Embed Size (px)
Citation preview
UNITED STATES DEPARTMENT OF THE INTERIORRAY LYMAN WILBUR, Secretary
GEOLOGICAL SURVEY GEORGE OTIS SMITH, Director
Water-Supply Paper 629
SURFACE WATER SUPPLY of the UNITED STATES
1926
PART IX
COLORADO RIVER BASIN
NATHAN C. GROVER, Chief Hydraulic EngineerROBERT FOLLANSBEE, A. B. PURTON
and W. E. DICKINSONDistrict Engineers
Prepared in cooperation withTHE STATES OF COLORADO, WYOMING
UTAH, CALIFORNIA, and ARIZONA
UNITED STATES
GOVERNMENT PRINTING OFFICE
WASHINGTON: 1930
For sale by the Superintendent of Documents, Washington, D. C. ----- Price 20 cents
Authorization and scope of Definition of terms. ______Explanation of data_-___- Aecuracy of field data and co: Publications. ____________Cooperation. ____________Division of work_________Gaging-station records
Colorado River Basin Colorado River and
Colorado Rivei Colorado Rivei Colorado Rivei Colorado Rivei Colorado Rivei Colorado Rivei
ArizColorado River Colorado Fraser River Blue River at Roaring Fork Parachute Roan Creek Taylor River Gunnison River Gunnison Rive Leroux Creek Surface Creek Uncompahgre Uncompahgre Uncompahgre San Miguel
Green River Basin Green River Green River at Green River at New Fork near Pine Creek at Hams Fork at Little Snake Ashley Creek i Utah Power & Duchesne River Duchesne River
v rork.
River atnoar
Creok near at
CONTENTS
imputed results^
tributaries above Green River-__________at Hot Sulphur Springs, Colo_____________at Glen wood Springs, Colo_____________near Palisade, Colo_______-_--_-__--___near Cisco, Utah______________________at Lees Ferry, Ariz._____________________at Bright Angel Creek, near Grand Canyon,
near Topock, Ariz. ________Yuma, Ariz____________West Portal, Colo__ _
Dillon, Colo-_---________--Glen wood Springs, Colo_ at Grand Valley, Colo____De Beque, Colo-________
Almottfr, -Colo ____________near Gunnison, Colo___--_
r near Grand Junction, Colo. near Lazear, Colo_._________
Cedaredge, Colo_________liver below Ouray, Colo___- Eliver near Colona, Colo_____River at Delta, Colo________
at Naturita, Colo_______Riyer
nta,r Daniel, Wyo__.________--_____-__Green River, Wyo_ _ _____________Green River, Utah_________________Boulder, Wyo_____________________
Pinedale, Wyo___--_____-_-----_--__Diamondville, Wyo_ ________________
near Lily, Colo_-____-_------_-ear Vernal, Utah.__________________Light Co.'s tailrace near Vernal, Utah-
near Tabiona, Utah._____________at Duchesne, Utah_______________.
River
12245
10101111111112141617
1921222425262829303234353738394142444445474850515354565758
IV CONTENTS
Gaging-station records Continued. Colorado River Basin Continued.
Green River Basin Continued. Pag&Duchesne River at Myton, Utah____________________.___ 60Strawberry River at Duchesne, Utah ____________________ 62West Fork of Lake Fork near Mountain Home, Utah____ 63Lake Fork near Myton, Utah_________________________ 65Uinta River near Neola, Utah__________________________ 66Whiterocks River near Whiterocks, Utah______--____---_ 68Fish Creek near Scofield, Utah_________________________ 69Price River near Helper, Utah_-_____________,__________ 70Huntington Creek near Huntington, Utah______________ 72.Cottonwood Creek near Orange ville, Utah ________________ 73
Paria River Basin_______-_________________-___-_-_________ 75Paria River at Lees Ferry, Ariz_________________._______ 75
Little Colorado River Basin________________________,______ 77Little Colorado River at Grand Falls, Ariz___ ____________ 77Zuni River at Blackrock, N. Mex_-_____--____-_____-___ 79
Bright Angel Creek Basin---_-_------_-------_,------------ 79Bright Angel Creek near Grand Canyon, Ariz. ___________ 79
Virgin River Basin-___________-_____-_______-___________-_ 81Virgin River at Virgin, Utah____ _________,,____,______ 81Mukuntuweap River near Springdale, Utah_____________ 82Santa Clara Creek near Central, Utah ___________________ 84
Gila River Basin__-___________-_____-_____---__,__________ 85Gila River near Duncan, Ariz___._______________________ 85Gila River at York, Ariz,___,_-__,__ -___,_________---_ 86Gila River near Solomonsville, Ariz.__,__________________ 87Gila River near Ashurst, Ariz__________^________________ 88Gila River near San Carlos, Ariz_____,.__-__,_,______-_-_ 89Gila River at Kelvin, Ariz...- _______________.,,.____---- 91Gila River at Ashurst-Hayden Dam, near Florence, Ariz___ 94Gila River at Gillespie Dam, Ariz______ ________ ______ 95Sunset Canal near Duncan, Ariz_____,_ ,_______________ 97Cosper-Windham Canal near Duncan, Ariz-______---_---- 98Moddle Canal near Duncan, Ariz__>__.________,,.__- __ 100Valley Canal near Duncan, Ariz_ ________ _ ____---_-- 102Duncan Canal near Duncan, Ariz___________ _______ 103Black-McClesky Canal at Duncan, Ariz___,_____,__--__ 105Colmonero Canal near Duncan, Ariz___________________ 106York Canal at York, Ariz____________________ 107Brown Canal near Solomonsville, Ariz__________________ 108Brown Canal waste way near Solomonsville, Ariz_ _________ 109Michelana Canal near Solomonsville, Ariz___,__________ 111Fourness Canal near Solomonsville, Ariz _________________ 112San Jose Canal near Solomonsville, Ariz_________________ 114Montezuma Canal near Solomonsville, Ariz__.______-_---_ 115Union Canal near Solomonsville, Ariz_,__________________ 117Graham Canal near Safford, Ariz____,___,_______________ 118Smithville Canal near Thatcher, Ariz___________________ 120Dodge-Nevada Canal near Pima, Ariz ___________________ 121Curtis-Kempton Canal near Eden, Ariz________________ 123Fort Thomas Consolidated Canal at Ashurst, Ariz_______ 124San Pedro River near Fairbank, Ariz_____________________ 126
CONTENTS V
Gaging-station records Continued. Colorado River Basin Continued.
Gila River Basin Continued. Page Santa Cruz River at Tucson, Ariz-___________-__.________ 127Rillito Creek near Tucson, Ariz_________________________ 129Salt River near Chrysotile, Ariz_________________.______ 130Salt River near Roosevelt, Ariz______________________ 132Tonto Creek near Roosevelt, Ariz____________________ 133Verde River near McDowell, Ariz_____________-_--______ 135
Miscellaneous discharge measurements_____________________________ 136Index__________________________________ __ 137
ILLUSTRATION
FIGUBB 1. Typical gaging station.Pag.
3
SURFACE WATER SUPPLY OF THE COLORADO RIVER BASIN, 1926
AUTHORIZATION AND SCOPE OF WORK
This volume is one of a series of 14 reports presenting records of measurements of flow made on streams in the United States during the year ending September 30, 1926.
The data presented in these reports were collected by the United States Geological Survey under the following authority contained inthe organic law (20 Stat. L., p. 394):
&Provided, That this officer [the director] shall have the direction of the Geologi
cal Survey and the classification of public lands and examination of the geo logical structure, mineral resources, and products of the national domain.
The work was begun in 1888 in connection with special studies relating to irrigation. Since the fiscal year ending June 30, 1895, successive appropriation bills passed by Congress have carried the following items:
For gaging the streams and determining the water supply of the United States and for the investigation of underground currents and artesian wells, and for the preparation of reports upon the best methods of utilizing the water resources.
Annual appropriations for the fiscal years ending June 30, 1895-1926
1895___.-_..__._____._ $12, 500. 001896_________.______- 24, 500. 001897-1899____________. 50,000.001900______._________ 70,000.001901-2________._______ 100,000.001903-1906. __________ 200,000.001907__._______________ 150, 000. 001908-1910. __________ 100,000.00
1911-1917-.____-_---- $150,000.001918_-------------_-_- 175,000.001919__--_-__________ 148,244.101920_--_-____.____ 175, 000. 001921-1923. ________ 180,000. 001924-25_---_------_--_ 170,000.001926_----_-_--______ 165, 000. 001927_-______--____..-_ 151, 000. 00
In the execution of the work many private and State organizations have cooperated, either by furnishing data or by assisting in collect ing data. Acknowledgments for cooperation of the first kind are made in connection with the description of each station affected; cooperation of the second kind is acknowledged on page 8.
Measurements of stream flow have been made at about 5,250 points in the United States and also at many points in Alaska and the Hawaiian Islands. In July, 1926, 1,730 gaging stations were being maintained by th.B Geological Survey and the cooperating organiza tions. Many miscellaneous discharge measurements were made at
1
2 SURFACE WATER SUPPLY, 1926, PART IX
other points. In connection with this work, data were also collected in regard to precipitation, evaporation, storage reservoirs, river pro files, and water power in many sections of the country and will be made available in water-supply papers from time to time.
DEFINITION OF TERMS
The volume of water flowing in a stream the "run-off" or "dis charge" is expressed in various terms each of which has become associated with a certain class of work. These terms may be divided into two groups (1) those that represent a rate of flow, as second- feet, gallons per minute, miner's inches, and discharge in second-feet per square mile, and (2) those that represent the actual quantity of water, as run-off in inches, acre-feet, and millions of cubic feet. The principal terms used in this series of reports are second-feet, second-feet per square mile, run-off in inches, and acre-feet. They may be defined as follows: **
"Second-feet" is an abbreviation for "cubic feet per second." A second-foot is the rate of discharge of water flowing in a channel of rectangular cross section 1 foot wide and 1 foot deep at an average velocity of 1 foot per second. It is generally used as a fundamental unit from which others are computed.
"Second-feet per square mile" is the average number of cubic feet of water flowing per second from each square mile of area drained, on the assumption that the run-off is distributed uniformly both as regards time and area.
"Run-off in inches" is the depth to which an area would be covered if all the water flowing from it in a given period were uniformly distributed on the surface. It is used for comparing run-off with rainfall, which is usually expressed in inches.
An "acre-foot," equivalent to 43,560 cubic feet, is the quantity required to cover an acre to the depth of 1 foot. The term is com monly used in connection with storage for irrigation.
The following terms not in common use are here defined."Stage-discharge relation," an abbreviation for the term "relation
of gage height to discharge.""Control," a term used to designate the section or sections of the
stream below the gage which determines the stage-discharge relation at the gage. It should be noted that the control may not be the same section or sections at all stages.
The "point of zero flow" for a gaging station is that point on the gage the gag^ height at which water ceases to flow over thecontrol.
EXPLANATION OF DATA .
The data presented in this report cover the year beginning October 1, 1925, and ending September 30, 1926. At the beginning of Janu-
EXPLANATION OF DATA " - &
ary in most parts of the United States much of the precipitation in the preceding three months is stored in the form of snow or ice, or in ponds, lakes, and swamps, or as ground water, and this stored water passes off in the streams during the spring break-up. At the end of September, on the other hand, the only stored water available for run-off is possibly a small quantity in the ground; therefore the run-off for the year beginning October 1 is practically all derived from precipitation within that year.
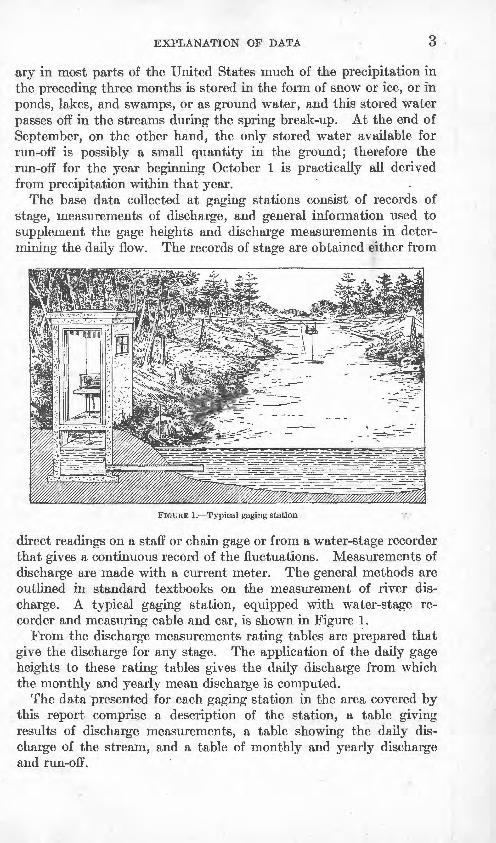
The base data collected at gaging stations consist of records of stage, measurements of discharge, and general information used to supplement the gage heights and discharge measurements in deter mining the daily flow. The records of stage are obtained either from
FIGUKE 1. Typical gaging station
direct readings on a staff or chain gage or from a water-stage recorder that gives a continuous record of the fluctuations. Measurements of discharge are made with a current meter. The general methods are outlined in standard textbooks on the measurement of river dis charge. A typical gaging station, equipped with water-stage re corder and measuring cable and car, is shown in Figure 1.
From the discharge measurements rating tables are prepared that give the discharge for any stage. The application of the daily gage heights to these rating tables gives the daily discharge from which the monthly and yearly mean discharge is computed.
The data presented for each gaging station in the area covered by this report comprise a description of the station, a table giving results of discharge measurements, a table showing the daily dis charge of the stream, and a table of monthly and yearly discharge and run-off.
4 SURFACE WATER SUPPLY, 1926, PART IX
If the base data are insufficient to determine the daily discharge, tables giving daily gage heights -and results of discharge measure ments are published.
The description of the station gives, in addition to statements regarding location and equipment, information in regard to any con dition that may affect the permanence of the stage-discharge rela tion, covering such subjects as the occurrence of ice, the use of the stream for log driving, shifting of control, and the cause and effect of backwater; it gives also information as to diversions that decrease the flow at the gage, artificial regulation, maximum and minimum recorded stages, and the accuracy of the records.
The table of daily discharge gives, in general, the discharge in second-feet corresponding to the mean of the gage heights read each day. At stations on streams subject to sudden or rapid diurnal fluctuation the discharge obtained from the rating table and the mean daily gage height may not be the true mean discharge for the day. If such stations are equipped with water-stage recorders the mean daily discharge may be obtained by averaging discharge at regular intervals during the day or by using the discharge integrator, an instrument operating on the principle of the planimeter and con taining as an essential element the rating curve of the station.
In the table of monthly discharge the column headed "Maximum" gives the mean flow for the day when the mean gage height- was highest. As the gage height is the mean for the day it does not indicate correctly the stage when the water surface was at crest height, and the corresponding discharge was consequently larger than given in the maximum column. Likewise, in the column headed "Minimum" the quantity given is the mean flow for the day when the mean gage height was lowest. The column headed "Mean" is the average flow in cubic feet for each second during the month. On this average flow computations recorded in the remain ing columns, which are defined on page 2, are based.
ACCURACY OF FIELD DATA AND COMPUTED RESULTS
The accuracy of stream-flow data depends primarily (1) on the permanence of the stage-discharge relation and (2) on the accuracy of observation of stage, measurements of flow, and interpretation of records.
A paragraph in the description of the station gives information regarding the (1) permanence of the stage-discharge relation, (2) precision with which the discharge rating curve is defined, (3) refine ment of gage readings, (4) frequency of gage readings, and (5) meth ods of applying daily gage heights to the rating table to obtain the daily discharge.
PUBLIOATIONB 5
For the rating tables "well denned" indicates, in general, that the rating is probably accurate within 5 per cent; "fairly well denned," within 10 per cent; "poorly defined" within 15 to 25 per cent. These notes are very general and are based on the plotting of the individual measurements with reference to the main rating curve.
The monthly means for any station may represent with high accu racy the quantity of water flowing past the gage, but the figures showing discharge per square mile and run-off in inches may be sub ject to gross errors caused by the inclusion of large noncontributing districts in the measured drainage area, by lack of information con cerning water diverted for irrigation or other use, or by inability to interpret the effect of artificial regulation of the flow of the river above the station. "Second-feet per square mile" and "Run-off in inches" are therefore'not computed if such errors appear probable. The computations are also omitted for stations on streams draining areas in which the annual rainfall is less than 20 inches. All figures representing "second-feet per square mile" and "run-off in inches" published in earlier reports by the Geological Survey should be used with caution because of possible inherent but unknown sources of error.
Many gaging stations on streams in the irrigated areas of the United States are situated above most of the diversions from those streams, and the discharge recorded does not show the water supply available for further development, as prior appropriations below the stations must first be satisfied. To give an idea of the amount of prior appropriations, a paragraph on diversions is presented in each station description. The figures given can not be considered exact but represent the best information available.
The table of monthly discharge gives only a general idea of the flow at the station and should not be used for other than preliminary estimates; the tables of daily discharge allow more detailed studies of the variation in flow. It should be borne in mind, however, that the observations in each succeeding year may be expected to throw new light on data previously published.
PUBLICATIONS
Investigation of water resources by the United States Geological Survey has consisted in large part of measurements of the volume of flow of streams and studies of the conditions affecting that flow, but it has comprised also investigation of such closely allied subjects as irrigation, water storage, water powers, underground waters, and quality of waters. Most of the results of these investigations have been published in the series of water-supply papers, but some have appeared in the bulletins, professional papers, annual reports, and monographs.
SURFACE WATEB StTPPLT, 1926, PART IX
The results of stream-flow measurements are now published annu ally in 12 parts, each part covering an area whose boundaries coincide with natural drainage features as indicated below:
Part I. North Atlantic slope basins (St. John River to York River).II. South Atlantic slope and eastern Gulf of Mexico basins (James River
to the Mississippi).III. Ohio River Basin.IV. St. Lawrence River Basin.
V. Upper Mississippi River and Hudson Bay Basins.VI. Missouri River Basin.
VII. Lower Mississippi River Basin.VIII. Western Gulf of Mexico basins.I.. Colorado River Basin.X. Great Basin.
XI. Pacific slope basins in California. XII.' North Pacific slope basins, in three parts:
A, Pacific slope basins in Washington and upper Columbia RiverBasin.
B, Snake River Basin. C, Pacific slope basins in Oregon and lower Columbia River Basin.
Water-supply papers and other publications of the United States Geological Survey containing data in regard to the water resources of the United States may be obtained or consulted as indicated below.
1. Copies may be purchased at nominal cost from the Superintend ent of Documents, Government Printing Office, "Washington, D. C., who will on application furnish lists giving prices.
2. Sets of the reports may be consulted in the libraries of the principal cities in the United States.
3. Sets are available for consultation in the local offices of the water-resources branch of the Geological Survey, as follows:
Augusta, Me., State House.Boston, Mass., 2500 Customhouse.Hartford, Conn., 64 State Capitol.Albany, N. Y., 904 Home Savings Bank Building.Trenton, N, J., 423 Statehouse Annex.Charlottesville, Va., Brooks Museum, University of Virginia.South Charleston, W. Va., Naval Ordnance Plant.Asheville, N. C., 608 City Hall.Chattanooga, Tenn., 630 Power Building.Tuscaloosa, Ala., Post Office Building.Columbus, Ohio, Engineering Experiment Station, Ohio State University.Chicago, 111., 1510 Consumers Building.Madison, Wis., 337N State Capitol.Thief River Falls, Minn., 618 Knight Avenue north.Topeka, Kans., 23 Federal Building.Rolla, Mo., Rolla Building, School of Mines and Metallurgy.Fort Smith, Ark., Post Office Building.Austin, Tex., State Capitol.Tucson, Ariz., 104 Agricultural Building, University of Arizona.Denver, Colo., 403 Post Office Building.Salt Lake City, Utah, 313 Federal Building.
PUBLICATIONS
Idaho Falls, Idaho, 228 Federal Building. Boise, Idaho, Federal Building. Helena, Mont., 45-46 Federal Building. Tacoma, Wash., 406 Federal Building. Portland, Oreg., 606 Post Office Building. San Francisco, Calif., 303 Customhouse. Los Angeles, Calif., 600 Federal Building. Honolulu, Hawaii, Territorial Office Building.
A list of the Geological Survey's publications may be obtained by applying to the Director of the United States Geological Survey, Washington, D. C.
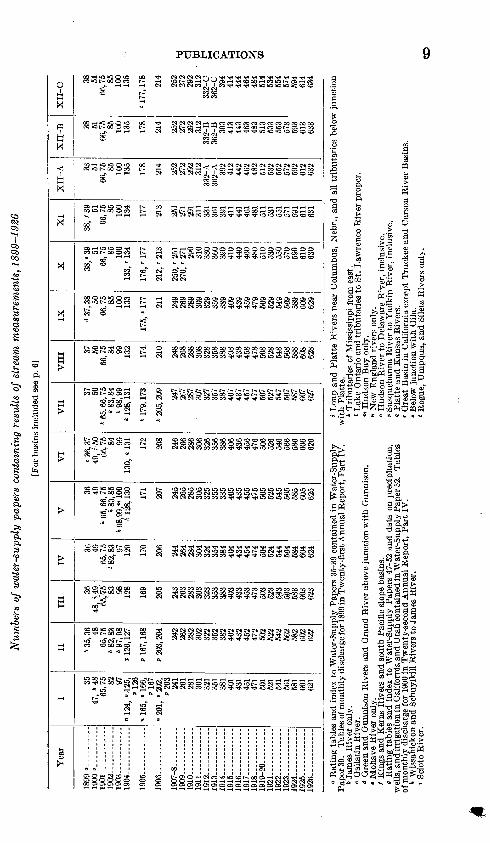
Stream-flow records have been obtained at about 5,250 points in the United States, and the data obtained have been published in the reports tabulated below:
Stream-flow data in reports of the United States Geological Survey
[A = Annual Report; B=Bulletin; W=Water-Supply Paper]
Report Character of data Year
10th A, pt. 2.__ Descriptive information only.________________ llth A, pt. 2.__ Monthly discharge and descriptive information. ______ 1884 to Sept., 1890.12th A, pt. 2...... ...--do.- .-. .-. ..- .......... .- 1884 to June 30,1891.13th A, pt. 3... Mean discharge in second-feet..__. _____. . 1884to Dec.31,1892. 14th A, pt. 2.__ Monthly discharge (long-time records, 1871 to 1893).._ _ 1888 to Dec.31,1893. B 131..- Descriptions, measurements, gage heights, and ratings...--- 1893 and-1894. 16th A, pt. 2..__ Descriptive information only.____________..__...B 140.--._------ Descriptions, measurements, gage heights, ratings, and monthly 1895.
discharge (also many data covering earlier years).W 11. Gage heights (also gage heights for earlier years)..______ 1896. 18th A, pt. 4--.... Descriptions, measurements, ratings, and monthly discharge 1895 and 1896.
(also similar data for some earlier years). W 15. .... Descriptions, measurements, and gage heights eastern United 1897.
States, eastern Mississippi River, and Missouri River abovejunction with Kansas.
W 16. .. Descriptions, measurements, and gage heights, western Missis- 1897.sippi River below junction of Missouri and Platte, and west ern United States.
19th A, pt. 4.. Descriptions, measurements, ratings, and monthly discharge 1897.(also some long-time records).
W 27 I Measurements, ratings, and gage heights eastern United States, 1898.eastern Mississippi River, and Missouri River.
W 28. -. Measurements, ratings, and gage heights, Arkansas River and 1898.western United States.
20th A, pt. 4.. Monthly discharge (also for many earlier years). 1898. W36-to 39.. Descriptions, measurements, gage heights, and ratings.. .. 1899. 21st A, pt. 4.. .. Monthly discharge.._ . ___ .....- 1899.W 47 to 52.. Descriptions, measurements, gage heights, and ratings.... 1900.22dA, pt. 4, Monthly discharge 1900.W 65, 66.- Descriptions, measurements, gage heights, and ratings. 1901. W 75.--.. ..... Monthly discharge .__. _.. . _____.. 1901.W 82 to 85.--.-_ Complete data__....___, . .__-----_ 1902.W97tolOO-__--..--do..---_ ...__ -.. ----- ... _ _ 1903.W 124 to 135.___ .._do . - . _ ... 1904. W 165 to 178..__ - -do..-----. ____ . ------- .. .__.____ 1905.W 201 to 214._.. do.._ . - .- - 1906.W 241 to 252__ do..---.. .- . . . -. 1907-8. W 261 to 272...... .....do..--... ... . ....... ....... __ .. 1909.W281 to 292...... .....do .._ . . . . . . ....... 1910.W 301 to 312_ . .do-... . .... . . ... ... 1911.W 321 to 332..__ __do . .. 1912. W351to362.-_. ._.do.... . ... . . . ....... _ 1913.W 381 to 394..-.- do... . . . ..... ...... .................. 1914.W 401 to 414.._. .....do -. . . . 1915.W 431 to 444...... do-. . - . . . ... --- ----- 1916.W 451 to 464...... .do._ 1917.W 471 to 484...... ..... do--... ....... . ... ..... ...... . 1918.W501 to 514..- .....do .... .... . . ... 1919-20.W521 to 534...... -....do --.... ... .. . .... 1921.W541 to 554...... . do...... __..... . . ......... 1922.W 561 to 574.._......do -- ._.___ -.- --..-. . . .-..-.._.... 1923.W 581 to 594..__ do - ..... . . ... 1924.W 601 to 614...... .....do.---.... ....... . ........ ...... 1925.W 621 to 634...... .....do._... ......... . 1926.
8 STJKFACE WATEK SUPPLY, 1926, PAKT IX
The records at most of the stations discussed in these reports extend over a series of years, and miscellaneous measurements at many points other than regular gaging stations have been made each year. An index of the reports containing records obtained prior to 1904 has been published in Water-Supply Paper 119.
The following table gives, by years and drainage basins, the num bers of the papers on surface-water supply published from 1899 to 1922. The data for any particular station will, as a rule, be found in the reports covering the years during which the station was main tained. For example, data for Machias River at Whitneyville, Me., 1903 to 1921, are published in Water-Supply Papers 97, 124, 165, 201, 241, 261, 281, 301, 321, 351, 381, 401, 431, 451, 471, 501, and 521, which contain records for the New England streams from 1903 to 1921. Results of miscellaneous measurements are published by drainage basins.
Num
bers
of
wat
er-s
uppl
y pa
pers
con
tain
ing
resu
lts o
f st
ream
mea
sure
men
ts,
1899
-192
6
[For
bas
ins
incl
uded
see
p.
6]
Year
1899"--- -..
1900
>. .
..... ..
.1901 . ..
....
1902 . . .
1903
-- . _ .
1904
1905
1906
1907-8
1909 -
1910
1911
1912-- ---,
1913
1914 .
1915
-- - --
1916
1917
1918 --
1919-20.-.-.-
1921
1922
1923
-
1924 -
1925
1926 .
I
3547
, » 48
65,75 82 97
» 12
4, "
125,
*126
P167
» 20
1, o
202
,"203
241
261
281
Qftl
001
351
381
431
451
471
501
521
K4.1
581
601
II 6 OK Qfl
4865,75
» 82
, 83
b Q7 Q«
" 126, 127
"203,204 949
262
282
ono
000
352
000
4O9
4.00
452
479
502
522
KCO
582
602
III
3648
, i 4
9RK 7K'
00 98 128
169
205
243
oco
283
fjno
300
oeo
ooo
403
4.00
453
K(Y3
523
KAQ
663
583
603
fiOO
IV
36 4965
,75
» 82,
83 97 129
170
944
284
304
324
354
384
434
4.K4
.
474
Kf\A
544
584
604
624
V
36 49* 65
, 66
, 75
* 83
, 85
* 98
,99,
10
0* 128, 130 171
207
245
265
285
one
ooe
Oee
385
405
4.0 K
455
475
Kf\K
525
KAK
KRK
585
605
625
VI
c gg 3
749
/ 50 84 99 172
one
246
286
°,fi
fi
326
OKO
406
456
KAC
526
546
Kfif
i
586
VII
V7 50
* 65, 66
, 75
*83,84
* 128, 131 247
267
287
307
357
387
437
457
477
507
527
547
587
607
VIII
07 50
66,75 84 QQ
100
174.
210
040
268
288
308
328
388
408
458
478
508
528
c/fo
568
588
608
628
IX
d 37, 38 50 85
"Ifl
fl
211
249
269
289
OAQ
OOQ
QKQ
OOQ
409
4°.Q
4.KQ
479
509
529
549
KCQ
589
609
629
X OR e
°,Q 51
66,75 85 100
133, r
134
176,
' 177
919
r 91°,
250,
' 251
97fl
r 97
128
001
noqn
360
onfl
44fl
460
480
530
550
570
590
610
630
XI
38,
/ 39 51
66,75 85 100
134
177
91 ̂
251
271
291
361
QQ1
461
481
511
531
551
571
KQ1
611
631
XII-A 33 51
66,7
5 85 100
135
178
214
252
272
292
312
332-A
362-A
OQO
412
442
462
512
532
KKO
*79
592
632
XII-B 38 51 85 100
135
178
214
252
272
292
312
332-B
362-B
393
413
443
463
483
513
533
553
E7Q
593
613
633
XII-C 38 51
66,7
5 85 100
135
« 177, 178 214
252
272
292
312
332-C
362-
C39
4414
444
464
484
514
534
554
574
594
614
634
a E
atin
g ta
bles
and
ind
ex t
o W
ater
-Sup
ply
Pape
rs 3
5-39
con
tain
ed i
n W
ater
-Sup
ply
Pap
er 3
9.
Tab
les
of m
onth
ly d
isch
arge
for 1
899
in T
wen
ty-f
irst
Ann
ual E
epor
t, P
art I
V.
»Jam
es R
iver
onl
y.
« Q
alla
tin
Riv
er.
<» G
reen
and
Qun
niso
n R
iver
s an
d G
rand
Riv
er a
bove
jun
ctio
n w
ith
Gun
niso
n.
Moh
ave
Riv
er o
nly.
t K
ings
and
Ker
ns R
iver
s an
d so
uth
Paci
fic
slop
e ba
sins
.«
Rat
ing
tabl
es a
nd i
ndex
to
Wat
er-S
uppl
y Pa
pers
47-
52 a
nd d
ata
on p
reci
pita
tion,
w
ells
, and
irri
gatio
n in
Cal
ifor
nia
and
Uta
h co
ntai
ned
in W
ater
-Sup
ply
Pap
er 5
2.
Tab
les
of m
onth
ly d
isch
arge
for
190
0 in
Tw
enty
-sec
ond
Ann
ual
Rep
ort,
Par
t IV
.*
Wis
sahi
ckon
and
Sch
uylk
ill R
iver
s to
Jam
es R
iver
. «' S
ciot
o R
iver
.
» Lou
p an
d P
latt
e R
iver
s ne
ar C
olum
bus,
Neb
r.,
and
all
trib
utar
ies
belo
w j
unct
ion
wit
h P
latt
e.*
Tri
buta
ries
of
Mis
siss
ippi
fro
m e
ast.
' Lak
e O
ntar
io a
nd t
ribu
tari
es t
o St
. L
awre
nce
Riv
er p
rope
r.m
Hud
son
Bay
onl
y."
New
Eng
land
riv
ers
only
.0
Hud
son
Riv
er t
o D
elaw
are
Riv
er,
incl
usiv
e." S
usqu
ehan
na R
iver
to
Yad
kin
Riv
er,
incl
usiv
e.«
Pla
tte
and
Kan
sas
Riv
ers.
' G
reat
Bas
in i
n C
alif
orni
a ex
cept
Tru
ckee
and
Car
son
Riv
er B
asin
s.*
Bel
ow j
unct
ion
wit
h G
ila.
* Rog
ue,
Um
pqua
, an
d Si
letz
Riv
ers
only
.
10 SURFACE WATER SUPPLY, 1926, PART IX
COOPERATION
The work in Arizona, Utah, and Wyoming was carried on under cooperative agreement between the United States Geological Survey and the States. Special acknowledgments are due to the cooperating State officials, F. P. Trott, State water commissioner of Arizona; G. M. Bacon, State engineer of Utah; and F. C. Emerson, State engineer of Wyoming.
The State engineer of Colorado, M. C. Hinderlider, furnished field data for some stations in Colorado and complete records for other stations.
The United States Bureau of Reclamation paid the gage observer on Taylor River at Almont, Colo.
The United States Weather Bureau paid the gage observer for the station on Green River at Green River, Wyo.
The United States Indian Service assisted in the maintenance of stations on Gila River near San Carlos and Kelvin, Ariz. Financial assistance for work on Colorado River in Arizona was furnished by the United States Bureau of Reclamation, the Federal Power Com mission, the United States Weather Bureau, the State of California, the city of Los Angeles, the Palo Verde Irrigation District, and South ern California Edison Co.
Assistance in the collection of data was rendered by Utah Power & Light Co., Best Flume & Power Co., Vernal Milling & Light Co., Redlands Irrigation Co., John L. Fish, and Gila Water Co.
DIVISION OF WORK
Data for stations in Arizona were collected and prepared for publi cation under the direction of W. E. Dickinson, district engineer, who was assisted by D. A. Dudley, J. H. Gardiner, D. H. Barber, B. S. Barnes, J. A. Baumgartner, W. E. Code, K. C. McCarter, G. S. Hayes, and J. E. Klohr.
Data for stations in Colorado and Wyoming were collected and prepared for publication under the direction of Robert Follansbee, district engineer who was assisted by P. V. Hodges and Miss Nellie L. Esterly.
Data for stations in Utah were collected and prepared for publica tion under the direction of A. B. Purton, district engineer, who was assisted by J. W. Mangan, M. T. Wilson, D. M. Corbett, and Miss Lysle Christensen.
The records were reviewed and the manuscript assembled by B. J. Peterson.
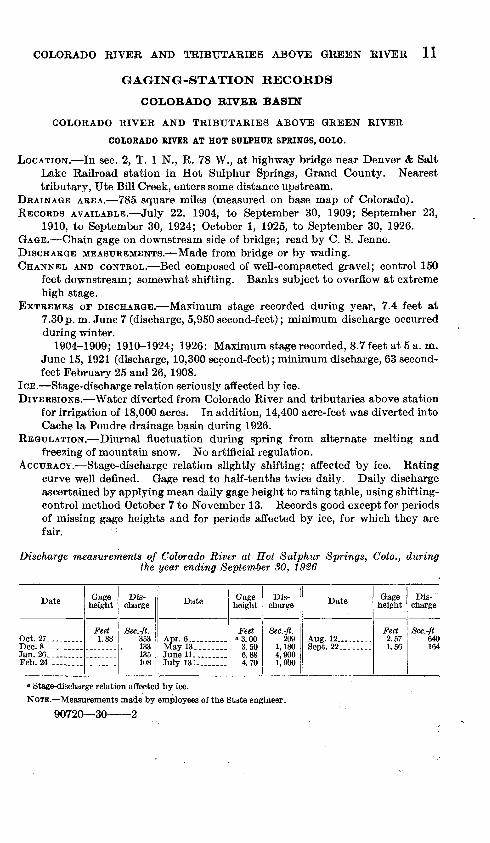
COLOEADO RIVER AND TRIBUTARIES ABOVE GREEN RIVER 11
GAGING-STATION RECORDS
COLORADO RIVER BASIN
COLORADO RIVER AND TRIBUTARIES ABOVE GREEN RIVER
COLORADO RIVER AT HOT SULPHUR SPRINGS, COLO.
LOCATION. In sec. 2, T. 1 N., R. 78 W., at highway bridge near Denver & Salt Lake Railroad station in Hot Sulphur Springs, Grand County. Nearest tributary, Ute Bill Creek, enters some distance upstream.
DRAINAGE AREA. 785 square miles (measured on base map of Colorado).RECORDS AVAILABLE. July 22, 1904, to September 30, 1909; September 23,
1910, to September 30, 1924; October 1, 1925, to September 30, 1926.GAGE. Chain gage on downstream side of bridge; read by C. S. Jenne.DISCHARGE MEASUREMENTS. Made from bridge or by wading.CHANNEL AND CONTROL. Bed composed of well-compacted gravel; control 150
feet downstream; somewhat shifting. Banks subject to overflow at extreme high stage.
EXTREMES OF DISCHARGE. Maximum stage recorded during year, 7.4 feet at 7.30 p. m. June 7 (discharge, 5,950 second-feet); minimum discharge occurred during winter.
1904-1909; 1910-1924; 1926: Maximum stage recorded, 8.7 feet at 5 a. m. June 15, 1921 (discharge, 10,300 second-feet); minimum discharge, 63 second- feet February 25 and 26, 1908.
ICE. Stage-discharge relation seriously affected by ice.DIVERSIONS. Water diverted from Colorado River and tributaries above station
for irrigation of 18,000 acres. In addition, 14,400 acre-feet was diverted into Cache la Poudre drainage basin during 1926.
REGULATION. Diurnal fluctuation during spring from alternate melting and freezing of mountain snow. No artificial regulation.
ACCURACY. Stage-discharge relation slightly shifting; affected by ice. Rating curve well defined. Gage read to half-tenths twice daily. Daily discharge ascertained by applying mean daily gage height to rating table, using shifting- control method October 7 to November 13. Records good except for periods of missing gage heights and for periods affected by ice, for which they are fair.
Discharge measurements of Colorado River at Hot Sulphur Springs, Colo., during the year ending September SO, 1926
Date
Oct. 27.. .......
Jan. 26.. .......Feb. 24.. .......
Gage height
Feet 1.88
Dis charge
Sec.-ft. 353133135108
Date
Apr. 6 ..........May 13 _ .....
July 13 ......
Gage height
Feet »3.00
3.506.884.70
Dis charge
See.-fl. 209
1,1804,9001,900
Date
Aug. 12.........
1
Gage height
Feet 2.571.56
Dis charge
Sec.-ft 640164
Stage-discharge relation affected by ice.NOTE. Measurements made by employees of the State engineer.
90720 30 2
SURFACE WATER SUPPLY, 1926, PART IX
Daily discharge, in second-feet, of Colorado River at Hot Sulphur Springs, Colo. for the year ending September 80, 1926
Day
1. ...... -. .- 2. . _ ... __ .... _ ---------.--------.-3.. 4 5- -
6... 7. _ 8.---
10
11 12..-... . . .. _13.- 14-..... . .. .15
16-.- . - 17 ___ -. _ . . ... __ ..18-.--.. 19 _ .. . __ .. . 20.
21... . 22... ..... ...... ........ . ... ..... ..... ..... ...2Z. ...........................................24. 25
26...--. . 27-- 28 29-- - ..30 31---- .
Oct.
300275280350410
440471431388369
417466441417431
412402388359355
332323341336.341
323350328355332341
Nov.
292288292288204
288276250225212
200196204
.LO/
135
145
May
1,7701,8301,9802,4802,800
3,0002,6401,9801,7101,720
1,4301,2501,1801,0901,170
1,3601,5701,7501,7201,980
2,6203,1803,7004,2004,420
4,5405,0804,4604,3203,7004,030
June
4,2804,5404,6304,8404,600
4,9005,9105,7105,3204,900
4,8404,6605,5104,9804,370
4,4603,9503,6203,2703,000
2,4502,3402,1202,0802,230
2,3402,5602,6402,5302,600
July
2,6002,6202,6402,5302,600
2,2602,3402,9302,3702,840
2,2801,9501,8601,7701,730
1,5901,5301,5101,4901,370
1,3701,2901,1701,030
885
944914897914838856
Aug.
700558644711700
722814856797780
700628589522486
486486456456407
388388359341341
314314314305271263
Sept.
284271263292305
310280292280251
239239235227215
204200215185178
163163160153149
149163171163160
NOTE. No gage-height record Oct. 1-6; stage-discharge relation affected by ice Nov. 8-9 and 14-30; discharge based on comparison with flow of Colorado River at Glenwood Springs. Braced figures give mean discharge for period indicated.
Monthly discharge of Colorado River at Hot Sulphur Springs, Colo., for the year ending September 80, 1926
Month
July. -
Discharge in second-feet
Maximum
471 292
5,080 5,810 2,930
856 310
Minimum
275
1,090 2,080
838 263 149
Mean
371 190
2,«00 3,870 1,740
519 219
Run-off in acre-feet
22,800 11,300
160; 000 230,000 107,000 31,900 13,000
COLORADO RIVER AT GLENWOOD SPRINGS, COLO.
LOCATION. In sec. 9, T. 6 S., R. 89 W., at Glenwood Springs, Garfield County No Name Creek enters Colorado River 2 miles above station and Roaring Fork enters half a mile below.
DRAINAGE AREA. 4,560 square miles (measured on base map of Colorado).RECORDS AVAILABLE. January 1, 1900, to September 30, 1926, also May 12 to
July 17, 1899, at point just above Roaring Fork.GAGE. Friez water-stage recorder on right bank in front of power house; in
spected by C. H. Oberly and Andrew Dickson.
COLORADO RIVER AND TRIBUTARIES ABOVE GREEN RIVER 13
DISCHARGE MEASUREMENTS. Made from cable beneath State Street bridge, a third of a mile below gage.
CHANNEL AND CONTROL. Bed composed of well-compacted gravel, on which silt is deposited. Control at riffle 300 feet downstream; slightly shifting at intervals. Banks not subject to overflow except at extremely high stages.
EXTREMES OP DISCHARGE. Maximum discharge occurred when water-stage recorder was not operating. By comparison with record of Roaring Fork at Glen wood Springs the mean daily discharge was estimated at 22,700 second-feet on June 7; minimum stage, 2.1 feet from 7 to 11 a. m. December 30 and 31 (discharge, 200 second-feet).
1900-1926: Maximum stage recorded, 12.55 feet at noon June 14 and 15, 1918 (discharge, 30,100 second-feet); minimum stage, 1.6 feet at 5p.m. February 6, 1921 (discharge, 80 second-feet).
ICE. Stage-discharge relation nat affected by ice. Hot water from springs keeps river open. ,
DIVERSIONS. Between this station and Hot Sulphur Springs, water is diverted for irrigation of a few hundred acres.
REGULATION. Shoshone power plant of Public Service Co., 7 miles upstream, controls flow during day at low water but has insufficient pondage to control it for more than a few hours.
ACCURACY. Stage-discharge relation practically permanent; not affected by ice. Rating curve well defined. Operation of water-stage recorder satis factory except as explained in footnote to daily-discharge table. Daily discharge ascertained by applying to rating table mean daily gage height obtained by inspection of recorder graph except from November 20 to April 5 when daily discharge was computed from bihourly discharge on account of diurnal fluctuations. t Records excellent except for period of missing gage height, for which they are fair.
Discharge measurements of Colorado River at Glenwood Springs, Colo. year ending September 30, 1926
during the
Date
Nov. 7.. .......Nov. 18........Mar. 30. ____
Gage height
Feet 3.813.683.73
Dis charge
Sec.-ft. 1,1501,0801,150
Date
May 11.........
July 28.. .......
Gage height
Feet 6.50
10.555.27
Dis charge
Sec.-ft. 5,930
21,8003,030
Date
Aug. 24 .....-
Gage height
Feet 4.09
Dis charge
Sec.-ft. 1,490
NOTE. All measurements, except the one on Nov. 18, were furnished by State engineer.
Daily discharge, in second-feet, of Colorado River at Glenwbod Springs, Colo., for the year ending September 30, 1926
Day
1 ______2.. ....... ...3............4............5 ............
6... ....... ..7............8.. ....... . ..9 ...10 .........
11 _ .........12..........C.IS............14... ___ ....15. ........
Oct.
1,3101,2801 2601,2201,250
1,5001,5801,7201,680
1,6701,7101,7101,6701.590
Nov.
1,4101,4201,4201,4001,310
1,2401,2101,200
1 ftfiA
1,0001 0001,0601,1101.110
Dec.
1,0101,0301 ft4.fi
1,010852
924900968835711
5966387QQ
810621
Jan.
6268347Q1
922832
857830847Q1Q
744
*7I"1A
643638649
Feb.
751710768758674
682' 624
774
736
703704vsn626768
Mar.
696721746743824
818590711743734
837Q97
QAQ
738854
Apr.
844906769803956
1,3401,8602,2802,4102 QA(\
2,6109 7^2,6809 fiSft2.540
May
7,3007,3007 Q«JA
8,9009,910
11,00010,6008,9007,610ft OQA
5,6705 OKA
4,7004,1904.070
June
15,70016,50017,80018,70019,100
19,80022,70021,70020,80019,100
17 Af]f\
17,80017.400
July
9,2309,2308,5708,2508,570
8,5709,230
11,00010,600
8,5707 onft
6,9906,3905.960
Aug.
2,9102,8302,7502,8302,910
3,1903,0903,0903,290
3,090O QOA
2,6102,4802.340
Sept.
1,4001,3901,2701,3601,360
1,130918966
1,0401,020
956928862871880
14 SURFACE WATER SUPPLY, 1926, PART IX
Daily discharge, in second-feet, of Colorado River at Glenwood Springs, Colo., for the year ending September SO, 1926 Continued
Day
16 - 17 18 19 20
21............22 . __23.-.. .....24--- 25
26 27 -28 29............30 31
Oct.
1,540
1,4701,4601,410
1,4201,4001,4001,4301,470
1,4301,3901,3701,4001,4701,480
Nov.
1,020
1,0201,040
969
893858878959932
1,0101,0101,050
969
Dec.
7087Afl
631732733
754796843842842
785785733662626527
Jan.
7fU70379ft
723760
7636967246147OK
707
743570GAQ
853638
Feb.
CQ7
7/1 c
687650712
6127co
681OAK
678
704707
Mar.
810QQO
825931984
966919
1,1101,2001,410
1,3101,1001,070
897940869
Apr.
2,6803 <M\
4,3204,3204,700
4,5704,9705,250
4,440
4,5705,1105,6705,810
May
4,7005,6706,6906,9907,300
8,90011,30013,20015,20016,500
17 00016,50015,70015,70014,00014,000
June
16,10014,00012,00010,60010,600
10,2009,2308,8008,2508,250
8,5708,5708,900
July
5,6705,5305,2504,9704,700
4,5704,3204,0703,8403,610
3,4003,0903,0903,4003,6103,190
Aug.
2,2202,1001,9801,8601,740
1,6801,6201,5701,5101,460
1,4601,3601,3901,3901,3601,360
Sept.
937966-985-975946-
918862-844790-79»
7428/U.
758880-899-
NOTE. No gage-height record June 6-7, 23; discharge based on comparison with flow of Roaring Fork at Glenwood Springs.
Monthly discharge of Colorado River at Glenwood Springs, Colo., for the year ending1September SO, 1926
Month
March ____________________________
May _____________________________
July-...
Discharge in second-feet
Maximum
1,720 1,420
'1,040 922 774
1,410 6,390
17,000 22,700 11,000 3,290 1,400
22,700
Minimum
1,220 * 858
527 570 612 590 769
4,070 8,250 3,090 1,360
742
527
Mean
1,480 1,090
790 738 702 890
3,310 9,650
14,400 6,260 2,240
983
3,550
Run-off in acre-feet
91,000 64,900 48,600 45,400 39,000 54,700
197,000 593,000 857,000 385,000 138,000 58,500
2, 570, 000
COLORADO RIVER NEAR PALISADE, COLO.
LOCATION. In sec. 2, T. 11 S., R. 98 W., at highway bridge 2 miles above Palisade,Mesa County. Nearest large tributary, Plateau Creek, enters 6 miles above.
DRAINAGE AREA. 8,790 square miles (measured on base map of Colorado). RECORDS AVAILABLE. April 9, 1902, to September 30, 1926. GAGE. Chain gage an downstream side of bridge near midspan; read by A»
Barnhisel.DISCHARGE MEASUREMENTS. Made from bridge 2 miles below gage. CHANNEL AND CONTROL. Bed composed of gravel, silt, and scattered boulders;
control is at rapids 300 feet downstream; practically permanent. Banksnot subject to overflow.
EXTREMES OP DISCHARGE. Maximum stage recorded during year, 21.8 feet at6 p. m. June 7 (discharge, 34,300 second-feet); minimum stage, 11.8 feet at6 p. m. September 26 (discharge, 900 second-feet).
1902-1926: Maximum stage recorded, 24.4 feet at 7 a. m. June 16, 1921(discharge, 52,400 second-feet); minimum stage, 11.4 feet on September 2,1924 (discharge, 630 second-feet).
ICE. Stage-discharge relation affected by ice during some winters.
COLORADO RIVER AND TRIBUTARIES ABOVE GREEN RIVER 15
DIVERSIONS. Principal diversion between Glenwood Springs and Palisade gaging station is the Government high-line canal, which has a capacity of 1,425 second-feet. Enough of the water diverted for power is returned to the river to supply a priority of 521 second-feet for the Grand Valley Canal.
REGULATION. None. COOPERATION. Complete records furnished by Burea-u of Reclamation.
Daily discharge, in second-feet, of Colorado River near Palisade, Colo., for the yearending September 80, 1926
Day
1........ ...2... ........3 4...........5... ........
7... ........8. .9... ......._
10. - ..
11 .......12 13 14...........15
16..... ..17...........18...........19 . ......20...........
21 .......22. __ .... .23 24.... .......25..........
26 .......27 ......28.. .29 .......30 .......31
Oct.
1,9201 ftfift
1,8601,8101,860
2,9403,1209 ^vift
S oon
3,2302,7802,860
3,0002,780
9 4^n
2,430
2,4302,4309 3Afi
2 9Qft
2 99ft
2,220
2,220
Nov.
2,2202,5703,0002,5702,430
9 99O
2,1602,1002,160
2,1002 inn1,8101,760
1,4401,590
1,8101 980
1,9201,9801,9202,0401,920
Dec.
1,7601,8101,7001,7001.640
1,7001,8101,5401,760
i 9on1,2401,440
1,860
1,4401 4401,5401,810
1,5901 4.4ft1 3Qft
1,4901 C40
1,7001 fi4.ft
1,5401,490
Jan.
1,490
1,5401,4901,E90
1,5901,4901,4401 490
1 3QO
1,3401,2001,290
1,3901 fldft
1,4901 4Qft
1,390t QJA
1,2001 0601,240
i 9Qn1 °.Qft
1,3401,3901 7ftft
1,760
Feb.
1,390
1,4901,4901,490
1 °.QO1 °.Qft
1,4401 5401 3Qft
1,490
1,440
1,390
1,3901,390i 3on1 4401 340
1,3401,3401,3401,3401 440
1 QQAi ^Qft1 3Qft
Mar.
1,3901,4901,5401,6401,700
1,7601,6401,4901,7001,760
1,7001,7001,7001,6101,340
1,7001,9201,9201,860
1,7601,7601,8601 9801 980
2 (\Af\
i Sfin1 5401,4901 4-Qft
1,640
Apr.
1,5401,5401,590
1,540
2,5003,3103,6803,160
3 93ft
3,4803,390
3,310
3,3903,5805,6005,9606,470
6,8807,1608,4808 7QftQ qon
c nqn
8,9409 900
10,20011,200
May
12,20011,90012, 70014,50016,000
18,00017,60015, 400
8,0307,3006,7406,470
6,8808,480
10,900U cnn
14,10017,00020,50094. Qftfl97 inn
26,800
OC flAft
24,000
22,600
June
24, 30027,40029,00029, 60030,700
31,00032, £0033, 400
30, 400
28,20027, 40027, 40027, 10026,000
24,80022, 600
16, 800
15,80014,80013,10019 Qftft
13,600
1 3 fiftft
10 QAA
13,90013,800
July
13,90013, 80013,20012,60012, 200
13,40013,80015, 8001C, 600IE, 000
12,60011, 50010, 70010,2009,100
8,6407,880
7,1606 470
6,0805,720
4,810
4,0803,7803,7803,8804,0803,780
Aug.
3,2303,1602,9302,7802,860
4,9203,8803,8803,' 7803,780
3,7803,3003,1202,7802,390
2,3202,1802,0002,0001,940
1,8801,8203,6401,4201,110
1,3201,2301,2301,1901.1101,070
Sept.
1,1101,0701,030
990990
1,1501,2301,3201,4201,370
1,2801,2801,2301,1901,190
1,2301,2301,2301,2301,230
1,2301,1101,0701,0301,030
9501,2301,2301,1901,640
NOTE. Quantities have been changed slightly to comply with rules of computation used by U. S. Geol. Survey.
Monthly discharge of Colorado River near Palisade, Colo., for the year endingSeptember 30, 1926
Month
December ___ .. . ____ __ .
February... _______________ . __________
April........ ........ ............. .. . ......
July......... ........ ... . . ..............
Discharge in second-feet
Maximum
3,980 3,000 1,860 1,760 1,540 2, 100
11,200 27,100 33,400 16,600 4,920 1,640
33,400
Minimum
1,810 1,440 1,240 1,060 1,340 1,340 1,540 6,470
12,900 3,780 1,070
950
950
Mean
2,580 2,100 1,580 1,420 1,410 1,710 5,070
15,400 22,500 9,080 2,450 1,190
5,560
Run-off in acre-feet
159,000 125,000 97,200 87,300 78,300
105,000 302,000 947,000
1, 340, 000 558,000 151, 000 70,800
4,020,000
NOTE. Monthly discharge computed by U. S. Qeol. Survey from daily-discharge record furnished by the U. S. Bureau of Reclamation.
16 StTEFACE WATEE SUPPLY, 1926, PART IX
COLORADO RIVER NEAR CISCO, UTAH
LOCATION. In NW. % sec. 17, T. 23 S., R. 24 E., 1 mile below mouth of Dolores River and 15 miles by road south of Cisco, Grand County.
DRAINAGE AREA. 24,100 square miles (measured on General Land Office map).
RECORDS AVAILABLE. November 10, 1914, to September 30, 1917, and October 1, 1922, to September 30, 1926; 25 miles downstream at Moab October 1,. 1913, to November 10, 1914; flow about the same at both places.
GAGE. Au continuous water-stage recorder on left bank half a mile above suspension highway bridge; inspected by G. C. Brown and Frank Hittle.
DISCHARGE MEASUREMENTS. Made from cable 400 feet below gage.CHANNEL AND CONTROL. Channel straight for several hundred feet above and
below station. Left bank high and not subject to overflow; right bank in extreme floods is overflowed between station and bridge. Bed composed of sand and gravel. Low-water control is a riffle a quarter of a mile below gage; fairly permanent.
EXTREMES OF DISCHARGE. Maximum stage during year, 15.20 feet at 4 p. m. May 27 (discharge, 52,400 second-feet); minimum stage, 1.16 feet at 5 a. m. September 27 (discharge, 1,430 second-feet).
1915-1917; 1923-1926: Maximum stage, 19.7 feet at 9 p. m. June 19, 1917 (discharge, 76,800 second-fefft); minimum stage, 1.14 feet at 8 p. m. September 3, 1924 (discharge, 844 second-feet).
ICE. Stage-discharge relation affected by ice.DIVERSIONS. Below practically all diversions. A large amount of water is
diverted in Colorado for irrigation.REGULATION. Station is too far downstream to be affected, except in a general
way, by regulation in Colorado.ACCURACY. Stage-discharge relation practically permanent except for slight
shifting caused by temporary deposits of sediment on control; affected by ice January 1 to February 11. Standard rating curve well defined. Operation of water-stage recorder satisfactory except as stated in footnote to daily-discharge table. Daily discharge determined by applying to rating table mean daily gage height or by shifting-control method. Discharge during ice-affected periods and periods of missing gage height estimated by hydrographic comparison with flow at stations in Colorado and at Lees Ferry in Arizona. Records good except for estimated periods for which they are fair.
Discharge measurements of Colorado River near Cisco, Utah, during the year endingSeptember SO, 1926
Date
Dec. 11 Mar. 24. .. ...
Gage height
Feet 2.432.85
Dis charge
Sec.-ft. 2,7903,760
Date
Apr. 29 -
Gage height
Feet 8.607.62
Dis charge
Sec.-ft. 24,40019,700
Date
Aug. 27-.
Gage height
Feet 2.02
Dis charge
Sec.-ft. 2,020
COLORADO RIVER AND TRIBUTARIES ABOVE GREEN RIVER 17
Daily discharge, in second-feet, of Colorado River near Cisco, Utah, for the year ending September SO, 1926
Day
1 2.-.-.-.....3...........4...........5... ........
6.. ....... ..7... .....8 9... ........
10.. ...... ...
11 _ .. ......12...........13... ........14 15.. ........ .
16 17.. ....... . .18 19.. .........20
21 .22...........23 24...........25
26 27 28 29 30 31
Oct.
3,810
3,3903,2705,200
13,0005,8805,4705,2205,030
5,6706,6105,8006,0906,170
5,7805,3205,1305,0104,890
4,7704,5704,5404,630
4,5704,4604,3904,320
Nov.
4,3204,4304,7904,8904,630
4,3503,9403,8303,9203,830
3,7303,7903,7303,8603,770
3,7103,4303,4903,550
3,3503,1803,1403,1603,240
3,4103,5103,4703,3703,330
Dec.
3,3103,2203,2603,3503,240
2,9903,100
3,0803,030
2,7702,650
2,6502,650
2,6802,5802,5402,5602,560
2,6002,5002,4502,4002,500
9 fi^ft2,8002,8302,7502,5602,560
Jan.
9 4fin
9 9nn
11.9 inn
I
IksooI2,700
Feb.
2, 700
2,7002,6802 fif\0
2,8802,750
2,6602,7209 <i8n2,5202,420
2,3802,4402,3602,4102,330
2,3602,360
Mar.
2,340
2,4702,6102,880
3,2709 o^ft2,540
2,800
3,0603,5903,8104,060
4,3204,4104,2103,9404. 4fin
K ftfift4,8204,4604,0003,7103,450
Apr.
3,2903,4303,3903,4503,290
3,5104,3906 QKft
9,0708,600
7,6508,0408,720.8,6308,880
9,52013,10012,40014,000
18,200
22,40022,60023,900
23, 80024,40025, 10024,00024,600
May
26,30025,500OA cnn26,60028,800
35,80031,70027,90022,500
18, 70016,200
13,80013,500
13,40015,00017,30019,200Oft ctfVI
24,20029,80033,40037,200
47,50042,10038,30035,20004 9_Afl
June
34,60007 QAfl
41,30043,20044,600
44,80045,200
45,20043,700
41,30039,30038,30037,90035,800
34,60032, 60029,40025,400
21,60021,00019,50018,20018,200
18,20018,00018,00018,40017,800
July
17,400
17,80016, 700
17,40018,10020,40022, 70020,800
18,80016,00014,00013,00012,000
11,00010,0009,5009,000
7,6007,3006,8006,2005,600
5,3005,0005,0005,2005,500
Aug.
4,5004,2004,0003,9003,800
5,5005,500
5,0005,500
5,5005,2004,6004,0003,400
3,3003,0002,8002,8002,600
2,4002,3002,2002,1001,900
2,1002,0201,9001,7501,680
Sept.
1,6201 5601,5401,5101,470
1,4601,470
1,6701,820
1,8101,8101 7Qft1,8101,880
1,8401,8801,7901,7601,750
1,7501,9401,7201,5801,480
1,5101,6001,7601,6801,880
NOTE. No gage-height record and discharge estimated by hydrographic comparison Oct. 19, 20, Dec. 21-27, Jan. 1-30, Feb. 1-10, Mar. 11-15, and July 12 to Aug. 26. Braced figures give estimated mean dis charge for periods indicated.
Monthly discharge of Colorado River near Cisco, Utah, for the year ending September30, 1926
Month
March.
July......
September. _________________________
Discharge in second-feet
Maximum
13,000 4,890 3,350 2,700 2,880 5,060
25,100 47,500 46,800 22,700 5,500 1,940
47,500
Minimum
3,270 3,140 2,400
2,230 2,340 3,290
13,400 17,800 5,000 1,670 1,460
1,460
Mean
5,170 3,760 2,790 2,310 2,590 3,450
12,900 27,400 31,800 12,000 3,420 1,690
9,120
Run-off in acre-feet
318,000 224,000 172,000 142,000 144,000 212,000 768, 000
1, 680, 000 1, 890, 000
738,000 210,000 101,000
6, 600, 000
COLORADO RIVER AT IEES FERRY, ARIZ.
LOCATION. At Lees Ferry just above mouth of Paria River, at head of MarbleGorge, and at lower end of Glen Canyon, Coconino County.
DRAINAGE AREA. Not measured. RECORDS AVAILABLE. June 13, 1921, to September 30, 1926.
18 SURFACE WATER SUPPLY, 1926, PART IX
GAGE. Continuous water-stage recorder installed January 19, 1923, on left bank at head of Paria riffle. Zero of gage is 3,106.35 feet above sea level. Recor der inspected by D. A. Dudley and Jerry Johnson or Elmer Johnson.
DISCHARGE MEASUREMENTS. Made from cable about 1 mile upstream.CHANNEL AND CONTROL. Channel at measuring section straight and fairly
uniform. Banks high and not subject to overflow. Bed is composed of sand and silt and is scoured several feet during each flood season. Channel at gage confined between banks that are not subject to overflow. Control is Paria riffle; composed of gravel and boulders.
EXTREMES OF DISCHARGE. Maximum stage during year, from water-stage recorder, 16.7 feet at 8 a. m. May 29 (discharge, 86,500 second-feet); mini mum stage from water-stage recorder, 6.16 feet at 9 p. m. September 10 (discharge, 3,100 second-feet).
1921-1926: Maximum stage recorded, 26.5 at 2 p. m. June 18, 1921 discharge, about 190,000 second-feet); minimum stage, 4.2 feet at 5 p. m.
December 27, 1924 (discharge, 750 second-feet); river frozen over.The high-water mark of the flood of 1884 at the ranch near the mouth of
Paria River, as identified by Jerry Johnson, is at altitude of 3,137.1 feet above sea level.
ICE. Stage-discharge relation occasionally affected by ice for short periods.DIVERSIONS. Water is diverted from main river and tributaries above station
for irrigation of about 1,500,000 acres.REGULATION. None.ACCURACY. Stage-discharge relation practically permanent during year, except
for slight changes at the beginning of the spring floods and more changeable conditions during the short periods of maximum discharge. Rating curves well defined below 72,000 second-feet, but not satisfactory above. During the year 39 discharge measurements were made, of which 27 were made during the period of the spring floods, April 16 to July 12. Operation of water-stage recorder satisfactory, except August 18-19. Daily discharge ascertained by applying to rating table mean daily gage height determined from recorder graph, except for periods indicated in footnote to table of daily discharge and for a few days when hourly discharge was used because of rapidly changing stage. Records good.
Daily dischargefin second-feet, of Colorado River at Lees Ferry, Ariz., for the year ending September 80, 1926
Day
1 . 2.......3 -4 ... .5 . ...
6 _ ....7.......8 . _g10
11 12 13 ....14 15
16 17 18.......19 20
Oct.
13,00019 9flft
11,20010,500!fi iyifi
29,70025,50030,600oo tyifi16,700
15,90015,70017,10019,70019,200
1Q 3ftfi10 7Hft
17,10015,60015.000
Nov.
11,60011,500
11,80011,700
12, 10012,20011,90011 80011, 400
10,90010,700in 4nft10,40010,200
9 QQA
9,7009.7409,6609.540
Dec.
8,610S OftA
8,300
8 KAf\
8,470
8,7208 4fifi
8,120
8 1 Oft
7,8507,6207,5807,350
7 ion7,1907,0006,8106.590
Jan.
6,590
6,6906,8106,870
6,750
6,470
6,1706,1706,0206,0205,840
5 6405 KCA
5,5505,3905.280
Feb.
5,0905,060f, vin
5,870
6,2006,290
6,4106 440
6 0QA
6,3506 OQA
6,5006,780
6 7ftA
6,780
6,8706.750
Mar.
6,1706,1406,1106,0206,110
6,320
7,3508,0508,650
9,1309,240ft 700
8,9409,470
9,6609 OKA
9,74010,10011.000
Apr.
15,60014,10014,00013,00011 800
11,30011, 30012, 300
15,300
17,60020,0001Q 7ftft
22,50023,200
99 Qfln
22,80023,90026,90031.600
May
47,60048, 80050,90050,90052,600
55, 30059,60067,3007fi nnfi64,100
59,00053,60047,50042,20038,600
35,30033,30032,00033,30035.800
June
67,00066,30069, 70073,60075,000
76,00077, 50078,0007ft Hftfi
78,000
75,50073,400
68,10065,800
«o nnn
61,40059,90055,80049.500
July
28,00027,00025, 70025,30025,600
25,40025,70025,80026,70027,600
29,10028,60029,90035,80033,800
29,80026,70024,00021,90020,400
Aug.
10,0009,4709,3509,3908,850
8,4708.8908,0607 8008,890
10,50011,00011,10011,60012,200
12,20012,20011,0009,8008.770
Sept.
4,7804,4104,1503,9203,700
3,5203.3903,3303,2103,150
4,8807,9407,2007,2005,170
4,5506,1204,9304,3304,670
COLORADO BIVER AND TRIBUTARIES ABOVE GREEN RIVER 19
Daily discharge, in second-feet, of Colorado River at Lees.Ferry, Ariz., for the year ending September SO, 1926 Continued
Day
21.......22.......23_ 24 25.......
26.......27 .......28 29.......30.......31.......
Oct.
14,40013,80013,30013,20012,800
12, 80012,50012,50012,30012,00011,800
Nov.
9,4709,3509,1608,9808,540
8,2608,2208,1908,400
Dec.
6.2905,7305,5305,4405,640
5,6705,8106,1106,6206,7206,690
Jan.
5,4005,3505,3005,1005,050
5,0004,9505,0504,9804,9804,980
Feb.
6,8406,6606,4706,4406,320
6,3806,2606,260
Mar.
12,80014. 60014,70015,20015,800
15,10014, 10014,40014.70014,20013,700
Apr.
33,20037,20039,50040,20042,600
45,10047,80048,20048, 30049,000
May
38,30041,80048,80058,60064,900
71,70076,00081,00084,00077,50071,700
June
44,40040, 70038,60037,20034, 700
32,40031,40030,70029,20028,500
July
15,70017,50016,00014,70013, 600
12, 90012,10012,00013, 40011,80011,300
Aug,
8,5808,0607,440
6,510
6,0505,7005,5105,3205,1404,930
Sept.
4,9004,3004,0403,8703,820
»l 4,3106,2508,6207,8006,090
NOTE. Discharge Jan. 18 and 21-28 estimated, because of ice, by hydrographic comparison with Colorado River near Grand Canyon. Discharge May 27-30 and June 5-11 estimated by hydrographic comparison with Colorado River near Grand Canyon because of unsatisfactory rating for Lees Ferry. Discharge Aug. 18-19 interpolated because of unsatisfactory record of gage height.
Monthly discharge of Colorado River at Lees Ferry, Ariz., for the year endingSeptember SO, 1926
Month
July....-...... . August ___________ . __________ . .........
The year __________ _____________
Discharge in second-feet
Maximum
30,600 12,200 8,720 6,870 6,910
15,500 49,000 84,000 78,500 35,800 12,200 8,620
84,000
Minimum
10,500 8,190 5,440 4,950 5,060 6,020
11,300 32,000 28,500 11, 300 4,930 3,150
3,150
Mean
16,300 10,200 7,230. 5,820 6,310
10,400 26,500 54,600 57, 700 22,500 8,700 4,950
19,300
Run-off in acre-feet
1,000,000 607,000 445,000 358,000 350,000 640,000
1, 580, 000 3, 360, 000 3,430,000 1, 380, 000
535,000 295,000
14,000,000
COLORADO RIVER AT BRIGHT ANGEL CREEK, HEAR GRAND CANYON, ARIZ.
LOCATION. 300 feet above Kaibab Bridge, Grand Canyon National Park, aquarter of a mile above Bright Angel Creek, and 11 miles by trail northeastof Grand Canyon, Coconino County.
DRAINAGE AREA. Not measured.RECORDS AVAILABLE. October 1, 1922, to September 30, 1926. GAGE-. Water-stage recorder in concrete shelter and stilling well on right bank.
Inspected by B. S. Barnes, D. H. Barber, W. E. Code, and K. C. McCarter,resident hydrographers. Zero of gage is 2,420.3 feet above sea level.
DISCHARGE MEASUREMENTS. Made from cable 20 feet upstream from gage. CHANNEL AND CONTROL. Channel at gage and measuring section ranges from
a width of 250 feet at low water to 325 feet at high water. Banks are solidrock and very high. Bed is silt and sand which scours and fills each season.Control is Bright Angel Creek rapids.
EXTREMES OF DISCHARGE. Maximum stage during year, from water-stagerecorder, 24.27 feet at 2.30 p. m. May 29 (discharge, 85,600 second-feet);minimum stage, from water-stage recorder, 2.14 feet at 1 a. m. September 12(discharge, 3,810 second-feet).
1923-1926: Maximum stage recorded, 28.5 feet at 6 p. m. September 19,1923 (discharge, 112,000 second-feet); minimum stage, 0.70 foot at 8 p. m.December 28, 1924 (discharge, 700 second-feet).
20 SURFACE WATER SUPPLY, 1926, PART IX
ICE. No ice has occurred at this station during the period of record.DIVERSIONS. Water is diverted from main river and tributaries above station
for irrigation of about 1,500,000 acres. *tREGULATION. None.ACCURACY. Stage-discharge relation changed to some extent during period of
high water in May. Rating curves very well defined by 74 discharge measurements made during the year and well distributed with respect to both time and river stage. Operation of water-stage recorder satisfactory. Daily discharge ascertained by applying to rating table mean daily gage height determined from recorder graph. Records excellent.
Daily discharge, in second-feet, of Colorado River at Bright'Angel Creek, near Grand Canyon, Ariz., for the year ending September SO, 1926
Day
1 __ ..2......3 _4----..5 ...
6 7 8 .9 ...
10._ _
11 .12......13......14......15......
16...... 17 18..-_. 19 20
21...... 22 23...... 24...... 25
26 27 28 29 30 .31......
Oct.
14,00013, 300
11, 30011,600
28,40028,90029,00027,20020, 200
16,70018,20020, 700
19,300 20,900 20, 100 17,700 16,100
15, 600 15, 000 14,400 13, 900 13, 700
13,300 12,900 12, 800 12,60012,40012, 100
Nov.
11,90011,70011,70011,80012,000
11, 90012,40012,50012r 10011,700
11,40011, 10010,80010,50010,500
10,200 10,000 9,980 9,960 9,780
9,570 9,440 9,440 9,330 9,020
8,660 8,360 8,310 8,3208,630
Dec.
8,7708,660
8,5308,560
8,550
8,7308,500
8 97fi
8,3208,260
7,830
7,530 7,400 7,260 7,220 6,920
6,670 6,350 5,840 5,720 5,800
5,970 5,980 6,180 6,5606,9406,940
Jan.
6,8006 7Qfifi 74A
7 0306,9706,9206,9006 640
6,5206,4006,320
6,080
5,920 5,770 5,750 5,640 5,620
5,470 5,550 5,560 5,520 5,320
5,240 5,160 5,120 5,2505,1505,240
Feb.
5,280
5,280
6,170
6,5406,6006,680
6 Kftn6,6106,6306,910
7,200 7,060 7,060 7,3207,160
7,040 7,040 6,900 6,700 6,610
6,560 6,570 6,540
Mar.
6,320
6,450
6,7207,120
8,480
9,020
9,300
9,260
9,910 9,870 9,780
10, 400 11,000
12,200 14, 100 15, 500 15,700 16,100
16,100 15,200 14,800 14,90015,10014,700
Apr.
14, 40016, 80014,700
13,000
12,10013,00014,900
19,10021,50022,30022, 70024,500
24,300 23,900 24,200 26,000 29,500
34,300 36,600 40,600 40, 600 44,000
45, 700 48, 500 49,700 50,10050,800
May
50,20050,000
52, 70052,400
55, 80057, 800
72,40067,700
61, 900
51,000
41.000
38,000 34,800 32,700 32,600 35, 100
38, 100 41,300 45,900 54, 900 62,800
68,300 73, 800 77, 700 84,00078,80072,700
June
68,50067, 10068, 70072, 40074, 700
75,60077,200
77,90078,500
74,10072,50070,00068, 300
65, 300 62, 300 60, 400 57,500 52,200
47,000 42, 600 39, 700 38,200 35,800
32, 800 31, 500 30,900 29,80028,600
July
27,60026,40025,50026,100
25,80026,30025, 90026,900
29, 60028,70035, 40036,900
32, 400 28,900 25,800 23,200 21,600
19,900 18, 300 17, 100 15, 900 14, 800
13,800 13, 000 12,200 12,40013, 60011, 800
Aug.
11, 50010,40010, 20010,0009,780
9,4409,0609,2008,650
11,80011, 60011, 40012,200
12,500 12,800 12, 700 11,300 9,920
9,180 8,890 8,460 7,880 7,380
6,980 6,610 6,280 5,9705,6705,450
Sept.
5,2605,0004,7904,5904,460
4, 3204,2204,1104,0503,940
3,8705,6209,9009,3507,620
5,970 5,380 6,640 5,620 5,060
5,380 5,600 4,970 4,70fr 4,500
4,710 11,500 21,600 13,4009,150
Monthly discharge of Colorado River at Bright Angel Creek, near Grand Canyon, Ariz., for the year ending September SO, 1926
Month
July..
The vear ______________________ .. ...
Discharge in second-feet
Maximum
29.000 12,500 8,770 7,030 7,320
16,100 50,800 84,000 78, 500 36,900 12,800 21,600
84,000
Minimum
11,300 8,310 5,720 5,120 5,250 6,320
12.100 32,600 28,600 11,800 5,450 3,870
3,870
Mean
17,000 10, 400 7,490 6,040 6,530
10.600 27,700 54,900 58,500 23,200 9,430 6,510
19,900
Run-off in acre-feet
1, 050, 000 619, 000 461, 000 371, 000 363, 000 652,000
1, 650, 000 3,380,000 3,480,000 1, 430, 000
580,000 387, 000
14, 400, 000

COLORADO RIVER AND TRIBUTARIES ABOVE GREEN RIVER 21
COLORADO RIVER NEAR TOPOCE, ARIZ.
LOCATION. At lower end of a narrow section of Mohave Canyon, 3 miles below Topock, Mohave County.
DRAINAGE AREA. 171,000 square miles.RECORDS AVAILABLE. February 1, 1917, to September 30, 1926.GAGE. Continuous water-stage recorder on left bank; inspected by J. A. Baum-
gartner, K. C. McCarter, and J. E. Klohr, resident hydrographers. Zero of gage is 428.2 feet above sea level.
DISCHARGE MEASUREMENTS. Made from cable 20 feet upstream from gage.CHANNEL AND CONTKOL. Channel is straight above and below gage. Banks
are rock and have steep slopes. Bed is composed of sand and silt and shifts continually. The control is indefinite.
EXTREMES OF DISCHARGE. Maximum stage during year, from water-stage recorder, 19.80 feet at 2.30 a. m. June 1 (discharge, 84,800 second-feet); minimum stage recorded, 4.66 feet at 11 p. m. September 13 (discharge, 3,390 second-feet).
1917-1926: Maximum stage recorded, 28.2 feet at 6 a. m. June 22, 1921 (discharge, 174,000 second-feet); minimum discharge, 1,800 second-feet at 8 a. m. January 4, 1925.
DIVERSIONS. Water is diverted from main river and tributaries above station for irrigation of about 1,500,000.acres.
REGULATION. None.4ccuKACY. Stage-discharge relation continually changing. Discharge measure
ments made on alternate days throughout year. Measurements also made on intervening days when there was rapid change in stage. Measurements were made each day August 25 to September 30. Operation of water- stage recorder satisfactory. 'Daily discharge ascertained by shifting- control method by applying to standard rating table mean daily gage height determined from recorder graph. Records good.
Daily discharge, in second-feet, of Colorado River near Topock, Ariz., for the yean ending September 30, 1926
Day
1 2 ___ .3_ 4.. .5 6 7 ___8 9 10 11 ......12 13 .14 ...15. 16 17 18- 19 20 21 22 23 24 _25 26. 27 28 29 30 31- _ .
Oct.
13, 70013,00013,30013,40014,90013, 70019,80022, 40029,50026,70027, 40021,70017, 90016,80016,40016,90018,00018,80018,70020,20018,60016,60015,60015,40014,70014,10013, 40013,00012,60012,50011, 900
Nov.
11,70011,30011, 50011, 50012, 10011, 40011,50011,90011, 80012,20012,40011,90011, 70011,50011, 00010,50010,40010, 30010,2009,7609,5409,4809,4809,3409,0609,1209,0608,9508,6708,390
Dec.
8,0808,0108.2208,3908,5308,7408,2808,1808,3908,3608,2808,3908,4608,2207,7707,9108,0808,0107,4707,2607,1306,9607,0906,7506,4606,0605,7005,7005,8606,0906,000
Jan.
6,2606,5206,9606,9606,8506,8206,8906,5906,7506,8206,9607,0206,9206,5906,3606,2306,2906,1306,0905,8605,6305,8005,6305,4705,4405,3405,5705,7005,6605,3405,080
Feb.
5,2105,3105,3405,1805,4005,4705,1205,4705,9306,3606,4206,2306,3906,5606,4206,4606,8206,6906,8907,0606,8506,6607,1306,7906,9606,9606,6606,620
Mar.
6,5206,4906,4906,5206,3606,2606,1906,3206,5206,5906,7207,0207,7408,2508,9509,0908,4608,5309,440
10,0009,650
10,00010,90012,00014,00015,20015,20015,20015,00013,70013, 600
Apr.
14,80014,30014,40015,50016, 80014,80014,30015, 700J5,80015,10018,10021, 90020,90020,60022, 40021,90023,90025, 00024,20024,90027,10029,40033,00035,00039,30040,60042,60044,60047,70049,800
May
50,00050, 70051, 60050,80050,80052,20052,10054,20056,60060, 10065,40067,50065,00060,20052,40045,30041,90038, 70035, 20033, 60032,20032,70035,00039,40043, 10051,10058,60064,60069,10073,20080,700
June
83,80078,70071,20068,40068,60070,50072,20072,60073,90076,20077,00078,60079,30076,90073,00071,30069,80065,00061,70059,00057,70052, 80048,40043,20039,40037, 80036, 00034,00032,80032,000
July
30,20028,80027,70027,40026,70025,60025,20025,40025,80025,90025,20026,30027,30028,80028,00030,20035,80034,50030,80027,00024,40022,40020,60018,60017,00015,90015, 60015,10013,70012,90011,900
Aug.
11, 80012,90011, 60011,20010, 50010,6009,920
10,0009,2408,6808,6008,0907,6709,400
11, 40011, 30010, 70011,20011, 40011,00011,10010,3009,3208,6808,0507,6307,2106,5406,4705,9605,960
Sept.
5,5005,2204,8704,9705,0004,7605,3904,3604,2604,3005,4203,9703,6103,5403,7607,1408,8007,3605,7404,7605,0806,390
- 5,0004,5304,9004,9004,5604,2304,040
12,500
22 SURFACE WATER SUPPLY, 1926, PART IX
Monthly discharge of Colorado River near Topock, Ariz., for the year ending Septem ber 30, 1926
Month
October..... ________________________November... ________________________
January _______ ____________________February... __ . _____________________
April. _ . ______ . ______ . _______May....... ...........................................June. ____________________________July......................................................August ___________________________ ...
The year... ........................................
Discharge in seeond-feet
Maximum
29,500 12,400 8,740 7,020 7,130
15,200 49,800 80,700 83,800 35,800 12,900 12,500
83,800
Minimum
11,900 8,390 5,700 5,080 5,120 6,190
14,300 32,200 32,000 11,900 5,960 3,510
3,510
Mean
17,100 10,600 7,510 6,210 6,260 9,450
25,500 52,100 62,100 24,200 9,500 5,290
19,700
Run-off in acre-feet
1, 050, 000 631,000 462,000 382,000 348,000 581,000
1, 520, 000 3, 200, 000 3, 700, 000 1, 490, 000
584,000 315, 000
14, 300, 000
COLORADO RIVER AT YUMA, ARIZ.
LOCATION. In NE. K NE. % sec. 35, T. 16 S., R. 22 E., San Bernardino base and meridian, 100 feet upstream from original Southern Pacific Railroad bridge and half a mile downstream from highway bridge at Yuma, Yuma County. Since the change in channel on June 7, 1920, Gila River enters from east 5 miles upstream from this station.
DRAINAGE AREA. 242,000 square miles (measured on map compiled from best available maps of the Colorado River Basin).
RECORDS AVAILABLE. April 1, 1878, to September 30, 1926. Gage heights only, prior to January 1, 1902.
GAGE. Long-distance water-stage recorder installed May 1, 1922. Sender in stilling well on left bank 100 feet upstream from original Southern Pacific Railroad bridge at same point as vertical staff gage formerly used. Con tinuous recorder in office of Bureau of Reclamation. Sender and recorder inspected daily by Dan Martinez. Prior to installation of recorder vertical staff at same location and datum. Zero of gage is 102.79 feet above mean sea level.
DISCHARGE MEASUREMENTS. Made from cable 1,100 feet downstream from gage.CHANNEL AND CONTROL. Bed composed of shifting sand and silt; subject to
much scour during high water. No well-defined control.EXTREMES OF DISCHARGE. Maximum discharge during year, 73,100 second-feet
on June 16 (stage, 25.18 feet); maximum stage, 26.65 feet at 1 p. m. June 6. Minimum stage, 15.90 feet at 7 p. m. September 16 (discharge, 2,130 second- feet).
1902-1926: Maximum daily mean discharge, 240,000 second-feet Jan uary 22,1916; minimum discharge, 1,150 second-feet on January 8, 1925.
DIVERSIONS. Water is diverted for irrigation and power from main river and tributaries. Some water is diverted out of the drainage basin above this station. Water for the Yuma project of >the United States Bureau of Recla mation is diverted from right side of river at Laguna Dam 15 miles upstream. Canal siphons under river at Yuma. Wasteway from canal returns water to river in right side half a mile below gaging station. Imperial Irrigation Dis trict diverts water from river on right side 7 miles downstream from this station.
REGULATION.: Flow temporarily affected at times by sluicing at Laguna Dam Storage on tributaries has very little effect on flow at this station.
COLORADO RIVER AND TRIBUTARIES ABOVE GREEN RIVER 23
ACCURACY. Stage-discharge relation continually changing. Discharge measure ments made on alternate days except Sundays throughout year. Beginning January, 1926, discharge measurements made with equipment and methods similar to those used at other gaging stations on Colorado River. Operation of water-stage recorder satisfactory, except November 7-13 and December 15 to January 31, when staff readings were used. Staff gage read twice each day throughout year. Daily discharge ascertained by shifting-control method by applying to standard rating table mean daily gage height determined from recorder graph.
COOPERATION. Station operated by United States Bureau of Reclamation. Records furnished by Bureau of Reclamation and reviewed and checked by Geological Survey. Monthly discharge computed by Geological Survey.
Daily discharge, in second-feet, of Colorado River at Yuma, Ariz., for the year endingSeptember 30, 1926
Day
1 ..2 3 _ ...-4 5- ......
6 7. 8. ...9 ....10
11 12 13 14 15
16 17 18 19 20
21 22 23 _24 25
26 27 28 29 __30 31
Oct.
17,00015,30014,60014,00015,900
17,60021,40017,60021,80024,400
28,00027,90028,40023,40019,900
18,60017,60017,60019,90019,700
19,50020,30018,30016,80016,400
15,60014,60014,90014,30013,30013,200
Nov.
14,00012,90011,70011,90011,700
12,20012,60012,50012,10011,800
11,10011,40012,40013,10013,200
11,90010,70010,10010,20010,200
10,50010,90010,20011,00010,800
10,50010,2009,850
10,1009,460
Dec.
8,8608,3408,2907,7608,460
9,6609,1809,0408,5508,250
8,5508,7708,6008,2508,130
8,1308,0007,8408,2907,450
6,7206,7206,7906,7606,900
6,5206,7206,5205,8405,4905,590
Jan.
6,3005,9606,2306,5206,830
6,6206,5207,1106,7606,110
6,5906,8306,5206,7206,460
6,4205,7005,9305,5705,240
4,8905,0105,6804,6705,030
4,6304.4404,4604,6704,8004,420
Feb.
4,4004,5004,5404,5204,480
4,3304,4004,3104,4404,370
4,6104,8205,7305,7904,980
5,2905,3605,2605,4406,230
6,3606,5905,9305,4905,760
5,8205,6505,790
Mar.
5,2904,9105,1405,1705,100
5, 5204,8704,5904,6504,440
4,5404,5404,6105,0005,490
6,3306,9707,1507,1107,370
8,1307,9207,7207,3708,950
10,60012,20013,20013,60013,70012,900
Apr.
11,50011,60013,30012, 70012,800
14,00014,00013,40015,50027,200
35,80026,80027,20024,90022,100
22,50023,70023,50023,20023,900
23,40023,30024,70028,40029,700
31,300<fcl dfirt36,90039,00040,400
May
41,60041,40043,00044,10045,200
45,40046,60048,50048,60049,300
49,30050,50051,60053,90057,400
57,80056,20047,60041,60037,500
34,90032,20031,80033,30034,900
37,30040,60044,00048,00051,10054,400
June
57,40061,60063,40065,20067,300
68,30066,50066,60067,70068,000
68,30068,60069,70071,20071,800
73,10072,70070,60068,20064,500
60,00057,50055,40049,90044,700
40,60036,90035,10033,90030,400
July
28,60028,30027,20027,80026,300
24,30023,80024,10023,40023,200
24,50024,10024,80023,90025,600
26,00026,10029,80031,80029,500'
26,90023,70021,10019,20018,600
16,80015,90013,70011,90012,000,11,700
Aug.
11,50010,50013,90012,00010,600
10,4009,8009,3708,5109,230
8,8208,2908,5509,2707,180
7,1109,3709,3209,0009,140
9,6109,3709,4208,2907,220
6,6906,3306,3005,7005,1204,650
Sept.
4,6104,3104,0703,7403,540
3,7605,1908,2505,1204,940
4,5404,0984,2305,1704,650
3,3302,4403.1907,5606,260
5,1904,2003,4603,6804,800
3,5403,4003,3003,3603,190
MonihUy discharge of Colorado River at Yuma, Ariz., for the year ending September30, 1926
Month
December _ __ __ . __ . __________
February.. __ . _____________________
July....... .................... ... ..August
Discharge In second-feet
Maximum
28,400 14,000 9,660 7,110 6,590
13,700 40,400 57,800 73,100 31,800 13,900 8,250
73,100
Minimum
13,200 9,460 5,490 4,420 4,310 4,440
11,500 31,800 30,400 11,700 4,650 2,440
2,440
Mean
18,600 11,400 7,710 5,790 5,190 7,260
23,600 45,100 59,800 23,100 8,730 4,370
18,400
Kun-off in acre-feet
1, 140, 000 678,000 474,000 356,000 288,000 446,000
1,400,000 2, 770, 000 3,560,000 1, 420, 000
537,000 260,000
13,300,000
24 SURFACE WATER SUPPLY, 1926, PART IX
FRASER RIVER NEAR WEST PORTAL, COIO.
LOCATION. In NE. % sec. 4, T. 2 S., R. 75 W., a quarter of a mile from Vasquea siding on Denver & Salt Lake Railroad and \% miles northwest of West Portal, Grand County. Nearest important tributary, Buck Creek, enters. 7 miles upstream.
DRAINAGE AREA. 28 square miles (measured on topographic map).RECORDS AVAILABLE. September 23, 1910, to September 30, 1926.GAGE. Gurley water-stage recorder on left bank 300 feet upstream from old
logging road crossing at Vasquez; inspected by forest ranger.^ During: winter readings taken from staff gage 1 mile upstream at railroad bridge.
DISCHARGE MEASUREMENTS. M^de from-foottmdge near gage^or.by wading.CHANNEL AND CONTROL. Bed composed of boulders and coarse gravel; fairly
permanent. No well-defined control. Banks not subject to overflow.EXTREMES OP DISCHARGE. Maximum stage during year, from water-stage-
recorder, 2.36 feet at 8 p. m. June 6 (discharge, 383 second-feet); minimum discharge, 5 second-feet January 8-10 and 20-25.
1911-1926: Maximum discharge recorded, 820 second-feet at 9 p. mt June 13, 1918 (gage height, 2.9 feet); minimum discharge, 2 second-feet on March 30, 1912 (gage height, 0.60 foot).
ICE. Stage-discharge relation affected by ice.DIVERSIONS. Court decree for diversions of 53 second-feet across divide from,
headwaters of Fraser River into headwaters of Clear Creek. Water is diverted below station for irrigation of 9,300 acres.
REGULATION. Diurnal fluctuation during spring caused by alternate melting and! freezing of mountain snow. No artificial regulation.
COOPERATION. Complete records furnished by State engineer of Colorado.
Daily discharge, in second-feet, of Fraser River near West Portal, Colo., for the year ending September 30, 1926
Day
1234 - . - -5-.-----..-.....6 78 . .910 1112 __1314 _____ IS-..---....---..1617 18 1920 2122 2324 ............2526---.....-.....2728 29 3031
Oct.
28282626273127262726262d26262626252425252525252525252525252525
Nov.
252525242424
242*242424241315151514141414141414141415151515
Dec.
15141413141310
1313131313121212121211
101010998777777
Jan.
88777
6
5
6
67
6e
5
5
588788
Feb.
89888888888888877777
77778
118
Mar.
98880101010008888001010988999910101010101ft
Apr.
109999991011121414111214182021212624222124313637444652
May
6460697154494Q515454565862646466 971767692156186208220220208192173173181
June
201229241256263310
338324307302296290282282270236215222212195186190203206222215210208201
July
227210201192195192
19219018417014813912612311710710299949388807979747477706359
Aug.
59585953526563606259565250484645444241393837373332322927272726
Sept-
2625262626242221202121212120.2020,20202020.20.2019191920.20-2120.21
NOTE. Stage-discharge relation affected by ice Oct. 22-31 and no gage-height record Sept. 19-24; dis-- eharge interpolated. Shifting-control method used Nov. 4 to Ma*. 13.
COLORADO EIVEE AND TRIBUTARIES ABOVE I38EEN RIVER 25
Monthly discharge of Fraser River near West Portal, Colo., for the year endingSeptember 30, 1926
Month
July
September. ____ .. __ ... _______ -. __ .-- __
Discharge in second-feet
Maximum
31 25 15 8
11 10 52
220 349, 227
65 26
349
Minimum
24 137 5 7 8 9
49 186
5ft 26 19
5
Mean
25.9 18.6 11.0 6.35 7.79 9.06
20.2 104 249130 45.1 21.3
£4.2
Run-off in acre-feet
1,590 1,110
676 390 433in
1,200 6^400
14,800 7,990 2,770 1,270
39,200
BLUE RIVER AT DILLON, COLO.
LOCATION. In sec. 18, T. 5 S., R. 77 W., at highway bridge on edge of Dillon, Summit County. Nearest tributaries, Snake River and Tenmile Creek, enter a short distance below.
DRAINAGE AREA. 129 squre miles (measured on Forest Service maps).RECORDS AVAILABLE. October 15, 1910, to September 30, 1926.GAGE. Gurley water-stage recorder installed April 21, 1920, and referred to ver
tical staff on right abutment of bridge, which was used previously; inspected by I. W. Blundell.
DISCHARGE MEASUREMENTS. Made from bridge or by wading.CHANNEL AND CONTROL. Bed composed of compact gravel upon which lodges
detritus from hydraulic dredges near Bieckenridge. Control is riffle 50 feet downstream which shifts at long intervals. Banks not subject to overflow.
EXTREMES OF DISCHARGE. Maximum stage during year, from water-stage recorder, 3.44 feet at 11.30 a. m. June 7 (discharge, 1,080 second-feet); minimum discharge occurred during winter.
1911-1926: Maximum stage recorded, 3.6 feet on June 14, 1924 (discharge, 1,180 second-feet); minimum discharge, 14 second-feet on January 30 and February 9, 1915 (gage height, 1.10 feet).
ICE. Stage-discharge relation affected by ice.DIVERSIONS. Except for a small diversion across Boreas Pass practically no
diversions above station which do not return water to river.REGULATION. Diurnal fluctuation during spring caused by alternate melting
and freezing of mountain snow. No artificial regulation.COOPERATION. Complete records furnished by State engineer of Colorado.
Daily discharge, in second-feet, of Blue River at Dillon, Colo., for the year endingSeptember 30, 1926
Day
1. ._ -.2.... _ _.. 3- .... ...... .^.. ....................
6.--. ..... ... ......7. ......... - ....-...8--... .......9- ...............10- .. .11. .. .... .. ......12---.----.--.-... __ ..13 14-.. ___ ........ .....15.. ........ ___ . ...
Oct.
80777474
71747877767473737373
Nov.
62626362CQ
5656
56
545454
52
Dec. Jan. Mar. Apr.
36303030303030"U.
3840
45384250
May
202231276348070
421365114280
231213196190202
June
625699745817Qftft
9161050995977900874858874858817
July
536506478489
500495495
411445426,388374
Aug.
170165163168175177196
213234219196172154143
Sept.
9088.85848485848178.777673737171
26 SURFACE WATER SUPPLY, 1926, PART IX
Daily discharge, in second-feet, of Blue River at Dillon, Colo., for the year ending September SO, 1926 Continued
Day
16. 17. _ _ 18 19 20 21. 22-... .23..-.-..-- .24. .......... .... ......25
26 27. ___ . _ . ___ .. _28. ___ .--- _ . __29- .30- 31
Oct.
7473
73
70706969656'3
586363686663
Nov.
504845424242
42
454.c
4545AK
Dec.
07
Jan. Mar.
31
Apr.
78849090
108
10098
107118128149156
May
237280295
3183Q3
472548606
592506ci 9
554
June
784684599
548CQA
467484
484489506
July
361343335QOf
OlQ
306987
254OflO
247231222199
180
Aug.
138fOO
128
199
116
116114
979594
92
Sept.
RQ
6868flC
65656360*;Q606060f;o
NOTE. No gage-height record Nov. 15-30 and Apr. 1-21; discharge based on temperature record and current-meter measurements. Shifting-control method used Apr. 22 to June 15.
Monthly discharge of Blue River at Dillon, Colo:, for the year ending SeptemberSO, 1926
Month
July.....
September- ______ _____ ___ __ .... __ .. ....The year __ . _________________ ... ...
Discharge in second-feet
Maximum
80 63
175 737
1,050 536 234
901,050
Minimum
58
190 467 180 92 59
Mean
70,9 50.5 39 28 29 30 74.4
382 701 364 146 71.7
166
Run-off in acre»feet
4,360 3,000 2,400 1,720 1,610 1,840 4,430
23,500 41, 700 22,400 8,980 4,270
120,000
NOTE. Mean discharge for December, January, February; and March based on temperature record and three current-meter measurements.
SOARING FOSE AT GLENWOOD SPRINGS, COLO.
LOCATION. In sec. 9, T. 6 S., R. 89 W., 1,500 feet above mouth of river at Glen- wood Springs, Garfield County.
DRAINAGE AREA. 1,460 square miles (measured on base map of Colorado).RECORDS AVAILABLE. April 6, 1906, to September 30, 1909; September 21, 1910,
to September 30, 1926.GAGE. Gurley water-stage recorder installed October 27, 1917, and referred to
inclined staff on left bank 800 feet above highway bridge; inspected by C. H. Oberly and Andrew Dickson.
DISCHARGE MEASUREMENTS. Made from single-span highway bridge.CHANNEL AND CONTROL. Bed composed of boulders and coarse gravel; shifting at
long intervals. No well-defined control. At rare intervals affected by backwater from Colorado River. Banks not subject to overflow.
EXTREMES OF DISCHARGE. Maximum stage during year, from water-stage recorder, 6.36 feet at 7 a. m. June 7 with an estimated backwater effect of 0.3 foot (discharge, 9,640 second-feet); minimum stage, 0.80 foot from 1 p. m. to 8 p. m. February 24 (discharge, 300 second-feet).
1906-1909; 1910-1926: Maximum discharge recorded, 17,600 second-feet June 14, 1918, and June 14, 1921; minimum discharge, 225 second-feet on December 16, 1906 (gage height, 1.15 feet).
COLORADO RIVER AND TRIBUTARIES ABOVE GREIJN RIVER 27
ICE. Stage-discharge relation not seriously affected by ice except for short periods.
DIVERSIONS. Water diverted from Roaring Fork for irrigation of 8,700 acres, and water diverted from tributaries for irrigation of 25,000 acres.
REGULATION. Diurnal fluctuation during spring cuased by alternate melting and freezing of mountain snow. No artificial regulation.
ACCURACY. Stage-discharge relation shifts at intervals; slightly affected by ice. Rating curves used October 1 to December 9 and December 16 to September 25 are both well defined. Operation of water-stage recorder satisfactory except as explained in footnote to table of daily discharge. Daily discharge ascertained by applying to rating tables mean daily gage height obtained by inspection of recorder graph; shifting-control method used July 17 to August 11. Records gopd except for periods of missing gage heights and when affected by ice and by backwater, for which they are fair.
Discharge measurements of Roaring Fork at Glenwood Springs, Colo., during the year ending September 30, 1926
Date
«.?-- Nov. 16... Mar. 30........ _
Gage height
Sfcrf1.451.31.98
Dis charge
Sec.-ft. 749560367
Date
May 11 May 12.........
Gage height
Feet 2.372.255.35
Dis charge
Sec.-ft. 1,4701,3606,890
Date
July 28. ........A nsr *M
Gage height
Feet 2.251.53
Dis charge
Sec.-ft. 1,450
652
NOTE. All measurements, except the one on Nov. 16, furnished by State engineer.
Daily discharge, in second-feet, of Roaring Fork at Glenwood Springs, Colo., for the year ending September 30, 1926
Day
2.. ...... __3. ........... ...
5 - -- -
6..... ......... .7. . . _8. 9---.-.-.---- ..10. 11.- 19Sfe:::::::::::14 - 15..- 16 17. 18 19. .20. ..21.,.. . ..........22..-- .........23.. ..-. 24. 25. 26- 27. 28.. _ .. . _29. .-.-.30. 31. -..
Oct.
990960920890940
1,2501,2001,0901,0501,0401,2001,1401,0701,020
980
1,000970930900881872881900843852843843852
824
Nov.
805796852834754746805805788780771762754
,,754698690
619606606580580
600606986580580580580
Dec.
586586593532580580568520509480455440430
. 420400
390394437442419424432432424394390390402363360
Jan.
4324023943863633783703743863633783563523703704QR
398395398400390370338342428398398
370QQA
374
Feb.
qnn
374360
356370370370
37036036336334937ft
356338Q7A
37d
342
335366346335346
Mar.
q/lfi
352360
382
366338352374382
3863983Q4
382402
419446475475475465
455500495A4K
414
410385
Apr.
370395386QQd
4195175725291517
535529KfiC
584591679880
1,110
1,270
1,3701 PIQfl
1,4501.6701 QAfl
1 ftrtfl
2 17ft
May
9 Iftfl
2,1002,5209 owl3,4303,4302,6102,2301,9001,670
1,310i ion1,1301,3001,4101,6301,7501 Rftflo 01 n
9 QP»fl
4,1005,0005,5006,0005,1004,2503 QAf)
3,740
June
3,2403.110
6,6207,5408,4407,5107,5906 QQn
7,1106,9706,2806,0606,0904,8704,1704,1904 q7n
4,2603,7803.7604,1304,3303 QRA
4,0204 0604,020
July
3,8003,4502,9703,0603,430
3,4504,2405,1204,7503 8403,5303,340
2,8802,6402,440
2,2602,1602,0802,030
1 7*U1
1,7101 680i PISH1 *\ftft
1,450i 3fini oftn1,200
Aug.
1,1501,1001,080
1,3001,2501,2701,2901,300
1,2401,100
825807780764748732715700693686651617604
C7C
eeq
535
Sept.
523511511529565578578578600580541
.530
500530
591595con
585575
535517505540500510520
NOTE, No gage-height record Jan. 17-22, 28-29, May 23-28, July 15-16, 25-27, Aug. 12-13, 20, Sept. 9^10, 12-17,19-24^,26-30; stage-discharge relation affected by ice Dec. 10-15 and by backwater from Colorado River June 5-13; discharge based on comparison with flow of Colorado River at Glenwood Springs. .
90720 30 3 - ^
SURFACE WATER SUPPLY, 1926, PART IX
Monthly discharge of Roaring Fork at Glenwood Springs, Colo,f for the year endingSeptember 30, 1926
Month
July-..
Discharge in second-feet
Maximum
1,250 852 593 432 390 500
2,170 6, 000 8,440 5,120 1,300
600
8,440
Minimum
824 580 352 330 335 338 370
1,130 3,110 1,200
535 500
330
Mean
966 692 456 380 360 411 971
2,840 5,170 2,650
889 546
1,360
Kun-ofl in acre-feet -
59, 400 41,200 28,000 23,400 20,000 25, 300 57,800
175; 000 308,000 163,000 54,700 32,500
988,000
PARACHUTE CREEK AT GRAND VALLEY, COLO.
LOCATION. In NW. % sec. 12, T. 7 S., R. 96 W., at Aplin ranch, half a milenorthwest of Grand Valley, Garfield County. No tributary between stationand mouth, 1 mile below.
DRAINAGE AREA. 196 square miles (measured on base map of Colorado). RECORDS AVAILABLE. April 7, 1921, to September 30, 1926. GAGE. Vertical staff attached to side of left abutment of private bridge; read
by W. T. Aplin.DISCHARGE MEASUREMENTS. Made from single-span bridge or by wading. CHANNEL AND CONTROL. Bed composed of compact silt on shale rock. Control
at rapids 200 feet downstream; slightly shifting during high water. Banksnot subject to overflow.
EXTREMES OF DISCHARGE. Maximum stage recorded during year, 2.2 feet at8 a. m. and 6 p. m. April 27 (discharge, 226 second-feet); minimum stage,creek dry during greater part of August and September.
1921-1926: Maximum stage recorded, 3.0 feet at 5 p. m. May 9, 1922(discharge, 790 second-feet); minimum discharge occurred in 1926.
ICE. Stage-discharge relation seriously affected by ice. DIVERSIONS. Water diverted above station for irrigation of 2,000 acres. REGULATION. Diurnal fluctuation during spring due to alternate melting and
freezing of mountain snow. No artificial regulation. \ COOPERATION. Complete records furnished by State engineer.
Daily discharge, in second-feet, of Parachute Creek at Grand Valley, Colo., for the year ending September SO, 1926
Day
1:1 2 ' '. .-. (
3------ i-!~4.. * -5.-- --*- --
6. ! -7 ^. ___ .. ...Q :',. " !
Li:; I-- -I-:"10--
: .; : ' -. ".'.. < - r . - ";11 V-,Ji. -..Wi. ___ .. -,.v.
12. ** , ,-!13 * 14 __ 15---
Oct.
1212121212
1219
121212
f1212
Nov.
, 4444515858
v/, 58'' 58
585858
!/' : 58*.;.,; 58
585858
,Mar.
17171717
' 17
1717
',. 171 20
20
rlao.*' ' * 33
3333
Apr.
242658719Q >
58747466'58
.58,,7f^7888
May'
140103S&8883f
:7fmm
10388
ic '74'
666658
/ Junii
#> ::,f'
242424n24
:'l?
,17; .171817
..:?if:';.; ; ;;;i7.:**'-' 24'
:i28
20
Jui^
1111% 2
1 ^
\1
r.v,-.^.-= ~.^jy,,:.^-.
-.,.4Vv4
Aug.
42224
': 24- 7
44
i 4
' : 4.'/'Z:,.;.<:- 2
--.-i-- f -2;«*: . flr
Sept.
0Q000
00Q00
f^ .,,'« -:, ' 6
V- ̂ o12
COLORADO BIVEB1: AISTOTRIBUTAEIBS, ABOVE GREEN RIVER 29l
Daily discharge, in second-feet, of Parachute Creek at Grand Valley, Colo.,for th& year ending September 30, 1926 Continued
Day
16 __ _ _....-_._..-__n. ..........................18 __ .......................19 __ .- ...._.....__.._...20 __ .......................
21.-. ............. .......22 __ ........................23 _ ........................24 __ .. _ ...................25...........................
26 __ ...... __ ..............27 __ .......................28.............. _ ..........29.......... .................30 __ ............... _ .....31....... ............ ........
Oct.
1616121212
1212171717
242428333333
Nov..
5858585858
5858585858
5858585858
Mar,
2426242428
2624283824
242494172018
Apr..
889696119140
154190211211211
196226
211127
May
5858444444
4442333333
312826242018
June
127774
42222
11
11
July
21111
11111
111111
Aug.
00000
00010
000000
Sept.
000
- 00
00022
3477
33
Monthly discharge of Parachute Creek at Grand Valley, Colo., for the year endingSeptember 30, 1926
Month
April.. - - .-..- .- . May _______________________________
July............... ......................................
Discharge in second-feet
Maximum
33 58 38
226 140 28 20 24 33
Minimum
12 44 17 24 18
1 1 0 0
Mean
17.0 56.8 23.0
113 59.7 12.2 1.90 2.19 2.03
Run-off in acre-feet
1,050 3,380 1,410 6,720 3,670
72fr 117 135 121
EOAN CREEK NEAR DE BEQUE, COIO.
LOCATION. On line between sees. 10 and 15, T. 7 S., R. 98 W., at highwaybridge 11 miles north of De Beque, Mesa County. Nearest tributary,Kimball Creek, enters half a mile above.
DRAINAGE ABE A. 210 square miles (measured on base map of Colorado). RECORDS AVAILABLE. April 8, 1921, to September 30, 1926. GAGE. Chain gage attached to downstream side of bridge; read by J. D. Nethery. DISCHAKGE MEASUREMENTS. Made from single-span bridge or by wading. CHANNEL AND CONTBOL. Bed composed of compact mud and gravel; shifting.
No well-defined control. Banks not subject to overflow. EXTREMES OF DISCHARGE. Maximum stage recorded during year, 2.4 feet at
8 a. m. and 6 p. m. May 1 (discharge, 193 second-feet); minimum dischargeprobably occurred during winter.
1921-1926: Maximum stage recorded, 4.45 feet at 7.30 p. m. May 21,1922 (discharge, 1,110 second-feet); minimum discharge, 8 second-feet at7,30 p. m. August 4, 1922.
ICE. Stage-discharge relation seriously affected by ice. DIVERSIONS. Water diverted for irrigation of 2,200 acres from Roan Creek,
chiefly, below station; also 3,400 acres from tributaries. REGULATION. Diurnal fluctuation during spring from alternate melting and
freezing of mountain snow. No artificial regulation. COOPERATION. -Complete records furnished,by State engineer. .,
30 SURFACE WATER SUPPLY, 1926, PART,IX
Daily discharge, in second~feet, of Roan Creek near De Beque, Colo., for the yearending September SO, 1926
Day
1 2.--- ----- _ . _3 .................4 ............. ...5 ____ _ _ -.
6- _ - _
8 9 10
11 12-.- . -.13 14 15
16 17 18 19 .20
21 22 2SL2* - .... .... . ..... -25
26 27 28 29.. _ - .......30 31 ... ........ ..
Oct.
1816161627
3323212023
3230282624
2221212020
2019191919
181818171818
Nov.
1920Oft
91
19
1919181818
1919191817
1818171717
1718If1818
1818191919
Feb.
f 15
1616
16
161515
151516
Mar.
16
161726
,30
2191
24
2929293236
5050505040
455056,2119
171716161616
Apr.
1617171736
56755040
6868757582
90989898106
106123148.157166
166161157175179
May
193179175166157
157148148140114
11498908282
7575625040
4040323232
404032365062
June
3636363232
3236343232
3231313131
3131313131
3130292929
2626262621
July
2121212932
2662322424
6236363232
3232262121
2121171616
1414148242119
Aug.
1Q
17171414
1616141416
1719191919
1917171716
1616161414
141414141414
Sept.
1616161614
14141414
1414141416
1414141413
1212121313
1314141414
Monthly discharge of Roan Creek near De Beque, Colo., for the year ending Septem ber 30, 1926
Month
May
July
Discharge in second-feet
Maximum
3321
r56 179 193
36 148
19 16
Minimum
15 17
15 16 32 21 1* 14 12
Mean
21.3 18.4 15 28.3 91.9 89.7 30.7
,30:716.0 14.0
Run-off in acre-feet
1,310 1,090
833 1,740 5,4?0 5,520 1,830 1390
984 833
NOTE. Mean discharge for February based on temperature and gage-height record.
TAYIOR RIVER AT ALMONT, COIO.
LOCATION. In sec. 22, T. 51 N., R. 1 E., at highway bridge in Almont, GunnisonCounty, 300 feet above junction of Taylor and East Rivers.
DRAINAGE AREA. 440 square miles (measured on base map of Colorado). RECORDS AVAILABLE. July 27, 1910, to September 30, 1926. GAGE. Bristol float-type water-stage recorder installed April 16, 1922, on
downstream end of center pier and referred to staff gage used previously;inspected by J. W. Brittain.
DISCHARGE MEASUREMENTS. Made from 2-span bridge. CHANNEL AND CONTROL. Bed composed of small boulders and coarse gravel;
slightly shifting. No well-defined control. Banks not subject to overflow.
COLORADO RIVER AND TRIBUTARIES ABOVE GREEN RIVER 31
EXTREMES OP DISCHARGE. Maximum stage recorded during year, 4.1 feet at 6 a. m. June 7 (discharge, 2,320 second-feet); minimum discharge occurred during winter.
1910-1926: Maximum discharge recorded, 3,760 second-feet on June 9, 1920 (gage-height, 5.0 feet); minimum stage, 1.2 feet, several days during August, 1913 (discharge, 50 second-feet).
ICE. Stage-discharge relation affected by ice during winter.DIVERSIONS. Water diverted by Taylor River for irrigation of 1,800 acres.REGULATION. None.ACCURACY. Stage-discharge relation slightly shifting; affected by ice. Rating
curve well defined. Operation of water-stage recorder satisfactory. Daily discharge ascertained by applying to rating table mean daily gage height obtained by inspection of recorder graph; shifting-control method used August 12 to September 30. Records good except for periods of missing gage heights and when affected by ice, for which they are fair.
Discharge measurements of Taylor River at Almont, Colo., during the year endingSeptember 30, 1926
Date
Mar. 24.. ....Apr. 19
Gage height
Feet 1.782.10
Dis charge
Sec.-ft. 131274
Date
May 28..... .
Gage height
Feet 3.163.36
Dis charge
Sec.-ft. 1,0501,190
Date
Aug. 9 ..........
Gage height
Feet 2.351.82
Dis charge
Sec.-ft. 395176
NOTE. Discharge measurements made by employees of State engineer.
Daily discharge, in second-feet, of Taylor River at Almont, Colo., for ihe year endingSeptember SO, 1926
Day
I... .................... .... i. ............ ..... .........3 ... .. . ....4---. . _. - .5... .....................
T. ..........................8.. .9----.. .................10.. 11 12.. ______ ___13.......- ...............14-... .. .15....... ...... ..............16-- 17.-.. - __ -- -18 19-- 20 . 21.... _ ............ ........22....... ...............23 24--. _ - ....^S,.. .........................26------ _ -. .27 . 28-- 29 .. .......30- ... .--.. ... ... .. .31 - _
Oct.
180184180
252
284
224275280275275
238229224238224234211211224229224188252252255240230225
Nov.
220
211184184
180184
171171175166
1.58103ino
120136136136
136
136136136136136136136
Mar.
7878
105QQ
7657AQ
7887QA
IfUl
105
105
119
105
110
136136119112
112116100
Apr.
1001AO
105
119140
126
1301 W
193229qno
357313298275234010
480398079
458486377458480
May
430486CQft
605
62844641 Q
367OO7
308298289,298398486480506
708QfiS
1,0701,2001,3201,2601,2201,120
9941,120
June
1 6801,6101 7°/l
1,910
1,410
1,4101, 5101,2601,200
946
834798756716724748708708692644652732
July
676620
RQ9
834
927Q97
708cnn
700.636575
532469452
414
one079367oc7
342317367367332
Aug.
289
284303372
435
382
322322280270270
27528026625726697A
234
229220211211206
Sept.
175175175
294
280243229188180184224
' 216202180
175171175175188
211193188193211202193216
NqjGE, No*g^ge-height.record Qct. 27 to,Nov. 2, Mar. 21-23; stage-discharge relation ajfected by ice Nov. 17, 22-26;'30; discharge based on comparison witB flow'of Gmmisori River neat' Gunhison. Braced figures show mean discharge for period indicated.
32 : SUEEACE WATEE SUPPLY, 1926,.PAET IX
Monthly discharge of Taylor River at Almont, Colo.,for the year ending September 30,
Month
October _____________________________
December __________________________January ___________ _ ______ ______ __
March. ________ _ ___ .... __ __
June.. ...................................................July... ...................................................August _____________________________September. _____ _____ .. ___ . _ _____
Discharge in second-feet
Maximum
284 220
136 486
1,320 1,910
927 435 294
1,910
Minimum
180 103
57 100 289 644 303 188 171
Mean
232155 106 84 95
102 254 697
1,150 541 286 202
326
Run-off in acre-feet
14,300 9,220 6,520 5,160 5,280 6,270
15,100 42,900 68,400 33,300 17,600 12,000
236, 000
NOTE. Mean discharge for December, January, and February based on temperature and gage-height records and comparison with flow of Gunnison River near Gunnison.
GUNNISON HIVES NEAB GUNNISON, COIO.
LOCATION. In sec. 3, T. 49 N., R. 1 W., at highway bridge 2 miles southwest of Gunnison, Gunnison County. Nearest tributary, Tomichi Creek, enters 1 mile below.
DRAINAGE AEEA. 1,010 square miles (measured on Forest Service map).RECORDS AVAILABLE. November 27, 1910, to November 30, 1914; April 27,
1916, to September 30, 1926.GAGE. Chain on downstream side of bridge; datum lowered 1.00 foot October
15, 1918; read by C. W. Chinery.DISCHARGE MEASUREMENTS. Made from single-span bridge or by wading.CHANNEL AND CONTROL. Bed composed of coarse gravel and small boulders.
Control at well-defined rapids below bridge; somewhat shifting. Banks not subject to overflow except during extremely high stages.
EXTREMES OP DISCHARGE. Maximum stage recorded during year, 3.9 feet at 7 a. m. June 7 (discharge, 4,140 second-feet); minimum discharge probably occurred during winter.
1910-1914; 1916-1926: Maximum discharge, 11,400 second-feet June 13, 1918; minimum discharge recorded, 126 second-feet January 8, 1919, from current-meter measurement.
ICE. Stage-discharge relation seriously affected by ice.DIVERSIONS. Water diverted by Gunnison River, between this station and forks
at Almant, for irrigation of 8,800 acres.REGULATION. None.ACCURACY. Stage-discharge relation shifts at intervals; affected by ice. Rating
curve used October 1 to December 24 and curve used December 25 to Sep tember 30 are both well defined. Gage read to quarter-tenths twice daily. Daily discharge ascertained by applying mean daily gage height to rating table. Records good except for ice-affected periods, for which they are fair.
COLORADO RIVER AND TRIBUTARIES ABOVE GREEN RIVER 33
Discharge measurements of Gunnison River near Gunnison, Colo., during the yearending September 30, 1926
Date
Oct. 2..-.--....
Feb. 23
Gage height
Feet 1.08".82
.90
Dis charge
Sec.-ft. 292110171
Date
Mar. 23 . -Apr. 19 May 27.. ..
Gage height
Feet 1.041.903.10
Dis charge
Sec.-ft.
775.2, 600
Date
Sept. 10-
Gage height
Feet 3.001.821.12
Dis charge
Sec.-ft. 2,240
782277
<* Stage-discharge relation affected by ice.NOTE. Discharge measurements made by employees of State engineer.
Daily discharge, in second-feet, of Gunnison River near Gunnison, Colo., for the year ending September 30, 1926
Day
1 ..... . _ -2 ..... . ...3 ....4. _5 .e. ...........7. ..............8 .9 ...
10.. 11 12 13 14. 15 16 17 18 . ..19 20. 21.. ......22- _23 _ . ......24. 25 ________ ..26 27 28. 29 .30- . .31
Oct.
277286290286294
4003663363613944114174234.00
417423435435417
417429429423411379388411361383
Nov.
3783663613di9Q4.
326350294Q17
322322308308299
,1! 252
I.1j- 250
I
Dec.
|f 2481.!i 2101.
I 2001
201198201203203201201198198201192182
. IQfl
Jan.
180
150
133
1QK
Feb.
215
180
162
1531 ^Q
166
Mar.
169
162169
159153156
172172188206214218225230*?3Q
244244244239244OQC;
295278248221214182188
Apr.
206218225248239253360360342313313
390500KA-l
660855
786
7701,1901,1801,0701,2201 ^I7ft1,2201,3901,560
May
1,4201,6401,8002,0102,1002,2201,6501,4401,3301,150960970855770
1,1501,1501,2701,270980
1,1301,9802,2902,4402 9802,8802,7602 AQn2,2602,0602,2602.580
June
2,9803,3803,3203,4103,4503,4903,5302,9602,9602,8802,6802,9202,9802,5102,3802,1301,7201,4901,4401,390
1,3001,1201,2101,1801,1001 ion1,2201,1901,160
July
1,1701,1501,0701,0301,4301,4301,4201,4201,2701,020930
1,1501,040940900873794730674674597611562527481468
500562500442
Aug.
436436429442462632695695709646611555527474455448442429403384366384354348330318307278263301342
Sept.
330313318336455448429384336301330342307318267258267258244253248248263267267267267272278313
NOTE. Stage-discharge relation affected by ice Nov. 15 to Dec. 14, Dec. 23-24, 27-31, Jan. 1 to Feb. 25; discharge based on temperature and gage-height record and two current-meter measurements. Braced figures give mean discharge for period indicated.
Monthly discharge of Gunnison River near Gunnison, Colo., for the year endingSeptember 30, 1926
Month
October..... _ .....
February... ____________ ........................March ....... ....... ......-........ ........ ........April ........................ ... .... ...........
July...... .. .. ........... .... ......
September. __ . _________ , ...... -.... .........
The year ___ . ________ ___ . ..........
Discharge in second-feet
Maximum
435 378
295 1,560 2,980 3,530 1,430
709 455
3,530
Minimum
277
153 206
770 1,100
442 263 244
Mean
385 289 207 166 194 209 685
1,750 2,200
865 448 306
643
Eun-off in acre-feet
23,700 17,200 12,700 10,200 10,800 12,900 40,800
108,000 131,000 53,200 27,500 18,200
466,000
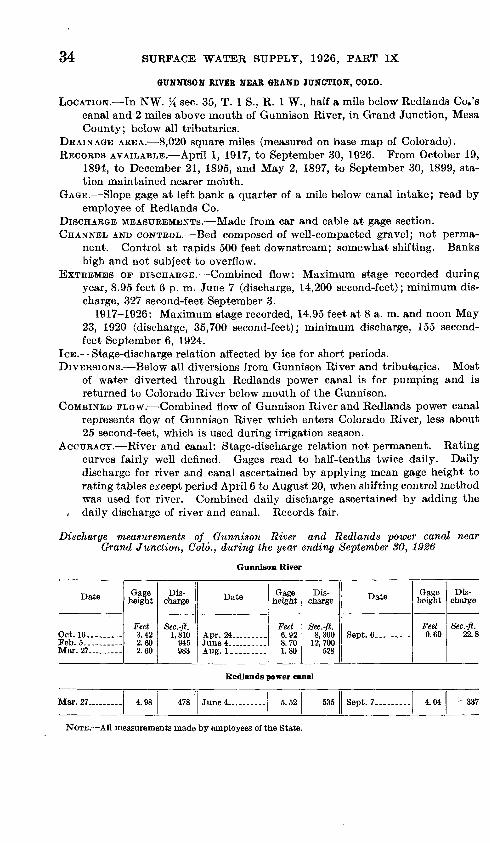
34 SURFACE WATER SUPPLY, 1926, PART IX
GUNNISON RIVER NEAR GRAND JUNCTION, COIO.
LOCATION. In NW. % sec. 35, T. 1 S., R. 1 W., half a mile below Redlands Co.'s canal and 2 miles above mouth of Gunnison River, in Grand Junction, Mesa County; below all tributaries.
DRAINAGE AREA. 8,020 square miles (measured on base map of Colorado).RECORDS AVAILABLE. April 1, 1917, to September 30, 1926. From October 19,
1894, to December 21, 1895, and May 2, 1897, to September 30, 1899, sta tion maintained nearer mouth.
GAGE. Slope gage at left bank a quarter of a mile below canal intake; read by employee of Redlands Co.
DISCHARGE MEASUREMENTS. Made from car and cable at gage section.CHANNEL AND CONTROL. Bed composed of well-compacted gravel; not perma
nent. Control at rapids 500 feet downstream; somewhat shifting. Banks high and not subject to overflow.
EXTREMES OF DISCHARGE. Combined flow: Maximum stage recorded during year, 8.95 feet 6 p. m. June 7 (discharge, 14,200 second-feet); minimum dis charge, 327 second-feet September 3.
1917-1926: Maximum stage recorded, 14.95 feet at 8 a. m. and noon May 23, 1920 (discharge, 35,700 second-feet); minimum discharge, 155 second- feet September 6, 1924.
ICE. Stage-discharge relation affected by ice for short periods.DIVERSIONS. Below all diversions from Gunnison River and tributaries. Most
of water diverted through Redlands power canal is for pumping and is returned to Colorado River below mouth of the Gunnison.
COMBINED FLOW. Combined flow of Gunnison River and Redlands power canal represents flow of Gunnison River which enters Colorado River, less about 25 second-feet, which is used during irrigation season.
ACCURACY. River and canal: Stage-discharge relation not permanent. Rating curves fairly well defined. Gages read to half-tenths twice daily. Daily discharge for river and canal ascertained by applying mean gage height to rating tables except period April 6 to August 20, when shifting control method was used for river. Combined daily discharge ascertained by adding the
, daily discharge of river and canal. Records fair.
Discharge measurements of Gunnison River and Redlands power canal near Grand Junction, Colo., during the year ending September 30, 1926
Gunnison River
Date
Oct. 16... ...Feb. 5. ... ...Mar. 27 ......
Gage height
Feet 3.422.602.60
Dis charge
Sec.-ft. 1,810
945983
Date
A r*r 94
Aug. 1. ________
Gage height
Feet6 no
8.701.80
Dis charge
Sec.-ft. 8,300
12, 700528
Date
Sept. 6_ -
Gage height
Feet 0.60
Dis charge
Sec.-ft. 22.8
Redlands power canal
Mar. 27.-...-... 4.98 478 5.52 Sept. 7.. - 4.04 337
NOTE. All measurements made by employees of the State.
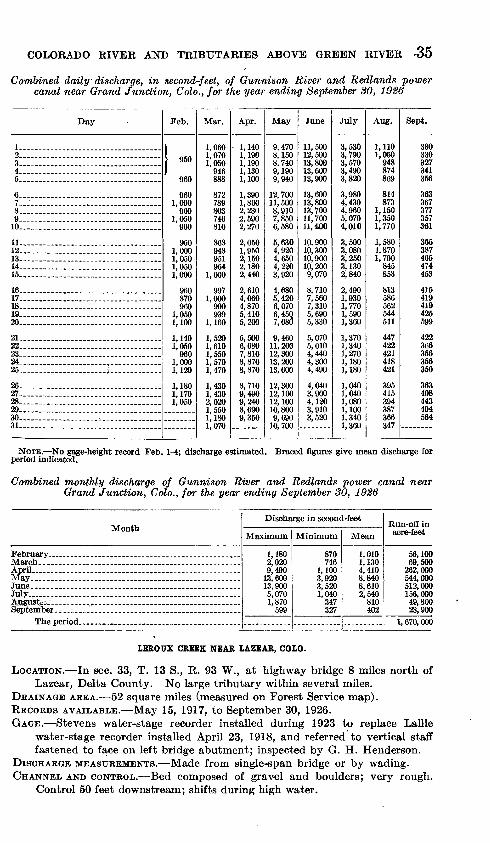
COLOKADO RIVER AND TRIBUTARIES ABOVE GREEN RIVER -35
Combined daily discharge, in second-feet, of Gunnison River and Redlands power canal near Grand Junction, Colo., for the year ending September 30, 1926
Day
1 2........ ___ __ ........ _ ... ...3 . 45....................................
6 ... ...................... ..7 . .................... ............8 .................................9 10........... ......................
11 12. .. 13 14.. ...........................15 .............................
16... .................................17 ...... .....-.-...-...-.-.......18....................................19 .............................20 .
21....................................22....................................23 24 ................ _ ..........25 _* .
26 27 .............................28 29.. .............................30 . .,. 31
Feb.
1 9501
960
9601,000
9601,050
960
9601,0001,0501,0501,000
960870960
1,100
1,1401,050
9601,0001,120
1,1801,1701,050
Mar.
1,0601,0701,050
946888
872789803746810
868948951964
1,000
997
900939
1,160
1,5201,6101,5501,5701,470
1,4301,4302,0201,5501.1801,070
Apr.
- 1,1401,1901,1901,1301,100
1,3901,8002,2302,5902,270
2,0501,9502,1502,1802,440
2,6104,0604,8705,4105,200
5,5006,6807,8108,8708,870
8,7109,4909,240
-8,6909,350
May
9,4708,1508,7409,1909,940
12,70011,5008,9107,8506,580
5,6304,9204,6504,2203,920
4,6805,4206,070
7*680
9,46011,20012,30013,20013,600
12,30012,10012,10010,8009,690
10 700
June
11,50012,50013,80013,60013,900
13,60013,80013,70011,70011,400
10, 90010,30010,90010,2009,070
8,7107,5607,3105,6905,330
5,0705,0104,4404,3004,490
4,0403,9004,1203,9103,520
July
3,5303,7903,5703,4903,820
3,9804,4304,9605,0704,010
3,5003,0803,2503,1302,840
2,4901,9301,7701,5901,360
1,3701,3401,2701,1801,180
1,0401,0401,0801,1001,3401,360
Aug.
1,1101,080
948874869
814873
1,1501,3501,770
1,5801,8701,700
845853
813586562544511
447422421418421
395415394387366^47
Sept.
330330327341356
363367377357361
365387465474453
415419419425599
422366356356350
363408443494564
NOTE. No gage-height record Feb. 1-4; discharge estimated. Braced figures give mean discharge for period indicated.
Combined monthly discharge of Gunnison River and Redlands power canal near Grand Junction, Colo., for the year ending September 30, 1926
Month
February
May. _________ ____________________
July.. .
September.. I . _ .. ......................The period ____________________ .....
Discharge in second-feet
Maximum
1,180 2,020 9,490
13,600 13,900 5,070 1,870
599
Minimum
870 746
1,100 3,920 3,520 1,040
347 327
Mean
1,010 1,130 4,410 8,840 8,610 2,540
810 402
Run-off in acre-feet
56,100 69,500
262,000 544,000 512,000 156,000 49,800 23,900
1, 670, 000
1EROUX CREEK NEAR IAZEAR, COIO.
LOCATION. In see. 33, T. 13 S., R. 93 W., at highway bridge 8 miles north of Lazear, Delta County. No large tributary within several miles.
DRAINAGE AREA. 52 square miles (measured on Forest Service map).RECORDS AVAILABLE. May 15, 1917, to September 30, 1926.GAGE. Stevens water-stage recorder installed during 1923 to replace Lallie
water-stage recorder installed April 23, 1918, and referred to vertical staff fastened to face on left bridge abutment; inspected by G. H. Henderson.
DISCHARGE MEASUREMENTS. Made from single-span bridge or by wading.CHANNEL AND CONTROL. Bed composed of gravel and boulders; very rough.
Control 50 feet downstream; shifts during high water.
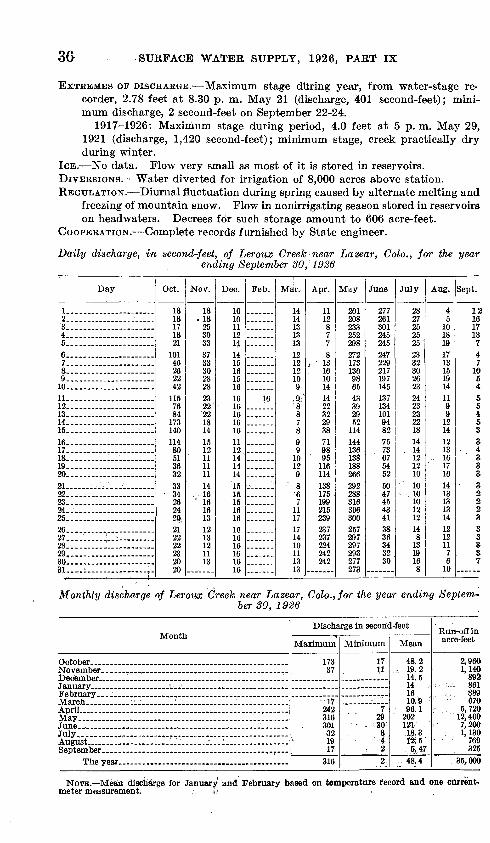
SURFACE WATER SUPPLY, 1926, PART IX
EXTREMES OF DISCHARGE. Maximum stage during year, from water-stage re corder, 2.78 feet at 8.30 p. m. May 21 (discharge, 401 second-feet); mini mum discharge, 2 second-feet on September 22-24.
1917-1926: Maximum stage during period, 4.0 feet at 5 p.m. May 29, 1921 (discharge, 1,420 second-feet); minimum stage, creek practically dry during winter.
ICE. No data. Flow very small as most of it is stored in reservoirs.DIVERSIONS. Water diverted for irrigation of 8,000 acres above station.REGULATION. Diurnal fluctuation during spring caused by alternate melting and
freezing of mountain snow. Flow in nonirrigating season stored in reservoirs on headwaters. Decrees for such storage amount to 606 acre-feet.
COOPERATION. Complete records furnished by State engineer.
Daily discharge, in second-feet, of Leroux Creek near Lazear, Colo., for the year ending September 30, 1926
Day
I... .... ......... .... ..2........ _ ...... ._ ...
' 3.. ............ ........4:.. ....................
5...- ... ...............8.. ................. ...7. ... ..................B.. ................. ...9... ............... ....10............. ..... . ...11 ______________12....... ___ ... .... ...13 _ ..... __ ..... __ .14...... _ ........ __ .15 _ __ 16 .... _17 .._ ... r ... .....18.. ........... .........19. ... ___ 20.......... ___ ....21....-.....;...........99
23.. _ ...... .. ... 24. ............ _ ......25 - __ ,26.. .. __ 27...... ...... - ....28 ..... . _ . .....29,. . _______ .30 _ ___ - _ 31 . - T-
, . ... . i
Oct.
1818171821
10146262242115
84173140114805136323334262420212222232020
Nov.
18.18253033373330282823
221814151211111114161616131213121113
Dec.
1010111 9
l*141516151616161616161112141414151515
16161616161616
Feb.
16
Mar.
1414131O
1Q
12121210
9:88789910129867
1117171410111313
Apr.
11128778
/ ' 13, 16
10141422322938719895116114138175199215239237237224242242
May
2012082339^99QS
27217313098654339295211414413613&188266292288316306300257297297293277273
June
2772613012452452472292171971451371341019482757367545250
. 474543413836343230
July
28272525252332302623242323221814
. 1412121010
.101012121481319168
Aug.
45101819171315191411991214121316
' 171614131313141212117610
Sept.
12161713747105456453343333222333337
Monthly discharge of Leroux Creek near Lazear, Colo., for the year ending Septem ber 30, 1926
Month
May. ______ . .
July,.
September. __ _ . . . _ . _ .. ...
Discharge in second-feet
Maximum
173 37
17 242 316
- 301 32 19 17
316
Minimum
17 11
7 29
- . 308- ' - *"
, 2,2w
Mean
48.2, 19. 2
14.5 14 , 16 10:9 96. 1
202 121- 18.3re 5'
& 4748.4
Run-off in acre-feet
2,960 1,140
892 .:- . 861
,, 889 670
5, 720 12,400 7,200
, , 1,130 769 325
35,000
NOTE. Mean discharge for January and February based on temperature record and one current, meter measurement. . i
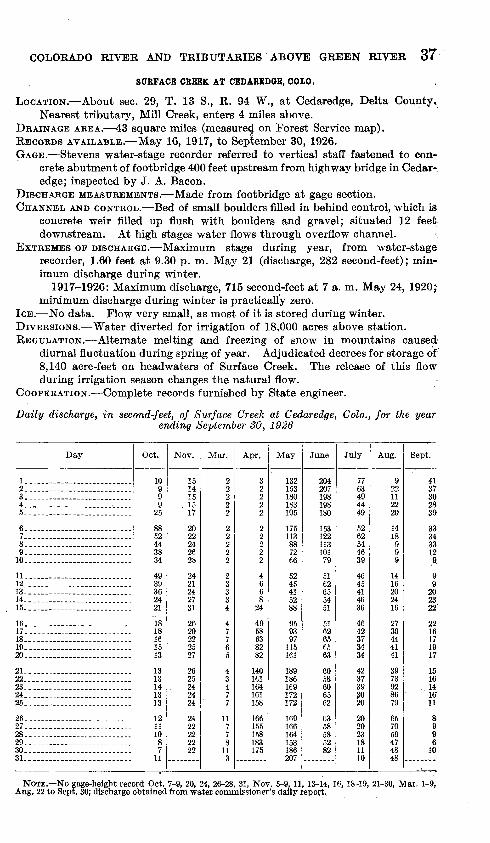
COLORADO RIVER AND TRIBUTARIES ABOVE GREEN RIVER 37
SURFACE CREEK AT CEDAREDGE, COIO.
LOCATION. About sec. 29, T. 13 S., R. 94 W., at Cedaredge, Delta County, Nearest tributary, Mill Creek, enters 4 miles above.
DRAINAGE AREA. 43 square miles (measured on Forest Service map).RECORDS AVAILABLE. May 16, 1917, to September 30, 1926.GAGE. Stevens water-stage recorder referred to vertical staff fastened to con
crete abutment of footbridge 400 feet upstream from highway bridge in Cedar- edge; inspected by J. A. Bacon.
DISCHARGE MEASUREMENTS. Made from footbridge at gage section.CHANNEL AND CONTROL. Bed of small boulders filled in behind control, which is
concrete weir filled up flush with boulders and gravel; situated 12 feet downstream. At high stages water flows through overflow channel.
EXTREMES OF DISCHARGE. Maximum stage during year, from water-stage recorder, 1.60 feet .at 9.30 p. m. May 21 (discharge, 282 second-feet); min imum discharge during winter.
1917-1926: Maximum discharge, 715 second-feet at 7 a. m. May 24, 1920;- minimum discharge during winter is practically zero.
ICE. No data. Flow very small, as most of it is stored during winter.DIVERSIONS. Water diverted for irrigation of 18,000 acres above station.REGULATION. Alternate melting and freezing of snow in mountains caused
diurnal fluctuation during spring of year. Adjudicated decrees for storage of 8,140 acre-feet on headwaters of Surface Creek. The release of this flow during irrigation season changes the natural flow.
COOPERATION. Complete records furnished by State engineer.
Daily discharge, in second-feet, of Surface Creek at Cedaredge, Colo., for the year ending September 30, 1926
Day
1....... __________ ..2. 34. .......... ... __ ........5. ..........................
6.. 1. ..........................8.......... ..............9........ __ ...............
10. ........ ............... ...
11. .12.. _ .... _ . _____ .....13.. 14............... ___ ... ...15. ....... ........ _ ........
16....... ....... ......... .17-.-. ..18.......... ....... .......19. 20--
21--- 22..... ___ . ___ ..........23-- 24.. _____ .... _ ..........25.
26. ......27-. . 2829-. 30-- 31-.
Oct.
10999
25
8852
3834
4939362421
1818ie1513
1313141313
12111087
11
Nov.
151415
, 1517
2022
2628
2421242731
2620222527
2625242424
22222222
Mar.
22
2
22
2
2333
7765
43477
8
3
Apr.
32
29
2
2
4668
24
4958638282
140Ifcl164161158
166155158183175
May
132153180183
175113887266
52AK.
41
88
959397
115iei189186169172172
166164153186207
June
204207198198180
1 %1
122
1017Q
£1
65
51
65(563
6058606562
6358585282
July
7763494449
5262
4639
4645414636
4642373434
4237393020
202023181110
Aug.
9221122
1418999
1416202416
2730444141
3973928679
657059474848
Sept.
4137302830
33343312
99
2022'
22
171917
1516141611
899610
NOTE. No gage-height record 9ct. 7-9, 20, 24, 26-28, 31, Nov. 5-9. 11, 13-14, 16, 18-19, 21-30, Mar. 1-9, Aug. 22 to Sept. 30; discharge obtained from water, commissioner's daily report.
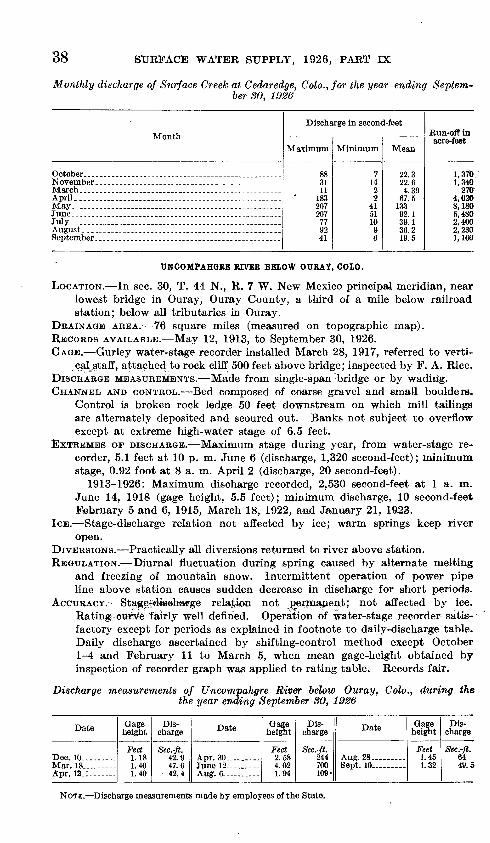
38 SURFACE WATER SUPPLY, 1926, PART IX
Monthly discharge of Surface Creek at Cedaredge, Colo., for the year ending Septem ber SO, 1926
Month
OctoberNovemberMarch. _ ... _ . .AprilMay._June. _ ................... __ .July__August __ . _September.--------. _ ................ .....
Discharge in second-feet
Maximum
88 31 11
183 207 207
77 92 41
Minimum
7 14
2 2
41 51 10 9 6
Mean
22.3 22.6 4.39
67.5 133 92.1 39.1 36.2 19.5
Run-off in acre-feet
1,370 1,340 270" 4,020 8,180 5,480 2,400 2,230 1,160
ITNCOMPAHGRE RIVER BEIOW OITRAY, COIO.
LOCATION. In sec. 30, T. 44 N., R. 7 W. New Mexico principal meridian, near lowest bridge in Ouray, Ouray County, a third of a mile below railroad station; below all tributaries in Ouray.
DRAINAGE AREA. 76 square miles (measured on topographic map).RECORDS AVAILABLE. May 12, 1913, to September 30, 1926.GAGE. Gurley water-stage recorder installed March 28, 1917, referred to verti
cal staff, attached to rock cliff 500 feet above bridge; inspected by F. A. Rice.DISCHARGE MEASUREMENTS. Made from single-span bridge or by wading.CHANNEL AND CONTROL. Bed composed of coarse gravel and small boulders.
Control is broken rock ledge 50 feet downstream on which mill tailings are alternately deposited and scoured out. Banks not subject to overflow except at extreme high-water stage of 6.5 feet.
EXTREMES OP DISCHARGE. Maximum stage during year, from water-stage re corder, 5.1 feet at 10 p. m. June 6 (discharge, 1,320 second-feet); minimum stage, 0.92 foot at 8 a. m. April 2 (discharge, 20 second-feet).
1913-1926: Maximum discharge recorded, 2,530 second-feet at 1 a. m. June 14, 1918 (gage height, 5.5 feet); minimum discharge, 10 second-feet February 5 and 6, 1915, March 18, 1922, and January 21, 1923.
ICE. Stage-discharge relation not affected by ice; warm springs keep river open.
DIVERSIONS. Practically aH diversions returned to river above station.REGULATION. Diurnal fluctuation during spring caused by alternate melting
and freezing of mountain snow. Intermittent operation of power pipe line above station causes sudden decrease in discharge for short periods.
ACCURACY. Staj^diseharge relation not permanent; not affected by ice. Rating etHwe fairly well defined. Operation of water-stage recorder satis factory except for periods as explained in footnote to daily-discharge table. Daily discharge ascertained by shifting-control method except October 1-4 and February 11 to March 5, when mean gage-height obtained by inspection of recorder graph was applied to rating table. Records fair.
Discharge measurements of Uncompahgre River below Ouray, Colo., during the the year ending September SO, 1926
Date
Apr. 12
Qage height
Feet 1.18
1.40
Dis charge
Sec.-ft.
47.642.4
Date Gage height
Feet
4.021.94
Dis charge
Sec.-ft. 244700109-
Date
Aug. 28 Sept. 10 _ . __
Gage height
Feet 1.451.32
Dis charge
Sec.-ft. 6449.5
NOTE. Discharge measurements made by employees of the State.
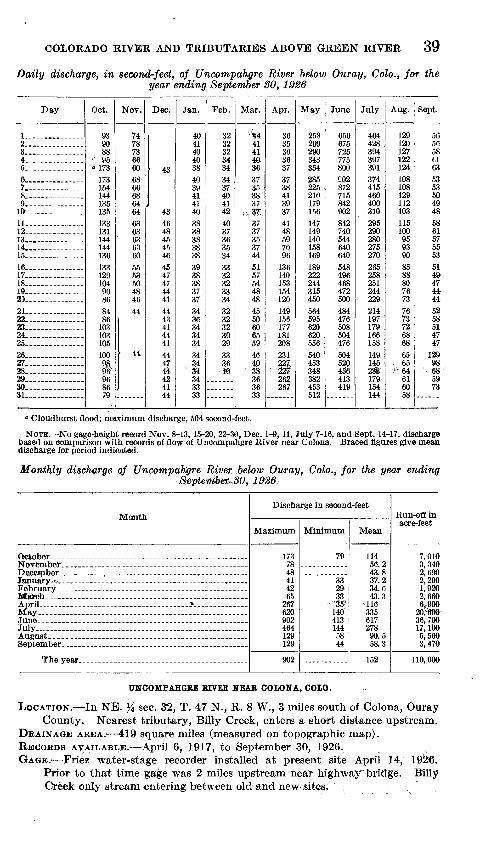
COLORADO RIVER AND TRIBUTARIES ABOVE GREEN RIVER
Daily discharge, in second-feet, of Uncompahgre River below Ouray, Colo., for the year ending September SO, 1926
Day
1. . __ 2 _ ............3 _ -- .-.-.._4 .... ..... ...5...............6. __ .7.8 ___ --.. _ ...9.
10L ........
11. ---.. ......12... ............13 14 ............15
16 17 _ ............18 19 23 21 ..........2223- 24 25 .26 27 28 .29- 30. 31 .
Oct.
939088
>' 95"173
154144135135133131144
133
1(14.9086
8486103103
100
So
8679
Nov.
747873
6068
6864646363
' 63636055KQ
50484644
44
Dec.
43464845
4645
47444144434144414447444241
Jan.
404140403840394141403838383838393838373734363434343434343433
Feb.
3232
3434
37404142403736353433323233343232323029
^
Mar.
'%4
41
403637353837
- ; ,.$? '3737353744515754484845506065594640383636
Apr.
3635
363737384139374148597096136140153154120149
177181208231
227"262267
May
258269290343354285225210179
147149140158169189222244315450564595620620556540453348382453
June
650675725775800S02872715842902842740544640640548496468472500484476508504476504520436413419
July
464428394397391374415460400310295290280275270265258251244229214197179166158149145231179154144
Aug.
129120127122124108108129112103115100959390858880767376737268686565
^64616058
Sept.
5656586163535350494858615755535149474444525851474712998685973
a Cloudburst flood; maximum discharge, 504 second-feet.
NOTE. No gage-height reeord Nov. 8-13, 15-20, 22-30, Dec. 1-9,11, July 7-16, and Sept. 14-17; discharge based on comparison with records of flow of Uncompahgre River near Colona. Braced figures give mean discharge for period indicated.
Monthly discharge of Uncompahgre River below Ouray, Colo., for the year endingSeptember, 30, 1926
Month
April ______________________ * _____ __
July
Discharge in second-feet
Maximum
173 78 48 41 42 65
267 620 902 464 129 129
902
Minimum
79
33 29 33- "35*
140 413 144 58 44
Mean
114 56.2 43.8 37.2 34.6 43.3
116 335 617 278 90.5 58.3
152
Run-off in acre-feet
7,010 3,340 2,690 2,290 1,920 2,660 6f flOO
20,'eOO 36,700 17,100 5,560 3,470
110,000
UNCOMPAHGRE RIVER NEAR COLON A, COIO.
LOCATION. In NE. K sec. 32, T. 47 N., R. 8 W., 3 miles south of Colona, Ouray County. Nearest tributary, Billy Creek, enters a short distance upstream.
DBAINAGE ABEA. 419 square miles (measured on topographic map).RECORDS AVAILABLE. April 6, 1917, to September 30, 1926.GAGE. Friez water-stage recorder installed at present site April 14, 1926.
Prior to that time gage was 2 miles upstream near highway bridge. Billy Creek only stream .entering between old and new sites.
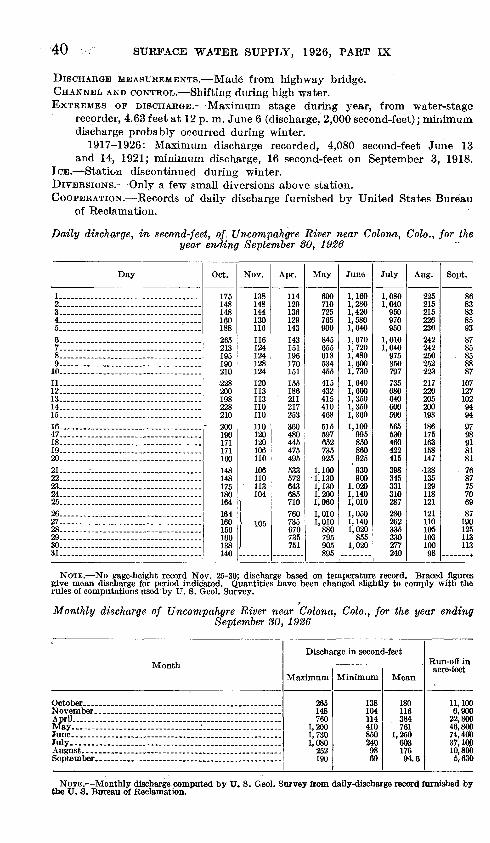
40
DISCHARGE MEASUREMENTS. Made from highway bridge.CHANNEL AND CONTROL. Shifting during high water.EXTREMES OF DISCHARGE. Maximum stage during year, from water-stage
recorder, 4.63 feet at 12 p. m. June 6 (discharge, 2,000 second-feet); minimumdischarge probably occurred during winter.
1917-1926: Maximum discharge recorded, 4,080 second-feet June 13and 14, 1921; minimum discharge, 16 second-feet on September 3, 1918.
ICE. Station discontinued during winter. DIVERSIONS. Only a few small diversions above station. COOPERATION. Records of daily discharge furnished by United States Bureau
of Reclamation.
Daily discharge, in second-feet, of, Uncompahgre River near Colona, Colo., for the year ending September SO, 1926
Day
1.. ______ ......................2... .................................3. . ..-. .--.-.4....................................5 ...............6 ........ .... .7 . _ 8....................................9 ..........10 11 . 12....................................13 _ . 14. . __ 15 .....-..... ...........16 ... ................17.. ...... _ .................... _ ..18.. _____ .... 19 20 . _
21.......... _____ . _ ........ __ .22 ............ _ ..................23... _ ._24 _25 ..............................26. _ .27 _. _28 ....................... _ ....29 . . ...30 31... ....... _ .......................
Oct.
175148148160188265
195IQrt
210
200
228
- 200190171171160148148175
164164160156160138-tAf)
Nov.
138148144130116116124124128124120113113110110110,120120106110106110113104
Apr.
114129136129143143151196170151
186' 211
217253360480445475
533572643685710760735670735751
May
690710725765900845655618534455415432415410468515597652735925
1,1001, 1301,1301,2001,0601,0101,010880795905895
June
1,1601,2801,4201,5801,6401,6701,7201,4801,6001,7301,6401,6001,3501,3501,3601,100995850860925930900
1,0201,1401,0101,0501,1401,020855
1,020
July
1,0801,040950970950
1,0101,040975850797735680640600590565530460422415398345331310287280262335330277240
Aug.
225215215226230242242250252223217220205200193186175163158147138135129118121121110105103100Qfi
Sept.
86838385938785
. 85888710712710294949798918181
. 768775706987190125113113
NOTE. No gage-height record Nov. 25-30; discharge based on temperature record. Braced figures give mean discharge for period indicated. Quantities have been changed slightly to comply with the rules of computations used by U. S. Geol. Survey.
Monthly discharge of Uncompahgre River near Colona, Colo., for the year endingSeptember SO, 1926
Month
November.. _____ __________________
June.. ______ . ____________________July.....................................................
Discharge in second-feet
Maximum
265 148 760
1,200 1,730 1,080
252 190
Minimum
138 104 114 410 850 240 98 69
Mean
180 116 384 761
1,250 603 176 94.6
Run-off in acre-feet
11,100 6,900
22,800 46,800 74,400 37,100 10,800 5,630
NOTE. Monthly discharge computed by U. S. Geol. Survey from daily-discharge record furnished by the U. S. Bureau of Reclamation.
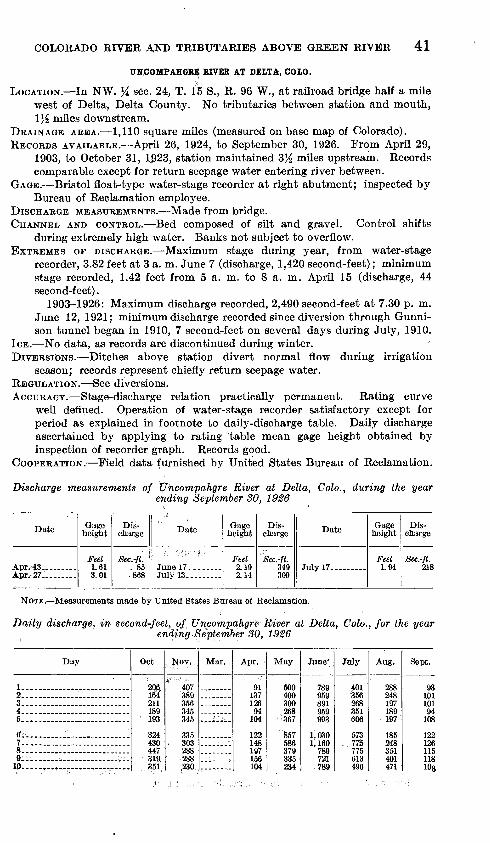
COLORADO RIVER AND TRIBUTARIES ABOVE GREEN RIVER 41
UNCOMPAHGRE RIVER AT DEITA, COIO.
LOCATION. In NW. % sec. 24, T. 15 S., R. 96 W., at railroad bridge half a mile west of Delta, Delta County. No tributaries between station and mouth, \Yz miles downstream.
DRAINAGE AREA. 1,110 square miles (measured on base map of Colorado).RECORDS AVAILABLE. April 26, 1924, to September 30, 1926. From April 29,
1903, to October 31, 1923, station maintained 3K miles upstream. Records comparable except for return seepage water entering river between.
GAGE. Bristol float-type water-stage recorder at right abutment; inspected by Bureau of Reclamation employee.
DISCHARGE MEASUREMENTS. Made from bridge.CHANNEL AND CONTROL. Bed composed of silt and gravel. Control shifts
during extremely high water. Banks not subject to overflow.EXTREMES OP DISCHARGE. Maximum stage during year, from water-stage
recorder, 3.82 feet at 3 a. m. June 7 (discharge, 1,420 second-feet); minimum stage recorded, 1.42 feet from 5 a. m. to 8 a. m. April 15 (discharge, 44 second-feet).
1903-1926: Maximum discharge recorded, 2,490 second-feet at 7.30 p. m. June 12, 1921; minimum discharge recorded since diversion through Gunni- son tunnel began in 1910, 7 second-feet on several days during July, 1910.
ICE. No data, as records are discontinued during winter.DIVERSIONS. Ditches above station divert normal flow during irrigation
season; records represent chiefly return seepage water.REGULATION. See diversions.ACCURACY. Stage-discharge relation practically permanent. Rating curve
well denned. Operation of water-stage recorder satisfactory except for period as explained in footnote to daily-discharge table. Daily discharge ascertained by applying to rating table mean gage height obtained by inspection of recorder graph. Records good.
COOPERATION. Field data furnished by United States Bureau of Reclamation.
Discharge measurements of Uhcompahgre River at Delta, Colo., during the year ending September 30, 1926
Date
Apr.'43 _. ....Apr.- 27i. .......
Gage height
Feet 1.613.01
Dis charge
Sec.-ft.. 85.868
Date
--. ' "--' .«'
July 13- .....
Gage height
Feet 2.192.14
Dis charge
Sec.-ft. 349309
Date
July 17.. ..
Gage height
Feet 1.94
Dis charge
Sec.-ft. 218
NOTE. Measurements made by United States Bureau of Reclamation.
Daily discharge, in second-feet, of Uncompakgre River at Delta, Colo., for the yearending September 80, 1926
Day
12... __..-......._.-._.._....3....... .. ............^... ................... ... ..5-. ...... ...................
6.. ........... __ ..........7.. ...... _ ................8.... . _ .. __ ..........o-.... ....-...:.... .--.10.----,-,. .- ..........
Oct
164211ISO
193
324430447
" ^1Q
351
NOV. ,
; 407389356345QJC
QQC
303288
' 9ftft
230
Mar. Apr.
Ql
126Q4.
IfU
1221481971*515
104
May
500400300268367
857
379OOE
234
June'
789QKQ
CQ1
959QQO
1,030
7CQ
79T
789
July
401356268OKI
606
573775775613496
Aug.
OOC
248197ICQ
197
is<;248351401471
Sept.
9810110194
108
109
115
10»
42 SURFACE WATER SUPPLY, 1926, PART IX
Daily discharge, in second-feet, of Uncompahgre River at Delta, Colo., for the year ending September 30, 1926 Continued
Day
11... ___ .. ___ .........12-.. .....................13..... .14....-. ... 15
16...- .... 17---..... __ .. _ . . _ ..18... ..19 20
21.. ___ ... ___ ....... __ .22... __ .... __ _23-- 24 . 25
26. 27.- . 28 29 30 31
Oct.
483447471520
CO7
471459496
447
A CO
418
413407411
418418418
Nov.
1761641 ^fi
1521 fUl
145
Mar.
8181
Apr.
7461685163
148319367490553
436586721857891
823789700650fiftfl
May
197225185164156
185283335
586
436508407483520
373620789520
721
June
823857959620687
586288202172351
351263373424185
215340351238
July
453390309309293
206215
172
164156185193193
215220234298309278
Aug.
258152148197197
189176m168164
160168152164152
145133129133129111
Sept.
118145160133115
122118118104108
98941019191
111115137129141
NOTE. Discharge estimated Nov. 15-16 because of ice and interpolated Apr. 28 to May 3 because of missing gage heights.
Monthly discharge of Uncompahgre River at Delta, Colo., for the year ending Sep tember 30, 1926
Month
October _____________________________
April- _ _
June--_----_------__----------_-_._____ . .-.- -.-_-.-.-.July August--..- __________________________
Discharge in second-feet
Maximum
527 407 891 857
1,160 775 471 160
Minimum
164 145
51 156 172 156 111 91
Mean
400 264 351 414 586 337 199 115
Eun-off in acre-feet
,2fc#8P '8^80 20,900 25,500 34,900 20,700 12,200 6,840
SAN MIGTTEL BIVEE AT NATUBITA, COLO.
LOCATION. In T. 46 N., on line between Rs. 15 and 16 W., at highway bridge in Naturita, Montrose County. Nearest tributary, Basin Creek, enters half a mile downstream.
DRAINAGE AREA. 1,080 square miles (measured on base map of Colorado).RECORDS AVAILABLE. April 26, 1918, to September 30, 1926.GAGE. Chain gage fastened to upstream side of bridge; read by Mrs. A. R.
Payson.DISCHARGE MEAauREMENTS. Made from single-span bridge or by wading.CHANNEL AND CONTROL. Bed composed of coarse gravel and small boulders
and is rough. Control at rapids 300 feet downstream; practically per manent.
EXTREMES OF DISCHARGE. Maximum stage recorded during year, 4.2 feet at 7.30 a. m. May 6 and 6,30 a. m. June 6 (discharge, 1,790 second-feet); mini mum discharge probably occurred during Winter.
1918-1926: Maximum stage, 7.5 feet from high-water mark during night of May 4, 1921 (discharge, 6,000 second-feet); minimum stage recorded, 0.05 foot on August 31, 1918 (discharge, 38 second-feet).
COLORADO RIVER AND TRIBUTARIES ABOVE GREEN RIVER 43
ICE. Stage-discharge relation affected by ice.DIVERSIONS. Water diverted by San Miguel River for irrigation of 8,100 acres,
the greater part of which is above station. Also, 15,000 acres irrigated bytributaries above station.
REGULATION. Diurnal fluctuation during spring from alternate melting andfreezing of mountain snow.
COOPERATION. Complete records furnished by State engineer.
Daily discharge, in second-feet, of San Miguel River at Naturita, Colo., for the year ending September SO,,1926
Day
1 .-2. _____ - 3 4... ...... ...... ---.5
6. ...............78. . .... __.... . 9...................10
11 12. ------------- ...13 14 . 15 -
16 .............17 18-. .............19 ................20
21 ... ---.-- 22 23 ..... . 24 ................2ft
26 ..............27 ................28 ................29 30 31
Oct.
205197187187205
326381276232224
23230229227ft246
224224218218224
232240246261240
240240232
218205
Nov.
197197205197180
180180164168173
180164164151138
168164164147147
147147147164132
1111fi9
8663
Feb.
1701802131921E8
158128114143147
9491868675
7075707581
7591816391
787578
Mar.
89100111147124
10294108108125
111138114
' 1^9
16i
180192246187197
173
180
187
168158132120(U
Apr.
114114114114164
252381420351389
400462506506604
788830882
1,060766
9471,5201,270
1,430
1,400
1,3701,370
May
1,4501,4301,4001,4801,440
1,6201,4401,4301,3601,150
1,000920882866893
893958
1,0101,0301,240
1,5801,4801,4001,5401,51Q
1,4501,4301,3001 2401,1801,070
June
1,3101,3701,4001,3801,380
1,6701,5801,5601,5901,570
1,5901,5001,430l,'3fiO1,370
1,3101,3101,1501,000947
947866947974
1,000'
947893814798762
July
904866866851936
947830747688641
595572550 -48*471
471441420389381
3893512922612§2
224224362428283246
Aug.
232218218246218
232276326246192
1681681581?8187
138128125120108
9791918175
707570667066
Sept.
6060555453
5153515047
6699695955
595659<5051
536860-5351
66-1321168081
Monthly discharge of San Miguel River at Naturita, Colo., for the year endingSeptember ,30,,1986
Month
October ____ __ ___ _ .. ... __ - _ -- _ -
December ____ __ _________ _ _ .. ...January _______ ________ __ __ _ .. __ ...February.-.-. ____________________ ... .....
April _ _ __ ..... __ __ . . ... ...
June.. __ _ .- _ ___ __ ... _ . __ .July-.---- -- _
September.. _______________ .. ..........
Discharge in second-feet
Maximum
381 205
213 246" 1,520 1,620 1,670
947 326 132
1,670
Minimum
187 63
63 89
114 866 762 224
66 47
Mean
240 153 80 75
108 145 763
1,260 1,230
528 152 63.9
400
Run-off in acre-feet
14,800 9,100 4,920' 4,610 6, 000. 8,920
45, 400' 77,500 73,200. 32, 500 9,350' 3,800
290,000
NOTE;. Mean discharge for December and January based on temperature record. 90720 30 -4
44 SURFACE WATER SUPPLY, 1926, PART IX
GREEN RIVER BASIN
GREEK RIVER NEAR DANIEL, WTO.
LOCATION Near line between Tps. 32 and 33 N., R. 110 W., at highway bridge 6 miles southeast of Daniel, Sublette County. No large tributary within several miles.
DRAINAGE AREA. 932 square miles (measured on base map of Wyoming).KECORDS AVAILABLE. April 1, 1915, to September 30, 1926. State engineer
maintained station at this point during 1913 and 1914.GAGE. Chain gage on downstream side of bridge; read by Ellis Price.DISCHARGE MEASUREMENTS. Made from 2-span bridge or by wading.CHANNEL AND CONTROL. Bed composed of coarse gravel and small boulders.
Control 100 feet downstream at small rapids; shifting at long intervals. Banks high and not subject to overflow.
EXTREMES OF DISCHARGE. Maximum stage recorded during year, 3.9 feet at 4 p. m. June 9 (discharge, 1,930 second-feet); minimum discharge occurred during winter.
1913-1926: Maximum stage recorded, 7.0 feet at 10 a. m. on June 16, 1918 (discharge, 8,750 second-feet); minimum discharge occurred during winter.
ICE. Stage-discharge relation seriously affected by ice; observations discontinued during winter.
DIVERSIONS. Adjudicated diversions for irrigation of 18,000 acres from Green River above Daniel station.
REGULATION. None, except natural regulation of Green River lakes.ACCURACY. Stage-discharge relation slightly shifting. Rating curve used
October 1 to December 3 and curve used March 28 to September 30 are both well defined. Gage read to hundredths twice daily. Daily discharge as certained by applying mean gage height to rating tables. Records good.
The following discharge measurements were made: May 13, 1926: Gage height, 3.04 feet; discharge, 916 second-feet. July 18, 1926: Gage height, 2.72 feet; discharge, 661 second-feet. September 23, 1926: Gage height, 2.05 feet; discharge, 259 second-feet.
Daily discharge, in second-feet, of Green River near Daniel, Wyo., for the year endingSeptember 30, 1926
Day
i ____ . .........2...................3 _ ................4...................5.. .......... .
6 ._._-7. _____ ..... .....8. __ . _ .......... 9...................JO _ _.
11 ....... - - 12.......... :. . ....13... _ ... ..L. ......14 ____ L . ...16... .................
16 ... J 17 .; IS.......... .....19 .... J , 28.
Oct.
528482498475430
462436404382349
360393436468423
349331322317308
Nov.
322326317322300
289297304308331
345336317304304
29728927426Y254
Dec.
251251251
Mar. Apr.
412417412291282
282282327890
1,100
890990
1,1001,2101,430
1,6701,5501,5501,6701.550
May
1,2101,3201,3201,4301,550
1,4301,3201,100990844
890940890
1,5501,670
710797797890
1,100
June
1,1001,1001,1001,1001,100
1,3201,3201,5501,8001,800
1,6701,5501,5501,4301,320
1,10089075465359fi
July
1,2101,2101,2101,2101,320
1,3201,1001,2101,3201,320
1,2101,100844754710
700680661702797
Aug.
474474501542797
890797754754890
940844797754644
620581565565565
Sept.
528628528514528
528501463439412
391370356332309
304304287278274
GREEN RIVER .BASIN 45-
Daily discharge, in second-feet, of Green River near Daniel, Wyo., for the year ending September 30, 1926 Continued
Day
21...... _ ..........2223.....-... __ ...24........ __ .......26-., .
26. -__-_._ .. 27_. _ ....... _ ....28...................29.. .30-.... ....... .......31- _ ..............
Oct.
297304289278281
285293304281336313
Nov.
241238238244244
244244251251251
Dee. Mar.
549356386401
Apr.
1,4301,210
710386890
890940990
1,1001,100
May
1,1001,3201,2101, 2101,210
1,2101,2101,2101,1001,2101,210
June
542. 514
474445417
434528628940
1,100
July
797710694644557
565542542501480463
Aug.
557521474468480
480463445494535573
Sept.
267249249236256
260253249256296
NOTE. No gage-height record July 16-17; discharge interpolated.
Monthly discharge of Green River near Daniel, Wyo., for the year ending September30, 1926
Month
JuneJuly- . . _ _
Discharge in second-feet
Maximum
528 345
1,670 1,670 1,800 1,320
940 628
Minimum
278 238 282 710 417 463 445 236
Mean
368 285 932
1,160 1,030
874 621 362
Run-off in acre-feet
22,600 17,000 55,500 71,300 61,300 53,700 38,200 21, 500
GREEN RIVER AT GREEN RIVER, WYO.
LOCATION. In sec. 22, T. 18 N., R. 107 W., at Union Pacific Railroad pumping station 100 feet below railroad bridge at Green River, Sweetwater County. No tributary within several miles.
DRAINAGE AREA. 7,670 square miles (measured on base map of Wyoming).RECORDS AVAILABLE. May 2, 1.895, to October 31, 1906; March 1, 1915, to
September 30, 1926. GAGE. Chain gage on left bank at pumping station; read by E. H. Graver. DISCHARGE MEASUREMENTS. Made from 2-span highway bridge.
CHANNEL AND CONTROL. Bed composed of boulders. Control of well-compactedsmall boulders 400 feet downstream. During winter of 1924-25 city placedtwo cribs on control, shortening it considerably.
.EXTREMES OF DISCHARGE. Maximum stage recorded during year, 4.39 feet at 8a. m. July 11 (discharge, 5,550 second-feet); minimum discharge occurredduring winter.
1895-1906; 1915-1926: Maximum stage recorded, 12.3 feet at 5 p. m.June 19, 1918 (discharge, 22,200 second-feet); minimum discharge recorded,160 second-feet November 17, 1898.
ICE. Stage-discharge relation seriously affected by ice. DIVERSIONS. Adjudicated diversions for irrigation of 16,000 acres from Green
River between station near Daniel and Green River station. ^REGULATION. None.
46 SURFACE WATER SUPPLY, 1926, PART IX
ACCURACY. Stage-discharge relation slightly shifting; affected by ice. Rating curve fairly well defined between 400 and 15,030 second-feat. Gage read to quarter-tenths twice daily. Daily discharga ascertained by applying mean gage height to rating tables. Records good except for periods affected by ice, for which they are fair.
The following discharge measurements were made: May 16, 1926: Gage height, 2.84 feet; discharge, 2,020 second-feet. September 29, 1926: Gage height, 1.74 feet; discharge, 5S3 second-feet. Saptembsr 29, 1923: Gag3 height, 1.74 feet; discharge, 592 second-feet.
Daily discharge, in second-feet, of Green River at Green River, Wyo., for the year- ending September SO, 1926
Day
1 ___ ... __ ....... . .....o
3 -4 5 . . . ......
6 ... _ .7__ 8 9 10
11 12. 13.. . 14 15
16 17.. - _ .18 19 20
21... _22 .. ..23 .. 24 25
26 -. ...27 ....... ....28 29 .30.... . .31
Oct.
1,4501,3801,3101,3101,240
1,3101,3101,3101,3801,310
1,3101,3101,6001,5201,380
1,3801,3801,3101,2401,240
1,1801,1201,1201,060i flfift
1 0601,0601,0601,0601,1201,180
Nov.
1,2401,1801,1201,1201,240
1,060900802950
1,120
1,1201,1201.120
950850
755755708660
615660708802802
850950900850802
Mar.
780820880950
1,030
1,0801,0601,000
930890
940920
1,0601,0501,220
1,1101,3101,5201,7601,760
1,9301,4501,7601,9302,110
2,7002,1101,7601,3101,310
Apr.
802755802
1,0601,310
1,3101,4502,3002,5002,910
3,1203,1203,1203,1203,120
2,9102,7003,1203,1202,910
3,1202,»102,7002,7002,300
2,1101,9302, HO2,3002,300
May
2,7002,9103,7703,7703,990
4,2204,7104,4603,9903,770
3,3303,1202,9102,7002,500
1,9301,9302,1102,5002,700
2,9103,5504,4604,4604,460
4 9804,980
4,2203,9903,990
June
3,9903,7703,5503,3303,120
3,1203,1203,3303,5504,220
4,4604,4604,2204,2204,220
3,9903,5503,1202,7002,300
1,9301,7801,6001,4501,310
1,1801,0601 0601,0601,180
July
1,4501,4501,7601,9301,930
2,1102,1102,1102,9104,460
4,9803,9903,5502,9102,700
2,1101,7601,6001,6001,600
1,4501,6801,6001,4501,450
1,3101,3101,1801,1801,1801,180
Aug.
1,060950950950
1,060
1,0601,1801,9301,6001,600
1,6001,7601,7601,6001,600
1,3101,3101,1801,0601,060
1,0601,0801,0001,0601,060
950900950802850850
Sept.
850850900850850
950850850850802
802802755755755
755707707707660
6606156156l&570
570615
615660
NoiE.^Sta^rfliscliflcgefre,l|itiQnaJfect%d<,by,iGe,Mar. 1-11; discharge based on temperature record and comparison witirrecoro's of flow of Big-Itoro-Rfver at Thermopolis.
Monthly discharge of Green River at Green River, Wyo., for the year ending Sep--tember 30, 1926
Month
June.. _ . _____________ ___________ .July..... August _ _____ .. ................ ...............
Discharge in second-feet
Maximum
],600 1,-240 2; 700 %120 4,980 4,460 4i98fl ¥930
960:
Minimum
1,060 615 780 755
1,930 1,060 1,180
802 570
Mean
1,260 911
1,340 2,330 3,560 2,860 2,060 1,200
739
Run-off in acre-feet
77,500 54,200 82,400
139, 000 219, 000 170, 000 127,000 73,800
' 44,000^
GREEN RIVER BASIN 47
GREEN RIVER AT GREEN RIVER, UTAH
LOCATION In NW. Ji SW. % sec. 15, T. 21 S., R. 16 E., at highway bridge 1 mile southeast of Green River, Emery County. San Rafael River enters from right 22 miles downstream.
DRAINAGE ABBA. 40,600 square miles (measured on base maps).RECORDS AVAILABLE. October 21,1894, to October 15, 1899; February 16, 1905,
to December 31, 1911; June 21, 1924, to September 30, 1926. Records obtained at Little Valley, 7Bailes*tl6WE»trea;'m, December 18, 1910, to June 20, 1924, give practically the same flow.
'GAGE. Stevens continuous water-stage recorder on downstream side of bridge pier near right bank, installed September 19, 1924; inspected by H. T. Howland.
DISCHAKGE .MEASUREMENTS. Made from cable at old ferry site, 7 miles below gage.
CHANNEL AND CONTROL. Bed composed of gravel and sand. One channel at all stages. Left bank high and not subject to overflow; right bank lower and may be overflowed at extreme stages. However, water is confined by high way and Denver & Rio Grande Western Railroad bridges. There is a well- defined break in slope three-quarters of a mile downstream.
EXTREMES OP DISCHARGE. Maximum stage during year, 10.67 feet at 10 p. m. May 26; maximum discharge, 24,500 second-feet May 9; minimum stage, 4.84 feet at 1 p. m. December 20 (discharge, 1,140 second-feet).
1894-1899;'lW5iil'926: Maximum*dfedfctomge retft»cted,*68^800'sffcond^f0et May 29, 1897; minimum stage recorded, 0.95 foot on December 1, 1919 (discharge, 510 second-feet).
ICE. Stage-discharge relation affected by ice nearly every winter.DIVERSIONS. Below practically all diversions..REGULATION. Some regulation due to irrigation.ACCURACY. Stage-discharge relation changed several times during the year;
affected by ice December 20-31 and January 4 to February 4. Standard rating curve well defined. Operation of water-stage recorder satisfactory during year except from August 12 to September 4, during which time two daily readings were obtained. Daily discharge ascertained by applying to rating table mean daily gage height; shifting-control method used October 1-5 and May 9 to September 30. Gage heights during ice-affected period were only affected for part of each day; discharge for this period ascertained by computing an effective gage height and applying it to rating curve. Records good.
"COOPERATION. Since December 16, 1917, station has been maintained in cooper ation *with Utah Power & Lig*yp©o.
.Discharge measurements of Green River at Green River, Utah, during the year endingSeptember 30, 1926
Date
Jan. 7 «. _.
Gage height
Feet 6 14
5.955.77
Dis charge
Sec.-ft. 2,8802,8502,5601,850
Date Gage height
Feet 7.639.308.289.03
Dis charge
Sec.-ft. 7,630
17 2009^580
14,100
Date
Ai-icr 11 a
Aug. 26 _Sept. 19
Gage height
Feet 7.936.845.545.13
Dis charge
See.-ft. 9,2805,5802,1901,430
1 Made by engineer of Utah Power & Light Co.
48 SUEFACE WATEE SUPPLY, 1926, PAET IX
Daily discharge, in second-feet, of Green River at Green River, Utah, for the year ending September SO, 1926
Day
I.. _ z.. .........3 4 ... .
8 9.- .....
10. . .-
11 12... -... .13
15
16 17 - 18 19 20
21 22 23 24 25
26 27 28 29 30 31
Oct.
4,0403,8203,6803,5406,280
4,6605,3205,4905,490
6,0206,580'6,2006,2005,490
5,1504,9804,820A fifiA
4,5004,3404,1904,0403,990
3,9003,7603,760
3,6203,620
Nov.
3,6203,6203,6203,6203 £OA
3,7603,7603,7603,6203,620
3,490
3,3603 Qf>A
Q Q/Jft
3,3603,3003,2403,1803,110
2,9302,7302,6802,6202,660
2,7302,6202,600
2,730
Dec.
2,8802,970S lfifi
3,180
3 9fift
3 f\A(\
2,7902,7302,810
2,8102,7702,5402,5202,560
2,520
1,2501,240
1,4201,5801,8302 *>nA
2,200
2,1202,1202,2002,1202,0402,040
Jan.
2 A4O
2,0802,1202 1 9A
2,1202 <>nA
2,120
1,970
1,9701 QHft1 Qftfl
I QAfl
1,970
1,9701,8301,7601,7601,700
1,700
1,8301 onn1,830
1,7601,700
1,7001,7601,700
Feb.
1,7601,7601 8301,9702 000
9 fVtft
2,1202,1502,2002,200
2 0QA
2,280
2 3702 ' QQA
2,480
2,4802,5202,540
2,5409 d.ftf)
2,5202,4202,420
2 onn2,4102,420
Mar.
2,6002 700o OA(\
^ 9so
3,4103 nan
4,4404,2804,130
4,690
5,220
5,4605,910
7,6607,910
8 9HO
8,9408,6308,2007 860
7.3706,890
7,050
5,950
Apr.
4,9804,6604,1904,020
3 7fifi
4,0404,2804,8906,470
8,42011,60010,80010 30010 600
10,40010,1009,900
10, 1001A flflA
13,80014,90015,80017, 300
18,300
16,700
May
17,80018, 50019,30019, 500
91 ^no
23,50024,00023, 500
17,70015, 50010 7Afl
12, 300
10,2009,7109 son
10, 900
12, 50014,80017,100
22,100
23,400
23,00022,900
June
23,70021,70019,60019,0001Q 90fi
18,700
17,00016,500
15, 30014,800
14,600
14,00013,10012,60012,1008,980
8,0709,1608,3307,7007,010
5,9105,5605,1804,890
July
4,6004,2503,9903,870
3,9904,5004,0905,5206,540
9,25016,10013, 60012, 40010,200
8,7207,5806,7005,9505,320
4,7204,1303,7603,5203,390
3,2602,9702,9502,- 8602,7702,790
Aug.
2,7002,5202,4402,4109 dfift
2,4802,6202,7703,1803,520
5,2905,1206,2405,9805,420
4,4104,0704,1303,7303,310
3,0402,8602,6202,4202,390
2,1802,0902,0301,8601,9301,860
Sept.
1,7601,7401,7001,7001 fifiO
1,700l,68fr1,7401,7601, 730
1,7302,2801,820
1,560
1,5401,5101,4401,4101,410
1,4001,4001,3801,3401,310
1,2601,2901,2601,2801,830
Monthly discharge of Green River at Green River, Utah, for the year ending SeptemberSO, 1926
Month
October ________________________ . __
July..
September- __ _ _ ___ ____ ___ _ _ - __
Discharge in second-feet
Maximum
9,990 3,760 3,260 2,200 2,540 8,940
18,300 24,000 23,700 16, 100
6,240 2,280
24,000
Minimum
3,540 2,600 1,240 1,640 1,760 2,500 3,760 9,710 4,890 2,770 1,860 1,260
1,240
Mean
4,850 3,220 2,370 1,900 2,270 5,600
10,300 18,200 13,100 5,770 3,230 1,580
6,050
Run-off in acre-feet
298,000 192, 000 146,000 117,000 126, 000 344,000 613,000
1, 120, 000 780,000 355,000 199,000 94,000
4, 380, 000
NEW FORK WEAR BOULDER, WTO.
LOCATION. About sec. 8, T. 32 N., R. 108 W., at highway bridge 1 mile west of Boulder, Sublette County. Nearest tributary, Boulder Creek, enters one- eighth of a mile below.
DRAINAGE AREA. 578 square miles (measured on base map of Wyoming).RECORDS AVAILABLE. May 11, 1915, to September 30,1926.GAGE. Vertical staff on downstream side of left abutment; read by Martin T.
Brandt.DISCHARGE MEASUREMENTS. Made from 2-span bridge or by wading
GREEN RIVEE BASIN
CHANNEL AND CONTROL. Bed composed of sand and gravel; shifting at long intervals. No well-defined control. At high-water stages there are two overflow channels, one around right end of bridge and other from New Fork to- Boulder Creek.
EXTREMES OF DISCHARGE. Maximum stage recorded during year, 4.5 feet from 8 a. m. June 10 to 8 a. m. June 11 (discharge, 1,450 second-feet); minimum discharge probably occurred during winter.
1915-1926: Maximum stage recorded, 8.7 feet at 6 a. m. June 17, 1918- (discharge, 12,300 second-feet); minimum discharge, 42 second-feet Decem ber 15-17, 1915.
ICE. Stage-discharge relation seriously affected by ice; observations discon tinued.
DIVERSIONS. Adjudicated diversions for irrigation of 13,400 acres from New Fork above station.
RE GUL ATI ON . None.ACCURACY. Stage-discharge relation slightly shifting; affected by ice. Rating
curve used October 1 to December 14 and curve used April 1 to September 30 are both well defined. Gage read to quarter-tenths twice daily. Daily discharge ascertained by applying mean gage height to rating table. Records excellent except for ice-affected periods, for which they are fair.
The following discharge measurements were made: May 13, 1926: Gage height, 3.16 feet; discharge, 570 second-feet. July 18,1926: Gage height, 3.08 feet; discharge, 517 second-feet. September 23, 1926: Gage height, 2.11 feet; discharge, 133 second-feet.
Daily discharge, in second-feet, of New Fork near Boulder, Wyo., for the year ending- September 80, 1926
Day
1 __ ..... __ .............Z.. .................. ..... ..3 _ ......... __ - -_ .4.. ....................... ..5
6 _ . _ ....................7.. ..- . 8.... _ ....................9.. _ ......................10--- . -
11...... _ ..................12...1... _ .................13....... __..._..__..--.-- 14....... _ .................15.. ................... ......
16... .....................17.. __ .....................18.. _ ..... _ ..............19.... _______ ...........20..- .
21.. ....... ... .CJ__. ..........22.. .,._.- ... 23.. __ .... _ ..............24. 25
26... __ . 27....-.... _ . _ . .....28...... 29.. .................... _ ..3031 ....... ....... .
Oct.
376367358349336
326354354349331
314340340331326
318309297288288
280280272265250
250257269284297
284
Nov.
272272276284297
288280275270270
272269265260250
240230230225230
235235230220210
200198191216OQ1
Dec.
195180170160171
171160150145140
148145140140135
Apr.
147116107112103
107190268500558
585525558450378
3513343022983fl9
90S
302310306306
310330338347378
May
406536634707767
827815755755707
662624574510475
470520568646725
8881 0801,140i 9fin1,310
1,3101,2501, 2101,2101,2101,200
June
1,1401,1001,0801,0701,070
1,0801,1501,2501,3501,450
1,4301,3701,3501,3101,200
1,080992908815743
640596541475392
435445465500.480
July
585585558585585
558558612695755
755640640612585
530530530530
530480406406
ooo
430406360338338
Aug.
318298338298
' 279
298298298382382
382406406406382
360360360360338
338338338298279
256238228231OOQ
207
Sept.
190-190204224217
204204197197190
187187184184180
164152147141141
136130130130130
130125125.158217
NOTE. Stage-discharge relation affected by ice Nov. 7-10,14-20,23-26, Dec. 2-4,7-10,12-13,15; discharge based on temperature and gage-height records and on comparison with records of discharge of Pine Creek at Pinedale.
50 SURFACE WATER SUPPLY, 1926, PART IX
Monthly discharge of New Fork near Boulder, Wyo., for the year ending September80, 1926
Month
October _______________________ ___
~D&mSlKt^l5....... ....................................
June.. _____________________________July....... .........................................
Discharge in second-feet
Maximum
376 ... 297
195 «5gsr
1,310 1,450
755 406 224
Minimum
250 191 135 103 406 392 338 207 125
Mean
311 247 157 317, 829 930 537 320 170
Run-off in acre-feet
19,100 14,700 4,670
18, «QO 51,000 55,300 33,000 19,700 10,100
PINE CREEK AT PINEDAIE, WYO.
LOCATION. In sec. 4, T. 33 N., R. 109 W., near highway bridge at Pinedale, Sublette County. No large tributary between station and mouth, 3 miles below.
DRAINAGE AREA. 128 square miles (measured on base map of Wyoming).RECORDS AVAILABLE. May 8, 1915, to September 30, 1926.GAGE. Gurley water-stage recorder installed May 4, 1926, at left bank 30 feet
upstream from highway bridge and referred to staff gage used previously; ins^fe&ttd by J. W. Smith.
DISCHARGE MEASUREMENTS. Made from 2-span bridge or by wading.CHANNEL AND CONTROL. Bed composed of gravel. Control at rapids just
below gage; somewhat shifting at long intervals. Banks subject to over flow at extremely high water.
EXTREMES OP DISCHARGE. Water-stage recorder not operating during period of maximum stage; maximum daily discharge estimated by comparison with record of New Fork near Boulder, 630 second-feet on June 10; mini mum discharge occurred during winter.
1916-1926: Maximum stage recorded, 5.0 feet at 8 a. m. and 5 p. m. June 17, 1918 (discharge, 2,310 second-feet); minimum discharge recorded, 4 second-feet November 14-16, 1921.
ICE. Stage-discharge relation somewhat affected by ice; observations discon tinued during winter.
DIVERSIONS. Adjudicated diversions for irrigation of 5,100 acres from Pine Creek above Pinedale and 280 acres below.
REGULATION. Flow naturally regulated by Fremont Lake, which has an area of iSttyfttmis^iaSfe inil^a&M^HMifs' 110^fttaSife inMfe
ACCURACY. Stage-discharge relation practically permanent; affected by ice during winter. Rating curve well denned. Gage read to hundredths twice daily October 1 to May 3, after which date operation of water-stage recorder was fairly satisfactory, except for periods as explained in footnote to daily-discharge table. Daily discharge ascertained by applying mean gage height to rating table. Records good except for periods of missing gage heights and when affected by ice, for which they are fair.
The following discharge measurements were made: May 12, 1926: Gage height, 2.25 feet; discharge, 217 second-feet. July 17, 1926; Gage height, 2.07 feet; discharge, 162 second-feet. September 22, 1926: Gage height, 1.32 feet; discharge, 35.9 second-feet.
GREEN RIVER BASIN 51
Daily discharge, in second-feet, of Pine Creek at Pinedale, Wyo,,for the year ending"September SO, 1926
Day
I..... __ . _____ . ......2.... . _ ... __ ........ .3-- . - . .-.4.... _________ .. ......5.... _ . _ .. ___ . ___ ..
6 ... _____ . _____ ...7 . _ ........8..._- . _ .._--._.-.__9... -.- .-. .. ..10---
11.. _ .. _____ ... ___ ..12-......-.,..-.. . ...13--... . 14.....---. ___ . _ ... _ .15 . .
16.. 17-.- 18..... ......... ..........19---- 20-.-
21-. 22...-. .23 24-- 25--
26 27 28-- 29- - 30 31...
Oct.
1191 14
112108106
1121041039997
97Q7
979797
Q9on878482
807777
74
7371
76777474
Nov.
7171707070
7070707274
78828787
' 84
827777
67
6665676866
6663636060
Dec.
606060<tf>40
4244464949
4646454240
Apr.
2218181618
2327393423
2222211817
1819202430
3439
4641
3339444952
May
6684101lit139
165184224254245
220212208197188
188200212208250
300359
492
508
522530535
June
510APtft
480470465
485530590620625
617
593569538
4.Q9
429383377
318281236208185
162
178167162
July
178-\QA
191200197
191181184200224
220212194181172
16916015414.Q
143
135131125118137
135
143137131127
Aug.
123127129133137
136135145156165
165167162167178
167162154
141
141143139131131
11510085847976
Sept.
7371747676-
7473717167
6360605753
4944424038
3536343230
3028272529
NOTE. Stage-discharge relation aflected by ice Nov. 3-12,21-23, Dec. 4-8,11,14-15; no gage-height record Apr. 1-3, May 20-21, 30-31, June 1-10, 25, Aug. 26-27; discharge based on comparison with records of flow of New Fork near Boulder.
Monthly discharge of Pine Creek at Pinedale, Wyo., for the year ending September30, 1926
Month
July . -- ........
Discharge in second-feet
Maximum
119 87
60 52
535 625 224 178 76
Minimum
73 60 40 16 66
162 118 76 25
Mean
91.1 71.5 47.9 29
283 410 166 136 51.3
Run-off in acre-feet
5,600 4, '250 1,430 1,730
17,400 24,400 10,200 8,360 3,050
HAMS FORK AT DIAMONDVII1E, WYO.
LOCATION. In SW. % sec. 24, T. 21 N., R. 116 W., at highway bridge at Diamond- ville, Lincoln County. No large tributary within many miles.
DKAINAGB AKEA. 386 square miles (measured on base map of Wyoming).RECOKDS AVAILABLE. October 1, 1918, to September 30, 1926.
1 GAGE. Vertical staff attached to downstream side of bridge; read by T. L. Stewart.
DISCHARGE MEASTJBEMENTS. Made from 2-span bridge or by*wading.
SUKFACE WATEE SUPPLY, 1926, PAKT IX
CHANNEL AND CONTROL, Bed composed of small boulders and well-compacted gravel. Control 200 feet downstream at small rapids, which shifts at long intervals. Banks not subject to overflow.
EXTREMES OF DISCHARGE. Maximum stage recorded during year, 2.86 feet at 5 p. m. April 21 and May 6 (discharge, 522 second-feet); minimum stage recorded, 1.21 feet at 8 a. m. August 31 (discharge, 2 second-feet).
1918-1926: Maximum stage recorded, 4.55 feet at 8 a. m. May 11, 1923 (discharge, 3,250 second-feet); minimum discharge, river dry August 29-31, 1919.
ICE. Stage-discharge relation seriously affected by ice; observations discontinued during winter.
DIVERSIONS. Adjudicated diversions from Hams Fork and tributaries for irriga tion of 7,620 acres above station and 8,090 acres below.
REGULATION. Diurnal fluctuation during spring caused by alternate melting and freezing of mountain snow. No artificial regulation.
ACCURACY. Stage-discharge relation practically permanent. Rating curve well defined. Gage read'to quarter-tenths twice daily. Daily discharge ascer tained by applying mean gage height to rating table. Records excellent except for period of missing gage heights, for which they are fair.
The following discharge measurements were made: May 15, 1926: Gage height, 2.32 feet; discharge, 203 second-feet. July 16, 1926: Gage height, 1.63 feet; discharge, 28.5 second-feet. September 24, 1926: Gage height, 1.34 feet (datum of gage raised 0.49 foot;
gage height referred to new datum, 0.85 foot); discharge, 6.4 second-feet.
Daily discharge, in second-feet, of Hams Fork at Diamondville, Wyo., for the yearending September 30, 1926
Day
1. ...... __ ________ ..2..... .............. __ ....3...... - ..4..........................5. .
6.. .........................7. ...... __ ................8... - .- _ ....9............ ... . ..
10.. ............. .............
11.... _ ....................12...........................13. ............... _ ........14..........................15........... .............
16. ..........................7... _ - .18...........................19............ ......... ...20 . .. . ..,
21...... _ _ 22 . . . _..___23....... ................24... . _25 ..--.._ ._ _
26........ _ ................27... _ -_. ___._...28..... . _ ..29............ ............30..,. . __ ....31.. ..... ..............
Oct.
37 36 3r 33 37
40 43 45 47 42
42 47 £050 50
45 42 42 41 42
40 40 40 37 37
37 35 37 40 40 42
Nov.
40 37 40 40 16
5 25 26 24 27
26 35
Mar.
50
I 60
1 90
146
142 146 131 131 120
124 135 165 198 234
188 151 109 106 67 81
Apr.
113 60 53 54 67
116 300 306 425 450
438 438 438 382 370
388 419 382 425 382
489 476 419 376 382
358 346 370 370 395
May
425 425 425 407 401
495 489 438 407 364
358 306 272 224 213
218 229 244 239 300
300 306 300 294 283
266 272 218 174 160 128
June
124 113 103 113 109
131 101 95 95 89
81 63 65 £5 54
50 47 45 41 31
35 27 26 20 16
10 11 11 10 8
July
10 8 9
10 11
14 19 23 29 35
47 48 46 48 42
29 30 33 33 32
21 17 16 14 19
15 7
11 12 17 17
Aug.
19 12 17 18 18
If 15 23 19 19
25 24 19 20 16
14 11 8 6 4
4 4 4 4 3
4 4 5 4 4 2
Sept.
4 5
11 10 11
10 11 13 13 13
12 12 13 12 12
11 12 12 10 8
7 8 8 6 6
6 9 8 7
11
NOTE. No gage-height record Mar. 1-14; discharge based on temperature record and comparison with records of flow of Bear River near Evanston. Braced figures give mean discharge for period indicated.
GEEEN RIVER BASIN 53
Monthly discharge of Hams Fork at Diamondville, Wyo., for the year, ending Septem*ber 80, 1926 ;
Month
October. _ ___ .. ____ . ____________ .November 1-12 ___ .. __________________
July. .......... ........................ ..................August. .. _______________________ ........
Discharge in second-feet
Maximum
60 40
234 489 495 131 48 25 13
Minimum
335
53128
8 7 2 4
Mean
,41.0 28.4
10ft 333 309 59.3 23.3 11.7 9.7
Run-oft in acre-feet
2,520 676
6,520 19,800 19,000 3,530 1,430
719 577
IITTLE SNAKE RIVER NEAR LILY, COLO.
LOCATION. In sec. 20, T. 7 N., R. 98 W., at highway bridge near mouth of canyon 6 miles above Lily, Moffat County. No tributary between station and mouth of river at Lily.
DRAINAGE AREA. 3,730 square miles (measured on base maps of Colorado and Wyoming).
HECORDS AVAILABLE. June 9 to August 14, 1904; May 1, 1922, to September 30, 1926.
GAGE. Stevens water-stage recorder; inspected by Baxter L. Waddell. Datum raised 0.48 foot October 1, 1925.
DISCHARGE MEASUREMENTS. Made from bridge or by wading.CHANNEL AND CONTROL. Fairly permanent.EXTREMES OP DISCHARGE. Maximum stage during year, from 'water-stage
recorder, 10.5 feet at 1 p. m. May 27 (discharge, 14,200 second-feet); mini mum stage 0.36 foot August 31 and September 3-4 (discharge, 12 second- feet).
: 1904; 1922-1926: Maximum stage in 1926; minimum discharge, river dry August 7 to September 11, 1924.
DIVERSIONS. Adjudicated diversions for irrigation of 28,700 acres from Little Snake River and tributaries above station.
RE GUL ATION . None.COOPERATION. Complete records furnished by State engineer.
Daily discharge, in second-feet, of Little Snake River near Lily, Colo., for the yearending September 80, 1926
Day
1.. ... _ . . 2 ____ . __________ . ...........3.... .............................A..... ......^.. ......................5. _ .... ______________ . .....6 ___ ... . _______________ ..7 . . . .8....................................9.. -. .-..-...._.- -.-_..__
10.. --__.._.__--.._-...._.__.11-.. ..............................12....................................13.......... _ .......................14... . ...........................15 ........ .........................16......... _ ........................17... ............................18. _ .. _._._.__ ._ 19..._..._.._. ___._.. ...........20.. ...............................
Oct.
2325263091
2101,210
700450398418450670418378378378378378378
Mar. Apr.
820820790730
1,5301,6201,2902,6102,7301,5301,4501,4501,3701,3701,2901,3701,5301,8202,0802.430
May
3,3403,4703,8604,0004,2804,4904,5603,8604,2103,3402,7302,4302,2001,9201,7201,6201,7201,9202,3702.730
June
4,4204,5604,4204,2104,0003,2102,1402,2001,9801,8701,6701,5301,4501,3701,2501,3301,1301,050
970890
July.
263216270350330310370290450520,3102341911671561361261048771
Aug.
3330221818162416202044646971503730252820
Sept.
161312121828336269
350136160116
717482
1321606974
54 SURFACE WATEE SUPPLY, 1926, PAET IX
Daily discharge, in second-feet, of Little Snake River near Lily, Colo., for the year ending September 30, 1926 Continued
Day
21...................................22.....23.. .............. ...24........................... ... ...25- .26-27............28...................................29... .................................30........... ..31-... .......................... ...
Oct.
398418398398378430450
418430430
Mar.
1,1301,1001,060
990885820820820790
Apr.
2,4902,6103,7304,5603,2102,7903,0903,2803,3403,380
May
2,8503,4703,6603..6603,8604,0703,8608, 9505,3305,6704,350
June
910730700645595545520495382278
July
6452494441303029243030
Aug.
1828161313151316151512
Sept.
788269748996
126156178270
NOTE. No gage-height record June 18-21; discharge interpolated.
Monthly discharge of Little Snake River near Lily, Colo., for the year ending Sep tember 30, 1926
Month
March 23-31.---. __ .... _ .... .........
June.. _ ... _ . .- ------July........ ....................... ......................
September..- ___________________ . ..........
Discharge in second-feet
Maximum
1,210 1,130 4,560 8,950 4,560
520 71
350
Minimum
23 790 730
1,620 278
24 12 12
Mean
385 935
2,100 3,560 1,720
173 26.7 96.8
Run-off in acre-feet
23,700 16, 700
125, 000- 219,000 102, 000'
10, 600' 1,640- 5, 760-
ASHIEY CREEK NEAR VERNAL, UTAH
LOCATION. In sec.l, T. 3 S., R. 20 E., three-quarters of a mile above heading of power canal of Utah Power & Light Co. and 12 miles northwest of Vernal,. Uintah County. Dry Fork enters from right 4 miles downstream.
DEAINAGE AREA. 101 square miles (measured on topographic maps).RECORDS AVAILABLE. June 6, 1914, to September 30, 1926. From October 8,.
1911, to June 5, 1914, fragmentary records obtained at power plant. Rec ords also available for a point below Dry Fork from March 15, 1900, to- December 31, 1904.
GAGE. Stevens continuous water-stage recorder on left bank three-quarters; of a mile above heading of power canal; inspected by Lee Hall and Kenneth- Richardson.
DISCHARGE MEASUREMENTS. Made from cable or by wading near gage.CHANNEL AND CONTROL. Bed steep and rough, composed of gravel and cobbles,,
subject to change during high water. No well-defined control.EXTREMES OP DISCHARGE. Maximum stage during year, 7.90 feet at 9 p. mv
May 20 (discharge, 729 second-feet); minimum stage, 5.85 feet March 23 (discharge, 29 second-feet).
1911-1925: Maximum discharge, 2,050 second-feet at 9 p. m. May 29, 1921; minimum discharge, 26 second-feet February 7, 1920.
ICE. None.DIVERSIONS. None above station.REGULATION. None.ACCURACY. Stage-discharge relation remained permanent following a slight
shift on October 6. Rating curves well defined. Water-stage recorder operated satisfactorily except as stated in footnote to daily-discharge table.. Daily discharge ascertained by applying to rating table mean daily gage height*determined fromrecorder graph or weekly gage readings. Records for estimated periods fair; others good.
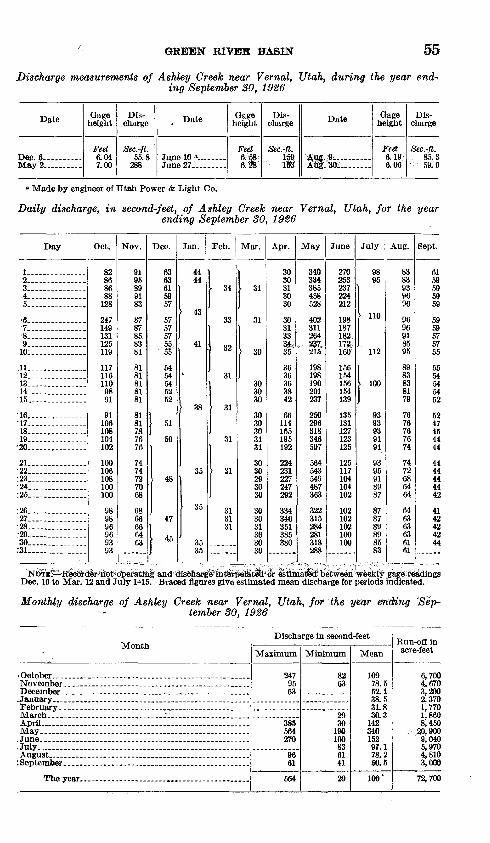
GREEN RTSrUR BASIN
Discharge measurements of Ashley Creek near Vernal, Utah, during the year end ing September 30, 1926
Date
Dec. 6_._.__.
Gage height
Feet 6.047.00
Dis charge
Sec.-ft. 65.8
288
Date
JllTIA 10 0
Gage height
Feet 6.586/28'
Dis charge
Sec.-ft.
ife
Date
Aug.9 AufrM:- -
Gage height
Feet 6.196.06
Dis charge
Sec.-ft. 85. 359.6
0 Made by engineer of Utah Power & Light Co.
Daily discharge, in second-feet, of Ashley Creek near Vernal, Utah, for the yearending September 30, 1926
Day
1 ... .... .... .12.. ... .......3.45. ...........
'6'7 8910 .
11 . ...121314...-.-...-...-.15. ...........
16..- ..."17
18 ..........19 20.--
-21 . . 22. 23"24. .........:25 . . ........ ..
:26. ___ .......-27 28 .....:29. ...........30 ....:31 - __ ......
Oct.
82868688128
247149131125119
1171161109891
91106108104102
100106108100100
989896969393
Nov.
9195S991S3
8787858381
8181818181
8181787676
7474727068
6866666463
Dec.
6363615957
575757
: 55*
5454545252
I «1
50
48
47
Jan.
4444
43
41
\
38
35
35
3535
Feb.
34
33
32
31
31
31
31
313131
Mar.
f 31
31
30
303030
3030303131
3030293030
303031303030
Apr.
3030313030
30313334;s(S'
3636363842
66114165195192
224231227247292
334346351385380
May
340334385458528
402311264237
' 215
198198190201237
250296318346507
564543549487363
322315284281318288
June
270253237224212
19818718217&160
156154156154139
135131127123125
125117104104102
102102102100100
July
9895
110
112
100
9393939191
9395918987
8787898985S3
Aug.
8383939696
9696918595
8983838179
7676767674
7472686464
646363636161
Sept
6159595959
5959575755
5554545452
5247454444
4444444442
4142424244
'ot estfinatid1 between weekly gagetreadings Dec. 16 to Mar. 12 and July 1-»15. Braced figures give estimated mean discharge for periods indicated.
.Monthly discharge of Ashley Creek near Vernal, Utah, for the year ending 'Sep tember 30, 1926
Month
December
February _______ _____ , _________ __March . _. " . .AprilMay..
.July.-......-.....-.-.-. .-.............-...-...........August
Discharge in second-feet
Maximum
247 95 63
3SS 564 270
96 61
564
Minimum
82 63
29 30
190 100 83 61 41
29
Mean
109 78.5 52.1 38.5 31.8 30.3
142 340 152 97.1 78.2 50.5
100'
Run-off in acre-feet
6,700 4,670 3,200 2,370 1,770 1,860 8,450
20,900 9,040 5,970 4,810 3,000
72,700
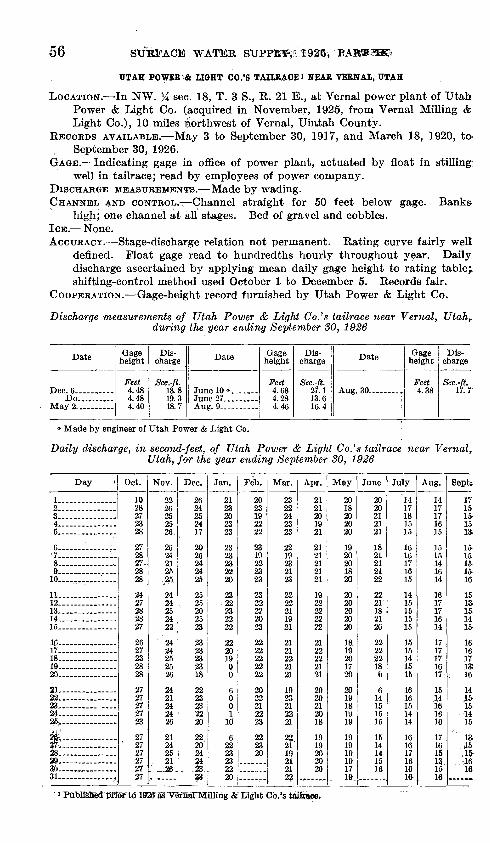
SUTRFACE WATEK
UTAH POWER & LIGHT CO.'S TAILRACEi NEAR VERNAL, UTAH
LOCATION. In NW. }i sec. 18, T. 3 S., R. 21 E., at Vernal power plant of Utah Power & Light Co. (acquired in November, 1925, from Vernal Milling & Light Co.), 10 miles northwest of Vernal, Uiatah County.
RECORDS AVAILABLE. May 3 to September 30, 1917, and March 18, 1920, to- September 30, 1926.
GAGE. Indicating gage in office of power plant, actuated by float in stilling: well in tailraee; read by employees of power company.
DISCHARGE MEASUREMENTS. Made by wading.CHANNEL AND CONTROL. Channel straight for 50 feet below gage. Banks-
high; one channel at all stages. Bed of gravel and cobbles.ICE. None.ACCURACY. Stage-discharge relation not permanent. Rating curve fairly well
defined. Float gage read to hundredths hourly throughout year. Daily discharge ascertained by applying mean daily gage height to rating table;, shifting-control method used October 1 to December 5. Records fair.
COOPERATION. Gage-height record furnished by Utah Power & Light Co.
Discharge measurements of Utah Power & Light Co.'s tailraee near Vernal, Utah^ during the year ending September 30, 1926
Date
Dee. 6 _____Do.
Gage height
Feet 4.484.484.40
Dis charge
Sec.-ft. 18.819.318.7
Date
Aug. 9 ..........
Gage height
Feet 4.684.284.46
Dis charge
Sec.-ft. 27.113.616.4
Date
Aug. 30 _____
Gage height
Feet 4.38
Dis charge
Sec.-ft. 17. T
* Made by engineer of Utah Power & Light Co.
Daily discharge, in second-feet, of Utah Power & Light Co.'s tailraee near Vernal, Utah, for the year ending September 80, 1926
Day i
1 2.. ........... ..3 ... 4 ... 5.- .........
6 ...
8 9. ___ 10
11 - 12. _____ . __13 14
16 17. . _ 18 -19 .20- _ -
21 22 23 ....24 25*- _
2»28:, 29 36... ., ..., 31 4
Oct.
1028272328
2728272828
2427282827
2627232828
2727272723
27' 27
2727279727
Nov.
99
26
2526
2624212525
2424OK
99
2424OH
oc
2491
24
26
91
24252126
-
Dec.
2624
2417
2026
2425
25202523
23oqrto
oq
18
22oqoq
2220
22202424
_ .23.23
Jan.
21232023oq
2323OQ
2220OQ
.2200
2299
22201900
600
10
699
23232220
Feb.
2023192222
2319222323
23222220oq
22
99
2222
20999199
23
99
2320
Mar.
2322242393
2219232123
222291
1991
2191oo9191
19oq
91
2221nn
19
2122
Apr.
2121201991
2121
2121
102299
2222
2199
91 Ji
202091
2018
1919202020
May
2018202020
1920201820
2020202020
181Q
201720
20191ft
1919
191919191710
June
2020212121
18
212122
2221ia2120
229999
180
1415
15
1514141516
-
July'14
17181515
1616171615
1415151515
15
141515
16161 ^
1414
1616171616Ifr
Aug.
1417171615
1515141614
1617171614
1717171617
1514161616
171615IQ
1516
Sept*.
1515-1513-
15-151&1£16
15iai&1415-
16161713:
. 16
1416-15-1415
iaJS
.15-1616
i Published prior to 1926" as TefnaOIilling &"LIgMCb.*
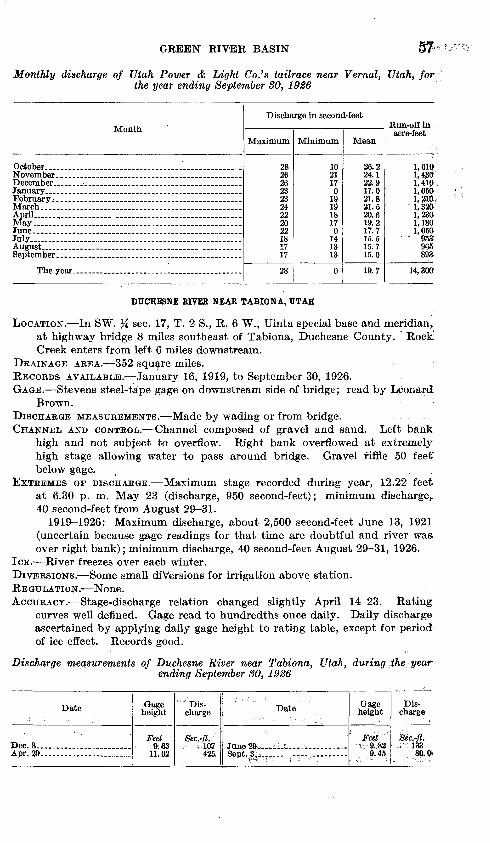
GEEEN RIVER BASIN
Monthly discharge of Utah Power & Light Co.'s tailrace near Vernal, Utah, for the year ending September 30,
Month
October _____________________ ____ ..
December ____ _____ . _______________January ___________________________
April ___ . ______ _________ .............
June _____________________________July....................... ...............................
Discharge in second-feet
Maximum
28 26 26 23 23 24 22 20 22 18 17 17
28
Minimum
10 21 17 0
19 19 18 17 0
14 13 13
0
Mean
26.2 24.1 22.9 17.0 21.8 21.5 20.6 19.2 17.7 15.5 15.7 15.0
19.7
Run-off Inacre-feet
1,610 1,430 1, 410 1,050 1,210 1, 320 1,230 1,180 1,050
953 965 89S
14,300
DTTCHESNE RIVER NEAR TABIONA, UTAH
LOCATION. In SW. % sec. 17, T. 2 S., R. 6 W., Uinta special base and meridian,,at highway bridge 8 miles southeast of Tabiona, Duchesne County. RockCreek enters from left 6 miles downstream.
DRAINAGE AREA. 352 square miles.RECORDS AVAILABLE. January 16, 1919, to September 30, 1926. GAGE. Stevens steel-tape gage on downstream side of bridge; read by Leonard
Brown. : DISCHARGE MEASUREMENTS. Made by wading or from bridge. ... CHANNEL AND CONTROL. Channel composed of gravel and sand. Left bank
high and not subject to overflow. Right bank overflowed at extremelyhigh stage allowing water to pass around bridge. Gravel riffle 50 feet"below gage,
EXTREMES OF DISCHARGE. Maximum stage recorded during year, 12.22 feetat 6.30 p. m. May 23 (discharge, 950 second-feet); minimum discharge,.40 second-feet from August 29-31.
1919-1926: Maximum discharge, about 2,500 second-feet June 13, 1921(uncertain because gage readings for that time are doubtful and river wasover right bank); minimum discharge, 40 second-feet August 29-31, 1926.
ICE. River freezes over each winter.DIVERSIONS. Some small diversions for irrigation above station. REGULATION. None. ACCURACY. Stage-discharge relation changed slightly April 14-23. Ratings
curves well defined. Gage read to hundredths once daily. Daily dischargeascertained by applying daily gage height to rating table, except for period1of ice effect. Records good.
Discharge measurements of Duchesne River near Tabiona, Utah,ending September 30, 1926
Date
Dec. 8 ____________ ._ Apr. 39.......................
Gage height
Feet 9. 63
11.02
Dis charge
Sec.-ft. ,<107
425,
Date
Sept. 3,^...... .... .%?" 1 :! '- ;:- - . - , ,
Gage height
Feet": 9.82
9.45
Dis charge
'Sec.-ft. ; ;i33
80. Q>
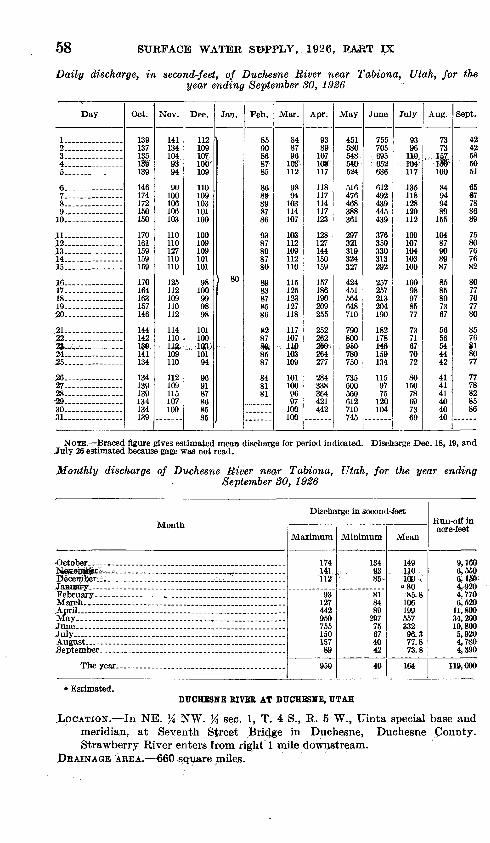
.58 SURFACE WATER SWPLY, 1926, BART
Daily discharge, in second-feet, of Duchesne River near Tabiona, Utah, for the year ending September 30, 1926
Day
1 . 2 3 4 &...... ... ...
«_ 7 8.-.-...--. __ .9 10.
11 ... .... .12... ............10
14 15
16 - 17
19 20
21 22 - 2&. ........
25
26 9728 29 3d31
Oct.
139137
139139
146174172150150
170161159159159
170164163157146
144142139
134
13410Q
139
134139
Nov.
1411341O49394
90100106106103
110110127110110
125112109110112
114110
.-: UA109110
112109115107
Dec.
112109107100*
109
110109103101100
100109
101101
OS100QQ9898
101100
, !Q3a101Od
9691
868585
Jan.
80
Feb.
8590868785
89898786
QO
80
Q7
8586
82Q7
m07840181
Mar.
848796103112
9894103114107
103112109112110
115125123127118
1171071U)103109
101100
Q7100100
Apr.
938910710»117
118117114117123
128127144150159
157186190209255
252262360
277
284338
442
May
451580548sm524
516476468388361
297321319324327
424451564648710
790
910780750
600560
710745
June
755705695652636
612492439445439
350
313292
257257
204190
182178Mft1 f*Q
115Q7
75120
July
9396
110,let?117
135118128120112
109107104103100
10098Q78577
73
677072
80
78697169
Aug.
7373<*->w.-im100
84949489155
10487Oft8987
8585807367
56
54
42
414141404040
Sept.
4242585051
6567788689
7580767682
SO777677SO
8576il8077
7778828586
NOTE. Braced figure gives estimated mean discharge for period indicated. Discharge Dec. 18, 19, and July 26 estimated because gage was not read.
Monthly discharge of Duchesne River near Tabiona, Utah, for the year endingSeptember SO, 1926
Month
Ne»B««^rif,- - ___ . _ . _ .BlcemSer... _ .... _____ ......... .......... ..
July
Discharge in second-feet
Maximum
174 141 112
93 127 442 950 755 150 157 89
950
Minimum
134 9385-
81 84 89
297 75 67 40 42
40
Mean
149 J.10 .. 1QB -80
'85.8 106 199 557 332 96.3 77.8 73.8
164
Run-off in acre-feet
9,160
41-920 4,770 6,520
11,800 34,200 19,800 5,920 4,780 4,390
11«,000
' Estimated.DUCHESNE RIVES AT DTJCHESNE, UTAH
'LOCATION. In NE. % NW. % sec. 1, T. 4 S., R. 5 W., Uinta special base and meridian, at Seventh Street Bridge in Duchesne, Duchesne County. Strawberry River enters from right 1 mile downstream.
DKAINAGE AREA. 660 square miles.
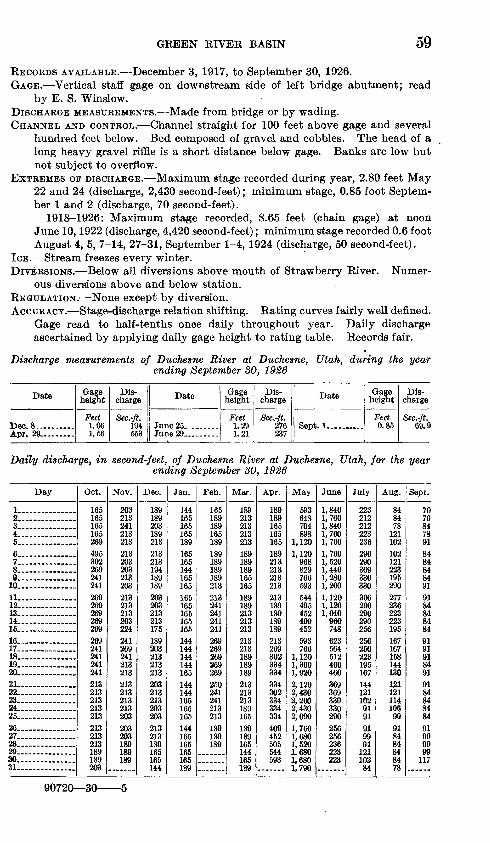
GREEN RIVER BASIN 59
RECORDS AVAILABLE. December 3, 1917, to September 30, 1926.GAGE. Vertical staff gage on downstream side of left bridge abutment; read
by E. S. Winslow.DISCHARGE MEASUREMENTS. Made from bridge or by wading.CHANNEL AND CONTROL. Channel straight for 100 feet above gage and several
hundred feet below. Bed composed of gravel and cobbles. The head of a long heavy gravel riffle is a short distance below gage. Banks are low but not subject to overflow.
EXTREMES OF DISCHARGE. Maximum stage recorded during year, 2.80 feet May 22 and 24 (discharge, 2,430 second-feet); minimum stage, 0.85 foot Septem ber 1 and 2 (discharge, 70 second-feet).
1918-1926: Maximum stage recorded, 8.65 feet (chain gage) at noon June 10,1922 (discharge, 4,420 second-feet); minimum stage recorded 0.6 foot August 4, 5, 7-14, 27-31, September 1-4, 1924 (discharge, 50 second-feet).
ICE. Stream freezes every winter.DIVERSIONS. Below all diversions above mouth of Strawberry River. Numer
ous diversions above and below station.REGULATION. None except by diversion.ACCURACY. Stage-discharge relation shifting. Rating curves fairly well defined.
Gage read to half-tenths once daily throughout year. Daily discharge ascertained by applying daily gage height to rating table. Records fair.
Discharge measurements of Duchesne River at Duchesne, Utah, during the year ending September SO, 1926
Date
Dec. 8 .
Gage height
Feet 1.061.56
Dis charge
Sec.-ft. 194553
Date Gage height
Feet 1.291 91
Dis charge
Sec.-ft. 276237
Date Gage height
Feet 0.85
Dis charge
Sec.-ft. 69.9
Daily discharge, in second-feet, of Duchesne River at Duchesne, Utah, for the year ending September 80, 1926
Day
1 _ . ____ 2...... .........3 -4.. . .........5... _ - _ .....
6.. ..........7.. _______8... .........9. . ____ 10 11-. __ .....12... .........13 14 _______ . ...15 _ . _ .... ....16 __ . ....1718. ..1920 21 ...............2223..... .....24 25 26 27.. ___ ... .... .2829. . __ . .... ,30 ..31 .
Oct.
165165165165269495802269241241269269269269269269241241241241213213213213213213213213189189203
Nov.
203213241213213213203203218203213213213203224241269241213213213213213213203203203189IRQ189
Dec.
189189203189213213213194189189203203213213175189203213213213203213213203203213213189165165144
Jan.
144165165165189165165144165165
165165
165
144IAA
144165144
165165165144165165165165IQQ
Feb.
165189189165189189189189
213213241241241241269269269269269OKft
241241213213189189189
Mar.
189213213213213189189189
165189IQQ
213213213
213IQQ
189189
213213189165189189165144165IQQ
Apr.
189189165165165189213213213213213189189189189213269302334334334302334334334409452505544593
May
593648704898
1,1201,120968829766593544495452409452593766
1,1201,3601,9302,1202,4302,2602,4302,0901,7601,6801,5201,6801,6801 7Qft
June
1,8401,7601,8401,7601,7601,7601,5201,4401,2801,2001,1201,1201,040960748623564512460460369369330330290256256236223223
July
223212212223236290290369330330306290290290256256256223195167
121102019191990112110284
Aug.
848478
1211021021212231952902772362232231951671«715814413012112111410699918484848478
Sept.
7070847891848484849191fid848434Q191Q18491918484848491999999117
90720 3C
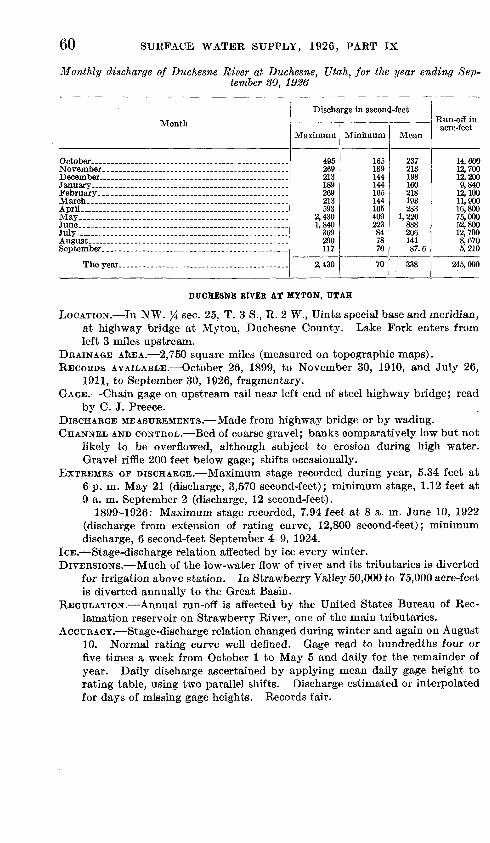
60 SURFACE WATER SUPPLY, 1926, PART IX
Monthly discharge of Duchesne River at Duchesne, Utah, for the year ending September 80, 1926
Month
July .. . . .- . . ...---- -
Discharge in secontj-feet
Maximum
495 269 213 189 269 213 593
2,430 1,840
369 290 117
2,430
Minimum
165 189 144 144 165 144 165 409 223
84 78 70
70
Mean
237 213 198 160 218 193 283
1,220 888 206 141 87.6
338
Run-off inacre-feet
14,600 12,700 12,200 9,840
12,100 11,900 16,800 75,000 52,800 12,700 8,670 5,210
245,000
DUCHESNE RIVER AT MYTON, UTAH
LOCATION. In NW. % sec. 25, T. 3 S., R. 2 W., Uinta special base and meridian, at highway bridge at Myton, Duchesne County. Lake Fork enters from left 3 miles upstream.
DRAINAGE AREA. 2,750 square miles (measured on topographic maps).RECORDS AVAILABLE. October 26, 1899, to November 30, 1910, and July 26,
1911, to September 30, 1926, fragmentary.GAGE. Chain gage on upstream rail near left end of steel highway bridge; read
by C. J. Preece.DISCHARGE MEASUREMENTS. Made from highway bridge or by wading.CHANNEL AND CONTROL. Bed of coarse gravel; banks comparatively low but not
likely to be overflowed, although subject to erosion during high water. Gravel riffle 200 feet below gage; shifts occasionally.
EXTREMES OF DISCHARGE. Maximum stage recorded during year, 5.34 feet at 6 p. m. May 21 (discharge, 3,570 second-feet); minimum stage, 1.12 feet at 9 a. m. September 2 (discharge, 12 second-feet).
1899-1926: Maximum stage recorded, 7.94 feet at 8 a. m. June 10, 1922 (discharge from extension of rating curve, 12,800 second-feet); minimum discharge, 6 second-feet September 4-9, 1924.
ICE. Stage-discharge relation affected by ice every winter.DIVERSIONS. Much of the low-water flow of river and its tributaries is diverted
for irrigation above station. In Strawberry Valley 50,000 to 75,000 acre-feet is diverted annually to the Great Basin.
REGULATION. Annual run-off is affected by the United States Bureau of Rec lamation reservoir on Strawberry River, one of the main tributaries.
ACCURACY. Stage-discharge relation changed during winter arid again on August 10. Normal rating curve well defined. Gage read to hundredths four or five times a week from October 1 to May 5 and daily for the remainder of year. Daily discharge ascertained by applying mean daily gage height to rating table, using two parallel shifts. Discharge estimated or interpolated for days of missing gage heights. Records fair.
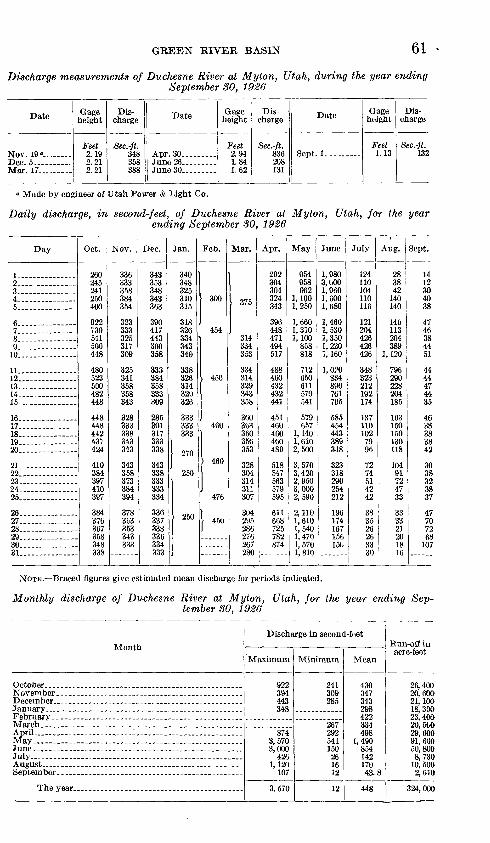
GREEN RIVER BASIN 61
Discharge measurements of Duchesne River at Myton, Utah, during the year endingSeptember 30, 1926
Date
Nov. 19«.
Gage height
Feet 2.192.21
Dis charge
Sec.-ft. 348358388
Date
Apr. 30 .........June 26 _____
Gage height
Feet 2.941.84
Dis charge
Sec.-ft. 836208131
Date
Sept. 1. .-...-. .
Gage height
Feet 1.13
Dis charge
Sec.-ft. 132
Made by engineer of Utah Power & Light Co.
Daily discharge, in second-feet, of Duchesne River at Myton, Utah, for the year ending September 30, 1926
Day
2.... 3. -
5
6 7 8..... .9.... ..... - .10
11 12..-.-.-- _ .--.13 14 15...
16 17 18 19 20 -
21.. . _ .22 23 -24 25
26 27 . 28 29 30 31
Oct.
260245241250400
922730541500448
480523500482448
448448442437424
410384397410397
384
367358348338
Nov.
336333358384354
323333325317309
325341358358343
328333338343343
343358373384394
378363353343333
Dec.
343353348343363
390417443300358
333384358333309
285301317333338
343338333333334
336337338336334333
Jan.
340348325310315
318326334343340
338326314320326
333333333
1 270
250
Feb.
> 300
454
1 450
460
460
476
\ 450
Mar.
O/O
314334353
334314329343358
360363360356353
328304314311307
304295286276267280
Apr.
292304304324343
396448471494517
488460432432441
451460460460489
518547563579595
611668725782874
May
954958962
1,1001,250
1,6601,3101,100858818
712650611579541
579657
1,1401,6102,500
3, 5703,4202,9503,0002,590
2,1101,6101,5401,4701,5701,810
June
1,9803,0001,9601,6001,680
1,4601,5301,3501,2201,160
1,0?0834890761705
585454443389348
323318290254212
196174167
July
124110104110116
121204426426426
348323212192174
1371101027996
7274514242
38352626333fl
Aug.
283842140140
140113204389
3,120
796290228204185
163150150130118
10491724733
3333212018
Sept.
1412304038
4746384451
4444474435
4638383842
3038323837
47
7268107
NOTE. Braced figures give estimated mean discharge for periods indicated.
Monthly discharge of Duchesne River at Myton, Utah, for the year ending Sep tember 30, 1926
Month
July....... . .. ......... .......................
Discharge in second-feet
Maximum
922 394 443 348
874 3,570 3,000
426 1,120
107
3.570
Minimum
241 309 285
267 292 541 150 26 16 12
12
Mean
430 347 343 298 422 334 498
1,490 854 142 170 43.8
448
Run-off in acre-feet
26,400 20,600 21,100 18, 300 23,400 20,500 29,600 91, 600 50,800 8,730
10, 500 2,610
324,000
62 SURFACE WATER SUPPLY, 1926, PART IX
STRAWBEEEY RIVER AT DUCHESNE, UTAH
LOCATION. In SW. Y* NE. % sec. 2, T. 4 S., R. 5 W., Uinta special base and meridian, at Winslow ranch, three-quarters of a mile west of post office at Duchesne, Duchesne County, three-quarters of a mile above mouth of Indian Canyon Creek, a small tributary entering from south, and \Y% miles above confluence with Duchesne River.
DRAINAGE AREA. 1,040 square miles (measured on topographic maps).RECORDS AVAILABLE. June 10, 1908, to November 30, 1910, and March 16,
1914, to September 30, 1926.GAGE. Enameled vertical staff on downstream side of right abutment of bridge;
read by E. S. Winslow.DISCHARGE MEASUREMENTS. Made from cable just below bridge or by wading.CHANNEL AND CONTROL. Channel straight for several hundred feet above and
below gage. Bed of sand and fine .gravel. Natural channel about 50 feet wide is constricted at bridge to 36 feet. Banks comparatively low; covered with underbrush; left bank subject to overflow at very high stages. Gravel riffle 200 feet below gage.
EXTREMES OF DISCHARGE. Maximum stage recorded during year, 7.0 feet at 7 a. m. August 10 (discharge, 1,270 second-feet); minimum stage, 4.05 feet at 7 p. m. July 26 (discharge, 33 second-feet).
1908-1926: Maximum stage recorded, 7.7 feet (old datum) on May 27, 1922 (discharge, 3,230 second-feet); minimum discharge, 30 second-feet November 20, 1914. Records obtained prior to 1914 incomplete.
ICE. Stage-discharge relation affected by ice every winter.DIVERSIONS. 50,000 to 75,000 acre-feet of water from Strawberry Valley
Reservoir (capacity, 250,000 acre-feet), about 40 miles above station, is diverted annually by tunnel to Spanish Fork drainage basin. Some water is also diverted from upper end of Strawberry Valley to basin of Provo River.
REGULATION. Since 1912 flow of river has been affected by operation of Straw berry Valley Reservoir.
ACCURACY. Stage-discharge relation not permanent. Two rating curves are fairly well defined. Gage read to half-tenths twice a day. Daily discharge ascertained by applying mean daily gage height to rating table. Discharge for ice-affected periods estimated from one discharge measurement, tempera ture records, observer's notes, and hydrographic comparison with all Du chesne River stations. Records fair.
Discharge measurements of Strawberry River at Duchesne, Utah, during the year ending September 30, 1926
^ Date
Dec. 8 __ . .....Anr. 29.........
Gage height
Feet "4.40
5.33
Dis charge
Sec.-ft. 68.0
366
Date Gage height
Feet 4 264.18
Dis charge
Sec.-ft. 52.545.6
Date
Sept. !_..-. _
Gage height
Feet 4.10
Dis charge
Sec.-ft. 37.3
Stage-discharge relation affected by ice.
GREEN RIVER BASIN 63
Daily discharge, in second-feet, of Strawberry River at Duchesne, Utah, for the year ending September SO, 1926
Day
I....... ........2 _________3... . ... ..4 .... .... ....5.. .......
6 -----7 8 9 ... 10
11 12. ...-.-.-.-.13 14 15
16 17 18 19 20
21 22. 23 2425
26 27 28 29 30 O1
Oct.
5252525295
38895957766
10782777373
7366
6666
5858585858
586666
6666
Nov.
706666
587073
7777737782
8773878270
7373707373
7373737373
Dec.
7373735860
626568
65
Jan.
60
Feb.
70
Mar.
. 90
11110191
101101
111122122111101
111111
101101
10110110110191101
Apr.
7387919191
107218250228243
260206189162178
178189189250260
218250243250243
284322362362362
May
362354362375396
477396354346282
274244237220203
203230237237256
274267256237220
197188172150144
June
144144131124119
119119213144124
13110810810196
9696867676
7368605755
4747474646
July
4246465063
743837692124
101203806860
5454474239
3737373737
354580925445
Aug.
4237866363
57449534362855
13192806360
6060545454
5447474747
474242424237
Sept.
3737423737
3737373737
3737373737
3737373737
3737373737
4242
474747
NOTE. Qage heights affected by ice Dec. 5 to Mar. 10; braced figures give estimated mean discharge for periods indicated.
Monthly discharge of Strawberry River at Duchesne, Utah, for the year endingSeptember 30, 1926
Month
November.. __________________________
February... _ .- __ ._. _ _March. _____ ___ . __ _ _ . _ ...
July..-
September. ---------
The year ________________ ___ . .......
Discharge in second-feet
Maximum
38887
122 362 477 213 383 855
47
855
Minimum
5258
73 144 46 35 37 37
35
Mean
79.1 72.5 65.4
"60 "70
100 215 268 96.7 73.5
121 38.5
105
Run-off in: acre-feet
4,860 4,310 4,020 3,690 3,890 6,150
12,800 16,500 5,750 4,520 7,440 2,290
76,200
1 Estimated.
WEST FORK OF LAKE FORK NEAR MOUNTAIN HOME, UTAH
LOCATION. In NE. % see. 19, T. 2 N., R. 5 W., Uinta special base and meridian half a mile below Moon Lake and 13 miles northwest of Mountain Home, Duchesne County.
DRAINAGE AREA. 108 square miles (measured on topographic map).RECORDS AVAILABLE. From September 18, 1921, to September 30, 1926; not
operated during winter.
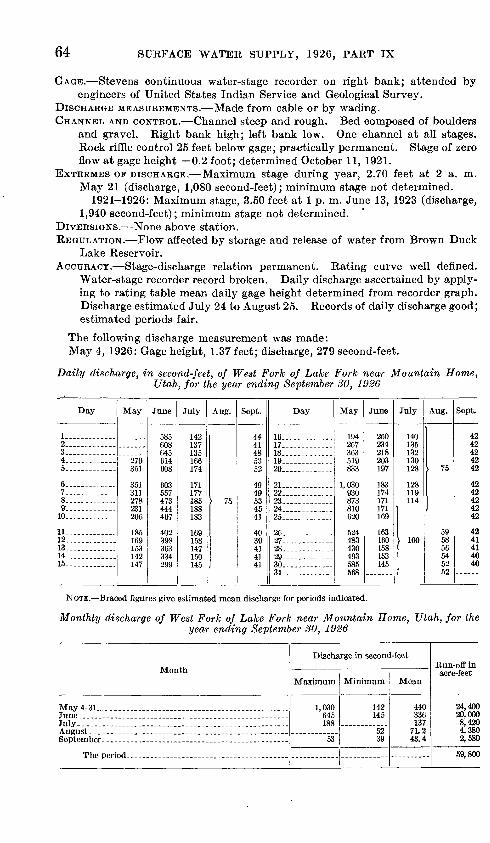
64 SURFACE WATER SUPPLY, 1926, PART IX
GAGE. Stevens continuous water-stage recorder on right bank; attended by engineers of United States Indian Service and Geological Survey.
DISCHARGE MEASUREMENTS. Made from cable or by wading.CHANNEL AND CONTROL. Channel steep and rough. Bed composed of boulders
and gravel. Right bank high; left bank low. One channel at all stages. Rock riffle control 25 feet below gage; practically permanent. Stage of zero flow at gage height 0.2 foot; determined October 11, 1921.
EXTREMES OF DISCHARGE. Maximum stage during year, 2.70 feet at 2 a. m. May 21 (discharge, 1,080 second-feet); minimum stage not determined.
1921-1926: Maximum stage, 3.50 feet at 1 p. m. June 13, 1923 (discharge, 1,940 second-feet); minimum stage not determined.
DIVERSIONS. None above station.REGULATION. Flow affected by storage and release of water from Brown Duck
Lake Reservoir.ACCURACT. Stage-discharge relation permanent. Rating curve well defined.
Water-stage recorder record broken. Daily discharge ascertained by apply ing to rating table mean daily gage height determined from recorder graph. Discharge estimated July 24 to August 25. Records of daily discharge good; estimated periods fair.
The following discharge measurement was made:May 4, 1926: Gage height, 1.37 feet; discharge, 279 second-feet.
Daily discharge, in second-feet, of West Fork of Lake Fork near Mountain Home, Utah, for the year ending September SO, 1926
Day
1. -------2 3 . 4 5 -----
6 ..1.... .........8- ..9.--- . .
10.-.- .
11 12 ..13 .14 15. ..
May
270351
351311278231206
185169153
147
June
608fiAR
614
603557
444407
398363
299
July
149
1371QK
166174
1711771851881 ft^
1691 ^ft1471 firt
1 /IE
Aug.
t 75
Sept.
44414853CO
4Q
49CO
4541
40OQ
41
Day
16 17 . 1ft
19 20 . --.
21 . 22 23 24. OK
Oft
27 28 - -OQ
30 .31
May
267363519833
1,030930873810
4834304Q3
585568
June
260234
203197
183174171171169
163160158153145
July
140135
130128
128119114
1 100
i
Aug.
75
595856545252
Sept.
4242424242
4242424242
4241414040
NOTE. Braced figures give estimated mean discharge for periods indicated.
Monthly discharge of West Fork of Lake Fork near Mountain Home, Utah, for the year ending September 30, 1926
Month
May 4-31...... ...
July.. -_ ..__.._.-..__.____._ . . .
Th6 period
Discharge in second-feet
Maximum
1,030645 188
53
Minimum
142 145
52 39
Mean
440 336 137
71.2 43.4
Run-off in acre-feet
24,400 20,000 8,420 4,380 2,580
59,800
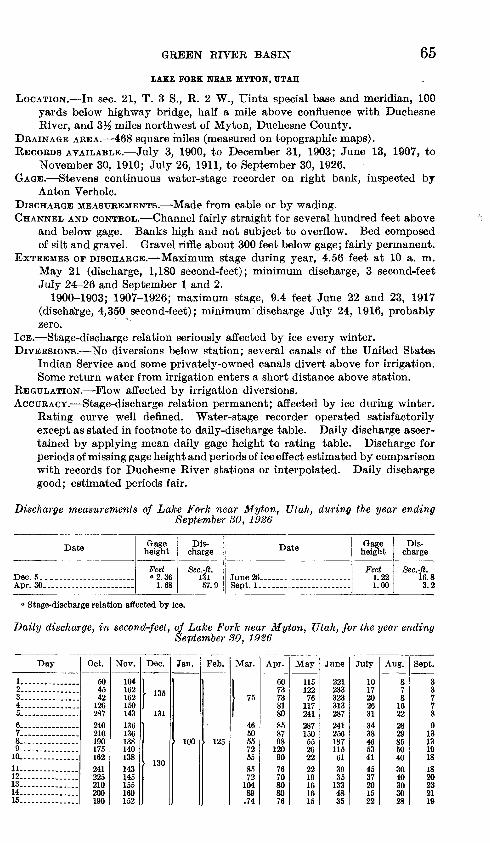
GREEN EIVER BASIN 65LAKE FORE NEAR MYTON, UTAH
LOCATION. In sec. 21, T. 3 S., R. 2 W., Uinta special base and meridian, 100 yards below highway bridge, half a mile above confluence with Duchesne River, and 3^ miles northwest of My ton, Duchesne County.
DRAINAGE AREA. 468 square miles (measured on topographic maps).RECORDS AVAILABLE. July 3, 1900, to December 31, 1903; June 13, 1907, to
November 30, 1910; July 26, 1911, to September 30, 1926.GAGE. Stevens continuous water-stage recorder on right bank, inspected by
Anton Verholc.DISCHARGE MEASUREMENTS. Made from cable or by wading.CHANNEL AND CONTROL. Channel fairly straight for several hundred feet above
and below gage. Banks high and not subject to overflow. Bed composed of silt and gravel. Gravel riffle about 300 feet below gage; fairly permanent.
EXTREMES OF DISCHARGE. Maximum stage during year, 4.56 feet at 10 a. m. May 21 (discharge, 1,180 second-feet); minimum discharge, 3 second-feet July 24-26 and September 1 and 2.
1900-1903; 1907-1926; maximum stage, 9.4 feet June 22 and 23, 1917 (discharge, 4,350 second-feet); minimum discharge July 24, 1916, probably zero.
ICE. Stage-discharge relation seriously affected by ice every winter.DIVERSIONS. No diversions below station; several canals of the United States
Indian Service and some privately-owned canals divert above for irrigation. Some return water from irrigation enters a short distance above station.
REGULATION. Flow affected by irrigation diversions.ACCURACY. Stage-discharge relation permanent; affected by ice during winter.
Rating curve well defined. Water-stage recorder operated satisfactorily except as stated in footnote to daily-discharge table. Daily discharge ascer tained by applying mean daily gage height to rating table. Discharge for periods of missing gage height and periods of ice effect estimated by comparison with records for Duchesne River stations or interpolated. Daily discharge good; estimated periods fair.
Discharge measurements of Lake Fork near Myton, Utah, during the year endingSeptember 30, 1926
Date
Apr. 30.-.. ...............
Gage height
Feet "2.36
1.68
Dis charge
Sec.-ft. 13157.9
Date
Sent. I...... .................
Gage height
Feet 1.221.00
Dis charge
Sec.-ft. 16.83.2
a Stage-discharge relation affected by ice.
Daily discharge, in second-feet, of Lake Fork near Myton, Utah, for the year endingSeptember 30, 1926
Day
1.. ...... ....2...............3...............4... .._.......
6... ............7...............8 ............9... .......... .10...............11..... .......12.............13...............14.............15.............
Oct.
504542126OQ7
240210190175162
225
200190
Nov.
104162162150143136136138140138143145155160152
Dec.
i.uu
130
Jan.
> 100
Feb.
1 125
Mar.
11
46505572EK
oe
7210489.74
Apr.
6073738180858798120on
7670808076
May
11 R
76117241OQ7
1 ^ft
5526no
99
101 ft
1615
June
221233323313*>Q7
241
18711561on
35
AQ
35
July
10172026o-i
34384653414537201 ^
22
Aug.
87
OO
OQ
9Q85504ft
304ft
303028
Sept.
3377
9131319isis202391
19
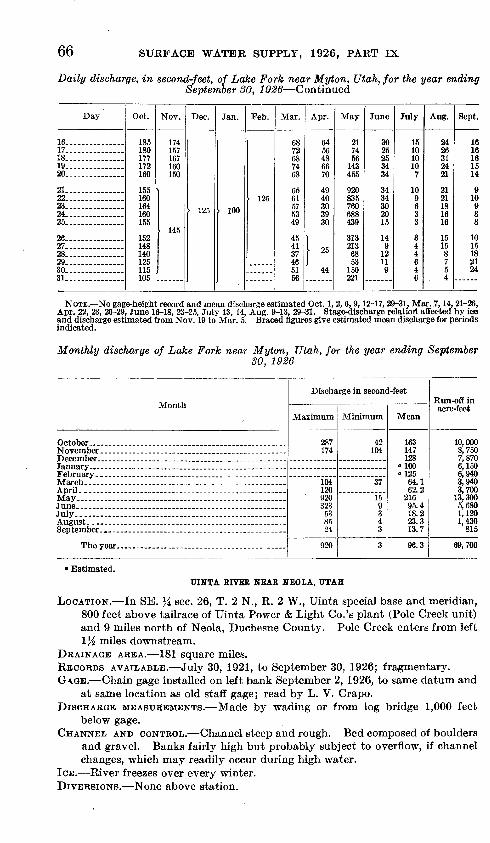
66 SURFACE WATER SUPPLY, 1926, PART IX
Daily discharge, in second-feet, of Lake Fork near Myton, Utah, for the year ending September 30, 1926 Continued
Day
16.-. .........17...............18...............19.. .............20.- .........
21...... .........2223...............24 ...........25... .........
26 27 28 29. 30 31.
Oct.
185180177172160
160164160
152148140125115105
Nov.
174157167160150
145
Dec.
\ 125
Jan.
1 100
Feb.
19^
Mar.
6879
687468
656157CO
49
45413746
56
Apr.
6456486670
494fl
30<to30
! 25
I44
May
91
7456
143455
920835760688439
3132136853150221
June
3025OK
3434
3434302015
14912119
July
151010107
109633
344646
Aug.
2426312421
2121181616
1515875
, 4
Sept.
1616161514
910988
1015182124
NOTE. No gage-height record and mean discharge estimated Oct. 1, 2, 6, 9,12-17, 29-31, Mar. 7,14, 21-26, Apr. 22, 23, 26-29, June 16-18, 23-25, July 13, 14, Aug. 9-13, 29-31. Stage-discharge relatiorl affected by ice and discharge estimated from Nov. 19 to Mar. 5. Braced figures give estimated mean discharge for periods indicated.
Monthly discharge of Lake Fork near Myton, Utah, for the year ending September30, 1926
Month
April...
July..
Discharge in second-feet
Maximum
287 174
104 120 920 323
53 85 24
920
Minimum
42 104
37
15 9 3 4 3
3
- Mean
163 147 128
«100 -125
64.1 62.2
216 95.4 18.2 23.3 13.7
96.3
Run-off inacre-feet
10,000 8,750 7,870 6,150 6,940 3,940 3,700
13,300 5,680 1,120 1,430
815
69,700
1 Estimated.UINTA RIVER NEAR NEOLA, UTAH
LOCATION. In SE. }i sec. 26, T. 2 N., R. 2 W., Uinta special base and meridian,800 feet above tailrace of Uinta Power & Light Co.'s plant (Pole Creek unit)and 9 miles north of Neola, Duchesne County. Pole Creek enters from left\ l/z miles downstream.
DRAINAGE AREA. 181 square miles.RECORDS AVAILABLE. July 30, 1921, to September 30, 1926; fragmentary. GA.GE. Chain gage installed on left bank September 2, 1926, to same datum and
at same location as old staff gage; read by L. V. Crapo. DISCHARGE MEASUREMENTS. Made by wading or from log bridge 1,000 feet
below gage. CHANNEL AND CONTROL. Channel steep and rough. Bed composed of boulders
and gravel. Banks fairly high but probably subject to overflow, if channelchanges, which may readily occur during high water.
ICE. River freezes over every winter. DIVERSIONS. None above station.
GREEN RIVER BASIN 67
REGULATION. None.ACCURACY. Stage-discharge relation permanent during the year. Rating curve
fairly well defined. Gage read to hundredths once or twice daily, except as stated in footnote to daily-discharge table. Daily discharge ascertained by applying daily or mean daily gage height to rating table. Discharge esti mated for days of missing gage heights by comparison with records of flow of Duchesne River near Tabiona, Whiterocks River near Whiterocks, Ashley Creek near Vernal, and a study of precipitation records. Records fair.
Discharge measurements of Uinta River near Neola, Utah, during the year endingSeptember 30, 1926
Date
May 1... .......... ...........
Gage height
Feet 0.22.88
Dis charge
See.-ft. 119252
Date Qage height
Feet 1.03.26
Dis charge
See.-ft. 308112
Daily discharge, in second-feet, of Uinta River near Neola, Utah, for the year endingSeptember 80, 1926
Day
2... .........3.... ...........4...............5 ... ... ...
6...............7... ........... .8.. ...... ....9...............10
12...............13 ...14 . .15 ..
16...............17 18. ....19 ............20. .
21 ..........22...............23 ...........24...............25 ....
26. ...........27 ..........28 .........29...............30 .31 ......
Oct.
240
219213207202196
180185196180155
160160165151142146
Nov.
1511551 An14A125
113129121129129
117125121165
133115
1009390
9399121110110
110103103
Dec.
103103142
129
99997676
101
10886877673
7381879676
7378888768
819696QQ10396
Jan.
8878817173
7164666664
6668718481
7876787881
75
737272
Feb.
|.6866666668
686458
58
58
606366
66
66
Mar.
6258666462
6676626262
6062646264
6668666466
6668646664
646462646662
Apr.
62
-
May
260285379528687
554391298236224
207196
202196
260445554700912
1,020975
1,010
687
615606486571705660
June
7057507015682750
700660fiO9567507
AQG
4534»fi406383
361332318298290
28027226629297Q
298282318279282
July
28828597Q368391
315361357398368
282292970257282
298332320310298
301285242224188
222230239202180170
Aug.
162160
200
269227279308
949230213185180
170165158160151
15114214613319Q
125121121121115115
Sept.
110106110113106
104103106QQ
93
9396QA
9390
9087878786
8684868793
9699QQ
,96127
NOTE. No gage-height record; discharge estimated or interpolated Oct. 1-15, Nov. 4,5,17,18,27, Dec. 4, Jan. 21-28, 30, 31, Feb. 1-5, 14-18, 24-27, May 19, June 6, 20, 21, July 18, 19, Aug. 3-6, 16, 17, 30, 31, Sept. 19, 20.
68 SURFACE WATER SUPPLY, 1926, PART IX
Monthly discharge of Uinta River near Neola, Utah, for the year ending Sep tember 30, 1926
Month
November... __ -.--. _ . _ _ _ .... _ ___ __ . ...
January. ___ . _ __ ___ ... ____ __ .. . __February ___ -. __ __ ___ _ .. __ __ __ __ ....
April.. ....-..__......-.. _ .. . ., ....... ..May. ____ __ .... ... ___ ...... ___ . _ ..........
July.. .....-......-............._...._..................
September. __ ... _ --------- . --... __ _ .-.- _ ....
The year
Discharge in second-feet
Maximum
165 142 88
76
1,020 795 398
127
1,020
Minimum
142 90 73 64
58
180 266 170 115 84
Mean
«210 119 92.6 74.2 64.2 64.3
95 516 446 285 177 96.9
188
Run-off in acre-feet
«12,900 7,080 5,690 4,560 3,570 3,950
« 5, 650 31,700 26,500 17, 500 10, 900 5,770
136,000
Estimated.WHITEEOCKS EIVEE NEAE WHITEEOCKS, UTAH
LOCATION. In sec. 18, T. 2 N., R. 1 E., Uinta special base and meridian, 8 miles north of Whiterocks, Uintah County. United States Whiterocks Canal diverts from left side and Farm Creek Canal from right side 2 miles below station.
DRAINAGE AREA. 118 square miles.RECORDS AVAILABLE. August 1, 1921, to September 30, 1926, at present site;
fragmentary. November 8, 1917, to June 2, 1921, at a point about 2 miles downstream below diversion of United States Whiterocks Canal and above Farm Creek Canal; 1899 to 1904 and 1907 to 1910, somewhere in vicinity of present site. Records are comparable.
GAGE. Stevens continuous water-stage recorder on left bank.DISCHARGE MEASUREMENTS. Made by wading or from cable a quarter of a mile
above gage.CHANNEL AND CONTROL. Narrow box canyon. Stream bed is steep and rough;
composed of boulders and gravel. Channel is subject to change by erosion during high water.
EXTREMES OP DISCHARGE. Not determined for 1926.1918-1926: Maximum stage recorded, 5.40 feet at 9 p. m. June 20 and
7 p. m. June 21, 1922 (discharge, 2,750 second-feet); minimum discharge less than 14 second-feet in the winter of 1920-21.
ICE. Stream freezes over every winter.DIVERSIONS. After August 1, 1921, above all diversions.REGULATION. None.ACCURACY. Stage-discharge relation practically permanent during year. Stand
ard rating curve fairly well denned. Operation of water-stage recorder satisfactory April 7 to May 5 and August 31 to September 30. Daily dis charge ascertained by applying to rating table mean daily gage height deter mined from recorder graph. Records fair.
Discharge measurements of Whiterocks River near Whiterocks, Utah, during the year ending September 30,1926
Date
Dec. 7.... ....................
Gage height
Feeta o OK
9 4ft
Dis charge
Sec.-ft. 62.2
273
Date
Aug. 31 ..-....... - .
Gage height
Feet 2.212.04
Dis charge
Sec.-ft. 11768.4
Stage-discharge relation affected by ice.
GREEN RIVER BASIN 69
Daily discharge, in second-feet, of Whiterocks River near Whiterocks, Utah, for the year ending September SO, 1926
Day
1 ..... ....
4 .......
6... ..... ....7... .........
g10 .
Apr.
47
45
May
274*>C7
qoj.
Sept.
727278527Si
70
78G1
7875
Day
11
13 14.. 1 C
16 17.. .Ifi
1QOft
Apr.
4545454549
5761
7266
May Sept.
7587817875
6966666461
Day
21 22 23 24 25 .
26 -27 28 29 30
Apr.
72818187
106
123143168191248
May Sept.
5959595757
5755555381
FISH CEEEK NEAE SCOFIEID, UTAH
LOCATION. In sec. 10, T. 12 S., R. 7 E., below Horsley Dam of Price RiverIrrigation District, 5 miles northeast of Scofield, Carbon County, and 10miles above point where Fish Creek and White River unite to form PriceRiver.
DRAINAGE AREA. 163 square miles (measured on Forest Service map, 1920). RECORDS AVAILABLE. November 17, 1917, to September 30, 1921, and June 15,
1925, to September 30, 1926; fragmentary. GAGE. Vertical enameled staff gage on left bank below outlet tunnel at dam;
installed April 27, 1926; read by S. W. Robertson and J. W. Boothe. DISCHARGE MEASUREMENTS. Made from footbridge 500 feet below gage or by
wading. CHANNEL AND CONTROL. One channel at all stages. Right bank is high; left
bank lower but probably not subject to overflow. Railroad embankmenta few feet back from left bank can not be overflowed. Stream bed graveland sand. Riffle a short distance below gage.
EXTREMES OF DISCHARGE. Maximum stage recorded during year, 6.30 feet at4 p. m. May 21 (discharge, 381 second-feet); minimum discharge 2 or 3second-feet in middle of winter.
ICE. Stream freezes over every winter.DIVERSIONS. Some small diversions for irrigation above station. REGULATION. Flow completely regulated after May, 1926, by dam and reservoir
of Price River Irrigation District, capacity 66,000 acre-feet. ACCURACY. Stage-discharge relation permanent during period. Rating curve
well defined. Staff gage read to hundredths once or twice daily except asstated in footnote to daily-discharge table. ' Daily discharge ascertained byapplying mean daily gage height to rating table. Records good.
COOPERATION. Daily gage-height record furnished by Price River IrrigationDistrict.
Discharge measurements of Fish Creek near Scofield, Utah, during the year endingSeptember 30, 1926
Date
Apr. 27.. .......
June 14 «.. __June 19 «.... ...
Gage height
Feet
5.164.605.40
Dis charge
Sec.-ft. 20011646.6
167
Date
July 7 «___ July 15 .........
Gage height
FeetK OA
5.235.09
Dis charge
Sec.-ft. 150131110108
Date
July 15... ......
Aug. 23
Gage height
Feet 4.464.254.27
Dis charge
Sec.-ft. 29.323.623.6
1 Made by water commissioner of Price River Irrigation District.
70 SURFACE WATER SUPPLY, 1926, PART IX
Daily discharge, in second-feet, of Fish Creek near Scofield, Utah, for the year endingSeptember SO, 1926
Day
1 . --.-2...-. ..3..----....4 _5-. .....
6--_ _ 7..........8..........9..........10-
11 .........12... .......13..........14..........15-. ........
Apr. May
267272282284282
274267230302312
30630919677
174
June
120120120120120
12047474747
474746'47
47
July
127
156152146
140108120117113
108110110
60
Aug.
8766242424
2424242424
2424
2424
Sept.
1 14
Day
16 17. 18- 19 on
91
22. 23.
25.
26- 27. 28- 29- 30-- 01
Apr.
196191230239
May
241166237324289
304324299246241
246241241136118118
June
47474791162
156154150148146
142142136135131
July
2626252525
2525252525
461079794120117
Aug.
8367584739
3229252424
212019181716
Sept.
14
1314131313
NOTE. No gage-height record Aug. 28 to Sept. 25; discharge estimated. Braced figures gives estimated mean discharge for periods indicated.
Monthly discharge of Fish Creek near Scofield, Utah, for the year ending SeptemberSO, 1926
Month
April 27-30- May ___ ............
July.
Discharge in second-feet
Maxi mum
239 324 162 156
Mini mum
191 77 46 25
Run-off in acre-
feet
1,700 15,100 5,9005,240i
Month
Discharge in second-feet
Maxi mum
87
Mini mum
16
Run-off In acre-
feet
1,990 827
30,800
PRICE EIVER NEAR HELPER, UTAH
LOCATION. In SE. ^ sec. 36, T. 13 S., R. 9 E., at highway bridge three-quarters of a mile above diversion dam of Price River Irrigation Co., 2 miles south of Helper, Carbon County, and 3 miles below Spring Creek.
DRAINAGE AREA. 530 square miles (measured on topographic maps).RECORDS AVAILABLE. February 21, 1904, to September 30, 1926.GAGE. Chain gage on highway bridge; inspected by D. S. Rowley.DISCHARGE MEASUREMENTS. Made from highway bridge or by wading.CHANNEL AND CONTROL. Bed of stream composed of gravel and sand. Con
trol is a riffle of gravel and cobbles.EXTREMES OP DISCHARGE. Maximum stage recorded during year, 9.4 feet at
11 a. m. October 5 (discharge determined from extension of rating curve, 1,400 second-feet); minimum stage recorded, 6.48 feet September 22-28 (discharge, 9 second-feet).
1904-1926: Summer floods occur nearly every year and often greatly exceed any recorded stage. Maximum stage recorded, for which discharge was determined, 8.43 feet at 9 p. m. June 25, 1917 (discharge determined from extension of rating curve, 8,500 second-feet); minimum discharge, 4 second-feet during December, 1905, January, 1906, and August 8, 1925.
ICE. Stage-discharge relation affected by ice nearly every winter.DIVERSIONS. Main diversions from Price River are below station.
GREEN RIVER BASIN 71
REGULATION. Flow regulated after May, 1926, by storage reservoir on Fish Creek, which is main tributary to Price River.
ACCURACY. Stage-discharge relation changed several times during year. Stand ard rating curves fairly well defined. Gage read to hundredths once daily with occasional omissions and twice daily during periods of rapidly changing stage. Daily discharge ascertained by applying mean daily gage height to rating table using shifting-control method. Discharge for periods of ice effect estimated from temperature records, observer's notes, and one meter measurement. Discharge interpolated or estimated from observer's notes for days for which no gage heights were obtained and for small flood October 4-6. Records fair.
Discharge measurements of Price River near Helper, Utah, during the year endingSeptember 30, 1926
Date
Mar 28
Gage height
Feet 6.77
»6.627 flQ
Dis charge
Sec.-ft. 33.910.590.5
Date
Apr. 28
Gage height
Feel
7.017.42
Dis charge
Sec.-ft. 35349.4 i
134 ,
Date
Aug. 25.........
Gage height
Feet 6.70
Dis charge
Sec.-ft. 22.4
Made by engineer of Utah Power & Light Co.* Stage-discharge relation affected by ice.
Daily discharge, in second-feet, of Price River near Helper, Utah, for the year endingSeptember 30, 1926
Day
12...... .........3 __45
67. ..............89 . ........10
11..... ..........12 . .1314. .......
16 ... ......17 18 .19 . 20
21..... ..........22. ......23. 24... ........25
2627. ..2829 30 . 31 .... ......
Oct.
24242050
KflA
250634697
37
3746OQ
37370-7
1737363£
3433333333
313331302828
Nov.
2876373n24
2020202020
2023172020
20
211616
1616161718
2091
212324
Dec.
2626242321
2121282633
20202024
> 15
Jan.
10
10
1 1S
20
2320
Feb.
1 af *35
2835312831
3535262835
3525303535
3433282240
312840
Mar.
521591046666
5252484445
45607324066
30141012686106
988993126111
979384797468
Apr.
68656582102
317244641128128
126126138151165
210241
210
286298317337350
386OCft
368430430
May
430430430430446
456430298350
395376358138244
272250
279
448537
285274
266270274274137
June
129127127127117
11299575751
5151515149
49495151120
120122115122129
124124124127124
July
124127132137150
137124115120124
115115115115110
4945413434
3829292727
2727
10390106
Aug.
7984833939
3838353338
3333312727
2738484845
3628242421
191716171615
Sept.
1312121212
1111111111
1111101010
1010101010
109999
999
1ft2T
NOTE. Braced figures give estimated mean discharge for periods indicated.
72 SURFACE WATER SUPPLY, 1926, PART IX
Monthly discharge of Price River near Helper, Utah, for the year ending September30, 1926
Month
March. ___________ ______ .. ____ _ ...April... ..... .......................................May.. _____ _____ ____ __ ______
July......... .......................................
September ___________________________
The year _____ _ ___ ___________
Discharge in second-feet
Maximum
500 7« 33
40 410 641 637 129 150 84 27
641
Minimum
20 16
44 65
132 49 27 15 9
9
Mean
57.3 22.9 18.8 15.7 30.1
104 241 336 93.6 86.2 35.4 11.1
88.0
Run-off in acre-feet
3,520 1,360 1,160
965 1,670 6,400
14,300 20,700 5,570 5,300 2,180
660
63,800
HUNTHTGTON GREEK NEAR HUNTINGTON, UTAH
LOCATION. In SE. % sec. 6, T. 17 8., R. 8 E., at old Cunha ranch, 7 miles north west of Huntington, Emery County. Below all main tributaries, except Fish Creek.
DRAINAGE AREA. 188 square miles (measured on Forest Service map, 1920).RECORDS AVAILABLE. May 3, 1909, to September 30, 1926; fragmentary.GAGE. Stevens continuous water-stage recorder on left bank; inspected by
Joseph Cunha.DISCHARGE MEASUREMENTS. Made by wading or from bridge at gage.CHANNEL AND CONTROL. Bed composed of gravel and sand. Control of coarse
gravel; fairly permanent.EXTREMES OF DISCHARGE. Maximum stage recorded during year, 4.45 feet at
4 pr. m. September 11 (discharge, 755 second-feet); minimum stage, 1.24 feet at 7 p. m. November 5 (no flow, probably caused by ice jam above).
1909-1926: Maximum discharge, 1,340 second-feet at 9.30 p. m. May 25,1920. and at 11 p. m. May 25, 1922. Discharge may have been greater in1921. Minimum stage, 1.24 feet at 7 p. m. November 5, 1926 (no flow, prob ably caused by ice jam above).
ICE. Stage-discharge relation seriously affected by ice.DIVERSIONS. Several small ditches from tributaries above station.REGULATION. A small storage reservoir on Huntington Creek above the station
controls distribution of flow to a slight extent.ACCURACY: Stage-discharge relation changed slightly at low-water stages. Rat
ing curves well defined between 30 and 700 second-feet; extended above. Operation of water-stage recorder satisfactory except during winter. Daily discharge ascertained by applying to rating tables mean daily gage height determined from recorder graph. Records good except for winter estimates, which are fair.
Discharge measurements of Huntington Creek near Huntington, Utah, during the year ending September 30, 1926
Date
Dec. 13 TV/Tar M
Gage height
Feet 2.06
1.92
Dis charge
Sec.-ft. 35.634.1
Date
June 24 __ . __
Gage height
Feet 3.252.53
Dis charge
Sec.-ft. 273101
Date
Aug. 24. ___ ..
Gage height
Feet 2.01
Dis charge
Sec.-ft. 34.3
° Stage-discharge relation affected by ice.
GKEEN KIVEK BASIN 73
Daily discharge, in second-feet, of Huntington Creek near Huntinglon, Utah, for the year ending September 30, 1926
Day
I... ......................2. __ . _______ . __ ....3.- ............ .......4.. ......................5... .- .._ .-..._.
6. ..........................7... .....................8... .....................9... . - _.. .-.._..10.... ....................
11.......... __ .............12. _________________13.. . _ ............14. ............. _ ..........IS.... ... .....
16.......... .................17.. ......................18...... .....................19..... ...............20.- .....................
21....... ...............22........ ____ ___ . .23.- .................24........ ................25.- .....................
26... ............. ......27 _______ ... __ ..... ...28-..- ...................29.... ...................30..--. ...................31
Oct.
3232323250
5543873635
3638383635
3331311131
3131323131
32go
33333131
Nov.
3336353320
2836293531
36343128
\ 30
Mar.
40
3743
4744454242
4043485447
434.9
39403939
Apr.
3737383846
4646474850
4848506794
121124132i4.n132
164186188203230
971onn
329349349
May
332349396446450
336287268225198
183178171188250
306367392446515
507474450400322
287265271287296306
June
293274250227211
200186180176164
157147136147113
1049589101117
113110110106IfU
10197106124123
July
108115113115115
115110106102101
102102999795
9595978975
7773737375
808468666260
Aug.
6364706767
7371736767
5854535152
5048464443
4241383533
31in30323130
, Sept.
3030302929
2930302828
3840353332
3232313131
3131313130
3335333939
NOTE. Braced figures give estimated mean discharge for periods indicated.
Monthly discharge of Huntington Creek near Huntington, Utah, for the year endingSeptember 30, 1926
Month
March.. ____________________________ .April.. _ . _ . . May
July-...................-............... .... .........August.. _____________________________
The year ...........................................
Discharge in second-feet
Maximum
55 36
54 349 515 293 115 73 40
515
Minimum
31 20
37 171 89 60 30 29
20
Mean
34.6 30.8
-35 °35 °35
41.7 132 327 149 91.5 50.1 32.0
83.2
Kun-off in acre-feet
2,130 1,830 2,150 2,150 1,940 2,560 7,860
20,100 8,870 5,630 3,080 1,900
60,100
1 Estimated.COTTONWOOD CREEK NEAR ORANGEVILLE, UTAH
LOCATION. In SW. % sec. 10, T. 18 S., R. 7 E., at Sitterud ranch, 5 miles north west of Orangeville, Emery County.
DRAINAGE AREA. 200 square miles (measured on Forest Service map, 1920).RECORDS AVAILABLE. May 1, 1909, to September 30, 1926; fragmentary.GAGE. Stevens continuous water-stage recorder on left bank near ranch house;
inspected by George Sitterud.DISCHARGE MEASUREMENTS. Made from cable 500 feet downstream or by
wading.
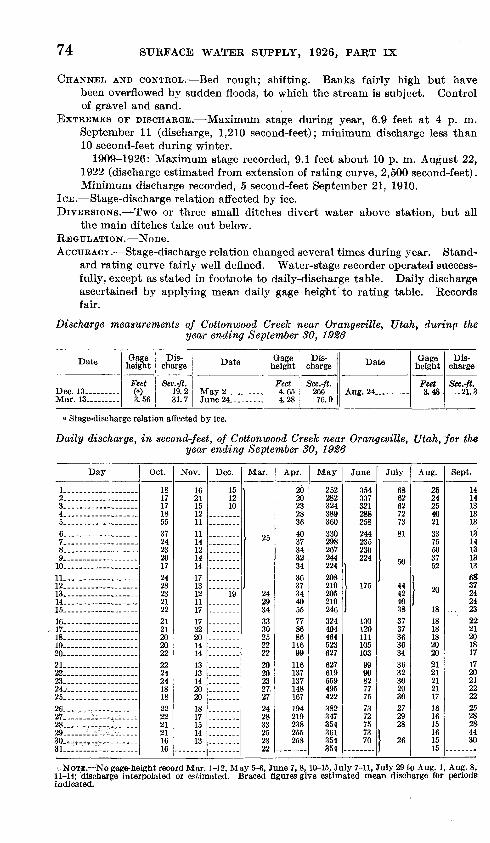
74 SURFACE WATER SUPPLY, 1926, PART IX
CHANNEL AND CONTROL. Bed rough; shifting. Banks fairly high but have been overflowed by sudden floods, to which the stream is subject. Control of gravel and sand.
EXTREMES OF DISCHARGE. Maximum stage during year, 6.9 feet at 4 p. m. September 11 (discharge, 1,210 second-feet); minimum discharge less than 10 second-feet during winter.
1909-1926: Maximum stage recorded, 9.1 feet about 10 p. m. August 22, 1922 (discharge estimated from extension of rating curve, 2,500 second-feet). Minimum discharge recorded, 5 second-feet September 21, 1910.
ICE. Stage-discharge relation affected by ice.DIVERSIONS. Two or three small ditches divert water above station, but all
the main ditches take out below.REGULATION. None.ACCURACY. Stage-discharge relation changed several times during year. Stand
ard rating curve fairly well defined. Water-stage recorder operated success fully, except as stated in footnote to daily-discharge table. Daily discharge ascertained by applying mean daily gage height to rating table. Records fair.
Discharge measurements of Cotton/wood Creek near Orangeville, Utah, durinci the year ending September 80, 1926
Date
Dec. 13 Mar. 13 ......
Gage height
Feet ( )3.56
Dis charge
Sec.-ft. 19.231.7
Date Gage height
Feet 4.654.28
Dis charge
Sec.-ft. 26676.9
Date Gage height
Feet3.48
Dis charge
Sec.-ft. -.21.3
° Stage-discharge relation affected by ice.
Daily discharge, in second-feet, of Cottonwood Creek near Orangeville, Utah, for the year ending September 80, 1926
Day
1 ......... ...2 ...... ... ....3. ... ....4 5 6 .... ....7 ....... .8 9. ...... 10 11 12 13 14 15 16 17 18 19 20- - .21 22 23 24. 25 26 27 ' 28 29 .... . i-L 30.^ T-, 31
Oct.
18
1718553724232017242823212221212020
2224241818222221211616
Nov.
16211512
1419
14
171312
17
22
14
1314202018
1514
Dec.
15
10
Mar.
242934
3330252222202023
27242833252322
Apr.
20
2328364037
32343637344055778686
11699
116137137148167194219238255258
May
252282324389360330298267244224208210205210246324404464523627627619559495422382347354361354354
June
354007
321OSC
258244235230224
175
13012011110510399908277757372757370
July
686262727381
50
4442403837373636343632302930272928
1 -"
Aug.
25
2540213375503752
1 20
1818181820202121212117161615161515
Sept.
14
131313131413131368372424
... 23222120181717202122222528284430
:, NOTE, No gage-height record Mar. 1-12, May 5-6, June 7, 8, 10-15, July 7-11, July 29 to Aug. 1, Aug. 8, 11-14; discharge interpolated or estimated. Braced figures give estimated mean discharge for periods indicated.
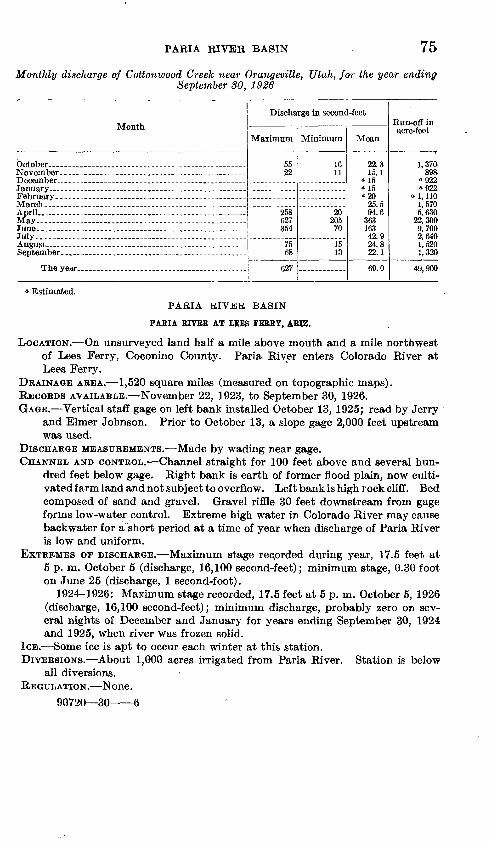
PARIA RIVER BASIN 75
Monthly discharge of Cottonwood Creek near Orangeville, Utah, for the year endingSeptember 30, 1926
Month
April.... .
July.....-..-. .............. ........ ........
Discharge in second-feet
Maximum
55 22
258 627 354
75 68
627
Minimum
16 11
20 205
70
15 13
Mean
22.315.1
«15 « 15 «20
25.5 94.6
363 163 42.9 24.8 22.1
69.0
Run-off in acre-feet
1,370 898
"922 « 922
« 1, 110 1,570 5,630
22,300 9,700 2,640 1,520 1,320
49,900
» Estimated.PARIA RIVER BASIN
PARIA RIVER AT LEES FERRY, ARIZ.
LOCATION. On unsurveyed land half a mile above mouth and a mile northwest of Lees Ferry, Coconino County. Paria River enters Colorado River at Lees Ferry.
DKAINAGE AREA. 1,520 square miles (measured on topographic maps).RECORDS AVAILABLE. November 22, 1923, to September 30, 1926.GAGE. Vertical staff gage on left bank installed October 13, 1925; read by Jerry
and Elmer Johnson. Prior to October 13, a slope gage 2,000 feet upstream was used.
DISCHARGE MEASUREMENTS. Made by wading near gage.CHANNEL AND CONTROL. Channel straight for 100 feet above and several hun
dred feet below gage. Right bank is earth of former flood plain, now culti vated farm land and not subject to overflow. Left bank is high rock cliff. Bed composed of sand and gravel. Gravel riffle 30 feet downstream from gage forms low-water control. Extreme high water in Colorado River may cause backwater for a short period at a time of year when discharge of Paria River is low and uniform.
EXTREMES OF DISCHARGE. Maximum stage recorded during year, 17.5 feet at 5 p. m. October 5 (discharge, 16,100 second-feet); minimum stage, 0.30 foot on June 25 (discharge, 1 second-foot).
1924-1926: Maximum stage recorded, 17.5 feet at 5 p. m. October 5, 1926 (discharge, 16,100 second-feet); minimum discharge, probably zero on sev eral nights of December and January for years ending September 30, 1924 and 1925, when river was frozen solid.
ICE. Some ice is apt to occur each winter at this station.DIVERSIONS. About 1,000 acres irrigated from Paria River. Station is below
all diversions.REGULATION. None.
90720 30 6
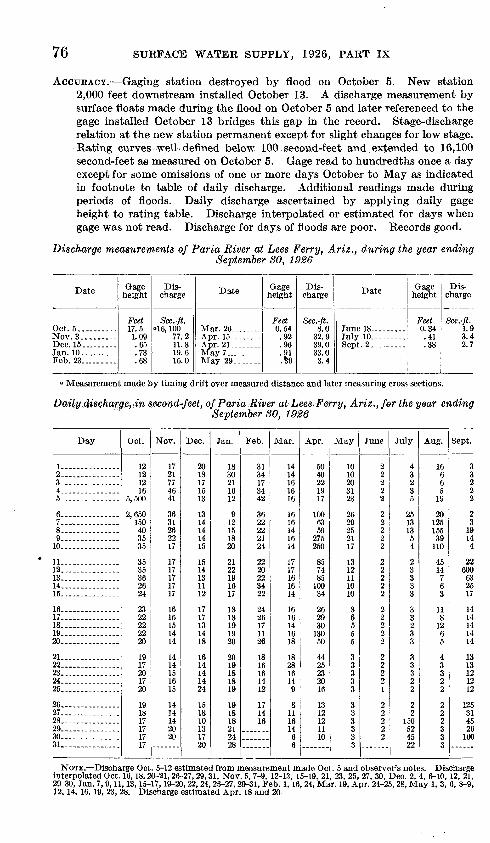
76 SURFACE WATER SUPPLY, 1926, PART IX
ACCURACY. Gaging station destroyed by flood on October 5. New station 2,000 feet downstream installed October 13. A discharge measurement by surface floats made during the flood on October 5 and later referenced to the gage installed October 13 bridges this gap in the record. Stage-discharge relation at the new station permanent except for slight changes for low stage. Rating curves well defined below 100,second-feet and extended to 16,100 second-feet as measured on October 5. Gage read to hundredths once a day except for some omissions of one or more days October to May as indicated in footnote to table of daily discharge. Additional readings made during periods of floods. Daily discharge ascertained by applying daily gage height to rating table. Discharge interpolated or estimated for days when gage was not read. Discharge for days of floods are poor. Records good.
Discharge measurements of Paria River at Lees Ferry, Ariz., during the year endingSeptember 30, 1926
Date
Oct. 5 Nov. 3.-.. _ -.Dec. 15 ..... .
Feb. 23 --
Gage height
Feet 17.51.09.65.73.68
Dis charge
Sec.-ft.
77.211.819.616.0
Date
Apr. 15 Apr. 21.
Gage height
Feet
.92
.96
.91.%9
Dis charge
Sec.-ft. 8.0
32.939.033.03.4
Date
July 10.
Gage height
Feet 0.34.41.38
Dis charge
Sec.-ft. 1.93.42.7
0 Measurement made by timing drift over measured distance and later measuring cross sections.
Daily discharge, in s.econd-feet, of Paria River at Lees Ferry, Ariz., for the year endingSeptember 30, 1926
Day
2 ...... ......3 ....... ...4. .... ....5.. ___ ........
6 7 ^ 8 ... .... ... -910
11. . .12 13 14 15
16 17 .......18. __ ..... .....19 20
21 22 _ ...... -- .23 24 25
26- 27 .28. . 29 30 .31.
Oct.
12121216
5,500
2,650
3535
3535362624
232222
20
19
201720
1Q
1817171717
Nov.
1721774641
3631262217
1717171717
16151414
151615
14142020
Dec.
2018171513
1314
1415
i f\141°.
12
171713
18
14141424
i f\
13
20
Jan.
30211612
9
1820
221Q
17
1818191Q
20
201Q
181819
1910
212428
Feb.
3134173442
36
2124
2220
3422
17
26
18
16
12
171416
Mar.
14141616
16
14
171716
14
161614
18
00
16
9
16
66
Apr.
402219
10063
275250
85748510034
262930
io.n
oe
2320
10
12
10
May
10203123
26on
2117
1°.
12
10
65
3
333
0
3o
June
22222
2
222
2
22
22
2
2
2
July
4323
251°.
1°.
4
23
33
2
3
0
22
2
5245
Aug.
665
19
201OK
1 KK
39110
AK
14763
8126
22
Sept.
33222
2319144
22600632517
141414
14
1310
121212
12501
AK
26
NOTE. Discharge Oct. 5-12 estimated from measurement made Oct. 5 and observer's notes. Discharge interpolated Oct. 16,18,20-21, 26-27, 29,31, Nov. 5, 7-9, 12-13, 15-19, 21, 23, 25, 27, 30, Dec. 2, 4, 6-10, 12, 21, 29-30, Jan. 7, 9,11,13,15-17,19-20, 22, 24, 26-27, 29-31, Feb. 1,16, 24, Mar. 19, Apr. 24-25, 28, May 1, 3, 6, 8-9, 12. 14, 16, 19, 23, 28. Discharge estimated Apr. 18 and 20
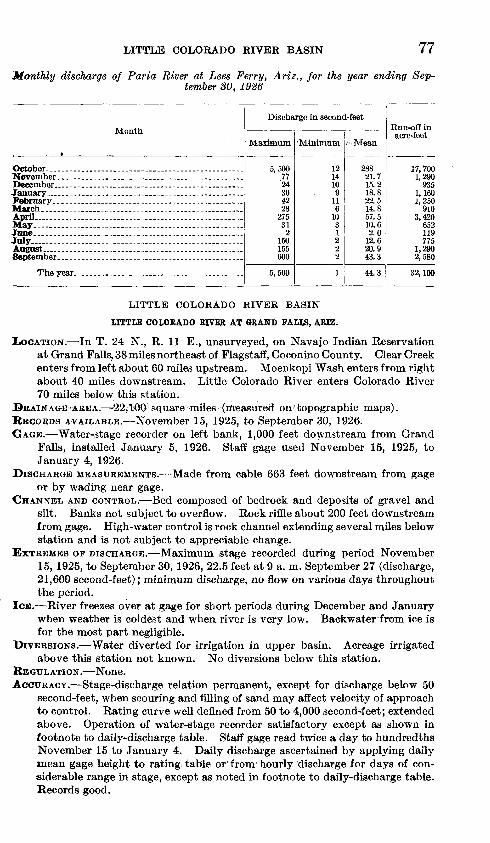
LITTLE COLORADO EIVEE BASIN 77
Monthly discharge of Paria River at Lees Ferry, Ariz., for the year ending Sep tember SO, 1926
Month
March...................................................April .- .. May -.... ..... ............. .......................
July August
Discharge in second-feet
Maximum
5,500 77 24 30 42 28
275 31 2
150 155 600
5,500
'Minimum
12 14 10 9
11 6
10 3 1 2 2 2
1
Mean
288 21.7 15.2 18.8 22.5 14.8 57.5 10.6 2.0
12.6 20.9 43.3
44.3
Run-off in acre-feet
17,700 1,290
935 1,160 1,250
910 3,420
652 119 775
1,290 2,580
32,100
LITTLE COLORADO RIVER BASIN
LITTLE COLORADO RIVER AT GRAND FALLS, ARIZ.
IIOCATION. In T. 24 N., R. 11 E., unsurveyed, on Navajo Indian Reservation at Grand Falls, 38 miles northeast of Flagstaff, Coconino County. Clear Creek enters from left about 60 miles upstream. Moenkopi Wash enters from right about 40 miles downstream. Little Colorado River enters Colorado River 70 miles below this station.
DRAINAGE ARfcA. 22,100''square miles (measured on topographic maps).RECORDS AVAILABLE. November 15, 1925, to September 30, 1926.GAGE. Water-stage recorder on left bank, 1,000 feet downstream from Grand
Falls, installed January 5, 1926. Staff gage used November 15, 1925, to January 4, 1926.
DISCHARGE MEASUREMENTS. Made from cable 663 feet downstream from gage or by wading near gage.
CHANNEL AND CONTROL. Bed composed of bedrock and deposits of gravel and silt. Banks not subject to overflow. Rock riffle about 200 feet downstream from gage. High-water control is rock channel extending several miles below station and is not subject to appreciable change.
EXTREMES OF DISCHARGE. Maximum stage recorded during period November 15, 1925, to September 30, 1926, 22.5 feet at 9 a. m. September 27 (discharge, 21,600 second-feet); minimum discharge, no flow on various days throughout the period.
ICE. River freezes over at gage for short periods during December and January when weather is coldest and when river is very low. Backwater from ice is for the most part negligible.
DIVERSIONS. Water diverted for irrigation in upper basin. Acreage irrigated above this station not known. No diversions below this station.
REGULATION. None.ACCURACY. Stage-discharge relation permanent, except for discharge below 50
second-feet, when scouring and filling of sand may affect velocity of approach to control. Rating curve well defined from 50 to 4,000 second-feet; extended above. Operation of water-stage recorder satisfactory except as shown in footnote to daily-discharge table. Staff gage read twice a day to hundredths November 15 to January 4. Daily discharge ascertained by applying daily mean gage height to rating table or from hourly discharge for days of con siderable range in stage, except as noted in footnote to daily-discharge table. Records good.
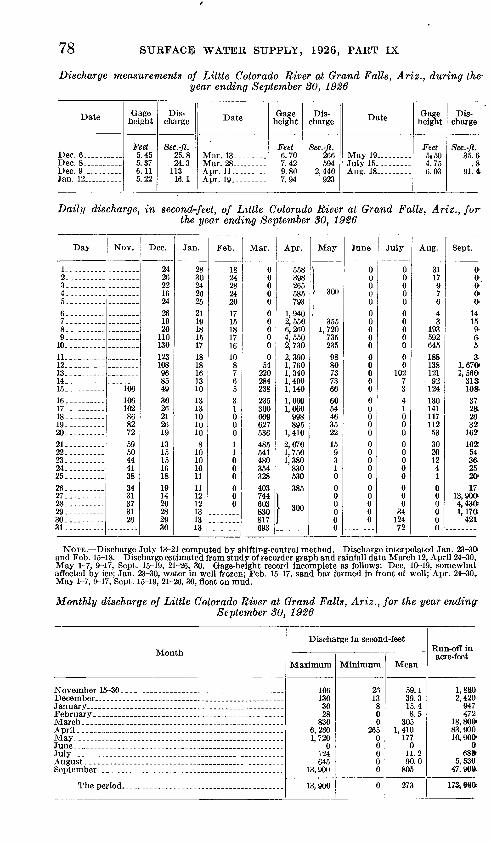
78 SURFACE WATER SUPPLY, 1926, PART IX
Discharge measurements of Little Colorado River at Grand Falls, Ariz., during the year ending September 30, 1926
Date
Dec 6Dec. 8--...----.Dec. 9-__ _ .Jan. 12__.___-
Gage height
Feet 5.455.376.115.22
Dis charge
Sec.-ft. 25.824.3
11316.1
Date
Mar. 28Apr. 11. .....Apr. 19... ......
Gage height
Feet
7.429.80
Dis charge
Sec.-ft.
594
923
Date
May 19July 15... ...Aug. 18... ......
Gage height
Feet 5.504.756.03
Dis charge
Sec.-ft. 35.6
.891 4
Daily discharge, in second-feet, of Little Colorado River at Grand Falls, Ariz., for the year ending September 80, 1926
Day
12345
789
1011_. ...... -.12.-. 13-. 14.. 1516. 17- 18
20- 212223. -------2425. 26- 27. 28293031
Nov.
10610610286827259504441383431373126
Dec.
242622
24261920
110130123108968549302621261913
151618191420282930
Jan.
2830242625211910
1117181816111010
13101010
810101011
12131313
Feb.
1 Q
f)A
28242017
10
171610
8
65
0001000000
Mar.
00000000000
220OQd.
238235inn
627536485CA-t
480354328403744603830
693
Apr.
CCQ
one
CQC
793
2,5506,260
2,7309 ^IQfi
1,340
1,1401,0601,060
998QQK
2,0701,7501,380
830530385
i 300
May
,
> 300
1355
1,720
235no
80737366605446352215g310
000000
June
000000000000000000000000000000
July
000000000000
10273
100000000000
3412472
Aug.
01
76
31Q1
592645188
121- 92
124ion
14111711253302012
41000000
Sept.
000O0-
1415
6-5^
1,560313;10*17
28.2632
J62102Tid3ft2520*17
13, 900>4,430>1,17ft
421
NOTE. Discharge July 13-21 computed by shifting-control method. Discharge interpolated Jan. 23-30" and Feb. 15-18. Discharge estimated from study of recorder graph and rainfall data March 12, April 24-30, May 1-7, 9-;17, Sept. 15-19, 21-26, 30. Gage-height record incomplete as follows: Dec. 10-19, somewhat affected by ice; Jan. 23-30, water in well frozen; Feb. 15-17, sand bar formed in front of well; Apr. 24-30, May 1-7, 9-17, Sept. 15-19, 21-26, 30, float on mud.
Monthly discharge of Little Colorado River at Grand Falls, Ariz., for the year endingSeptember 80, 1926
Month
November 15-30 . . - _DecemberJanuaryFebruaryMarchAprilMayJuneJulyAugust. .. .._- ... . _ _
The period.
Discharge in second-feet
Maximum
106 130 30 28
830 6,260 1,720
0 124 645
13,900
13, 900
Minimum
28 13 8 0 0
265 0 0 0 0 0
0
Mean
59.1 39.3 15.4 8.5
305 1,410
177 0
11.2 90.0
805
273
Run-off in acre-feet
1, 88ft 2, 420
947 472
18,800- 83,900 10,900-
0 68ft
5,530 47.90&
173> <W»
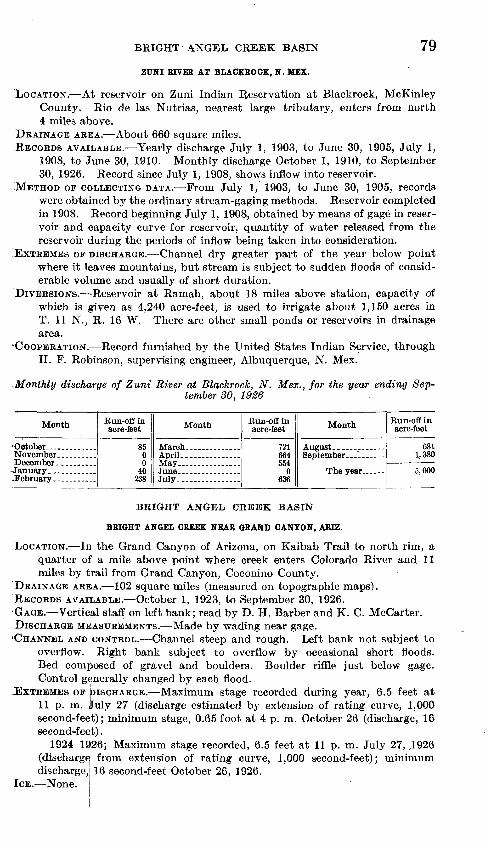
BRIGHT ANGEL CREEK BASIN 79ZTTNI RIVER AT BLACKROCK, N. HEX.
LOCATION. At reservoir on Zuni Indian Reservation at Blackrock, McKinley County. Rio de las Nutrias, nearest large tributary, enters from north 4 miles above.
DRAINAGE AREA. About 660 square miles.'RECORDS AVAILABLE. Yearly discharge July 1, 1903, to June 30, 1905, July 1,
1908, to June 30, 1910. Monthly discharge October 1, 1910, to September 30, 1926. Record since July 1, 1908, shows inflow into reservoir.
^METHOD OF COLLECTING DATA. From July 1, 1903, to June 30, 1905, records were obtained by the ordinary stream-gaging methods. Reservoir completed in 1908. Record beginning July 1, 1908, obtained by means of gage in reser voir and capacity curve for reservoir, quantity of water released from the reservoir during the periods of inflow being taken into consideration.
^EXTREMES OP DISCHARGE. Channel dry greater part of the year below point where it leaves mountains, but stream is subject to sudden floods of consid erable volume and usually of short duration.
-DIVERSIONS. Reservoir at Ramah, about 18 miles above station, capacity of which is given as 4,240 acre-feet, is used to irrigate about 1,150 acres in T. 11 N., R. 16 W. There are other small ponds or reservoirs in drainage area.
COOPERATION. Record furnished by the United States Indian Service, through H. F. Robinson, supervising engineer, Albuquerque, N. Mex.
.Monthly discharge of Zuni River at Blackrock, N. Mex., for the year ending Sep tember SO, 1926
Month
October .............November...... ....
-February.. ........
Run-off in acre-feet
8500
40238
Month
April-. -
July--- .........
Run-off in acre-feet
721664KKA
636
Month Run-off in acre-feet
6811,380
5,000
BRIGHT ANGEL CREEK BASIN
BRIGHT ANGEL CREEK NEAR GRAND CANYON, ARIZ.
"LOCATION. In the Grand Canyon of Arizona, on Kaibab Trail to north rim, aquarter of a mile above point where creek enters Colorado River and 11miles by trail from Grand Canyon, Coconino County.
DRAINAGE AREA. 102 square miles (measured on topographic maps). RECORDS AVAILABLE. October 1, 1923, to September 30, 1926. GAGE. Vertical staff on left bank; read by D. H. Barber and K. C. McCarter. DISCHARGE MEASUREMENTS. Made by wading near gage.
'CHANNEL AND CONTROL. Channel steep and rough. Left bank not subject tooverflow. Right bank subject to overflow by occasional short floods.Bed composed of gravel and boulders. Boulder riffle just below gage.Control generally changed by each flood.
EXTREMES OP DISCHARGE. Maximum stage recorded during year, 6.5 feet at11 p. m. July 27 (discharge estimated by extension of rating curve, 1,000second-feet); minimum stage, 0.65 foot at 4 p. m. October 26 (discharge, 16second-feet).
1924-1E26; Maximum stage recorded, 6.5 feet at 11 p. m. July 27, 1926(discharge from extension of rating curve, 1,000 second-feet); minimumdischarge, 16 second-feet October 26, 1926.
ICE. None.
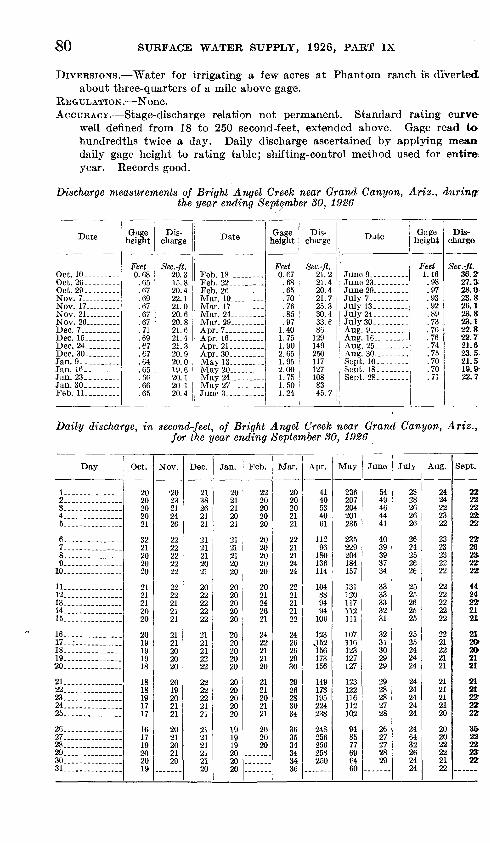
80 SUEFACE WATEK SUPPLY, 1926, PART IX
DIVERSIONS. Water for irrigating a few acres at Phantom ranch is diverted; about three-quarters of a mile above gage.
REGULATION. None.ACCURACY. Stage-discharge relation not permanent. Standard rating curve
well defined from 18 to 250 second-feet, extended above. Gage read to hundredths twice a day. Daily discharge ascertained by applying mean daily gage height to rating table; shifting-control method used for entire year. Records good.
Discharge measurements of Bright Angel Creek near Grand Canyon, Ariz., during; the year ending September 30, 1926
Date
Oct. 10-
Oct. 29.... . .Nov. 7 ...Nov. 17 Nov. 21 Nov. 26 _ .. ....Dec. 7... .......
Dec. 24 .........
Jan. 9. ........
Jan. 30 . ......Feb. 11
Gage height
Feet 0.68
.67
.69
.67
.67
.67
.71
.69
.67
.64
.65
Dis charge
Sec.-ft. 20.3
20.499 1
20.620.821.6
21.3
20.0
20.1
20.4
Date
Feb. 18 Feb. 22 ......Feb. 26. ...... ..
May 13-.- -
May 27... ......
Gage height
Feet 0.67
.68
.65
.70
.76
.85
.971.401.751.902.651.952.001.751.501.24
Dis charge
Sec.-ft. 21.221.420.421.725.330.433.686
1291492501171271088345.7
Date
June 29 .. ....July 7 .
July 30- Aug. 9.. ........Aug. 16 - Aug. 25
Sept. 10-. Sept. 18_ .......
Gage height
Feet 1.16.98.97.93.92.89.73.76.76.74.75.70.70.71
Dis charge
Sec.-ft. 36.227.328. 023.826.123.823.122.822.721.623.521.519. 9>22.7
Daily discharge, in second-feet, of Bright Angel Creek near Grand Canyon, Ariz.,. for the year ending September 30, 1926
Day
1 -23 4___ 5 .. .
6... ........ ....T. ..............8 ..... .....9 10
11... . _ ...12 13.. ....... ......14......... ......15
16. .. . . .17 .- .18 19. ..20
21 22..... ........23 2425 .
26...... _ ...27. 28 . .29 .... ........30....... ........31
Oct.
on
2021
00
21202020
21212020
2019191918
181819
17
16
1Q
2019
Nov.
212426
22
22
21
21
on
20
19
21
20
on
2120
Dec.
3826
91
91
2120
9ft
21212122
99
22
91
21
21
20
Jan.
20
20
21212020
20
202020
20
202020
20209ft9ft
20
191Q
1Q
2020
Feb.
2220
2020
202020
20
20
242621
2422212120
212120
21
9ft
2020
Mar.
2020
21
2221212424
2121
2426262930
292628
34
363504
343436
Apr.
4140534061
11296180136114
104889494106
123J52156173156
149173195224238
256
258250
May
236207204201235
235229204184157
131120117112111
107116123127127
123122116112102
948577696460
June
5449464441
4039393734
3333333231
3231302929
2928282728
2627272829
July
2828262626
2624252626
2525262525
2525242424
2424242424
246432262424
Aug.
2424222322
2323232222
2222222222
2221222121
2121212120
202022222122
Sept.
22:222222;22
22262a2222
4424222121
2120>202121
2121222222
35.22222322
VIRGIN EIVEE BASIN 81
Monthly discharge of Bright Angel Creek near Grand Canyon, Ariz., for the yearending September 80, 1926
Month
December _____ ...... ___^____
February __________________________
May _ .- ______ _ .............June __________________________ ... .July......................................................August _ .. _ .. _____ ...... _ .......
Discharge in second-feet
Maximum
32 26 38 21 26 36
258 236
50 64 24 44
258
Minimum
16 19 20 19 20 2Q 40 60 26 24 20 20
16
Mean
19.7 21.2 21.9 20.1 20.9 26.2
146 139 33.8 26.5 21.8 23.1
43.4
Run-off in acre-feet
1,210 1,260 1,350 1,240 1,160 1,610 8,690 8,550 2,010 1,630 1,340 1,370
31,400
VIRGIN RIVEE BASIN
VIRGIN RIVER AT VIRGIN. UTAH
LOCATION. In NW.-}£ sec. 27 or NE. }£ sec. 28, T. 41 S., R. 12 W., a few hundred feet above point where river enters a steep, narrow gorge and three-quarters of a mile west of Virgin, Washington County.
DRAINAGE AREA. 1,010 square miles (measured on topographic map).RECORDS AVAILABLE. April 18, 1909, to September 30, 1926; fragmentary.
Prior to February, 1915, the station was half a mile above Virgin where the flow is practically the same as at present site.
GAGE. Chain gage on right bank near lower end of sandstone bluff; read by Lawrence Earl.
DISCHARGE MEASUREMENTS. Made by wading or from highway bridge 7 miles below gage.
CHANNEL AND CONTROL. Bed consists of sand and gravel. Right bank high; left bank low and is overflowed. One channel at all stages. Principal control is a gravel bar a short distance below gage; shifting.
EXTREMES OF DISCHARGE. Not determined for this year.1909-1926: Maximum stage recorded, 11.6 feet at upper station October
27, 1912 (discharge estimated, 12,000 second-feet). Minimum discharge, 24 second-feet, July 1, 2, 4, and 5, 1909.
ICE. Stage-discharge relation rarely affected by ice.DIVERSIONS. Above all important diversions.REGULATION. None.ACCURACY. Stage-discharge relation not permanent. Rating curve poorly
defined. Gage read to hundredths three or four times a week. Daily discharge ascertained by applying gage height to rating table, using shifting- control method and interpolating or estimating discharge for days when gage was not read. Records poor.
Discharge measurements of Virgin River at Virgin, Utah, during the year endingSeptember 30, 1926
Date
Dec. 14.......................May T.. ......................
Gage height
Feet 2.983.34
Dis charge
Sec.-ft. 137564
Date
Aug. ^l...... .................
Gage height
Feet 2.612.45
Dis charge
Sec.-ft.
61.5
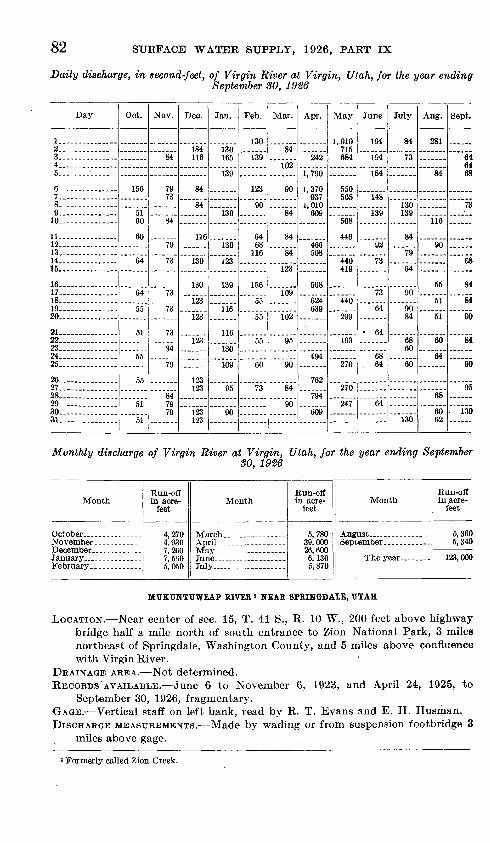
0.4 SURFACE WATER SUPPLY, 1926, PART IX
Daily discharge, in second-feet, of Virgin River at Virgin, Utah, for the year endingSeptember 80, 1926
Day
!__-. ___ ______23 4..---._. _ _ _5.-.-. -------
6-.. . -_7 _ 8_ . _______9__ _-. .10 _.___-
11 12 13 -14 ...15 ..
16. 17 18 19. _ 20
21 __22........ ...... .23__ _ ___._._._24.-.. _...._-.__25. .___
26 . 27. . ___..._28 __._.___29 ___.-_30 _.___31.. -__.____._
Oct.
156
5160
60
64
64
51
55
55
K1
Nov.
84
7973
84
79
73
73
73
73
84
7Q
847979
Dec.
184116
84
R4
116
130
130
123
123
123
Jan.
130165
ion
123
116
116
130
inn
95
on
Feb.
130 IOQ
123
on
fi-t68
156
55
55
KK
60
70
Mar.
84
102
90
84
84
S4.
123
109
102
95
90
S4
90
Apr.
242
1 7Gf|
Q07
1,010
Afifi
508
624639
494
762
794
May
1,010715GQA
K«C
508
AAR
440419
4.4.0
299
193
270
270
247
June
194
1Q4.
184
148
139
92
73
73
64
64
6864
64
July
84l-ro
130139
84
79
64
90
9084
6860
60
130
Aug.
281
84
116
on
55
51
51
60
64
68
6062
Sept.
fiA
fid
68
73
68
84
84
90
84
90
95
. 130
Monthly discharge of Virgin River at Virgin, Utah, for the year ending September80, 1926
Month
November.... ______
Run-off in acre-
feet
4,2704,9307,260
5,050
Month
April__-__ ____________May,- ___._- -----
July __ ________-
Run-off in acre-
feet
5,78039,000
6,1305, 870
Month
September- _ __ _ _.
Run-off in acre-
feet
5,3605,340
123,000
MUKUNTUWEAP EIVEB 2 NEAR SPKIWGDAIE, UTAH
LOCATION. Near center of sec. 15, T. 41 S., R. 10 W., 200 feet above highway bridge half a mile north of south entrance to Zion National Park, 3 miles northeast of Springdale, Washington County, and 5 miles above confluence with Virgin River.
DRAINAGE AREA. Not determined.RECORDS AVAILABLE. June 6 to November 6, 1923, and April 24, 1925, to
September 30, 1926, fragmentary. TAGE. Vertical staff on left bank, read by R. T. Evans and E. H. Husman.DISCHARGE MEASUREMENTS. Made by wading or from suspension footbridge 3
miles above gage.
2 Formerly called Zion Creek.
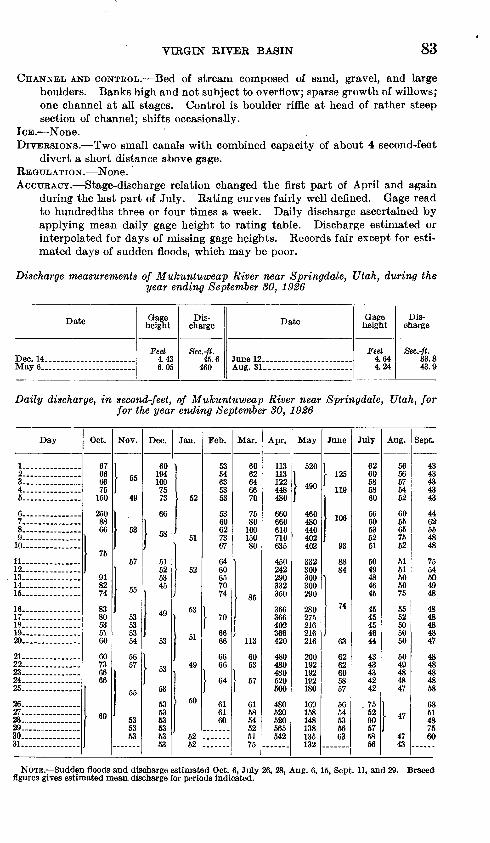
VIRGIN RIVER BASIN 83
CHANNEL AND CONTROL. Bed of stream composed of sand, gravel, and large boulders. Banks high and not subject to overflow; sparse growth of willows; one channel at all stages. Control is boulder riffle at head of rather steep section of channel; shifts occasionally.
ICE. None.DIVERSIONS. Two small canals with combined capacity of about 4 second-feet
divert a short distance above gage.REGULATION. None.ACCURACY. Stage-discharge relation changed the first part of April and again
during the last part of July. Rating curves fairly well defined. Gage read to hundredths three or four times a week. Daily discharge ascertained by applying mean daily gage height to rating table. Discharge estimated or interpolated for days of missing gage heights. Records fair except for esti mated days of sudden floods, which may be poor.
Discharge measurements of Mukuntuweap River near Springdale, Utah, during the year ending September SO, 1926
Date
Dec. 14.... _ .....May 6 . ._ .__
Gage height
Feet 4.436.05
Dis charge
Sec.-ft. 45 6
460
Date
Aug. 31--. _ .... _ .... __ .
Gage height
Feet 4.644.24
Dis charge
Sec.-ft. 83.843.9
Daily discharge, in second-feet, of Mukuntuweap River near Springdale, Utah, for for the year ending September SO, 1926
Day
1.. ........ __ .2.... _ ........3........ ___ .4.. __ .........5...... .........
6 _ ............7...............8. ...........9.. __ ........10 ...... ......
11. . ...... ....12...............13.. _ ..........14...............15 ......
16 _ ............17 ...........18 _ ............19 _ ............20 ............
21........ _ ....22.. _ ....... ...23 __ .. __ . _ .24 ............25 . _ ........
26........ _ ....27.. ___ .......28...............29.......... _ ..30. .........31 ............
Oct.
67666675150
2508866
75
918274
8380535160
60736666
60
Nov.
1-49
\ 53
57
55
53535354
5657
55
535353
Dec.
601941007573
66
58
51525345
49
53
11
53
535353535353
Jan.
52
11
19
53
51
49
50
5252
Feb.
5314635353
5360627367
6460657074
1-6666
6666
I ft*1 01
616160
Mar.
6062646670
758010015080
85
113
6053
I .7r6158KA
525175
Apr.
113113122448480
660660610710635
450242290332350
366366402366420
480480480520500
480520520565542
May
520
i 4901
4fin4sn440
332300300300290
28097R
21691 fi216
200192192192180
IfiQ158148138135132
June
}1 125
119
106
03
8884
74
63
62626058K7
5654535663
July
6260585860
5660535251
5049484645
4545454644
4343434242
. 7552Of)
575856
Aug.
5656575452
6055657552
5151505075
5552505050
5049484847
1"4743
Sept.
4343434343
4462554848
7554504948
4848484847
4848484858
6851487560
NOTE. Sudden floods and discharge estimated Oct. 6, July 26, 28, Aug. 6,15, Sept. 11, and 29. Braced figures gives estimated mean, discharge for periods indicated.
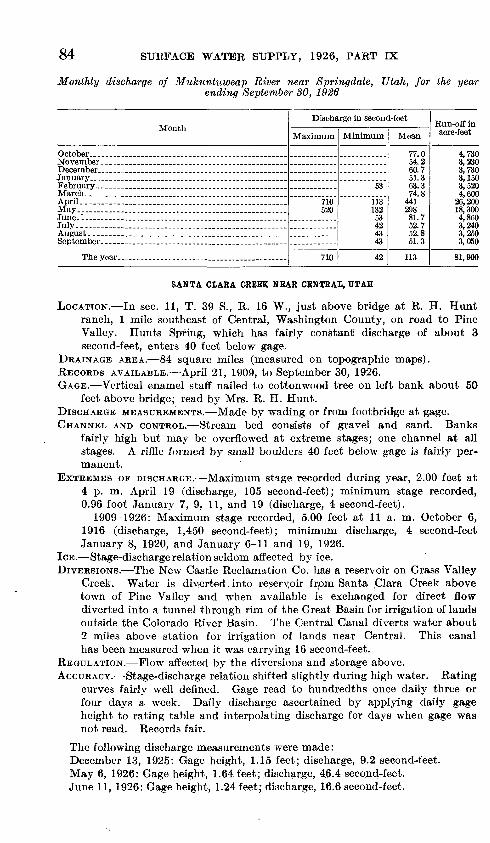
84 SURFACE WATER SUPPLY, 1926, PART IX
Monthly discharge of Mukuntuweap River near Springdale, Utah, for the yearending September 30, 1926
Month
November. __________ .. __ .. .........
January _ . _ .. . . ...... . .... ......February.. ___________ ___ __ .....
April.. ..................................................
June.'. ______ _ .. __ _ - .. ....July.....................................................
September.. ___ _ _ __ .. ___ .. __ .
Discharge in second-feet
Maximum
710 520
710
Minimum
53
113 132 53 42 43 43
42
Mean
77.0 54.2 60.7 51.3 63.3 74.8
441 298 81.7 52.7 52.8 51.3
113
Run-off in acre-feet
4,730 3,230 3,730 3,150 3,520 4,600
26,200 18,300 4,860 3,240 3,250 3,050
81,900
SANTA CIARA CREEK NEAR CENTRAL, UTAH
LOCATION. In sec. 11, T. 39 S., R. 16 W., just above bridge at R. H. Hunt ranch, 1 mile southeast of Central, Washington County, on road to Pine Valley. Hunts Spring, which has fairly constant discharge of about 3 second-feet, enters 40 feet below gage.
DRAINAGE AREA. 84 square miles (measured on topographic maps).RECORDS AVAILABLE. April 21, 1909, to September 30, 1926.GAGE. Vertical enamel staff nailed to cottonwood tree on left bank about 50
feet above bridge; read by Mrs. R. H. Hunt.DISCHARGE MEASUREMENTS. Made by wading or from footbridge at gage.CHANNEL AND CONTROL. Stream bed consists of gravel and sand. Banks
fairly high but may be overflowed at extreme stages; one channel at all stages. A riffle formed by small boulders 40 feet below gage is fairly per manent.
EXTREMES OP DISCHARGE. Maximum stage recorded during year, 2.00 feet at 4 p. m. April 19 (discharge, 105 second-feet); minimum stage recorded, 0.96 foot January 7, 9, 11, and 19 (discharge, 4 second-feet).
1909-1926: Maximum stage recorded, 5.00 feet at 11 a. m. October 6, 1916 (discharge, 1,450 second-feet); minimum discharge, 4 second-feet January 8, 1920, and January 6-11 and 19, 1926.
ICE. Stage-discharge relation seldom affected by ice.DIVERSIONS. The New Castle Reclamation Co. has a reservoir on Grass Valley
Creek. Water is diverted, into reseryoir from Santa Clara Creek above town of Pine Valley and when available is exchanged for direct flow diverted into a tunnel through rim of the Great Basin for irrigation of lands outside the Colorado River Basin. The Central Canal diverts water about 2 miles above station for irrigation of lands near Central. This canal has been measured when it was carrying 16 second-feet.
REGULATION. Flow affected by the diversions and storage above.ACCURACY. Stage-discharge relation shifted slightly during high water. Rating
curves fairly well defined. Gage read to hundredths once daily three or four days a week. Daily discharge ascertained by applying daily gage height to rating table and interpolating discharge for days when gage was not read. Records fair.
The following discharge measurements were made: December 13, 1925: Gage height, 1.15 feet; discharge, 9.2 second-feet. May 6, 1926: Gage height, 1.64 feet; discharge, 46.4 second-feet. June 11, 1926: Gage height, 1.24 feet; discharge, 16.6 second-feet.
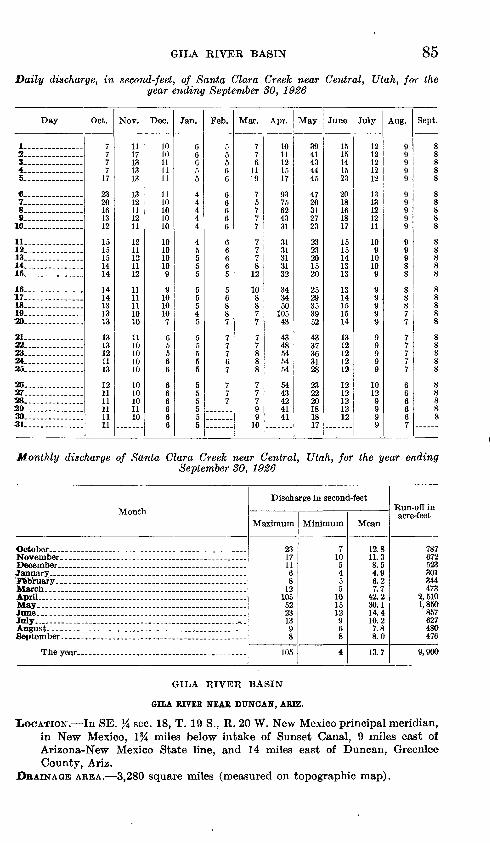
GILA EIVEE BASIN 85
Daily discharge, in second-feet, of Santa Clara Creek near Central, Utah, for the year ending September 80, 1926
Day
1 _ ... ... .23 _ . ...4...... .5
7 _ .8 ... ft 10
11 ___ ... _ ....
13 _ ....... 14 .......15
16 _ .... ..... ...17 18 19 20
21 _ ..... .22 _ ...... ......23 24 _ .35
26 _ 27 _2829_ .... ..30 31
Oct.
7
7717
2320161312
1515
14
14
131313
1113121113
12
1111
Nov.
11171310.
1 *.
1 *.
11
1211121110
1111111010
1110101010
1010101110
Dec.
10101111111110101010
10101010g
91010107
655
6
666
Jan.
6665K
4
4
K
5
5K
4
5
5K
5
55
5
Feb.
5
566
66
6
65
568
7
77767
777
Mar.
776
75
77
777812
108877
77888
7779910
Apr.
1011121517
QO.
7562
01
01
31313100
343450
1054.0.
4854
54
544.0.
424141
May
394143
45
4720312723
2323201520
25on
3539CO
07
36Q1
28
2399
20181817
June
15141523
2018161817
1515
1310.
13
151 *,
14
12121212
12121212
July
1212
1312
11
1091010g
999g
9999
10
9g9
Aug.
g99g9
g99g9
9g88
88877
7777
6
6
7
Sept.
88888
88888
88888
88888
88888
88888
Monthly discharge of Santa Clara Creek near Central, Utah, for the year endingSeptember SO, 1926
Month
May
July...... - .. _..-..
The year _________________________
Discharge in second-feet
Maximum
23 17 11 6 8
12 105
52 23 13 9 8
105
Minimum
7 10
5 4 5 5
10 15 12 9 6 8
4
Mean
12.8 11.3 8.5 4.9 6.2 7.7
42.2 30.1 14.4 10.2 7.8 8.0
13.7
Run-off in acre-feet
787 672 523 301 344 473
2,510 1,850
857 627 480 476
9,900
GILA RIVER BASIN
GILA RIVER NEAR DUNCAN, ARIZ.
IK>CATION. In SE. % sec. 18, T. 19 S., E. 20 W. New Mexico principal meridian, in New Mexico, \% miles below intake of Sunset Canal, 9 miles east of Arizona-New Mexico State line, and 14 miles east of Duncan, Greenlee County, Ariz.
DRAINAGE ABEA. 3,280 square miles (measured on topographic map).
86 SURFACE WATER SUPPLY, 1926, PART IX
RECORDS AVAILABLE. Discharge measurements only, January 10, 1923, to» September 30, 1926. Miscellaneous measurements were made near this point from April 24 to November 21, 1922. Recording gage station 2 miles- upstream maintained May 1, 1914, to September 30, 1915.
GAGE. None.DISCHARGE MEASUREMENTS. Made by wading near road crossing from old town
of San Antonio.CHANNEL AND CONTROL. Bed composed of sand and silt. Banks not well
defined; subject to overflow. No well-defined control.DIVERSIONS. Station is above diversions for irrigation in Duncan Valley, except
Sunset Canal, which diverts water \% miles above station for irrigating 1,800 acres. About 3,500 acres are irrigated from Gila River above Duncan. Valley.
REGULATION. None except by diversions for irrigation.ACCURACY. No gage heights obtained. Discharge measurements only-
Records show inflow to Duncan Valley, except for water diverted by Sunset Canal.
Discharge measurements of Gila River near Duncan, Ariz., during the year ending- September 30,
Date
Oct. 1 . __Nov. 4.Dee. I..... ___ ...Jan. 5 _______
Discharge
Sec.-ft.7QO1
8494
Date
Feb. 6.._ Mar. 5 .... .
July 19....
Discharge
Sec.-ft. 66622.9
45.21
Date
Aug. 10.
Sept. 21.
Discharge
Sec<-ft. 15.11.7'36.4-
GHA RIVER AT YORK, ARIZ.
LOCATION. In SE. % sec. 19, T. 6 S., R. 31 E., below all canal headings in; Duncan Valley, at York, Greenlee County.
DRAINAGE AREA. 3,920 square miles (measured on topographic maps).RECORDS AVAILABLE. May 15,1923, to September 30,1926. Discharge measure
ments only. Miscellaneous measurements made near this point April 26* and July 19, 1922.
GAGE. None. NDISCHARGE MEASUREMENTS. Made by wading near road crossing.CHANNEL AND CONTROL. Bed composed of sand and gravel. Banks well"
defined, not subject to overflow. No well-defined control.DIVERSIONS. About 11,500 acres are irrigated from Gila River above this
station. Water for about 8,000 acres diverted by Duncan Valley canals..REGULATION. None except by diversions for irrigation.ACCURACY. No gage heights obtained. Discharge measurements only..
Records show outflow from Duncan Valley, below all diversions.
Discharge measurements of Gila River at York, Ariz., during the year ending Sep tember 30, 1926
Date
Oct. 4 ...........Nov. 5. .
Discharge
Sec.-ft. 54
10772
Date
Feb. 7. _ ...TV/far 7
Discharge
Sec.-ft. 1337782
Date
Aug. 12...... ....Aug. 30. _____ ...
Discharge
Sec.-ft. 36.38.8
25. &
GILA RIVER BASIN 87
GILA RIVER NEAR SOLOMONSVILLE, ARIZ.
LOCATION. In NE. # sec. 31, T. 6 S., R. 28 E., 1 mile below intake of Brown Canal and 10 miles east of Solomonsville, Graham County. San Francisco River enters from right 10 miles upstream.
DRAINAGE AREA. 7,910 square miles (measured on topographic maps).RECORDS AVAILABLE. April 21, 1914, to September 30, 1926. GAGE. Water-stage recorder on left bank, directly opposite J. W. Earven
ranch; inspected by J. W. Earven.DISCHARGE MEASUREMENTS. Made from cable at gage or by wading near
gage.CHANNEL AND CONTROL. Bed composed of gravel, sand, and silt. Left bank
high and not subject to overflow. Right bank low and may be overflowed during large floods. Gravel riffle 500 feet downstream from gage.
EXTREMES OF DISCHARGE. Maximum stage during year, from water~stage recorder, 4.58 feet at 1.30 a. m. April 7 (discharge, 5,660 second-feet); minimum stage, from water-stage recorder, 1.08 feet at 5.30 p. m. September 6 (discharge, 57 second-feet).
1914-1926: Maximum stage, determined from floodmarks on gage, 14.0 feet January 19, 1916 (discharge, about 100,000 second-feet from extension of rating curve); minimum discharge, 26 second-feet July 4, 1923.
DIVERSIONS. Station is above diversions for irrigation in Safford Valley, except Brown Canal which diverts water 1 mile above station for irrigating 820 acres. Brown Canal waste way returns some water to river below this station. About 14,000 acres is irrigated from Gila River and tributaries above Safford Valley.
REGULATION. None except by diversions for irrigation.ACCURACY. Stage-discharge relation not permanent. Standard rating curve
well defined below 10,000 second-feet and extended above. Operation of water-stage recorder satisfactory except for a few short periods. Daily discharge ascertained by applying mean daily gage height to rating table, except as shown in footnote to table of daily discharge; shifting-control method used for the entire year. For days of considerable range in stage daily discharge determined from hourly discharge. Records good.
.Discharge measurements of Gila River near Solomonsville, Ariz., during the yearending September- SO, 1926
Date
Oct. 3... ....Nov. 11....- .Dec. 12.. .......
.Jan. 12 .........Feb. 4..........Mar. I.....
Gage height
Feet 1.211.541.471.571.42i 10
Dis charge
. Sec.-ft. 136221214223187122
Date
Mar. 24.........Apr. 16 Apr. 18 TVA'O-TT 9Q
Gage height
Feet 1.642.972.902.86
1.10
Dis-. charge
Sec.-ft. 318
1,9401,6001,460
38991
Date
July 17. .... .Aug. 8.. Aug. 28 Sept. 19-
Gage height
Feet 1.311.521.141.50
Dis charge
Sec.-ft. 12817567
182
88 SURFACE WATER SUPPLY, 1926, PART IX
Daily discharge, in second-feet, of Gila River near Solomonsville, Ariz., for the year ending September 30, 1926
Day
23 - . 4. ..............5
6 78- 9 ....... -
11 - 1213 - 14 __ ___ ______15------- .-.
16 ...
18 1920-
21__ _.22 ......... .23 2425
26--- .2728- 2930 -. - - -31
Oct.
133125133136136
133128120880
1,400478600650550
550
478428
375340
347360
375363352
319299
Nov.
278266255249238
226215204209
200
2049nnion186186
168i«4
168
160
Dec.
160
214272
224214204200
200
214209
200
1QC
200
1 Qfi
183
TOO
186TOO
219
Jan.
204001
368
266
244
9O9
99/1
214209209
2009nn200200
186100
1 7Q
179
17Q
Feb.
175186190186186
179179175
172172164153153
160160
153
147145
136
133131125
-.-.-.
Mar.
122125131136147
382730560512478
600530452405
368360347334314
314354334328321
553
249
3,9302,710
Apr.
1,8001,6101,5301,450
1,6404,3803,0302,840
1,8201,9802,0802,050
2,030
1,460
1,4301,380
1,320
1,4001,3701,400
1,940
May
1,700
1,4501,5801,480
1,6601,6601,480
1 2601,2301,090
958834
756
560494
469412360328328
368412390375347
June
289261228219
204190183168
136125122115110
108
96
9693918787
8789858585
July
82828280
102
139131118105
98
105433396261190
157
1089685
133105
485817
476494412340488412
Aug.
630460278200145
115123149118
373543278373347
659398272186153
136118
10087
747167656565
Sept.
6464606060
5&586063-
752
67234O33422817»
14716»21»1861 ""131115112105102
11848236&302266
NOTE. Recorder clock not running Oct. 13-17, 27-31, Nov. 5-7, and 12. Staff gage read Oct. 29. Dis charge for period Oct. 13-17 estimated from recorded range in stage and by comparison with record of Gila River near San Oarlos. Discharge interpolated Oct. 27-28, 30-31, Nov. 5-7, and 12.
Monthly discharge of Gila River near Solomonsville, Ariz., for the year endingSeptember 30, 1926
Month
October-__-__--_-_._. _.-... .... . _- _
December - . - -
March - - .April ...... .. ..- -. ... ..... . . - --May ----- _ . . . -
JulyAugust. ___ _ ........ --. . .-. _ ___
The year .... .... .-.
Discharge in second-feet
Maximum
1,400 278 272 382 190
3,930 4,380 1,700
321 817 659 752
4,380
Minimum
120 160 160 175 125 122
1,260 321
85 80 65 58
Mean
390 204 201 228 161 624
1,870 899 141 234 222 201
58 i 448
Run-off to acre-feet
24,000. 12,10O 12,400- 14,OOO 8,94ft
38,40O 111,000 55,30O 8,390
14,40» 13,60O 12,000.
325,000>
GILA RIVER NEAR ASHURST,
LOCATION. In sec. 30, T. 5 S., R. 24 E., below all canal headings in Safford Valley and 1% miles southeast of Ashurst, Graham County.
RECORDS AVAILABLE. December 24, 1920, to September 30, 1926.DIVERSIONS. About 38,000 acres is irrigated from Gila River and tributaries
above this station.
GILA EIVEE BASIN 89
Discharge measurements of Gila River near Ashurst, Ariz., during the year endingSeptember 30, 1926
Date
Oct. 2_ .........Nov. 14.. ___ .....Dec. 14... Jan. 10_. ............Feb. 5-.. -----.--._.
Discharge
Sec.-ft.27.849.752
30.5
Date
Feb. 26... .......... .Mar. 23,. ..........May 27 . ... .......
July 16.. ............
Discharge
Sec.-ft. 4.48.73.53.54.2
Date
Aug. 9... ...........Aug. 26. . . ..Sept. 18-
Discharge
Sec.-ft. 2.41.03.S
GILA RIVER NEAR SAN CARLOS, ARIZ.
LOCATION. In T. 3 S., R. 18 E., unsurveyed, half a mile above San Carlos dam site on San Carlos Indian Reservation and 6J4 miles west of San Carlos.
RECORDS AVAILABLE. April 29, 1914, to September 30, 1925. July 11, 1899, to November 27, 1905, at point half a mile south of San Carlos and below San Carlos River. August 17, 1910, to February 5, 1911, at point just below Arizona Eastern Railroad bridge and half a mile above San Carlos River.
GAGE. Water-stage recorder installed July 3, 1924, on right bank.EXTREMES OF DISCHARGE. Maximum stage during year, from water-stage
recorder, 11.9 feet at 10.30 p. m. April 6 (discharge, 9,960 second-feet): no flow July 8-10, August 31, and September 3-10.
1914-1926: Maximum stage, 25.5 feet January 20, 1916 (discharge estimated, 130,000 second-feet); minimum discharge, no flow June 28 to July 1, 1919, and July 8-10, August 31, September 3-10, 1926.
DIVERSIONS. About 38,000 acres is irrigated from Gila River and tributaries above this station.
ACCURACY. Stage-discharge relation not permanent; probably fairly permanent for high stages but changed for low stages by each flood. Daily discharge ascertained by shifting-control method. Records good.
Records of discharge for certain high-water periods in the years ending Sep tember 30, 1915 and 1916, revised on basis of a comparison, by means of hydro- graphs, of discharge at the San Carlos station with the discharge at the stations on Gila River near Solomonsville and at Kelvin, are given in the table on page 90. The revised records for the Kelvin station, published in this report and based on discharge measurements of the flood in 1926, were used in revising the records for the San Carlos station.
Discharge measurements of Gila River near San Carlos, Ariz., during the year ending September 30, 1926
Date
Nov. 10 Dec. 9 .... ...Jan. 10-.... .Jan. 14.........Feb. 2... ... ....Feb. 9... ... ....Feb. 24... ......Mar. 2---.-. ...Mar. 20 Mar. 29
Gage height
Feet 3.443.543.803.703.332.86
2.423.048.12
Dis charge
Sec.-ft. 187271303280
1075647.4
113
Date
Mar. 30
Apr. 13_______-_
May25
July 13-
Gage height
Feet 8.967.897.477.075.875.003 flfl
1.741.96
Dis charge
Sec.-ft. 3,7502,3401,9201,760
57092
.415.3
Date
July 21-.
Aug. 13 -.Anp 94
Sept. 14. .....
Sept. 27-.- -Sept. 28...
Gage height
Feet 1.483.082.282.312.172.721.744.984.27
Dis charge
Sec.-ft. 0.5
7426.55.5.8
61.7
563347
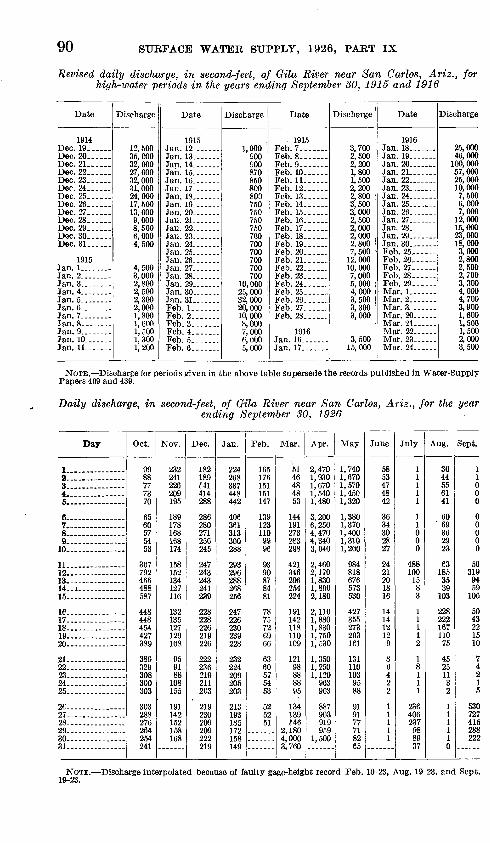
90 SURFACE WATER SUPPLY, 1926, PART IX
Revised daily discharge, in second-feet, of Gila River near San Carlos, Ariz., for high-water periods in the years ending September SO, 1915 and 1916
Date
1914 Dec. 19 ......Dec. 20 ......Dec. 21......Dec. 22 __ ..Dec. 23-. Dec. 24......Dec. 25... ...Dec. 26-- .
Dec. 28..
Dec. 31. .. ...
1915
Jan. 6 ........
Jan. 9... ..Jan. 10 Jan. 11
Discharge
12,50035,00032,00027,00032,00031,00024,00017,50013, 0009,0008,5006,0004,500
4,5003,0002,8002,5002,3002,0001,8001,6001,5001,3001,200
Date
1915 Jan. 12.......
Tfl-n 14
Jan. 17 ..
Tan 99
Feb. l.......Feb. 2.
Feb. 4.......Feb. 5. ......Feb. 6. ......
Discharge
1,000COOCftft
870850 i8008007507cn
7507507007007ftft
700700700
10,000OK ftflft
00 AAA
20,000 i10,0008 0007 000
5,000
Date
- 1915 Feb. 7 Feb. 8. ......Feb. 9- Feb. 10 Feb. 11......Feb. 12. Feb. 13. Feb. 14......Feb. 15. Feb. 16 Feb. 17 Feb. 18 Feb. 19... . Feb. 20--. Feb. 21. Feb. 22___ ...Feb. 23.
Feb. 26. Feb. 27.... ..Feb. 28
1916
Jan. 17.
Discharge
3,7002,5002,2001,8001,5002,2002,8003,5003,0002,5002,0002,0002,8007,500
12.00010,0007,0005,0004,0003,5003,3003,000
3,50015,000
Date
1916 Jan. 18 Jan. 19 .......Jan. 20 .......Jan. 21 .......Jan. 22 .......Jan. 23 .......Jan. 24 Jan. 25 Jan. 26 .......Jan. 27.......Jan. 28 Jan. 29 .......Jan. 30 .......Feb. 25... Feb. 26 Feb. 27 Feb. 28 Feb. 29....-Mar. l.... ...Mar. 2. .Mar. 3 Mar. 20 .Mar. 21 Mar. 22Mar. 23 Mar. 24......
Discharge
25,00046,000
100,00057,00025,00010,0007,5006,0007,000
12,00015,00023,00018,0003,0002,8002,5002,7003,3004,0004,7003,9001,6001,5001,5002,0003,500
NOTE. Discharge for periods given in the above table supersede the records published in Water-Supply Papers 409 and 439.
Daily discharge, in second-feet, of Gila River near San Carlos, Ariz., for the year ending September 30, 1926
Day
1.. 2 ... 3 4 ...5 _ .. .
6 ... 7. _8 -9 ... ... 10
11 - 12 13. - - 14 1 15
16 17 18 19 20
21 2223 24. ___ ..... ...25
2C27 28 .29 _ .30 31
Oct.
9988777370
6560575453
307792466488587
448448454427389
389DOQ
308300303
303288
264254241
Nov.
232241226209195
189178168168174
158152134127116
132135127129108
959188108155
191142
158168
Dec.
182189Ml414288
286280271256245
247
243241239
228228226
226
ooo
91 Q
2119O3
91 QoonOAQ
20922291 Q
Jan.
224268337448442
406361313300288
293
288268256
247226230239228
224209
203
213193185172158
Feb.
165176151151147
1391231109996
9390878481
7875726966
6360575453
52
51
Mar.
5146484853
144191273283298
421346296
224
191142118110109
12198888895
134139£46
4,0003,760
Apr.
2,4701,9301,6701,5401,480
3,2006,2504,4704,3403,040
2,4602,1701,8301,8902,180
1,8801,8301,7501,530
1,3501,2501,120
963903
887903
9591,500
May
1,7401,6701,5701,4501,320
1,3801,3701,4001,3101,200
984818676573530
427355273203161
1311101039588
919177718265
June
5853474842
3634302827
2421201816
141412
9
86
2
1
1
1
July
11111
11000
4881001583
11112
18111
236406237988937
Aug.
3644556141
60' 69
362923
631853539103
22822216711075
45251132
111110
Sept.
11000
00000
563199459106
5043221510
74215
530727415288222
NOTE. Discharge interpolated because of faulty gage-height record Feb. 10-23, Aug. 19-23, and Sept. 19-23.
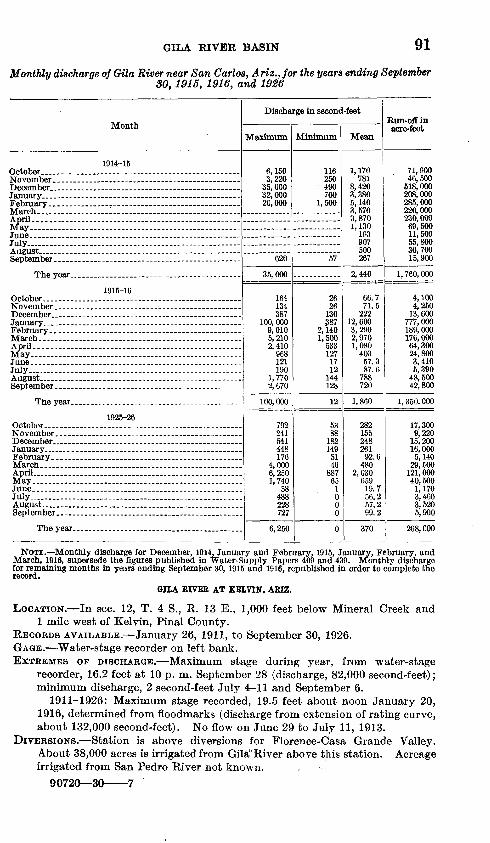
GILA RIVEB BASIN 91
Monthly discharge ofGila River near San Carlos, Ariz.,for the years ending SeptemberSO, 1915, 1916, and 1926
Month
1914-15
July-... . -
September.. ------ ,.
The year.. , _______ .. ___ .. ... .......
1915-16
July
The year. _____ _____ .. __ __ -.-. _ _..__
1925-26
April.....-................................... .........
July ... . . __ August _____________________________
Discharge in second-feet
Maximum
6,150 3,220
35,000 32,000 20,000
620
35,000
164 134 387
100,000 9,010 5,210 2,410
968 121 190
1,770 2,670
100,000
792 241 541 448 176
4,000 6,250 1,740
58 488 228 727
6,250
Minimum
116 250
490 700
1,500
57
26 26
130 ?87
2,140 1,500
533 127
17 12
144 128
12
53 88
182 149
51 46
887 65
1 0 0 0
0
Mean
1,170 781
8,420 3,380 5,140 3,570 3,870 1,130
193 907 500 267
2,440
66.7 71.5
222 12,600 3,290 2,970 1,080
403 57.3 87.6
788 720
1,860
282 155 248 261 92.6
480 2,030
659 19.7 56.2 57.2 99.2
370
Run-off in acre-feet
71,900 46,500
518,000 208,000 285,000 220,000 230, 000 69,500 11,500 55,800 30,700 15,900
1, 760, 000
4,100 4,250
13,600 777,000 189,000 176,000 64,300 24,800 3,410 5,390
48,500 42,800
1, 350, 000
17,300 9,220
15,200 16,000 5,140
29,500 121,000 40,600
1,170 3,460 3,520 5,900
268, COO
NOTE. Monthly discharge for December, 1914, January and February, 1915, January, February, and March, 1916, supersede the figures published in Water-Supply Papers 409 and 439. Monthly discharge for remaining months in years ending September 30,1915 and 1916, republished in order to complete the record.
GHA RIVER AT KELVIN. AEIZ.
LOCATION. In sec. 12, T. 4 S., R. 13 E., 1,000 feet below Mineral Creek and1 mile west of Kelvin, Final County.
RECORDS AVAILABLE. January 26, 1911, to September 30, 1926. GAGE. Water-stage recorder on left bank. EXTEEMES OP DISCHARGE. Maximum stage during year, from water-stage
recorder, 16.2 feet at 10 p. m. September 28 (discharge, 82,000 second-feet);minimum discharge, 2 second-feet July 4-11 and September 6.
1911-1926: Maximum stage recorded, 19.5 feet about noon January 20,1916, determined from floodmarks (discharge from extension of rating curve,about 132,000 second-feet). No flow on June 29 to July 11, 1913.
DIVERSIONS. Station is above diversions for Florence-Casa Grande Valley.About 38,000 acres is irrigated from Gila'River above this station. Acreageirrigated from San Pedro River not known.
90720 30 7
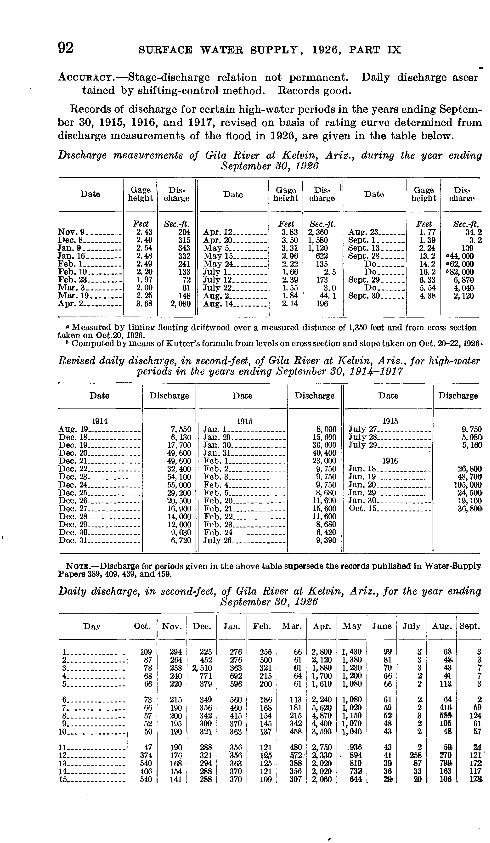
SURFACE WATER SUPPLY, 1926, PART IX
ACCURACY. Stage-discharge relation not permanent. Daily discharge ascer tained by shifting-control method. Records good.
Records of discharge for certain high-water periods in the years ending Septem ber 30, 1915, 1916, and 1917, revised on basis of rating curve determined from discharge measurements of the flood in 1926, are given in the table below.
Discharge measurements of Gila River at Kelvin, Ariz., during the year endingSeptember 30, 1926
Date
Nov. 9.. .......
Feb. 1 .... ...Feb. 10 Feb. 23 Mar. 3. .... .Mar. 19...
Gage height
Feet 2.432.402.542.482.492.201.972.002.253.68
Dis charge
Sec.-ft. 204315343qqo
241133
7261
1482,080
Date
Apr. 12 Apr. 20... ......
May 24.. .......July 1. ........ .July 12. July 22.... .....Aug. 2 .
Gage height
Feet 3.833.503.312.962.221.662.391.551.842.14
Dis charge
Sec.-ft. 2,3601,5801,120
622135
2.5173
3.044.1
196
Date
Aug. 23
Sept. 13
Do-Do
Do.......Sept. 30... ...
Gage height
Feet 1.771.392.24
14.216.26.335.544.38
Dis charge
Sec.-ft. 34.23.2
139"44,000"62,000'82,000
6,8704,0402,120
« Measured by timing floating driftwood over a measured distance of 1,350 feet and from cross section taken on Oct.20,1926.
* Computed by means of Kutter's formula from levels on cross section and slope taken on Oct. 20-22,1926-
Revised daily discharge, in second-feet, of Gila River at Kelvin, Ariz., for high-water periods in the years ending September 30, 1914 1917
Date
1914
Dec. 21 Dec. 22........ Dec. 23.--- ---Dec. 24... ... .....
Dec. 26 Dec. 27. ....
Dec. 31... .
Discharge
7,5506,130
49, 600
32,40054,10055,00029,200
16,900
12,0009,0306,720
Date
1915 Jan. 1 ....Jan. 29-. ._
Feb 1Feb. 2 .... -.Feb. 3 .... Feb. 4...- .... -
Feb. 21 -
Feb. 23 Feb. 24 _____ ....July 26 .... ...... -
Discharge
8,00015,60036, 60040,40023, 0009,7509,7509,7508,680
11,60015,60011,6008,6806,4209,390
Date
1915 July 27-. ....... ..July 28 ... ..... ...July 29 ... .... ... -
1916Jan. 18 ..............Jan. 19 Jan. 20- _ ..........Jan. 29 ..............
Oct. 15.-.-... __ .
Discharge
9,7505,9805,160
26,80048,700
105,00024,500
36,809
NOTE. Discharge for periods given in the above table supersede the records published in Water-Supply Papers 389, 409, 439, and 459.
Daily discharge, in second-feet, of Gila River at Kelvin, Ariz., for the year endingSeptember 30, 1926
Day
2 ...... 3 4. ....5 ... ... ...
6 7. 8 9 . .10.
11 12..... ..........13 14. 15 _ ............
Oct.
1098778
66
7366575250
47374540406540
Nov.
29426425894.ft
220
215190200195190
190176168154141
Dec.
225452
2,510771379
349356342300321
288321294288288
Jan.
276276363
596
560460415370363
3563*56
363370370
Feb.
500321
200
186168154145137
121125125121109
Mar.
6661616461
113181215342458
4805,72:388356307
Apr.
2,8002,1201,8801,7001,610
2,2405,6204,8704,4003,590
2,7502,3302,0202,0202,060
May
1,4301,3801,2301,2001,080
1,0801,0201,1501,0701,040
936. 894
810732644
June
9981706666
6159524843
434130362»
July
33322
22322
2258S73320
Aug.
6848.4a41
113,
64416sm106.48'
5ft270799,163
r 106
Sept.
33773
259
1246157
M121172117ITS
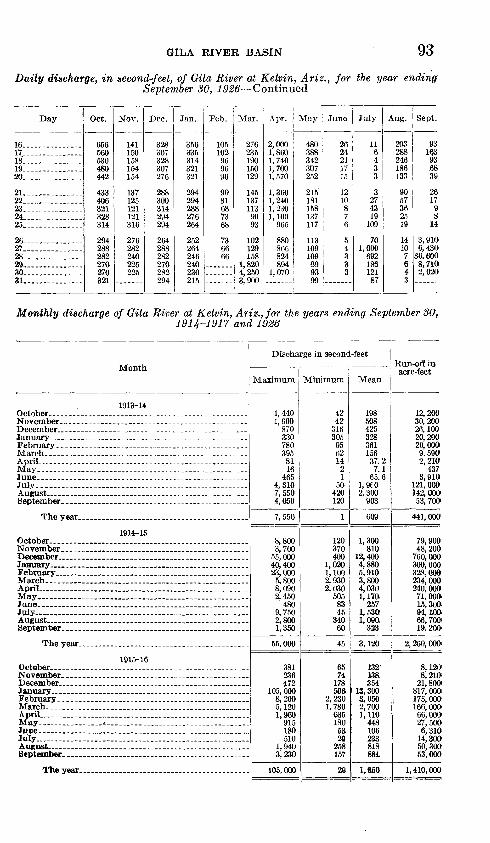
GILA RIVER BASIN \)6
Daily discharge, in second-feet, of Gila River at Kelvin, Ariz., for the year ending September 30, 1926 Continued
Day Oct. Nov. Dec. Jan. Feb. Mar. Apr. May 1 June July Aug. ' Sept.
16-17-18- 19.. 20-
21-22-23-24- 25..
26.27. 28-29..30. SI-
560530480442
433406321328314
294288282270270321
141150158154154
137125121121316
276282240225225
328307328307276
300314294294
264288282270282294
356335314321321
294294288276264
252264246240230215
105102
96
73
276235190150129
145137113
9093
102129158
1,8204,2503,900
2,0001,8601,7401,7001,570
1,3601,2401,2301,100
965
824894
1,070
388342307252
215181158137117
1131091099993
433
3274319
109
701,000
69218612187
203 I288246186133 39
14
3,9106,430
36,6008,7102,020
Monthly discharge of Gila River at Kelvin, Ariz., for the years ending September SO,1914-1917 and 1926
Month
Discharge in second-feet
Maximum Minimum Mean
Run-off in acre-feet
1913-14October___._________......--..-- .....- 1,440November___________._...___________ 1,900December____________ __ ___ _______ 870January.--..----------_-------------------------------- 330February.________...__. . ... . ... 780March..___.______...._ _ _ _- 395April -.. - - 81May __ 16June._______________________.____-.._ 465July.-___ . ... _. -.....-- 4,310August...__..._______.____....._... ....... 7, 550September__._.__...._ .... ... - 4,050
The year_____....___ _ ._ 7,550
1914-15October________....______.... _.... 8,800November..__________________________ 3,700December_______________....__.....___. 55,000January.___________________________ 40,400Febraary__________....___....__.... . 23,000March..______________________________ 5,800April________________________________ 8,090May_________________._______......._ 2,450June...___...._________._._.____....... 480July-_,______.__ 9,750August.___.______________.... __-. . 2,800September____________.______________ 1,350
The year . . ..- 55,000
1915-16October__________.__... ........ ...... 381November_____________._______.__ 236December______________..__. __.___-. 472January______________________._____ 105,000February_______________________.___ 8,200March- -__.... .... .. .. 5,120April_ ....... .__ 1,960May__---_-__L........... ................. 915JjHie ............................... 180July_______________......_......._--- 510August_______________________________ 1,940September__________________________ 3,230
The year_____....__....__.. ......_.- 105,000
4242
316305
956214
21
50420120
508 425 328 361 156 37.2 7.1
65.6 1, 9fO 2,300
903
120370400
1,0201,1002,9302,030
5058345
340
1,300810
12,4004,8805,9103,8004,0301,170
2571,53ft1,090.
323
45 3,120
6574
178506
2,2301,780
6351805329
258157
132'138354
13,3003,0502,7001,110
448106233,818
29
12,20030,20026,10020,20020,0009,5902,210
4373,910
121,000142, 00053,700
441,000
79,90048,200
760,. 000300,000328,000234,000240,00071,90015,30094,100-66,700)19,200'
2,260,000
8,1208,210
21,800817,000175,000!166,00066,00027,5006,310
14,30050,30053,000
1,410,000
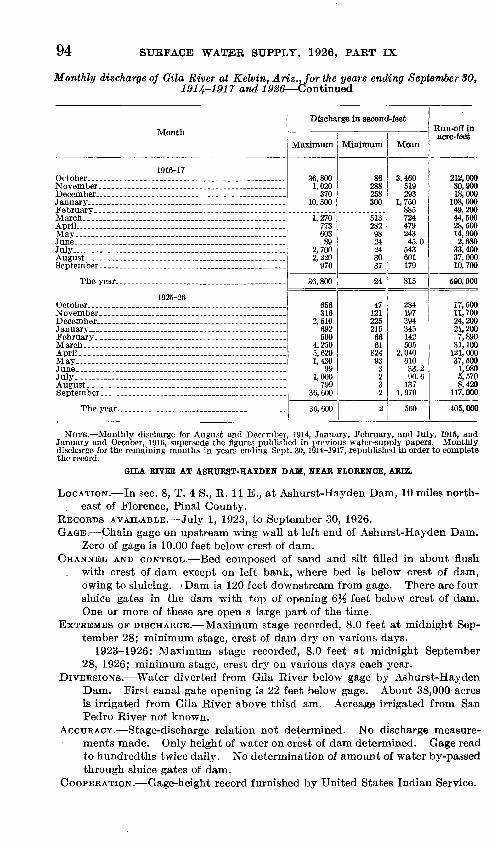
94 SURFACE WATER SUPPLY, 1926, PART IX
Monthly discharge of Gila River at Kelvin, Ariz.,forthe years ending September SO, 1914-1917 and 1926 Continued
Month
1916-17
July-. . .
The year ___ __ ... ____ ___ .. __ __ ....
1925-26
July.- .
September.. ___________________ .... ___ .
Discharge in second-feet
Maximum
36,800 1,020
370 10,500
1,270 773 603 89
2,700 2,220
970
36,800
656 316
2,510 692 500
4,250 5,620 1,430
99 1,000
799 36,600
36,600
Minimum
86 288 258 300
513 282
98 24 24 30 37
24
47 121 225 215
66 61
824 93
3 2 3 2
2
Mean
3,460 519 293
1,750 885 724 479 243 45.0
543 601 179
815
284 197 394 345 142 505
2,040 610 33.2 90.6
137 1,970
560
Run-off in acre-feet
212,000 30,900 18,000
108,000 49,200 44,500 28,500 14,900 2,680
33,400 37, 000 10, 700
590, 000
17,500 11,700 24,200 21,200 7,890
31,100 121,000 37, 500
1,980 5,570 8,420
117,000
405,000
NOTE. Monthly discharge for August and December, 1914, January, February, and July, 1915, and January and October, 1916, supersede the figures published in previous water-supply papers. Monthly discharge for the remaining months in years ending Sept. 30, 1914-1917, republished in order to complete the record.
GILA RIVER AT ASHURST-HAYDEN DAM, NEAR FLORENCE, ARIZ.
LOCATION. In sec. 8, T. 4 S., R. 11 E., at Ashurst-Hayden Dam, 10 miles north east of Florence, Final County.
RECORDS AVAILABLE. July 1, 1923, to September 30, 1926.GAGE. Chain gage on upstream wing wall at left end of Ashurst-Hayden Dam.
Zero of gage is 10.00 feet below crest of dam.CHANNEL AND CONTROL. Bed composed of sand and silt filled in about flush
with crest of dam except on left bank, where bed is below crest of dam, owing to sluicing. 'Dam is 120 feet downstream from gage. There are four sluice gates in the dam with top of opening Q% feet below crest of dam. One or more of these are open a large part of the time.
EXTREMES OF DISCHARGE. Maximum stage recorded, 8.0 feet at midnight Sep tember 28; minimum stage, crest of dam dry on various days.
1923-1926: Maximum stage recorded, 8.0 feet at midnight September 28, 1926; minimum stage, crest dry on various days each year.
DIVERSIONS. Water diverted from Gila River below gage by Ashurst-Hayden Dam. First canal gate opening is 22 feet below gage. About 38,000 acres is irrigated from Gila River above thisd am. Acreage irrigated from San Pedro River not known.
ACCURACY. Stage-discharge relation not determined. No discharge measure ments made. Only height of water on crest of dam determined. Gage read to hundredths twice daily. No determination of amount of water by-passed through sluice gates of dam.
COOPERATION. Gage-height record furnished by United States Indian Service.
GILA RIVER BASIN 95
Daily height, in feet, of Gila River at Ashurst-Hayden Dam, near Florence, Ariz.^ for the year ending September SO, 1926
Day
l._ ___ . ___ .... ...2....... ......... 3........ ...... ........ 4........... __ ......5.... __ ..............6.... __ ........... ...7.......... ............8................... .. 9........ __ . __ ....
10...... .......... __ ..11-.... .. 12..,....... .........13..... ...... ......14............ __ ......15......................16.-.... .............17.....................18............. _ ......19........ ........ ___ .20.. ...... ..............21..... .............22......................23......................24......................25................ .26....:.................27-. 28......................29......................30........ ..............31.... ...............
Oct.
-----
.......
~«6."64"
.74
.64
.69
.76
.63
.64
.60
.58
.53
.51
.47
.45
.41
.41
.38
.40
.40
.40
.58
Nov.
0.44.40 .40 .40.39.36.33.32 .32.31.31 .32
-.32
«.40
a 10
Dec.
0.101.57 .84
.56
.43
.40
.38
.38
.37
.38
.39
.38
.37
.37
.39
.38
.37«.36
Jan.
~~6.~22~
.62
.55
.51
.£3
.52dQ
.49
.48
.48
.48
.48
.46
.46
.46«46
Feb.
0.54 .39
«.32
...... .
Mar.
----- -
-----
.31
.37 .46.29.26.25.08
.841.901.88
Apr.
1.401.10 1.19 1.161.191.202.101.70 1.701.60J.50 1.251.201.251.201.401.301.201.221 2£1.051.00.85.75.65.69.76.71.75.90
May
1.051.13 1.00 .96.97
1.05.95.95
1.00.96.94.85.74.70.60.49.43.21.05
July
.......
"»6."40"
1.62.77.20
Aug.
0.55
.......
.90
Sept.
...
°3 1 -
.20
2.6(12.594.732.911.3S
« Flow for half a day. * Flow for quarter of a day.No water over rarest of dam on days forNOTE. Gage heights in above table show head on crest of dam.
which no record is given.QUA RIVER AT GIL1ESPIE DAM, ARIZ.
LOCATION. In SE. % NE. % sec. 28, T. 2 S., R. 5 W., at Gillespie Dam, Maricopa County. Hassayampa River enters from right 8 miles upstream.
DRAINAGE AREA. 48,100 square miles.RECORDS AVAILABLE. August 4, 1921, to September 30, 1926.GAGE. Water-stage recorder on left wing wall 10 feet upstream from crest of
Gillespie Dam, installed July 28, 1924. Zero of gage at mean elevation of crest of dam and 753.8 feet above mean sea level.
EXTREMES OP DISCHARGE. Maximum stage during year, from water-stage recorder, 3.95 feet at 6 a. m. September 30 (discharge, 38,300 second-feet); minimum stage, crest of dam dry on various days during year.
1921-1926: Maximum stage recorded, 6.0 feet on December 28, 1923 (discharge, 70,000 second-feet); minimum stage, crest of dam dry for various periods each year.
'DIVERSIONS. Water diverted from Gila River by Gillespie Dam. When water is below crest of dam a gate is kept open which turns a small quantity of water downstream to satisfy prior rights. About 275,000 acres is irrigated from Gila River and tributaries above this dam.
ACCURACY. Stage-discharge relation permanent. Rating curve well defined from 100 to 10,000 secpnd-feet. From 10,000 to 150,000 second-feet, rating has been extended by using formula for broad-crested weirs, Q = 2.64L£Tf, and assumed velocities of approach based on observed conditions. Below 100 second-feet rating varies somewhat on account of accumulation of moss or trash on crest of dam. Water discharged through sluice gates, separately computed, and included in daily discharge. Records good.
96 SURFACE WATER SUPPLY, 1926, PART IX
Discharge measurements of Gila River at Gillespie Dam, Ariz., during the year endingSeptember 30, 1926
Date
Dec. 4 ..........Jan. 20...... ....Feb. 27.........
Gage height
Feet 0.10.12.04
Dis charge
Sec.-ft. 15818838
Date
Apr. 15--
Gage height
Feet 0.011.02.88
Dis charge
Sec.-ft. 25
4,4503,570
Date
Sept. 8..... .
Gage height
Feet
0.15
Dis charge
Sec.-ft. 11.8304
Water below crest of dam; discharge measured in river channel half a mile downstream.
Daily discharge, in second-feet, of Gila River at Gillespie Dam, Ariz., for the year ending September 30, 1926
Day
1 _____ . ....2 -
4. 5 ... ...
6_ 7 %9. .... ....10
11... ............
13----.- 14 15
16.-..-.-- .......17. 18 19. ..... ..... _"20
21 .... ..22 ........ _ .23 24-----.-.. _ ..25
26.--.......-...27 .28 .. .29 ..........30. . ..31-
Oct.
105eo28
570
4,070821861
1,360840
600460370315265
524495460430430
430370315265
265240240215195175
NOlT.
195240
155195
195 195
155120
120
909090
105
909075
7575909090
1051059090
105
Dec.
105
17c
9101,150
720430
290215
155
135135105
9090909075
90109155
1951751951209090
Jan.
120
i ^
460370370340315
315290290265240
215215240215
175175175
175
135
120135
Feb.
155
120120
105120
8145
45536090
105
7575604535
3332153635
203745
Mar.
4545322736
62706060
603532
10
00000
00000
000
1061,0001,030
Apr.
3,8803,140
1,7001,470
20,40025, 20019, 20014, 400
14, 4008,4707,0005,6404,300
3,4603,0002,4001,9502,200
3,5803,8802,5001,6501,200
920730530494494
May
500560851880800
660645560590
590573540560470
385310102
00
00000
000000
June
00000
00000
00000
00000
00000
00000
July
00000
00000
00000
0240
000
00000
01,8001,540
440322125
Aug.
6341
000
015643
16065
00000
00000
00000
000000
Sept.
00000
064
3812,4202,700
2,3501,320
170335235
17075000
00000
204,6507,800
14, 10021,200
Monthly discharge of Gila River at Gillespie Dam, Ariz.September 30, 1926
for the year ending
Month
December ______________ _______ _ ...
March. _ _____________ __ _ .. _ ......
July .. . . _ ....... ..... .......
September. _________________ ___ .........
The year
Discharge in second-feet
Maximum
4,070 240
1,150 460 155-
2,030 25, 200
880 0
1,800 160
21,200
25,200
Minimum
28 75 75
120 15 0
494 0 0 0 0 0
0
Mean
519 121 228 219
73.3 120
5,570 331
0 144 17.0
1,930
766
Run-off inacre-feet
31,900 7,200
14,000 13,500 4,070 7,380
331,000 20,400
0 8,850 1,050
115,000
554,000
GILA RIVER BASIN 97SUNSET OAWAL NEAR DUNCABT, ARIZ. <
LOCATION. In NW. % sec. 17, T. 19 S., R. 20 W. New Mexico principal meridian, in New Mexico 3 miles below intake, 9 miles east of Arizona-New Mexico State line, and 14 miles east of Duncan, Greenlee County, Ariz.
RECORDS AVAILABLE. October 1, 1914, to September 30, 1915. July 15, 1922, to September 30, 1926.
GAGE. Vertical staff on right bank at Brooks ranch, read by M. H. Brooks.DISCHARGE MEASUREMENTS. Made from footbridge at gage.CHANNEL AND CONTROL. Bed composed of silt. Banks vertical. No well-
defined control.DIVERSIONS. About 35 acres irrigated above station.REGULATION. By head gates. Flow in canal varies considerably with flow in
Gila River.ACCURACY. Stage-discharge relation continually changing. Standard rating
curve well defined. Gage read to nearest two-hundredths twice a day with additional readings June to August. Daily discharge ascertained by apply ing mean daily gage height to rating table, shifting-control method used for entire year. Records good.
COOPERATION. Supplementary gage readings from June 23 to August 31 and some discharge measurements during that period furnished by J. F. McGrath.
Canal diverts water from right side of Gila River in NW. J4 sec. 20, T. 19 S., R. 20 W. New Mexico principal meridian, for irrigating 1,800 acres in the vicinity of Virden.
Discharge measurements of Sunset Canal near Duncan, Ariz., during the year endingSeptember SO, 1926
Date
Oct. 1..
Nov. 17 ......Dec. 1 _ ..Dec. 15 -
Jan. 20--. Feb. 6 ....Feb. 20 _ . _ ..Mar. 6.. .......Mar. 17..
Gage height
Feet 1.541.701.791.922.011.521.371.682.102.021.92
Dis charge
Sec.-ft. 21.519.521.924.428. 916.212.417.229.925.225.6
Date
May 10 .........'May 31.. . June 25 .........
July 2.. ........July 9. July 18.. ...July 19.
Gage
Feet 1.52
1.781.832.052.172.201.922.242.242.43
Dis charge
Sec.-ft. 20.316.820.019.9
. :2fej629. 6130.924.232.835.037.3
Date
July 20..- -
.AHgi.13 . Auf.20 ... ...Aug. 27
Aug. 31 .
aFeet 2.342.302.342.072.302.321.65.74.90
2.21
Dis charge
Sec.-ft. 38.536.338.130.338.036.223.33.88.6
36.2
Daily discharge, in second-feet, of Sunset Canal near Duncan, Ariz,, for the yearending September SO, 1926
Day
1 _ .. __ ... ...2...............3 _ ............4. .... .......6 .
6 .7...............8.. ..........9 10 -- .
11.. . ..1213...............14...............15 - -..
Oct.
2324252531
3230272717
00
00
Nov.
1919192020
2121202121
2121212121
Dec.
2424232323
2323232324
2423232324
Jan.
1111141417
1818181818
1817171919
Feb.
1715161818
19202121
2323
23
Mar.
2828282726
2526272827
2727272727
Apr.
1615151719
2122212220
191810
1818
May
19181918
1718201717
1819191919
June
2135353436
3534313033
3736362630
July
2223202937
3836323025
3225293333
Aug.
2524242527
3440373029
3132323333
Sept.
7.06.96.66.96.7
7.06.9121330
1823282932
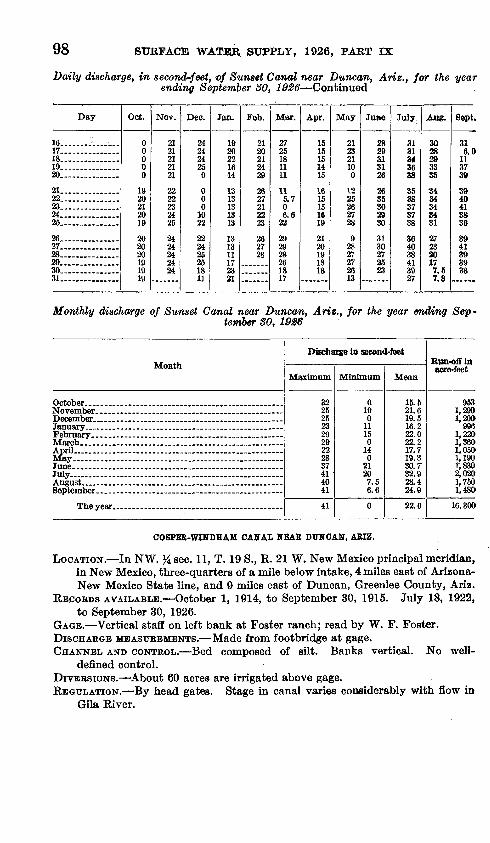
98 SURFACE WATER, SUPPLY, 1926, PART IX
Daily discharge, in second-feet, <of Sunset Canal near Duncan, Ariz., for the year ending September 30, 1926 Continued
Day
16 . 17...............18 _ . _____ ..19_ _20. ...........
21 __ .... ......22.. ___ ........23 ............24...............25 ............
26.... ...........27 ...............28.. __ . .......29...............30.... __ . __ .31...............
Oct.
00000
1920212010
202020191919
Nov.
2121212121
2222232425
2424242424
Dec.
242424250
000
1022
222425251811
Jan.
1920221614
1313131313
131311172321
Feb.
2120212429
2627212223
262728
Mar.
2725181111
115.706.6
22
292928261817
Apr.
1515151415
1615151619
2120191818
May
212321100
1225262728
92827272613
Juae
2829313126
26353029vi
3130272523
July
3131843638
35as373738
364038413927
Aug.
3028293335
3434343431
272320177.57.8
Sept.
316 9
113739
3940413836
3d41393938
Monthly discharge of Sunset Canal near Duncan, Ariz., for the year ending Sep-tember SO, 1926
Month
March _____ . ____________________ ...April........... ...
July... ............................... ......... .....
September ________________________ ...
Discharge in second-feet
Maximum
32 25 25 23 29 29 22 28 37 41 40 41
41
Minimum
0 19 0
11 15 0
14 0
21 20 7.5 6.6
0
Mean
IS. 5 21.6 19.5 16.2 22.0 22.2 17.7 19.3 30.7 32.9 28.4 24.9
22.6
Run-off in acre-feet
953 1,290 1,200
996 1,220 1,360 1,050 1,190 1,830 2,020 1,750 1,480
16,300
COSPER-WINDHAM CANAL WEAR DUNCAN, ARIZ.
LOCATION. In NW. % sec. 11, T. 19 S., R. 21 W. New Mexico principal meridian, in New Mexico, three-quarters of a mile below intake, 4 miles east of Arizona- New Mexico State line, and 9 miles east of Duncan, Greenlee County, Ariz.
RECOBDS AVAILABLE. October 1, 1914, to September 30, 1915. July 18, 1922, to September 30, 1926.
GAGE. Vertical staff on left bank at Foster ranch; read by W. F. Foster.DISCHARGE MEASTTBEMENTS. Made from footbridge at gage.CHANNEL AND CONTROL. Bed composed of silt. Banks vertical. No well-
defined control.DIVEBSIONS. About 60 acres are irrigated above gage.REGULATION. By head gates. Stage in canal varies considerably with flow in
Gila River.
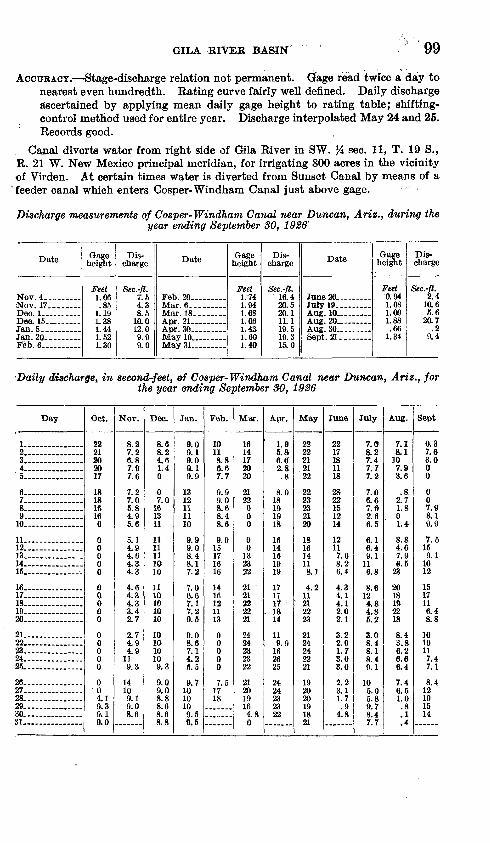
GILA RIVER BASIN 99
ACCURACY. Stage-discharge relation not permanent. Gage read twice a day to nearest even hundredth. Rating curve fairly well denned. Daily discharge ascertained by applying mean daily gage height to rating table; shifting- control method'used for entire year. Discharge interpolated May 24 and 25. Records good.
Canal diverts water from right side of Gila River in SW. % sec. 11, T. 19 S., R. 21 W. New Mexico principal meridian, for irrigating 800 acres in the vicinity of Virden. At certain times water is diverted from Sunset Canal by means of a
'feeder canal which enters Cosper-Windham Canal just above gage.
Discharge measurements of Cosper-Windham Canal near Duncan, Ariz., during the year ending September SO, 1926'
Date
Nov. 17.- Tift/» 1
Jan. 20-- -Feb. 6 .... .
Gage height
Feet 1.06.85
1 191.381.441.52
Dis charge
Sec.-ft. 7.54.38.5
10.012.09.9Q n
Date
Feb. 20... ...
Apr. 21. ...
Gage height
Feet 1.741.941.681.061.431.601.40
Dis charge
Sec.-ft. 16.420.520.111.119.519.315.0
Date
June 28 _____July 19... .. Aug. 10L. . ...Aug. 20 __Aug. 30 __ . __Sept. 21... . ....
Gage height
Feet 0.941.681.091.88.66
1.34
Dis charge
Sec.-ft. 2.4
10.65.6
20.7.2
9.4
'Daily discharge, in second-feet, of Cosper-Windkam Canal near Duncan, Ariz., for the year ending September SO, 1926
Day
I .;. .........2 _ -. .......3 _ . ...........4 ............5 _ .....
6 ___ ..7...... ......8 ... ..... .9. __ ... .. -..10 ........
11 . . ...12......... __ ..13.... ...........14 _ ... __ . ...15 _ ... _
16. _ ... .....17 _ . _ . .......18 ____ ..19. ..20 _ ....
21...............22 _ .. . .......23 ___ ....24. ...........25. .. ___ ....
26 27 28. ... __ ....2930 _ .. ..........31... ............
Oct.
2221202017
181816160
00000
0a000
0
000
004.19.39.1a n
Nov.
8.27.26.87.97.6
7.27.05.84.95.6
5.14.94.64.34.3
4.64.34.33.49 7
2 74.94 Q
119.3
14109.19.08.6
Dec.
8.68.24.61.40
07.0
161311
1111111010
1110101010
101010109.3
9.09.08.88.68.68.8
Jan.
9.09.19.09.19.9
1312111110
9.99.08.48.17.2
7.06.67.17.29 E
9 08.67.14.26.5
9.71010109.59.5
Feb.
10118.86.67.7
9.99.08.68.48.6
9.915171616
141512
TO
00000
7.51718
Mar.
1614172020
2122000
00
132322
21212222tyt
2424232322
212019164.80
Apr.
1.95.86.62.&.8
8.018191918
1614161919
1717171&14
119 0
2625
242423OO
May
222221
,2122
2223232120
181614118.1
4.2112122oo
01
242499
21
192020191891
June
2217181118
2822151214
12117.68.26.4
4.34.14.12.0
3 92.01.73.03.0
2.2q 1
1.7g
4.8
July
7.08.27:47.77.2
7.06.67. ft2.66.5
6.16.49.1
116.8
8.6124.84 0
5 0
3 ft
8.48 18 49 1
105.05.89 78.47.7
Aug.
7.18.1
107.93.6
.82.71.8
, 01.4
8.84.67.96.5
23
20IS192218
8.43.86.26.66.4
7.46.51.0.8.1.4
Sept
0.37.63.000
007.98.19.9
7.5159.1
1012
1517116.48.8
1010117.47.1
8.412191514
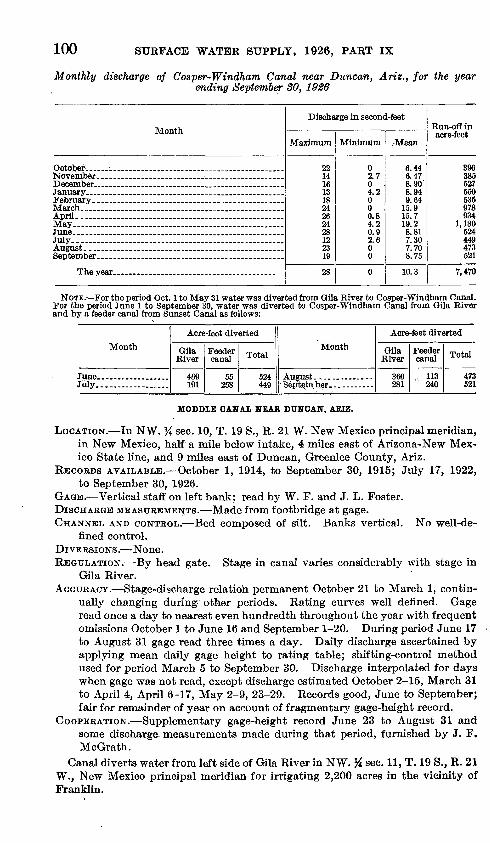
SUEFACE WATEE SUPPLY, 1926, PAET IX
Monthly discharge of Cosper-Windham Canal near Duncan, Ariz., for the year ending September SO, 1926
Month
November _____________ __________
February. ...............................................March...... ...... ............ ................ .......
June. ______ . ....................................July..- ...... . ...... -..-........ .. ........
September __ ... ______________________
Discharge in second-feet
Maximum
22 14 16 13 18 24 26 24 28 12 23 19
28
Minimum
0 2.7 0 4.2 0 0 0.8 4.2 0.9 2.6 0 0
0
;Mean
6.44 6.47 8.90 8.94 9.64
15.9 15.7 19.2 8.81 7.30 7.70 8.75
10.3
Run-off in acre-feet
396 385 527 550 535 978 934
1,180 524 449 473 521
7,470
NOTE. For the period Oct. 1 to May 31 water was diverted from Qila River to Cosper-Windham Canal. For the period June 1 to September 30, water was diverted to Cosper-Windham Canal from Qila River and by a feeder canal from Sunset Canal as follows:
Month
July..... .... .
Acre-feet diverted
Gila River
469 191
Feeder canal
55 258
Total
524 449
Month
Acre-feet diverted
Qila River
360281
Feeder canal
113 240
Total
473521
MODDIE CANAL NEAR DUNCAN, ARIZ.
LOCATION. In NW. % sec. 10, T. 19 S., R. 21 W. New Mexico principal meridian, in New Mexico, half a mile below intake, 4 miles east of Arizona-New Mex ico State line, and 9 miles east of Duncan, Greenlee County, Ariz.
RECORDS AVAILABLE. October 1, 1914, to September 30, 1915; July 17, 1922, to September 30, 1926.
GAGE. Vertical staff on left bank; read by W. F. and J. L. Foster.DISCHARGE MEASUREMENTS. Made from footbridge at gage.CHANNEL AND CONTROL. Bed composed of silt. Banks vertical. No well-de
fined control.DIVERSIONS. None.REGULATION. By head gate. Stage in canal varies considerably with stage in
Gila River.ACCURACY. Stage-discharge relation permanent October 21 to March 1, contin
ually changing during other periods. Rating curves well defined. Gage read once a day to nearest even hundredth throughout the year with frequent omissions October 1 to June 16 and September 1-20. During period June 17 to August 31 gage read three times a day. Daily discharge ascertained by applying mean daily gage height to rating table; shifting-control method used for period March 5 to September 30. Discharge interpolated for days when gage was not read, except discharge estimated October 2-15, March 31 to April 4, April 6-17, May 2-9, 23-29. Records good, June to September; fair for remainder of year on account of fragmentary gage-height record.
COOPERATION. Supplementary gage-height record June 23 to August 31 and some discharge measurements made during that period, furnished by J. F. McGrath.
Canal diverts water from left side of Gila River in NW. % sec. 11, T. 19 S., R. 21W., New Mexico principal meridian for irrigating 2,200 acres in the vicinity ofFranklin.
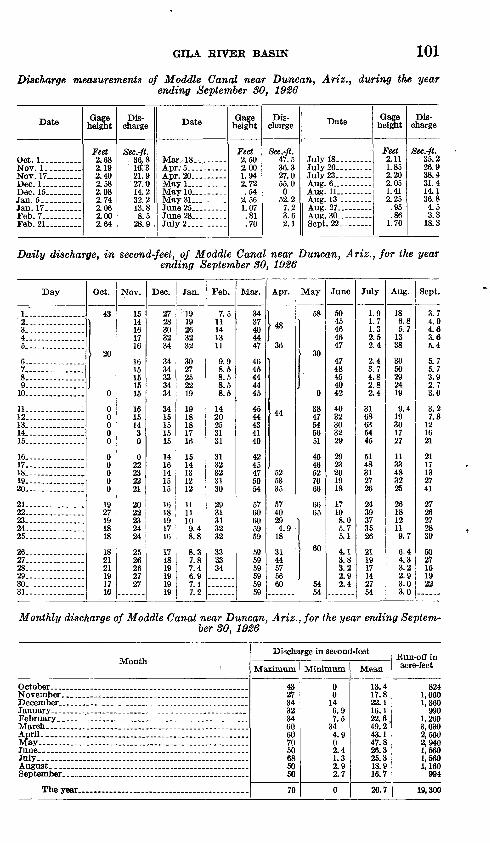
GtLA BIVEB BASIN 101
Discharge measurements of Moddle Canal near Duncan, Ariz., during the year ending September 30, 1926
Date
Oct. 1.. _ .....Nov. I.........Nov. 17 .. __Dec 1
Jan. 17... ...Feb. 7 .... ...Feb. 21
Qage height
Feet 2.682.19
2.582.082.742.062.002.64
Dis charge
Sec.-ft. 36.8ltf.391 O
27.014.232.213.88.5
28.9
Date
May31 -- June 25 _
July 2.... ..
Qage height
Feet 2.502.001.942.72.54
2.561.07.81.70
Dis charge
Sec.-ft. 47.536.327.055.0
052.27.2
2.1
Date
July 18-.. ....July 20-.. ...July 23.. ....
Aug. 11 Aug. 13.. -------Aug. 27
Sept. 22-. ...
height
Feet 2.111.852.202.051.412.25.95.86
1.70
Dis charge
Sec.-ft. 35.226.938.431.414.136.84.53.3
18.3
Daily discharge, in second-feet, of Moddle Canal near Duncan, Ariz., for the year ending September 30, 1926
Day
1 ....... ........2 _ . ____ . ...3 -.-... 4 ___ . ...... 5. .- ...
6 7 ... .... .. ...8 ...9 ...10
11 . .;12. .........13....... ___ ...14. .......15
16 ...............17 .. _ ....18-. .19 20 . .:21. ... _ .....22 . -23 24-.-. 25..
26 27 - 28 29 30. 31. .....
Oct.
43
20
0
00000
00000
1927191818
182121191716
Nov.
1514161716
16
151515
16151430
022232221
2022232424
2526262727
Dec.
2728303234
3434333434
3415151515
1416141515
1618191716
171819191919
Jan.
1919263232
3027252219
1918181716
1514131212
1111109.48.8
8.37.87.4fi Q
7.2
Feb.
7.511141311
9 98.58.58.58.5
1420253131
3132323130
2931313232
333334
Mar.
3437404447
4645444445
4544434140
4245475054
5760605959
595959595959
Apr.
u36
44
525335
5740294.918
3144575660
May
58
30
0
3847545651
4646527066
6665
60
5454
June
5045464647
4748454042
4032303229
2923201918
17108.05.75.1
4.13.83.22.92.4
July
1.91.71.32.52.4
2.43.74.82.82.4
3168635445
5148312726
2439373526
211917142754
Aug.
186.85.71338
3050292419
9.419301727
1133483225
261812119.7
6.44.33.22.93.03.0
Sept.
3.74.04.63.65.4
5.75.73.92.73.0
3.27.8121621
2117132741
2726272839
5027161922
Monthly discharge of Moddle Canal near Duncan, Ariz., for the year ending Septem ber SO, 1926
Month
April. _ May... ________ ______________ .......
July... __ . ___ .. _ ... ... _ ....... _ .... August.. ________________________ . ...
The year... ____ . ____________ .
Discharge in second-feet
Maximum
43 27 34 32 34 60 60 70 50 68 50 50
70
Minimum
0 0
14 6.9 7.5
34 4.9 0 2.4 1.3 2.9 2.7
0
Mean
13.4 17.8 22.1 16.1 22.6, 49.2'
43.1 47.8 26.3 25.3 18.9 16.7
26.7
Run-off in acre-feet
824 1,060 1,360
990 1,260 3,030 2,560 2,940 1,560 1,560 1,160
994
19,300
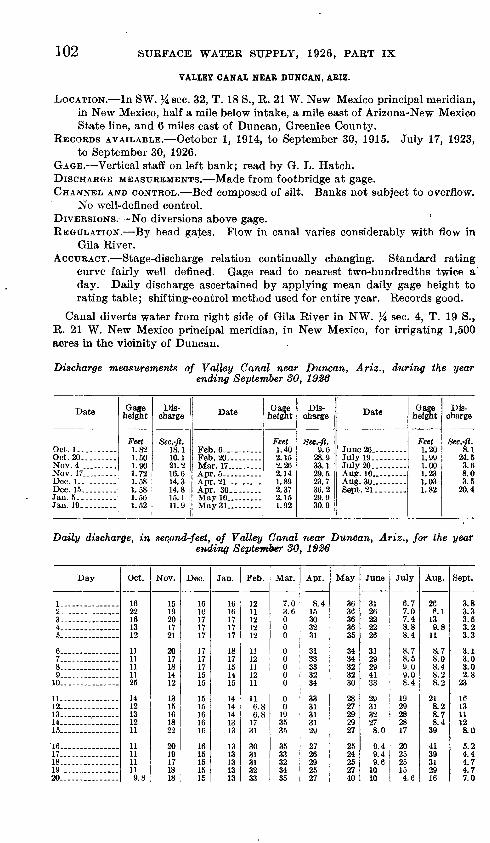
102 SURFACE WATER SUPPLY, 1926, PART IX
VALLEY CANAL NEAR DUNCAN, AEIZ.
LOCATION. In SW. 14 sec. 32, T. 18 S., R. 21 W. New Mexico principal meridian, in New Mexico, half a mile below intake, a mile east of Arizona-New Mexico State line, and 6 miles east of Duncan, Greenlee County.
RECORDS AVAILABLE. October 1, 1914, to September 30, 1915. July 17, 1923, to September 30, 1926.
GAGE. Vertical staff on left bank; read by G. L. Hatch.DISCHARGE MEASUREMENTS. Made from footbridge at gage.CHANNEL AND CONTROL. Bed composed of silt. Banks not subject to overflow.
No well-defined control.DIVERSIONS. No diversions above gage.REGULATION. By head gates. Flow in canal varies considerably with flow in
Gila River.ACCURACY. Stage-discharge relation continually changing. Standard rating
curve fairly well defined. Gage read to nearest two-hundredths twice a' day. Daily discharge ascertained by applying mean daily gage height to rating table; shifting-control method used for entire year. Records good.
Canal diverts water from right side of Gila River in NW. % sec. 4, T. 19 S., R. 21 W. New Mexico principal meridian, in New Mexico, for irrigating 1,500 acres in the vicinity of Duncan.
Discharge measurements of Valley Canal near Duncan, Ariz., during the year ending September 30, 19S6
Date
Oct. 1. .........Oct. 20-.... .
Nov. 17... ...
Jan. 19 ........
Gage height
Feet 1.821.501.901.721.581.581 ^fi
Dis charge
Sec.-ft. 18.110.121.216.614.314.81 K 1
11.9
Date
Feb. 6 Feb. 20 .
Qage height
Feet 1.40
2.262.141.892.37OIK
1.92
Dis charge
See.-ft. 9.6
28.933.129.523.736.2
30.9
Date
June 26 .. ..
July 20 .... ...
height
Feet 1.201.991.001.231.031.82
Dis charge
Sec.-ft. 8.1
24.53.68.03.5
20.4
Daily discharge, in second-feet, of Valley Canal near Duncan, Ariz., for the year ending September SO, 1926
Day
1. .... .......
3..
5..------.... _
6 ... .... ....7 .8 9 10..-. ... _ ....
12 13 , 14 _ -15.
16 . 17 IS...............19 . .....20
Oct.
1622161312
1111111125
12131211
1111
119.8
Nov.
1519201721
2017181412
1315161822
2019
1818
Dec.
16
171717
1717
15
15
161616
151 fl
]£
Jan.
1616171717
1817
1415
14
1410
13
10
131 °.
1313
Feb.
19
12
12
12
n6.86.81731
on
3101
3233
Mar.
7.03.6000
00000
0
193535
353332Id35
Apr.
8.415303231
3133333234
33313101
9Q
27269Q91
27
May
363636363514.34323230
98
27292927
2524
2740
June
3126222226
3129294133
9O
3132278.0
9.49.40 ft
1010
July
6.77.07.48.88.4
8.78.59.09.08.4
1929282817
202525154.6
Aug.
266.1139.811
8.78.08.48.28.2
8.28.78.439
4139312916
Sept.
3.83.33.53.23.3
3.13.03.02.8
23
1311128.0
5.24.44.74.77.0
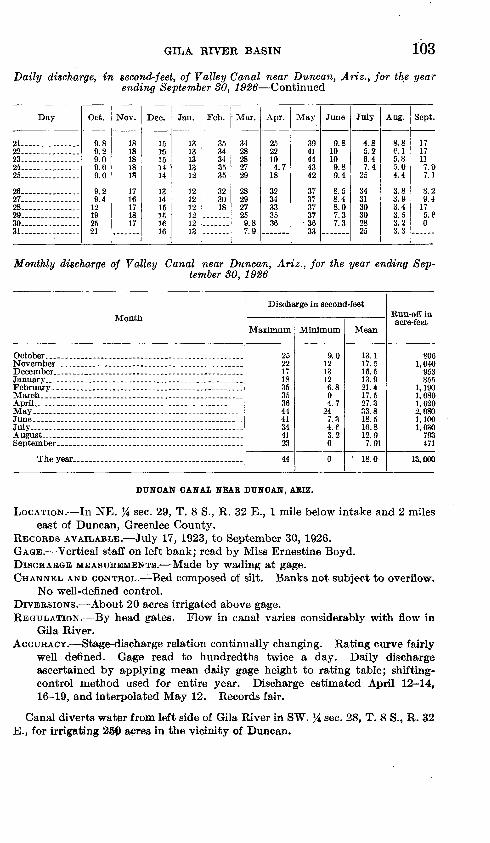
GILA EIVEK BASIN iosDaily discharge, in second-feet, of Valley Canal near Duncan, Ariz., for the year
ending September 80, 1926 Continued
Day
21 22 23 24..... ..........25....... ........
26...............27 ............28...............29...............30 31. ........ ..
Oct.
9.89.29.09.09.0
9.29.412192521
Nov.
1818181818
1716171817
Dec.
15
151414
13
151£1616
Jan.
13
131312
121212121213
Feb.
3534343535
323018
Mar.
3428282729
282927259.87.9
Apr.
2522104.718
3234333536
May
3941444342
373737373633
June
9.810109.89.4
8.58.48.07.37.3
July
4.85.26.47.425
343130302825
Aug.
ase.i5.85.04.4
3.83.93.43.53.23.3
Sept.
1717117.07.1
8.29.4175.e0
Monthly discharge of Valley Canal near Duncan, Ariz., for the year ending Sep tember 30, 1926
April......... ............. ..... ................
July........... ... _ .
Discna
Maximum
252217183535364441344]23
44
,rge m secon<
Minimum
9.01213126.804.7
247.34.e3.20
0
Meet
Mean
13.117.515.513.921.417.527.333.818.516.812.97.91
' 18.0
Run-off iHacre-feet
806
953855
1,1901,0801,6202,0801,1001,030
793471
13,000
DUNCAN CANAI NEAR DUNCAN, ARIZ.
LOCATION. In NE. % sec. 29, T. 8 S., R. 32 E., 1 mile below intake and 2 miles east of Duncan, Greenlee County.
RECORDS AVAILABLE. July 17, 1923, to September 30, 1926.GAGE. Vertical staff on left bank; read by Miss Ernestine Boyd.DISCHABGE MEASUREMENTS. Made by wading at gage.CHANNEL AND CO-NTROL. Bed composed of silt. Banks not subject to overflow.
No well-defined control.DIVERSIONS. About 20 acres irrigated above gage.REGULATION. By head gates. Flow in canal varies considerably with flow in
GUa River.ACCURACY. Stage-discharge relation continually changing. Rating curve fairly
well defined. Gage read to hundredths twice a day. Daily discharge ascertained by applying mean daily gage height to rating table; shifting- control method used for entire year. Discharge estimated April 12 14, 16-19, and interpolated May 12. Records fair.
Canal diverts water from left side of Gila River in SW. % sec. 28, T. 8 S., R. 32 E., for irrigating 23$ acres in the vicinity of Duncan.
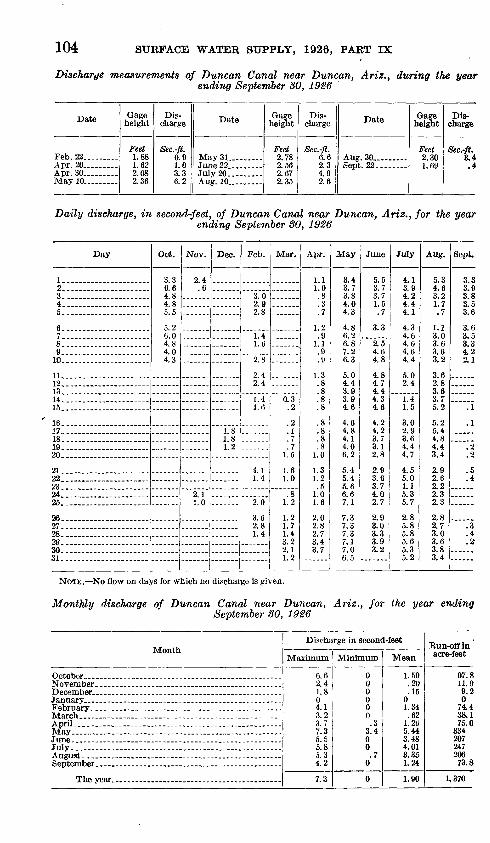
104 SURFACE WATER SUPPLY, 1926, PART IX
Discharge measurements of Duncan Canal near Duncan, Ariz., during the year ending September SO, 1926
Date
Feb. 22.. .......Apr. 20... -...--Apr. 30... ......May 10 .........
Gage height
Feet 1.881.622.082.36
Dis charge
Sec.-ft. 0.91.03.36.2
Date
May 31... ......June 22 .........July 20..
Gage height
Feet 2.782.562.672.35
Dis charge
Sec.-ft. 6.62.34.92.6
Date
Sept. 22........
Gage height
Feet 2.301.69
Dis charge
Sec.-ft. 3.4.4
Daily discharge, in second-feet, of Duncan Canal near Duncan, Ariz., for the year ending September SO, 1926
Day
2...... ... .......3..... .......... ....4............. _ ......5.. _ ..... _ . _ .--..
7........ .... .......8.. ........ .... ..9.... ..... --10-.
12..... _ . .- 1 3
15..
16. 17. . 18. 19. . 20.
21. 22... ..............23.. 24. 25.
26.. . _ ........27-- 28. 29. 30... . ..01
Oct.
3.36.64.84.85.5
5.26.04.84.04.3
Nov.
2.4.6
2.11.0
Dec.
1.81.81.2
Feb.
3.02.92.8
1.41.6
2.8
2.42.4
1.6
4.11.4
2.6
3.62.81.4
Mar,
0.3.2
.2
.1
.71.5
1.61.0
.81.2
1.21.71.43.22.11.2
Apr.
1.0.8.3.7
1.2.9
1.1.9.9
1.3.8.8.8.8
.8
.8
.8
.81.0
1.31.2.5
1.01.6
2.02.82.73.43.7
1
May
3.43.73.84.04.3
4.86.26.87.26.3
5.04.43.93.94.6
4.64.84.14.06.2
5.45.45.66.67.1
7.37.37.37.17.06.5
June
5.53.73.71.5.7
3.3
2.54.64.8
4.84.74.44.34.6
4.24.23.73.12.8
2.93.63.74.02.7
2.93.03.33.93.2
July
4.13.94.24.44.1
4.34.64.64.64.4
5.02.4
1.41.5
3.02.93.64.44.7
4.55.01.15.35.7
2.85.85.85.65.35.2
Aug.
5.34.63.21.7.7
1.13.03.63.63.2
3.62.83.63.75.2
5.25.44.84.43.4
2.92.62.22.32.3
2.82.73.03.63.83.4
Sept.
3.33.93.83.53.6
3.63.53.34.22.1
.1
.1
.2
.2
.5
.4
.3
.4
.2
NOTE. No flow on days for which no discharge is given.
Monthly discharge of Duncan Canal near Duncan, Ariz., for the year endingSeptember SO, 1926
Month
July.. ...................................................
The year ___ . __________________ . ...
Discharge in second-feet
Maximum
6.6 2.4 1.8 0 4.1 3.2 3.7 7.3 5.5 5.8 5.3 4.2
7.3
Minimum
0 0 0 0 0 0 .3
3.4 0 0 .7
0
0
Mean
1.59 .20 .15
0 1.34 .62
1.26 5.44 3.48 4.01 3.35 1.24
1.90
Eun-ofl in acre-feet
97.8 11.9 9.2 0
74.4 38.1 75.0
334 207 247 206 73.8
1,370
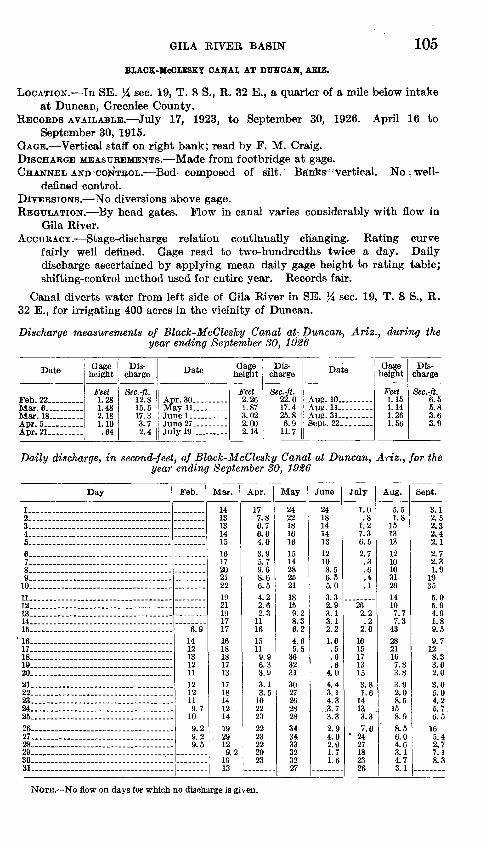
GILA KIVER BASIN 105BLACK-McCLESKY CANAL AT DUNCAN, ABIZ.
LOCATION. In SE. }£ sec. 19, T. 8 S., R. 32 E., a quarter of a mile below intake at Duncan, Greenlee County.
RECORDS AVAILABLE. July 17, 1923, to September 30, 1926. April 16 to September 30, 1915.
GAGE. Vertical staff on right bank; read by F. M. Craig.DISCHARGE MEASUREMENTS. Made from footbridge at gage.CHANNEL AND CONTROL.- Bed composed of silt. Banks vertical. No well-
defined control.DIVERSIONS. No diversions above gage.REGULATION. By head gates. Flow in canal varies considerably with flow in
Gila River.ACCURACY. Stage-discharge relation continually changing. Rating curve
fairly well defined. Gage read to two-hundredths twice a day. Daily discharge ascertained by applying mean daily gage height to rating table; shifting-control method used for entire year. Records fair.
Canal diverts water from left side of Gila River in SE. }£ sec. 19, T. 8 S., R. 32 E., for irrigating 400 acres in the vicinity of Duncan.
Discharge measurements of Black-McClesky Canal at Duncan, Ariz., during the year ending September 80, 1926
Date
Feb. 22 ___ ..
Apr. 21.. ....
Gage height
Feet 1.281.48
1.1064
Dis charge
Sec.-ft. 12.815.517.33.72.4
Date
June 27 ___ ..July 19
Gage height
Feet 2.261.873.022.002.14
Dis charge
See.-ft. 22.017.425.8
6. 911.7
Date
Aug. 10..... ... .Aug. 11 Aug. 31. Sept. 22....
Gage height
Feet 1.151.141.261.56
Dis charge
Sec.-ft. 6.55.83.63.9
Daily discharge, in second-feet, of Black-McClesky Canal at Duncan, Ariz., for the year ending September 80, 1926
Day
1. _ . ___ ............. ... _ ...2. _ . _____ .......................3........ ....... _ .... 4. _ . _ . _ _ 5. ___ ... _ _ 6 7 _ 8 _ .... ___ ..... .9.. .... 10 ___ 11 12.. ........... _ ....................13........ ___ ....................14 ___ ....... ...... 15... - ...
16 17. ___ __ _ -18 19. ___ . 20 __ . __ _.. __-. _ .....21 __ . _ ...... ... .......22 .. _____ . _ .. 23....... _ 24....... . .........................25 _ 26 ____ ..... ...... .......27 _ ............ .......28 .. _ ......29 __ ... ... ........... ......30 _ ......... _ 31 ........... ....... ...............
Feb.
6 9
14121312111212119.7109.29.29.5
Mar.
1413131415161720212219211917171618181713171814121419
. 29129.21913
Apr.
177.86.76.04.03.95.79.68.66.54.22.62.3111615119.96.33.93.13.51022232223222023
May
2422181616151428262118159.28.36.24.65.53632313027262828343433323227
June
241814141312108.56.55.03.32.93.13.1
1.6.5.6.6
4.04.43.14.33.73.39 Q4.02.91.71.6
July
1.0.81.27.36.52.7.3.6.4.1
262.2.22.0
16151713153.81.614133.37.6' 2427182326
Aug.
5.51.8
151313121010312914107.77.3
432821167.83.83.92.08.5158.98.56.04.63.14.73.1
Sept.
3.12.52.32.42.12.72.31.9
19355.05.94.91.89.59.7128.33.62.03.05.04.25.76.5165.42.77.18.3
NOTE. No flow on days for which no discharge is given.
106 SURFACE WATEE SUPPLY, 1926, PART IX
Monthly discharge of Black-McClesky Canal at Duncan, Ariz., for the year endingSeptember 80, 1926
Month
April.. .
July...
The year.. .. __________________
Discharge in second-feet
Maximum
0 0 0 0
14 29 23 36 24 27 43 35
43
Minimum
0 0 0 0 0 9.2 2.3 4.6 0.5 0 1.8 1.8
0
Mean
0 0 0 0 5.41
16.7 11.0 2.24 5.96 9.31
11.8 6.66
7.47
Run-off in acre-feet
0 0 0 0
800 1,030
655 1,380
355 572 726 396
5,410
GOIMONEEO CANAL NEAR DUNCAN, ARIZ.
LOCATION. In SE. % sec. 33, T. 7 S., R. 31 E., 3 miles below intake and 6 milesnorthwest of Duncan, Greenlee County.
RECORDS AVAILABLE. September 19, 1914, to September 30, 1915. July 20,1923, to September 30, 1926.
GAGE. Vertical staff gage on left bank; read by Annie Zumwalt. DISCHARGE MEASUREMENTS. Made from footbridge at gage. CHANNEL AND CONTROL. Bed composed of silt. Banks not subject to overflow.
No well-defined control.DIVERSIONS. About 12 acres irrigated above gage. REGULATION. By head gates. Flow in canal varies considerably with flow in
Gila River. ACCURACY. Stage-discharge relation continually changing. Rating curves
fairly well defined. Gage read to hundredths twice a day. Daily dischargeascertained by applying mean daily gage height to rating table; shifting-control method used for entire year. Discharge estimated May 16-31.Records good.
Canal diverts water from right side of Gila River in SE. 31 E., for irrigating 460 acres in the vicinity of Sheldon.
see. 11, T. 8 S., R.
Discharge measurements of Colmonero Canal near Duncan, Ariz., during the year ending September 80, 1926
Date
Dec. 2 Dec. 20. ....Jan. 7... ..... ...
Feb. 23. ___ .Mar. 17. -
Gage height
Feet 0.83.76.41.16
1.23.64
Dis charge
Sec.-ft. 3.83.91.4.2
7.96.1
Date
Apr. 19
May 11... ...
Gage height
Feet0.981.121.131.001.501.64
Dis charge
See.-ft. 6.78.a7.46.57.65.8
Date
June 27 ____July 19 __ _July 2GL. . ......
Sept. 22.... ....
Gage height
Feet \ 1.241 1.42
1.40: .so
1.20
Dis charge
See.-ft. 2.36.15.91.84.1
GILA RIVER BASIN 107
Daily discharge, in second-feet, of Colmonero Canal near Duncan,. Ariz., for the year ending September 80, 1926
Day
\... ...................3.-..- __ . _ 4...... __ ..... 5 -.-
6.... . _ 7... ... - ... 8-.. - _ ......9... _ .... ...10-..
11.... 12... __ ..... __13... _ . ___ . _14....- 15. ___ ..... __ .. _ -
16... 17-.. 18.--. . 19..... ....... .. 20--.
21...... 22... 23--- . . _ .......24.-.. __ ....25
26... 27..- - _ ...........28... _ ...29..- . 30.-.-. __ ...31.-- __ ..
Nov.
6.4
2.42.82.63.43.3
3.6s o3.94.04 1
Dec.
4.03.93.84.24.2
4.34.44.44.54.4
4.44.44.54.54.2
4.04.04.44.54.7
4.74.8J. s4.94.8
4.94.03.73.53.23.5
Jan.
3.43.43.3
1.41.41.41.1
1.41.11.41.7
.2
.3
.3
.2
Feb.
2.52.92.94.75.7
5.65.85.25.65.9
6.06.05.97.07.0
7.05.66.2
Mar.
5.94.82.4
9.57.5
6.96.56.86.56.3
5.55.25.27.78.4
7.96.37.26.35.9
6.49.0
Apr.
3.06.76.26.86.7
6.56.46.46.55.8
5.96.06.66.96.8
6.75.35.28.17.7
7.17.06.05.74.4
5.35.35.35.25.5
May
7.57.68.07.67.9
8.17.97.87.16.5
7.37.37.36.96.7
7.0
June
7.57.36.25.85.2
6.15,84.54.66.2
3.84.74.05.74..8'
5.52.91.1.7
2.8
3.23.5.4..4
2.2
5.73.95.04.33.7
July
3.62.62.01.22.5
1.2.3.1
3.23.05.15.6
6.05.45.15.85..9
5.52.65.56.56.7
5.27.35.97.37.85.7
Aug.
3.16.36.15.44.8
5.64.83.55.85.7
1.03.94.63.8
2,2.8
1.44.93.4
2.23.82.6
2.31.7
Sept..
0.91.0.8
1.11.1
1.01.1.9
1.2.5.
2.33.21.91.63.6
4.74.64.94.34.0
2.03.03.54.13.7
3.32.52.55.25.3
NOTE. No flow on days for which no discharge is given.
Monthly discharge of Colmonero Canal near Duncan, Ariz~, for. the year endingSeptember SO, 1926
February.. ..............................................
July-.-- . ......... ......... ... ......... .......
jjiscna
Maximum
04.14.93.47.09.58.18.17.57.86.35.3
9 5
arge m seeonc
Minimum
003.200,
! 0; 3.0,
6.5i .4,
01 0
.5
0
i-iee?
Mean
01.164.27..71
3.48i 4.65i 6.10
7.214.254.02
i 3.012.66
3.46
Run-off ittacre-feet
068. i
26343.7
193286363.443,253247185158
2,500
YORK CANAL AT YORK, AEIZ.
LOCATION. In SE. % sec. 19, T. 6 S., R. 31 E., half a mile below intake,, opposite- suspension bridge at York, and 16 miles north of Dmiean,, Greenlee County..
RECORDS AVAILABLE. May 15, 1923, to September 30,. 1926,, diselayge measure ments only. September 19,1914, to September 30,, iai5_
GAGE. None.80720 30 8
108 SURFACE WATER SUPPLY, 1926, PART IX
DISCHABGE MEASUREMENTS. Made by wading near road crossing.CHANNEL AND CONTROL. Bed composed of silt. Banks not subject to overflow.
No well-defined control.DIVERSIONS. None above measuring station.REGULATION. By head gate. Flow in canal varies with flow in Gila River. ACCURACY. No gage heights obtained. Discharge measurements only.
Canal diverts water from right side of Gila River in SW. Y* sec. 29, T. 6 S., R. 31 E., for irrigating 286 acres in the vicinity of York.
The following discharge measurements were made during the year: August 30, 1926: Discharge, 4.7 second-feet. September 22, 1926: Discharge, 3.0 second-feet.
BROWS' CANAL NEAR SOLOMOffSVIILE, ARIZ.
LOCATION. In SE. Y* SE. % sec. 30, T. 6 S., R. 28 E., near Earven ranch, a quarter of a mile below intake and 10 miles east of Solomonsville, Graham County.
RECORDS AVAILABLE. June 1, 1914, to September 30, 1915; December 20, 1920, to September 30, 1926.
GAGE. Vertical enamel staff on right bank 10 feet below head .gate; read by J. W. Earven.
DISCHARGE MEASUREMENTS. Made by wading.CHANNEL AND CONTROL. Bed composed of silt. Banks not subject to overflow.DIVERSIONS. No diversions above gage.REGULATION. By head gates. Flow in canal varies considerably with flow in
Gila River.ACCURACY. Stage-discharge relation not permanent. Standard rating curve
well defined. Gage read to half-tenths twice a day October 1 to December 31, and thereafter to nearest two-hundredths. Daily discharge ascertained by applying mean daily gage height to rating table; shifting-control method used for entire year. Records good.
Canal diverts water from right side of Gila River in the SE. % sec. 30, T. 6 S., R. 28 E., for irrigating about 820 acres east of Solomonsville.
Discharge measurements of Brown Canal near Solomonsville, Ariz., during the yearending September SO, 1926
Date
Dec. 12..... ....Jan. 12.........Feb. 4__. .......Mar. 1.... ......
Gage height
Feet 4.305.044.914.87
95.08
Dis charge
Sec.-ft. 2.6
11.311.48.7
13.0
Date
Mar. 24.. .......Apr. 16 May 13. -
June 23 ........
Gage height
Feet5 K1
5.244.805 0M.
4.57
Dis charge
Sec.-ft. 20.314.05.6
3.9
Date
July 17.... ....Aug. 8.. ........Aug. 28... .
Gage height
Feet 5.18
5.015.03
Dis charge
Sec.-ft.14. 010.810.6
Daily discharge, in second-feet, of Brown Canal near Solomonsville, Ariz., for the year ending September SO, 1926
Day
1 __ _ _ ......2 __ ... .... .3.. _ ... ...4. ...........5.... ..... _ ...« . .. 7.... ...........8. ...........9...............10.. ..........
Oct.
0000000000
Nov.
2.62.62.62.62.62.62.62.62.62.6
Dec.
19
23oq
2322
22222222
Jan.
269719
2424242424oc
13
Feb.
262626202600
99
000
Mar.-to
16151413
1°L
151515
Apr.
01
oo01
01
oo01
01
°.l
31
May
2901
°.101
01
°.lo-i
OQ
00
30
June
°. 4.5 0
5.65 0
6.1
166.66.72.1
July
9 C
2 79 7
2.6K Q
7 Q
5 0
9 d
.8
Aug.
17Ifi
10
26f)f
4.219
1621
Sept.
9 9.
9 ft
2 Q
9 7
2.69 79 ft9 Q
6.0
GILA RIVER BASIN 109
Daily discharge, in second-feet, of Brown Canal near Solomonsville, Ariz., for the year ending September SO, 1926 Continued
Day
11.... . _ . ...12 _ ..... ___ .13.... ... .....14... ........15.......... .....
16......... __ .17...............18- _ ..........19-. ....20
21 . 22. .........23 ......24 ___25 .........
26. 27 .......28.. ..........29 - 30... ... .........31.... ........
Oct.
06.2.127.63.8
3.83.8121212
1212145.2.4
.4
.4
.41 9
9 R
Nov.
3.23.8141414
1414141413
1313131318
24242419
12
Dec.
211Q
212222
2222222299
2222232323
232323oq
2326
Jan.
1317282727
2727272828
2827272627
282930323427
Feb.
000034
3434343434
2234343423
151314
Mar.
1214191919
1919313232
3132312731
31323411159S
Apr.
313130912
16111818
3636393620
2316172728
May
33185.84.0.6
3537373029
28285.65.65.3
5.35.05.0125.01.1
June
6.97.47.67.47.8
2.21.52.62.62.8
2.82.43.33.14.2
2.92.92.82.33.9
July
0.74.79.71110
9.511118.011
1314141820
212020203430
Aug.
3031313231
2926185.88.2
9.38.98.54.6.8
.4
.42.31.12.62.1
Sept.
202.93.72.47.1
8.28.75.31111
111115129.9
1212128.35.3
Monthly discharge of Brown Canal near Solomonsville, Ariz., for the year endingSeptember 30, 1926
Month
October..... __________ _ __ __ ..........
December __________________________
March. ____________________________ .
July.... -. .. -.. .-.--._-... ._.--......_.....August _____________________________
Discharge in second-feet
Maximum
14 24 26 34 34 34
' 39 39 16 34 32 20
39
Minimum
0 2.6
12 12 0 8 9 .6
1.2 .7 .4
2.3
0
Mean
4.01 10.3 22.0 25.4 20.4 21.0 26.6 21.5 5.07
11.1 15.0 7.31
15.8
Run-off inacre-feet
247 613
1,350 1,560 1,130 1,290 1,580 1,320
302 682 922 435
11,400
BROWN CANAL WASTEWAY NEAR SOLOMONSVILLE, ARIZ.
LOCATION. In SE. % NE. % sec. 31, T. 6 S., R. 28 E., near Earven ranch, 10miles east of Solomonsville, Graham County.
RECOKDS AVAILABLE. December 20, 1920, to September 30, 1926. GAGE. Vertical enamel staff on right bank 200 feet below waste gate; read by
J. W. Earven.DISCHAKGE MEASTJKEMENTS. Made by wading. CHANNEL AND CONTKOL. Bed composed of silt. Channel straight. Banks,
not subject to overflow. DIVEKSIONS. None.REGULATION. Complete regulation by waste gate of Brown Canal. ACCXJKACY. Stage-discharge relation not permanent. Rating curves fairly
well defined. Gage read twice a day to half-tenths until January 17 andto two-hundredths thereafter. Daily discharge ascertained by applyingmean daily gage height to rating tables. Records fair.
Wasteway returns water from Brown Canal to Gila River half a mile below station on Gila River near Solomonsville.
110 SURFACE WATER SUPPLY, 1926, PART IX
Discharge measurements of Brown Canal wasteway near Solomonsville, Ariz. f during the year ending September SO, 1926
Date
Dec. 12. Jan. 12.. Feb. 4 ....Mar. 1... .
Gage height
Feet 5.735.485.585.10
Dis charge
Sec.-ft. 6.23.14.0.3
Date
Mar. 24.... ..
July 17.........
Gage height
Feet 5.255.275.855.25
Dis charge
Sec.-ft. 0.9.9
9.6.8
Date
Aug. 8 ___ .Sept. 19-
Gage height
Feet 5.755.69
Dis charge
Sec.-ft. 4.6.3.6
Daily discharge, in second-feet, of Brown Canal wasteway near Solomonsville, Ariz. f for the year ending September 30, 1926
Day
1... .
4 _ - . 5-
6- 7 ____ . 8 _ -.. .
10 _ . . -
11.- .. -to
10
14 _ . __ 15--
16 __ - -17 ______ . .1R
19 __ -_ 20 __ -
21 ___ 22 __ . _ .23 24 __ 25--
26-- 27 __ - - 28- 29 _____ ...tnql
Oct.
0.1
.1
.......
Dec.
0.1
.1
.1
.1
.62.1
2.12 Q
2 -1
O 1
2.1
2.12.1
2.1.1
.1
.1
.1
.1
.1
.1
.1
.1
.1
Jan.
2.19 1
.1
.1
.1
1.2
O 1
^ 1
3 1
^ i3.5 3.6
1.2
3.5.8
2.42.59 ft
2.42.5
Feb.
1.49 fi
o O
.7
.4
2 0
2.32.3.7 .5
9 d.
2.12.42.31.4
Mar.
0.2.3.2.0.6
.3
.7
.3
1.6
2.42.32.22.62.2
2.1
.62.22.41.7.7
2.2.7.4.6.7.6
Apr.
4.71.22.4.3.4
1.2
.6
1.0.8
2.6 3.0
3.53.53.45.23.2
5.04.75.04.66.8
May
1,4
.1
.62.4
9 1
.6
.12.1 .1
.1
.1
.1
.79.0.6
1.1
June
0.1.1
1.0.6
.1
.72.11.0
.1
.1
.1
------
July
0.3.8
.1
.5
1.11.8.7.2
Aug.
0.1
1.9
.2
1.7
.41.7.6 .4
.1
.2
.1
.4
Sept.
0.1.4
3.ft 3.7
3.»1.3.1
5.13.4.»
2.3
NOTE. No flow on days for which no discharge is given.
Monthly discharge of Brown Canal wasteway near Solomonsville, Ariz., for the year ending September 30, 1926
Month
December .. . ____________________
April..... -_ . May _ _ . ._. .
JulyAugust __ - ___________________________September- .. _________________
The year. _ . _ _ _______________
Discharge in second-feet
Maximum
0.1 0 2.9 3.6 2.6 2.6 6.8 9.0 2.1 1.8 1.9 5.1
9.0
Minimum
0 0 0 0 0 0 0 0 0 0 0 0
0
Mean
0.01 0 .78
1.62 .92 .99
2.12 .69 .20 .18 .26 .S3
.71
Run-off in acre-feet
0.6 0
48. tt 99.fr 51.1 60.9
126 42.4 11.9 11.1 15.4 49.4
516
GILA KIVEE ?ASIN ,
MICHELANA CANAL NEAR SOLOMONSVILLE. ARIZ.
Ill
LOCATION. In NE. % SW. % sec. 3, T. 7 S., R. 27 E., at Moody ranch, a quarter of a mile below head gate and 6 miles northeast of Solomonsville, Graham County.
RECORDS AVAILABLE. October 1, 1914, to September 30, 1915; December 21, 1920, to September 30, 1926.
GAGE. Vertical staff on right bank 30 feet below wagon bridge; read by Edwin Carpenter.
DISCHARGE MEASUREMENTS. Made from footbridge.CHANNEL AND CONTROL. Bed composed of silt. Banks vertical. No well-
defined control.DIVERSIONS. None above gage.REGULATION. By head gate. Flow in canal varies considerably with flow in
Gila River.ACCURACY. Stage-discharge relation not permanent. Standard rating curve
well defined. Gage read to half-tenths twice daily. Daily discharge ascer tained by applying mean daily gage height to rating table; shifting-control method used for entire year. Records good.
Canal diverts water from right side of Gila River in SW. % sec. 31, T. 7 S., R. 28 E., for irrigating about 450 acres in vicinity of Solomonsville.
Discharge measurements of Michelana Canal near Solomonsville, Ariz., during, the year ending September 30, 1926
Date
Oct. 3_ Nov. ll..___.
Jan. 11...... __Feb. 3. .-
height
Feet 3.454.103.533.583.64
Dis charge
Sec.-ft. 0.14.2.0.4.4
Date
Feb. 27 Mar. 23.--. Mar. 24... ......Apr. 16 . --May 13.. ....
Gage height
Feet 3.574.604.494.124.04
Dis charge
Sec.-ft. 0.4
11.89.86.14.3
Date
July21 .....Aug. 7 . ..... .Aug. 27 Sept. 20. _______
Gage height
Feet 3.753.724.534.203.79
Dis-charge
See./*. 1.31.19.35.81.5
Daily discharge, in second-feet, of Michelana Canal near Solomonsville, Ariz., for the year ending September 30, 1926
Day
!.__.. _ _ .^.. .............3 4____. ......-.._5...... ___ ....
6 _. .
8 ________9.10
12. ______________13. ______________
15. . _ - -.
16 _ ... .17.,... ..........18... ____________19_._ ...30-...... ..
Oct.
00000
02.01 Q
3.94.7
.6
.4
00000
Nov.
5.24.43.34.65.1
F ^
5.1
4.94.8
4.44.24.03.73.7
3.84.24.34.24.0
Dec.
00000
0000
000
0
0000.5
Jan.
0.5.5.5.5
.5
.4
.4
.4
.3
.3
.4
.4
.4
.4
Feb.
0.3.3.3.3^
.4
.4
.6
2 22.2000
000
.8
Mar.
0.2
4.75.74.7
5 0
5.03.82.61.8
1.71.71.71.79.1
9.19.49.49.49.4
Apr.
2.81.31.01.01.0
1.015141311
7.67.67.15 _.6.5
6.05.95.64.83.8
May
5.33.63 Q
7.46.8
4.63.24.15,06.0
5 4
5.14.02.61.8
8.88.27.57.26.7
June
5.3
5.15.35.3
_. 0
4.23.51.81.8
2.63.03.03.03.0
2.92.92.92.92.9
July
2.43.23 O
4.16.1
9.18.47.76.20.5
5.55.5
5.05.0
4.03.11.57.74.0
Aug:
6.07.82.82.52.2
11101110
19
1314 JO
7.8
7.47.88.28.56. If
Sept.
6.86.87.16.96.9
6.76.76.56.75.8
7 ft
5.31.5-6.4
.2
.2
.71.41.5
112 SURFACE WATER SUPPLY, 1926, PART IX
Daily discharge, in second-feet, of Michelana Canal near Solomonsville, Ariz., for the year ending September SO, 1926 Continued
Day
21 22. ___ . ___ ..23 ... .. ....24 . ___ .25
26 -...... ..27 _28 .. _ ...29 30- ___ ... 31 .
Oct.
2.85.75.75.75.7
5.65.45.45.45.25.2
Nov.
3.83.63.33 1
2.6
2.11.1
00
Dec.
0 58899
988999
Jan.
0.4.4.4
.6
.5
.5
.5
.5
Feb.
0*.8.6
.3
.3
.2
Mar.
9.410121010
9.49.59.59.48.88.8
Apr.
3.32.94.68.48.4
8.91212117.6
May
5.85.65.55.35.2
5.35.65.65.65.55.4
June
2.82.41.61.51.3
1.31.31.62.02.0
July
1.76.67.16.63.7
4.08.06.76.55.55.9
Aug.
6.86.26.05.98.1
6.96.36.26.16.26.3
Sept.
2.22.73.02.73.6
2.76.62.02.5.8
Monthly discharge of Michelana Canal near Solomonsville, Ariz. r for the year endingSeptember SO, 1926
Month
October __ . _________________________
December. ________ ..... __ ... ____ _____
March ______________ . ______________April--. . . May _____________ . _ .... ___ _ .... ...
July.. ... _- . August.. ...j _____ ___ ___ ___ ___ __ __
The year _________________________
Discharge in second-feet
Maximum
5.7 5.4 .9 .6
2.2 12 15 8.8 5.3 9.1
14 7.8
15
Minimum
0 0 0 .3
0 .2
1.0 1.8 1.3 1.5 2.2 .2
0
Mean
2.38 3.61 .31.45 .46
6.56 6.68 5.39 2.97 5.31 7.78 3.84
3.83
Run-off in acre-feet
146 215
19.1 27.7 25.5
403 397 331 177 326^ 478 228
2,770
FOURNESS CANAL NEAR SOIOMONSVELIE, ARIZ.
LOCATION. In SE. }i SE. % sec. 35, T. 6 S., R. 27 E., three-quarters of a mile below intake and 8 miles east of Solomonsville, Graham County.
RECORDS AVAILABLE. October 1, 1914, to September 30, 1915; December 20, 1920, to September 30, 1926.
GAGE. Vertical staff on right bank 300 feet below waste gate; read by P. Miranda and J. Abeita.
DISCHARGE MEASUREMENTS. Made by wading at gage.CHANNEL AND CONTROL. Bed composed of silt. Channel small and uniform
in cross section. No well-defined control.DIVERSIONS. No diversions above gage.REGULATION. By head gate. Flow in canal varies considerably with flow in
Gila River.ACCURACY. Stage-discharge relation not permanent. Standard rating curves
well defined. Gage read to two-hundredths twice a day. Daily discharge ascertained by applying mean daily gage height to rating table; shifting- control method used March 24 to May 9 and August 9 to September 30. Discharge estimated December 1-11, 13-31, and January 7-10. Records good.
Cahal diverts water from left side of Gila River in NE. Yt sec. 1, T. 7 S., R. 27 E., for irrigating about 260 acres in the vicinity of Solomonsville.
GILA RIVER BASIN 11S
Discharge measurements of Fourness Canal near Solomonsville, Ariz. t during the year ending September SO, 1926
Date
Dec. 12 _ . .....Jan. 11 .........Feb. 3..... .Feb. 27 .........Mar. 23 ........
Gage height
Feet 3.954.274.354.715.50
Dis charge
Sec.-ft. 0.0.1.3
2.911.2
Date
Mar. 24 .........Apr. 18 .........
Gage height
Feet 5.504.525.045.284.59
Dis charge
Sec.-ft. 11.7
.63.66.3.2
Date
July 17. ....-.
Aug. 28.. .
%Feet 4.835.494 70
Dis charge
Sec.-ft. 1.68.6.9
Daily discharge, in second-feet, of Fourness Canal near Solomonsvillef Ariz. t for the year ending September SO, 1926
Day
I- ...............2 ____________3 ____ . ____ ..4...................5. _ ...... _ ... _
6. ..7 __ . __ . ___ .8...................9......... __ ......
10... ................
11...... _______ .12 _ ... _____ ....13.. ___________14.. _____ . ___ ..15 _____ . _____ ..
16 _ . ___ ..........17...................18 _____ ...........19 ___ . _____ . _ .20............ .......
21 . ___ ....22..... ___ . __ . ...23 _ .. __ . .........24...................25 _ ... ___ . _ . ...
26 ................27.. _ . ___ . _ ....28............. __ ..29...................30...................31 .
Nov.
1.23 7
3.73.73.7
3.73.73.73.73.7
Jan.
1010105 21.2
1.2
1-.1
8.95.93.25.5
8.18.92.8.4.2
.3
1.2.6.2
.2
.2
.2
.2
.2
Feb.
0.2.2.4.4.4
.53.73.04.94.5
4.14.13.93.83 Q
6.26.86.26.85.2
6.83 9
7.57.48.0
7.65.22.8
Mar.
2.83.23.73.23.9
3.92.25.9
1111
128.16.86.89 0
1212121210
1211
1111
12129 74.5.4.3
Apr.
8.69.89.88.99.7
7.48.89.05.46.4
6.26.81.5.2
2.2
2.01.11.85.65.5
5.4^ i3.13.05.7
4.04.47.27.77.1
May
8.97.55.73 4
3.9
3.34.95.83.24.0
4.02.93.12. 1
.3
.92.35.57.4
8.28.27.45.54.4
4.85.56.66.36.85.5
June
4.42.31.5.9.4
8.9&97.54.6
1.81.51.2.7.6
.9
.8
.4
.4
.3
.3
.4
1.4
2.11.4
.4
.8
July
0.3.1.4
.5
1.52.11.0.9.3.4
7.04.4
1.0
1.11.0.7.4.1
6.4.67.47.03.3
.7
4.43.6
Aug.
9.27.0
.4.47.65.7
01.64.35.34.2
6.99.39 a4.48.4
8.5.7
7.74.53.2
1.6.6
3.98.0.6
4.11.21.01.94.51.1
Sept.
1.01.61.3
1.8
1.51.11.61.65.8-
3.4
1.2-
.*
NOTE. No flow on days for which no discharge is given.
Monthly discharge of Fourness Canal near Solomonsville, Ariz., for the year ending- September SO, 1926
Month
February _ . _ .... ____ .. ____ ..
April..... . . ......... ..........May _____________________________June . ... ....July...... ................................................
The year. _______________________
Discharge in second-feet
Maximum
0 3.7 0
10 8.0
*2 9.8 8.9 8.9 7.4 9.8 5.8
12
Minimum
0 0 0 .1 .2 .3 .2 .3
0 0 0 0
0
Mean
0 1.15 0 2.76 4.20 7.95 5.66 4.82 1.84 1.95 4.55 .74
2.97
Run-off in acre-feet
0 68.4-
0 170 233 489 337 296 109 120 280 44. 0»
2,150
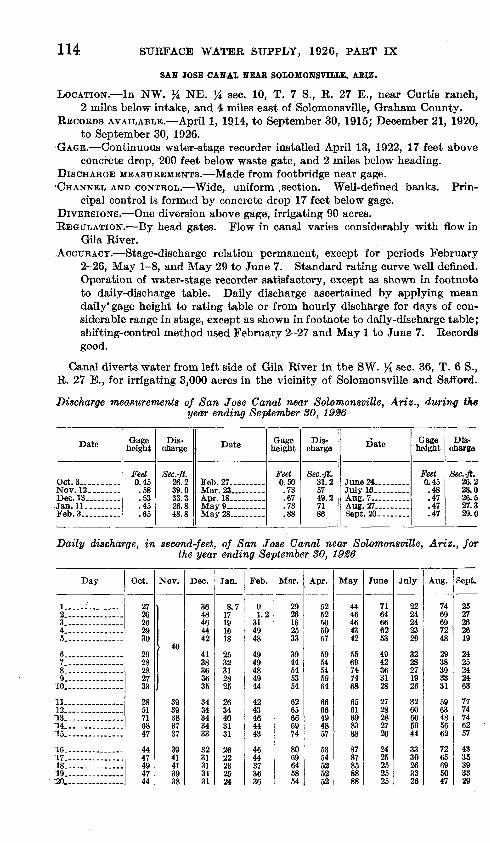
114 SURFACE WATER SUPPLY, 1926, PART IX
SAN JOSE CANAL NEAR SOIOMONSVHIE, ABIZ.
LOCATION. In NW. % NE. # sec. 10, T. 7 S., R. 27 E., near Curtis ranch, 2 miles below intake, and 4 miles east of Solomonsville, Graham County.
BECOBDS AVAILABLE. April 1, 1Q14, to September 30, 1915; December 21, 1920, to September 30, 1926.
GAGE. Continuous water-stage recorder installed April 13, 1922, 17 feet above concrete drop, 200 feet below waste gate, and 2 miles below heading.
DISCHARGE MEASUREMENTS. Made from footbridge near gage. CHANNEL AND CONTROL. Wide, uniform section. Well-defined banks. Prin
cipal control is formed by concrete drop 17 feet below gage.DIVERSIONS. One diversion above gage, irrigating 90 acres.REGULATION. By head gates. Flow in canal varies considerably with flow in
Gila River.ACCURACY. Stage-discharge relation permanent, except for periods February
2-26, May 1-8, and May 29 to June 7. Standard rating curve well defined. Operation of water-stage recorder satisfactory, except as shown in footnote to daily-discharge table. Daily discharge ascertained by applying mean daily'gage height to rating table or from hourly discharge for days of con siderable range in stage, except as shown in footnote to daily-discharge table; shifting-control method used February 2-27 and May 1 to June 7. Records good.
Canal diverts water from left side of Gila River in the SW. % sec. 36, T. 6 S., U. 27 E., for irrigating 3,000 acres in the vicinity of Solomonsville and Safford.
Discharge measurements of San Jose Canal near Solomonsville, Ariz., during the year ending September 80, 1986
Date
Oct. 3.... Nov. 12........Dec. 13 .........Jan. 11. ___ ..Feb. 3.... ......
Gage height
Feet 0.45.58.53.45.65
Dis charge
Sec.-ft. 26.239.033.326.848.8
Date
Feb. 27 Mar. 23 .......Apr. IS.. .TWsnr QMay 28 ... ...
Gage height
Feet 0.50.73.67.78.88
Dis charge
Sec.-ft. 31.25749.27186
Date
Julyl6... ......
Aug. 27. _Sept. 20.
Gage height
Feet 0.45.48.47.47.47
Dis charge
Sec.-ft. 26.228.026.527.329.0
Daily discharge, in second-feet, of San Jose Canal near Solomonsville, Ariz,, for the year ending September 30, 1926
Day
1. _ ...........2 _ ............3 _ ............4 _ ............5.. ........
6 _ ...7 _____ ------8 ....9. ... .... .10.
11 __ . _ ......12 13. ........14 _ ....... .....15
16 17 18 19. :20 __ . ____ .
Oct.
2726262930
2928282733
2851716847
4447494744
Nov.
40
3939383737
3941413938
Dec.
3648464442
4138363635
3434343433
3231313131
Jan.
Q 7
17191618
2532312825
2634403131
2622232524
Feb.
01.2
314948
4049484944
4243464443
4644373636
Mar.
2926162533
3944545354
6265666974
8069645854
Apr.
5252505057
5954545964
6666494857
5354525252
May
4446464342
5569747468
6561698388
8787858888
June
7164666253
4942363128
2728282726
2425252525
July
2224242329
3228271926
3260665944
3330263326
Aug.
7469697248
2938393331
5963485662
7265695047
Sept.
2527262619
2425242463
7774746257
4335393329
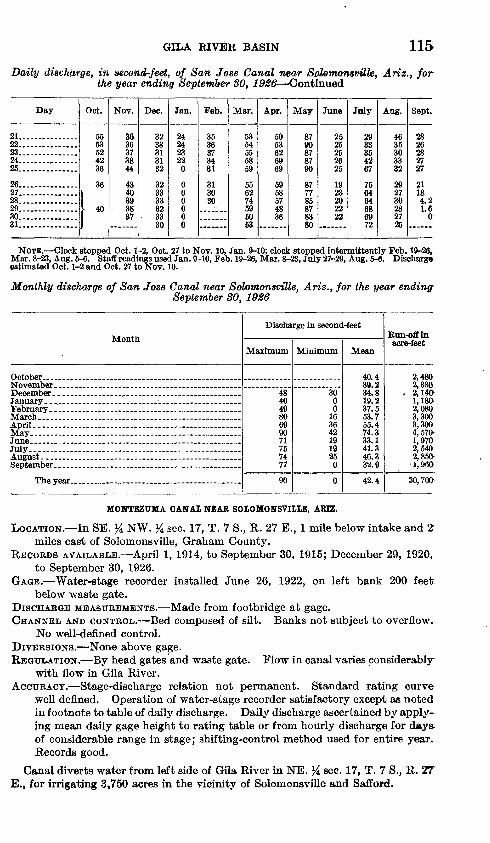
GILA RIVER BASIN 115
Daily discharge, in second-feet, of San Jose Canal near Stdomon&ville, Ariz., for the year ending September SO, 192B Continued
Day
21.... ........22..............23 _ ............24....-..... ..25.... ........
26 . ..27 __ .... _ ....28....... ..29.... ....30- _______81 ____ . ___ .
Oct.
5553524236
36
40
Nov.
3636373844
4340393887
Dec.
v>33313132
323333323330
Jan.
242423220
000000
Feb.
3536373431
313030
Mar.
5354555859
556274595053
Apr.
i?n536269 9
5958574836
May
97
90878790
877785978380
June
2525252625
1923202222
July
9Q
33
4267
756464686972
Aug.
4635303332
292730282725
Sept.
2826282727
21184.21.60
NOTE. Clock stopped Oct. 1-2, Oct. 27 to Nov. 10, Jan. 9-10; clock stopped intermittently Feb. 19-26,. Mar. 8-23, Aug. 5-6. Staff readings used Jan. 9-10, Feb. 19-26, Mar. 8-23, July 27-29, Aug. 5-6. Discharge estimated Oct. 1-2 and Oct. 27 to Nov. 10.
Monthly discharge of San Jose Canal near Solomonsville, Ariz., for the year endingSeptember SO, 1926
Month
January- .. ___ ... . .. __ _ . __
April.-
July-.... _
September. __________________ . ______
Discharge in second-feet
Maximum
48 40 49 80 69 90 71 75 74 77
90
Minimum
30 0 0
16 36 42 19 19 25
0
0
Mean
40.4 39.2 34.8 19.2 37.5 53.7 55.4 74.3 33.1 41.3 46.3 32.9
42.4
Run-off in acre-feet
2,480 2,330
. 2,140- 1,180- 2,080 3,30fr 3,300 4,570- 1,970 2,540 2,850- 1, 960-
30,700-
MONTEZUMA CANAL NEAR SOLOMONSVILLE, ARIZ.
LOCATION. In SE. % NW. # sec. 17, T. 7 S., R. 27 E., 1 mile below intake and 2 miles east of Solomonsville, Graham County.
RECORDS AVAILABLE. April 1, 1914, to September 30. 1915; December 29, 1920, to September 30, 1926.
GAGE. Water-stage recorder installed June 26, 1922, on left bank 200 feet below waste gate.
DISCHARGE MEASUREMENTS. Made from footbridge at gage.CHANNEL AND CONTROL. Bed composed of silt. Banks not subject to overflow.
No well-defined control.DIVERSIONS. None above gage.REGULATION. By head gates and waste gate. Flow in canal varies considerably
with flow in Gila River.ACCURACY. Stage-discharge relation not permanent. Standard rating curve
well defined. Operation of water-stage recorder satisfactory except as noted in footnote to table of daily discharge. Daily discharge ascertained by apply ing mean daily gage height to rating table or from hourly discharge for days; of considerable range in stage; shifting-control method used for entire year. Records good.
Canal diverts water from left side of Gila River in NE. % see. 17, T. 7 S., R. 27" E., for irrigating 3,750 acres in the vicinity of Solomonsville and Safford.
116 SURFACE WATER SUPPLY, 1926, PART IX
Discharge measurements of Montezuma Canal near Solomonsville, Ariz., during the year ending September 80, 1926
Date
Oct. 3. ... ...Nov. 12.......IDec. 13... ......Jan. 11. __ ....Feb. 4.... __ .
Gage height
Feet 8.559.249.017.988.84
Dis charge
Sec.-ft. 36.8635312.846.0
Date
Feb. 27... .....
Apr. 17 May 9 ..........
Gage height
Feet 8.519.309.609.75
10.07
Dis charge
Sec.-ft. 32.768748601
Date
July 16.-- ...
Aug. 27... ----._Sept. 17... ..
Gage height
Feet 8.30
8.558.368.46
Dis charge
Sec.-ft. 26.736.034.525.229.5
Daily discharge, in second-feet, of Montezuma Canal near Solomonsville, Ariz., for the year ending September SO, 1926
Day
1... .......2 ...........3... ............4...............5. ...... _
6-----.. .. --.--.7.. .........8. .......9 ............10 ............
11 ____ .... ....12 _ .......... .13 ... _ .14 _ _..' _ _ . .15 _ . __ .......
16.. _ ...17 18. . _ ...19 ............ 20- .-..
21___. ......... .. 22 ........ 23 -.. ....... . 24.. . ......25... ...... .....
26 ......27 28 29 -30......... ......31 ............
Oct.
5007
4551
4847433944
5766676667
6766636059
57524950CA
504847474644
Nov.
4239385268
6666656362
62
626160
6161616059
5858585857
52,
5252
Dec.
CO
535653
55555454
54
545353
5353535453
5252525151
50en
505050
Jan.
4800
01
2928
2827262626
181 9
11112956545557
5655555558
58CO
57585856
Feb.
5757CO
4751
525050474C
444.0
4342
454C
434650
5046423937
37OC
Mar.
qo
3436
42KA
656971
77.80807675
73727267PA
6468676668
878981767079
Apr.
7780848179
69
617570
7376767980
7774736879
8177789186
9292908681
May
93Q1898591
95103938786
8494928373
68
827470
6473828180
808890848179
June
6964646358
53CO
484438
28OC
2623
2120212499
2222302838
26OC
2626OK
July
00
2226
3400
332697
26466872CO
41O7
363528
2724252868
798080767780
Aug.
7674857756
44OJ.
383738
78687066
7470656053
50372531OQ
28<JC
24289Q33
Sept.
2936342726
2626262646
8383777677
5239524438
3231312627
3453535148
NOTE. Clock stopped Nov. 1-12, 17-30, Dec. 1-6, 16-20; staff readings (gage read twice a day to nun- dredths) used during these periods.
Monthly discharge of Montezuma Canal near Solomonsville, Ariz., for the yearending September 80, 1926
Month
July... . _. .
Discharge in second-feet
Maximum
67 68 56 58 57 89 92
103 69 80 85 83
103
Minimum
3738 50 11 34 32 61 64 20 22 24 26
11
Mean
52.2 57.3 52.6 40.0 45.4 65.2 78.3 83.7 34.8 43.6 50.5 43.6
54.0
Run-off in acre-feet
3,210 3,410 3,230 2,460 2,520
.4,010 4,660 5,150 2,070 2,680 3,110 2,590
39,100
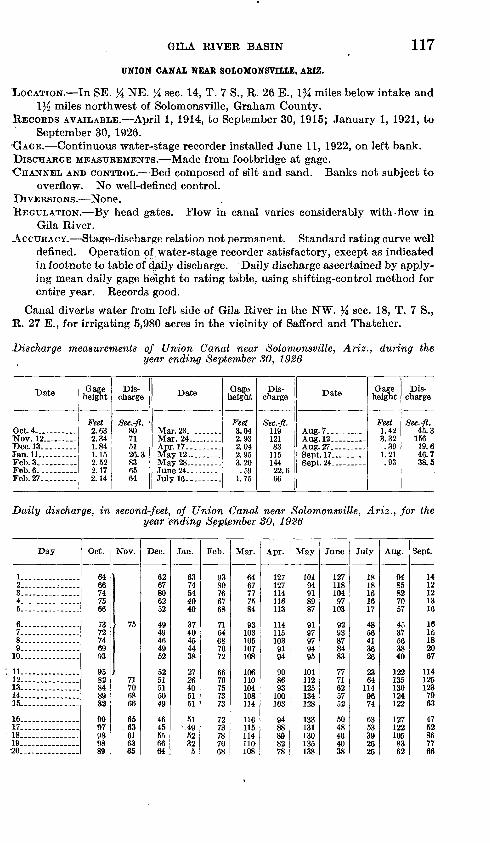
GILA EIVER BASIN 117UNION CANAL NEAR SOLOMONSVHLE, ARIZ.
LOCATION. In SE. % NE. % sec. 14, T. 7 S., R. 26 E., 1% miles below intake and \% miles northwest of Solomonsville, Graham County.
RECORDS AVAILABLE. April 1, 1914, to September 30, 1915; January 1, 1921, to September 30, 1926.
'GAGE. Continuous water-stage recorder installed June 11, 1922, on left bank.DISCHARGE MEASUREMENTS. Made from footbridge at gage. CHANNEL AND CONTROL. Bed composed of silt and sand. Banks not subject to
overflow. No well-defined control.DIVERSIONS. None.REGULATION. By head gates. Flow in canal varies considerably with flow in
Gila River.ACCURACY. Stage-discharge relation not permanent. Standard rating curve well
defined. Operation of water-stage recorder satisfactory, except as indicated in footnote to table of daily discharge. Daily discharge ascertained by apply ing mean daily gage height to rating table, using shifting-control method for entire year. Records good.
Canal diverts water from left side of Gila River in the NW. % sec. 18, T. 7 S., R. 27 E., for irrigating 5,980 acres in the vicinity of Safford and Thatcher.
Discharge measurements of Union Canal near Solomonsville, Ariz., during the year ending September 30, 1926
Date
Oct. 4... ..... ...Nov. 12 . .....Dec. 13 ......Jan. 11.. _ -----Feb. 3. ... .Feb. 6. .....Feb. 27... ...
Gage height
Feet 2.632.341.841.152.522.172.14
Dis charge
Sec.-ft. 80715126.3836564
Date
Mar. 23 .....Mar. 24.
May 12 May 28
July 16-- .
Gage height
Feet 3.042.932.042.953.20.59
i 7c
Dis charge
Sec.-ft. 11912183
115144
22.666
Date
Aug. 7-
\11tr 97
Gage height
Feet L423.32.39
1.21.93
Dis charge
Sec.-ft. 45.3
15619.646.738.5
Daily discharge, in second-feet, of Union Canal near Solomonsville, Ariz., for the year ending September 30, 1926
Day
!---_. .---. ..2-. ̂ _ ..3. 4 _ ......... ...5 _ .. ..........
« 7 ___ .... .....8..... ..........9..... ..........
10...............
11... __ . ___ .12----.... _..____13...............14.... ....... ....15... ............
16.-.-...-.......17 ___ .... .....IS...............19 20
Oct.
6466747566
7372746993
9582848982
909708
9889
Nov.
75
717068
6563616365
Dec.
6267806252
4940
4640
52
5251515049
4645556664
Jan.
6374544040
3740454438
2726405151
51<1Q
52325
Feb.
01oft
766768
64fis7672
6670757371
727070
68
Mar.
6467777=QA
iflQ
105107108
106110104ino
114
116115114110108
Apr.
197
114116
114115
01O4
onSfi01
100103
048889
78
May
101O4
91QQ
87
Q1
9797QA
95
101
12513419S
135138
June
10497
92QQ
87QA
83
777162
CO
en
48464038
July
18IS
161617
4856413626
23641149674
63CO
392626
Aug.
O4
85827057
4537563840
1221351301241 99
127199
1058362
Sept.
1412121316
1616182067
1141251237963
4752867766
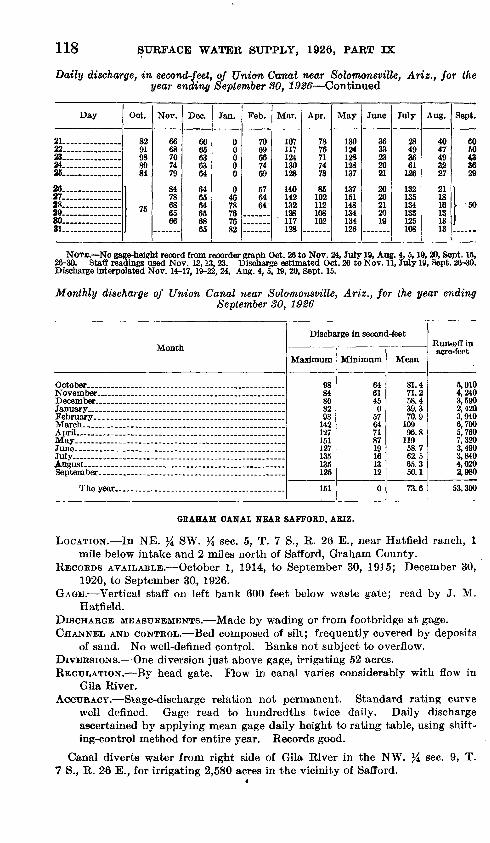
118
Daily
SURFACE WATER SUPPLY, 1926, PART IX
', in second-feet, of Union Canal near Solomonsville, Ariz., for the year ending September 80, 1926 Continued
Day
21 22 . .23 .. ..24 26 ________
26..... W. ..............28....... 39 ____ ........80. __ ..........81 .
Oct.
8291988984
75
Nov.
6668707479
8478686566
Dec.
6685636364
fid656465flQ
65
Jan.
00000
0dfi78
7676QO
Feb.
70fiQ667469
5764Rd-
Mar.
107117124130128
14014.9132128
' 117128
Apr.
7876717478
85102112108102
May
130124128128137
137151148134134126
June
3633232021
2020212010
July
28493661126
132135134133125108
Aug.
4n47493227
211816131313
Sept.
6050433629
11
NOTE. No gage-height record from recorder graph Oct. 26 to Nov. 24, July 19, Aug. 4, 5,19,20, Sept. 15, 26-30. Staff readings used Nov. 12,13,23. Discharge estimated Oct. 26 to Nov. 11, July 19, Sept. 26-30. Discharge interpolated Nov. 14-17,19-22, 24, Aug. 4, 5,19, 20, Sept. 15.
Monthly discharge of Union Canal near Solomonsville, Ariz., for the year endingSeptember 30, 1926
Month
October ___________________________November- _ - _____________________
January.. __ . _____________________
March.. __ . _ .. ____________________
May
July... .... ........... . . .
The year ______________________
Discharge in second-feet
Maximum
98 84 SO 82 93
142 127 151 127 135 135 125
151
Minimum
64 61 45
0 57 64 71 87 19 16 13 12
0
Mean
81.4 71.2 58.4 39.3 70.9
109 96.8
119 58.7 62.5 65.3 50.1
73.6
Run-off in acre-feet
5,010 4,240 3,590 2,420 3,940 6,700 5,760 7,320 3,490 3,840 4,020 2,980
53,300
GRAHAM CANAL NEAR SAFFORD, ARIZ.
LOCATION. In NE. % SW. }i sec. 5, T. 7 S., R. 26 E., near Hatfield ranch, 1mile below intake and 2 miles north of Safford, Graham County.
RECORDS AVAILABLE. October 1, 1914, to September 30, 1915; December 30,1920, to September 30, 1926.
GAGE. Vertical staff on left bank 600 feet below waste gate; read by J. M.Hatfield.
DISCHARGE MEASUREMENTS. Made by wading or from footbridge at gage. CHANNEL AND CONTROL. Bed composed of silt; frequently covered by deposits
of sand. No well-defined control. Banks not subject to overflow. DIVERSIONS. One diversion just above gage, irrigating 52 acres. REGULATION. By head gate. Flow in canal varies considerably with flow in
Gila River. ACCURACY. Stage-discharge relation not permanent. Standard rating curve
well denned. Gage read to hundredths twice daily. Daily dischargeascertained by applying mean gage daily height to rating table, using shifting-control method for entire year. Records good.
Canal diverts water from right side of Gila River in the NW. 7 S., R. 26 E., for irrigating 2,580 acres in the vicinity of Safford.
sec. 9, T.
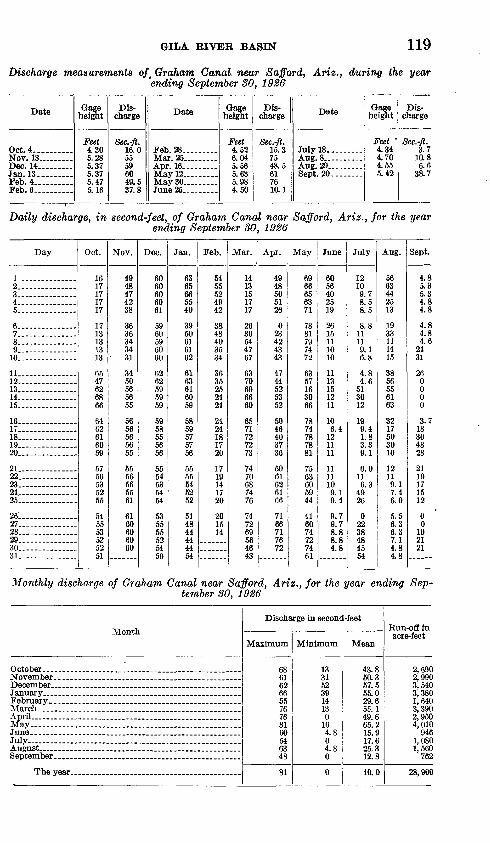
GILA RIVER BASIN 119
Discharge measurements oft Graham Canal near Safford, Ariz., during the year 'ending September SO, 1926
Date
Oct. 4..........Nov. 13.. Dec. 14.. .......Jan. 13. .....Feb. 4... .......Feb. 6 .... ...
Gage height
Feet 4305.285.375.375.475.16
Dis charge
Sec.-ft. 16.055596049.537.8
Date
Feb. 28 Mar. 25. Apr. 16 _May 12
June 25 .........
Gage height
Feet 4.526.045.565.685.984.50
Dis charge
Sec.-ft. 15.37548.5617610.1
Date
July 18. ... .
Aug. 29..... ....Sept. 20.. ...
Gage height
Feet ' 4.344.704.555.42
Dis charge
Sec.-ft. 3.7
10.86.6
38.7
Daily discharge, in second-feet, of Graham Canal near Safford, Ariz., for the year ending September SO, 1926
Day
2. - -3.. ..... .....4... ....5..-.-- __ - ....
6. ..... -T. ..............8... __ ..9. ....... ...10
11. _ .. .........12 13. 14 15
16 17 18 19. - _ .20
21. .22.. . .........23 24. .25. .... ... ...
26 27... ,28 29 30.. 31. . _ - __
Oct.
1617171717
1713131313
6547626866
6462616059
5756535255
545553525251
Nov.
4948474238
36363434
31
3450565655
5656565655
5556565561
6160606060
Dec.
6060606061
5960596060
6262595959
5958555656
555453
54
53
55CO
59
Jan.
6365665540
3950616162
6163616059
5859575756
5555545252
514844
4454
Feb.
5455524942
3848403534
3635252424
2424181720
1719141720
201514
Mar.
1413151717
2636544767
6370696660
6571727273
7470687476
7479
69564643
Apr.
4948505126
023424343
4744525352
5046403736
5061626166
7166717672
May
6966656371
7881797472
6357163066
7874787881
7563605944
41607479
7461
June
6056402519
2615111010
1113151211
106.4121111
1111109.19.4
9.79.78.88 Q
4.8
July
12109.78.58.5
8.811119.16.8
4.84.6513012
199.41.83.39.1
6.0116.3
4926
099
38AQ
54
Aug.
5663442513
1933111415
3856556163
3217503010
12119.17.46.0
5.56.36.37.14.84.8
Sept.
4.85.35.34.84.8
4.84.84.6
2431
260000
3.718304828
2119171512
00102121
Monthly discharge of Graham Canal near Safford, Ariz., for the year ending Sep tember 30, 1926
Month
November.. ._.__ _____. _______
January _____________________________
March. _________ _______________ . ....
May __________________________
July ... ... ... ...................
September ___ . ______________________
The year _________________________
Discharge in second-feet
Maximum
68 61 62 66 55 76 76 81 60 54 63 48
81
Minimum
13 31 52 39 14 13 0
16 4.8 0 4.8 0
0
Mean
43.8 50.3 57.5 55.0 29.6 55.1 49.6 65.2 15.9 17.6 25.3 12.8
40.0
Run-off in acre-feet
2,690 2,990 3,540 3,380 1,640 3,390 2,950 4,010
946 1,080 1,560
762
28,900
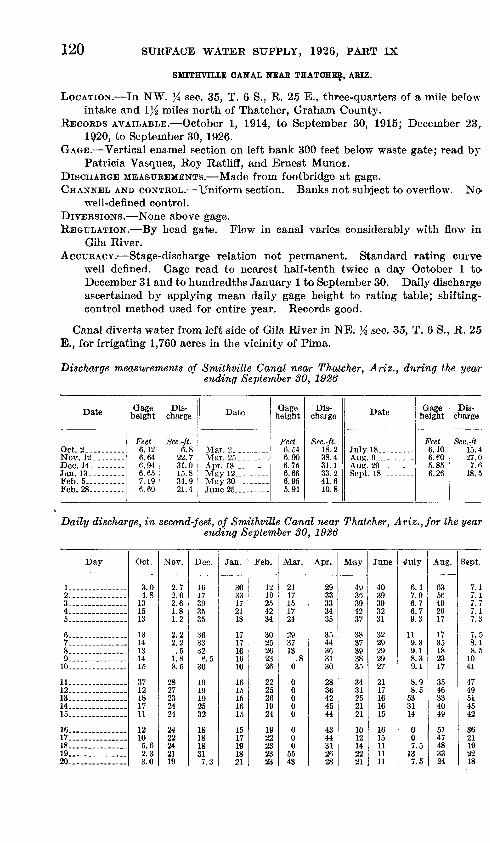
120 SURFACE WATER SUPPLY, 1926, PART IX
SMITHVILLE CANAL WEAR THATCHE£, ABIZ.
LOCATION. In NW. % sec. 35, T. 6 S., R. 25 E., three-quarters of a mile below intake and \% miles north of Thatcher, Graham County.
RECORDS AVAILABLE. October 1, 1914, to September 30, 1915; December 23,. 1920, to September 30, 1926.
GAGE. Vertical enamel section on left bank 300 feet below waste gate; read by Patricia Vasquez, Roy Ratliff, and Ernest Munoz.
DISCHARGE MEASUREMENTS. Made from footbridge at gage.CHANNEL AND CONTROL. Uniform section. Banks not subject to overflow. No
well-defined control.DIVERSIONS. None above gage.REGULATION. By head gate. Flow in canal varies considerably with flow in
Gila River.ACCURACY. Stage-discharge relation not permanent. Standard rating curve
well defined. Gage read to nearest half-tenth twice a day October 1 to December 31 and to hundredths January 1 to September 30. Daily discharge ascertained by applying mean daily gage height to rating table; shifting- control method used for entire year. Records good.
Canal diverts water from left side of Gila River in NE. E., for irrigating 1,760 acres in the vicinity of Pima.
sec. 35, T. 6 S., R. 25
Discharge measurements of Smithville Canal near Thatcher, Ariz., during the year ending September 30, 1926
Date
Nov. 12. .......Dec. 14... ......
Feb. 5... .......Feb. 28.........
Gage height
Feet 6.126.646.946.657.196.69
Dis charge
Sec.-ft. 6.8
22.731.015.834.921.4
Date
Apr. 18...---.--
May 30... ......
Gage height
Feet 6.E46.906.756.666.955.94
Dis charge
Sec.-ft.
38.431.133.241.610.8
Date
Aug. 9.... ......Aug. 29.__ ......Sept. 18.. ......
Gage height
Feet 6.10e.eo5.856.26
Dis charge
Sec.-ft.
27.07.6
18.5
Daily discharge, in second-feet, of Smithville Canal near Thatcher, Ariz., for the year ending September 30, 1926
Day
1 ..... - -2 -----S. ..............4 6
7... ........ .. ..8... ........... .910... ....... .....
11.. ........... ..12 13 14. _______ ..
17 .18 19.. ..........20
Oct.
3.04.8131513
1314
14
37121817
12105.62.33.0
Nov.
2.72.02.61.81.2
2.22.2.5
1.88.5
28272324
22242119
Dec.
173935OK
3633328.5
30
1 Q
2532
1Q
1818317.3
Jan.
3033
2118
17161610
15
15
191Q
21
Feb.
19254234
3025262326
2225261924
1Q
22232323
Mar.
2117151724
293713
.80
00000
0005543
Apr.
2933333435
3544363130
2836424544
312628
May
363942
3837
3835
3431
21
101214
21
June
4039393231
3229292927
21171616
161511
11
July
6.47.96.76.79.3
119.39.18.39.1
8.98.5
533114
007.5
137.5
Aug.
6356492617
1735182317
3546334049
47483324
Sept.
7.17.17.77.17.3
7.58.18.51041
47495145
3621192218
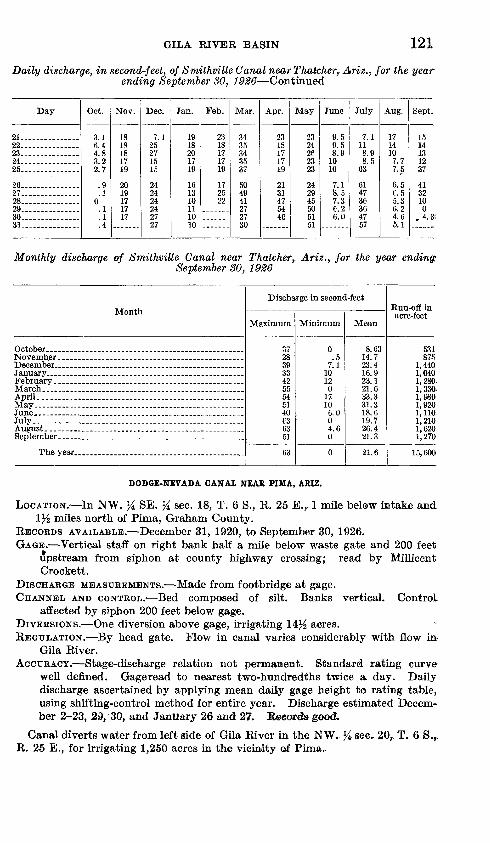
GILA KIVEK BASIN 121
Daily discharge, in second-feet, of Smithville Canal near Thatcher,.Aris., for the year ending September 30, 1926 Continued
Day
21 22...............23 24 25
26
28 29 30 31
Oct.
3.16.44.83.22.7
.9
0.1.1
Nov.
1818181719
20191717
Dec.
7.125271515
24
24242727
Jan.
1918201719
161310111010
Feb.
2318171719
172522
Mar.
3435*>4
3537
504941272730
Apr.
2318
1719
21on
5446
May
23242e2323
242945505151
June
9.59.58.91010
7.18.57.36.26.0
July
7.1118.98.563
614736364757
Aug.
1714307.77.5
6.56.55.36.24.65.1
Sept.-
1514131237
4132100
. 4.3:
Monthly discharge of Smithville Canal near Thatcher,. Ariz., for the year ending;September 30, 1926
Month
July..
Discharge in second-feet
Maximum
37 28 39 33 42 55 54 51 40es63 51
63
Minimum
0 .5
7.1 10 12 0
17 10 6.0
i 0 4.6
0
0
Mean
8.63 14.7 23.4 16.9 23.1 21.6 33.3 31.3 18.6 19.7 26.4 21.3
21.6
Run-off in acre-feet
531 875
1,440 1,040 1,280. l,33a 1,980 1,920 1,110, 1,210 1,620 1,270
15,600
DODGE-NEVADA CANAL NEAR PIMA, ARIZ.
LOCATION. In NW. % SE. % sec. 18, T. 6 S., R. 25 E. r 1 mile below intake and \% miles north of Pirna, Graham County.
RECORDS AVAILABLE. December 31, 1920, to September 30, 1926.GAGE. Vertical staff on right bank half a mile below waste gate and 200 feet
upstream from siphon at county highway crossing; read by Millicent Crockett.
DISCHARGE MEASUREMENTS. Made from footbridge at gage.CHANNEL AND CONTROL. Bed composed of silt. Banks vertical. Control
affected by siphon 200 feet below gage.DIVERSIONS. One diversion above gage, irrigating 14^4 acres.REGULATION. By head gate. Flow in canal varies considerably with flow in>
Gila River.ACCURACY. Stage-discharge relation not permanent. Standard rating curve-
well defined. Gageread to nearest two-hundredths twice a- day. Daily discharge ascertained by applying mean daily gage height to rating table, using shifting-control method for entire year. Discharge estimated Decem ber 2-23, 29, 30, and January 26 and 27. Reeordfc good.
Canal diverts water from left side of Gila River in the NW. }4 sec. 20,, T. 6 S.,. R. 25 E., for irrigating 1,250 acres in the vicinity of Pirna-
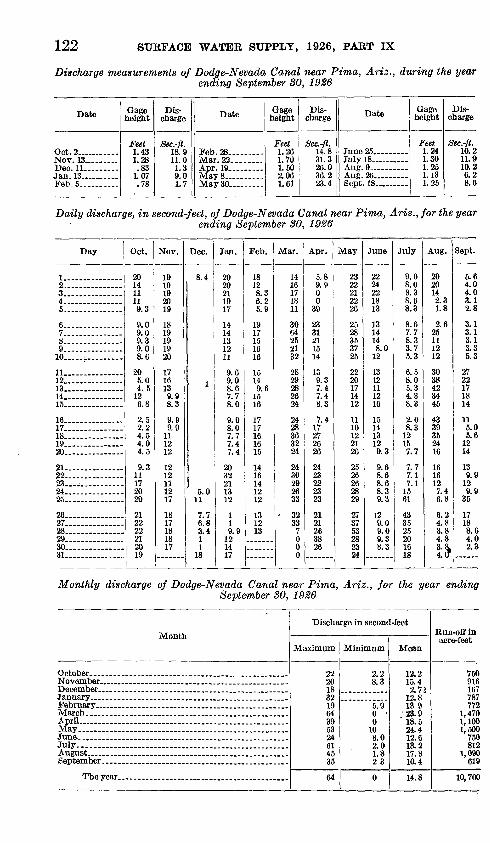
122 SUEFACE WATER SUPPLY, 1926, PART IX
Discharge measurements of Dodge-Nevada Canal near Pima, Ariz., during the yearending September 80, 1926
Date
Oct.2...... vr/vtr 10Dec 11Jan. 13..___
Gage height
Feet 1.431.28
00
1.07.78
Dis charge
Sec.-ft.-to a11.01.3a n
1.7
Date
Feb. 28 ..... -Mar. 22-....
A r»r 1 Q
Gage height
Feet 1.261.701.502.061.61
Dis charge
Sec.-ft. 14.831.326.036.223.4
Date
July 18 ___ ...
Aug. 26 ...... Sept. 18. .. ....
Gage height
Feet 1.241.301.251.131.25
Dis charge
Sec.-ft. 10.211.910.26.28.6
Daily discharge, in second-feet, of Dodge-Nevada Canal near Pima, Ariz., for the year ending September 30, 1926
Day
2 ... ... ... 3 _ ..... _ ....4 5
6.. ... - ...7. . . 8... ... .- 9. . ........10 r
11 ________ .12 __ ... .... 13. 14 __ . _____ .15 _ ....
16 17 __ -18.. 19 _ ....... __ -20 _ -
21 22... ............23 . 24 _ -
26 ___27 28- _ .. .....29 30 31 _____
Oct.
201411119.3
9.09.09.39.08.6
205.04.5126.8
2.52.24.54.04.5
9.311172020
212222212019
Nov.
191Q192019
1819191920
1716139.98.3
9.99.9
111212
1212111217
1817181817
Dec.
8.4
1
5.011
7.76.81 41
18
Jan.
2020211917
1414131211
9.69.08.67.78.0
9.08.07.77.47.4
2032211312
11a n
121417
Feb.
18128.36.25.9
1917151616
15149.61516
1717161615
14161412
131213
Mar.
1416171811
3064252132
2829282624
2428363224
2430292633
3233
000
Apr.
5.89.900
39
2331211514
139.37.47.48.3
7.417272626
2423222323
2121263826
May
2322212226
2528353725
2220171412
1110122126
2526262829
273753282324
June
2224221813
1314148.012
1312111216
151413129.3
9.68.68.68.39.3
129.09.09.38.3
July
9.08.08.38.68.3
8.67.78.33.75.3
6.58.05.34.38.3
2.08.312157.7
7.77.17.11561
433595201618
Aug.
2020142.31.8
2.625111212
3038423445
4339352416
1616127.46.8
6.24.83.84.83.8.4.?
Sept.
5.64.04.03.12.8
3.13.13.13.35.3
2722171814
115.05.61214
139.9129.9
35
17188.64.02.3
Monthly discharge of Dodge-Nevada Canal near Pima, Ariz., for the year endingSeptember 30, 1926
Month
December ____________________ _____
February ___________________ .. .. ..
April. ......... ....... ...... .........................
July..... .. . . ...August _ .... _____________________
The year. _________________ _ _ .
Discharge in second-feet
Maximum
22 20 18 32 19 64 39 53 24 61 45 35
64
Minimum
2.28.3
5.9 0 0
10 8.0 2.0 1.8 2 3
0
Mean
12.2 15.4 2.72
12.8 13 9 23.9 18.5 24.4 12.6 13.2 17.8 10.4
14.8
Run-off in acre-feet
750 916 167 787 772
1,470 1,100 1,500
750 812
1,090 619
10,700
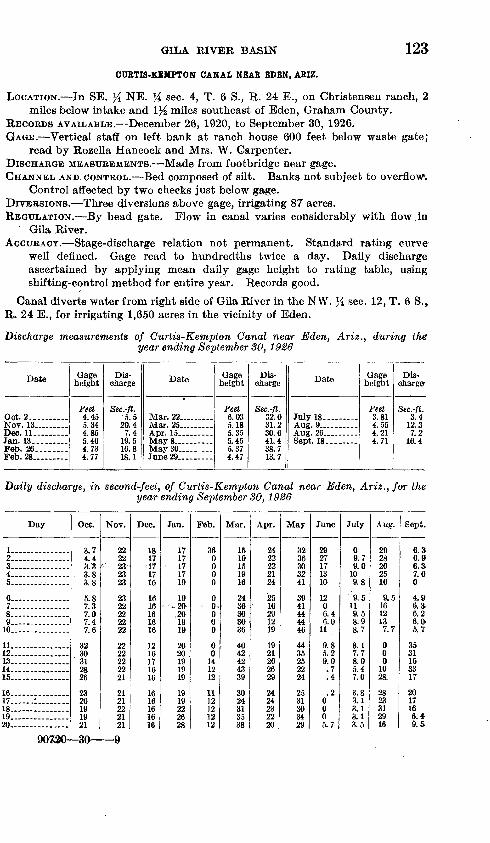
GILA RIVER BASIN 123
CURTIS-KEMPTON CANAL NEAR EDEN, ARIZ.
LOCATION. In SE. J4 NE. % sec. 4, T. 6 S., R. 24 E., on Christensen ranch, 2miles below intake and 1}£ miles southeast of Eden, Graham County.
RECORDS AVAILABLE. December 26, 1920, to September 30, 1926. GAGE. Vertical staff on left bank at ranch house 600 feet below waste gate;
read by Rozella Hancock and Mrs. W. Carpenter. DISCHARGE MEASUREMENTS. Made from footbridge near gage. CHANNEL AND. CONTROL. Bed composed of silt. Banks not subject to overflow.
Control affected by two checks just below gage. DIVERSIONS. Three diversions above gage, irrigating 87 acres. REGULATION. By head gate. Flow in canal varies considerably with flow,in
Gila River. ACCURACY. Stage-discharge relation not permanent. Standard rating curve
well defined. Gage read to hundredths twice a day. Daily dischargeascertained by applying mean daily gage height to rating table, usingshifting-control method for entire year. Records good.
Canal diverts water from right side of Gila River in the NW. }i sec. 12, T. 6 S., R. 24 E., for irrigating 1,650 acres in the vicinity of Eden.
Discharge measurements of Curtis-Kempton Canal near Eden, Ariz., during the year ending September 30,1926
Date
Oct. 2..........Nov. 13..... -Dee. 11 ......Jan. 13.... Feb. 26. .......Feb. 28
Gage height
Feet 4.455.344.855.464.734.77
Dis charge
Sec.-ft. 5.5
20 47.4
19.516.818 1
Date
Mar. 22.........
Apr. 15
Gage height
Feet 6.035.185.355.455.374.47
Dis charge
Sec.-ft. 32.031.230.641.438.713.7
Date
July 18.. . ___A nop 0Aug. 26 -Sept. 18-..
Gage height
Feet 3.814.554.214.71
Dis charge
Sec.-ft. 3.4
7.216.4
Daily discharge, in second-feet, of Curtis-Kempton Canal near Eden, Ariz., for the year ending September 30, 1926
Day
1 2...... .........3. __ ..........4.. ..........5 ......
6. ... ..... ...7.. ..........8 .... .9 . ... 10.. .... ......
11 _ ....... _ ..12...... .........13 ..........14. ...... _ ..15 . _ ..
16.. .......17 I IS 19 20
Oct.
3.74.43.3q o
3.8
5.87.37.07.47.6
3230312826
2320191921
Nov.
2222
' 232323
2322oo2222
2222222291
2121oo2121
Dec.
1C17171716
1616161616
16171616
1616161616
Jan.
1717171719
1920201919
2020101919
1Q19222628
Feb.
360000
00000
00141212
1112121212
Mar.
1519151916
2436363636
4042424339
3024313538
Apr.
2422222124
2516291219
1921262629
2424232220
May
3236303241
3941444446
4435252224
2531303429
June
2927171310
1206.46.0
11
9.85.29.0.7.4
.20005.7
July
09.79.0109.8
9. 5119.58.98.7
8.17.78.05.47.0
3.83.13.13.13.5
Aug.
2928262516
9.51612137.7
000102&
2823312916
Sept.
6.36.96. S7.00
4.0
6.26. ft5.7
3531153317
2017166.49.5
9om so 9
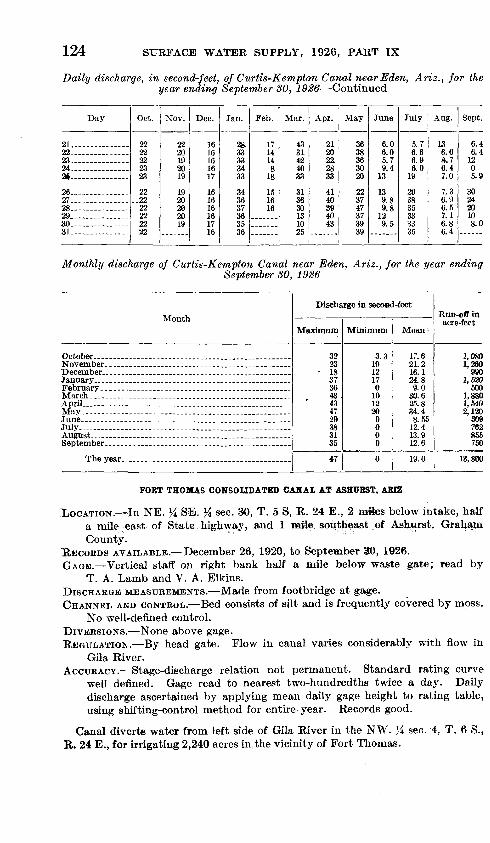
124 SURFACE WATER SUPPLY, 1926, PART IX
Daily discharge, in second-feet, of Curtis-Kempton Canal near Eden, Ariz., for the year ending September 30, 1926 Continued
Day
21 .22 23 24 a§ 26 27. 28 29 .30 31
Oct.
2222222323
22
22222222
Nov.
0920IS2019
1920
2010
Dee.
16161616
16161616
16
Jan.
00
3333ii33
343637 30
3536
Feb.
1414
1ft
151616
Mar.
4331424033
313fi
3015
1025
Apr.
2120222833
4140394043
May
3638363020
223747373939
June
6.06.05.79.4
13
139 0
9.8
9.5
July
5.76.66.96.0
19
263835333335
Aug.
156.6&76.47.0
7.36.96.57.16.86.4
Sept.
6.46.4
1205.9
302420108.0
Monthly discharge of Curtis-Kempton Canal near Eden, Ariz., for the year endingSeptember SO,
Month
February-... ______________________
July August... __ - _____ - ___ _______________
The year. ________________________
Discharge in second-feet
Maximum
32 23
18 37 36 43 43 47 29 38 31 35
47
Minimum
3.3 19 12 17 0
10 12 20
0 0 0 0
0
Mean
17.6 21.2 16.124.8 9.0
30.6 25.8 34.4 8.55
12.4 13.9 12.6
19.0
Run-off inacre-feet
1,080 1,280
990 1,520
600 1,880 1,540 2,120
309 762 855 750
13, 8CK)
FORT THOMAS CONSOLIDATED CANAI AT ASHURST, ARIZ.
XOCATION. In NE. ^ SE. % sec. 30, T. 5 S, R. 24 E., 2 mites below intake, half a mile east, of State highway, and 1 mHe southeast of As&urst, Graham County.
UECORDS AVAILABLE. December 26, 1920, to September 30, 1926.GAGE. Vertical staff on right bank half a mile below waste gate; read by
T. A. Lamb and V. A. Elkins.DISCHARGE MEASUREMENTS. Made from footbridge at gage.CHANNEL AND CONTROL. Bed consists of silt and is frequently covered by moss.
No well-defined control.DIVERSIONS. None above gage.REGULATION. By head gate. Flow in canal varies considerably with flow in
Gila River.ACCURACY. Stage-discharge relation not permanent. Standard rating curve
well defined. Gage read to nearest two-hundredths twice a day. Daily discharge ascertained by applying mean daily gage height to rating table, using shifting-control method for entire year. Records good.
Canal diverts water from left side of Gila River in the NW. }i sec. 4, T. 6 S., R. 24 E., for irrigating 2,240 acres in the vicinity of Fort Thomas.
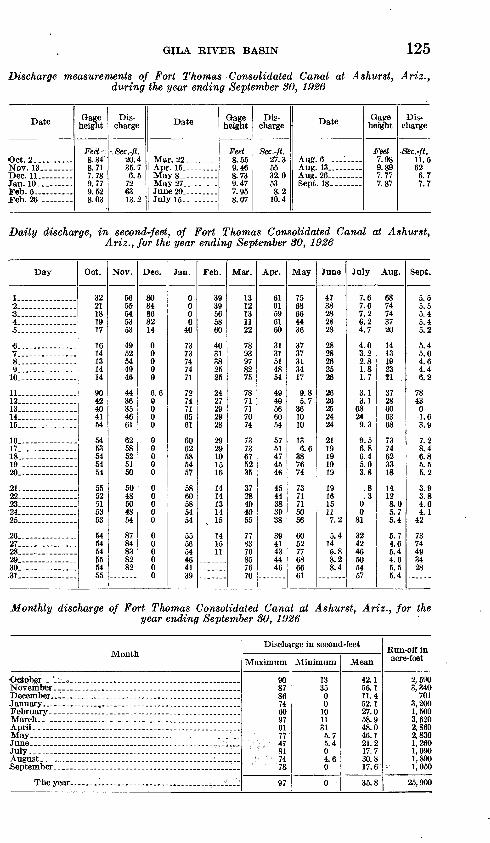
GILA RIVER BASIN 125
Discharge measurements of Fort Thomas Consolidated Canal at Ashurst, Ariz., during the year ending September SO, 1926
Date
Oct. 2.. .....Nov. 13.--.....Tiftn 11
Feb. 6 .
Gage height
Feet 8.348.717 78
9.779.52o no
Dis charge
; Sec.-ft. 20.435.76.5
7263
Date
Apr. 15
May 27. ....
Gage height
Feet
9.468.739.477.95Q /»7
Dis charge
Sec.-ft. 27.35532.0538.2
Date
Aug. 13...-- ...
Gage height
Feet 7.989.897.777.87
Dis charge
JSec.-ft. 11.5626.77.7
Daily discharge, in second-feet, of Fort Thomas Consolidated Canal at Ashurst, Ariz., for the year ending September SO, 1926
Day
1 2 3 ___ ... ___ -.4 &..... . ...
6 7... .. ....8 . 9 10
11 12 .~iq
14. 15 -
16 17... .18 19 20
21 22 23 24. 25.
26 27 ___ .. __ ....28 29 30 31
Oct.
3221181917
1614131414
9042An
4154
5453545454
5552515353
545454555455
Nov.
5655545353
4952544946
4436354661
6258525150
5048504854
8784838282
Dec.
SO84868214
00000
6.60000
00000
00000
000000
Jan.
0000
40
7373747471
7274716561
6062585457
58605854
5556
464139
Feb.
3939565860
4031382525
2427292928
2929101516
1414131415
141511
Mar.
1312131122
7893978275
7871717074
7373675235
3728404055
778376857670
Apr.
6161596160
3131514854
4940566054
5751474546
4544383938
3941434446
May
7568664436
3737313417
9.85.7361010
136.6
387674
7371715056
605277686661
June
4738282828
2828262526
2626252424
2119191919
191615117.2
5.4146.88.28.4
July
7.87.67.26.24.7
4.03.22.81.81.7
3.13.168249.3
9.56.86.45.03.6
.8
.300
81
32424650
57
Aug.
6874743720
1413192321 .
3728606368
7374623318
14128.05.75.4
5.74.65.44.65.55.4
Sept.
5.55.55.45.45.2
5.45.04.64.46.2
78430-1.63.9
7.28.4«.85.55.2
3.93.84.04.142
7374493428
Monthly discharge of Fort Thomas Consolidated Canal at Ashurst, Ariz., for the year ending September 30, 1926
Month
February.. ___________________________
April.. __ __ .- __ _. __ .. __ . _____ .... .
July---.. ...............I..
The year. ___ . _________________ 1.1.
Discharge in second-feet
Maximum
9087 8674 60 97 6177"
V' 4781
' :' ' 74
' : 78
97
Minimum
13 35 0 0
101131 5.7 5.4 0 4.6 0
0
Mean
42.1 56.1 11.4 52.1 27.0 58.9 48.0 46.1 21.2 17.7 30.8 17.6
35.8
Run-off in acre-feet
2,590 3,340
701 3,200 1,500 3,620 2,860 2,830 1,260 1,090 1,890 1,050
25,900
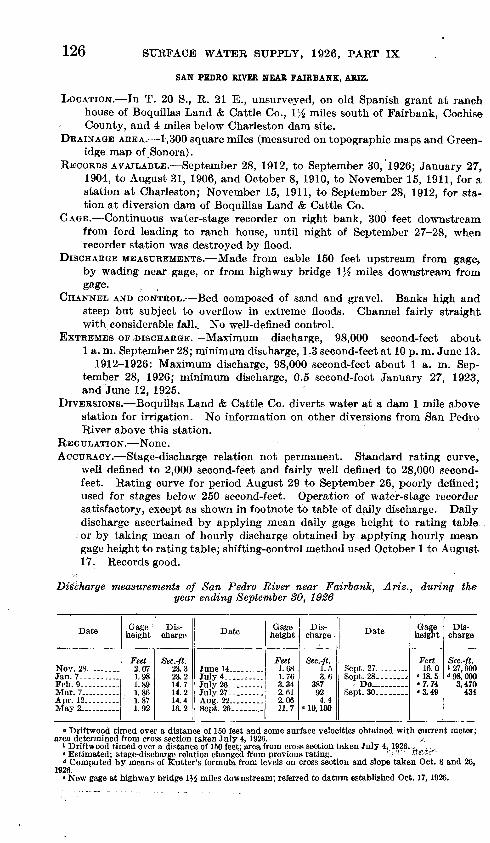
126 SURFACE WATER SUPPLY, 1926, PART IX
SAN PEDRO RIVER NEAR FAIRBANK, ARIZ.
LOCATION. In T. 20 S., R. 21 E., unsurveyed, on old Spanish grant at ranch house of Boquillas Land & Cattle Co., \% miles south of Fairbank, Cochise County, and 4 miles below Charleston dam site.
DRAINAGE AREA. 1,300 square miles (measured on topographic maps and Green-idge map of Sonora).
RECORDS AVAILABLE. September 28, 1912, to September 30, 1926; January 27, 1904, to August 31, 1906, and October 8, 1910, to November 15, 1911, for a station at Charleston; November 15, 1911, to September 28, 1912, for sta tion at diversion dam of Boquillas Land & Cattle Co,
GAGE. Continuous water-stage recorder on right bank, 300 feet downstream from ford leading to ranch house, until night of September 27-28, when recorder station was destroyed by flood.
DISCHARGE MEASUREMENTS. -Made from cable 150 feet upstream from gage,, by wading near gage, or from highway bridge \}i miles downstream from gage.
CHANNEL AND CONTROL. Bed composed of sand and gravel. Banks high and steep but subject to overflow in extreme floods. Channel fairly straight with considerable fall.. No well-defined control.
EXTREMES OF DISCHARGE. Maximum discharge, 98,000 second-feet about 1 a. m. September 28; minimum discharge, 1.3 second-feet at 10 p. m. June 13.
1912-1926: Maximum discharge, 98,000 second-feet about 1 a. m. Sep tember 28, 1926; minimum discharge, 0.5 second-foot January 27, 1923, and June 12, 1925.
DIVERSIONS. Boquillas Land & Cattle Co. diverts water at a dam 1 mile above station for irrigation. No information on other diversions from San Pedro River above this station.
REGULATION. None.ACCURACY. Stage-discharge relation not permanent. Standard rating curve,
well denned to 2,000 second-feet and fairly well denned to 28,000 second- feet. Rating curve for period August 29 to September 26, poorly defined; used for stages below 250 second-feet. Operation of water-stage recorder satisfactory, except as shown in footnote to table of daily discharge. Daily discharge ascertained by applying mean daily gage height to rating table or by taking mean of hourly discharge obtained by applying hourly mean gage height to rating table; shifting-control method used October 1 to August 17. Records good.
Discharge measurements of San Pedro River near Fairbank, Ariz., during the year ending September 80, 1926
Date
Nov. 28
Feb. 9 Mar. 7 Apr. 12 May 2 _____
Gage height
Feet 2.071 QO
1.891.86
1.92
Dis charge
Sec.-ft. 23.3
14.714.2
16.2
Date
July4__.__,
July 27--. ...A n w 99
Gage height
Feet 1.681.763.34
2.0611.7
Dis charge
Sec.-ft. 1.53.6
387Q94.4
« 10, 100
Date
Sept. 27_.......Sept. 28...... .1.
Do ........Sept. 30--.
Gage height
Feet 16.0
« 18.5 7.74 3.49
Dis charge
Sec.-ft. ' 27, 900<<98,000
3,470434
Driftwood timed over a distance of 150 feet and some surface velocities obtained with current meter; area determined from cross section taken July 4, 1926.
1 Driftwood timed over a distance of 150 feet; area, from cross section taken July 4, 1926..,, 4 , "Estimated; stage-discharge relation changed from previous rating. '' * " "' nr.-r Computed by means of Kutter's formula from levels on cross section and slope taken Oct. 8 and 26,
1926. New gage at highway bridge 1 Ji miles downstream; referred to datum established Oct. 17, 1926.
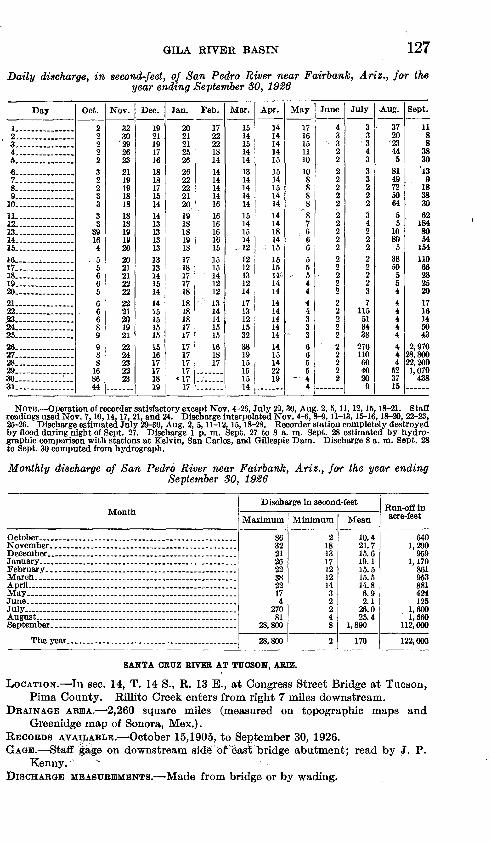
GILA EIVER BASIN 12?
Daily discharge, in second-feet, of San Pedro River near Fairbank, Ariz., for the year ending September 80, 1926
Day
I.... ........ ...2. ........ ...3.... ....... ....4.. ..........6 .......« 7 ....... __ .8...............9. ...........10.-.... ......11 ............12.. ..........13..-.. .......14. . .15. . ........16 i ....17.... ... ........18 19 ...... 20 21. ........22. ... ........J88 ..........24 ...26 .......26 .27.. _ ..28 _29.. __ ..30 31
Oct.
222223223333
3916455665666899881686
Nov.
3230'29
262321191918181818191920202121222222212019212224232223
Dec.
1921191716181817151414131313131313141514141515151515161717181Q
Jan.
2021212526262222212019181819181718171718181818171717171717
«1717
Feb.
1722221814141414141616161616151515' 1412121314141515161817
Mar.
15141514141314141414151415141212121312141713121532381915151514
Apr.
141414141515141514141414181415151514141414141414141415142219
May
17161511101088888766655
544443336655- 4-4
June
433222222222222222222222222222
July
333433322234222222237
1155134382701106040209
Aug.
372023445814972506455
10805385055444444444523715
Sept.
11883830'13
9183830621848054154110662825201716145043
2,97028,80022,2001,070438
NOTE. Operation of recorder satisfactory except Nov. 4-26, July 29,30, Aug. 2, 5,11,12,15,18-21. Staff readings used Nov. 7,10,14,17, 21, and 24. Discharge interpolated Nov. 4-6,8-9,11-13,15-16,18-20, 22-23, 25-26. Discharge estimated July 29-30, Aug. 2, 5,11-12,15,18-28. Recorder station completely destroyed by flood during night of Sept. 27. Discharge 1 p. m. Sept. 27 to 8 a. m. Sept. 28 estimated by hydro- graphic comparison with stations at Kelvin, San Carlos, and QUlespie Dam. Discharge 8 a. m. Sept. 28 to Sept. 30 computed from hydrograph.
Monthly discharge of San Pedro River near Fairbank, Ariz., for the year endingSeptember 30, 1926
Month
February..... ___ . ___________________
April.....................................................
July......................................................
September.... _______________________
The year.. __ ___ . _____________
Discharge in second-feet
Maximum
86 32 21 26 22 38 22 17 4
270 81
28,800
28,800
Minimum
218 13 17 12 12 14 3 2 2 4 8
2
Mean
10.4 21.7 15.6 19.1 15.5 15.5 14.8 6.9 2.1
26.0 25.4
1,890
170
Run-off in acre-feet
640 1,290
959 1,170
861 953 881 424 125
1,600 1,560
112,000
122,000
SANTA CRUZ RIVER AT TUCSON, ARIZ.
LOCATION. In sec. 14, T. 14 S., R. 13 E., at Congress Street Bridge at Tucson, Pima County. Rillito Creek enters from right 7 miles downstream.
DRAINAGE AREA. '2,260 square miles (measured on topographic maps and Greenidge map of Sonora, Mex.).
RECORDS AVAILABLE. October 15,1905, to September 30, 1926.GAGE. Staff gage on downstream side of Sast bridge abutment; read by J. P.
Kenny.DISCHARGE MEASUREMENTS. Made from bridge or by wading.
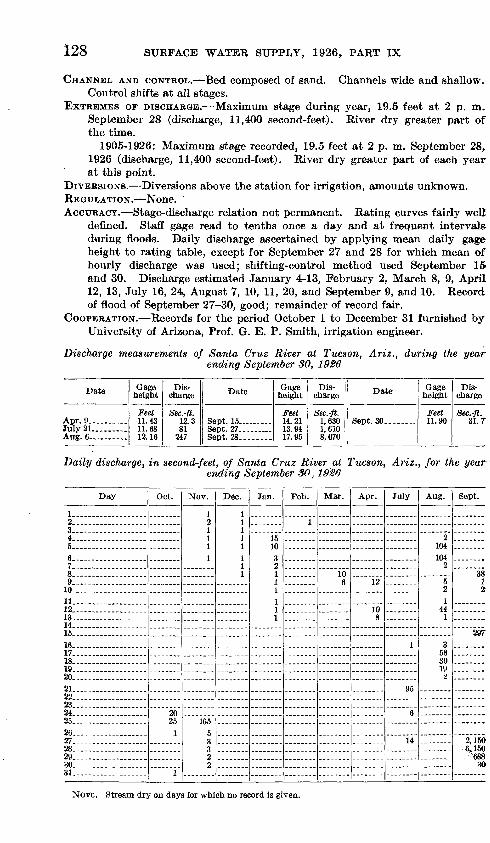
128 SURFACE WATER SUPPLY, 1926, PART IX
CHANNEL, AND CONTROL. Bed composed of sand. Channels wide and shallow. Control shifts at all stages.
EXTREMES OF DISCHARGE. Maximum stage during year, 19.5 feet at 2 p. m. September 28 (discharge, 11,400 second-feet). River dry greater part of the time.
1905-1926: Maximum stage recorded, 19.5 feet at 2 p. m. September 28r 1926 (discharge, 11,400 second-feet). River dry greater part of each year at this point.
DIVEHSION&. Diversions above the station for irrigation, amounts unknown.REGULATION. None.ACCURACY. Stage-discharge relation not permanent. Rating curves fairly well
defined. Staff gage read to tenths once a day and at frequent interval& during floods. Daily discharge ascertained by applying mean daily gage height to rating table, except for September 27 and 28 for which mean of hourly discharge was used; shifting-control method used September 15 and 30. Discharge estimated January 4-13, February 2, March 8, 9, April 12, 13, July 16, 24, August 7, 10, 11, 20, and September 9, and 10. Record of flood of September 27-30, good; remainder of record fair.
COOPERATION. Records for the period October 1 to December 31 furnished by University of Arizona, Prof. G. E. P. Smith, irrigation engineer.
Discharge measurements of Santa Cruz River at Tucson, Ariz., during the year ending September SO,
Date
Apr. 9 ... .July 21... __ ..
Gage height
Feet 11.4311.6812.16
Dis charge
Sec.-ft. 12.381
247
Date
Sept. 28........
Gage height
Feet 14.21IS <M
17.95
Dis charge
Sec.-ft. 1,630
8,070
Date Gage
Feet 11.90
Dis charge
Sec.-ft. 31.7
Daily discharge, in second-feet, of Santa Cruz River at Tucson, Ariz., for the year ending September 30 , 1926
Day
1 ..... .....2... .............3 .
7..... .... .......8. ...............9........ ........ ...10 -11...... .............12. .............13 14.- .............15 16 17.. ...18 19 ........ .......20 21 .......22. ..............23 24 25 26 27 28 ...29 30 31
Oct.
2025
Nov.
2
11
i
5
322
Dec.
111
11
1
Jan.
1510
211
1
1
Feb.
1
Mar.
106
Apr.
12
108
July
95
6
U
Aug.
2104104
2
521
441
3583019
2
Sept.
3812
297
2,1506*150 '- 088
30
NOTE. Stream dry on days for which no record is given.
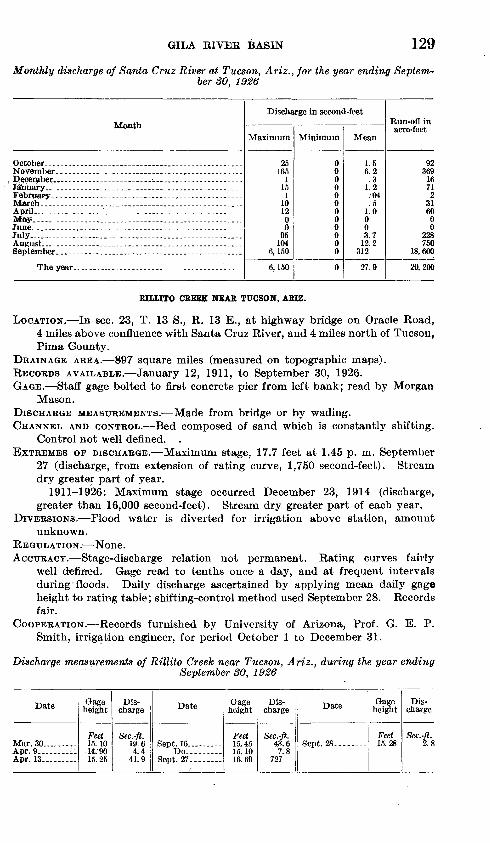
GILA RIVEB, BASIN 129
Monthly discharge of Santa Cruz River at Tucson, Ariz., for the year ending Septem ber 30, 1926
Month
March. ___ .._ .. ___________________April . ._-___ __ ..__ _._.________
July... ............................................. ......
Discharge in second-feet
Maximum
25 165
1 15
1 10 12 0 0
95 104
6,150
6,150
Minimum
0 0 0 0 0 0 0 0 0 0 0 0
0
Mean
1.5 6.2 .3
1.2 .84 .5
1.0 0 0 3.7
12.2 312
27.9
Kun-ofl in acre-feet
92 369
16 71
2 31 60 0 0
228 750
18,600
20,200
RILUTO CREEK NEAR TUCSON, AKIZ.
LOCATION. In sec. 23, T. 13 S., R. 13 E., at highway bridge on Oracle Road,4 miles above confluence with Santa Cruz River, and 4 miles north of Tucson,Pima County.
DRAINAGE AREA. 897 square miles (measured on topographic maps). RECORDS AVAILABLE. January 12, 1911, to September 30, 1926. GAGE. Staff gage bolted to first concrete pier from left bank; read by Morgan
Mason.DISCHARGE MEASUREMENTS. Made from bridge or by wading. CHANNEL AND CONTROL. Bed composed of sand which is constantly shifting.
Control not well defined. . EXTREMES OF DISCHARGE. Maximum stage, 17.7 feet at 1.45 p. m. September
27 (discharge, from extension of rating curve, 1,750 second-feet). Streamdry greater part of year.
1911-1926: Maximum stage occurred December 23, 1914 (discharge,greater than 16,000 second-feet). Stream dry greater part of each year.
DIVERSIONS. Flood water is diverted for irrigation above station, amountunknown.
REGULATION. None. ACCURACY. Stage-discharge relation not permanent. Rating curves fairly
well defined. Gage read to tenths once a day, and at frequent intervalsduring floods. Daily discharge ascertained by applying mean daily gageheight to rating table; shifting-control method used September 28. Recordsfair.
COOPERATION. Records furnished by University of Arizona, Prof. G. E. P.Smith, irrigation engineer, for period October 1 to December 31.
Discharge measurements of Rillito Creek near Tucson, Ariz., during the year endingSeptember 30, 1926
Date
Mar. 30 .... T .
Apr. 13
Gage height
Feet 15.10td 'Qfi
15.25
Dis charge
Sec.-ft.
41.9
Date
Do-. ...Sept. 27-..-
Gage height
Feet
15.1016.69
Dis charge
Sec.-ft. 43.67.8
727
Date
Sept. 28-...
Gage height
Feet 15.28
Dis charge
Sec.-ft. 2.8
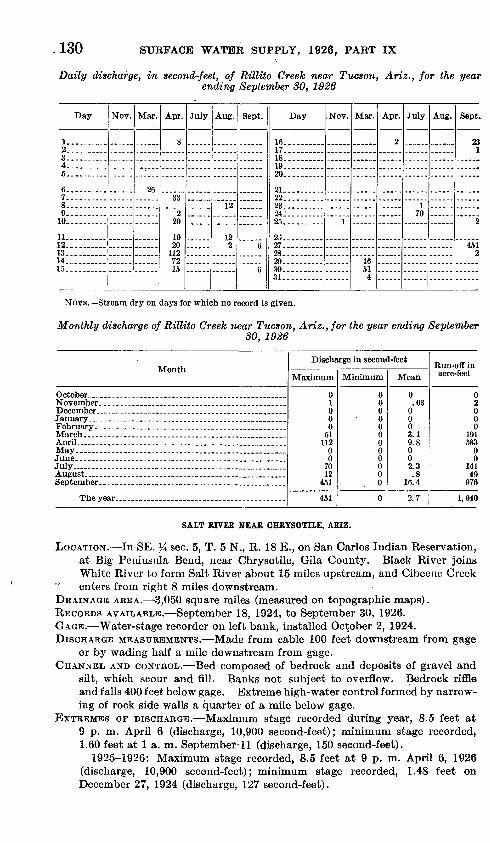
.130 SUEFACE WATEE SUPPLY, 1926, PAET IX
Daily discharge, in second-feet, of Rillito Creek near Tucson, Ariz., for the yearending September SO, 1926
Day
1... -------2... 3.... 4-... 5 .... ------
6. ___ -...7..-.-. .8....- .9-.. 10-..-
11.-.. ------12.....-. 13-.. 14... -,.15..
Nov. Mar. Apr.
8
33
220
1020
1127215
July Aug.
12
122
Sept.
6
6
Day
16-. __ 17... 18.-. 19..-. 20..........
21.. ........22.. __ ....23... 24--.-- .25...
23... 27..-. 28-.- 29---- 30... 31-..
Nov.
1
Mar.
1651
4
Apr.
2
July
170
Aug. Sept.
231
2
4512
NOTE. Stream dry on days for which no record is given.
Monthly discharge of Rillito Creek near Tucson, Ariz., for the year ending September30, 1926
Month
December __ ___ ___ __ ________ . _ , .....
Anril _ . ___________________________
June.. __ . ___________________________July .... ....
The year.-.-. -... _____ _______ .. __ ..
Discharge in second-feet
Maximum
,0 1 0 0 0
51 112
0 0
70 12
451
451
Minimum
0 0 0 0 0 0 0 0 0 0 0 0
0
Mean
0 .03
0 0 0 3.1 9.8 0 0 2.3 .8
16.4
2.7
Run-off in acre-feet
02 0 0 0
191 583
0 0
141 49
976
1,940
SALT RIVER NEAR CHRYSOTILE, ARIZ.
LOCATION. In SE. J4 sec. 5, T. 5 N., R. 18 E., on San Carlos Indian Reservation, at Big Peninsula Bend, near Chrysotile, Gila County. Black River joins White River to form Salt River about 15 miles upstream, and Cibecue Creek
' enters from right 8 miles downstream.DRAINAGE AREA. 3,050 square miles (measured on topographic maps).RECORDS AVAILABLE. September 18, 1924, to September 30, 1926.GAGE. Water-stage recorder on left bank, installed October 2, 1924.DISCHARGE MEASUREMENTS. Made from cable 100 feet downstream from gage
or by wading half a mile downstream from gage.CHANNEL AND CONTROL. Bed composed of bedrock and deposits of gravel and
silt, which scour and fill. Banks not subject to overflow. Bedrock riffle and falls 400 feet below gage. Extreme high-water control formed by narrow ing of rock side walls a quarter of a mile below gage.
EXTREMES OF DISCHARGE. Maximum stage recorded during year, 8.5 feet at 9 p. m. April 6 (discharge, 10,900 second-feet); minimum stage recorded^ 1.60 feet at 1 a. m. September-11 (discharge, 150 second-feet).
1925-1926: Maximum stage recorded, 8.5 feet at 9 p. m. April 6, 1926 (discharge, 10,900 second-feet); minimum stage recorded, 1.48 feet on December 27, 1924 (discharge, 127 second-feet).
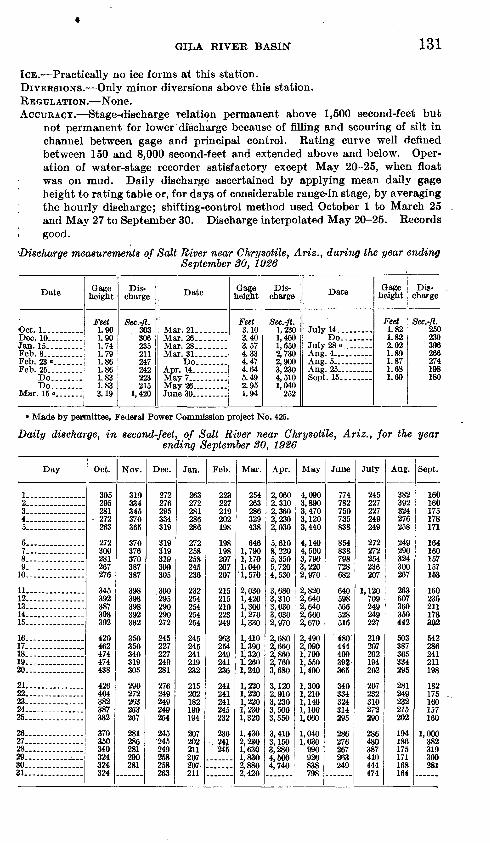
GILA RIVER BASIN 131
ICE. Practically no ice forms at this station.DIVERSIONS. Only minor diversions above this station.REGULATION. None.ACCURACY. Stage-discharge relation permanent above 1,500 second-feet but
not permanent for lower discharge because of filling and scouring of silt in channel between, gage and principal control. Rating curve well defined between 150 and 8,000 second-feet and extended above and below. Oper ation of water-stage recorder satisfactory except May 20-25, when float was on mud. Daily discharge ascertained by applying mean daily gage height to rating table or, for days of considerable range-in stage, by averaging the hourly discharge; shifting-control method used October 1 to March 25 and May 27 to September 30. Discharge interpolated May 20-25. Records good.
^Discharge measurements of Salt River near Chrysotile, Ariz., during the year endingSeptember SO, 1926
Date
Oct. 1. .........
Jan. IS...... ...Feb. 8... .......Feb. 23 .... Feb. 25 ___ ...
Do-Do
Gage height
Feet 1.901.901.741.791.861.861.831.833.19
Dis charge
Sec.-ft. 303306235211247242223215
1,420
Date
Mar. 21-.
Mar. 28.. ......Mar. 31.
Do .Apr. 14
May 26 June 30 .........
Gage height
Feet 3.103.403.574.334.474.645.492.951.94
Dis charge
Sec.-ft. 1,2301,4601,6502,7302,9003,2304,5101,040
252
Date
July 14... ......Do
July 28 «..._.
Aug. 25..... ....Sept. 15...
Gage height
Feet 1.821.822.021.891.871.681.69
Dis charge
Sec.-ft. 250230396266274198180
° Made by pertnittee, Federal Power Commission project No. 425.
Daily discharge, in second-feet, of Salt River near Chrysotile, Ariz., for the yearending September SO, 1926
Day
1 .... ... .....2.. .... ......3 4 ... ... ... ...5
6. ....... 7 ...8 . . .... ......9 10
11 12 ............13 . 14 15 .. .
16 17 18 19 20
21...... .........22...............23... ............24..... ..........25 ..
26... ............27...............28 _ ............29. 30 31
Oct.
305295281
- 272263
272300281267276
345392387398392
420<t«9474474438
426404382387382
370350340324324324
Nov.
319334345370365
370376370387387
398398 3QS
392382
350OKA
°.4ft
319OAK
9Qft272263263267
281286281290281
Dec.
272276295334319
319319 J1Q
309305
300295290290272
24522722724.Q281
27694.Q9J.QOiQ
254
245245249258258263
Jan.
263272281
272258OKQ94*236
232254OKJ.
254254
94*94524191 Qoqo
91 *202100
1QJ.
207202211
7(Y7
211
Feb.
2232272199rt9
198198207207207
215215219223249
263254
241OOfl
2412412419J.5232
236
245
Mar.
254263286WQ438
6461,7901,170Ij040'1,570
2,0301,4201 «>ftn
1,2701 330
1,4101 3901 39ft1 2601 *Mft
1,2201,2201,220
1,320
1,4302,2301,6301,8302,8802,420
Apr.
2,0602,3102,3602,2302,030
5,6108,2205,3505,7204,530
3,6803,3103,0303,0302 Q7rt
2,680
9 Rfirt2,7603,680
3,1202 Q1A
3 O9A
3 KAA
3 KKA
3,4103,1503,2804,5004,740
May
4,0903,8903,4703,1203,440
4,1404,500i 7Qft3,2202,970
2,8202,6402,6402,6602,670
9 4Qn9 flQrt1 7QA1,6501 400
i °.fift
1 1401,1001 060
1,0401,030
926QOQ
798
June
774782750735838
854838
728682
640598566528516
480414409392-OflR
340334OOJ.
O1 A
OQK
286276267263249
July
245227227249249
272272254236207
1,120709249249227
219207202194OAO
207232O1 A
272OQA
286480387410444474
Aug.
382392324276258
249290324300267
263607360350442
503387365334295
281249232215202
194186175171168164
Sept.
160160175178171
164160157157153
160236211178302
5422862412111QQ
1OO
1751601 K.7
160
1,000382319300281
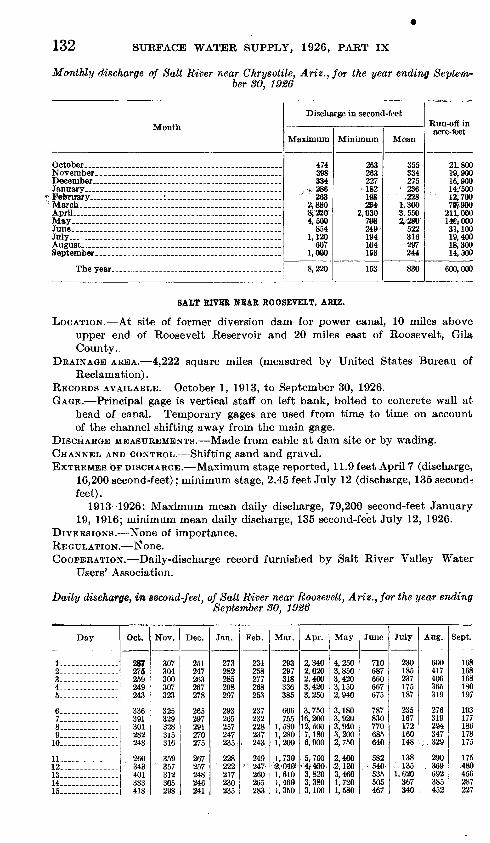
132 SURFACE WATER SUPPLY, 1926, PART IX
Monthly discharge of Salt River near Chrysotile, Ariz., for the year ending Septem ber SO, 1926
Month
February _________ : .............................
April .
July... . -_.__._.--. _..._._______._..__..._.......
Discharge in second-feet
Maximum
474 398 334
, *- 286 263
2,880 8;'220-
4,500 854
1,120 607
1,000
8,220
Minimum
263 263 227
-182 198 2S4
2,030 7®8 249 194 164 153
153
Mean
355 334 275
' 236 ' .228 1,300 3,550 2,280
522 316 297 244
830
Run-off inacre-feet
21,800 19,900 16,900 14,<;500 12,700 79*900
211,000 14% 000 31,100 19,400 18,300 14,500
600,000
SALT RIVER NEAR ROOSEVELT, ARIZ.
LOCATION. At site of former diversion dam for power canal, 10 miles aboveupper end of Roosevelt Reservoir and 20 miles east of Roosevelt, GilaCounty.,
DRAINAGE AREA. 4,222 square miles (measured by United States Bureau ofReclamation).
RECORDS AVAILABLE. October 1, 1913, to September 30, 1926. GAGE. Principal gage is vertical staff on left bank, bolted to concrete wall at
head of canal. Temporary gages are used from time to time on accountof the channel shifting away from the main gage.
DISCHARGE MEASUREMENTS. Made from cable at dam site or by wading. CHANNEL AND CONTROL. Shifting sand and gravel. EXTREMES OF DISCHARGE. Maximum stage reported, 11.9 feet April 7 (discharge,
16,200 second-feet); minimum stage, 2.45 feet July 12 (discharge, 135 second':feet).
1913-1926: Maximum mean daily discharge, 79,200 second-feet January19, 1916; minimum mean daily discharge, 135 second-feet July 12, 1926.
DIVERSIONS. None of importance. REGULATION. I^one. COOPERATION. Daily-discharge record furnished by Salt River Valley Water
Users' Association.
Daily discharge, in second-feet, of Salt River near Roosevelt, Ariz., for the year endingSeptember 30, 1926
Day
1... - .... ...2 . ...........3 - - - 4... ............5
67... ............8 910--.-.----- _ --
11 12. 13 14 .15
Oct.
287276259249243
336391301282248
260343401383418
Nov.
307304300307323
325329328315316
359357312305298
Dec.
251247263267278
265297291270275
267257248246241
Jan.
273282285298297
293265257247235
228- 22*217230235
Feb.
234258277268253
237232228237
, 243
249* 247
260265283
Mar.
293297318336385
606755
1,5801,2801,200
1,730!%040*1,6101,4601,350
Apr.
2,3402,0202,4603,4203,250
3,75016,20012,5007,1806,900
5,700«.4f480^3,8203,3803,100
May
4,2503,8503,4203,1502,940
3,1803,9203,9403,2002,750
2,4002,1303,4601,7201,580
June
710687660667675
787830770685640
582.-.- 540
535505467
July
230185237175187
235167172160
- 148
138-. 1351,620367340
Aug.
600417406365319
276319294347
;,329
290369692385452
Sept.
168168168180197
193177186178175
175.480456287227
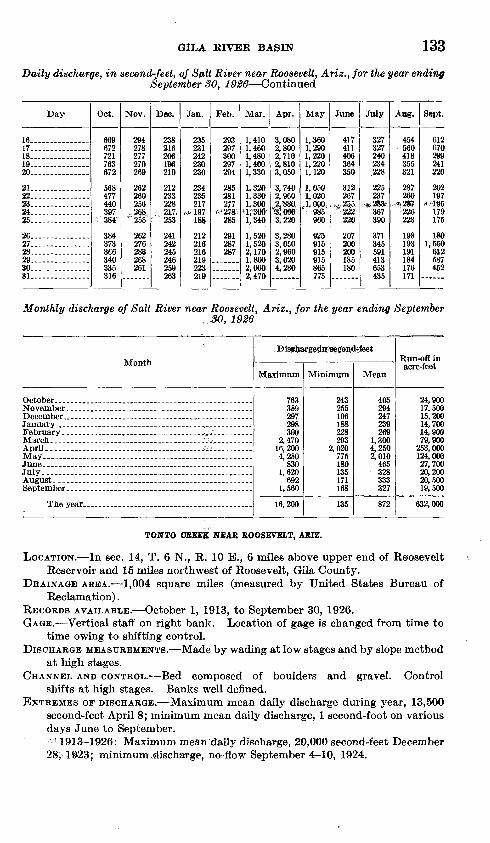
GILA RIVER BASIN 133
Daily discharge, in second-feet, of Salt River near RooseveU, Ariz.,for the year ending September 30, 1926 Continued
Day
16. 17 18 19 . 20 . -
21 22. 23 24 25
26 27 28 .29 30 31
Oct.
669672721763672
568477440
384
384373366340335316
NOV.
294278277270269
262260256
25^"
262276283268261
Dee.
238216206196210
212233228
253
241242245246259263
Jan.
235231242230230
234235217
1 Oft
21221621621922391 q
Feb.
293OQ7
300297294
285281977
-«..27gi-.285
287287
Mar.
1,4101,4601,4801,4001,330
1,3301,300ilf3ffi1,340
1,5202,1701 8002^ 0602,470
Apr.
3,0802,8002,7102,8103,050
3,7402,9602,«8ttIt 0003,220
3,2803,0£02,9603,0204,280
May
1,3601,2901,2201,2201,120
1,0501,020,1, oea.' 9f&
960
925915915915865775
June
417411406364350
312267
,-255,222220
207200200185180
July
327327240234228
225237
.'«2S&.367390
371345591413653435
Aug.
454560418355321
287260
»fx2S7226223
198193191184176171
Sept.
612670299241220
202197
*."1«5179175
1801,560612587462
Monthly discharge of Salt River near Roosevelt, Ariz., for the year ending September30, 1926
January ________________ . ___ ,. ______ .
April..... ... i_
July...... .. .. ..
Maximum
763359297298300
2,47016,2004,250
8301,620
6921,560
16,200
rge;insse<f9n<
Minimum
243255196188228293
2,020775180135171168
135
Mean
405294247239269
1,3004,2502,010
465 328
333327
872
Run-off inacre-feet
24,90017,50015,20014,70014,90079,900
253,000124,00027,70020,20020,50019,500
632,000
TONTO CREEK NEAR ROOSEVELT, ARIZ.
LOCATION. In sec. 14, T. 6 N., R, 10 E., 6 mites above upper end of RooseveltReservoir and 15 miles northwest of Roosevelt, Gila County.
DRAINAGE AREA. 1,004 square miles (measured by United States Bureau ofReclamation).
RECORDS AVAILABLE. October 1, 1913, to September 30, 1926. GAGE. Vertical staff on right bank. Location of gage is changed from time to
time owing to shifting control. DISCHARGE MEASUREMENTS. Made by wading at low stages and by slope method
at high stages. CHANNEL AND CONTROL. Bed composed of boulders and gravel. Control
shifts at high stages. Banks well defined. EXTREMES OF DISCHARGE. Maximum mean daily discharge during year, 13,500
second-feet April 8; minimum mean daily discharge, 1 second-foot on variousdays June to September.
<» 1913-1926: Maximum mean daily discharge, 20,000 second-feet December28, 19-23; minimum,discharge, no flow September 4-10, 1924.
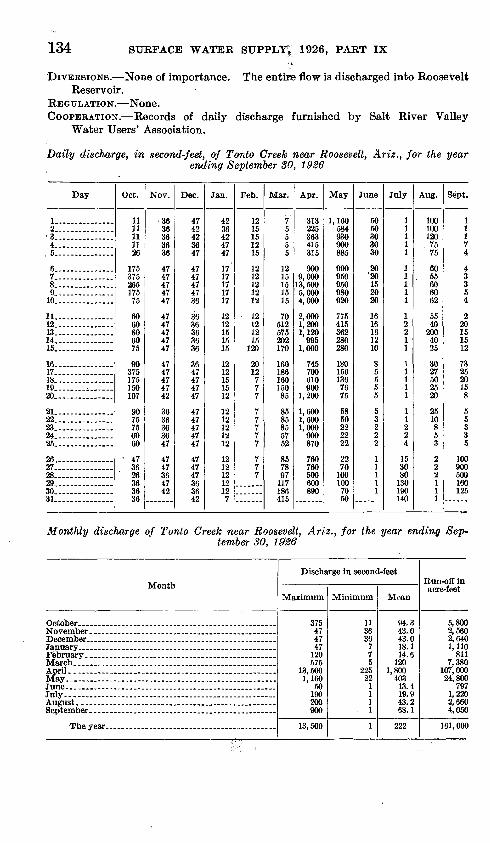
134 SURFACE WATER SUPPLY^ 1926, PART IX
DIVERSIONS. None of importance. The entire flow is discharged into RooseVeltReservoir.
REGULATION. None. COOPERATION. Records of daily discharge furnished by Salt River Valley
Water Users' Association.
Daily discharge, in second-feet, of Tonto Creek near Roosevelt, Ariz., for the year ending September 30, 1926
Day
..!.-. - _2. ___ ......3 _ _ ......4 _ ........
. 5. .... ... ....
6. . _ . ...7 _ ............8. . ....9. ... ... .....
10.... _ ........
11 12 _ ............13..- ...-.14 15.. ___ ........
16- _____ .. _17 ...18-- ...19 , 20. .. _ -
21 22 23. 24 . 25- _ ....... ...
26 27 28 _29 30 ai... .......
Oct.
1111111126
17537526517575
6060606075
90375175150107
9075756060
- 47
' 26363636
Nov.
3636363636
4747474747
4747474747
4747474742
3636363647
4747364742
Dec.
4742423647
4747474736
3636363636
3647474747
4747474747
474747363642
Jan.
4236424747
1717171717
1212151515
1212151512
1212121212
12121212127
Feb.
1215151215
1212121212
12121215
120
2012
777
77777
777
Mar.
75555
1215151515
70512575202170
16018616015085
8585855752
857897
117186415
Apr.
313225363415315
9009,000
13,5005,0004.000
2,0001,2001,120
9951,000
745700610900
1,200
1,6001,6001,000
900870
760760500600890
May
1,160584930900885
900950950980920
775415362280280
1801561367675
5850222222
2270
100100
7050
June
5050303030
20'20
152020
1616161210
85555
53222
11111
July
11lll
11lll
12211
111
11
11224
153080
130190140
Aug.
100100120
, 7575
60, 55
606062
5540
2004025
3027502520
2510853
222111
Sept.
11174
43354
220151512
732520158
55335
100900500160125
Monthly discharge of Tonto Creek near Roosevelt, Ariz., for the year ending Sep tember 80, 1926
Month
April.. ... ... ... ... ..... ...... ... ... ... ... ... ... .May. .... ..... ........ ..... .... ..... ........ .....
July.-.. __
Discharge in second-feet
Maximum
375 47 47 47
120 575
13,500 1,160
50 190 200 900
13,500
Minimum
11 36 36
7 7 5
225 22
1 1 1
. 1
1
Mean
94.3 43.0 43.0 18.1 14.6
120 1,800
403 13.4 19.9 43.2 68.1
222
Run-off inacre-feet
5,800 2,560 2,640 1,110
811 7,380
107,000 24,800
797 1,220 2,660 4,050
161,000
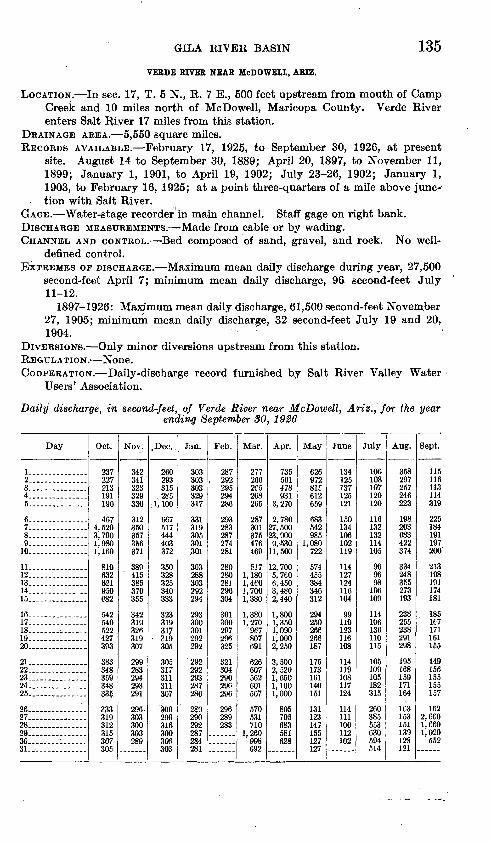
GILA RIVER BASIN 135VEEDE RIVER NEAR McDOWELL, AEIZ.
LOCATION. In sec. 17, T. 5 N., R. 7 E., 500 feet upstream from mouth of Camp Creek and 10 miles north of McDowell, Maricopa County. Verde River enters Salt River 17 miles from this station.
DRAINAGE AREA. 5,550 square miles.RECORDS AVAILABLE. February 17, 1925, to September 30, 1926, at present
site. August 14 to September 30, 1889; April 20, 1897, to November 11, 1899; January 1, 1901, to April 19, 1902; July 23-26, 1902; January 1, 1903, to February 16, 1925; at a point three-quarters of a mile above junc tion with Salt River.
GAGE. Water-stage recorder in main channel. Staff gage on right bank.DISCHARGE MEASUREMENTS. Made from cable or by wading.CHANNEL AND CONTROL. Bed composed of sand, gravel, and rock. No well-
defined control.EXTREMES OP DISCHARGE. Maximum mean daily discharge during year, 27,500
second-feet April 7; minimum mean daily discharge, 96 second-feet July 11-12.
1897-1926: Maximum mean daily discharge, 61,500 second-feet November 27, 1905; minimum mean daily discharge, 32 second-feet July 19 and 20, 1904.
DIVERSIONS. Only minor diversions upstream from this station.REGULATION. None.COOPERATION. Daily-discharge record furnished by Salt River Valley Water
Users' Association.
Daily discharge, in second-feet, of Verde River near McDowell, Ariz., for the year ending September 30, 1926
Day
1 2__ ___ ........3.. .... ...4. _ . _ .......5-.... _ --.--..
6...............7 8.. ... ..........9.. ..........10
11. . ....... 12.... ..... ......13 14............ ..15..... ..........
16...............17.... ........18 19.. .............20.. ..........
21..-....... ..22-.----.... .....23.. ..........24.. ..........25.. . ...... ..
26 27.-. ....---28 ............29 30 ...- ..31
Oct.
907
22701 Q
191190
4674,5203,7901 9801,160
810632
950682
540
427393
383348359348QQK
?33319312315307305
Nov;
040041OOQ
329330
312
357356Q71
389" J1 K.
3853701%*
040319
319307
299283294293291
296303300303289
.Dec.
260293315
1,100
667517
" 444403372
350328
340333
32331901 7
319305
305317311311307
309299
300306303
Jan.
303303qno
329317
331319305
.301
303288303292904.
300301292292'292
292293287286
289290292287284281
Feb.
, 292one
294286
293283287274
280280
296QfU
300297296325
321304290296
296289283
Mar.
277266
268265
287301375
5171,180
1,7001,380
1,3801,270'967
807691
607562601567
570531710
],260998692
Apr.
735561478931
3,270
2,78027. 50023,9009-53011,500
12,7005,760
3,480
1,8001,3501, 0901,0002,250
3,5002,5201,6501,1001,000
805705683581628
May
97281f
659
683542985
1,080722
574
384346010
294250266266187
175173161140151
131123147155127127
June
134125117
125121
150134106102119
114127124116104
99110123116108
114119108117124
114111100112102
July
106108107120120
116132132114105
969698106109
114106136110115
105109105182315
260385553630594514
Aug.
358297257246223
198203683422374
3342483E5273193
238255238291298
195168159171164
163153151139128121
Sept.
115116113114319
225184191197200
213198191174181
185167171161155
149156155155157
1622,6601,6601,020552
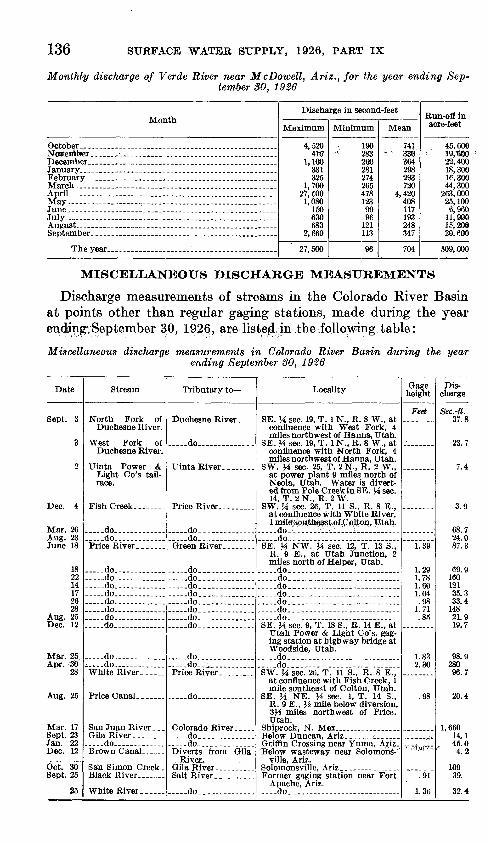
136 SURFACE WATER SUPPLY, 1926, PART IX
Monthly discharge of Verde River near McDowell, Ariz., for the year ending Sep tember SO, 1926
Month
N'oWefliber'. i ._ ..... .............................
February ______ . ..................................
July....................................................
September... ...... .................. ........ .. ......
Discharge in second-feet
Maximum
4,5204«
1,100 331 325
1,700 27, £00
1,080 150 630 683
2,660
27,500
Minimum
190 283 260 281 274 265 478 123 99 96
121 113
96
Mean
741 ' 386
364 298 293 720
4,420 408 117 193 248 347
704
Run-off in acre-feet
45,600 i 19,'880
22, 400 18,300 16, 300 44,300
263, 000 25,100 6,960
11,900 15,20820,eoo
509,000
MISCELLANEOUS DISCHARGE MEASUREMENTS
Discharge measurements of streams in the Colorado River Basin at points other than regular gaging stations, made during the year ending September 30, 1926, are listejd in the^follpysdng table:
Miscellaneous discharge measurements in Colorado River Basin during the year ending September SO, 1926
Date
Sept. 3
3
2
Dec. 4
Mar. 26Aug. 23June 18
182214172628
Aug. 25Dec. 12
Mar. 25Apr. 30
28
Aug. 25
Mar. 17 Sept. 23Jan. 22Dec. 12
Oct. 30Sept. 25
25
Stream
North Fork ofDuchesne River.
West Fork ofDuchesne River.
Light Go's tail- race.
Fish Creek. .......
..do ......
..... do. . ....... .
..... do .... . .....
.....do ... ... ....
.. do . ...... . .do .......... - do ... . ......... ..do .... ........... do ... .....
- do... .....--.do White River. .....
San Juan River. .. Gila River. ....... do Brown Canal __ ..
Black River .......
White River..
Tributary to
do.. ....
Price River _ . _ ..
- do.. ...... ... -do-..
do... do..... .... -do... .....- do__ _ -do..-- -do.. - do-.-
..do ..... ... do-_
Colorado River.. ... do.. . do - Diverts from Gila
River ,
Salt River..
do..-
Locality
SE. H sec. 19, T. 1 N., R. 8 W., atconfluence with West Fork, 4 miles northwest of Hanna, Utah.
SE. y* sec. 19, T. 1 N., R. 8 W., atconfluence with North Fork, 4 miles northwest of Hanna, Utah.
SW. H sec. 25, T. 2 N., R. 2 W.,at power plant 9 miles north of Neola, Utah. Water is divert ed from Pole Creek in SE. ]4 sec. 14, T. 2 N., R. 2 W.
SW. H sec. 26, T. 11 S., R. 8 E.,at confluence with White River, 1 mileisoHtiwa$tsof , Cotton, Utah.
__ do. ___ ---'. ...... '.'. ... ... do. SE. J4 NW. H sec. 12, T. 13 S.,
R. 9 E., at Utah Junction, 2 miles north of Helper, Utah.
__ do. do_ _ do.. do-_ do._ do.. .....do _ SE. J4 sec. 9, T. 18 S., R. 14 E., at
Utah Power & Light Co's. gag ing station at highway bridge at Woodside, Utah.
do. . do-.. ... SW. U sec. 26, T. 11 S., R. 8 E.,
at confluence with Fish Creek, 1 mile southeast of Colton, Utah.
SE. H NE. H sec. 1, T. 14 S.,R. 9 E., J4 mile below diversion, 3J4 miles northwest of Price, Utah.
Shiprock, N. Mex_ ................
Below wasteway near Solomons'-11 ville, Ariz.
Apache, Ariz. -do..
Gage height
Feet
1.39
1.291.781.601.04.98
1.71.85
1.832.30
.98
.91
1.36
Dis charge
Sec.-ft. 37.8
23.7
7.4
3.9
68.724.087.3
69.916012135.333.4
14821.919.7
98.928096.7
20.4
1,660 HI
. 45.04.2
10939.
32.4
INDEX
Accuracy of data and results, degrees of -. 4-5 Acre-foot, definition of_- _.,,____-.-. 2 Almont, Cole., Taylor River at_______ 30-32 Appropriations, record of_ . 1 Ashley Greek near Vernal, Utah._____ 54-55 Ashurst, Ariz., Port Thomas Consolidated
Canalat- . ----- - - 124-125 Gila River near..-.___-______ 88-89
Black-McClesky Canal at Duncan, Ark.. 105-106 Black River, Ariz., discharge measurement
of .-.--. _ - -- 136 Blackrock, N. Mex., Zuni River at-- 79 Blue River at Dillon, Colo.._________ 25-26 Boulder, Wyo., N0w*F!erk near-. - - 48-50 Bright Angel Creek near Grand' Canyon,
Ariz_ -- _ .. 78-81 Brown Canal, Ariz., discharge measurement
of . 136 near Solomonsville, Ariz _______.. 108-109
Brown Canal wasteway near SolomonsviLle,Ariz 109-110
Cedaredge, Colo., Surface Creek at__._- 37-38 Central, Utah, Santa Clara Creek near_ 84-85 Chrysotile, Ariz., Salt River near.____ 130-132 Cisco, Utah, Colorado River near..___-- 16-17 Colmonero Canal near Duncan, Ariz__. 106-107 Colona, CoJo., Uncompahgre River near_ - 39-40 Colorado River and tributaries above Green
River, gaging station records on. 11-43 Colorado River at Bright Angel Creek, near
Grand Canyon, Ariz.._ . 19-20 at Giwwraod Springs,>CoJ0--_-------- 12-14at Hot Sulphur Springs, Colo____ 11-12 at Lees Ferry, Ark___-------_----- 17-19at Yuma, Aria _- . .---- 22-23near Cisco, Utah..______--_. 16-17 near Palisade, Colo__-------_------ 14-15near Topock, Ariz_____________ 21-22
Computations, results, of accuracy of- __ _ 4-5 Control, definition of_ L...__.-___-_ 2 Cooperation, record of__ -_---------- 9Cosper-Windham Canal near Duncan, Ariz. 98-100 Cottonwoed Creek near Orangevilte, Utah-. 73-75 Curtis-Eempton Canal near Eden, Ariz.. 123-124
Daniel, Wyo., Green River'near__-------- 44-45Data, accuracy of______..__1____ 4-5
explanation of.___ ---...---------- 2-iDe Beque, Colo., Roan Creek near._____ 29-30 Delta, Colo., Uncompahgre River at.. ___ 41-42 Diamondville, Wyo., Hams Fork at_____ 51-53 Dillon, Colo., Blue River at ._.. 26-26 Dodge-Nevada Canal near Pima, Ariz..... 121-122^,Duncan, Ariz., Black-McClesky Canal at. 105-106
Colmonero Canal near ____. __. 106-107 Cosper-Windham Canal near._. 98-100
PageDuncan, Ariz., Duncan Canal near____ 103-104
Gila River near__ ____________ 85-86 Moddle Canal near_.__.______ 100-101 Sunset Canal near_______ _____ 97-98 Valley Canal near.___________ 102-103
Duncan Canal near Dunean, Ariz_ ___ 103-104 Duchesne, Utah, Strawberry River at___ 62-63 Duchesne River at Duchesne, Utah--,___ 58-60
at Myton, Utah.-.-- .----___.. 60-61 near Tabiona, Utah.-.__ ______- 57-58 North Fork of, Utah, discharge measure
ments of _____________ 136 West Fork of, Utah, discharge measure
ment of.____________.. 136
Eden, Ariz., Curtis-Kempton Canal near.. 123-124
Fairbank, Ariz., San Pedro River near__ 126-127 Fish Creek, Utah, discharge measurements
of . 136 near Scofield, Utah____________ 69-70
Florence, Ariz., Gila River near. 94-95 Fort Thomas Consolidated Canal at Ashurst,
Ariz.-- . 124-125 Fourness Canal near Solomonsville, Ariz.. 112-113 Fraser River near West Portal, Colo____ 24-25
Gila River at Ashurst-Hayden Dam, nearFlorence, Ariz______.____ 94-95
at Gillespie Dam, Ariz.- ______ 95-96 at Kelvin, Ariz .... ...._... 91-94at York, Ariz..,____.__ ____ 86 discharge ̂ Bjea«uremests.,oL^ 136 near Ashurst, Ariz.__- -__.-. 88-89 near Dunean, Ariz____ - -_. 85-86 near San Carlos, Ariz____.--..__... 89-91 near Solomonsville, Ariz___. __-.. 87-88
Gila River Basin, Ariz,, gaging-stationrecords in_____________ 85-136
Gillespie Dam, Ariz., Gila River at_____ 95-96 Glenwood Springs, Colo., Colorado River at. 12-14
Roaring Fork at______________ 26-28 Graham Canal near Safford, Ark __. 118-119 Grand Canyon, Ariz., Bright Angel Creek
near__ _ ... 79-81 Colorado Riv«r near 19-20
Grand Falls, Ariz., Little Colorado River at. 77-78 Grand Junction, Colo., Gunnison River near. 34-35 Grand Valley, Colo., Parachute Creek at 28-29 Green River at Green River, Utah...__... 47-48
at Green River, Wyo...... ..-. 45-46near Daniel, Wyo._._...- ...- 44-45
Green River Basin, Wyo.-Utah, gaging- station records in-----__- - . 44-75
Gunnison, Colo., Gunnison River near..._ 32-33Gunnison River near Grand Junction, Golo. 34-35
near Gunnison, Colo__---------- 32-33
137
138 INDEX
Hams Fork at Diamondville, Wyo.__. _ 51-5C Helper, Utah, Price River near....__...... 70-72Hot Sulphur Springs, Colo., Colorado River
at. -- . 11-12Huntington Creek near Huntington, Utah.. 72-7:
Kelvin, Ariz., Gila River at. _________ 91-64
Lake Fork near Myton, Utah.....__.... 65-66West Fork of, near Mountain Home,
Utah. ........................ 63-64Lazear, Colo., Lerous Creek near......_... 35-36Lees Ferry, Ariz., Colorado River at____ 17-19
Paria River at_._____________ 75-7 Leroux Creek near Lazear, Colo.___..__ 35-36 Lily, Colo., Little Snake River near._..... 53-54Little Colorado River at Grand Falls, Ariz.. 77-78 Little Colorado River Basin, Ariz.-N. Mex.,
gaging-station records in .... 77-79Little Snake River near Lily, Colo..____ 53-54
McDowell, Ariz., Verde River near.._... 135-136 Michelana Canal near Solomonsville, Ariz. 111-112 Moddle Canal near Duncan, Ariz......... 100-101Montezuma Canal near Solomonsville, Ariz. 115-
116 Mountain Home, Utah, West Fork of Lake
Fork near..____________ 63-64Mukuntuweap River near Springdale, Utah. 82-84Myton, Utah, Ducheshe River at...____ 60-61
Lake Fork near ____.......___.. 65-66
Naturita, Colo., San Miguel River at__ j__ 42-43 Neola, Utah, Uinta River near.._____.. 66-68 New Fork near Boulder, Wyo________. 48-50
Orangeville, Utah, Cottonwood Creek near.. 73-75 Ouray, Colo., Uncompahgre River below.... 38-39
Palisade, Colo., Colorado River near..__.. 14-15 Parachute Creek at Grand Valley, Colo. __ 28-29 Paria River at Lees Ferry, Ariz ... .. 75-77 Pima, Ariz., Dodge-Nevada Canal near... 121-122 Pine Creek at Pinedale, Wyo_________ 50-51 Price Canal, Utah, discharge measurement of. 136 Price River, Utah, discharge measurements
of__.-.----.--.._...__.__ 136near Helper, Utah_____________ 70-72
Publications, information concerning........ 5-9obtaining or consulting of 6-7 on stream flow, lists of . 7,9
Rillito Creek near Tucson, Ariz........... 129-130Roan Creek near De Beque, Colo.. .. 29-30 Roaring Fork at Glenwood Springs, Colo. 26-28 Roosevelt, Ariz., Salt River near._...... 132-133
Tonto Creek near.._._ ----- ..... 133-134Run-ofl in inches, definition of. .. 2
Saflord, Ariz., Graham Canal near. ____ 118-119Salt River-near Chrysotile, Ariz______ 130-132
near Roosevelt, Ariz__________ 132-133San Carlos, Ariz., Gila River near__....... 89-91San Jose Canal near Solomonsville, Ariz 114-115 San Juan River, N. Mex., discharge measure
ment of 136San Miguel River at Naturita, Colo__.. 42-43
San Pedro River near Fairbank, Ariz___ 126-127 San Simon Creek, Ariz., discharge measure
ment of________....__.. 136 Santa Clara Creek near Central, Utah___ 84-85 Santa Cruz River at Tucson, Ariz ___ 127-129 Scofield, Utah, Fish Creek near..______ 69-70 Second-feet, definition of________..__ 2 Second-feet per square mile, definition of. _ 2 Smithville Canal near Thatcher, Ariz..... 120-121 Solbmonsville, Ariz., Brown Canal near... 108-109
Brown Canal wasteway near. ____ 109-110 Fourness Canal near__________ 112-113 Gila River near______________ 87-88 Michelana Canal near..__...____ 111-112 Montezuma Canal near.________ 115-116 San Jose Canal near. . __ 114-115 Union Canal near..___________ 117-118
Springdale, Utah, Mukuntuweap River near 82-84 Stage-discharge relation, definition of____ 2 Strawberry River at Duchesne, Utah____ 62-63 Sunset Canal near Duncan, Ariz.._.___ 97-98 Surface Creek at Cedaredge, Colo._____ 37-38
Tabiona, Utah, Duchesne River near.___. 57-58 Taylor River at Almont, Colo.________ 30-32 Terms, definition of....----__--.,.,.____ 2 Thatcher, Ariz., Smithville Canal near__ 120-121 Tonto Creek near Roosevelt, Ariz.____ 133-134 Topock, Ariz., Colorado River near._.. 21-22 Tucson, Ariz., Rillito Creek near_____ 129-130
Santa Cruz River at__________ 127-129
Uinta Power & Light Co.'s tailrace, Utah,discharge measurement of...._ 136
Uinta River near Neola, Utah...____._ 66-68 Uncompahgre River at Delta, Colo ....... 41-42
below Ouray, Colo. ___________,. 38-39 near Colona, Colo.____________ 39-40
Union Canal near Solomonsville, Ariz.__ 117-118 Utah Power & Light Co.'s tailrace near
Vernal, Utah . 56-57
Valley Canal near Duncan, Ariz______ 102-103 Verde River near McDowell, Ariz_____ 135-136 Vernal, Utah, Ashley Creek near ... 54-55
Utah Power & Light Co.'s tailrace near. 56-57 Virgin River at Virgin, Utah.. ... .. 81-82 Virgin River Basin, Utah, gaging-station
records in .. 81-85
West Portal, Colo., Fraser River near. ___ 24-25 White River, Ariz., discharge measurement
of.. 136White River, Utah, discharge measurement
of. 136Whiterocks River near Whiterocks, Utah_ 68-69 Work, authorization of .*. 1
division of 10 scope of . 1-2
York, Ariz., Oila River at ._ . 86 York Canal at York, Ariz.. 107-108 Yuma, Ariz., Colorado River at 22-23
;ero flow, point of, definition of... ;uni River at Blackrock, N. Mex.
o