Embed Size (px)
Citation preview

Surge: A Network Analysis Tool
Crossbow Technology

Outline
• Discussion of 3 improvements to Surge tool
• Overview of routing protocol performance as captured by Surge
• Discussion of low-power routing performance

Updated Surge GUI
Quality = Link Yield to ParentYield = % of Data Packets
ReceivedPrediction = Product of
Quality metrics onall links to base

Log File History View• Allows one to scroll
through log files• Shows data yield across
time• Click on time-line to
show network topology at that time
• Reveals flaws in routing algorithms/performance


History Viewer Statistics
• Reports overall analysis of collected data.Node Numbe
Packets Received
Packets Sent
Success Rate
Parent Changes
Level Changes
Average Level
Packets Lost
0 66636 66638 0.99997 1 0 0 21 66635 66637 0.99997 1 1 0.99997 22 66631 66637 0.99991 1 1 0.99995 63 66460 66637 0.9973438 10 11 1.00346 1774 66184 66637 0.993202 60 59 1.18326 4535 66237 66637 0.9939973 285 60 1.95768 4006 66181 66636 0.9931719 238 3 2.00017 4557 66511 66637 0.9981092 13 12 1.00386 1268 65954 66637 0.9897504 66 56 1.19923 6839 66168 66637 0.9929619 130 93 1.67752 469
10 65680 66637 0.9856386 95 92 1.04114 95711 66370 66637 0.9959932 90 1 1.99994 267
Example output of Stats program showing reliable, stable networking.

Reliable Mint-Route Routing Algorithm
• Attempts to optimize expected success rate (Prediction in GUI)
• Each node monitors up to 16 neighbors• Each node reports its receive link quality from each
neighbor• Cost metric used to represent success rate to base
station• Each node broadcasts its cost• Node cost is parent cost plus link cost to parent• Nodes try to minimize total cost• Data packets are acknowledged by parents and
retransmitted up to 5 times

Mint-Route Results
• Avoids low-quality links seen in TinyOS 1.1 release version
• Prevents nodes from incorrectly attracting children
• In test network, it improved worst-case yield from 63% to 99%.
• Acknowledgements cost 6 ms of extra activity per message (less than typical MAC delay)
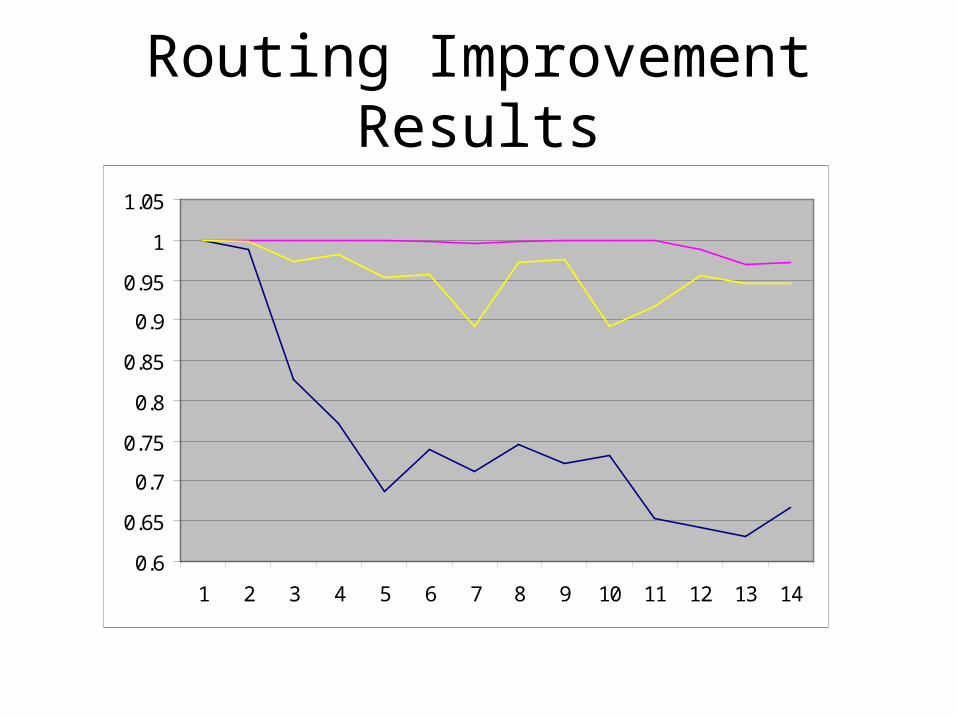
Routing Improvement Results
0.6
0.65
0.7
0.75
0.8
0.85
0.9
0.95
1
1.05
1 2 3 4 5 6 7 8 9 10 11 12 13 14

Power Reduction
Goal: 1 year lifetime, 100 nodes, 1 base, 3 minutes/report
Methodology:• Analyze current performance • Build analytical model to explain current
performance• Modify algorithm to meet goal using
analytical model• Confirm on real system

Analysis Model
Includes:• Network reconfiguration operations• Data originating from node• Data routed by node (ack/no_ack)• Data being transmitted in communication range
of node
Estimate for worst-case node in 100 node network: Route data for 20 nodes, hear over 200 data packets. (no base optimization)

Analytical Analysis of Activity by Node

Power Breakdown (80 ms)
10%
20%
66%
4%
Transmit Duty Cycle:
Receive Duty Cycle:
Check Duty Cycle:
Sleep Penalty
11 Months
Energy Breakdown
Power Breakdown (125 ms)
17%
34%
45%
4%
Transmit Duty Cycle:
Receive Duty Cycle:
Check Duty Cycle:
Sleep Penalty
13 Months
Power Breakdown (235 ms)
27%
51%
19%
3%
Transmit Duty Cycle:
Receive Duty Cycle:
Check Duty Cycle:
Sleep Penalty
10 Months
Lifetime Vs. Low Power Listen Check Interval
0
2
4
6
8
10
12
14
0 50 100 150 200 250 300 350
(ms)
(Mo
nth
s)

Confirming Performance
• Can’t wait a year to see if it works…
• Internal power meter allows one to track power consumption
• Record milliamp-minute use by radio, CPU and if necessary sensors
• Report total power usage via multi-hop network

Power Visualization
Nodes 2, 4 and 7 are “white hot” because they hear and route a lot of traffic. Nodes 9, 12and 13 are cool because they are leaf nodes at the edge of the network.
Analysis must focus on the “hot” nodes.
Analytical models predict this network to last1.5 years reporting every 3 minutes.
The base rarely transmits and is the coolest.

Final Network StatisticsNode
Number Packets Received
Packets Sent
Success Rate
Parent Changes
Level Changes
Average Level
Duty Cycle
0 3666 3666 100.0% 1 0 0 XXXXXX1 3666 3666 100.0% 0 1 0.99973 1.244%2 3664 3666 99.9% 0 1 0.99973 1.519%3 3665 3666 100.0% 29 22 1.609 1.051%4 3665 3666 100.0% 2 3 1.00518 1.413%5 3658 3665 99.8% 20 7 2.00492 1.263%6 3649 3665 99.6% 19 18 2.97095 0.984%7 3657 3665 99.8% 88 82 1.48811 1.260%8 3663 3665 99.9% 9 1 1.99945 1.529%9 3660 3665 99.9% 1 1 2.99918 0.888%
10 3661 3665 99.9% 29 7 2.00874 1.236%11 3621 3665 98.8% 68 11 2.98371 1.208%12 3551 3665 96.9% 5 80 2.51535 0.941%13 3558 3665 97.1% 119 80 3.34429 1.074%