Embed Size (px)
Citation preview
ACTA OPHTHALMOLOGICA 1956
(Southampton Eye Hospital, England)
SURGICAL PROGNOSIS IN CONGESTIVE GLAUCOMA: COMPARISON W I T H GLAUCOMA SIMPLEX
BY
George Bennett*)
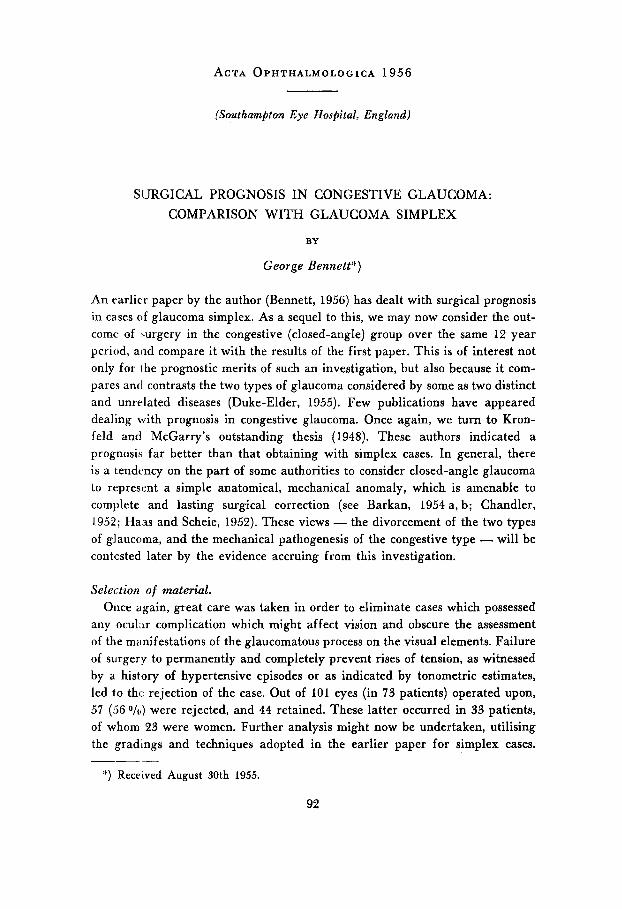
An earlier paper by the author (Bennett, 1956) has dealt with surgical prognosis in cases of glaucoma simplex. As a sequel to this, we may now consider the out- come of mrgery in the congestive (closed-angle) group over the same I2 year period, aiid compare it with the results of the first paper. This is of interest not only for the prognostic merits of such an investigation, but also because it com- pares and contrasts the two types of glaucoma considered by some as two distinct and unrelated diseases (Duke-Elder, 1955). Few publications have appeared dealing with prognosis in congestive glaucoma. Once again, we turn to Kron- feld and McGarry's outstanding thesis (1948). These authors indicated a prognosis far better than that obtaining with simplex cases. In general, there is a tendency on the part of some authorities to consider closed-angle glaucoma to represent a simple anatomical, mechanical anomaly, which is amenable to complete and lasting surgical correction (see Barkan, 1954 a, b; Chandler, 1952; Haas and Scheie, 1952). These views - the divorcement of the two types of glaucoma, and the mechanical pathogenesis of the congestive type - will be contested later by the evidence accruing from this investigation.
Selection of material. Once again, great care was taken in order to eliminate cases which possessed
any ocular complication which might affect vision and obscure the assessment of the manifestations of the glaucomatous process on the visual elements. Failure of surgery to permanently and completely prevent rises of tension, as witnessed by a history of hypertensive episodes or as indicated by tonometric estimates, led to thr rejection of the case. Out of 101 eyes (in 73 patients) operated upon, 57 (56 O/O) were rejected, and 44 retained. These latter occurred in 33 patients, of whom 23 were women. Further analysis might now be undertaken, utilising the gradings and techniques adopted in the earlier paper for simplex cases.
") Received August 30th 1955.
92
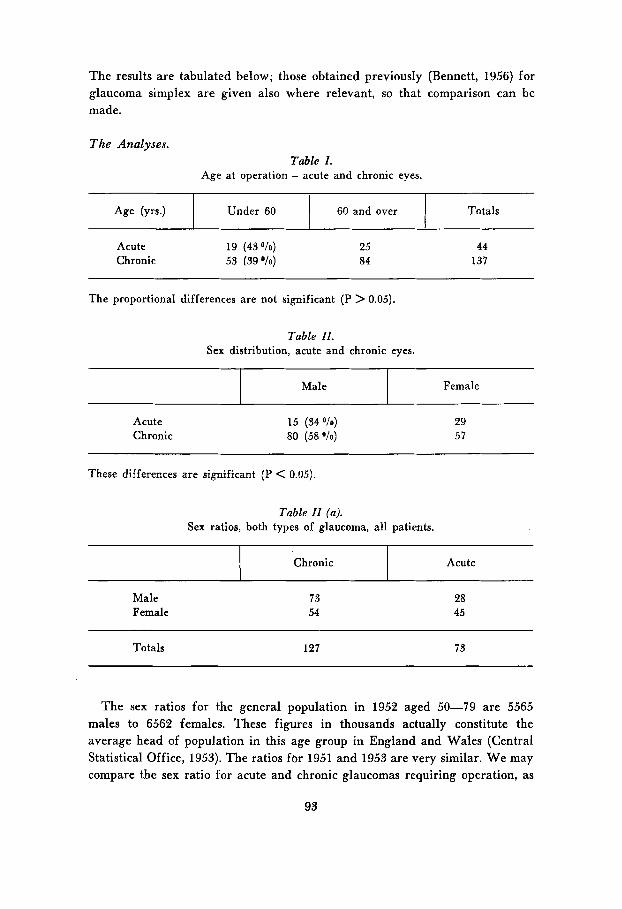
The results are tabulated below; those obtained previously (Bennett, 1956) for glaucoma simplex are given also where relevant, so that comparison can be made.
Male
The Analyses.
Female
Table 1. Age at operation - acute and chronic eyes.
Chronic
I 60 and over I Under 60
Acute
Totals
Acute 19 (430/0) 25 Chronic 53 (39%) 84
44 137
The proportional differences are not significant (P > 0.05).
Acute Chronic
15 (34 O/o)
80 (58 O/o)
29 51
These differences are significant (P < 0.05).
Totals 127 73
The sex ratios for the general population in 1952 aged 50-79 are 5565 males to 6562 females. These figures in thousands actually constitute the average head of population in this age group in England and Wales (Central Statistical Office, 1953). The ratios fbr 1951 and 1953 are very similar. W e may compare the sex ratio for acute and chronic glaucomas requiring operation, as
93
given above, with these. W e find that there is a significant proportional difference in the sex distribution for chronic (X2 = 5.1, n = 1 , P = 0.05-0.02) but not for acute glaucomas (X2 = 1.37, n = 1, P = 0.30-0.20).
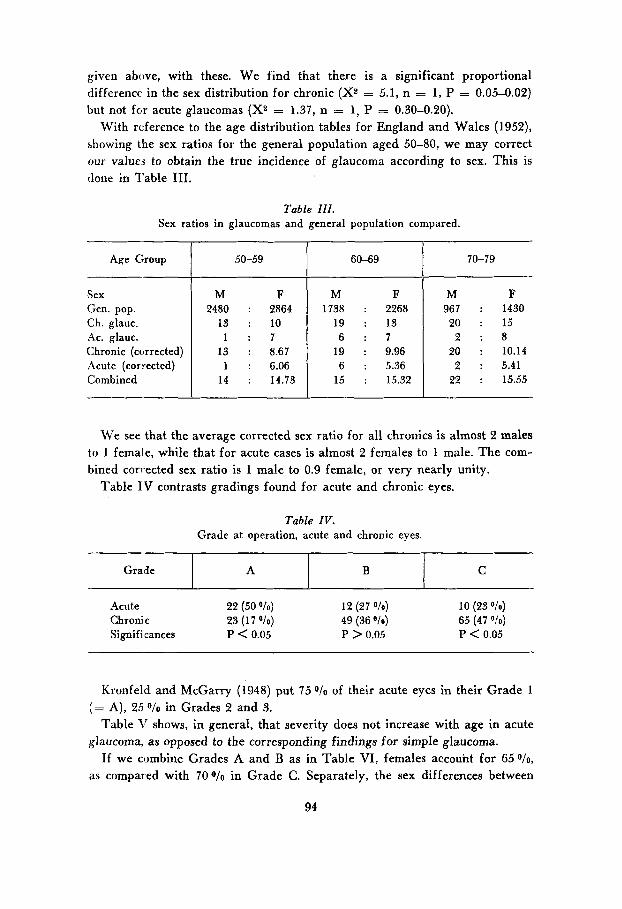
With reference to the age distribution tables for England and Wales (1952), showing the sex ratios for the general population aged 50-80, we may correct our values to obtain the true incidence of glaucoma according to sex. This is done in Table 111.
Grade
Table I I I . Sex ratios in glaucomas and general population compared.
A B C
Age Group 1 50-59
Sex Gen. pop. Ch. glauc. Ac. glauc. Chronic (corrected) Acute (corrected) Combined
M F 2480 : 2864
13 : 10 1 : 7
13 : 8.67 1 : 6.06
14 : 14.73
60-69 70-79
M F 1738 : 2268
19 : 13 6 : 7
19 : 9.96 6 : 5.36
15 : 15.32
M F 967 : 1430 20 : 15
2 : 8 20 : 10.14 2 : 5.41
22 : 15.55
We see that the average corrected sex ratio for all chronics is almost 2 males to 1 female, while that for acute cases is almost 2 females to 1 male. The com- bined corrected sex ratio is 1 male to 0.9 female, or very nearly unity.
Table IV contrasts gradings found for acute and chronic eyes.
Table IV. Grade at operation, acute and chronic eyes.
Kronfeld and McGarry (1948) put 75 O/O of their acute eyes in their Grade 1 (= A), 25 O/O in Grades 2 and 3.
Table 'I' shows, in general, that severity does not increase with age in acute glaucoma, as opposed to the corresponding findings for simple glaucoma.
If we combine Grades A and B as in Table VI, females accouht for 65 O/o,
as compared with 70 O/O in Grade C. Separately, the sex differences between
94
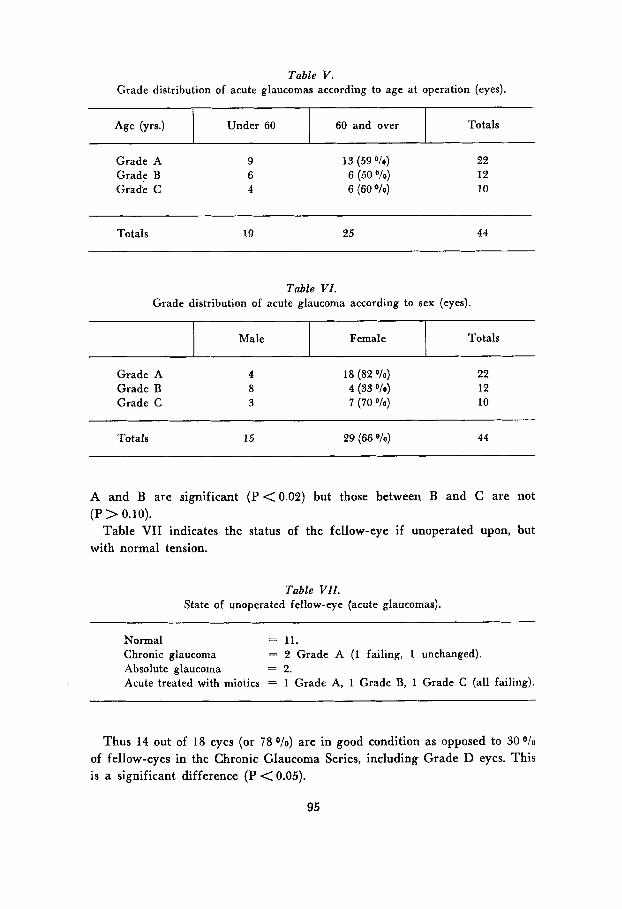
Age (yrs.1 Under 60 60 and over
Grade A Grade B Grade C
Totals
9 6 4
13 (59 "/o) 6 (50 O/o)
6 (60 %)
22 12 10
Totals 19 25 44
Table VI. Grade distribution of acute glaucoma according to sex (eyes).
1 Male I Female 1 Totals
Grade A Grade B Grade C
4 8 3
18 (82 "10)
7 (70 "10) 4 (33 010)
22 12 10
Totals 15 29 (66 "0) 44
A and B are significant (P <0.02) but those between B and C are not
Table VII indicates the status of the fellow-eye if unoperated upon, but (P > 0.10).
with normal tension.
Table VII. State of unoperated fellow-eye {acute glaucomas).
Normal = 11. Chronic glaucoma = 2 Grade A (1 failing, 1 unchanged). Absolute glaucoma = 2. Acute treated with miotics = 1 Grade A, 1 Grade B, 1 Grade C (all failing).
Thus 14 out of 18 eyes (or 78 o/o) are in good condition as opposed to 30 O/o
of fellow-eyes in the Chronic Glaucoma Series, including Grade D eyes. This is a significant difference (P < 0.05).
95
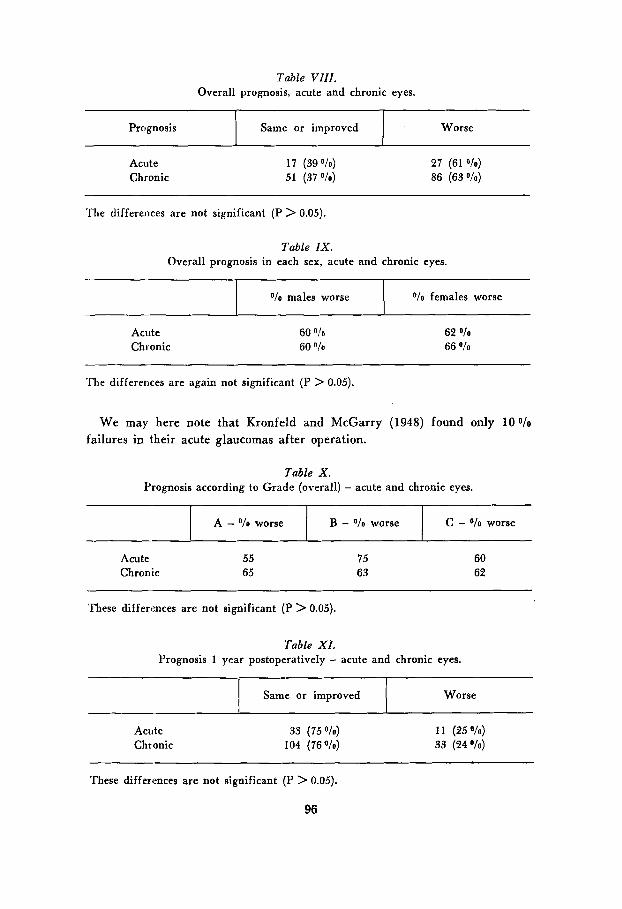
Table V I I I . Overall prognosis, acute and chronic eyes.
O/o males worse
Prognosis Same or improved I
V o females worse
Worse
Acute 1 7 (39 O/o) 27 (61 O i o ) Chronic 51 (37 O/o) 86 (63 O/o)
The differences are not significant (P > 0.05).
Acute Chronic
60 O/o
60 O/a
62 O/o
66 O/o
The differences are again not significant (P > 0.05).
We may here note that Kronfeld and McGarry (1948) found only 100/0 failures in their acute glaucomas after operation.
Table X . Prognosis according to Grade (overall) - acute and chronic eyes.
C - O/o worse I A - O/o worse B - O/o worse
Acute 55 Chronic 65
75 63
60 62
These differences are not significant (P > 0.05).
Table X I . Prognosis 1 year postoperatively - acute and chronic eyes.
Worse
~~~ ~
Same or improved
Acute 33 (75 V O ) 11 (25 O/O)
Chronic 104 (76p/o) 33 (24 "/o)
These differences are not significant (P > 0.05).
96
Tables VIII-XI above show that cases of acute and chronic glaucoma differ
(1) In their sex apportionment, males being more common in chronic and
(2) Severity at operation, the acutes having a much lower degree of visual
(3) The state of the unoperated fellow-eye, being much better with acutes. Tables XI1 give account of factors affecting prognosis in the acute glau-
only: -
females in acute glaucoma.
defect. Severity in acutes does not increase with age.
comas.
Grade A
Table XI1 (a). Type of operation.
Grade B Grade C
Type:
Filtration (29 eyes)
Iridectomy (14 eyes)
Cyclodiathermy (1 eye)
Abbreviated :
. Filtration Iridectomy
Improved
in 1 yr. overall
4 4
1 1
- -
Same
in 1 yr. overall
17 8
10 3
1 1
Improved or same Worse
in 1 yr. overall in 1 yr. overall
8 (28 O/o) 17 (59 "/o) 3 (21 "lo) 10 (71 O/o)
Worse
in 1 yr. overall
8 1 7
3 10
- -
Total eyes
29 14
Table XI1 (b). Grading according to operation.
Filtration 10 Iridectomy I1 Cyclodiathermy 1
10 2
9 1
We see in Table XI1 (a) that filtration operations give 28 o/o and 59 O / o
failures 1 year postoperatively and overall respectively, while the corresponding
97
rates for iridectomy are 21 and 7 1 O/O. Neither of these differences is significant (P > 0.05). though it is suggestive that while iridectomy gives a slightly better immediate prognosis, a better long-term result is obtained by a filtration technique.
Table X[I (b) shows the grading of the eyes operated on by the different techniques. 19, or 65.50/0 of the filtration operations are performed on eyes belonging to the severer Grades B and C, as compared with only 3, or 21.4 O/o
of the iridectomies. 13 (68 O/O) of the former and 2 (67 O/O) of the latter dete- riorate suhsequently, showing a similar prognosis for these grades; of the Grade A, or milder eyes, however, only 4 (40'0/0) operated on by a filtration technique failed, as opposed to 8 (72.7 O/O) which had suffered iridectomy. Once again, these proportional differences are suggestive but not statistically significant (P > 0.05).
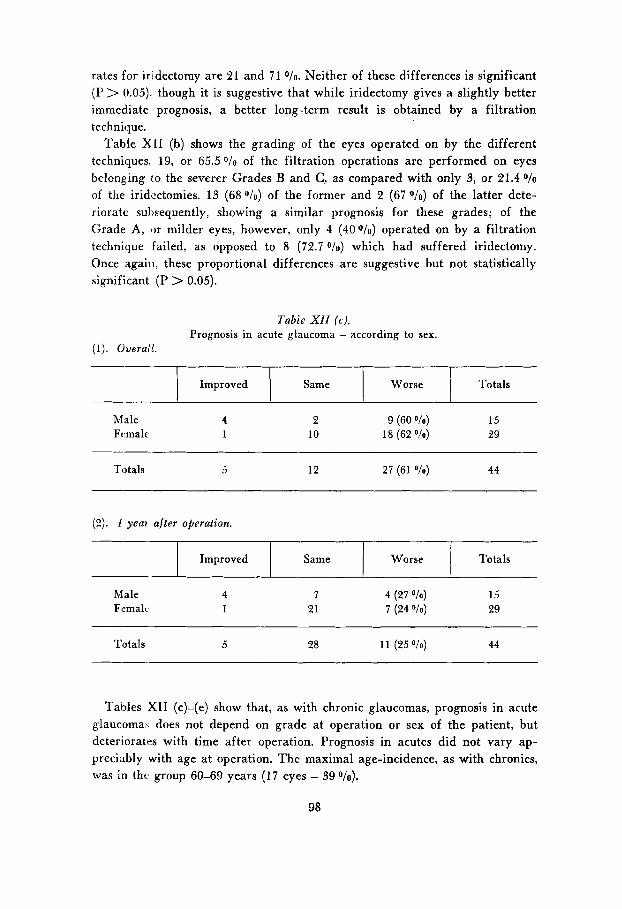
Improved
Tabie X I I (6). Prognosis in acute glaucoma - according to sex.
(1). Overail.
Same
Male 4 2 9 (60 O/o) 15 Female 1 10 18 (62 O/o) 29
Totals 5 12 27 (61 O/o) 44
(2). I yea? after operation.
1 Improved I Same 1 Worse I Totals
Male 4 7 4 (27 O!o) 15 Femalc 1 21 7 (24 O/o) 29
Totals 5 28 1 1 (25 Ole) 44
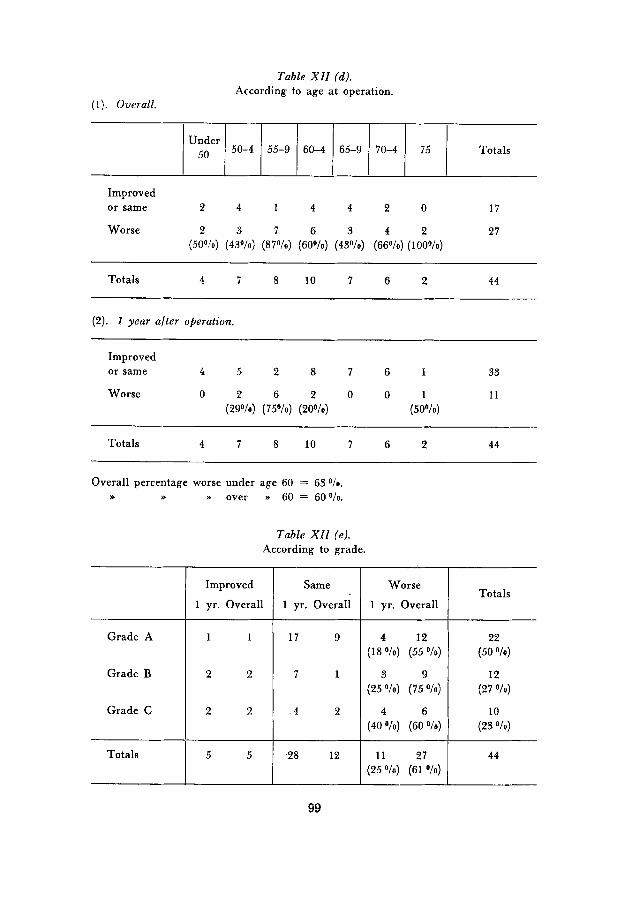
Tables XI1 (c)-(e) show that, as with chronic glaucomas, prognosis in acute glaucoma\ does not depend on grade at operation or sex of the patient, but deteriorates with time after operation. Prognosis in acutes did not vary ap- preciably with age at operation. The maximal age-incidence, as with chronics, was in thc group 60-69 years ( 1 7 eyes - 39%).
98
Under 5o 50-4
Totals 4 7 8 10 ' 1 6 2 44
55-9 60-4 65-9 70-4 75 Totals
(2). I year after operation.
Improved
1 yr. Overall
Improved or same 4 5 2 8 7 6 I 33
Worse 0 2 6 2 0 0 1 1 1 (29"/0) (75O/o) (20°/0) (50°/o)
Same
1 yr. Overall
Totals 4 7 8 10 7 6 2 44
Overall percentage worse under age 60 = 63 O/o.
w >>
Grade A
Grade B
Grade C
Totals
w over n 60 = 60°/o.
Table XI1 (e). According to grade.
2 2 2
5 5 I ~ 2 8 12
Worse
1 yr. Overall
4 12 (1 8 O/o) (55 O / o )
3 9 (25 O/o) (75 O/o)
4 6 (40 Ole) (60 O/o)
1 1 27 (25 O/o) (61 O/o)
Totals
22 (50 O/o)
12 (27 O / o )
10 (23 Ole)
44
99
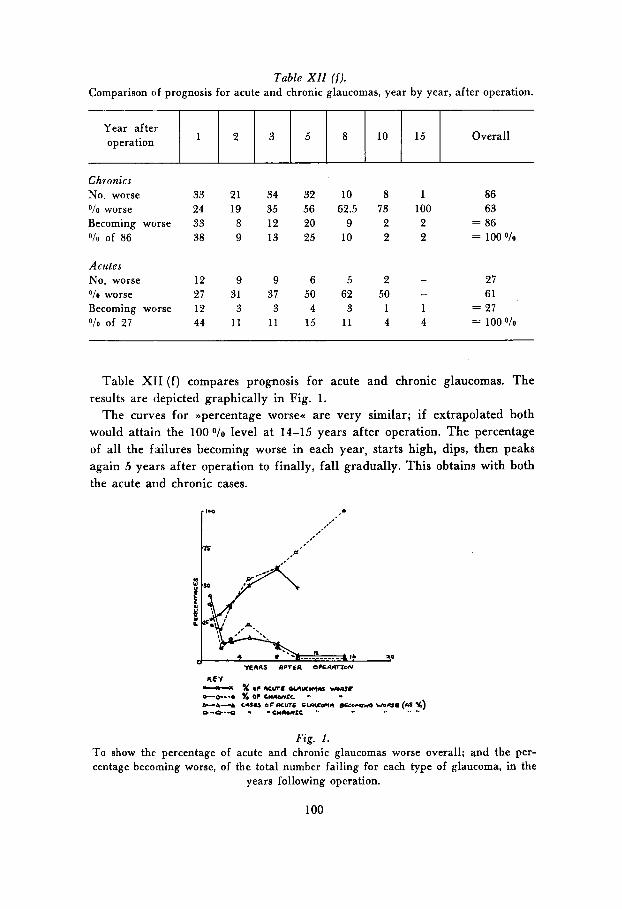
Table XI1 ( f ) . Comparison of prognosis for acute and chronic glaucomas, year by year, after operation.
Year after operation 1 2 3 5 Overall 8 10 15
Chronics No. worse 33 21 34 32 10 8 1 86 O/o worse 24 19 35 56 62.5 73 100 65 Becoming worse 33 8 12 20 9 2 2 = 86 OIo of 86 38 9 13 25 10 2 2 = 100 010
Acutes No. worse 12 9 9 6 5 2 - 27 O/o worse 27 31 31 50 62 50 - 61 Becoming worse 12 3 3 4 3 1 1 = 27 O I o of 27 44 11 11 15 11 4 4 = 100 010
Table XI1 ( f ) compares prognosis for acute and chronic glaucomas. The results are depicted graphically in Fig. 1.
The curves for >>percentage worsea are very similar; if extrapolated both would attain the 100 O/O level at 14-15 years after operation. The percentage of all the failures becoming worse in each year, starts high, dips, then peaks again 5 years after operation to finally, fall gradually. This obtains with both the acute and chronic cases.
Fig. 1. To show the percentage of acute and chronic glaucomas worse overall; qnd the per- centage becoming worse, of the total number failing for each type of glaucoma, in the
years following operation.
100
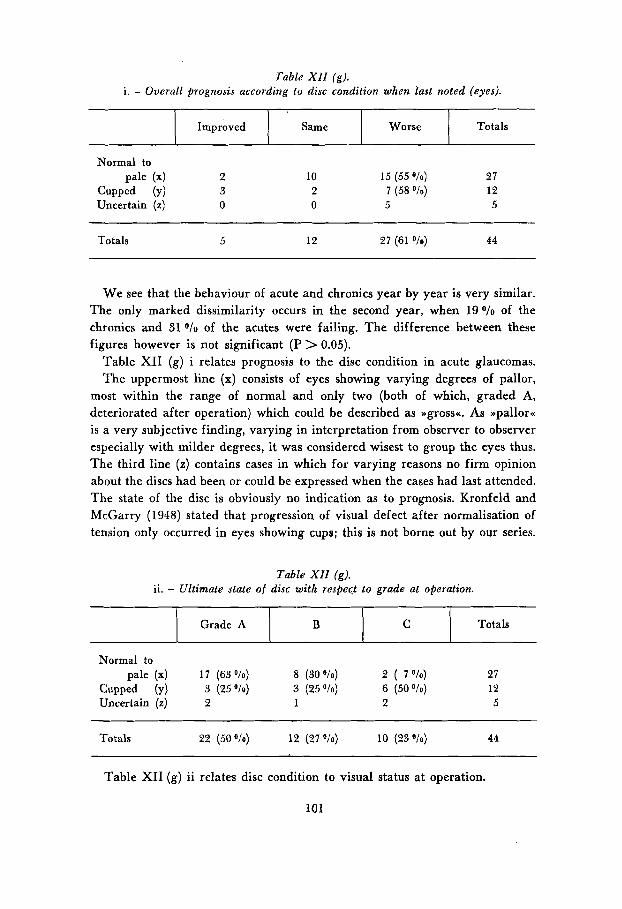
Table XII ( g ) . i . - Overall prognosis according to disc condition when last noted (eyes).
Grade A B
1 Improved I Same 1 Worse 1 Totals
C Totals
Normal to pale (4 2 10 15 (55 O/o) 27
Cupped (Y) 3 2 7 (58 O/o) 12 Uncertain (2) 0 0 5 5
Totals 5 12 27 (61 O/o) 44
We see that the behaviour of acute and chronics year by year is very similar. The only marked dissimilarity occurs in the second year, when 190/0 of the chronics and 31 O/O of the acutes were failing. The difference between these figures however is not significant (P > 0.05).
Table XI1 (g) i relates prognosis to the disc condition in acute glaucomas. The uppermost line (x) consists of eyes showing varying degrees of pallor,
most within the range of normal and only two (both of which, graded A, deteriorated after operation) which could be described as Dgrossc As ppallorcc is a very subjective finding, varying in interpretation from observer to observer especially with milder degrees, it was considered wisest to group the eyes thus. The third line (z) contains cases in which for varying reasons no firm opinion about the discs had been or could be expressed when the cases had last attended. The state of the disc is obviously no indication as to prognosis. Kronfeld and McGarry (1948) stated that progression of visual defect after normalisation of tension only occurred in eyes showing cups; this is not borne out by our series.
Table XI1 (g). ii. - Ultimate state of disc with respect to grade at operation.
Normal to pale (x) 1 7 (63 O/o) 8 (30 O/o) 2 ( 7 O h ) 27
Cupped (Y) 3 (25 O/o) 3 (25 O/o) 6 (50 O/o) 12 Uncertain (2) 2 1 2 5
Totals 22 (50 O/o) 12 (27 O h ) 10 (23 O h ) 44
Table XI1 (g) ii relates disc condition to visual status at operation.
101
We see there is a significant excess of Grade C eyes showing cupping over those sliowiiig pallor (P < 0.05). Thus acute glaucomas which show cupping are more likely to have severe visual defect before operation than are other cases; i. e. they show a characteristic typical of chronic glaucoma. Field defects were found to be similar whether cupping or only pallor was present.
DISCUSS I0 N
This investigation reveals a close resemblance between the behaviour of acute and chronic glaucomas after surgery has successfully and permanently nor- malised the tension, whether by simple iridectomy or by a filtration technique. It could be said that after operation the acute eye virtually became a chronic glaucomatous eye which had suffered a successful filtrating operation, and enjoyed a similar prognosis. We may be justified in believing that the factors which produce the post-operative visual loss are the same in both cases. This could be idcntified with the Bneuro-vascular instability* of Duke-Elder and his school (1950, 1955).
We mentioned earlier the prevailing fashion of dividing glaucomas into two clinical and pathological groups. Their post-operative behaviour has given us reason to view this differentiation with suspicion. W e may now examine the characteristics by which acute and chronic glaucomas differ, as disclosed by this survey The most fundamental and distinctive one is the sex distribution. The others (for acutes: - visual defect at operation milder and not increasing with age, moperated opposite eye healthier) probably derive from the fact that the acute attack and also the operation occur early in the course of the responsible pathological process, whatever the age of the patient. AS, according to our tables, the age at operation is similar in both cases, this suggests t h d acute glaucoma patients get their attacks at about the time that chronic glaucoma patients are found to require surgery to control tension. We. have a further piece of evidence which integrates the two types of glaucoma. We have seen that the corrected sex ratios were almost exactly 2 females to 1 male in xute , and 1 female to 2 males in chronic glaucoma. By summation, the corrected total glaucoma population was found to contain almost equal numbers ol males and females. We could therefore assume a glaucoma factor, equally liable to affect either sex, but more likely to produce a blockage of the angle of the anterior chamber in females than in males; this event, in acutes, coriesponds temporally, in the >>life cyclecc of the disease, to the failure in chronici to maintain medical control of tension. This factor may be a genetic one controlling ocular anatomy, or more subtilely, a hormonic or neuro-chemical one, which may again have a genetically controlled distribution.
102
Extraneous factors (e. g. toxic and dietetic) should also be considered; it is however, no part of this investigation to follow-up these speculations.
T o close this discussion I would like to reinforce this unitarian concept by recalling the not infrequent cases in these Series which presented difficulty in allocation to the acute or chronic groups. Some of these hybrid strains showed features common to both, at one and the same time or on different occasions. Thus an honest to goodness chronic, watched for some years, might throw a typical acute attack, or an acute might (less commonly) cease having congestive episodes and settle down to deteriorate steadily in the manner of the so-called wsimpiexa cases. The behaviour may differ in the eyes of one person, one eye having acute congestive attacks while the other pursues a chronic course. I t is surprising that the existence of these mixed and subacute cases have not been more frequently remarked upon in the literature, especially when powerful efforts are being made toward a separativist theory. The coincidence of both types in one eye is regarded rather as a chance association (see Sugar, 1950, 1953) on the rare occasions when it is reported upon, but Sugar (1947) did affirm his belief that all types of primary glaucoma had a common basis. Some authors e. g. Duke-Elder (1950, 1955), qualified this supposition by admitting that narrow-angle cases suffered, in addition, from some type of nneuro-vascular instability-, but the anatomical school gradually gained wide acceptance for the view of the separateness of acute and chronic glaucoma and the simple, obstructive mechanism of the acute type. It is hoped that this clinical survey will give reason for the proselytes of this school to reconsider their attitudes.
CONCLUSIONS
(1) Of certain selected cases of >>acute- glaucoma successfully operated on, over 600/0 showed further visual fai1;re over periods varying from 1 to 15 years.
(2) An excess of females over males was nofed, but this was not significant. Less than a quarter showed a severe degree of visual loss at operation. Peak incidence was in the 60-69th. year age-groups in both sexes.
(3) Severity is unrelated to sex and to age at operation, generally speaking. (4) A higher proportion of eyes failed the remoter the operation became
in time. (5 ) Prognosis does not vary significantly with sex, the type of operation, the
severity of visual loss, or with the age at operation. The state of unoperated fellow eyes is usually very good.
(6) Acute glaucoma differs from the chronic type only as regards sex in- cidence (females rather than males), severity at operation (milder), state of unoperated opposite eye (better) and the fact that the degree of visual loss
103
found at operation does not increase with age. Otherwise behaviour and status is similar.
( 7 ) Acute and chronic glaucomas deteriorate visually at much the same rate after operation, 100 O/O of each failing by the 14th. year.
(8) Corxected sex ratios showed a 2 : 1 preponderance of males for chronic, and females for acute glaucoma. Combined, the ratio became almost unity.
ACKNOWLEDGEMENTS
I once again am obliged to state my indebtedness to the Surgeons of the Southampton Eye Hospital for their encouragement and their permission to examine their patients and records.
REFERENCES
Barkan, 0. (1954 a). Am. J. Ophth., 37, 332. Barkan, 0. (1954b). ibid., 37, 724. Bennett, G. (1956). Acta Ophth. (in the press). Central Statistical Office (1953). .Annual Abstract of Statistics<, No. 90, pg. 29,
Chandler, P. A . (1952). Schoenberg Memorial Lecture, Arch. Ophth., Chicago, 47, 695. Duke-Elder, S. (1950). Am. J. Ophth., 33, 1 1 . Duke-Elder, S. (1955). ,Glaucoma : a Symposiumu. pg. 2. Blackwell Scientific Publi-
Haas, /. S . and Scheie, H . G. (1952). Tr. Am. Acad. Ophth., 56, 589. Kronfeld, P . C. and McGarry, H. I . (1948). J .A.M.A. 136, 957. Sugar, H . S. (1947). Am. J. Ophth., 30, 451. Sugar, H . S. (1950). Proc. XVI Int. Cong. Ophth., London, 2, 846. Sugar, H . S. (1953). Eye, Ear, Nose and Throat Monthly, 32, 191.
H. M. S. O., London.
cations, Oxford.
104