Embed Size (px)
Citation preview
Surimi Paste, Supply Track Executive Summary, Q2 2021Prepared by Urner Barry Consulting for the Genuine Alaska Pollock Producers, GAPP
Angel Rubio, Sr. Analyst [email protected] Pandey, Data Scientist [email protected] Ashley, Senior VP [email protected]
The following report is only an executive summary of all the data points analyzed. Because of the
many ways the data analyzed can be presented, these summaries only provide a general overview
of each data series. However, the data requested by the members is available in many ways in the
excel files provided. All data can be relatively easily manipulated to fit each member’s presentation
preference, whether in tables, charts, or raw data.
The nuances for many calculations are many, as these vary widely from species to species, origins,
destinations, etc. The methodologies for many species are relatively simple since trade data can be
assumed to be a function for its production in many cases. However, this is not always the case for
specific countries and species. Also, some calculations with limited data and rudimentary methods
had to be used to arrive at a “best estimate.” Don’t hesitate to contact the analyst directly to make
changes, suggestions, or corrections for details on each species or market. After exhausting most
options available to obtain reliable data, we firmly believe that the estimates presented here are a
good approximation of the species, origins, and destinations requested.
© Urner Barry 2021 All Rights Reserved. This publication is protected by US copyright law, please do not copy. Urner Barry Consulting Surimi Paste, Supply Track | A publication of Urner Barry Consulting | 732-240-2349 | P.O. Box 389, Toms River, NJ 08754
Table of Contents
Alaska Pollock SurimiProduction 1Trade (Imports) 2Import price 3Trade (Exports) 4
Japanese Pollock & Atka Mackerel SurimiJapanese Pollock Surimi Production and Inventory 5Atka Mackerel Surimi Production 6
Pacific Whiting SurimiProduction 7Trade (Imports) and Pricing 8Trade (Exports) 9
Southern Blue Whiting and Hoki SurimiProduction 10-11Trade (Imports) 11-12Trade (Exports) 13
Tropical Surimi Production and TradeThailand 14India 15Vietnam 16Indonesia 17Malaysia 18Pakistan 19Myanmar 20
Sardine Production and Trade, Peru to Japan 21
Northern Blue Whiting Production and Trade, France 22
Surimi from China, Trade 23

79,375
18,333
79,820
13,543
-
20
40
60
80
100
Q1 Q2 Q3 Q4
Thou
sand
MT
US Production 2018 2019 2020
2021 3 yr avgAlaska Pollock Surimi
71.4
16.8
111.8
7.4
78.5
26.4
86.7
4.7
86.0
13.6
82.9
16.9
73.6
14.9
69.9
19.0
59.0
32.8
52.2
-
20
40
60
80
100
120
Q1 Q2 Q3 Q4 Q1 Q2 Q3 Q4 Q1 Q2 Q3 Q4 Q1 Q2 Q3 Q4 Q1 Q2 Q3 Q4
2017 2018 2019 2020 2021
Me
tric
To
ns
US ProductionAlaska Pollock Surimi
-7.0% -5.0%-15.5%
+ 18.5%
-20%
-15%
-10%
-5%
0%
5%
10%
15%
20%
25%
163.0
-7.0%151.6
-5.0%143.9
-15.5%121.6
+ 18.5%144.0
-
20
40
60
80
100
120
140
160
180
2017 2018 2019 2020 2021
Thou
sand
MT
US ProductionAlaska Pollock Surimi from week 1 to week 32
Alaska Pollock SurimiAlaska pollock (AKP) surimi production during Q2 2021 increased dramatically compared to a year ago. On a year-to-date basis, AKP surimi production is up nearly 4 percent through Q2 and up 18.5 percent through week 32. As expected, the 20 percent decrease reported in Q1 could have been misleading as we moved into the year, with a noticeable comeback registered through week 32. AKP Surimi production in Q3 has thus far reached 52.2 thousand metric tons, which is over two-thirds of all the volume produced last year.
Table 1. Alaska Pollock Surimi Production by Quarter. Source: NOAA Fisheries, Urner Barry. *Q3 2021data is incomplete.
Figure 3. Alaska Pollock Surimi Production by Quarter, linear. Source: NOAA Fisheries, Urner Barry.*Q3 2021 data is incomplete.Figure 1. Alaska Pollock Surimi Production by Quarter. Source: NOAA, Urner Barry. *Q3 2021 data is
incomplete.
Production delays at the beginning of the year have skewed seasonal data, so we must exercise caution when comparing these figures.
1
Figure 2. Total Alaska Pollock Surimi Production and YTD through week 32. Source: NOAA Fisheries, Urner Barry Consulting.
© Urner Barry 2021 All Rights Reserved. This publication is protected by US copyright law, please do not copy. Urner Barry Consulting Surimi Paste, Supply Track | A publication of Urner Barry Consulting | 732-240-2349 | P.O. Box 389, Toms River, NJ 08754
US Production, Alaska Pollock Surimi (MT)2017 2018 '18 vs. '17 2019 '19 vs. '18 2020 '20 vs. '19 2021 '21 vs. '20
Q1 71,352 78,451 + 9.9% 86,026 + 9.7% 73,647 -14.4% 59,033 -19.8%Q2 16,763 26,448 + 57.8% 13,639 -48.4% 14,912 + 9.3% 32,804 + 120.0%Q3 111,827 86,666 -22.5% 82,858 -4.4% 69,935 -15.6% Q4 7,392 4,653 -37.1% 16,928 + 263.8% 19,048 + 12.5%
Total 207,334 196,218 -5.4% 199,451 + 1.6% 177,542 -11.0%YTD 88,115 104,899 + 19.0% 99,665 -5.0% 88,559 -11.1% 91,837 + 3.7%
51 4939 40
13 11
11 10
0
10
20
30
40
50
60
70
80
90
2018 2019 2020 2021
Thou
sand
MT
Alaska Pollock Surimi Imports Japan South Korea FranceThailand Spain LithuaniaTaiwan Poland BelarusUkraine Norway
By Declaring Country through Q2
-
10
20
30
40
50
60
70
Q1 Q2 Q3 Q4
Thou
sand
MT
Alaska Pollock Surimi Imports2018 2019
2020 2021All Countries
Table 2. Alaska Pollock Surimi Imports. Aggregate by declaring countries’ customs.
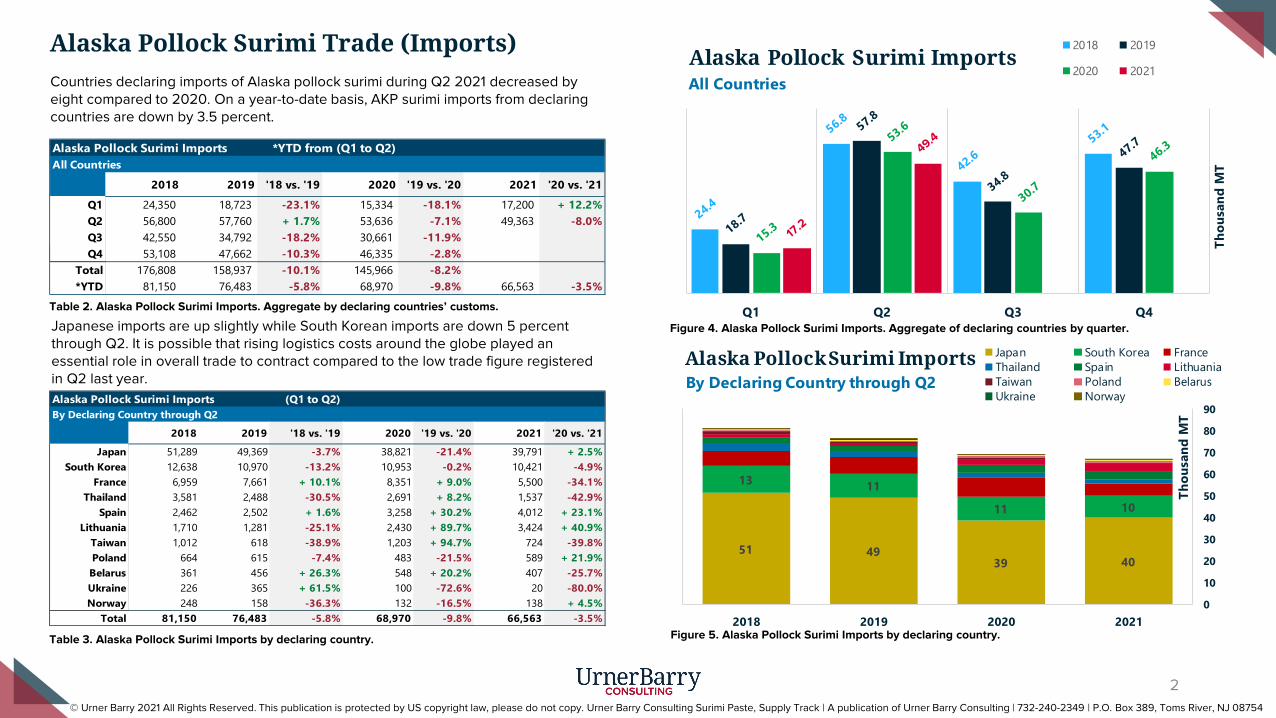
Alaska Pollock Surimi Trade (Imports)Countries declaring imports of Alaska pollock surimi during Q2 2021 decreased by eight compared to 2020. On a year-to-date basis, AKP surimi imports from declaring countries are down by 3.5 percent.
Table 3. Alaska Pollock Surimi Imports by declaring country.
Figure 4. Alaska Pollock Surimi Imports. Aggregate of declaring countries by quarter.Japanese imports are up slightly while South Korean imports are down 5 percent through Q2. It is possible that rising logistics costs around the globe played an essential role in overall trade to contract compared to the low trade figure registered in Q2 last year.
Figure 5. Alaska Pollock Surimi Imports by declaring country.
2
Alaska Pollock Surimi Imports *YTD from (Q1 to Q2)All Countries
2018 2019 '18 vs. '19 2020 '19 vs. '20 2021 '20 vs. '21
Q1 24,350 18,723 -23.1% 15,334 -18.1% 17,200 + 12.2%Q2 56,800 57,760 + 1.7% 53,636 -7.1% 49,363 -8.0%Q3 42,550 34,792 -18.2% 30,661 -11.9% Q4 53,108 47,662 -10.3% 46,335 -2.8%
Total 176,808 158,937 -10.1% 145,966 -8.2%*YTD 81,150 76,483 -5.8% 68,970 -9.8% 66,563 -3.5%
Alaska Pollock Surimi Imports (Q1 to Q2)By Declaring Country through Q2
2018 2019 '18 vs. '19 2020 '19 vs. '20 2021 '20 vs. '21
Japan 51,289 49,369 -3.7% 38,821 -21.4% 39,791 + 2.5%South Korea 12,638 10,970 -13.2% 10,953 -0.2% 10,421 -4.9%
France 6,959 7,661 + 10.1% 8,351 + 9.0% 5,500 -34.1%Thailand 3,581 2,488 -30.5% 2,691 + 8.2% 1,537 -42.9%
Spain 2,462 2,502 + 1.6% 3,258 + 30.2% 4,012 + 23.1%Lithuania 1,710 1,281 -25.1% 2,430 + 89.7% 3,424 + 40.9%
Taiwan 1,012 618 -38.9% 1,203 + 94.7% 724 -39.8%Poland 664 615 -7.4% 483 -21.5% 589 + 21.9%Belarus 361 456 + 26.3% 548 + 20.2% 407 -25.7%Ukraine 226 365 + 61.5% 100 -72.6% 20 -80.0%Norway 248 158 -36.3% 132 -16.5% 138 + 4.5%
Total 81,150 76,483 -5.8% 68,970 -9.8% 66,563 -3.5%
© Urner Barry 2021 All Rights Reserved. This publication is protected by US copyright law, please do not copy. Urner Barry Consulting Surimi Paste, Supply Track | A publication of Urner Barry Consulting | 732-240-2349 | P.O. Box 389, Toms River, NJ 08754

-
10,000
20,000
30,000
40,000
50,000
60,000
70,000
Met
ric T
ons
Declaring Countries' imports Japan S. Korea France Thailand
Spain Lithuania Taiwan Poland
Belarus Ukraine NorwayAlaska Pollock surimi
$2,000
$2,500
$3,000
$3,500
$4,000
$4,500
US
D$
/MT
Declaring Countries' imports Japan S. Korea FranceThailand Spain LithuaniaTaiwan PolandAlaska Pollock surimi
-
10
20
30
40
50
60
70
Thou
sand
MT
Declaring Countries' imports vs. U.S. Exports
Imports
ExportsAlaska Pollock surimi
Although some countries show an upward trend in imports, like Lithuania, Spain,and Poland, they have not offset an overall downward trade trend.
However, partial Q3 data through July from a handful of countries suggest AKPsurimi imports could increase relative to the previous year in that quarter.When matching up U.S. exports of Alaska pollock surimi and countries declaringU.S. imports of the same product, we continue to notice a downward trend—aspreviously mentioned—and a tight correlation.
Figure 8. Alaska Pollock Surimi Import Price per MT by declaring country. *Q3 2021 data is incomplete.
3
Figure 7. Alaska Pollock Surimi Imports vs. U.S. Alaska Pollock Surimi Exports. Smoothed average.
© Urner Barry 2021 All Rights Reserved. This publication is protected by US copyright law, please do not copy. Urner Barry Consulting Surimi Paste, Supply Track | A publication of Urner Barry Consulting | 732-240-2349 | P.O. Box 389, Toms River, NJ 08754
Alaska Pollock Surimi Trade (Imports), cont.
Figure 6. Alaska Pollock Surimi Imports. Linear imports by declaring countries. *Q3 2021 data isincomplete.

34 3222 25
29 31
28 29
0
10
20
30
40
50
60
70
80
90
2018 2019 2020 2021
Thou
sand
MT
U.S. Alaska Pollock Surimi Exports Japan South KoreaFrance ThailandLithuania NetherlandsSpain China
By Declaring Country through Q2
-
10
20
30
40
50
60
70
80
90
100
Q1 Q2 Q3 Q4
Thou
sand
MT
U.S. Alaska Pollock Surimi Exports 2018 2019
2020 2021All CountriesAKP surimi export prices remained strong through Q2, while import prices by declaringcountries peaked in Q3—through July—in Thailand and Japan. Global demand for AKPproducts is reportedly active, and rising production costs continue to push pricesupward. This situation is likely to persist throughout 2021 as many expect continuedlogistical bottlenecks across the globe. Furthermore, aside from the supply constraintsthat are likely to stay, many continue to report strong demand for surimi paste in themain markets, mainly Japan, South Korea, Thailand, and others.
Figure 9. Alaska Pollock Surimi Exports. Aggregate of destination countries by quarter.
Table 4. Alaska Pollock Surimi Exports (U.S.) by quarter. U.S. Customs, Urner Barry.
Figure 10. Alaska Pollock Surimi Exports by destination country.
Table 5. Alaska Pollock Surimi Exports (U.S.) by destination declared.
4
U.S. Alaska Pollock Surimi Exports *YTD from (Q1 to Q2)All Countries
2018 2019 '18 vs. '19 2020 '19 vs. '20 2021 '20 vs. '21
Q1 47,863 53,296 + 11.4% 41,807 -21.6% 34,007 -18.7%Q2 35,071 28,125 -19.8% 30,634 + 8.9% 34,943 + 14.1%Q3 86,176 69,144 -19.8% 46,756 -32.4% Q4 16,885 23,563 + 39.5% 32,704 + 38.8%
Total 185,995 174,128 -6.4% 151,901 -12.8%*YTD 82,934 81,421 -1.8% 72,441 -11.0% 68,950 -4.8%
U.S. Alaska Pollock Surimi Exports (Q1 to Q2)By Declaring Country through Q2
2018 2019 '18 vs. '19 2020 '19 vs. '20 2021 '20 vs. '21
Japan 34,218 32,250 -5.8% 22,266 -31.0% 25,418 + 14.2%South Korea 29,391 30,560 + 4.0% 28,415 -7.0% 28,539 + 0.4%
France 6,429 6,357 -1.1% 6,516 + 2.5% 5,051 -22.5%Thailand 1,238 2,516 + 103.2% 5,161 + 105.1% 2,078 -59.7%
Lithuania 3,223 2,627 -18.5% 2,073 -21.1% 1,444 -30.3%Netherlands 2,815 1,488 -47.1% 2,020 + 35.8% 3,381 + 67.4%
Spain 927 1,734 + 87.1% 2,668 + 53.9% 150 -94.4%China 2,411 1,744 -27.7% 863 -50.5% 984 + 14.0%
Germany 718 937 + 30.5% 592 -36.8% 115 -80.6%Taiwan 1,277 728 -43.0% 1,091 + 49.9% 761 -30.2%
India 588 546 -7.1%Total 82,934 81,421 -1.8% 72,441 -11.0% 68,950 -4.8%
© Urner Barry 2021 All Rights Reserved. This publication is protected by US copyright law, please do not copy. Urner Barry Consulting Surimi Paste, Supply Track | A publication of Urner Barry Consulting | 732-240-2349 | P.O. Box 389, Toms River, NJ 08754
Alaska Pollock Surimi Trade (U.S. Exports)
0
10,000
20,000
30,000
40,000
50,000
60,000
Jan-
18Fe
b-18
Mar
-18
Apr-
18M
ay-1
8Ju
n-18
Jul-1
8Au
g-18
Sep-
18O
ct-1
8N
ov-1
8De
c-18
Jan-
19Fe
b-19
Mar
-19
Apr-
19M
ay-1
9Ju
n-19
Jul-1
9Au
g-19
Sep-
19O
ct-1
9N
ov-1
9De
c-19
Jan-
20Fe
b-20
Mar
-20
Apr-
20M
ay-2
0Ju
n-20
Jul-2
0Au
g-20
Sep-
20O
ct-2
0N
ov-2
0De
c-20
Jan-
21Fe
b-21
Mar
-21
Apr-
21
All Surimi Inventory Japan
Pollock Inventory
Other Surimi Inventory
Metric Tons
131
109
103
95
70
83 84
97
85
73
64
60
51 52
42
35 4
2 46 5
5 60 65
52
38 40
33
32
30
43 47
0
20
40
60
80
100
120
140
1992
1993
1994
1995
1996
1997
1998
1999
2000
2001
2002
2003
2004
2005
2006
2007
2008
2009
2010
2011
2012
2013
2014
2015
2016
2017
2018
2019
2020
*20
21*
Thou
sand
MT
Japanese Pollock Surimi Production
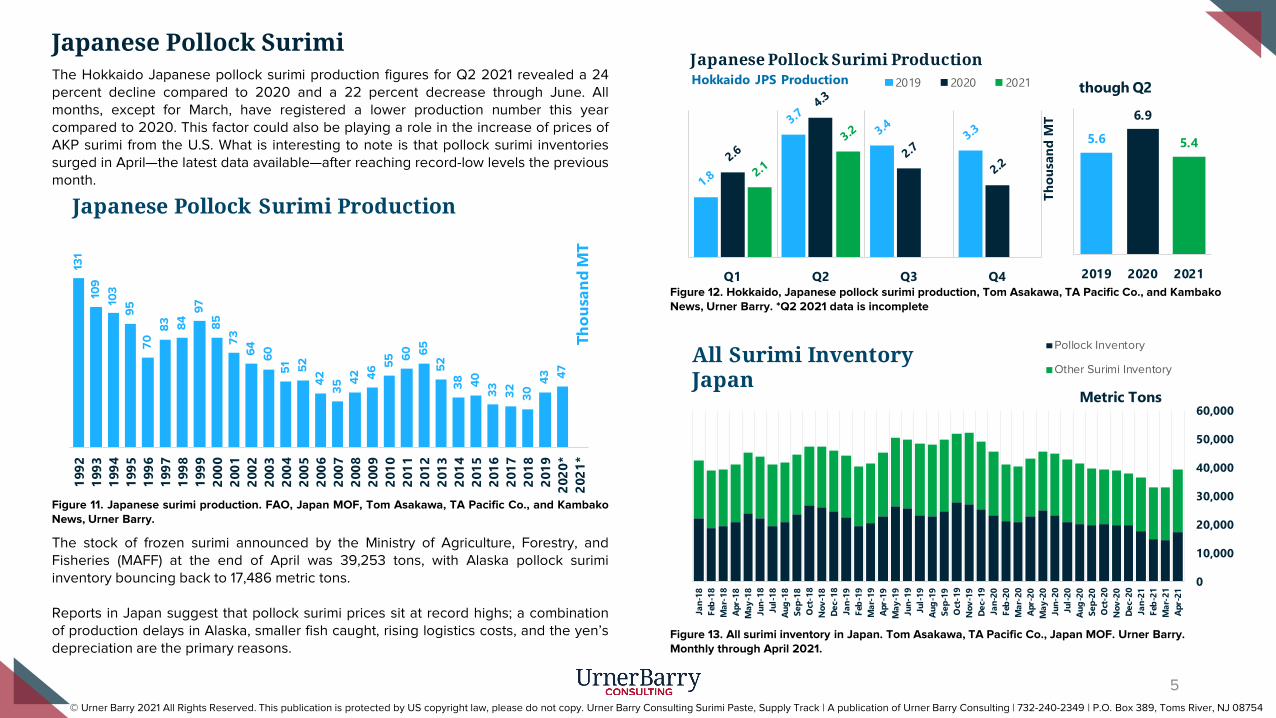
Japanese Pollock SurimiThe Hokkaido Japanese pollock surimi production figures for Q2 2021 revealed a 24percent decline compared to 2020 and a 22 percent decrease through June. Allmonths, except for March, have registered a lower production number this yearcompared to 2020. This factor could also be playing a role in the increase of prices ofAKP surimi from the U.S. What is interesting to note is that pollock surimi inventoriessurged in April—the latest data available—after reaching record-low levels the previousmonth.
Figure 12. Hokkaido, Japanese pollock surimi production, Tom Asakawa, TA Pacific Co., and Kambako News, Urner Barry. *Q2 2021 data is incomplete
Figure 11. Japanese surimi production. FAO, Japan MOF, Tom Asakawa, TA Pacific Co., and KambakoNews, Urner Barry.
The stock of frozen surimi announced by the Ministry of Agriculture, Forestry, andFisheries (MAFF) at the end of April was 39,253 tons, with Alaska pollock surimiinventory bouncing back to 17,486 metric tons.
Reports in Japan suggest that pollock surimi prices sit at record highs; a combinationof production delays in Alaska, smaller fish caught, rising logistics costs, and the yen’sdepreciation are the primary reasons.
Figure 13. All surimi inventory in Japan. Tom Asakawa, TA Pacific Co., Japan MOF. Urner Barry. Monthly through April 2021.
5
© Urner Barry 2021 All Rights Reserved. This publication is protected by US copyright law, please do not copy. Urner Barry Consulting Surimi Paste, Supply Track | A publication of Urner Barry Consulting | 732-240-2349 | P.O. Box 389, Toms River, NJ 08754
0.0
0.5
1.0
1.5
2.0
2.5
3.0
3.5
4.0
4.5
Q1 Q2 Q3 Q4
Thou
sand
MT
Japanese Pollock Surimi Production2019 2020 2021Hokkaido JPS Production
5.6
6.9
5.4
2019 2020 2021
though Q2
0
50
100
150
200
250
300
350
400
Q1 Q2 Q3 Q4
Atka Mackerel Surimi Production2019 2020 2021Hokkaido AMS Production
Met
ric T
ons
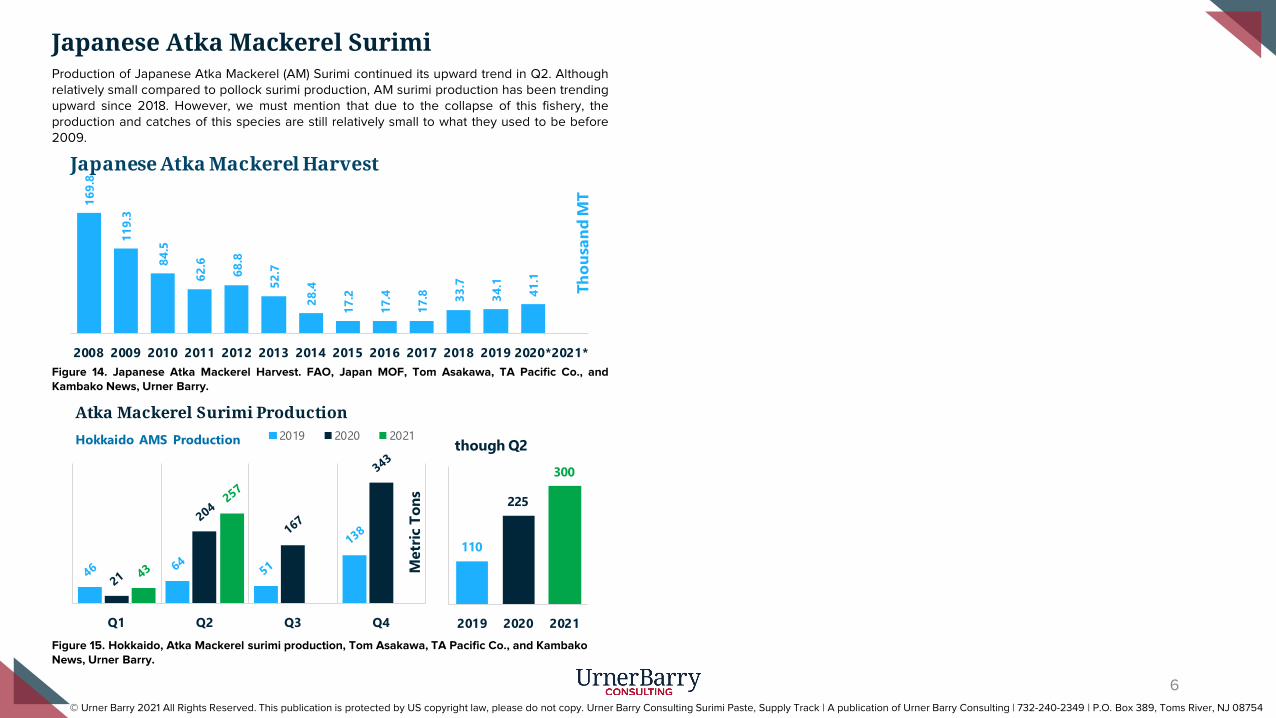
Japanese Atka Mackerel SurimiProduction of Japanese Atka Mackerel (AM) Surimi continued its upward trend in Q2. Althoughrelatively small compared to pollock surimi production, AM surimi production has been trendingupward since 2018. However, we must mention that due to the collapse of this fishery, theproduction and catches of this species are still relatively small to what they used to be before2009.
Figure 15. Hokkaido, Atka Mackerel surimi production, Tom Asakawa, TA Pacific Co., and Kambako News, Urner Barry.
Figure 14. Japanese Atka Mackerel Harvest. FAO, Japan MOF, Tom Asakawa, TA Pacific Co., andKambako News, Urner Barry.
6
© Urner Barry 2021 All Rights Reserved. This publication is protected by US copyright law, please do not copy. Urner Barry Consulting Surimi Paste, Supply Track | A publication of Urner Barry Consulting | 732-240-2349 | P.O. Box 389, Toms River, NJ 08754
169.
8
119.
3
84.5
62.6
68.8
52.7
28.4
17.2
17.4
17.8 33
.7
34.1
41.1
0
20
40
60
80
100
120
140
160
180
2008 2009 2010 2011 2012 2013 2014 2015 2016 2017 2018 2019 2020*2021*
Thou
sand
MT
Japanese Atka Mackerel Harvest
110
225
300
2019 2020 2021
though Q2
18.9
7.110.4
-
5
10
15
20
25
30
Q2 Q3 Q4
Thou
sand
MT
PW Surimi Production Estimate 2018 2019 20202021 5 yr Avg
PW Surimi Production Estimate
7.816.4 19.5 20.0 23.8
34.9
21.5
34.2 38.8 37.0 34.3 37.1
14.6
2009 2010 2011 2012 2013 2014 2015 2016 2017 2018 2019 *2020 *2021
All
Pacific Whiting Surimi
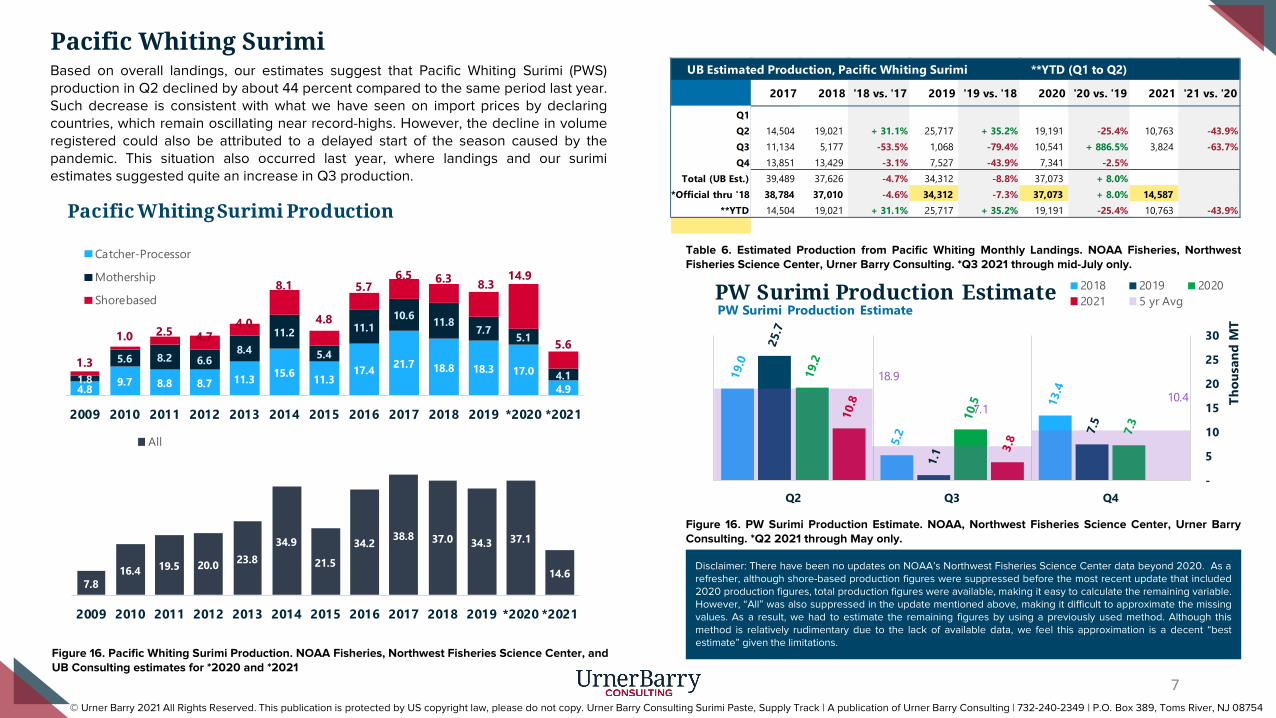
Table 6. Estimated Production from Pacific Whiting Monthly Landings. NOAA Fisheries, NorthwestFisheries Science Center, Urner Barry Consulting. *Q3 2021 through mid-July only.
Figure 16. Pacific Whiting Surimi Production. NOAA Fisheries, Northwest Fisheries Science Center, andUB Consulting estimates for *2020 and *2021
7
Disclaimer: There have been no updates on NOAA’s Northwest Fisheries Science Center data beyond 2020. As arefresher, although shore-based production figures were suppressed before the most recent update that included2020 production figures, total production figures were available, making it easy to calculate the remaining variable.However, “All” was also suppressed in the update mentioned above, making it difficult to approximate the missingvalues. As a result, we had to estimate the remaining figures by using a previously used method. Although thismethod is relatively rudimentary due to the lack of available data, we feel this approximation is a decent “bestestimate” given the limitations.
Based on overall landings, our estimates suggest that Pacific Whiting Surimi (PWS)production in Q2 declined by about 44 percent compared to the same period last year.Such decrease is consistent with what we have seen on import prices by declaringcountries, which remain oscillating near record-highs. However, the decline in volumeregistered could also be attributed to a delayed start of the season caused by thepandemic. This situation also occurred last year, where landings and our surimiestimates suggested quite an increase in Q3 production.
© Urner Barry 2021 All Rights Reserved. This publication is protected by US copyright law, please do not copy. Urner Barry Consulting Surimi Paste, Supply Track | A publication of Urner Barry Consulting | 732-240-2349 | P.O. Box 389, Toms River, NJ 08754
Figure 16. PW Surimi Production Estimate. NOAA, Northwest Fisheries Science Center, Urner BarryConsulting. *Q2 2021 through May only.
4.8 9.7 8.8 8.7 11.3 15.6 11.317.4 21.7 18.8 18.3 17.0
4.91.8
5.6 8.2 6.68.4
11.2
5.4
11.110.6 11.8
7.7 5.1
4.11.3
1.0 2.5 4.74.0
8.1
4.8
5.76.5 6.3 8.3
14.9
5.6
2009 2010 2011 2012 2013 2014 2015 2016 2017 2018 2019 *2020 *2021
Pacific Whiting Surimi Production
Catcher-Processor
Mothership
Shorebased
UB Estimated Production, Pacific Whiting Surimi **YTD (Q1 to Q2)
2017 2018 '18 vs. '17 2019 '19 vs. '18 2020 '20 vs. '19 2021 '21 vs. '20
Q1 Q2 14,504 19,021 + 31.1% 25,717 + 35.2% 19,191 -25.4% 10,763 -43.9%Q3 11,134 5,177 -53.5% 1,068 -79.4% 10,541 + 886.5% 3,824 -63.7%Q4 13,851 13,429 -3.1% 7,527 -43.9% 7,341 -2.5%
Total (UB Est.) 39,489 37,626 -4.7% 34,312 -8.8% 37,073 + 8.0%*Official thru '18 38,784 37,010 -4.6% 34,312 -7.3% 37,073 + 8.0% 14,587
**YTD 14,504 19,021 + 31.1% 25,717 + 35.2% 19,191 -25.4% 10,763 -43.9%
-
2
4
6
8
10
12
Q1 Q2 Q3 Q4
Thou
sand
MT
Pacific Whiting Surimi Imports 2018 2019
2020 2021All Countries
$2,000$2,200$2,400$2,600$2,800$3,000$3,200$3,400$3,600$3,800
Q1
2017
Q2
2017
Q3
2017
Q4
2017
Q1
2018
Q2
2018
Q3
2018
Q4
2018
Q1
2019
Q2
2019
Q3
2019
Q4
2019
Q1
2020
Q2
2020
Q3
2020
Q4
2020
Q1
2021
Q2
2021
USD
$/M
T
Declaring Countries, Imports SpainLithuaniaJapanPacific Whiting Surimi
8
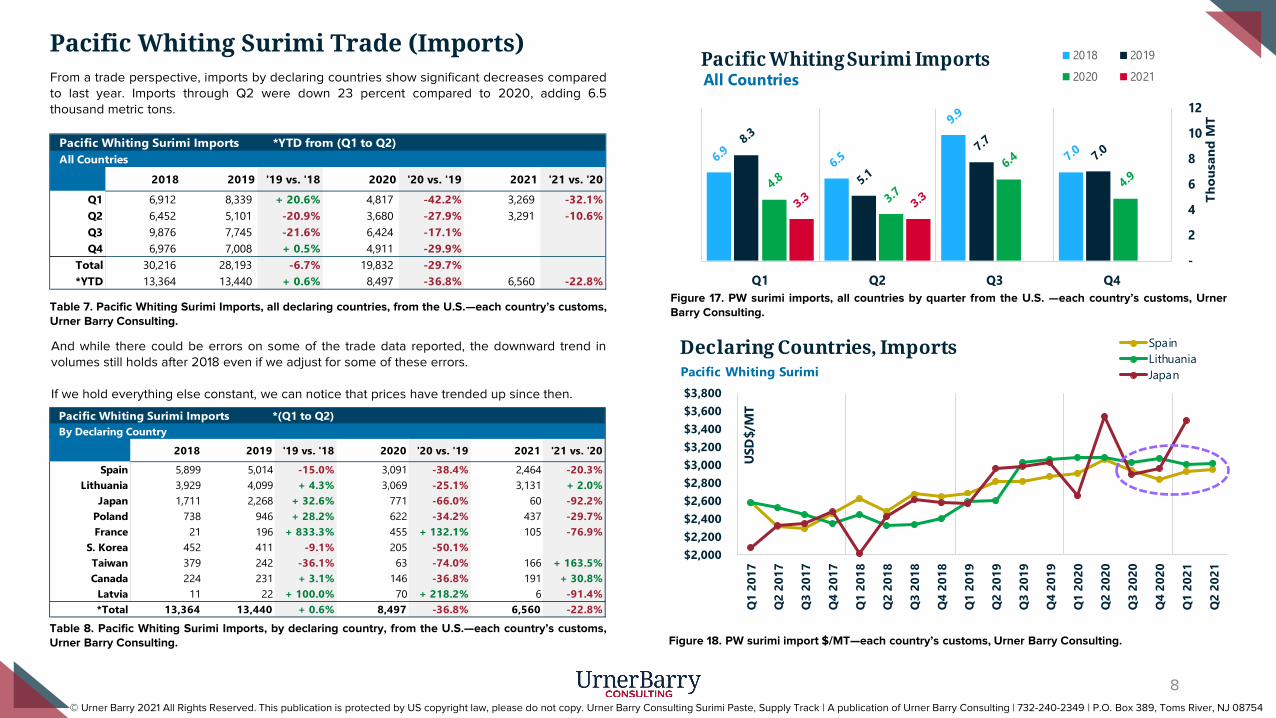
Pacific Whiting Surimi Trade (Imports)From a trade perspective, imports by declaring countries show significant decreases comparedto last year. Imports through Q2 were down 23 percent compared to 2020, adding 6.5thousand metric tons.
Table 7. Pacific Whiting Surimi Imports, all declaring countries, from the U.S.—each country’s customs,Urner Barry Consulting.
Table 8. Pacific Whiting Surimi Imports, by declaring country, from the U.S.—each country’s customs,Urner Barry Consulting.
And while there could be errors on some of the trade data reported, the downward trend involumes still holds after 2018 even if we adjust for some of these errors.
If we hold everything else constant, we can notice that prices have trended up since then.
Figure 17. PW surimi imports, all countries by quarter from the U.S. —each country’s customs, UrnerBarry Consulting.
Figure 18. PW surimi import $/MT—each country’s customs, Urner Barry Consulting.
Pacific Whiting Surimi Imports *YTD from (Q1 to Q2)All Countries
2018 2019 '19 vs. '18 2020 '20 vs. '19 2021 '21 vs. '20
Q1 6,912 8,339 + 20.6% 4,817 -42.2% 3,269 -32.1%Q2 6,452 5,101 -20.9% 3,680 -27.9% 3,291 -10.6%Q3 9,876 7,745 -21.6% 6,424 -17.1% Q4 6,976 7,008 + 0.5% 4,911 -29.9%
Total 30,216 28,193 -6.7% 19,832 -29.7%*YTD 13,364 13,440 + 0.6% 8,497 -36.8% 6,560 -22.8%
Pacific Whiting Surimi Imports *(Q1 to Q2)By Declaring Country
2018 2019 '19 vs. '18 2020 '20 vs. '19 2021 '21 vs. '20
Spain 5,899 5,014 -15.0% 3,091 -38.4% 2,464 -20.3%Lithuania 3,929 4,099 + 4.3% 3,069 -25.1% 3,131 + 2.0%
Japan 1,711 2,268 + 32.6% 771 -66.0% 60 -92.2%Poland 738 946 + 28.2% 622 -34.2% 437 -29.7%France 21 196 + 833.3% 455 + 132.1% 105 -76.9%
S. Korea 452 411 -9.1% 205 -50.1% Taiwan 379 242 -36.1% 63 -74.0% 166 + 163.5%Canada 224 231 + 3.1% 146 -36.8% 191 + 30.8%
Latvia 11 22 + 100.0% 70 + 218.2% 6 -91.4%*Total 13,364 13,440 + 0.6% 8,497 -36.8% 6,560 -22.8%
© Urner Barry 2021 All Rights Reserved. This publication is protected by US copyright law, please do not copy. Urner Barry Consulting Surimi Paste, Supply Track | A publication of Urner Barry Consulting | 732-240-2349 | P.O. Box 389, Toms River, NJ 08754
0.0
1.0
2.0
3.0
4.0
5.0
2018 2019 2020 2021
Thou
sand
MT
Pacific Whiting Surimi Exports Q1 Q2
Q3 Q4All Countries
9
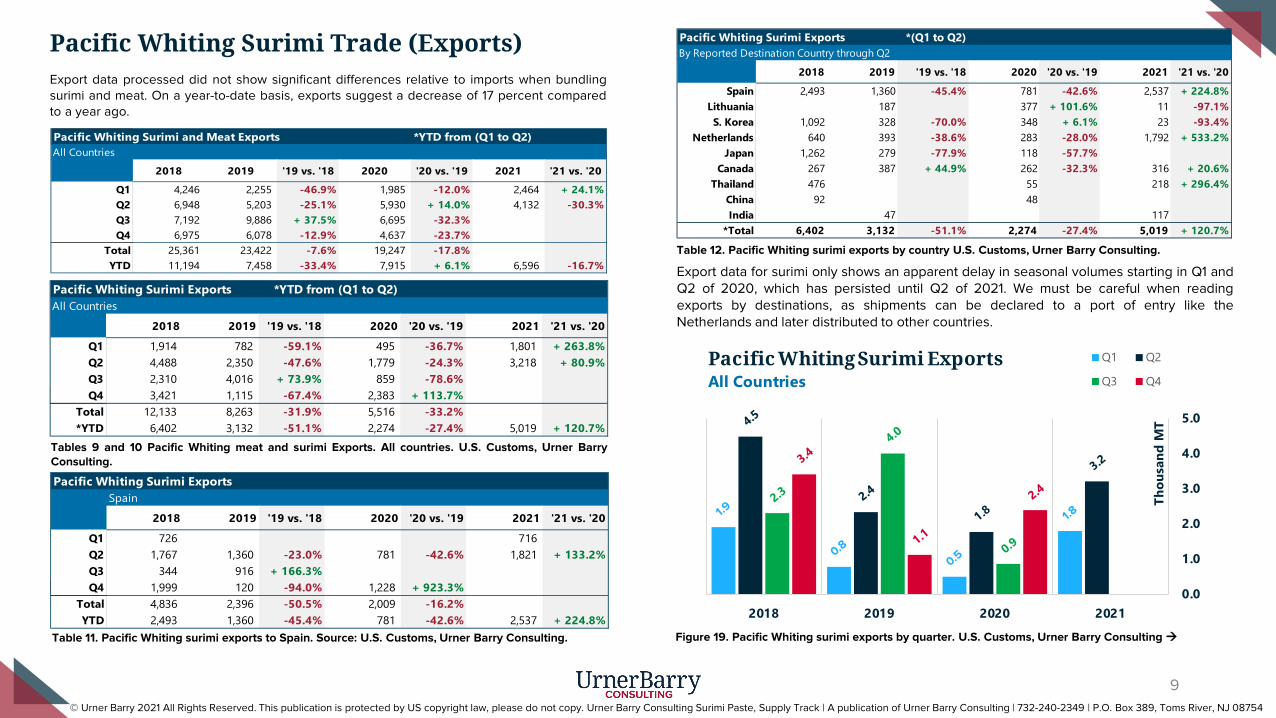
Pacific Whiting Surimi Trade (Exports)Export data processed did not show significant differences relative to imports when bundlingsurimi and meat. On a year-to-date basis, exports suggest a decrease of 17 percent comparedto a year ago.
Table 11. Pacific Whiting surimi exports to Spain. Source: U.S. Customs, Urner Barry Consulting.
Tables 9 and 10 Pacific Whiting meat and surimi Exports. All countries. U.S. Customs, Urner BarryConsulting.
Pacific Whiting Surimi and Meat Exports *YTD from (Q1 to Q2)All Countries
2018 2019 '19 vs. '18 2020 '20 vs. '19 2021 '21 vs. '20
Q1 4,246 2,255 -46.9% 1,985 -12.0% 2,464 + 24.1%Q2 6,948 5,203 -25.1% 5,930 + 14.0% 4,132 -30.3%Q3 7,192 9,886 + 37.5% 6,695 -32.3% Q4 6,975 6,078 -12.9% 4,637 -23.7%
Total 25,361 23,422 -7.6% 19,247 -17.8%YTD 11,194 7,458 -33.4% 7,915 + 6.1% 6,596 -16.7%
Pacific Whiting Surimi Exports *YTD from (Q1 to Q2)All Countries
2018 2019 '19 vs. '18 2020 '20 vs. '19 2021 '21 vs. '20
Q1 1,914 782 -59.1% 495 -36.7% 1,801 + 263.8%Q2 4,488 2,350 -47.6% 1,779 -24.3% 3,218 + 80.9%Q3 2,310 4,016 + 73.9% 859 -78.6% Q4 3,421 1,115 -67.4% 2,383 + 113.7%
Total 12,133 8,263 -31.9% 5,516 -33.2%*YTD 6,402 3,132 -51.1% 2,274 -27.4% 5,019 + 120.7%
Pacific Whiting Surimi Exports *(Q1 to Q2)By Reported Destination Country through Q2
2018 2019 '19 vs. '18 2020 '20 vs. '19 2021 '21 vs. '20
Spain 2,493 1,360 -45.4% 781 -42.6% 2,537 + 224.8%Lithuania 187 377 + 101.6% 11 -97.1%S. Korea 1,092 328 -70.0% 348 + 6.1% 23 -93.4%
Netherlands 640 393 -38.6% 283 -28.0% 1,792 + 533.2%Japan 1,262 279 -77.9% 118 -57.7%
Canada 267 387 + 44.9% 262 -32.3% 316 + 20.6%Thailand 476 55 218 + 296.4%
China 92 48 India 47 117
*Total 6,402 3,132 -51.1% 2,274 -27.4% 5,019 + 120.7%
Pacific Whiting Surimi ExportsSpain
2018 2019 '19 vs. '18 2020 '20 vs. '19 2021 '21 vs. '20
Q1 726 716 Q2 1,767 1,360 -23.0% 781 -42.6% 1,821 + 133.2%Q3 344 916 + 166.3% Q4 1,999 120 -94.0% 1,228 + 923.3%
Total 4,836 2,396 -50.5% 2,009 -16.2%YTD 2,493 1,360 -45.4% 781 -42.6% 2,537 + 224.8%
Table 12. Pacific Whiting surimi exports by country U.S. Customs, Urner Barry Consulting.
Figure 19. Pacific Whiting surimi exports by quarter. U.S. Customs, Urner Barry Consulting
© Urner Barry 2021 All Rights Reserved. This publication is protected by US copyright law, please do not copy. Urner Barry Consulting Surimi Paste, Supply Track | A publication of Urner Barry Consulting | 732-240-2349 | P.O. Box 389, Toms River, NJ 08754
Export data for surimi only shows an apparent delay in seasonal volumes starting in Q1 andQ2 of 2020, which has persisted until Q2 of 2021. We must be careful when readingexports by destinations, as shipments can be declared to a port of entry like theNetherlands and later distributed to other countries.
874
740
418
230
767
696
463
827
952
1,00
482
345
683
786
569
052
563
569
5
208
9845
969
898
813
97
107
564
388
239
392
366
487
-
400
800
1,200
1,600
2,000
2,400
Q1
2017
Q2
2017
Q3
2017
Q4
2017
Q1
2018
Q2
2018
Q3
2018
Q4
2018
Q1
2019
Q2
2019
Q3
2019
Q4
2019
Q1
2020
Q2
2020
Q3
2020
Q4
2020
Q1
2021
Q2
2021
Q3
2021
Q4
2021
Q1
2022
Q2
2022
Q3
2022
Q4
2022
Met
ric T
ons
Southern Blue Whiting Surimi Argentina Chile New ZealandTotal
10
Southern Blue Whiting & Hoki Surimi Production
Disclaimer: Southern blue whiting (SBW) and Hoki surimi production were assumed as a function of trade. Therewas consensus in which domestic markets for the three leading producers—Argentina, Chile, and New Zealand—were too small to be significant. As such, we utilized the following methodology:
• Use recipient countries’ volumes of surimi from Argentina and assume a 60/40 percent split between Hoki andSBW surimi, respectively
• Use Chilean exports as declared, which are divided by species.• Use New Zealand exports as declared, which are also divided by species.
Table 13. Southern Blue Whiting surimi estimated production.
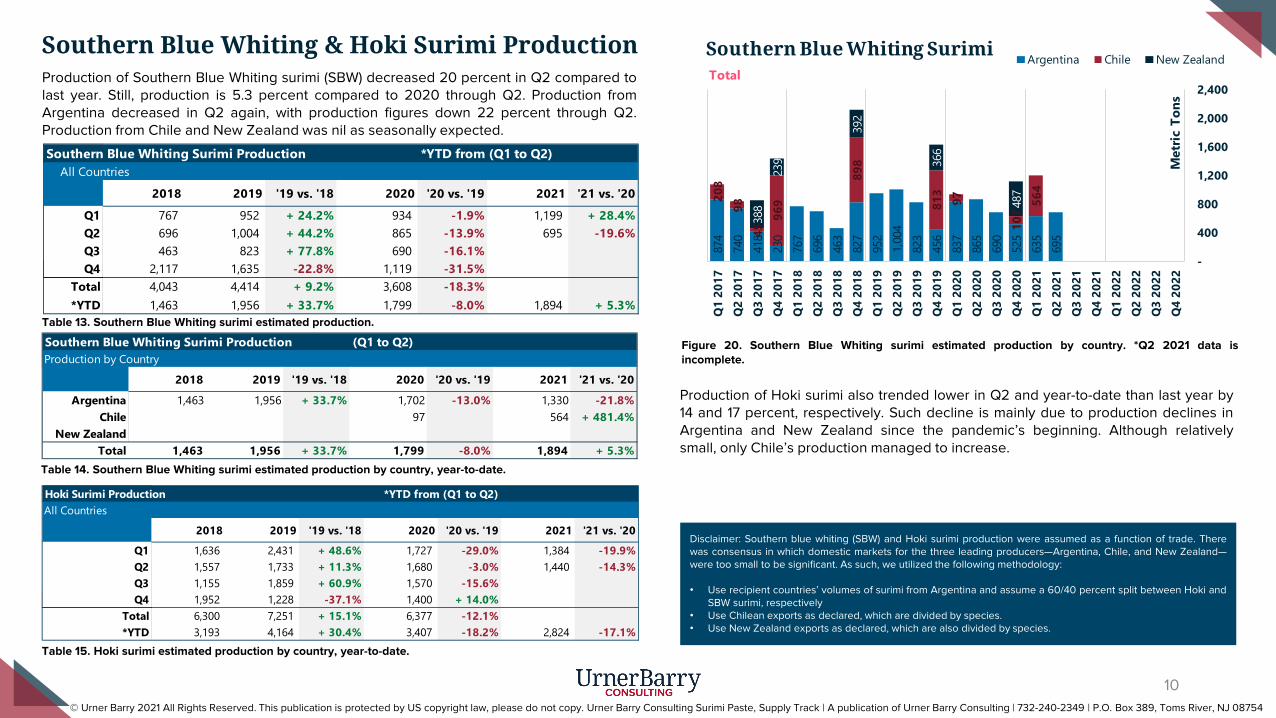
Production of Southern Blue Whiting surimi (SBW) decreased 20 percent in Q2 compared tolast year. Still, production is 5.3 percent compared to 2020 through Q2. Production fromArgentina decreased in Q2 again, with production figures down 22 percent through Q2.Production from Chile and New Zealand was nil as seasonally expected.
Table 14. Southern Blue Whiting surimi estimated production by country, year-to-date.
Production of Hoki surimi also trended lower in Q2 and year-to-date than last year by14 and 17 percent, respectively. Such decline is mainly due to production declines inArgentina and New Zealand since the pandemic’s beginning. Although relativelysmall, only Chile’s production managed to increase.
Figure 20. Southern Blue Whiting surimi estimated production by country. *Q2 2021 data isincomplete.
Table 15. Hoki surimi estimated production by country, year-to-date.
Southern Blue Whiting Surimi Production *YTD from (Q1 to Q2)All Countries
2018 2019 '19 vs. '18 2020 '20 vs. '19 2021 '21 vs. '20
Q1 767 952 + 24.2% 934 -1.9% 1,199 + 28.4%Q2 696 1,004 + 44.2% 865 -13.9% 695 -19.6%Q3 463 823 + 77.8% 690 -16.1% Q4 2,117 1,635 -22.8% 1,119 -31.5%
Total 4,043 4,414 + 9.2% 3,608 -18.3%*YTD 1,463 1,956 + 33.7% 1,799 -8.0% 1,894 + 5.3%
Southern Blue Whiting Surimi Production (Q1 to Q2)Production by Country
2018 2019 '19 vs. '18 2020 '20 vs. '19 2021 '21 vs. '20
Argentina 1,463 1,956 + 33.7% 1,702 -13.0% 1,330 -21.8%Chile 97 564 + 481.4%
New Zealand Total 1,463 1,956 + 33.7% 1,799 -8.0% 1,894 + 5.3%
© Urner Barry 2021 All Rights Reserved. This publication is protected by US copyright law, please do not copy. Urner Barry Consulting Surimi Paste, Supply Track | A publication of Urner Barry Consulting | 732-240-2349 | P.O. Box 389, Toms River, NJ 08754
Hoki Surimi Production *YTD from (Q1 to Q2)All Countries
2018 2019 '19 vs. '18 2020 '20 vs. '19 2021 '21 vs. '20
Q1 1,636 2,431 + 48.6% 1,727 -29.0% 1,384 -19.9%Q2 1,557 1,733 + 11.3% 1,680 -3.0% 1,440 -14.3%Q3 1,155 1,859 + 60.9% 1,570 -15.6% Q4 1,952 1,228 -37.1% 1,400 + 14.0%
Total 6,300 7,251 + 15.1% 6,377 -12.1%*YTD 3,193 4,164 + 30.4% 3,407 -18.2% 2,824 -17.1%

1,84
9
1,63
5
709
503
1,70
1
1,27
7
941
1,89
9
1,95
6
2,28
9
1,74
9
1,09
6
1,75
6
1,94
9
1,31
1
1,14
9
1,35
9
1,58
4
120
24
336
72
216
464
192
168 40
4 168
304
24
312 18
4
395
140 15
6 124
192
192
-
400
800
1,200
1,600
2,000
2,400
2,800
Jan-
17
Apr-
17
Jul-1
7
Oct
-17
Jan-
18
Apr-
18
Jul-1
8
Oct
-18
Jan-
19
Apr-
19
Jul-1
9
Oct
-19
Jan-
20
Apr-
20
Jul-2
0
Oct
-20
Jan-
21
Apr-
21
Jul-2
1
Oct
-21
Met
ric T
ons
Countries importing from Argentina All Surimi Japan Russian Federation Spain Belarus South Africa
Total
11
Figure 21. Hoki surimi production estimates. Each country’s customs, Urner Barry Consulting. *Q22021 data is incomplete.
From a linear perspective, the overall trend of Hoki surimi production is flat to slightly downward.
Table 16 . Hoki surimi estimated production by country. Each country’s customs, Urner Barry Consulting.
Southern Blue Whiting and Hoki Surimi Production SBW and Hoki Surimi Trade (Imports)In terms of trade, imports by declaring country show significant declines fromArgentina’s main markets, Japan and Russia. Overall, imports from this country aredown 22 percent compared to last year and 32 compared to 2019.
Figure 21. SBW and Hoki Surimi imports from Argentina. *Q2 2021 data is incomplete.
Table 17. Surimi imports from Argentina by country.
Surimi Imports from Argentina *(Q1 to Q2)Countries Importing from: Argentina
2018 2019 '19 vs. '18 2020 '20 vs. '19 2021 '21 vs. '20
Japan 2,978 4,245 + 42.5% 3,705 -12.7% 2,943 -20.6%Russian Federation 680 572 -15.9% 496 -13.3% 280 -43.5%
Spain Belarus 48 53 + 10.4% 77 + 45.3%
South Africa 25 25*Total 3,658 4,890 + 33.7% 4,254 -13.0% 3,325 -21.8%
Hoki Surimi Production (Q1 to Q2)Production by Country
2018 2019 '19 vs. '18 2020 '20 vs. '19 2021 '21 vs. '20
Argentina 2,195 2,934 + 33.7% 2,552 -13.0% 1,995 -21.8%Chile 100 74 -26.0% 9 -87.8% 63 + 600.0%
New Zealand 898 1,156 + 28.7% 846 -26.8% 766 -9.5%Total 3,193 4,164 + 30.4% 3,407 -18.2% 2,824 -17.1%
© Urner Barry 2021 All Rights Reserved. This publication is protected by US copyright law, please do not copy. Urner Barry Consulting Surimi Paste, Supply Track | A publication of Urner Barry Consulting | 732-240-2349 | P.O. Box 389, Toms River, NJ 08754
1,31
11,
111
627
345
1,15
01,
045
694
1,24
01,
428
1,50
61,
234
684
1,25
51,
297
1,03
578
895
21,
043
2116
995
551
943
246
642
770
0 1,00
215
461
452
746
338
350
651
3 408 358
188
279
3658
228
54 4634
121
7311
179
2999 24 39
-
400
800
1,200
1,600
2,000
2,400
2,800
Q1
2017
Q2
2017
Q3
2017
Q4
2017
Q1
2018
Q2
2018
Q3
2018
Q4
2018
Q1
2019
Q2
2019
Q3
2019
Q4
2019
Q1
2020
Q2
2020
Q3
2020
Q4
2020
Q1
2021
Q2
2021
Q3
2021
Q4
2021
Q1
2022
Q2
2022
Q3
2022
Q4
2022
Met
ric T
ons
Hoki SurimiArgentina New Zealand Chile
Total
53
175
113
693
139
101
90
91
105
184
71
420
104
60
54
535
80
104
20
20
20
-
100
200
300
400
500
600
700
800
Jan-
17Ap
r-17
Jul-1
7O
ct-1
7Ja
n-18
Apr-
18Ju
l-18
Oct
-18
Jan-
19Ap
r-19
Jul-1
9O
ct-1
9Ja
n-20
Apr-
20Ju
l-20
Oct
-20
Jan-
21Ap
r-21
Jul-2
1O
ct-2
1Ja
n-22
Apr-
22Ju
l-22
Oct
-22
Met
ric T
ons
Countries importing from New Zealand All Surimi Japan South AfricaTotal
1,56
7 50
8 47
2 1,
318
585
539
524
1,50
1 56
6 51
6 47
7 1,
287
500
408
488
644
1,08
4 41
3
21
5 40
45
43
65
10
21
22
7 65
-
200
400
600
800
1,000
1,200
1,400
1,600
1,800
Jan-
17Ap
r-17
Jul-1
7O
ct-1
7Ja
n-18
Apr-
18Ju
l-18
Oct
-18
Jan-
19Ap
r-19
Jul-1
9O
ct-1
9Ja
n-20
Apr-
20Ju
l-20
Oct
-20
Jan-
21Ap
r-21
Jul-2
1O
ct-2
1Ja
n-22
Apr-
22Ju
l-22
Oct
-22
Met
ric T
ons
Countries importing from Chile All Surimi
Japan Russian FederationTotal
12
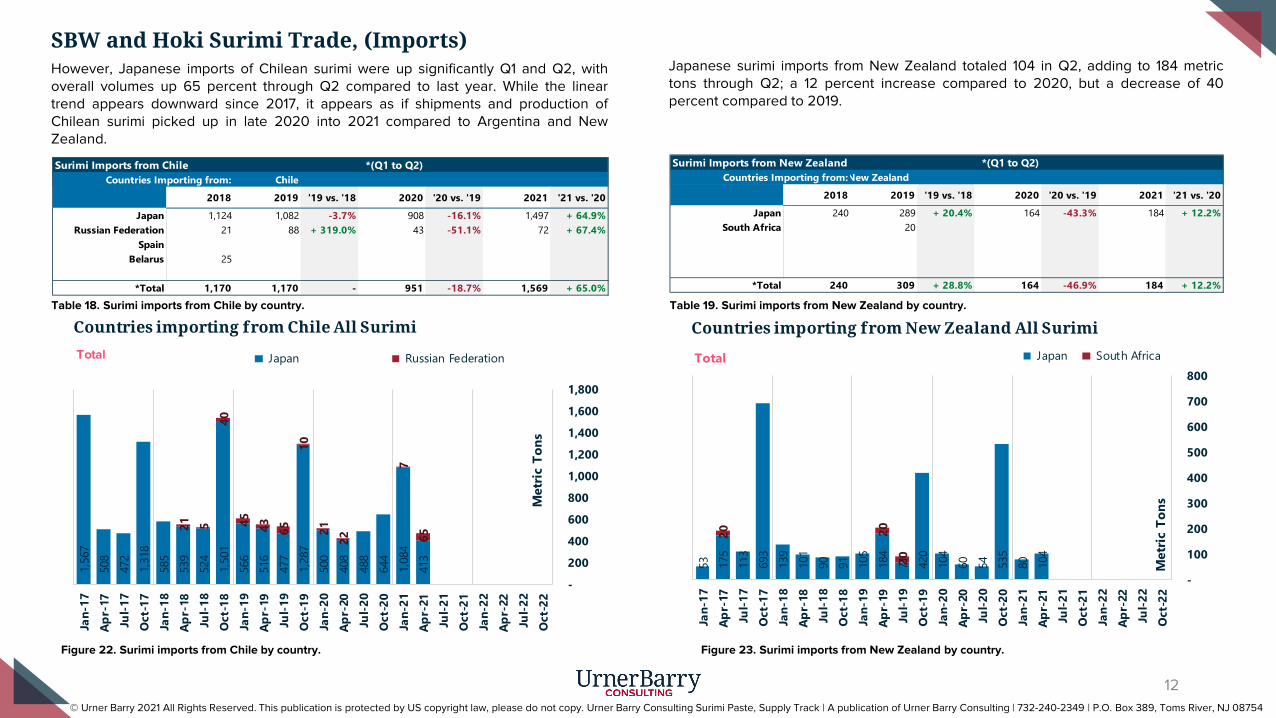
However, Japanese imports of Chilean surimi were up significantly Q1 and Q2, withoverall volumes up 65 percent through Q2 compared to last year. While the lineartrend appears downward since 2017, it appears as if shipments and production ofChilean surimi picked up in late 2020 into 2021 compared to Argentina and NewZealand.
Table 18. Surimi imports from Chile by country.
Figure 22. Surimi imports from Chile by country. Figure 23. Surimi imports from New Zealand by country.
Table 19. Surimi imports from New Zealand by country.
SBW and Hoki Surimi Trade, (Imports)
Surimi Imports from Chile *(Q1 to Q2)Countries Importing from: Chile
2018 2019 '19 vs. '18 2020 '20 vs. '19 2021 '21 vs. '20
Japan 1,124 1,082 -3.7% 908 -16.1% 1,497 + 64.9%Russian Federation 21 88 + 319.0% 43 -51.1% 72 + 67.4%
Spain Belarus 25
*Total 1,170 1,170 - 951 -18.7% 1,569 + 65.0%
Surimi Imports from New Zealand *(Q1 to Q2)Countries Importing from:New Zealand
2018 2019 '19 vs. '18 2020 '20 vs. '19 2021 '21 vs. '20
Japan 240 289 + 20.4% 164 -43.3% 184 + 12.2%South Africa 20
*Total 240 309 + 28.8% 164 -46.9% 184 + 12.2%
Japanese surimi imports from New Zealand totaled 104 in Q2, adding to 184 metrictons through Q2; a 12 percent increase compared to 2020, but a decrease of 40percent compared to 2019.
© Urner Barry 2021 All Rights Reserved. This publication is protected by US copyright law, please do not copy. Urner Barry Consulting Surimi Paste, Supply Track | A publication of Urner Barry Consulting | 732-240-2349 | P.O. Box 389, Toms River, NJ 08754
13
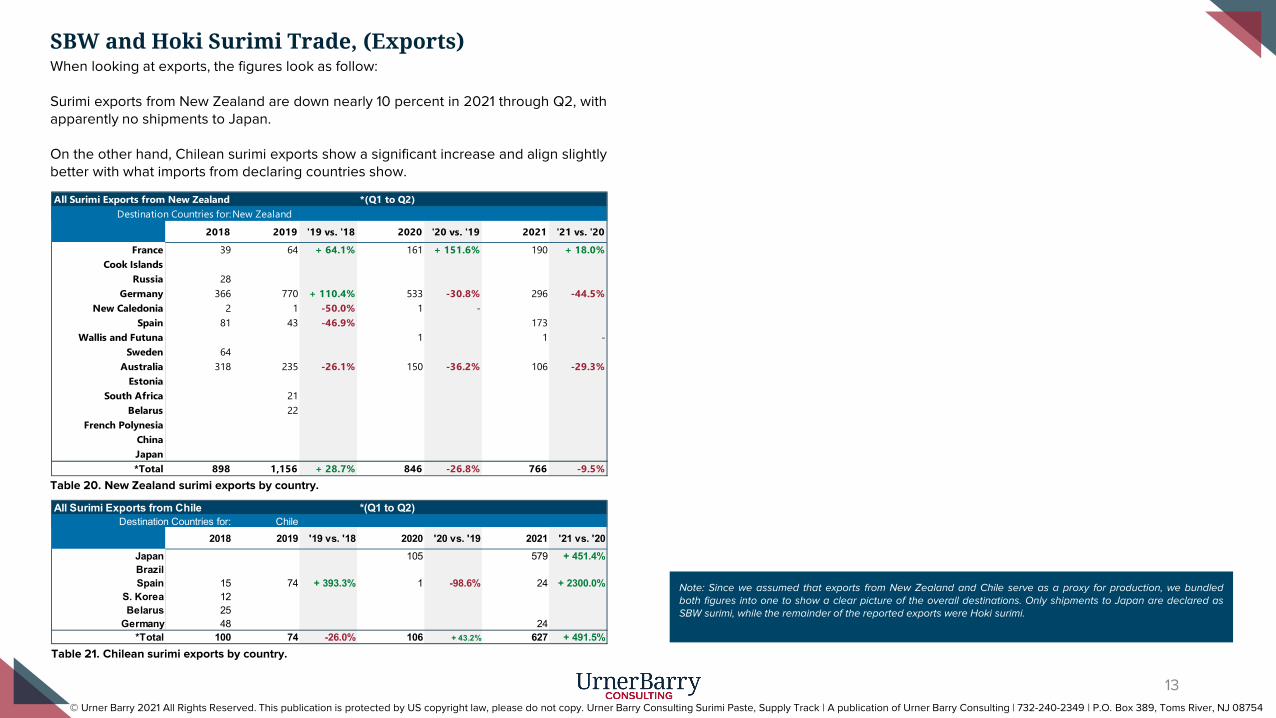
When looking at exports, the figures look as follow:
Surimi exports from New Zealand are down nearly 10 percent in 2021 through Q2, withapparently no shipments to Japan.
On the other hand, Chilean surimi exports show a significant increase and align slightlybetter with what imports from declaring countries show.
Table 20. New Zealand surimi exports by country.
Table 21. Chilean surimi exports by country.
SBW and Hoki Surimi Trade, (Exports)
All Surimi Exports from New Zealand *(Q1 to Q2)Destination Countries for:New Zealand
2018 2019 '19 vs. '18 2020 '20 vs. '19 2021 '21 vs. '20
France 39 64 + 64.1% 161 + 151.6% 190 + 18.0%Cook Islands
Russia 28 Germany 366 770 + 110.4% 533 -30.8% 296 -44.5%
New Caledonia 2 1 -50.0% 1 - Spain 81 43 -46.9% 173
Wallis and Futuna 1 1 -Sweden 64
Australia 318 235 -26.1% 150 -36.2% 106 -29.3%Estonia
South Africa 21 Belarus 22
French Polynesia China Japan *Total 898 1,156 + 28.7% 846 -26.8% 766 -9.5%
© Urner Barry 2021 All Rights Reserved. This publication is protected by US copyright law, please do not copy. Urner Barry Consulting Surimi Paste, Supply Track | A publication of Urner Barry Consulting | 732-240-2349 | P.O. Box 389, Toms River, NJ 08754
All Surimi Exports from Chile *(Q1 to Q2)Destination Countries for: Chile
2018 2019 '19 vs. '18 2020 '20 vs. '19 2021 '21 vs. '20Japan 105 579 + 451.4%Brazil Spain 15 74 + 393.3% 1 -98.6% 24 + 2300.0%
S. Korea 12 Belarus 25
Germany 48 24*Total 100 74 -26.0% 106 + 43.2% 627 + 491.5%
Note: Since we assumed that exports from New Zealand and Chile serve as a proxy for production, we bundledboth figures into one to show a clear picture of the overall destinations. Only shipments to Japan are declared asSBW surimi, while the remainder of the reported exports were Hoki surimi.
- 5
10 15 20 25 30 35 40
2010 2011 2012 2013 2014 2015 2016 2018 2019 2020 2021
Thou
sand
MT
Thailand's estimated Production by Species (Imports and Exports) thru Q2
Itoyori Eso BigeyeGoatfish Croaker RibbonSea Bream Other
14
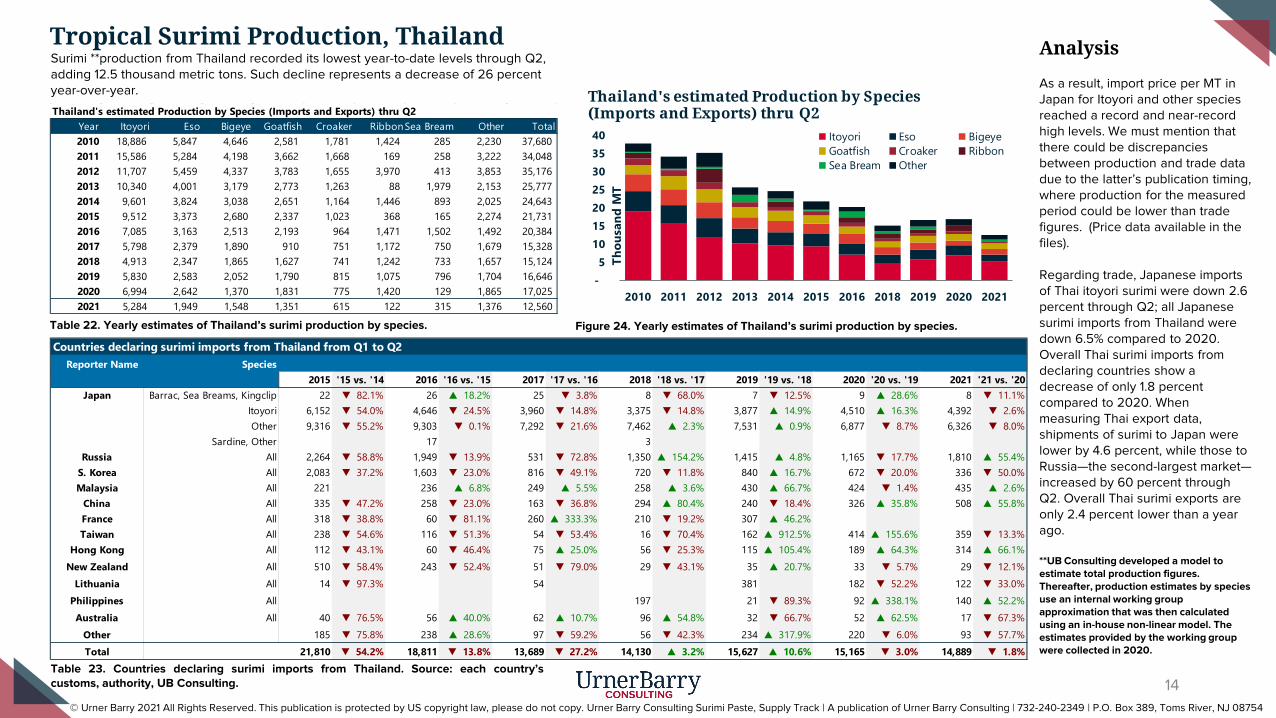
Tropical Surimi Production, ThailandSurimi **production from Thailand recorded its lowest year-to-date levels through Q2, adding 12.5 thousand metric tons. Such decline represents a decrease of 26 percent year-over-year.
Table 22. Yearly estimates of Thailand’s surimi production by species.
Analysis
As a result, import price per MT in Japan for Itoyori and other species reached a record and near-record high levels. We must mention that there could be discrepancies between production and trade data due to the latter’s publication timing, where production for the measured period could be lower than trade figures. (Price data available in the files).
Regarding trade, Japanese imports of Thai itoyori surimi were down 2.6 percent through Q2; all Japanese surimi imports from Thailand were down 6.5% compared to 2020. Overall Thai surimi imports from declaring countries show a decrease of only 1.8 percent compared to 2020. When measuring Thai export data, shipments of surimi to Japan were lower by 4.6 percent, while those to Russia—the second-largest market—increased by 60 percent through Q2. Overall Thai surimi exports are only 2.4 percent lower than a year ago.
Table 23. Countries declaring surimi imports from Thailand. Source: each country’scustoms, authority, UB Consulting.
Figure 24. Yearly estimates of Thailand’s surimi production by species.
**UB Consulting developed a model to estimate total production figures. Thereafter, production estimates by species use an internal working group approximation that was then calculated using an in-house non-linear model. The estimates provided by the working group were collected in 2020.
© Urner Barry 2021 All Rights Reserved. This publication is protected by US copyright law, please do not copy. Urner Barry Consulting Surimi Paste, Supply Track | A publication of Urner Barry Consulting | 732-240-2349 | P.O. Box 389, Toms River, NJ 08754
Thailand's estimated Production by Species (Imports and Exports) thru Q2Year Itoyori Eso Bigeye Goatfish Croaker RibbonSea Bream Other Total2010 18,886 5,847 4,646 2,581 1,781 1,424 285 2,230 37,680 2011 15,586 5,284 4,198 3,662 1,668 169 258 3,222 34,048 2012 11,707 5,459 4,337 3,783 1,655 3,970 413 3,853 35,176 2013 10,340 4,001 3,179 2,773 1,263 88 1,979 2,153 25,777 2014 9,601 3,824 3,038 2,651 1,164 1,446 893 2,025 24,643 2015 9,512 3,373 2,680 2,337 1,023 368 165 2,274 21,731 2016 7,085 3,163 2,513 2,193 964 1,471 1,502 1,492 20,384 2017 5,798 2,379 1,890 910 751 1,172 750 1,679 15,328 2018 4,913 2,347 1,865 1,627 741 1,242 733 1,657 15,124 2019 5,830 2,583 2,052 1,790 815 1,075 796 1,704 16,646 2020 6,994 2,642 1,370 1,831 775 1,420 129 1,865 17,025 2021 5,284 1,949 1,548 1,351 615 122 315 1,376 12,560
Countries declaring surimi imports from Thailand from Q1 to Q2Reporter Name Species
2015 '15 vs. '14 2016 '16 vs. '15 2017 '17 vs. '16 2018 '18 vs. '17 2019 '19 vs. '18 2020 '20 vs. '19 2021 '21 vs. '20Barrac, Sea Breams, Kingclip 22 ▼ 82.1% 26 ▲ 18.2% 25 ▼ 3.8% 8 ▼ 68.0% 7 ▼ 12.5% 9 ▲ 28.6% 8 ▼ 11.1%
Itoyori 6,152 ▼ 54.0% 4,646 ▼ 24.5% 3,960 ▼ 14.8% 3,375 ▼ 14.8% 3,877 ▲ 14.9% 4,510 ▲ 16.3% 4,392 ▼ 2.6%Other 9,316 ▼ 55.2% 9,303 ▼ 0.1% 7,292 ▼ 21.6% 7,462 ▲ 2.3% 7,531 ▲ 0.9% 6,877 ▼ 8.7% 6,326 ▼ 8.0%
Sardine, Other 17 3All 2,264 ▼ 58.8% 1,949 ▼ 13.9% 531 ▼ 72.8% 1,350 ▲ 154.2% 1,415 ▲ 4.8% 1,165 ▼ 17.7% 1,810 ▲ 55.4%All 2,083 ▼ 37.2% 1,603 ▼ 23.0% 816 ▼ 49.1% 720 ▼ 11.8% 840 ▲ 16.7% 672 ▼ 20.0% 336 ▼ 50.0%All 221 236 ▲ 6.8% 249 ▲ 5.5% 258 ▲ 3.6% 430 ▲ 66.7% 424 ▼ 1.4% 435 ▲ 2.6%All 335 ▼ 47.2% 258 ▼ 23.0% 163 ▼ 36.8% 294 ▲ 80.4% 240 ▼ 18.4% 326 ▲ 35.8% 508 ▲ 55.8%All 318 ▼ 38.8% 60 ▼ 81.1% 260 ▲ 333.3% 210 ▼ 19.2% 307 ▲ 46.2%All 238 ▼ 54.6% 116 ▼ 51.3% 54 ▼ 53.4% 16 ▼ 70.4% 162 ▲ 912.5% 414 ▲ 155.6% 359 ▼ 13.3%All 112 ▼ 43.1% 60 ▼ 46.4% 75 ▲ 25.0% 56 ▼ 25.3% 115 ▲ 105.4% 189 ▲ 64.3% 314 ▲ 66.1%All 510 ▼ 58.4% 243 ▼ 52.4% 51 ▼ 79.0% 29 ▼ 43.1% 35 ▲ 20.7% 33 ▼ 5.7% 29 ▼ 12.1%All 14 ▼ 97.3% 54 381 182 ▼ 52.2% 122 ▼ 33.0%All 197 21 ▼ 89.3% 92 ▲ 338.1% 140 ▲ 52.2%All 40 ▼ 76.5% 56 ▲ 40.0% 62 ▲ 10.7% 96 ▲ 54.8% 32 ▼ 66.7% 52 ▲ 62.5% 17 ▼ 67.3%
185 ▼ 75.8% 238 ▲ 28.6% 97 ▼ 59.2% 56 ▼ 42.3% 234 ▲ 317.9% 220 ▼ 6.0% 93 ▼ 57.7%21,810 ▼ 54.2% 18,811 ▼ 13.8% 13,689 ▼ 27.2% 14,130 ▲ 3.2% 15,627 ▲ 10.6% 15,165 ▼ 3.0% 14,889 ▼ 1.8%
Japan
Russia
New ZealandLithuania
PhilippinesAustralia
OtherTotal
S. KoreaMalaysia
ChinaFranceTaiwan
Hong Kong
15
Analysis
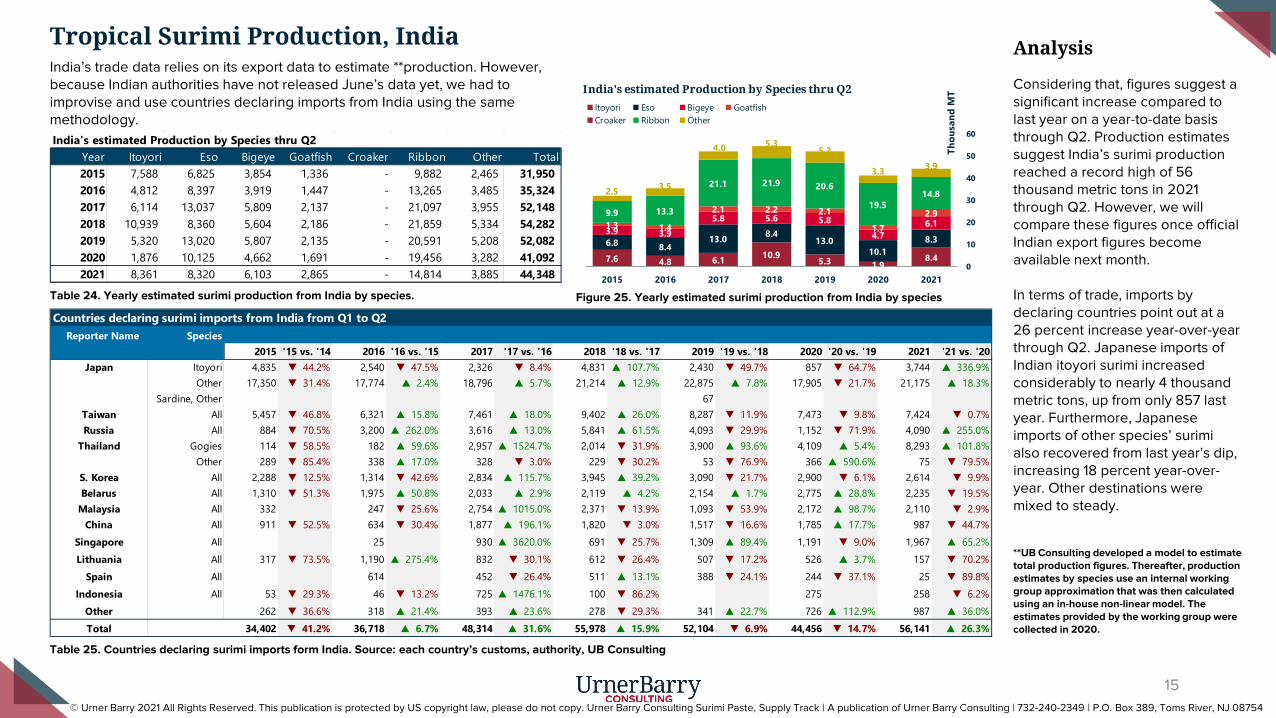
Considering that, figures suggest a significant increase compared to last year on a year-to-date basis through Q2. Production estimates suggest India’s surimi production reached a record high of 56 thousand metric tons in 2021 through Q2. However, we will compare these figures once official Indian export figures become available next month.
In terms of trade, imports by declaring countries point out at a 26 percent increase year-over-year through Q2. Japanese imports of Indian itoyori surimi increased considerably to nearly 4 thousand metric tons, up from only 857 last year. Furthermore, Japanese imports of other species’ surimi also recovered from last year’s dip, increasing 18 percent year-over-year. Other destinations were mixed to steady.
Figure 25. Yearly estimated surimi production from India by speciesTable 24. Yearly estimated surimi production from India by species.
Table 25. Countries declaring surimi imports form India. Source: each country’s customs, authority, UB Consulting
India’s trade data relies on its export data to estimate **production. However, because Indian authorities have not released June’s data yet, we had to improvise and use countries declaring imports from India using the same methodology.
**UB Consulting developed a model to estimate total production figures. Thereafter, production estimates by species use an internal working group approximation that was then calculated using an in-house non-linear model. The estimates provided by the working group were collected in 2020.
© Urner Barry 2021 All Rights Reserved. This publication is protected by US copyright law, please do not copy. Urner Barry Consulting Surimi Paste, Supply Track | A publication of Urner Barry Consulting | 732-240-2349 | P.O. Box 389, Toms River, NJ 08754
Tropical Surimi Production, India
India's estimated Production by Species thru Q2Year Itoyori Eso Bigeye Goatfish Croaker Ribbon Other Total2015 7,588 6,825 3,854 1,336 - 9,882 2,465 31,9502016 4,812 8,397 3,919 1,447 - 13,265 3,485 35,3242017 6,114 13,037 5,809 2,137 - 21,097 3,955 52,1482018 10,939 8,360 5,604 2,186 - 21,859 5,334 54,2822019 5,320 13,020 5,807 2,135 - 20,591 5,208 52,0822020 1,876 10,125 4,662 1,691 - 19,456 3,282 41,0922021 8,361 8,320 6,103 2,865 - 14,814 3,885 44,348
Countries declaring surimi imports from India from Q1 to Q2Reporter Name Species
2015 '15 vs. '14 2016 '16 vs. '15 2017 '17 vs. '16 2018 '18 vs. '17 2019 '19 vs. '18 2020 '20 vs. '19 2021 '21 vs. '20Itoyori 4,835 ▼ 44.2% 2,540 ▼ 47.5% 2,326 ▼ 8.4% 4,831 ▲ 107.7% 2,430 ▼ 49.7% 857 ▼ 64.7% 3,744 ▲ 336.9%Other 17,350 ▼ 31.4% 17,774 ▲ 2.4% 18,796 ▲ 5.7% 21,214 ▲ 12.9% 22,875 ▲ 7.8% 17,905 ▼ 21.7% 21,175 ▲ 18.3%
Sardine, Other 67All 5,457 ▼ 46.8% 6,321 ▲ 15.8% 7,461 ▲ 18.0% 9,402 ▲ 26.0% 8,287 ▼ 11.9% 7,473 ▼ 9.8% 7,424 ▼ 0.7%All 884 ▼ 70.5% 3,200 ▲ 262.0% 3,616 ▲ 13.0% 5,841 ▲ 61.5% 4,093 ▼ 29.9% 1,152 ▼ 71.9% 4,090 ▲ 255.0%
Gogies 114 ▼ 58.5% 182 ▲ 59.6% 2,957 ▲ 1524.7% 2,014 ▼ 31.9% 3,900 ▲ 93.6% 4,109 ▲ 5.4% 8,293 ▲ 101.8%Other 289 ▼ 85.4% 338 ▲ 17.0% 328 ▼ 3.0% 229 ▼ 30.2% 53 ▼ 76.9% 366 ▲ 590.6% 75 ▼ 79.5%
All 2,288 ▼ 12.5% 1,314 ▼ 42.6% 2,834 ▲ 115.7% 3,945 ▲ 39.2% 3,090 ▼ 21.7% 2,900 ▼ 6.1% 2,614 ▼ 9.9%All 1,310 ▼ 51.3% 1,975 ▲ 50.8% 2,033 ▲ 2.9% 2,119 ▲ 4.2% 2,154 ▲ 1.7% 2,775 ▲ 28.8% 2,235 ▼ 19.5%All 332 247 ▼ 25.6% 2,754 ▲ 1015.0% 2,371 ▼ 13.9% 1,093 ▼ 53.9% 2,172 ▲ 98.7% 2,110 ▼ 2.9%All 911 ▼ 52.5% 634 ▼ 30.4% 1,877 ▲ 196.1% 1,820 ▼ 3.0% 1,517 ▼ 16.6% 1,785 ▲ 17.7% 987 ▼ 44.7%All 25 930 ▲ 3620.0% 691 ▼ 25.7% 1,309 ▲ 89.4% 1,191 ▼ 9.0% 1,967 ▲ 65.2%All 317 ▼ 73.5% 1,190 ▲ 275.4% 832 ▼ 30.1% 612 ▼ 26.4% 507 ▼ 17.2% 526 ▲ 3.7% 157 ▼ 70.2%All 614 452 ▼ 26.4% 511 ▲ 13.1% 388 ▼ 24.1% 244 ▼ 37.1% 25 ▼ 89.8%All 53 ▼ 29.3% 46 ▼ 13.2% 725 ▲ 1476.1% 100 ▼ 86.2% 275 258 ▼ 6.2%
262 ▼ 36.6% 318 ▲ 21.4% 393 ▲ 23.6% 278 ▼ 29.3% 341 ▲ 22.7% 726 ▲ 112.9% 987 ▲ 36.0%34,402 ▼ 41.2% 36,718 ▲ 6.7% 48,314 ▲ 31.6% 55,978 ▲ 15.9% 52,104 ▼ 6.9% 44,456 ▼ 14.7% 56,141 ▲ 26.3%
LithuaniaSpain
IndonesiaOtherTotal
S. KoreaBelarus
MalaysiaChina
Singapore
TaiwanRussia
Thailand
Japan
7.6 4.8 6.1 10.9 5.3 1.98.4
6.8 8.413.0 8.4
13.010.1
8.33.9 3.9
5.8 5.6 5.84.7
6.11.3 1.4
2.1 2.2 2.1
1.72.99.9 13.3
21.1 21.9 20.6
19.514.82.5 3.5
4.0 5.35.2
3.3 3.9
0
10
20
30
40
50
60
2015 2016 2017 2018 2019 2020 2021
Thou
sand
MTIndia's estimated Production by Species thru Q2
Itoyori Eso Bigeye GoatfishCroaker Ribbon Other
-
20
40
60
80
100
2015 2016 2017 2018 2019 2020 2021
Thou
sand
MT
Vietnam's Estimated Production by Species thru Q2
Itoyori Eso BigeyeGoatfish Croaker RibbonSeabream Flying Fish Other
16
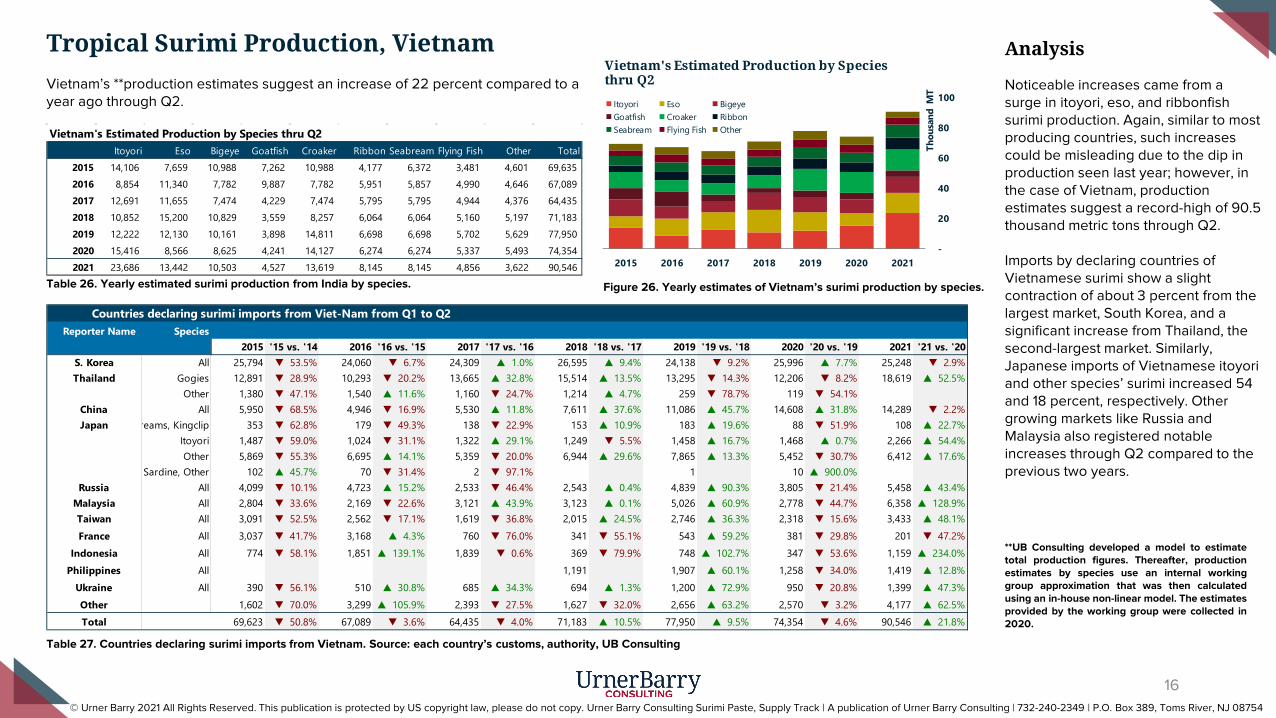
Vietnam’s **production estimates suggest an increase of 22 percent compared to a year ago through Q2.
Figure 26. Yearly estimates of Vietnam’s surimi production by species.Table 26. Yearly estimated surimi production from India by species.
Analysis
Noticeable increases came from a surge in itoyori, eso, and ribbonfish surimi production. Again, similar to most producing countries, such increases could be misleading due to the dip in production seen last year; however, in the case of Vietnam, production estimates suggest a record-high of 90.5 thousand metric tons through Q2.
Imports by declaring countries of Vietnamese surimi show a slight contraction of about 3 percent from the largest market, South Korea, and a significant increase from Thailand, the second-largest market. Similarly, Japanese imports of Vietnamese itoyori and other species’ surimi increased 54 and 18 percent, respectively. Other growing markets like Russia and Malaysia also registered notable increases through Q2 compared to the previous two years.
Table 27. Countries declaring surimi imports from Vietnam. Source: each country’s customs, authority, UB Consulting
**UB Consulting developed a model to estimatetotal production figures. Thereafter, productionestimates by species use an internal workinggroup approximation that was then calculatedusing an in-house non-linear model. The estimatesprovided by the working group were collected in2020.
© Urner Barry 2021 All Rights Reserved. This publication is protected by US copyright law, please do not copy. Urner Barry Consulting Surimi Paste, Supply Track | A publication of Urner Barry Consulting | 732-240-2349 | P.O. Box 389, Toms River, NJ 08754
Tropical Surimi Production, Vietnam
Vietnam's Estimated Production by Species thru Q2Itoyori Eso Bigeye Goatfish Croaker Ribbon Seabream Flying Fish Other Total
2015 14,106 7,659 10,988 7,262 10,988 4,177 6,372 3,481 4,601 69,635 2016 8,854 11,340 7,782 9,887 7,782 5,951 5,857 4,990 4,646 67,089 2017 12,691 11,655 7,474 4,229 7,474 5,795 5,795 4,944 4,376 64,435 2018 10,852 15,200 10,829 3,559 8,257 6,064 6,064 5,160 5,197 71,183 2019 12,222 12,130 10,161 3,898 14,811 6,698 6,698 5,702 5,629 77,950 2020 15,416 8,566 8,625 4,241 14,127 6,274 6,274 5,337 5,493 74,354 2021 23,686 13,442 10,503 4,527 13,619 8,145 8,145 4,856 3,622 90,546
Countries declaring surimi imports from Viet-Nam from Q1 to Q2Reporter Name Species
2015 '15 vs. '14 2016 '16 vs. '15 2017 '17 vs. '16 2018 '18 vs. '17 2019 '19 vs. '18 2020 '20 vs. '19 2021 '21 vs. '20All 25,794 ▼ 53.5% 24,060 ▼ 6.7% 24,309 ▲ 1.0% 26,595 ▲ 9.4% 24,138 ▼ 9.2% 25,996 ▲ 7.7% 25,248 ▼ 2.9%
Gogies 12,891 ▼ 28.9% 10,293 ▼ 20.2% 13,665 ▲ 32.8% 15,514 ▲ 13.5% 13,295 ▼ 14.3% 12,206 ▼ 8.2% 18,619 ▲ 52.5%Other 1,380 ▼ 47.1% 1,540 ▲ 11.6% 1,160 ▼ 24.7% 1,214 ▲ 4.7% 259 ▼ 78.7% 119 ▼ 54.1%
All 5,950 ▼ 68.5% 4,946 ▼ 16.9% 5,530 ▲ 11.8% 7,611 ▲ 37.6% 11,086 ▲ 45.7% 14,608 ▲ 31.8% 14,289 ▼ 2.2% reams, Kingclip 353 ▼ 62.8% 179 ▼ 49.3% 138 ▼ 22.9% 153 ▲ 10.9% 183 ▲ 19.6% 88 ▼ 51.9% 108 ▲ 22.7%
Itoyori 1,487 ▼ 59.0% 1,024 ▼ 31.1% 1,322 ▲ 29.1% 1,249 ▼ 5.5% 1,458 ▲ 16.7% 1,468 ▲ 0.7% 2,266 ▲ 54.4%Other 5,869 ▼ 55.3% 6,695 ▲ 14.1% 5,359 ▼ 20.0% 6,944 ▲ 29.6% 7,865 ▲ 13.3% 5,452 ▼ 30.7% 6,412 ▲ 17.6%
Sardine, Other 102 ▲ 45.7% 70 ▼ 31.4% 2 ▼ 97.1% 1 10 ▲ 900.0%All 4,099 ▼ 10.1% 4,723 ▲ 15.2% 2,533 ▼ 46.4% 2,543 ▲ 0.4% 4,839 ▲ 90.3% 3,805 ▼ 21.4% 5,458 ▲ 43.4%All 2,804 ▼ 33.6% 2,169 ▼ 22.6% 3,121 ▲ 43.9% 3,123 ▲ 0.1% 5,026 ▲ 60.9% 2,778 ▼ 44.7% 6,358 ▲ 128.9%All 3,091 ▼ 52.5% 2,562 ▼ 17.1% 1,619 ▼ 36.8% 2,015 ▲ 24.5% 2,746 ▲ 36.3% 2,318 ▼ 15.6% 3,433 ▲ 48.1%All 3,037 ▼ 41.7% 3,168 ▲ 4.3% 760 ▼ 76.0% 341 ▼ 55.1% 543 ▲ 59.2% 381 ▼ 29.8% 201 ▼ 47.2%All 774 ▼ 58.1% 1,851 ▲ 139.1% 1,839 ▼ 0.6% 369 ▼ 79.9% 748 ▲ 102.7% 347 ▼ 53.6% 1,159 ▲ 234.0%All 1,191 1,907 ▲ 60.1% 1,258 ▼ 34.0% 1,419 ▲ 12.8%All 390 ▼ 56.1% 510 ▲ 30.8% 685 ▲ 34.3% 694 ▲ 1.3% 1,200 ▲ 72.9% 950 ▼ 20.8% 1,399 ▲ 47.3%
1,602 ▼ 70.0% 3,299 ▲ 105.9% 2,393 ▼ 27.5% 1,627 ▼ 32.0% 2,656 ▲ 63.2% 2,570 ▼ 3.2% 4,177 ▲ 62.5%69,623 ▼ 50.8% 67,089 ▼ 3.6% 64,435 ▼ 4.0% 71,183 ▲ 10.5% 77,950 ▲ 9.5% 74,354 ▼ 4.6% 90,546 ▲ 21.8%Total
RussiaMalaysiaTaiwanFrance
IndonesiaPhilippines
UkraineOther
Japan
S. KoreaThailand
China

-
2
4
6
8
10
12
14
16
18
20
2015 2016 2017 2018 2019 2020 2021
Th
ou
san
d M
T
Indonesia's Estimated Production by Species thru Q2
Itoyori Eso Bigeye
Goatfish Croaker Ribbon
Seabream Flying Fish Other
17
Surimi **production estimates from Indonesia suggest a steep decline of about 29 percent through Q2 compared to 2020, adding to 10 thousand metric tons
Table 28. Yearly estimates of Indonesia’s surimi production by species. Figure 27. Yearly estimates of Indonesia’s surimi production by species.
Analysis
However, according to our estimates, production of itoyori fell only by 3.6 percent year-to-date. Q2 2021 figures are the lowest quarterly figure since Q32018.
When analyzing import data by declaring countries, we noticed an increase in Japanese imports of itoyori surimi of 3.6 percent. Imports from the largest market, Malaysia, increased by 26 percent through Q2. Import price per MT also reached a record high for both markets in Q2 2021.
Thai imports also increased significantly. However, noticeable declines by South Korea and China, forced the overall import figure to contract by 15.3 percent through Q2 year-over-year.
Table 29. Countries declaring surimi imports from Indonesia. Source: each country’s customs, authority, UB Consulting
**UB Consulting developed a model to estimate total production figures. Thereafter, production estimates by species use an internal working group approximation that was then calculated using an in-house non-linear model. The estimates provided by the working group were collected in 2020.
© Urner Barry 2021 All Rights Reserved. This publication is protected by US copyright law, please do not copy. Urner Barry Consulting Surimi Paste, Supply Track | A publication of Urner Barry Consulting | 732-240-2349 | P.O. Box 389, Toms River, NJ 08754
Tropical Surimi Production, Indonesia
Indonesia's Estimated Production by Species thru Q2Itoyori Eso Bigeye Goatfish Croaker Ribbon Seabream Flying Fish Other Total
2015 5,303 1,876 1,520 653 1,732 1,887 634 1,407 2,036 17,050 2016 6,283 2,398 2,201 766 1,800 1,620 360 1,131 1,440 17,999 2017 2,989 1,268 1,185 187 933 840 546 187 1,196 9,331 2018 3,629 1,181 1,864 505 1,073 1,193 215 215 859 10,733 2019 5,068 1,991 1,775 286 1,431 1,563 286 763 1,144 14,306 2020 4,062 1,836 1,129 282 1,978 1,270 282 282 2,992 14,114 2021 3,915 1,201 802 396 1,607 902 201 201 802 10,026
Countries declaring surimi imports from Indonesia from Q1 to Q2Reporter Name Species
2015 '15 vs. '14 2016 '16 vs. '15 2017 '17 vs. '16 2018 '18 vs. '17 2019 '19 vs. '18 2020 '20 vs. '19 2021 '21 vs. '20All 3,585 3,575 ▼ 0.3% 1,912 ▼ 46.5% 1,796 ▼ 6.1% 2,662 ▲ 48.2% 3,070 ▲ 15.3% 3,862 ▲ 25.8%
Itoyori 2,249 ▼ 35.6% 1,314 ▼ 41.6% 1,303 ▼ 0.8% 848 ▼ 34.9% 878 ▲ 3.5% 800 ▼ 8.9% 829 ▲ 3.6%Other 2,259 ▼ 42.6% 2,546 ▲ 12.7% 1,565 ▼ 38.5% 1,858 ▲ 18.7% 1,793 ▼ 3.5% 1,016 ▼ 43.3% 502 ▼ 50.6%
Sardine, Other 21 20 ▼ 4.8%All 3,576 ▼ 37.7% 3,115 ▼ 12.9% 2,467 ▼ 20.8% 1,368 ▼ 44.5% 2,222 ▲ 62.4% 2,856 ▲ 28.5% 1,697 ▼ 40.6%All 1,050 ▼ 64.3% 1,148 ▲ 9.3% 539 ▼ 53.0% 1,245 ▲ 131.0% 2,664 ▲ 114.0% 3,589 ▲ 34.7% 2,260 ▼ 37.0%All 1,852 ▼ 65.1% 1,520 ▼ 17.9% 874 ▼ 42.5% 991 ▲ 13.4% 1,011 ▲ 2.0% 949 ▼ 6.1% 561 ▼ 40.9%
Gogies 446 ▲ 220.9% 1,948 ▲ 336.8% 219 ▼ 88.8% 640 ▲ 192.2% 1,880 ▲ 193.8% 1,173 ▼ 37.6% 1,463 ▲ 24.7%Other 94 ▼ 17.5% 133 ▲ 41.5% 30 ▼ 77.4% 16 ▼ 46.7% 18 ▲ 12.5% 1 ▼ 94.4% 2 ▲ 100.0%
All 69 ▼ 38.4% 132 ▲ 91.3% 78 ▼ 40.9% 90 ▲ 15.4% 124 ▲ 37.8% 126 ▲ 1.6% 162 ▲ 28.6%All 134 ▼ 44.4% 170 ▲ 26.9% 49 ▼ 71.2% 63 ▲ 28.6% 58 ▼ 7.9% 46 ▼ 20.7% 71 ▲ 54.3%All 96 126 ▲ 31.3% 54 ▼ 57.1% 156 ▲ 188.9%All 56 39 ▼ 30.4% 102 ▲ 161.5% 4All 25 ▼ 59.7% 49 ▲ 96.0% 18 ▼ 63.3% 25
10 ▼ 96.9% 45 ▲ 350.0% 52 ▲ 15.6% 23 ▼ 55.8% 5 ▼ 78.3% 2515,405 ▼ 31.3% 15,734 ▲ 2.1% 9,229 ▼ 41.3% 9,054 ▼ 1.9% 13,466 ▲ 48.7% 13,684 ▲ 1.6% 11,590 ▼ 15.3%
PhilippinesSingapore
Canada
OtherTotal
ChinaTaiwan
Thailand
Hong KongAustralia
MalaysiaJapan
S. Korea
0.0
1.0
2.0
3.0
4.0
5.0
6.0
7.0
2015 2016 2017 2018 2019 2020 2021
Thou
sand
MT
Malaysia's Estimated Production by Species thru Q2
Itoyori Eso BigeyeGoatfish Croaker RibbonSeabream Flying Fish Other
18
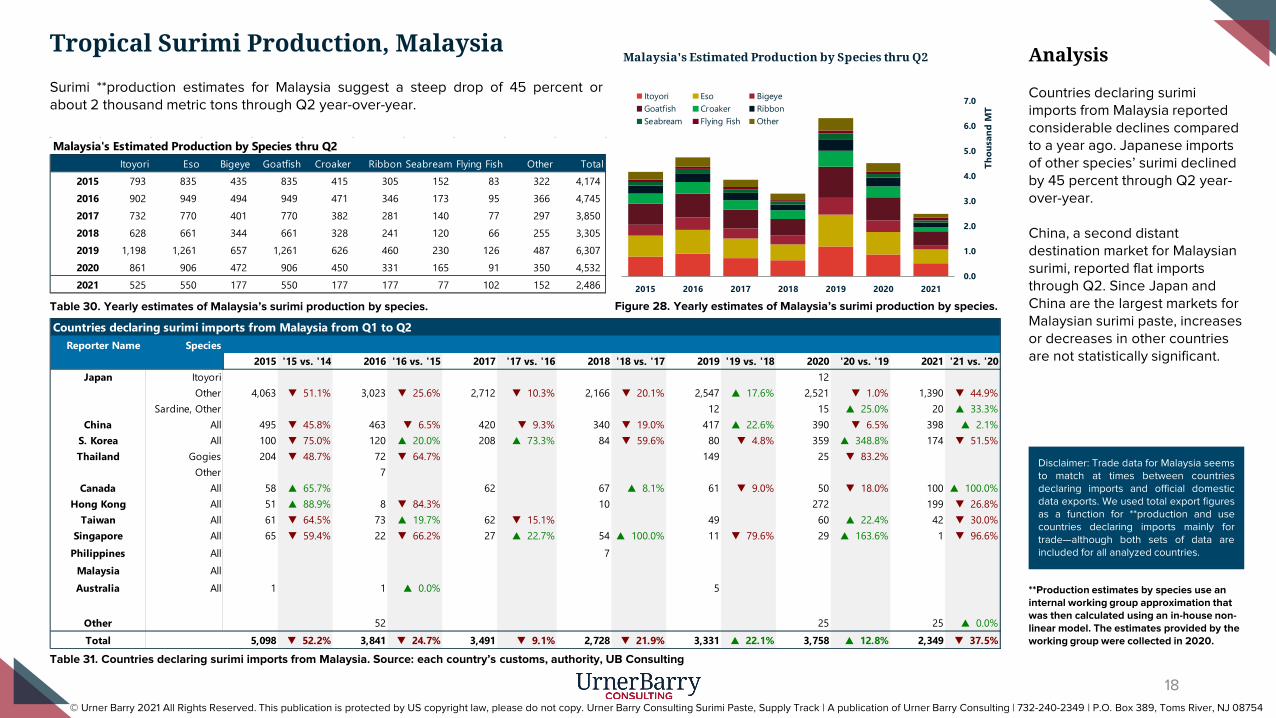
Table 30. Yearly estimates of Malaysia’s surimi production by species. Figure 28. Yearly estimates of Malaysia’s surimi production by species.
Analysis
Countries declaring surimi imports from Malaysia reported considerable declines compared to a year ago. Japanese imports of other species’ surimi declined by 45 percent through Q2 year-over-year.
China, a second distant destination market for Malaysian surimi, reported flat imports through Q2. Since Japan and China are the largest markets for Malaysian surimi paste, increases or decreases in other countries are not statistically significant.
Table 31. Countries declaring surimi imports from Malaysia. Source: each country’s customs, authority, UB Consulting
**Production estimates by species use an internal working group approximation that was then calculated using an in-house non-linear model. The estimates provided by the working group were collected in 2020.
© Urner Barry 2021 All Rights Reserved. This publication is protected by US copyright law, please do not copy. Urner Barry Consulting Surimi Paste, Supply Track | A publication of Urner Barry Consulting | 732-240-2349 | P.O. Box 389, Toms River, NJ 08754
Tropical Surimi Production, Malaysia
Malaysia's Estimated Production by Species thru Q2Itoyori Eso Bigeye Goatfish Croaker Ribbon Seabream Flying Fish Other Total
2015 793 835 435 835 415 305 152 83 322 4,174 2016 902 949 494 949 471 346 173 95 366 4,745 2017 732 770 401 770 382 281 140 77 297 3,850 2018 628 661 344 661 328 241 120 66 255 3,305 2019 1,198 1,261 657 1,261 626 460 230 126 487 6,307 2020 861 906 472 906 450 331 165 91 350 4,532 2021 525 550 177 550 177 177 77 102 152 2,486
Countries declaring surimi imports from Malaysia from Q1 to Q2Reporter Name Species
2015 '15 vs. '14 2016 '16 vs. '15 2017 '17 vs. '16 2018 '18 vs. '17 2019 '19 vs. '18 2020 '20 vs. '19 2021 '21 vs. '20Itoyori 12Other 4,063 ▼ 51.1% 3,023 ▼ 25.6% 2,712 ▼ 10.3% 2,166 ▼ 20.1% 2,547 ▲ 17.6% 2,521 ▼ 1.0% 1,390 ▼ 44.9%
Sardine, Other 12 15 ▲ 25.0% 20 ▲ 33.3%All 495 ▼ 45.8% 463 ▼ 6.5% 420 ▼ 9.3% 340 ▼ 19.0% 417 ▲ 22.6% 390 ▼ 6.5% 398 ▲ 2.1%All 100 ▼ 75.0% 120 ▲ 20.0% 208 ▲ 73.3% 84 ▼ 59.6% 80 ▼ 4.8% 359 ▲ 348.8% 174 ▼ 51.5%
Gogies 204 ▼ 48.7% 72 ▼ 64.7% 149 25 ▼ 83.2%Other 7
All 58 ▲ 65.7% 62 67 ▲ 8.1% 61 ▼ 9.0% 50 ▼ 18.0% 100 ▲ 100.0%All 51 ▲ 88.9% 8 ▼ 84.3% 10 272 199 ▼ 26.8%All 61 ▼ 64.5% 73 ▲ 19.7% 62 ▼ 15.1% 49 60 ▲ 22.4% 42 ▼ 30.0%All 65 ▼ 59.4% 22 ▼ 66.2% 27 ▲ 22.7% 54 ▲ 100.0% 11 ▼ 79.6% 29 ▲ 163.6% 1 ▼ 96.6%All 7AllAll 1 1 ▲ 0.0% 5
52 25 25 ▲ 0.0%5,098 ▼ 52.2% 3,841 ▼ 24.7% 3,491 ▼ 9.1% 2,728 ▼ 21.9% 3,331 ▲ 22.1% 3,758 ▲ 12.8% 2,349 ▼ 37.5%
PhilippinesMalaysiaAustralia
OtherTotal
Thailand
CanadaHong Kong
TaiwanSingapore
Japan
ChinaS. Korea
Disclaimer: Trade data for Malaysia seemsto match at times between countriesdeclaring imports and official domesticdata exports. We used total export figuresas a function for **production and usecountries declaring imports mainly fortrade—although both sets of data areincluded for all analyzed countries.
Surimi **production estimates for Malaysia suggest a steep drop of 45 percent orabout 2 thousand metric tons through Q2 year-over-year.
Analysis
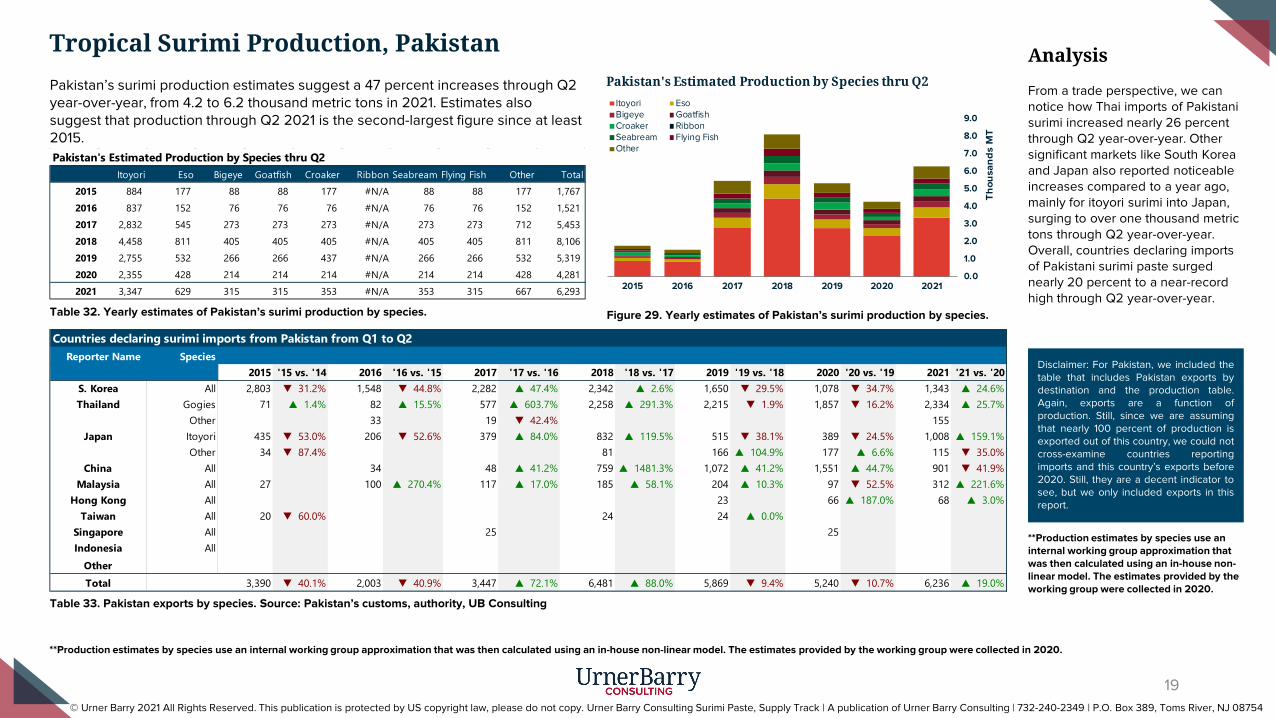
From a trade perspective, we can notice how Thai imports of Pakistani surimi increased nearly 26 percent through Q2 year-over-year. Other significant markets like South Korea and Japan also reported noticeable increases compared to a year ago, mainly for itoyori surimi into Japan, surging to over one thousand metric tons through Q2 year-over-year. Overall, countries declaring imports of Pakistani surimi paste surged nearly 20 percent to a near-record high through Q2 year-over-year.
19
Pakistan’s surimi production estimates suggest a 47 percent increases through Q2 year-over-year, from 4.2 to 6.2 thousand metric tons in 2021. Estimates also suggest that production through Q2 2021 is the second-largest figure since at least 2015.
Table 32. Yearly estimates of Pakistan’s surimi production by species.
Table 33. Pakistan exports by species. Source: Pakistan’s customs, authority, UB Consulting
Figure 29. Yearly estimates of Pakistan’s surimi production by species.
**Production estimates by species use an internal working group approximation that was then calculated using an in-house non-linear model. The estimates provided by the working group were collected in 2020.
© Urner Barry 2021 All Rights Reserved. This publication is protected by US copyright law, please do not copy. Urner Barry Consulting Surimi Paste, Supply Track | A publication of Urner Barry Consulting | 732-240-2349 | P.O. Box 389, Toms River, NJ 08754
Tropical Surimi Production, Pakistan
Pakistan's Estimated Production by Species thru Q2Itoyori Eso Bigeye Goatfish Croaker Ribbon Seabream Flying Fish Other Total
2015 884 177 88 88 177 #N/A 88 88 177 1,767 2016 837 152 76 76 76 #N/A 76 76 152 1,521 2017 2,832 545 273 273 273 #N/A 273 273 712 5,453 2018 4,458 811 405 405 405 #N/A 405 405 811 8,106 2019 2,755 532 266 266 437 #N/A 266 266 532 5,319 2020 2,355 428 214 214 214 #N/A 214 214 428 4,281 2021 3,347 629 315 315 353 #N/A 353 315 667 6,293
Countries declaring surimi imports from Pakistan from Q1 to Q2Reporter Name Species
2015 '15 vs. '14 2016 '16 vs. '15 2017 '17 vs. '16 2018 '18 vs. '17 2019 '19 vs. '18 2020 '20 vs. '19 2021 '21 vs. '20All 2,803 ▼ 31.2% 1,548 ▼ 44.8% 2,282 ▲ 47.4% 2,342 ▲ 2.6% 1,650 ▼ 29.5% 1,078 ▼ 34.7% 1,343 ▲ 24.6%
Gogies 71 ▲ 1.4% 82 ▲ 15.5% 577 ▲ 603.7% 2,258 ▲ 291.3% 2,215 ▼ 1.9% 1,857 ▼ 16.2% 2,334 ▲ 25.7%Other 33 19 ▼ 42.4% 155
Itoyori 435 ▼ 53.0% 206 ▼ 52.6% 379 ▲ 84.0% 832 ▲ 119.5% 515 ▼ 38.1% 389 ▼ 24.5% 1,008 ▲ 159.1%Other 34 ▼ 87.4% 81 166 ▲ 104.9% 177 ▲ 6.6% 115 ▼ 35.0%
All 34 48 ▲ 41.2% 759 ▲ 1481.3% 1,072 ▲ 41.2% 1,551 ▲ 44.7% 901 ▼ 41.9%All 27 100 ▲ 270.4% 117 ▲ 17.0% 185 ▲ 58.1% 204 ▲ 10.3% 97 ▼ 52.5% 312 ▲ 221.6%All 23 66 ▲ 187.0% 68 ▲ 3.0%All 20 ▼ 60.0% 24 24 ▲ 0.0%All 25 25All
3,390 ▼ 40.1% 2,003 ▼ 40.9% 3,447 ▲ 72.1% 6,481 ▲ 88.0% 5,869 ▼ 9.4% 5,240 ▼ 10.7% 6,236 ▲ 19.0%OtherTotal
ChinaMalaysia
Hong KongTaiwan
SingaporeIndonesia
S. KoreaThailand
Japan
**Production estimates by species use an internal working group approximation that was then calculated using an in-house non-linear model. The estimates provided by the working group were collected in 2020.
0.0
1.0
2.0
3.0
4.0
5.0
6.0
7.0
8.0
9.0
2015 2016 2017 2018 2019 2020 2021
Th
ou
san
ds
MT
Pakistan's Estimated Production by Species thru Q2Itoyori EsoBigeye GoatfishCroaker RibbonSeabream Flying FishOther
Disclaimer: For Pakistan, we included thetable that includes Pakistan exports bydestination and the production table.Again, exports are a function ofproduction. Still, since we are assumingthat nearly 100 percent of production isexported out of this country, we could notcross-examine countries reportingimports and this country’s exports before2020. Still, they are a decent indicator tosee, but we only included exports in thisreport.
-
200
400
600
800
1,000
1,200
1,400
1,600
2015 2016 2017 2018 2019 2020 2021
MT
Myanmar's Estimated Production by Species thru Q2
Croaker Itoyori EsoBigeye Goatfish RibbonSeabream Flying Fish Other
20
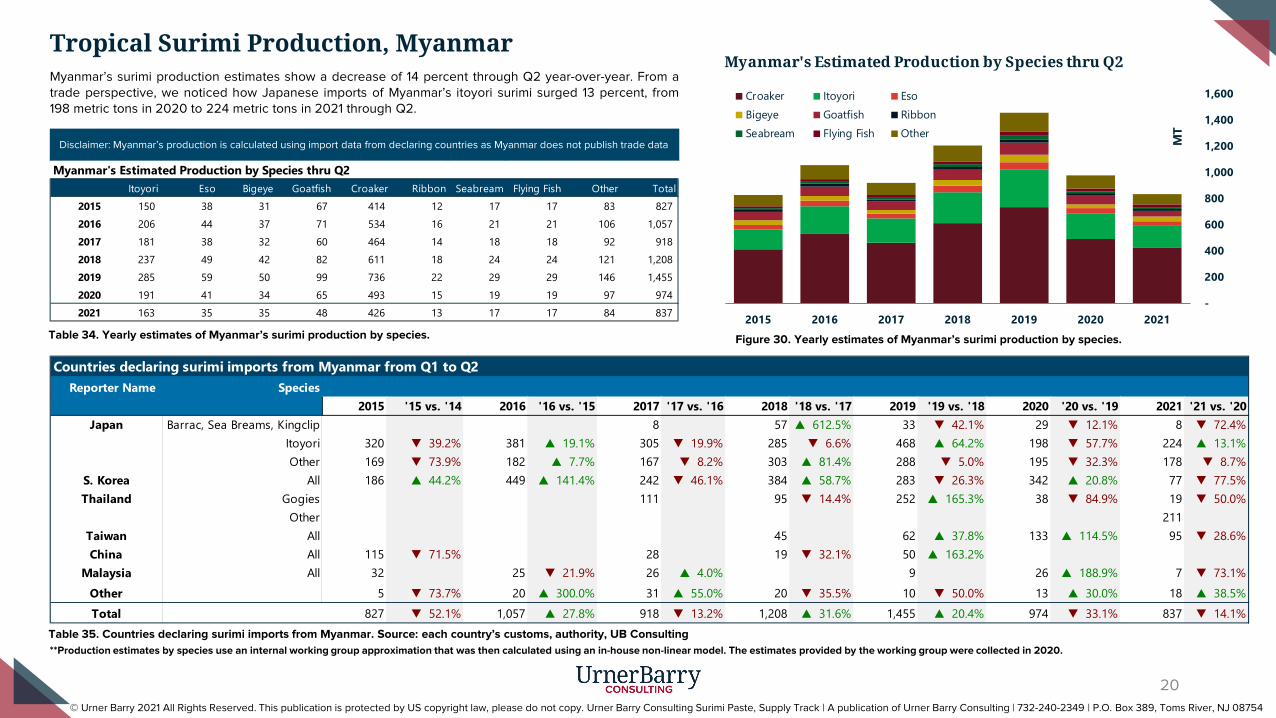
Myanmar’s surimi production estimates show a decrease of 14 percent through Q2 year-over-year. From atrade perspective, we noticed how Japanese imports of Myanmar’s itoyori surimi surged 13 percent, from198 metric tons in 2020 to 224 metric tons in 2021 through Q2.
Table 34. Yearly estimates of Myanmar’s surimi production by species.
Table 35. Countries declaring surimi imports from Myanmar. Source: each country’s customs, authority, UB Consulting
Figure 30. Yearly estimates of Myanmar’s surimi production by species.
**Production estimates by species use an internal working group approximation that was then calculated using an in-house non-linear model. The estimates provided by the working group were collected in 2020.
© Urner Barry 2021 All Rights Reserved. This publication is protected by US copyright law, please do not copy. Urner Barry Consulting Surimi Paste, Supply Track | A publication of Urner Barry Consulting | 732-240-2349 | P.O. Box 389, Toms River, NJ 08754
Tropical Surimi Production, Myanmar
Myanmar's Estimated Production by Species thru Q2Itoyori Eso Bigeye Goatfish Croaker Ribbon Seabream Flying Fish Other Total
2015 150 38 31 67 414 12 17 17 83 827 2016 206 44 37 71 534 16 21 21 106 1,057 2017 181 38 32 60 464 14 18 18 92 918 2018 237 49 42 82 611 18 24 24 121 1,208 2019 285 59 50 99 736 22 29 29 146 1,455 2020 191 41 34 65 493 15 19 19 97 974 2021 163 35 35 48 426 13 17 17 84 837
Countries declaring surimi imports from Myanmar from Q1 to Q2Reporter Name Species
2015 '15 vs. '14 2016 '16 vs. '15 2017 '17 vs. '16 2018 '18 vs. '17 2019 '19 vs. '18 2020 '20 vs. '19 2021 '21 vs. '20Barrac, Sea Breams, Kingclip 8 57 ▲ 612.5% 33 ▼ 42.1% 29 ▼ 12.1% 8 ▼ 72.4%
Itoyori 320 ▼ 39.2% 381 ▲ 19.1% 305 ▼ 19.9% 285 ▼ 6.6% 468 ▲ 64.2% 198 ▼ 57.7% 224 ▲ 13.1%Other 169 ▼ 73.9% 182 ▲ 7.7% 167 ▼ 8.2% 303 ▲ 81.4% 288 ▼ 5.0% 195 ▼ 32.3% 178 ▼ 8.7%
All 186 ▲ 44.2% 449 ▲ 141.4% 242 ▼ 46.1% 384 ▲ 58.7% 283 ▼ 26.3% 342 ▲ 20.8% 77 ▼ 77.5%Gogies 111 95 ▼ 14.4% 252 ▲ 165.3% 38 ▼ 84.9% 19 ▼ 50.0%
Other 211All 45 62 ▲ 37.8% 133 ▲ 114.5% 95 ▼ 28.6%All 115 ▼ 71.5% 28 19 ▼ 32.1% 50 ▲ 163.2%All 32 25 ▼ 21.9% 26 ▲ 4.0% 9 26 ▲ 188.9% 7 ▼ 73.1%
5 ▼ 73.7% 20 ▲ 300.0% 31 ▲ 55.0% 20 ▼ 35.5% 10 ▼ 50.0% 13 ▲ 30.0% 18 ▲ 38.5%827 ▼ 52.1% 1,057 ▲ 27.8% 918 ▼ 13.2% 1,208 ▲ 31.6% 1,455 ▲ 20.4% 974 ▼ 33.1% 837 ▼ 14.1%
OtherTotal
TaiwanChina
Malaysia
Japan
S. KoreaThailand
Disclaimer: Myanmar’s production is calculated using import data from declaring countries as Myanmar does not publish trade data

52 76
648 442 383 409 426 436
658
150
1,044
791
1,712
1,171 1,043
303 387
695 555
432 461 502
1,084 1,100
533
-
500
1,000
1,500
2,000
2017 2018 2019 2020 2021
Sardine surimi, to Japan, Q1 to Q2Japan importing Sardine, Other surimi from PeruJapan importing Other surimi from PeruJapan importing, total surimi from PeruJapan importing Sardine, Other surimi from all countriesPeru exporting All surimi to Japan
Met
ric to
ns
18 34 6
66 52 24
52 96
408
240 196
236 250
192
72 126 120
263
96
-
100
200
300
400
500
Q1 Q2 Q3 Q4
Japan importing Sardine, Other surimi from Peru 2017 20182019 2020
Met
ric to
ns
52 76
648
442 383
-
100
200
300
400
500
600
700
2017 2018 2019 2020 2021
Japan importing Sardine, Other surimi from Peru
Met
ric to
ns
thru Q2
21
Japanese imports of Peruvian sardine surimi is down 13 percent through Q2 year-over-year.However, imports surged 37 percent in Q2, and partial data through July only is already 33 percentabove last year’s figures for the entire quarter. While the pandemic certainly impacted productionand shipments in 2020, we expect figures to increase into the second half of 2021.
Table 32. Japanese imports of sardine surimi from Peru. Source: Japan’s customs, UB Consulting
Figure 31. Japanese imports of sardine surimi from Peru. Source: Japan’s customs, UB Consulting
© Urner Barry 2021 All Rights Reserved. This publication is protected by US copyright law, please do not copy. Urner Barry Consulting Surimi Paste, Supply Track | A publication of Urner Barry Consulting | 732-240-2349 | P.O. Box 389, Toms River, NJ 08754
Sardine Production and Trade, Peru to Japan
Table 33. Japanese imports of sardine surimi from Peru, and Peruvian exports of surimi to JapanSource: Japan’s customs, Peru’s customs, UB Consulting
22
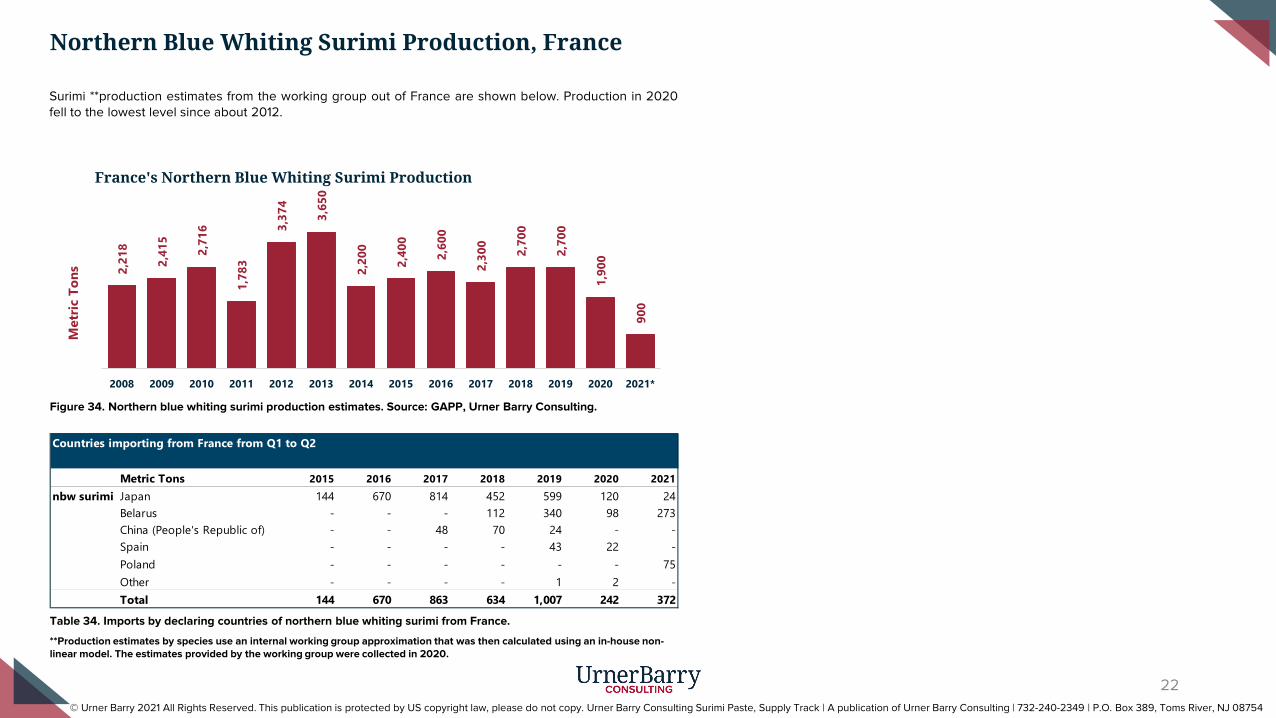
Surimi **production estimates from the working group out of France are shown below. Production in 2020fell to the lowest level since about 2012.
Table 34. Imports by declaring countries of northern blue whiting surimi from France.
Figure 34. Northern blue whiting surimi production estimates. Source: GAPP, Urner Barry Consulting.
© Urner Barry 2021 All Rights Reserved. This publication is protected by US copyright law, please do not copy. Urner Barry Consulting Surimi Paste, Supply Track | A publication of Urner Barry Consulting | 732-240-2349 | P.O. Box 389, Toms River, NJ 08754
Northern Blue Whiting Surimi Production, France
2,21
8
2,41
5
2,71
6
1,78
3
3,37
4
3,65
0
2,20
0
2,40
0
2,60
0
2,30
0
2,70
0
2,70
0
1,90
0
900
2008 2009 2010 2011 2012 2013 2014 2015 2016 2017 2018 2019 2020 2021*
Met
ric T
ons
France's Northern Blue Whiting Surimi Production
Countries importing from France from Q1 to Q2
Metric Tons 2015 2016 2017 2018 2019 2020 2021nbw surimi Japan 144 670 814 452 599 120 24
Belarus - - - 112 340 98 273China (People's Republic of) - - 48 70 24 - -Spain - - - - 43 22 -Poland - - - - - - 75Other - - - - 1 2 -Total 144 670 863 634 1,007 242 372
**Production estimates by species use an internal working group approximation that was then calculated using an in-house non-linear model. The estimates provided by the working group were collected in 2020.
9,776 10,319 9,475 9,270 10,686 8,813 9,960 10,536
14,693
18,678 17,027
14,460 14,644 14,482
21,559
26,618 29,037
27,227 25,558
23,699 24,654
-
5,000
10,000
15,000
20,000
25,000
30,000
35,000
2015 2016 2017 2018 2019 2020 2021
Surimi Imports from China Q1 to Q2Japan importing, total surimi from China (People's Republic of)
Korea (Rep. of) importing All surimi from China (People's Republic of)
ALL importing ALL surimi from China
Met
ric to
ns
292
592
198 174
378
552
125
335 288
124 168
388
49
193
75
217
92 120 48
-
100
200
300
400
500
600
700
Q1 Q2 Q3 Q4
Thailand importing All surimi from China (People's Republic of) 2017 20182019 2020
Met
ric to
ns
23
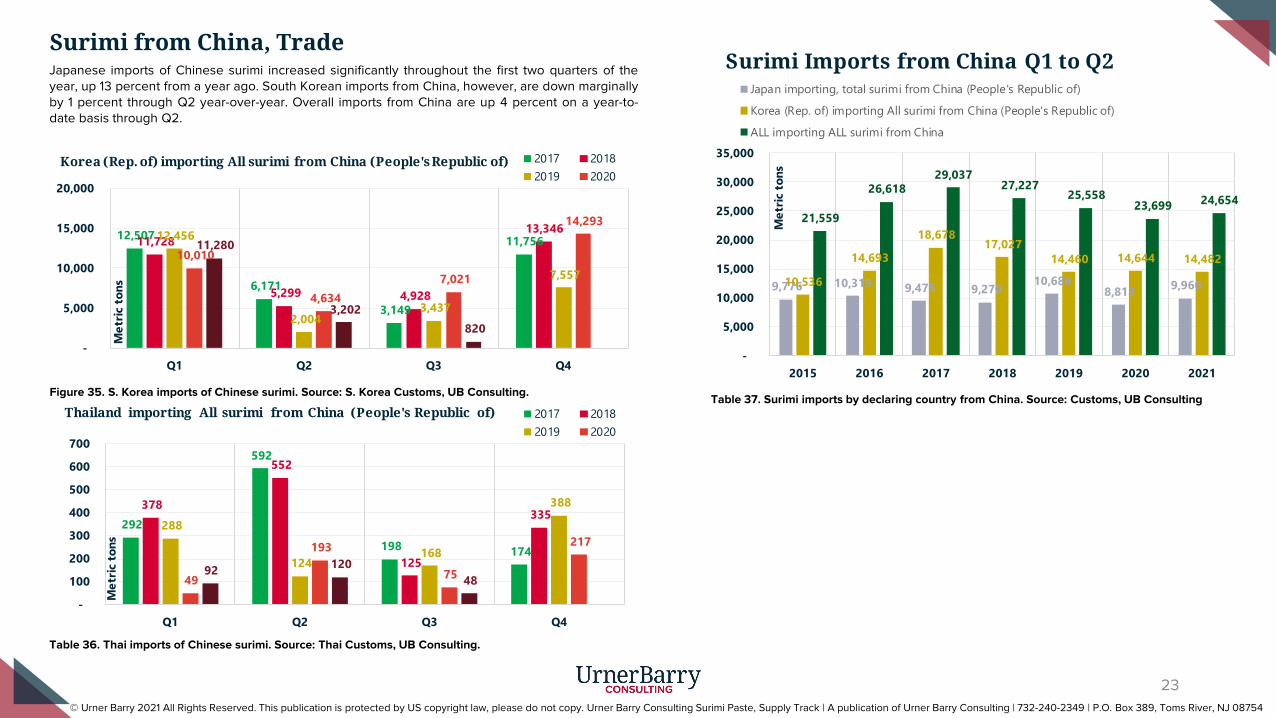
Japanese imports of Chinese surimi increased significantly throughout the first two quarters of theyear, up 13 percent from a year ago. South Korean imports from China, however, are down marginallyby 1 percent through Q2 year-over-year. Overall imports from China are up 4 percent on a year-to-date basis through Q2.
Table 36. Thai imports of Chinese surimi. Source: Thai Customs, UB Consulting.
Figure 35. S. Korea imports of Chinese surimi. Source: S. Korea Customs, UB Consulting.
© Urner Barry 2021 All Rights Reserved. This publication is protected by US copyright law, please do not copy. Urner Barry Consulting Surimi Paste, Supply Track | A publication of Urner Barry Consulting | 732-240-2349 | P.O. Box 389, Toms River, NJ 08754
Surimi from China, Trade
12,507
6,171
3,149
11,756 11,728
5,299 4,928
13,346 12,456
2,004 3,437
7,557 10,010
4,634 7,021
14,293
11,280
3,202 820
-
5,000
10,000
15,000
20,000
Q1 Q2 Q3 Q4
Korea (Rep. of) importing All surimi from China (People's Republic of) 2017 20182019 2020
Met
ric to
ns
Table 37. Surimi imports by declaring country from China. Source: Customs, UB Consulting
About Urner Barry Consulting
Urner Barry Consulting provides tailored solutions to identify growth opportunities within the fast-paced protein commodity sectors. Combining the expertise of our analytical team, our warehouse of proprietary and trusted data, and unparalleled insight into market forecasting.
Contact Urner Barry
Please contact, Senior Vice President, Chris Ashley ([email protected] or 732-240-5330) for additional product or subscription related services in the surimi or associated seafood markets and industries.
Report Terms and Conditions
The information and data contained herein are intended solely for the confidential and exclusive use of members of the Association of Genuine Alaska Pollock Producers (GAPP). All GAPP Members expressly agree that they will not sell, communicate, or give any of said information or data to any other person, firm, or corporation, including any governmental agent or agencies whatsoever and any news distributing or communications company or service outside the scope of the original agreement.
The use of data for contractual or other purposes is beyond the publishers’ control and they will in no case assume any responsibility for such use. They represent in the judgment of the publishers an accurate picture of current business, but they are not “official” in any sense of the word. The publishers disclaim and do not assume responsibility for any damages, alleged or otherwise, that may result or claim to have resulted from any use made by any person or any reliance made by any person upon any of the statements of data appearing at any time herein.
While the data contained in this report is gathered from reliable sources, accuracy and completeness cannot be guaranteed. The publisher does not give investment advice or act as an investment advisor. All data, information, & opinions are subject to change without notice. This publication is protected by U.S. copyright laws. Do not copy or redistribute this information without permission.
While the data contained in this report is gathered from reliable sources, accuracy and completeness cannot be guaranteed. The publisher does not give investment advice or act as an investment advisor. All data, information, & opinions are subject to change without notice. This publication is protected by U.S. copyright laws. Do not copy or redistribute this information without permission.
© Urner Barry 2021 All Rights Reserved. This publication is protected by US copyright law, please do not copy. Urner Barry Consulting Surimi Paste, Supply Track | A publication of Urner Barry Consulting | 732-240-2349 | P.O. Box 389, Toms River, NJ 08754
24
Angel Rubio, Sr. Analyst [email protected]
Akash Pandey, Data [email protected]
Chris Ashley, Senior [email protected]