Embed Size (px)
Citation preview

HEALTH ECONOMICSHealth Econ. (2011)Published online in Wiley Online Library (wileyonlinelibrary.com). DOI: 10.1002/hec.1741
SURROGATES, META‐ANALYSIS AND COST‐EFFECTIVENESSMODELLING: A COMBINED ANALYTIC APPROACH
NEIL HAWKINSa,*, GERRY RICHARDSONa,c, ALEX J SUTTONb, NICOLA J COOPERb, CHRIS GRIFFITHSd,ANNE ROGERSe and PETER BOWERe
aCentre for Health Economics, University of York, York, UKbDepartment of Health Sciences, University of Leicester, Leicester, UK
cHull York Medical School, York, UKdCentre for Health Sciences, Barts & The London School of Medicine & Dentistry, London, UK
ePrimary Care Research Group, University of Manchester, Manchester, UK
SUMMARYEstimates of cost‐effectiveness analyses are typically obtained either directly from ‘trial’ based analyses or indirectly viasurrogate endpoints in ‘model’ based analyses. Data from clinical trials that include both surrogate and final endpoints can beused in a joint analysis that combines these two approaches. This joint approach allows the inclusion of information regardingthe effects of treatment on surrogate endpoints while relaxing the strong assumption of ‘conditional independence’ associatedwith indirect model‐based analyses. An example cost‐effectiveness analysis of Chronic Disease Self‐ManagementProgramme is used to compare the different approaches. It is shown that despite using a common data set, the different analyticapproaches produce differing estimates of the cost‐effectiveness of the intervention and the value of future research. The paperconcludes by discussing the selection of the appropriate analytic approach. Copyright © 2011 John Wiley & Sons, Ltd.
Received 23 February 2009; Revised 7 February 2011; Accepted 18 March 2011
KEY WORDS: surrogate outcome; economic evaluation; Bayesian; Chronic Disease Self‐Management Programme;randomised controlled trial
1. INTRODUCTION
Presuming the application of a Bayesian decision rule, economic evaluations of healthcare technologies arebased on estimates of mean costs and effects—the final decision endpoints—for each treatment option.Precisely which costs are included and which scale is used to measure effects will depend on the preference ofthe decision‐maker. The expected values of the means are used to identify the optimum treatment given currentinformation, and the estimated joint distribution of the means are used to estimate the probability of correctlyidentifying the optimal treatment and the potential value of additional information in increasing thisprobability. Together, these analyses inform the related decisions of whether to adopt a treatment and whetherfurther information is required (Vanness and Mullahy, 2006). The required estimates of the joint distribution ofthe means for the final decision endpoints are commonly derived from either ‘trial’ or ‘model’ based analyses.
In ‘trial’ based analyses, the final decision endpoints are predicted for each treatment option based on thedirect relationship between treatment choice and final endpoints observed inferred from a clinical trial.Typically, a trial‐based analysis will be based on a single trial, although rare examples of meta‐analysis of cost‐effectiveness estimates do exist (Cheng and Niparko, 1999; Bower et al., 2003). Data from trials that includedsurrogate endpoints but not the final decision endpoints cannot be included in a trial‐based analysis.
*Correspondence to: Centre for Health Economics, Alcuin ‘A’ Block, University of York, Heslington, York, UK, YO10 5DD. E‐mail:[email protected]
Copyright © 2011 John Wiley & Sons, Ltd.
N. HAWKINS ET AL.
In ‘model’ based analyses, the final decision endpoints are predicted for each treatment option based on anindirect relationship operating via one or more surrogate endpoints (Elston and Taylor, 2009). The ‘model’combines the predicted effect of treatment choice on the surrogate endpoints and the estimated relationshipbetween the surrogate endpoints and the final decision endpoints. The relationship between treatment choiceand the surrogate endpoints is typically estimated based on the relationship observed within clinical trials,either based on an individual trial or a meta‐analysis of multiple trials. The relationship between the surrogateendpoints and mean costs and effects may be estimated from a variety of sources including data from clinicaltrials, observational studies and even clinical opinion (Elston and Taylor, 2009).
Two recent evaluations of asthma treatments provide practical examples of the two approaches. In the‘model’ based evaluation, the effect of individual treatments on the surrogate endpoint of mean per centsymptom‐free days was estimated from a meta‐analysis of randomised controlled trials and relationshipsbetween mean per cent symptom‐free days and mean costs, and quality‐adjusted life years (QALYs) wereestimated using data from a single trial. These relationships were combined to obtain treatment‐specificestimates of incremental mean costs and QALYs (Doull et al., 2007). The relationship between mean per centsymptom‐free days and mean costs and QALYs was assumed to be identical for each treatment. In the ‘trial’based analysis, mean costs and symptom‐free days were estimated for each treatment arm included in a singletrial. (Sullivan et al., 2005)
In some cases, it may not be possible to obtain estimates of the final decision endpoints for all treatmentoptions within a direct trial‐based analysis. For example, it may be impracticable to encompass the relevanttime horizon for a decision‐maker, such as a patient’s lifetime, within a clinical trial, or there may not be anavailable trial that includes all relevant treatment options. In these cases, an indirect model‐based analysis willbe necessary (Buxton et al., 1997; Sculpher et al., 2006).
Where there are no trials available that include all relevant treatment options, an indirect comparison basedon the available trial evidence may be helpful. Although indirect comparisons could in principle be based onthe final cost and effect endpoints, they are more usually applied to surrogate endpoints. Indirect comparisonsrequire the assumption that treatment effects are exchangeable across trials, and this assumption is more likelyto be met for surrogate endpoints than for final endpoints: the causal path between treatment and finalendpoints will be longer than the path between treatment and surrogate endpoints, and as the causal pathlengthens, there is increasing opportunity for differences between trials to modify relative treatment effects andpotentially confound indirect comparisons. For example, the effects of asthma treatments on forced expiratoryvolume in 1 s may be similar across different countries, but the effects on mortality may well be influenced bylocal medical practise. These differences may bias indirect comparisons based on mortality. This source ofpotential bias will be a particular concern for cost endpoints.
However, balanced against the ‘length’ of the causal pathway and the scope for confounding, we shouldconsider the scope for error in the measurement of surrogate endpoints. For example, if the methods used tomeasure forced expiratory volume in 1 s are not standardised between trials, differences in measurementbetween trials, particularly systematic differences between trials comparing different sets of treatments, mayconfound indirect comparisons. In contrast, the methods used to assess final endpoints, such as death, may bemore consistent.
Although indirect model‐based analysis via surrogate endpoints can be helpful (and some would argueessential) in meeting the needs of decision‐makers, they require the assumption that all the important effectsof treatment on the final decision endpoints are mediated, or predicted, by the surrogate endpoints. In otherwords, if we condition on the surrogate endpoints, the final decision endpoints are independent of treatmentchoice—a form of conditional independence. For example, in our example asthma model, mean costs (otherthan the treatment acquisition cost) and QALYs will depend only on estimated symptom‐free days and noton treatment.
If this assumption of conditional independence is not warranted, including only those effects of treatmentthat are mediated by surrogate endpoints may lead to biased estimates of mean costs and QALYs and also theunderestimation of uncertainty. For example, CD4+ counts have been used as a surrogate for survival in HIV
Copyright © 2011 John Wiley & Sons, Ltd. Health Econ. (2011)DOI: 10.1002/hec

SURROGATES, META‐ANALYSIS AND COST‐EFFECTIVENESS MODELLING
trials. Although certain drugs improve CD4+ count, and CD4+ count is a good measure of survival, otheradverse effects of these drugs may actually reduce survival (Ellenberg, 1994). In this instance, the CD4+ countsurrogate does not reliably capture the effect of treatment on final endpoint (Fleming and DeMets, 1996). Areliance on surrogate endpoints may lead to the effect of inappropriate adoption decisions being compoundedas the value of future research is underestimated.
The strong assumptions embedded in model‐based analysis create a tension between the desire to include awide range of treatment options (and information) and the concerns as to the validity of the resulting estimates.On occasion, these concerns may lead to a direct trial‐based analysis with a narrow scope and evidence basebeing preferred over a broader indirect model‐based analysis.
Some clinical trials include measures of both surrogate and final decision endpoints. In this paper, wedemonstrate how data from these trials can be used in an analysis that combines both direct ‘trial’ based andindirect ‘model’ based approaches. Vis‐à‐vis, direct information regarding the effect of treatment on the finaldecision endpoints and indirect information regarding the effect of treatment on surrogate endpoints arecombined within a joint analysis. This joint approach allows the inclusion of information regarding surrogateendpoints while relaxing the strong assumptions of conditional independence associated with indirect model‐based analyses.
The remainder of this paper is structured as follows. Section 2 presents the motivating example of theChronic Disease Self‐Management Programme (CDSMP). Section 3 outlines the direct, indirect and jointmodels developed for the motivating example. Section 4 reports the results and compares and contrasts thefindings from the three analytic approaches. We show in this example that, despite being based on a commonset of trial data, the three methods of analysis potentially lead to different decisions regarding the adoption ofCDSMP and the value of further research. Section 5 includes a description of the underlying assumptions foreach method of analysis and considers how the most appropriate method might be selected. Section 6concludes the paper.
2. EXAMPLE: CHRONIC DISEASE SELF‐MANAGEMENT PROGRAMME
Recently, interventions to support patients in their self‐care of chronic diseases have been developed. Anexample is CDSMP, which has been developed in the US. This forms the basis of the Expert PatientProgramme, a peer‐led self‐management programme that has recently been rolled out throughout the UK andwill be available to 100 000 individuals with chronic conditions by the year 2012 (Department of Health, 2006).
The CDSMP intervention is designed to increase patients’ level of self‐efficacy, defined as their confidencein their ability to manage their condition (Bandura, 1977). It is hypothesised that improving patients’ self‐efficacy will lead to improvements in health outcomes (Lorig et al., 2001a; Lorig et al., 2003). The decisionproblem is to determine whether the addition of the CDSMP programme to current treatment is cost‐effectiveand should be adopted and also whether further research should be required or commissioned.
2.1. Available data
The systematic procedure used to identify the data is described elsewhere (Richardson, 2007). Individualpatient data (IPD) were available from two UK randomised trials comparing the CDSMP intervention with ‘nointervention’ (Griffiths et al., 2005; Richardson, 2007). For these trials, the final decision endpoints of QALYsand total costs (over a 6‐month period) were estimated. These trials also included measurement of the surrogateendpoint self‐efficacy and a covariable, baseline EuroQol‐5D (EQ‐5D).
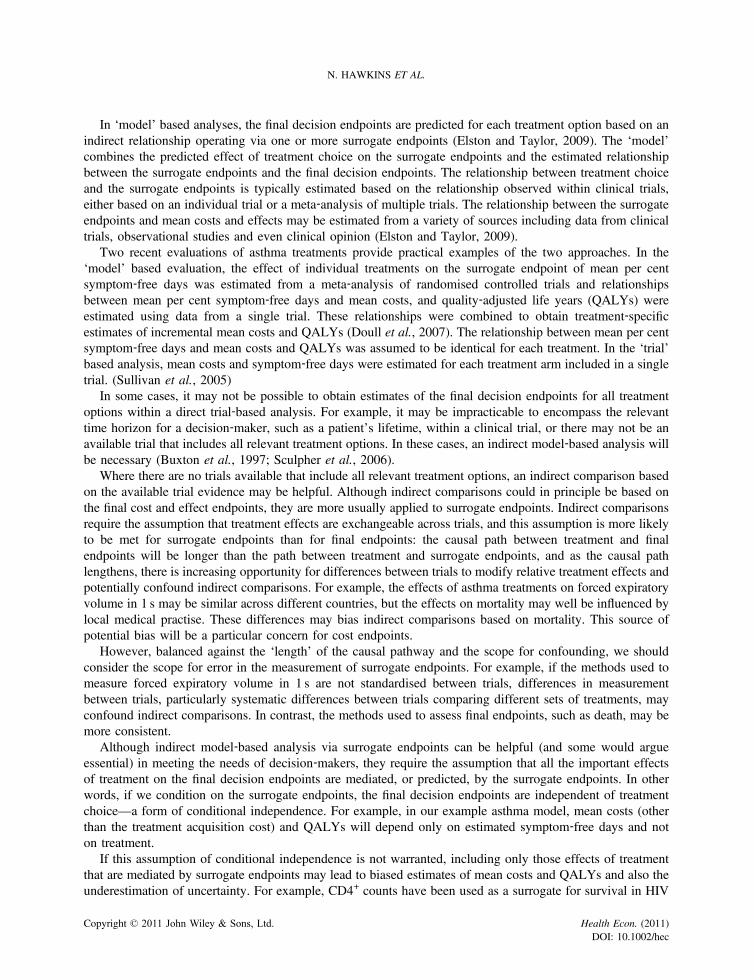
In addition, six non‐UK randomised trials were identified that compared CDSMP (or similar) with ‘nointervention’ (Richardson, 2007; Richardson et al., 2005). For these trials, only summary statistics for theeffect of treatment on the surrogate endpoint (self‐efficacy) were available. Henceforth, these are referred to asthe ‘additional surrogate’ data. Details of all included trials are provided in the Table I.
Copyright © 2011 John Wiley & Sons, Ltd. Health Econ. (2011)DOI: 10.1002/hec
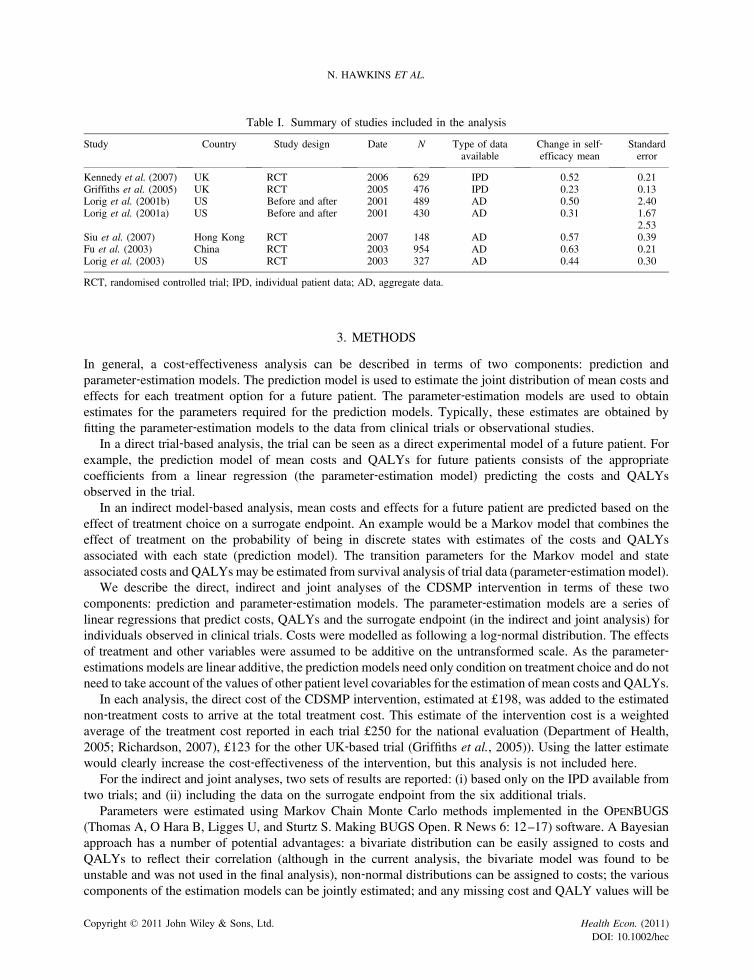
Table I. Summary of studies included in the analysis
Study Country Study design Date N Type of dataavailable
Change in self‐efficacy mean
Standarderror
Kennedy et al. (2007) UK RCT 2006 629 IPD 0.52 0.21Griffiths et al. (2005) UK RCT 2005 476 IPD 0.23 0.13Lorig et al. (2001b) US Before and after 2001 489 AD 0.50 2.40Lorig et al. (2001a) US Before and after 2001 430 AD 0.31 1.67
2.53Siu et al. (2007) Hong Kong RCT 2007 148 AD 0.57 0.39Fu et al. (2003) China RCT 2003 954 AD 0.63 0.21Lorig et al. (2003) US RCT 2003 327 AD 0.44 0.30
RCT, randomised controlled trial; IPD, individual patient data; AD, aggregate data.
N. HAWKINS ET AL.
3. METHODS
In general, a cost‐effectiveness analysis can be described in terms of two components: prediction andparameter‐estimation models. The prediction model is used to estimate the joint distribution of mean costs andeffects for each treatment option for a future patient. The parameter‐estimation models are used to obtainestimates for the parameters required for the prediction models. Typically, these estimates are obtained byfitting the parameter‐estimation models to the data from clinical trials or observational studies.
In a direct trial‐based analysis, the trial can be seen as a direct experimental model of a future patient. Forexample, the prediction model of mean costs and QALYs for future patients consists of the appropriatecoefficients from a linear regression (the parameter‐estimation model) predicting the costs and QALYsobserved in the trial.
In an indirect model‐based analysis, mean costs and effects for a future patient are predicted based on theeffect of treatment choice on a surrogate endpoint. An example would be a Markov model that combines theeffect of treatment on the probability of being in discrete states with estimates of the costs and QALYsassociated with each state (prediction model). The transition parameters for the Markov model and stateassociated costs and QALYs may be estimated from survival analysis of trial data (parameter‐estimation model).
We describe the direct, indirect and joint analyses of the CDSMP intervention in terms of these twocomponents: prediction and parameter‐estimation models. The parameter‐estimation models are a series oflinear regressions that predict costs, QALYs and the surrogate endpoint (in the indirect and joint analysis) forindividuals observed in clinical trials. Costs were modelled as following a log‐normal distribution. The effectsof treatment and other variables were assumed to be additive on the untransformed scale. As the parameter‐estimations models are linear additive, the prediction models need only condition on treatment choice and do notneed to take account of the values of other patient level covariables for the estimation of mean costs and QALYs.
In each analysis, the direct cost of the CDSMP intervention, estimated at £198, was added to the estimatednon‐treatment costs to arrive at the total treatment cost. This estimate of the intervention cost is a weightedaverage of the treatment cost reported in each trial £250 for the national evaluation (Department of Health,2005; Richardson, 2007), £123 for the other UK‐based trial (Griffiths et al., 2005)). Using the latter estimatewould clearly increase the cost‐effectiveness of the intervention, but this analysis is not included here.
For the indirect and joint analyses, two sets of results are reported: (i) based only on the IPD available fromtwo trials; and (ii) including the data on the surrogate endpoint from the six additional trials.
Parameters were estimated using Markov Chain Monte Carlo methods implemented in the OPENBUGS(Thomas A, O Hara B, Ligges U, and Sturtz S. Making BUGS Open. R News 6: 12–17) software. A Bayesianapproach has a number of potential advantages: a bivariate distribution can be easily assigned to costs andQALYs to reflect their correlation (although in the current analysis, the bivariate model was found to beunstable and was not used in the final analysis), non‐normal distributions can be assigned to costs; the variouscomponents of the estimation models can be jointly estimated; and any missing cost and QALY values will be
Copyright © 2011 John Wiley & Sons, Ltd. Health Econ. (2011)DOI: 10.1002/hec

SURROGATES, META‐ANALYSIS AND COST‐EFFECTIVENESS MODELLING
sampled from the posterior distribution. All the BUGS code used to fit the models described in the followingtext is available from the first author on request.
3.1. Direct analysis
In the descriptions that follow, the J trials for which individual patient data are available are indexed by subscriptj ( j= 1 …. . J), and the Ij individual subjects within the jth trial are indexed by the subscript i (i = 1 . . Ij).
The individual patient QALY data from each subject in each trial (qi, j) are assumed to be normallydistributed:
qi;j eN μqi; j ;σ2qj
� �i ¼ 1:…Ij; j ¼ 1:…J (1)
The variance (σ2qj) is allowed to vary between trials.
The expected QALYs for each subject (μqi;j ) are estimated as a linear regression including a study‐specificintercept (α qj ), treatment indicator (Ti, j) and the covariable baseline EQ‐5D (Ei; j ). βq is the regressioncoefficient associated with the treatment effect, and hence provides the average difference in QALYs betweenEEP and control interventions:
μqi; j ¼ αqj þ βqTi;j þ δqEi; j i ¼ 1:…Ij; j ¼ 1:…J (2)
The individual patient cost data (ci, j) are assumed to follow a log‐normal distribution (with treatment andother variables having an additive effect on mean cost):
log ci; j� � eN μci; j−
σ2cj
2;σ2
cj
!i ¼ 1:…Ij; j ¼ 1:…J (3)
Again, note the variance of the costs (σ2cj ) is allowed to vary between trials. The expected costs for each
subject (μci; j ) are estimated in a similar regression to the one used for QALYs; only now the subscript cindicates that the parameters refer to cost. Note in this example, the same covariable (baseline EQ‐5D) isspecified, but alternative covariables could be included.
μci; j ¼ αci þ βcTi;j þ δcEi;j i ¼ 1:…Ij; j ¼ 1:…J (4)
Here, the coefficient of primary interest is βc, which is the regression coefficient associated with the meandifference in cost between treatment arms.
The predicted incremental mean QALYs (Δq) and costs (Δc) for a future patient receiving CDSMP are thenassumed to equal the value of the costs and QALY treatment coefficients:
Δq = βq
Δc = βc3.2. Indirect analysis
The individual subject data on the surrogate, Si, j are assumed to be normally distributed with mean μsi; jandtrial‐specific variance σ2
sj :
Si;j eN μsi; j ;σ2sj
� �i ¼ 1:…Ij; j ¼ 1:…J (5)
The mean effects, μsi; j , are predicted in a linear regression including a study‐specific intercept, treatmentindicator and other covariables.
μsi; j ¼ αs;j þ βsTi;j þ δsEi;j i ¼ 1:…Ij; j ¼ 1:…J (6)
Copyright © 2011 John Wiley & Sons, Ltd. Health Econ. (2011)DOI: 10.1002/hec

N. HAWKINS ET AL.
The individual subject QALY and cost data are included using the likelihood functions given in Equations(1) and (3), respectively.
In the indirect analysis, QALYs for each subject are estimated as a linear regression similar to Equation butare dependent on the surrogate endpoint (Si, j)—level of self‐efficacy—rather than the treatment indicator:
μqi; j ¼ αqj þ γqSi;j þ δqEi;j i ¼ 1:…Ij; j ¼ 1:…J (7)
where γq is the regression coefficient, which estimates the mean change in QALYs for each unit change in thesurrogate endpoint.
Equation (4) is similarly modified for the indirect analysis:
μci; j ¼ αcj þ γcSi;j þ δcEi; j i ¼ 1:…Ij; j ¼ 1:…J (8)
where γc is the regression coefficient, which estimates the mean change in costs for each unit change in thesurrogate endpoint. These two parameter‐estimation models do not include terms for the effect of treatment oncosts and QALYs as the treatment effect is captured solely via its effect on the surrogate endpoint.
In a second analysis, data from the k= 1…K additional surrogate data trials reporting the mean difference inthe surrogate endpoint between trial arms, ΔSk, and its associated variance, s2k can be included using thefollowing likelihood function:
Δ�Sk eN βs; s
2k
� �: k ¼ 1…K (9)
Note that the mean of this normal distribution, βs, is the same parameter as in Equation (6). Differentlikelihood functions, which contain common parameters have been used recently in other contexts (Jacksonet al., 2006; Sutton et al., 2008) for synthesising individual and aggregate data.
The predicted incremental mean costs and QALYs for a future patient are then estimated as the productsof the effect of treatment on the surrogate endpoint and the effect of the surrogate endpoint on costs andQALYs:
10)
Δc= βs. γc (Δq = βs. γq (11)
3.3. Joint analysis
The joint analysis is a combination of the direct and indirect analyses. The likelihoods for costs, QALYs andsurrogate outcomes are specified as before (Equations (1), (3) and (5)). Like the indirect model, the surrogateendpoint is predicted in a linear regression including a treatment indicator (Equation (6)).
QALYs and costs for each subject are estimated as linear regressions; this time including both the surrogateendpoint and the treatment indicator.
μqi; j ¼ αqj þ βqTi;j þ γqSi;j þ δqEi;j i ¼ 1:…Ij; j ¼ 1:…J (10)
μci; j ¼ αcj þ βcTi;j þ γcSi;j þ δcEi;j i ¼ 1:…Ij; j ¼ 1:…J (11)
Again, an additional analysis was conducted including the additional surrogate data as per the indirectanalysis.
The predicted incremental mean costs and QALYs for a future patient are then estimated as the effect of thesurrogate endpoint on costs and QALYs (γc and γq) plus the product of the effect of treatment on the surrogateendpoint (βs) and the effect of the surrogate endpoint on costs and QALYs (γc and γq):
(12)
(13)
4)
5)
Δc = βc + βs. γc
Δq= βq + βs. γq
(1
(1
Copyright © 2011 John Wiley & Sons, Ltd. Health Econ. (2011)DOI: 10.1002/hec

Table II. Comparison of the three analytic approaches
Analysis
Direct Indirect Joint
Within‐study parameter‐estimation model
μci; j ¼ αcj þ βcTi; j þ δcEi; j
μqi; j ¼ αqj þ βqTi; j þ δqEi; j
μci; j ¼ αcj þ γcSi; j þ δcEi; j
μqi; j ¼ αqj þ γqSi; j þ δqEi; j
μci; j ¼ αcj þ γcSi; j þ δcEi; j
μci; j ¼ αcj þ βcTi; j þ γcSi; j þ δcEi; j
μqi; j ¼ αqj þ βqTi; j þ γqSi; j þ δqEi; j
μci; j ¼ αcj þ γ cSi; j þ δcEi; j
Likelihood‐IPD log ci; j� � eN μci; j−
σ2cj2 ;σ2
cj
� �qi; j eN μqi; j ;σ
2qj
� � log ci; j� � eN μci; j−
σ2cj
2 ;σ2cj
� �qi; j eN μqi; j ;σ
2qj
� �Si; j eN μsi; j ;σ
2sj
� �log ci; j� � eN μci; j−
σ2cj2 ;σ2
cj
� �qi; j eN μqi; j ;σ
2qj
� �Si; jeN μsi; j ; σ
2sj
� �Likelihood‐summary statistics
ΔSk eN βs; s2k� � ΔSk eN βs; s
2k
� �Out‐of‐study prediction model Δq= βqΔc= βc Δq= βs.γqΔc= βs. γc Δq= βq + βs. γqΔc= βc + βs.γc
Constraints Data on surrogate endpointsis not relevant and cannotbe incorporated (γc, γq = 0)
Costs and QALYs areconditionally independentof treatment given self‐efficacy (βc, βq = 0)
None. Data on surrogate endpointscan be incorporated without implicitassumption that costs and QALYs areconditional independent of treatmentgiven self‐efficacy
IPD, individual patient data; QALYs, quality‐adjusted life years.
SURROGATES, META‐ANALYSIS AND COST‐EFFECTIVENESS MODELLING
All three models are summarised in Table II.If sufficient data had been available, particularly multiple trials including surrogate and final endpoints,
other model specifications could have been compared. For example, the relationship between surrogate andfinal endpoints could be modelled as a random effect to account for the heterogeneity between trials.
4. RESULTS
The estimated incremental cost‐effectiveness ratio (ICER), cost‐effectiveness acceptability curves (CEAC) andexpected value of perfect information (EVPI) are compared for each analytic approach. The subsequentimplications for recommendations regarding treatment adoption and the need for further research are described(Barton et al., 2009).
4.1. Cost‐effectiveness
The estimated regression coefficients and their 95% CI1 for each of the analyses are shown in Table III.The direct analysis indicates that CDSMP treatment is associated with higher non‐treatment costs (£63) and
QALYs (0.009) than no intervention. Including the treatment cost, the direct analysis gives an ICER of£29 311.
The indirect analysis indicates that the CDSMP programme is associated with an increase in patient‐reported self‐efficacy (0.377) and that increased self‐efficacy is in turn associated with decreased non‐treatmentcosts (£−11 per unit change) and increased QALYs (0.009 per unit change). When these are combined,CDSMP treatment is associated with lower non‐treatment costs (£−4) and higher QALYs (0.003) than nointervention leading to an ICER of £55 644 when the treatment cost is included.
In the joint analysis, the CDSMP programme is associated with an increase in patient‐reported self‐efficacy(0.365), and increased self‐efficacy is associated with lower non‐treatment costs (£−11 per unit change) and
1Analogous to the usual interpretation of a frequentist CI.
Copyright © 2011 John Wiley & Sons, Ltd. Health Econ. (2011)DOI: 10.1002/hec
Table
III.
Results
Analysis
Direct
Indirect
Joint
Indirect+additio
naldata
Joint+
additio
naldata
Mean
(95%
CI)
Mean
(95%
CI)
Mean
(95%
CI)
Mean
(95%
CI)
Mean
(95%
CI)
Regressioncoefficients
Costson
treatm
ent(β
c)63
20,105
6525,103
6422,106
QALYson
treatm
ent(β
q)
0.009
0.000,
0.018
0.007
−0.003,0.016
0.007
−0.002,0.016
Costson
self‐efficacy(γ
c)−1
1−2
0,−3
−11
−20,
−2−1
1−2
0,−3
−11
−20,
−2QALYson
self‐efficacy(γ
q)
0.009
0.007,
0.011
0.009
0.007,
0.011
0.009
0.007,
0.012
0.009
0.007,
0.011
Self‐efficacy
ontreatm
ent(β
s)0.38
0.07,0.67
0.37
0.08,0.64
0.43
0.33,0.53
0.43
0.33,0.53
Increm
entalnon‐treatm
entcosts
6320,105
−4
−10,
060
20,99
−5−9
,−1
59−1
7,101
Increm
entaltotalcost
261
218,
303
194
188,
198
258
218,
297
193
189,
197
257
215,
299
Increm
entalQALYs
0.009
0.000,
0.018
0.003
0.001,
0.007
0.01
0.001,
0.020
0.004
0.003,
0.005
0.011
0.002,
0.019
ICER(£
perQALY)
29300
55600
25800
48800
24100
Probabilitythat
EPPisoptim
umat
acost‐effectiv
enessthresholdof
£30000
0.52
0.03
0.61
0.00
0.67
EVPIat
acost‐effectiv
enessthreshold
of£30000(£)
104
183
059
QALYs,quality
‐adjustedlifeyears;ICER,increm
entalcost‐effectiv
enessratio
;EPP,
expertpatientsprogramme;
EVPI,expected
valueof
perfectinform
ation.
N. HAWKINS ET AL.
Copyright © 2011 John Wiley & Sons, Ltd. Health Econ. (2011)DOI: 10.1002/hec
SURROGATES, META‐ANALYSIS AND COST‐EFFECTIVENESS MODELLING
increased QALYs (0.009 per unit change). In addition, independent of the effects mediated through self‐efficacy, CDSMP treatment is associated with higher non‐treatment costs (£65) and QALYs (0.007) than nointervention. Including the treatment cost gives an ICER of £25 786.
The incorporation of additional surrogate data into the indirect and joint analyses increases the estimatedmean increase in self‐efficacy associated with CDSMP from 0.35 to 0.428. This reduces the ICER in theindirect analysis to £48 760 and in the joint analysis to £24 064.
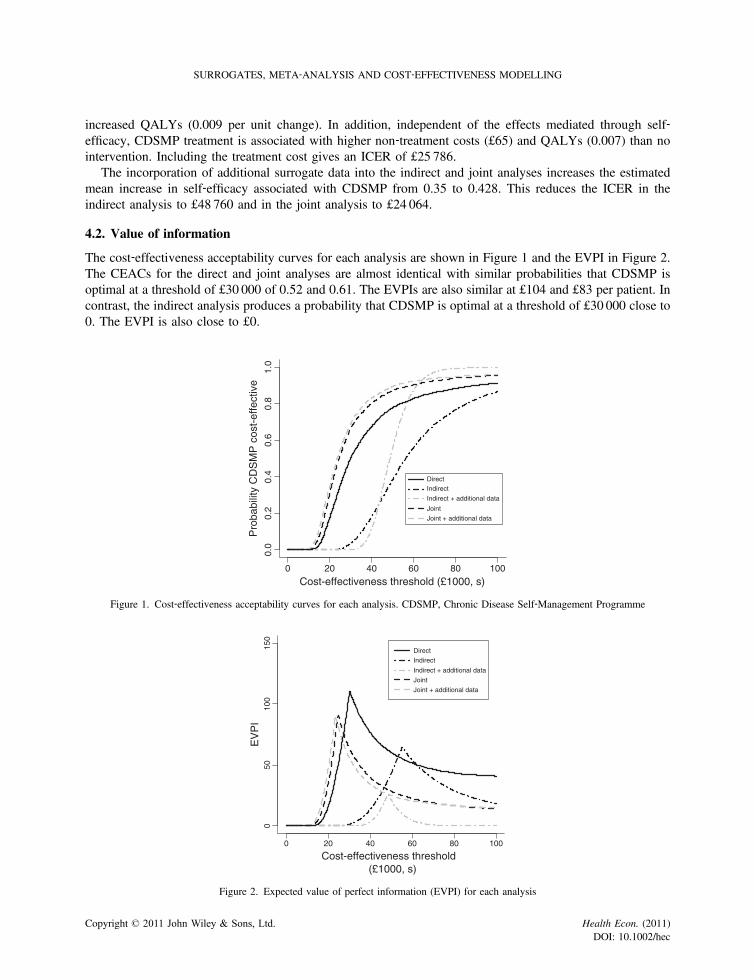
4.2. Value of information
The cost‐effectiveness acceptability curves for each analysis are shown in Figure 1 and the EVPI in Figure 2.The CEACs for the direct and joint analyses are almost identical with similar probabilities that CDSMP isoptimal at a threshold of £30 000 of 0.52 and 0.61. The EVPIs are also similar at £104 and £83 per patient. Incontrast, the indirect analysis produces a probability that CDSMP is optimal at a threshold of £30 000 close to0. The EVPI is also close to £0.
0 20 40 60 80 100
0.0
0.2
0.4
0.6
0.8
1.0
Cost-effectiveness threshold (£1000, s)
Pro
babi
lity
CD
SM
P c
ost-
effe
ctiv
e
DirectIndirect
Indirect + additional data
Joint
Joint + additional data
Figure 1. Cost‐effectiveness acceptability curves for each analysis. CDSMP, Chronic Disease Self‐Management Programme
0 20 40 60 80 100
050
100
150
Cost-effectiveness threshold(£1000, s)
EV
PI
Direct
Indirect
Indirect + additional data
Joint
Joint + additional data
Figure 2. Expected value of perfect information (EVPI) for each analysis
Copyright © 2011 John Wiley & Sons, Ltd. Health Econ. (2011)DOI: 10.1002/hec

N. HAWKINS ET AL.
The incorporation of additional surrogate data shifts the CEACs for both the indirect and joint analysis tothe left, reflecting the effect of the increased estimate of the effect of CDSMP on self‐efficacy, and thereforeimproves estimates of cost‐effectiveness. For the joint model, the probability that CDSMP is optimal increasesto 0.67, and the EVPI reduces to £59. For the indirect model, the probability that CDSMP is optimal and theEVPI remain close to 0.
4.3. Likely recommendations
The value of a QALY is open to some debate. However, the National Institute for Health and ClinicalExcellence (NICE) have suggested a threshold for the cost per QALY of between £20 000 and £30 000. (NICE,2004) Interventions with a cost per QALY below £20 000 are likely to be judged as an acceptable use of theNational Health Service resources, whereas those above £30 000 require strong additional evidence of, forexample, wider societal costs/benefits. If we use the higher end of this range and assume an acceptable cost‐effectiveness threshold of £30 000, a decision‐maker making adoption decisions based on current data alonewould adopt CDSMP based on the direct and joint analyses but would reject it based on the indirect analysis.Based on the joint or direct analysis, a decision‐maker who was also concerned with need for furtherinformation might commission further research or make the adoption of CDSMP conditional in some way onthe conduct of further research. Based on the indirect analysis, the decision‐maker would decide that there is novalue in future research.
5. DISCUSSION
We have shown that given a common dataset, comprising the two trials for which IPD was available, the directtrial‐based and indirect model‐based analyses lead to different recommendations regarding the adoption ofCDSMP and the need for further research. Under the direct trial‐based analysis, CDSMP would be deemedpossibly cost‐effective and further research of potential value, whereas under the indirect model‐basedanalysis, CDSMP would be deemed not cost‐effective and further research of little value. The conflictingresults were due to the effects of treatment on costs and QALYs that were independent of the effects mediatedby the surrogate endpoint. In addition, we showed that a wider body of trial data regarding the effect oftreatment on the surrogate could be included in the indirect model‐based analysis.
We also presented results from a joint analysis that combined the independent effects of treatment on costsand QALYs, treatment on surrogate endpoint, and surrogate endpoint on costs and QALYs. This analysisproduced similar results to the direct trial‐based analysis. Like the indirect model‐based analysis, it allowed theinclusion of additional data regarding the surrogate endpoint but did not require a strong assumption ofconditional independence.
Given the conflicting results between the different analytic approaches, which is most appropriate?—weconsider the advantages and disadvantages of each.
5.1. Advantages and disadvantages
The direct trial‐based approach is simple, being based on the empirical relationship between treatment and finalendpoints. However, a disadvantage of this approach is that additional data on surrogate endpoints cannot beincorporated. Although in principle, multiple trials could be combined in a direct trial‐based analysis, this israrely carried out in practise, and the methodology has been little discussed.
The indirect approach has the advantage that data from trials reporting surrogate outcomes can beincorporated, commonly allowing a wider range of data to be included. This may be necessary to allow theinclusion of relevant comparators. However, the drawback of this approach is the implicit assumption that ifwe know the value of the surrogate endpoint for an individual, the expected costs and effects are conditionallyindependent of treatment. In other words, the surrogate endpoint, within the model structure, provides all the
Copyright © 2011 John Wiley & Sons, Ltd. Health Econ. (2011)DOI: 10.1002/hec

SURROGATES, META‐ANALYSIS AND COST‐EFFECTIVENESS MODELLING
information required to inform the adoption and research decisions. Although if this assumption is valid, theindirect model‐based analysis will lead to increased precision over a direct trial‐based analysis (Day andDuffy, 1996).
The joint model includes data on both surrogate and final endpoints and does not require the conditionalindependence assumption of the indirect model. It will capture effects of the treatment on final endpoints notmediated by the surrogate or included in the model structure. However, it does require the availability of trialsincluding both the surrogate and final endpoints.
5.2. The role of hypothesis testing
Both the indirect and direct models can be seen as special cases of the joint model. In the direct model, theindependent effects of treatment on costs and QALYs mediated by the surrogate endpoint are not explicitlyincluded (γc and γq are constrained to zero, see Table II). However, these effects will be captured by the βc andβq coefficients. In the indirect model, the effects of treatment on costs and QALYs independent of the surrogateendpoint are not included (βc and βq are constrained to zero) and will not be captured by the analysis.
This relationship between the direct and the indirect models suggests a role for hypothesis testing to inferwhich model is appropriate. A test suggesting that the true values of βc and βq, from the joint analysis are zerowould support the adoption of the indirect model. This should be an equivalence test of the alternate hypothesis(H1) that βc or βq lie in an acceptable range. However, if the acceptable range selected for this equivalence testis narrow, there will be little difference anyway between the results of the joint and indirect analyses (ifselected). If a test of non‐equivalence is used rather than a test of equivalence, an indirect model may be adoptedwhen there is little data because of lack of power to reject the null hypothesis (even though βc and βq deviatemarkedly from zero) and rejected when there are large amounts of data (even though βc and βq are close to zero).
5.3. Conceptual models
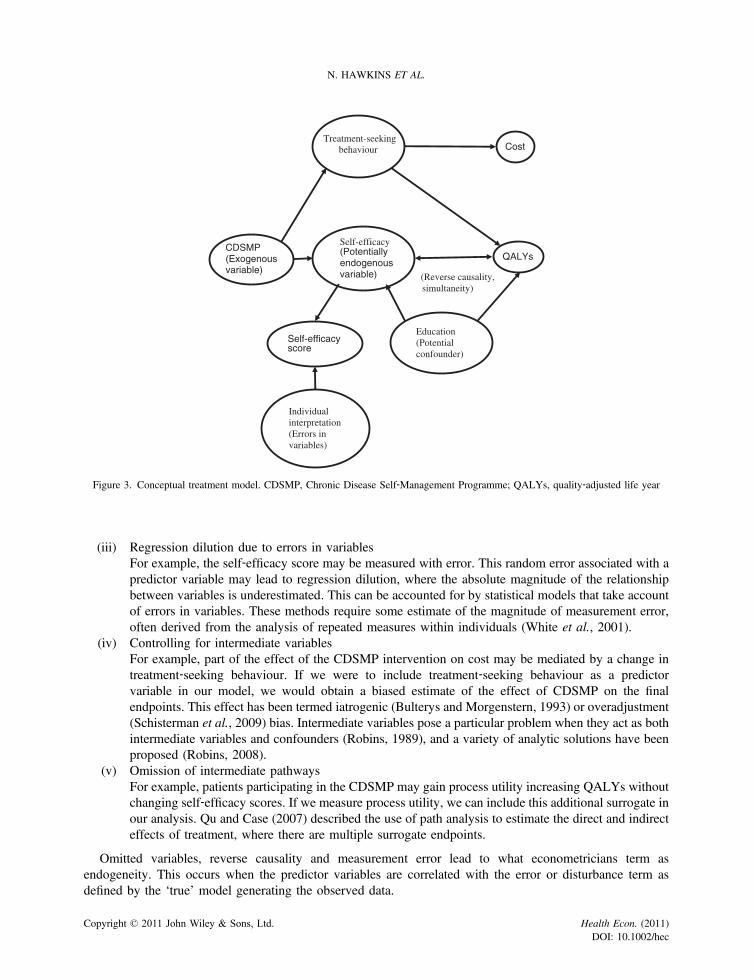
Rather than relying on blind hypothesis testing, it may be more useful to develop a conceptual model mappingthe causal pathway from treatment choice to final endpoints to assess adequacy of the surrogate endpoints inrepresenting the important effects of treatment on the final endpoints (Fleming and DeMets, 1996; Greenlandet al., 1999).
An example conceptual model of the effects of CDSMP on costs and QALYs is shown in Figure 3.This indicates that there may be important effects of CDSMP on the final endpoints that are not capturedby the surrogate endpoint of self‐efficacy. The development of a conceptual model at the start of themodelling process also reduces the risk of the availability of data inappropriately defining the analysis(Sculpher et al., 2000).
The development of a conceptual model might also be useful in identifying potential sources of bias in theregression modelling (VanderWeele et al., 2008; Hernán et al., 2002). Some of the potential sources of bias areillustrated using our example conceptual model:
(i) Confounding due to omitted variablesFor example, education level may influence both the treatment‐seeking behaviour and the self‐efficacyscore leading the self‐efficacy score to be endogenous (a variable that is related to and determined byother variables in the model). If this variable is not included in the analysis, the resulting confoundingmay lead to a biased estimate of the predictive relationship between the self‐efficacy score and costsand QALYs.
(ii) Reverse causality or simultaneityFor example, subjects experiencing greater quality of life because of exogenous factors may alsorecord higher self‐efficacy scores. Reverse causality can lead to biased estimate of the predictiverelationship between variables. The effects of reverse causality can be accounted for using approachessuch as structural modelling and G‐estimation (Flanders and Augestad, 2008).
Copyright © 2011 John Wiley & Sons, Ltd. Health Econ. (2011)DOI: 10.1002/hec
CDSMP(Exogenousvariable)
Self-efficacyscore
QALYs
Self-efficacy(Potentiallyendogenousvariable)
Individualinterpretation(Errors invariables)
CostTreatment-seeking
behaviour
Education(Potentialconfounder)
(Reverse causality, simultaneity)
Figure 3. Conceptual treatment model. CDSMP, Chronic Disease Self‐Management Programme; QALYs, quality‐adjusted life year
N. HAWKINS ET AL.
(iii) Regression dilution due to errors in variablesFor example, the self‐efficacy score may be measured with error. This random error associated with apredictor variable may lead to regression dilution, where the absolute magnitude of the relationshipbetween variables is underestimated. This can be accounted for by statistical models that take accountof errors in variables. These methods require some estimate of the magnitude of measurement error,often derived from the analysis of repeated measures within individuals (White et al., 2001).
(iv) Controlling for intermediate variablesFor example, part of the effect of the CDSMP intervention on cost may be mediated by a change intreatment‐seeking behaviour. If we were to include treatment‐seeking behaviour as a predictorvariable in our model, we would obtain a biased estimate of the effect of CDSMP on the finalendpoints. This effect has been termed iatrogenic (Bulterys and Morgenstern, 1993) or overadjustment(Schisterman et al., 2009) bias. Intermediate variables pose a particular problem when they act as bothintermediate variables and confounders (Robins, 1989), and a variety of analytic solutions have beenproposed (Robins, 2008).
(v) Omission of intermediate pathwaysFor example, patients participating in the CDSMP may gain process utility increasing QALYs withoutchanging self‐efficacy scores. If we measure process utility, we can include this additional surrogate inour analysis. Qu and Case (2007) described the use of path analysis to estimate the direct and indirecteffects of treatment, where there are multiple surrogate endpoints.
Omitted variables, reverse causality and measurement error lead to what econometricians term asendogeneity. This occurs when the predictor variables are correlated with the error or disturbance term asdefined by the ‘true’ model generating the observed data.
Copyright © 2011 John Wiley & Sons, Ltd. Health Econ. (2011)DOI: 10.1002/hec

SURROGATES, META‐ANALYSIS AND COST‐EFFECTIVENESS MODELLING
One technique used to correct for endogeneity is instrumental variable analysis. An instrumental variable isa factor associated with exposure to an intervention but independent of other factors associated with exposureand associated with outcomes only via its association with exposure (an assumption known as the ‘exclusionrestriction’). Indeed, the presence of endogeneity can be tested statistically using the Durbin–Wu–Hausmantest (Hausman, 1978), which compares instrumental variable and ordinary least squares estimates.
In a well‐designed randomised controlled trial, treatment allocation satisfies these requirements because it israndom and therefore independent of the characteristics of participants. Estimates from the analysis of arandomised trial or the corresponding results of the direct modelling will therefore not be subject to the biasespreviously listed, whereas the results of an indirect analysis may be. In a joint analysis, the effects of the biaseslisted previously will be captured in the term describing the direct relationship between treatment and costs andQALYs. However, estimates from an indirect model will be biased if the relationship between the surrogateand the final endpoints are subject to the biases previously mentioned.
5.4. Assessment of surrogate endpoints
The decision to adopt an indirect model‐based analysis requires a judgement as to the adequacy of thesurrogate endpoints included. A number of quantitative measures and qualitative criteria describing the validityof surrogate endpoints have been suggested.
Quantitative measures include the Prentice criteria (Prentice, 1989) (the conditional distribution of thefinal endpoint given the surrogate endpoint alone is the same as the conditional distribution of the clinicaloutcome given the surrogate marker and treatment), the proportion of treatment effect explained by a singlesurrogate (Freedman et al., 1992) or relative effect (Buyse and Molenberghs, 1998). Interestingly, like thejoint analyses presented in this paper, they are based on analysis of data sets including both the surrogate andfinal endpoints.
Qualitative criteria have been described by Bucher et al. (1999) and Elston and Taylor (2009). Bucher et al.(1999) suggested a number of criteria for determining whether a surrogate end point should be used as the basisfor decision‐making. Bucher suggested that in addition to a strong, independent and consistent associationbetween the surrogate and final endpoints, there should be either evidence from randomised trials in either thesame or other drug classes indicating that improvement in the surrogate endpoint has led to improvement in thefinal decision endpoint. In addition, Bucher suggested that the effect on the surrogate should be large, preciseand lasting, and the risk benefit ratio is likely to be in favour of the proposed treatment.
Elston and Taylor (2009) described three levels of evidence: level 1 comprises evidence that treatmenteffects on the surrogate corresponds to effects on the final endpoint arising from clinical trials showing that achange in the surrogate outcome with treatment is associated with a commensurate change in final endpoints;level 2 comprises evidence of consistent relationship between surrogate endpoint and final endpoint arisingfrom observational studies demonstrating an association between the surrogate and final endpoints; and level 3comprises evidence of biological plausibility of the relationship between surrogate and final endpoints arisingfrom pathophysiologic studies and understanding of disease processes.
In general, the literature on surrogacy has focussed on whether the surrogate endpoint can replace the finalendpoints within individual trials for the purposes of inference (Johnson et al., 2006; Weir and Walley, 2006).However, in cost‐effectiveness analysis, we are interested in estimating mean costs and effects for futurepatients based on the available evidence. As such, rather than aspiring to determine whether the final endpointscan be ‘replaced’ by the surrogate endpoints, we should be concerned with estimating what the surrogateendpoint fails to tell us about the final endpoints in addition to what it does tell us.
The joint analysis presented in this paper avoids a ‘take it or leave it’ approach to surrogacy as it ‘weights’the information on a surrogate according to the strength of its relationship to final endpoints. If the surrogatepredicts the majority of the effect of treatment on costs and effects, additional information on the surrogate willhave a large effect on the final estimates; if the surrogate only predicts a small proportion of the effect oftreatment, additional information on the surrogate will have limited impact.
Copyright © 2011 John Wiley & Sons, Ltd. Health Econ. (2011)DOI: 10.1002/hec

N. HAWKINS ET AL.
6. CONCLUSIONS
Where clinical trials do not include final endpoints or all comparators, extrapolation from a surrogate measureof treatment effect to final decision endpoints is a common component of cost‐effectiveness analyses.However, we do need to carefully evaluate whether analysis based on surrogate endpoints will produceunbiased estimates of the expectation and the variance of the final decision endpoints. Paradoxically, as in theexample presented in this paper, the use of poor surrogates can lead to uncertainty being underestimated.Failure to account for uncertainty about the structural form of our analyses and adequacy of our surrogates willbias estimates of the value of further research.
We recommend that wherever possible, clinical trials should include measures of both surrogate and finaldecision endpoints. This will allow a joint analysis that provides useful empirical information about theadequacy of surrogate endpoints. Where trial data including both surrogate and final endpoints are available,these should be used to evaluate the sufficiency of the surrogate endpoint; we advise caution in the use ofhypothesis testing for this. Finally, we recommend the development of a conceptual model as the first stage ofan evaluation.
REFERENCES
Bandura A. 1977. Self‐efficacy: toward a unifying theory of behavioral change. Psychological Review 84: 191–215.Barton GR, Briggs AH, Fenwick EAL. 2009. Optimal cost‐effectiveness decisions: the role of the cost‐effectiveness
acceptability curve (CEAC), the cost-effectiveness acceptability frontier (CEAF), and the expected value of perfectioninformation (EVPI). Volume in Health 11(5): 886–897.
Bower P, Byford S, Barber J, Beecham J, Simpson S, Friedli K, Corney R, King M, Harvey I. 2003. Meta‐analysis of dataon costs from trials of counselling in primary care: using individual patient data to overcome sample size limitations ineconomic analyses. BMJ 326: 1247.
Bucher H, Guyatt GH, Cook DJ, Holbrook A, McAlister F. 1999. Users’ guides to the medical literature: XIX. Applyingclinical trial results. A. How to use an article measuring the effect of an intervention on surrogate end points. JAMA 282:771–778.
Bulterys M, Morgenstern H. 1993. Confounding or intermediate effect? An appraisal of iatrogenic bias in perinatal AIDSresearch. Paediatric and Perinatal Epidemiology 7: 387–394.
Buxton M, Drummond MF, Van Hout B, Prince RL, Sheldon TA, Szucs T, Vray M. 1997. Modelling in economicevaluation: an unavoidable fact of life. Health Economics 6: 217–227.
Buyse M, Molenberghs G. 1998. Criteria for the validation of surrogate endpoints in randomized experiments. Biometrics54: 1014–1029.
Cheng A, Niparko J. 1999. Cost utility of the cochlear implant in adults. Archives of Otolaryngology ‐ Head & NeckSurgery 125: 1214–1218.
Day N, Duffy SW. 1996. Trial design based on surrogate end points–application to comparison of different breast screeningfrequencies. Journal of the Royal Statistical Society. Series A 159: 49–60.
Department of Health. 2005. Self care–A real choice: Self care support–A practical option.Department of Health. 2006. Our health, our care, our say: a new direction for community services.Doull I, Price D, Thomas M, Hawkins N, Stamuli E, Tabberer M, Gosden T, Rudge H. 2007. Cost‐effectiveness of
salmeterol xinafoate/fluticasone propionate combination inhaler in chronic asthma. Current Medical Research andOpinion 23: 1147–1159.
Ellenberg J. 1994. Selection bias in observational and experimental studies. Statistics in Medicine 13: 557–567.Elston J, Taylor RS. 2009. Use of surrogate outcomes in cost‐effectiveness models: a review of United Kingdom health
technology assessment reports. International Journal of Technology Assessment Healthcare 25: 6–13.Flanders W, Augestad LB. 2008. Adjusting for reverse causality in the relationship between obesity and mortality.
International Journal of Obesity (London) 32: S42–S46.Fleming T, DeMets DL. 1996. Surrogate endpoints in clinical trials: are we being misled? Annals of Internal Medicine 125:
605–613.Freedman L, Graubard BI, Schatzkin A. 1992. Statistical validation of intermediate endpoints for chronic diseases.
Statistics in Medicine 11: 167–178.Fu D, Fu H, McGowan P, Shen YE, Zhu L, Yang H, Mao J, Zhu S, Ding Y, Wei Z. 2003. Implementation and quantitative
evaluation of chronic disease self‐management programme in Shanghai, China: randomized controlled trial. Bulletin ofthe World Health Organization 81: 174–182.
Copyright © 2011 John Wiley & Sons, Ltd. Health Econ. (2011)DOI: 10.1002/hec

SURROGATES, META‐ANALYSIS AND COST‐EFFECTIVENESS MODELLING
Greenland S, Pearl J, Robins JM. 1999. Causal diagrams for epidemiologic research. Epidemiology 10: 37–48.Griffiths C, Motlib J, Azad A, Ramsay J, Eldridge S, Feder G, Khanam R, Munni R, Garrett M, Turner A, Barlow J. 2005.
Randomised controlled trial of a lay‐led self‐management programme for Bangladeshi patients with chronic disease.The British Journal of General Practice 55: 831–837.
Hausman JA. 1978. Specification tests in econometrics. Econometrica 46: 1251–1271.Hernán M, Hernández‐Díaz S, Werler MM, MitcheIl AA. 2002. Causal knowledge as a prerequisite for confounding
evaluation: an application to birth defects epidemiology. American Journal of Epidemiology 155: 176–184.Jackson C, Best N, Richardson S. 2006. Improving ecological inference using individual‐level data. Statistics in Medicine
25: 2136–2159.Johnson K, Freemantle N, Anthony D, Lassere MN. 2006. LDL‐cholesterol differences predicted survival benefit in statin
trials by the surrogate threshold effect (STE). Journal of Clinical Epidemiology 62: 328–336.Kennedy A, Reeves D, Bower P, Lee V, Middleton E, Richardson G, Gardner C, Gately C, Rogers A. 2007. The
effectiveness and cost effectiveness of a national lay‐led self care support programme for patients with long‐termconditions: a pragmatic randomised controlled trial. Journal of Epidemiology and Community Health 61: 254–261.
Lorig KR, Ritter P, Stewart AL, Sobel DS, Brown BW, Bandura A, Gonzalez VM, Laurent DD, Holman HR. 2001a.Chronic disease self‐management program: 2‐year health status and health care utilization outcomes. Medical Care 39:1217–1223.
Lorig KR, Sobel DS, Ritter PL, Laurent D, Hobbs M. 2001b. Effect of a self‐management program on patients with chronicdisease. Effective Clinical Practice 4: 256–262.
Lorig KR, Ritter PL Gonzalez VM. 2003. Hispanic chronic disease self‐management: a randomized community‐basedoutcome trial. Nursing Research 52: 361–369.
NICE. 2004. Guide to the methods of technology appraisal. N0515. National Institute for Clinical Excellence: London.Prentice R. 1989. Surrogate endpoints in clinical trials: definition and operational criteria. Statistics in Medicine 8: 431–440.Qu Y, Case M. 2007. Quantifying the effect of the surrogate marker by information gain. Biometrics 63: 958–963.Richardson G. 2007. The cost-effectiveness of interventions to support self care. PhD thesis. University of York, UK.Richardson G, Gravelle H, Weatherly H, Ritchie G. 2005. Cost‐effectiveness of interventions to support self‐care: a
systematic review. International Journal of Technology Assessment in Health Care. 21: 423–432.Robins JM. 1989. The control of confounding by intermediate variables. Statistics in Medicine 8: 679–701.Robins JM. 2008. Causal models for estimating the effects of weight gain on mortality. International Journal of Obesity 32:
S15–S41.Schisterman E, Cole SR, Platt RW. 2009. Overadjustment bias and unnecessary adjustment in epidemiologic studies.
Epidemiology 20: 488–495.Sculpher M, Fenwick E, Claxton K. 2000. Assessing quality in decision analytic cost‐effectiveness models. A suggested
framework and example of application. Pharmacoeconomics 17: 461–477.Sculpher MJ, Claxton K, Drummond M, McCabe C. 2006. Whither trial‐based economic evaluation for health care
decision making? Health Economics 15: 677–687.Siu AM, Chan CC, Poon PK, Chui DY, Chan SC. 2007. Evaluation of the chronic disease self‐management program in a
Chinese population. Patient Education and Counseling 65: 42–50.Sullivan S, Lee TA, Blough DK, Finkelstein JA, Lozano P, Inui TC, Fuhlbrigge AL, Carey VJ, Wagner E, Weiss KB.
2005. A multi‐site randomized trial of the effects of physician education and organizational change in chronic asthmacare: cost‐effectiveness analysis of the Pediatric Asthma Care PORT. Archives of Pediatrics & Adolescent Medicine159: 428–434.
Sutton AJ, Kendrick D, Coupland CAC. 2008. Meta‐analysis of individual‐ and aggregate‐level data. Statistics in Medicine27: 651–666.
VanderWeele T, Hernan MA, Robins JM. 2008. Causal directed acyclic graphs and the direction of unmeasuredconfounding bias. Epidemiology 19: 720–728.
Vanness D, Mullahy J. 2006. Perspectives on Mean‐Based Evaluation of Health Care. In Elgar Companion to HealthEconomics, Jones AM (ed.). Edward Elgar Publishing: Cheltenham.
Weir C, Walley RJ. 2006. Statistical evaluation of biomarkers as surrogate endpoints: a literature review. Statistics inMedicine 25: 183–203.
White I, Frost C, Tokunaga S. 2001. Correcting for measurement error in binary and continuous variables using replicates.Statistics in Medicine 20: 3441–3457.
Copyright © 2011 John Wiley & Sons, Ltd. Health Econ. (2011)DOI: 10.1002/hec