Embed Size (px)
Citation preview
i Surveillance for Foodborne Disease Outbreaks, United States 2013 | Annual Report
Surveillance for Foodborne Disease Outbreaks United States, 2013: Annual Report
AcknowledgementsThe findings in this study are based, in part, on contributions
by state, local, tribal, and territorial health departments.
Suggested CitationCenters for Disease Control and Prevention (CDC).
Surveillance for Foodborne Disease Outbreaks, United States, 2013, Annual Report. Atlanta, Georgia: US Department of Health and Human Services, CDC, 2015.
Report compiled byDaniel Dewey-Mattia, Sarah D. Bennett, Elisabeth Mungai, and L. Hannah Gould
Centers for Disease Control and PreventionDivision of Foodborne, Waterborne, and Environmental Diseases
1600 Clifton Road, Mail Stop C-09, Atlanta, GA 30329-4027Telephone: 404.639.2206
E-mail: [email protected] Web: http://www.cdc.gov/foodsafety/fdoss/

Surveillance for Foodborne Disease Outbreaks
United States
2013 Annual Report
ContentsMain Findings .......................................................................................................................................................................................................................................................................................................................................................................1
Background ................................................................................................................................................................................................................................................................................................................................................................................1
Findings: Foodborne Disease Outbreaks, United States, 2013..............................................................................................................................................................................2
Limitations ...................................................................................................................................................................................................................................................................................................................................................................................3
References.....................................................................................................................................................................................................................................................................................................................................................................................4
Figure: Rate of reported foodborne disease outbreaks per 1 million population and number of outbreaks, by state and etiology ...................................................................................................................................................................................................................................................5
Table 1: Reported foodborne disease outbreaks, outbreak-associated illnesses, and hospitalizations, by etiology (confirmed or suspected) .....................................................................................................................................................................................6
Table 2a: Reported foodborne disease outbreaks and outbreak-associated illnesses, by food category .......................................................................................................................................................................................................................................................................................................................................................7
Table 2b: Common pathogen-food category pairs resulting in outbreaks, outbreak-associated illnesses, hospitalizations, and deaths ......................................................................................................................................................................................8
Table 3a: Reported foodborne disease outbreaks and outbreak-associated illnesses, by location of food preparation ..................................................................................................................................................................................................................................................................................................9
Table 3b: Reported foodborne disease outbreaks and outbreak-associated illnesses, by etiology (confirmed or suspected) and location of food preparation ..............................................................................................................................................10
Table 4: Multistate foodborne disease outbreaks ......................................................................................................................................................................................................................11
Appendix: Reported foodborne disease outbreaks by etiology (confirmed or suspected) and contributing factors ................................................................................................................................................................................................................12
1 Surveillance for Foodborne Disease Outbreaks, United States 2013 | Annual Report
Main Findings z In 2013, 818 foodborne disease outbreaks were
reported, resulting in 13,360 illnesses, 1,062 hospitalizations, 16 deaths, and 14 food recalls.
z Outbreaks caused by Salmonella increased 39% from 2012 (113) to 2013 (157). Outbreak-associated hospitalizations caused by Salmonella increased 38% from 2012 (454) to 2013 (628).
z Fish (50 outbreaks), mollusks (23), chicken (21), and dairy (21, with 17 due to unpasteurized products) were the most common single food categories implicated in outbreaks.
z As reported in previous years, restaurants (433 outbreaks, 60% of outbreaks reporting a single location of preparation), specifically restaurants with sit-down dining 351, 49%), were the most commonly reported locations of food preparation.
BackgroundFoodborne diseases cause about 48 million illnesses each year in the United States, of which about 9.4 million are caused by known pathogens.1-2 Although relatively few of these illnesses occur in the setting of a recognized outbreak, data collected during outbreak investigations can provide valuable insights into the pathogens and foods that cause illness. Public health officials, regulatory agencies, and the food industry can use these data to create control strategies along the farm-to-table continuum that target specific pathogens and foods.
An outbreak of foodborne disease is defined as the occurrence of two or more cases of a similar illness resulting from ingestion of a common food. Foodborne disease outbreaks are a nationally notifiable condition (http://c.ymcdn.com/sites/www.cste.org/resource/resmgr/CSTENotifiableConditionListA.pdf ). CDC conducts surveillance of foodborne disease outbreaks in the United States through the Foodborne Disease Outbreak Surveillance System. Public health agencies in all 50 states, the District of Columbia, U.S. territories, and Freely Associated States voluntarily submit reports of outbreaks inves¬tigated by their
agencies using a Web-based reporting platform, the National Outbreak Reporting System (NORS) (http://www.cdc.gov/nors/). NORS also collects reports of enteric disease outbreaks caused by other transmission modes, including water, animal contact, person-to-person contact, environmental contamination, and unknown mode of transmission.
Investigating and reporting agencies use a standard outbreak reporting form (http://www.cdc.gov/nors/pdf/NORS_CDC_5213.pdf ) to report foodborne disease outbreaks. Data requested for each outbreak include the reporting state; date of first illness onset; number of illnesses, hospitalizations, and deaths; etiology; implicated food and ingredients; locations of food preparation; and factors contributing to food contamination (see appendix). Outbreaks that are excluded from the Foodborne Disease Outbreak Surveillance System include those that occurred on cruise ships that have both U.S. and international ports and those in which the food was eaten outside the United States, even if the illness occurred in the United States.
This report includes foodborne disease outbreaks reported to the Foodborne Disease Outbreak Surveillance System by March 26, 2015 in which the first illness occurred in 2013. Etiologic agents were reported as confirmed if a predefined criteria were met;3 otherwise, they were reported as suspected. For outbreaks caused by a single confirmed or suspected etiology, etiologies were grouped as bacterial, chemical and toxin, parasitic, or viral. Multistate outbreaks were defined as outbreaks in which exposure to the implicated food occurred in more than one state or territory. Population-based outbreak reporting rates were calculated for each state using U.S. Census estimates of the 2013 state populations (http://www.census.gov/popest). Multistate outbreaks were included in population-based outbreak reporting rates by assigning one outbreak to each state that reported a case in the outbreak. Implicated foods were
2 Surveillance for Foodborne Disease Outbreaks, United States 2013 | Annual Report
classified into 1 of 24 single food categories if a single contaminated ingredient was identified or if all ingredients belonged to that category.4 Outbreaks attributed to foods that could not be assigned to one of these categories, or for which the report contained insufficient information for category assignment, were not attributed to any category.
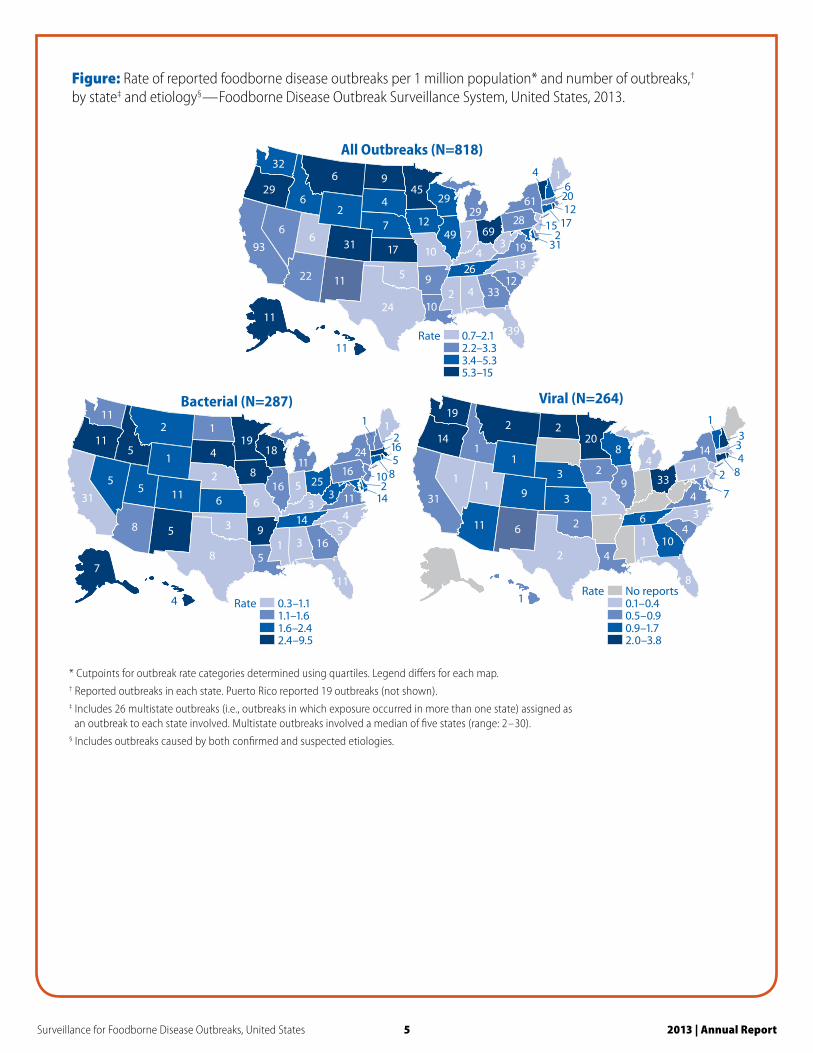
Findings: Foodborne Disease Outbreaks, United States, 2013States and RatesDuring 2013, 818 foodborne disease outbreaks were reported, resulting in 13,360 illnesses, 1,062 hospitalizations, and 16 deaths (Table 1). Outbreaks were reported by public health officials from all 50 states and Puerto Rico (Figure). The median rate was 3.3 foodborne disease outbreaks per 1 million population; rates ranged from 0.7 outbreaks per 1 million population in Mississippi to 15.0 outbreaks per 1 million population in Alaska.
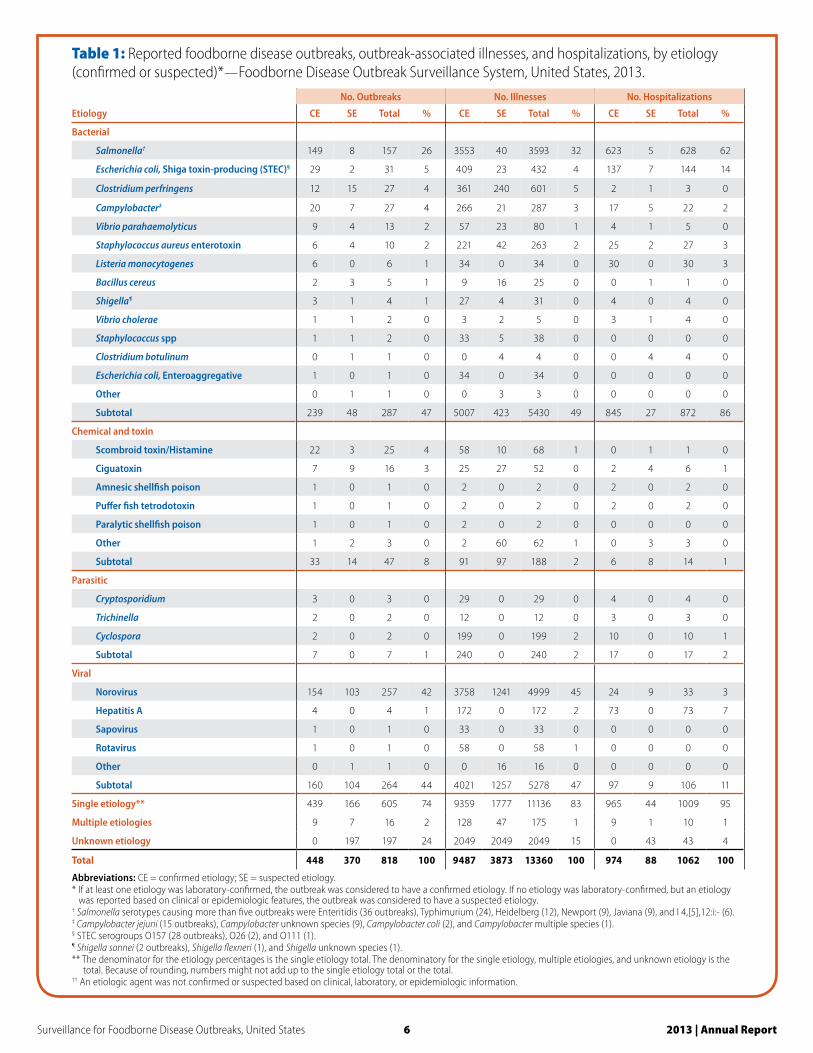
Etiologic AgentsA single confirmed or suspected etiologic agent was identified in 605 outbreaks (74%, with 439 confirmed and 166 suspected) (Table 1). Among the 439 outbreaks with a single confirmed etiologic agent, bacteria caused the most outbreaks (239 outbreaks, 54%), followed by viruses (160, 36%), chemicals (33, 8%), and parasites (7, 2%). Norovirus was the most common cause of confirmed, single-etiology outbreaks, accounting for 154 (35%) outbreaks and 3,758 (40%) illnesses. Salmonella was next, accounting for 149 (34%) outbreaks and 3,553 (38%) illnesses. Among the 147 confirmed Salmonella outbreaks with a serotype reported, Enteritidis was the most common (34 outbreaks, 23%), followed by Typhimurium (24, 16%), Heidelberg (12, 8%), Newport (9, 6%), Javiana (8, 5%), and I 4,[5],12:i:- (6, 4%). Shiga toxin-producing Escherichia coli (STEC) caused 29 confirmed, single-etiology outbreaks, of which 26 (90%) were caused by serogroup O157, 2 (7%) by O26, and 1 (3%) by O111.
Illnesses, Hospitalizations, and DeathsOf the 9,359 outbreak-associated illnesses caused by a single confirmed etiologic agent, 965 (10%) resulted in hospitalization (Table 1). Among confirmed, single-etiology outbreaks, Salmonella caused the most outbreak-associated hospitalizations (623 hospitalizations, 65%), followed by STEC (137, 14%) and hepatitis A virus (73, 8%). Outbreaks caused by Listeria monocytogenes resulted in the highest proportion of ill persons hospitalized (88%). Among the 16 deaths reported, 13 (81%) were attributed to bacterial etiologies (Listeria monocytogenes [6], Salmonella [4], STEC O157 [2], and Vibrio cholerae [1]); 1 death was attributed to norovirus, 1 to multiple etiologies, and 1 to an unknown etiology.
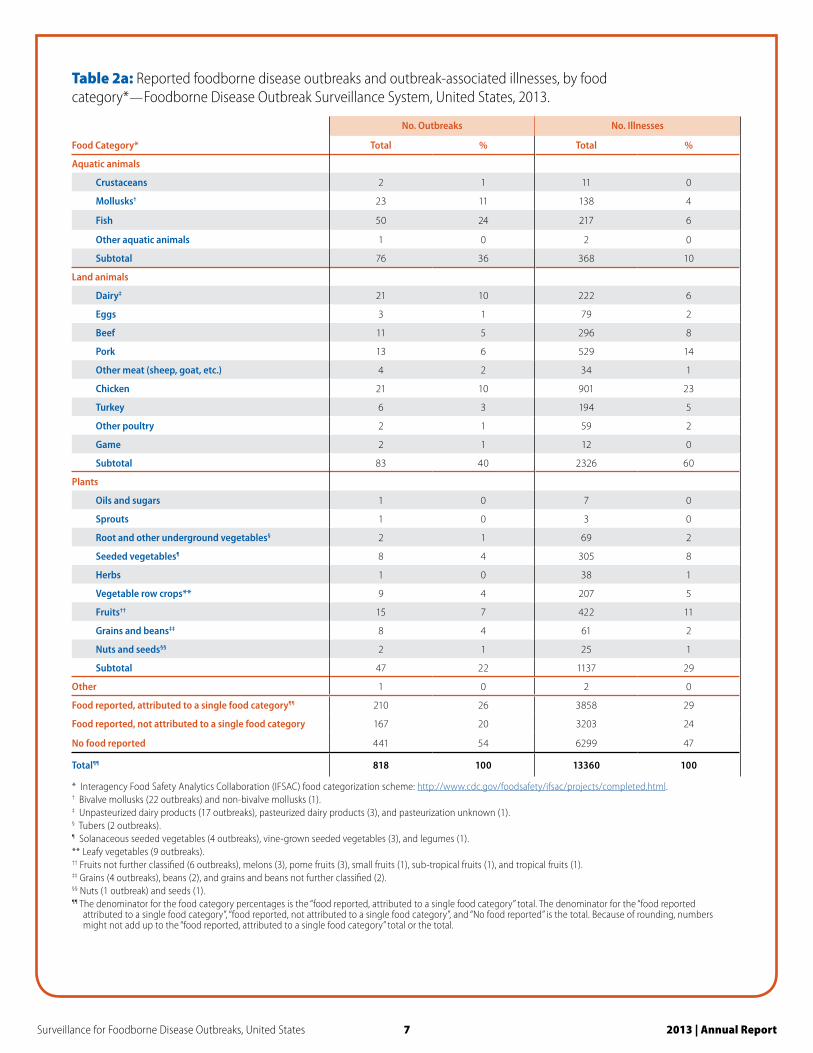
Food Categories ImplicatedA food was reported for 377 (46%) outbreaks. In 210 (56%) of these outbreaks, the food could be classified into 1 of the 24 categories (Table 2a); the categories most commonly implicated were fish (50 outbreaks, 24%), mollusks (23, 11%), chicken (21, 10%), and dairy (21, 10%). Pasteurization information was reported for 20 of the dairy outbreaks and 17 (85%) involved unpasteurized products. The most outbreak-associated illnesses were from chicken (901 illnesses, 23%), pork (529, 14%), and fruit (422, 11%).
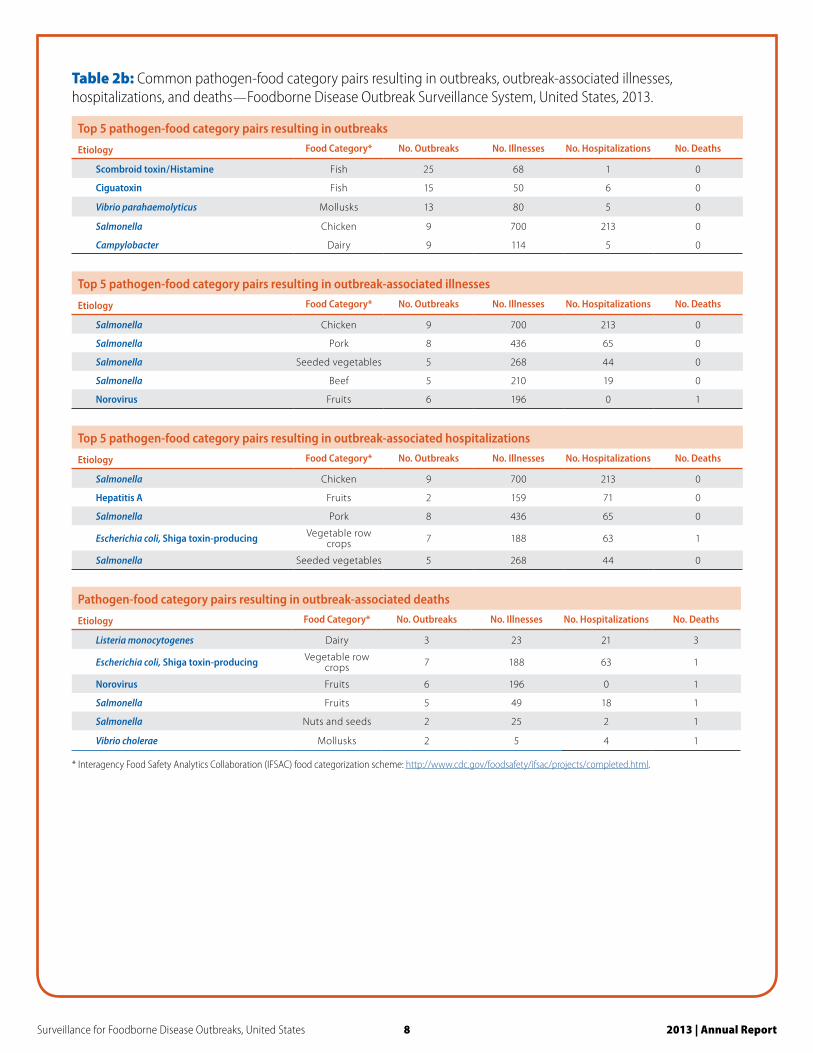
Etiologic Agents and Food Category Pairs The pathogen-food category pairs responsible for most outbreaks were scombroid toxin (histamine fish poisoning) in fish (25 outbreaks), ciguatoxin in fish (15), and Vibrio parahaemolyticus in mollusks (13) (Table 2b). The pathogen-food category pairs responsible for the most outbreak-associated illnesses were Salmonella in chicken (700 illnesses), Salmonella in pork (436), and Salmonella in seeded vegetables (268). The pathogen-food category pairs responsible for the most hospitalizations were Salmonella in chicken (213 hospitalizations), hepatitis A virus in fruits (71), and Salmonella in pork (65). Deaths were reported for the following pathogen-food category pairs: Listeria in dairy (3 deaths),
3 Surveillance for Foodborne Disease Outbreaks, United States 2013 | Annual Report
STEC in vegetable row crops (1), norovirus in fruits (1), Salmonella in fruits (1), Salmonella in nuts and seeds (1), and Vibrio cholerae in mollusks (1).
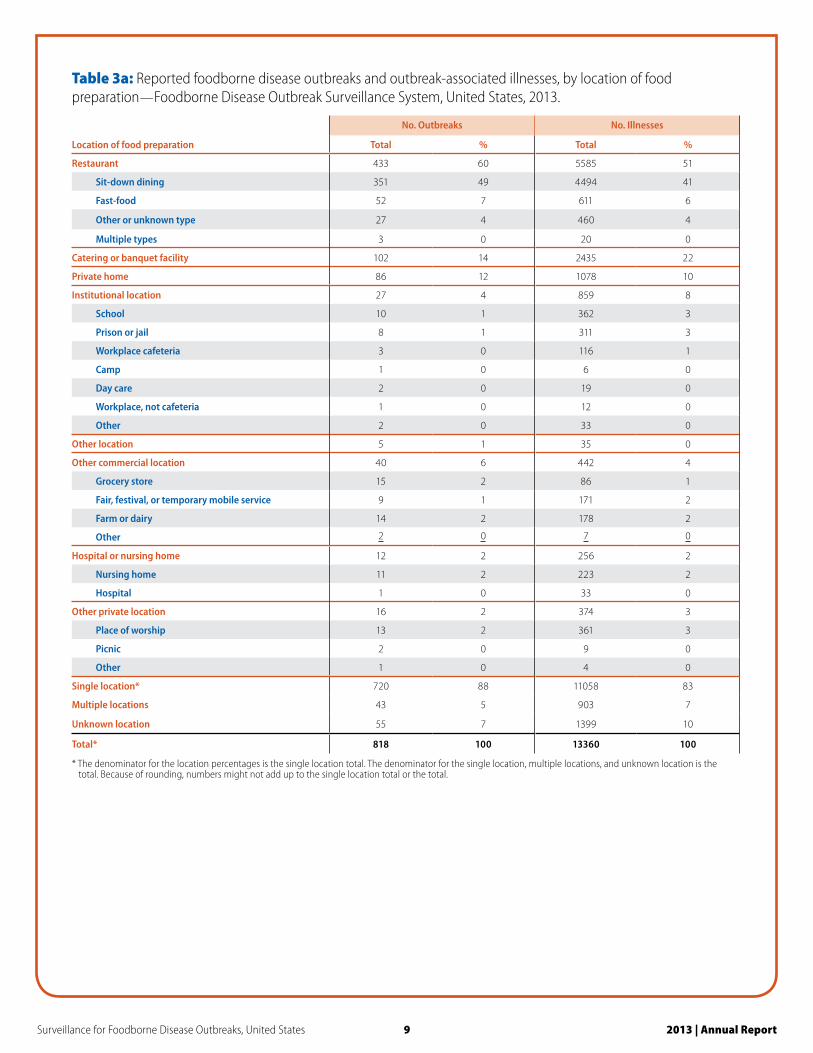
Location of Food PreparationAmong the 720 outbreaks and 11,058 illnesses with a reported single location where food was prepared, 433 outbreaks (60%) and 5,585 associated illnesses (51%) were attributed to foods prepared in a restaurant (Table 3a). Among these outbreaks, sit-down dining-style was the type of restaurant most commonly reported as the location where food was prepared (351 outbreaks, 81%).
RecallsFourteen outbreaks resulted in product recalls. The foods recalled were Latin-style soft cheese (2 outbreaks); chicken (2); oysters (2); French-style semi-soft cheese, infused rice products, landjaeger sausage, oysters and clams, pistachios, raw cashew cheese, romaine lettuce, and tahini (1 each).
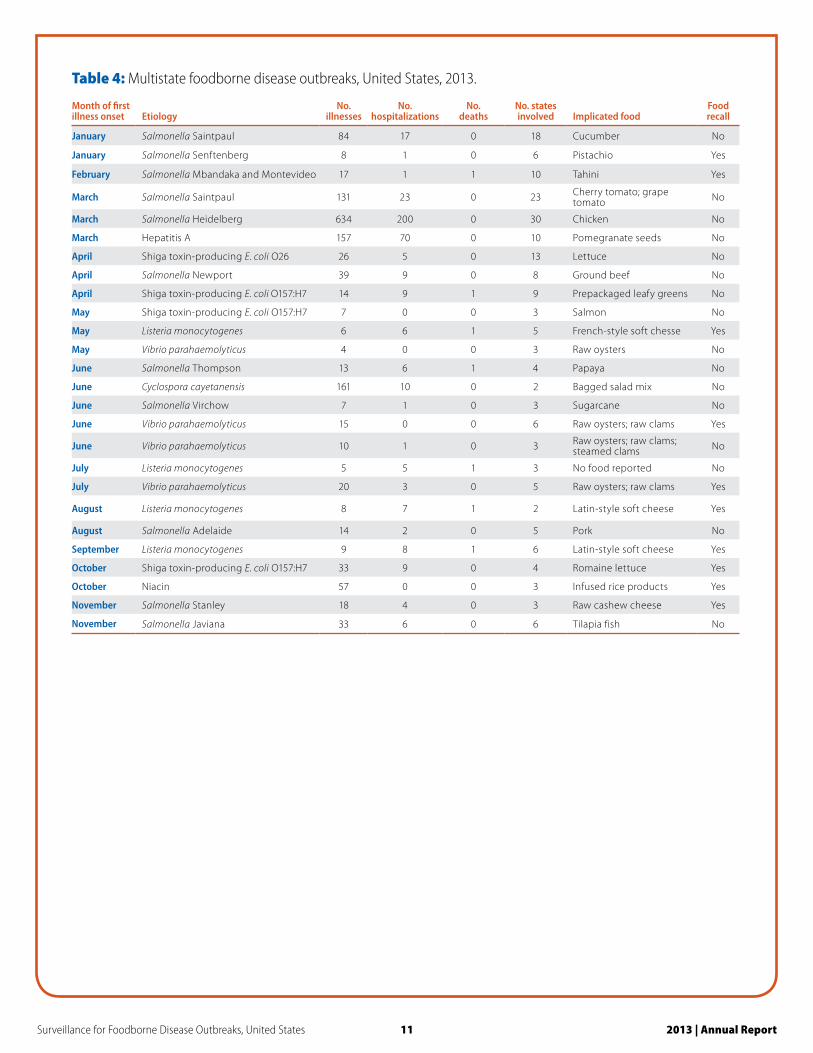
Multistate OutbreaksTwenty-six multistate outbreaks (3% of all outbreaks) were reported (Table 4), resulting in 1,530 illnesses (11% of illnesses), 403 hospitalizations (38% of hospitalizations), and 7 deaths (44% of deaths). Outbreaks involved a median of five states (range: 2-30). Eleven outbreaks were caused by Salmonella; the serotypes were Saintpaul (2 outbreaks); Adelaide, Heidelberg, Javiana, Newport, Senftenberg, Stanley, Thompson, Virchow, and multiple serotypes (1 each). The remaining 15 outbreaks were caused by Vibrio parahaemolyticus (4), STEC (4 outbreaks; serogroups O157 [3] and O26 [1]), Listeria (4), hepatitis A virus (1), Cyclospora cayetanensis (1), and niacin (1). A food was implicated in all 11 multistate outbreaks caused by Salmonella; the foods were cherry and grape tomatoes, chicken, cucumber, ground beef, papaya, pistachios, pork, raw cashew cheese, sugarcane, tahini, and tilapia fish (1 each). Four multistate outbreaks were caused by STEC, which was transmitted in prepackaged leafy greens (serogroup O157), romaine lettuce (O157), salmon (O157), and an unspecified lettuce (O26) (1 outbreak each).
Four multistate outbreaks were caused by Listeria in pasteurized Latin-style soft cheese (2 outbreaks), pasteurized French-style semi-soft cheese (1), and an unidentified food in an outbreak identified through whole genome sequencing (1). Raw oysters and raw clams (2 outbreaks), raw oysters (1), and raw oysters, raw clams, and steamed clams (1) were implicated in the four Vibrio parahaemolyticus outbreaks. Infused rice products were implicated in the outbreak caused by niacin, bagged salad mix was implicated in the outbreak caused by Cyclospora cayetanensis, and pomegranate seeds were implicated in the outbreak caused by hepatitis A virus.
LimitationsThe findings in this report have at least three limitations. First, only a small proportion of foodborne illnesses reported each year are identified as being associated with outbreaks. The extent to which the distribution of food vehicles and locations of preparation implicated in foodborne disease outbreaks reflect the same vehicles and locations as sporadic foodborne illnesses is unknown. Similarly, not all outbreaks are identified, investigated, or reported. Second, many outbreaks had an unknown etiology, an unknown food vehicle, or both, and conclusions drawn from outbreaks with a confirmed or suspected etiology or food vehicle might not apply to outbreaks with an unknown etiology or food vehicle. Finally, CDC’s outbreak surveillance system is dynamic. Agencies can submit new reports and change or delete reports as information becomes available. Therefore, the results of this analysis might differ from those published earlier or from future reports.
Additional InformationPublic health, regulatory, and food industry professionals can use this information to target prevention efforts against pathogens and foods that cause the most foodborne disease outbreaks. Learn more about how outbreaks are reported and tracked at http://www.cdc.gov/foodsafety/fdoss/.
4 Surveillance for Foodborne Disease Outbreaks, United States 2013 | Annual Report
References1. Scallan E, Hoekstra RM, Angulo FJ, et al. Foodborne
illness acquired in the United States — major pathogens. Emerging Infectious Diseases 2011; 17(1): 7-15.
2. Scallan E, Griffin PM, Angulo FJ, Tauxe RV, Hoekstra RM. Foodborne illness acquired in the United States - unspecified agents. Emerging Infectious Diseases 2011; 17(1): 16-22.
3. CDC. Guide to confirming a diagnosis in foodborne disease. Available at: http://www.cdc.gov/foodsafety/
outbreaks/investigating-outbreaks/confirming_diagnosis.html. Accessed January 23, 2014.
4. Interagency Food Safety Analytics Collaboration (IFSAC). The Interagency Food Safety Analytics Collaboration (IFSAC): Completed Projects. Available at: http://www.cdc.gov/foodsafety/ifsac/projects/completed.html. Accessed May 30, 2014.
5 Surveillance for Foodborne Disease Outbreaks, United States 2013 | Annual Report
Figure: Rate of reported foodborne disease outbreaks per 1 million population* and number of outbreaks,† by state‡ and etiology§ — Foodborne Disease Outbreak Surveillance System, United States, 2013.
* Cutpoints for outbreak rate categories determined using quartiles. Legend differs for each map.† Reported outbreaks in each state. Puerto Rico reported 19 outbreaks (not shown).‡ Includes 26 multistate outbreaks (i.e., outbreaks in which exposure occurred in more than one state) assigned as
an outbreak to each state involved. Multistate outbreaks involved a median of five states (range: 2 – 30).§ Includes outbreaks caused by both confirmed and suspected etiologies.
All Outbreaks (N=818)32
6
93
22
11
31
11
24
5
17
12
10
92 4
39
3312
13264
49 7 693 19
28
61
16
12
215
31
17
20
4
11
10
7
429
6
2
6
945
2929
6
Bacterial (N=287)11
5
31
8
7
11
5
8
3
6
8
6
91 3
11
165
4143
16 5 253 11
16
24
12
5
2
4
14
810
16
1
5
2
4
1
1
112
5
1918
115
Viral (N=264)19
11
31
11
1
9
6 2
3
3
34
2
8
10
6
1
2
2
9 334
4
143
42
7
8
3
1
4
14
1
2 220
84
1
0.7–2.12.2–3.33.4–5.35.3–15
Rate
0.3–1.1Rate1.1–1.61.6–2.42.4–9.5
0.1–0.4Rate
0.5–0.9
No reports
0.9–1.72.0–3.8
Surveillance for Foodborne Disease Outbreaks, United States 2013 | Annual Report
Table 1: Reported foodborne disease outbreaks, outbreak-associated illnesses, and hospitalizations, by etiology (confirmed or suspected)* — Foodborne Disease Outbreak Surveillance System, United States, 2013.
Etiology CE
No. Outbreaks
SE Total % CE
No. Illnesses
SE Total % CE
No. Hospitalizations
SE Total %
Bacterial
Salmonella† 149 8 157 26 3553 40 3593 32 623 5 628 62
Escherichia coli, Shiga toxin-producing (STEC)§ 29 2 31 5 409 23 432 4 137 7 144 14
Clostridium perfringens 12 15 27 4 361 240 601 5 2 1 3 0
Campylobacter‡ 20 7 27 4 266 21 287 3 17 5 22 2
Vibrio parahaemolyticus
Staphylococcus aureus enterotoxin
9
6
4
4
13
10
2
2
57
221
23
42
80
263
1
2
4
25
1
2
5
27
0
3
Listeria monocytogenes 6 0 6 1 34 0 34 0 30 0 30 3
Bacillus cereus 2 3 5 1 9 16 25 0 0 1 1 0
Shigella¶ 3 1 4 1 27 4 31 0 4 0 4 0
Vibrio cholerae 1 1 2 0 3 2 5 0 3 1 4 0
Staphylococcus spp
Clostridium botulinum
1
0
1
1
2
1
0
0
33
0
5
4
38
4
0
0
0
0
0
4
0
4
0
0
Escherichia coli, Enteroaggregative 1 0 1 0 34 0 34 0 0 0 0 0
Other 0 1 1 0 0 3 3 0 0 0 0 0
Subtotal 239 48 287 47 5007 423 5430 49 845 27 872 86
Chemical and toxin
Scombroid toxin/Histamine
Ciguatoxin
22
7
3
9
25
16
4
3
58
25
10
27
68
52
1
0
0
2
1
4
1
6
0
1
Amnesic shellfish poison 1 0 1 0 2 0 2 0 2 0 2 0
Puffer fish tetrodotoxin 1 0 1 0 2 0 2 0 2 0 2 0
Paralytic shellfish poison 1 0 1 0 2 0 2 0 0 0 0 0
Other 1 2 3 0 2 60 62 1 0 3 3 0
Subtotal 33 14 47 8 91 97 188 2 6 8 14 1
Parasitic
Cryptosporidium 3 0 3 0 29 0 29 0 4 0 4 0
Trichinella 2 0 2 0 12 0 12 0 3 0 3 0
Cyclospora 2 0 2 0 199 0 199 2 10 0 10 1
Subtotal 7 0 7 1 240 0 240 2 17 0 17 2
Viral
Norovirus 154 103 257 42 3758 1241 4999 45 24 9 33 3
Hepatitis A 4 0 4 1 172 0 172 2 73 0 73 7
Sapovirus
Rotavirus
1
1
0
0
1
1
0
0
33
58
0
0
33
58
0
1
0
0
0
0
0
0
0
0
Other 0 1 1 0 0 16 16 0 0 0 0 0
Subtotal 160 104 264 44 4021 1257 5278 47 97 9 106 11
Single etiology** 439 166 605 74 9359 1777 11136 83 965 44 1009 95
Multiple etiologies 9 7 16 2 128 47 175 1 9 1 10 1
Unknown etiology 0 197 197 24 2049 2049 2049 15 0 43 43 4
Total 448 370 818 100 9487 3873 13360 100 974 88 1062 100
Abbreviations: CE = confirmed etiology; SE = suspected etiology.* If at least one etiology was laboratory-confirmed, the outbreak was considered to have a confirmed etiology. If no etiology was laboratory-confirmed, but an etiology was reported based on clinical or epidemiologic features, the outbreak was considered to have a suspected etiology.† Salmonella serotypes causing more than five outbreaks were Enteritidis (36 outbreaks), Typhimurium (24), Heidelberg (12), Newport (9), Javiana (9), and I 4,[5],12:i:- (6).‡ Campylobacter jejuni (15 outbreaks), Campylobacter unknown species (9), Campylobacter coli (2), and Campylobacter multiple species (1).§ STEC serogroups O157 (28 outbreaks), O26 (2), and O111 (1).¶ Shigella sonnei (2 outbreaks), Shigella flexneri (1), and Shigella unknown species (1).** The denominator for the etiology percentages is the single etiology total. The denominatory for the single etiology, multiple etiologies, and unknown etiology is the total. Because of rounding, numbers might not add up to the single etiology total or the total.†† An etiologic agent was not confirmed or suspected based on clinical, laboratory, or epidemiologic information.
6
7 Surveillance for Foodborne Disease Outbreaks, United States 2013 | Annual Report
Table 2a: Reported foodborne disease outbreaks and outbreak-associated illnesses, by food category* —Foodborne Disease Outbreak Surveillance System, United States, 2013.
No. Outbreaks No. Illnesses
Food Category* Total % Total %
Aquatic animals
Crustaceans 2 1 11 0
Mollusks† 23 11 138 4
Fish 50 24 217 6
Other aquatic animals 1 0 2 0
Subtotal 76 36 368 10
Land animals
Dairy‡ 21 10 222 6
Eggs 3 1 79 2
Beef 11 5 296 8
Pork 13 6 529 14
Other meat (sheep, goat, etc.) 4 2 34 1
Chicken 21 10 901 23
Turkey 6 3 194 5
Other poultry 2 1 59 2
Game 2 1 12 0
Subtotal 83 40 2326 60
Plants
Oils and sugars 1 0 7 0
Sprouts 1 0 3 0
Root and other underground vegetables§ 2 1 69 2
Seeded vegetables¶ 8 4 305 8
Herbs 1 0 38 1
Vegetable row crops** 9 4 207 5
Fruits†† 15 7 422 11
Grains and beans‡‡ 8 4 61 2
Nuts and seeds§§ 2 1 25 1
Subtotal 47 22 1137 29
Other 1 0 2 0
Food reported, attributed to a single food category¶¶ 210 26 3858 29
Food reported, not attributed to a single food category 167 20 3203 24
No food reported 441 54 6299 47
Total¶¶ 818 100 13360 100
* Interagency Food Safety Analytics Collaboration (IFSAC) food categorization scheme: http://www.cdc.gov/foodsafety/ifsac/projects/completed.html.† Bivalve mollusks (22 outbreaks) and non-bivalve mollusks (1).‡ Unpasteurized dairy products (17 outbreaks), pasteurized dairy products (3), and pasteurization unknown (1).§ Tubers (2 outbreaks).¶ Solanaceous seeded vegetables (4 outbreaks), vine-grown seeded vegetables (3), and legumes (1).** Leafy vegetables (9 outbreaks).†† Fruits not further classified (6 outbreaks), melons (3), pome fruits (3), small fruits (1), sub-tropical fruits (1), and tropical fruits (1).‡‡ Grains (4 outbreaks), beans (2), and grains and beans not further classified (2).§§ Nuts (1 outbreak) and seeds (1).¶¶ The denominator for the food category percentages is the “food reported, attributed to a single food category” total. The denominator for the “food reported attributed to a single food category”, “food reported, not attributed to a single food category”, and “No food reported” is the total. Because of rounding, numbers might not add up to the “food reported, attributed to a single food category” total or the total.
8 Surveillance for Foodborne Disease Outbreaks, United States 2013 | Annual Report
Table 2b: Common pathogen-food category pairs resulting in outbreaks, outbreak-associated illnesses, hospitalizations, and deaths — Foodborne Disease Outbreak Surveillance System, United States, 2013.
Top 5 pathogen-food category pairs resulting in outbreaks
Etiology Food Category* No. Outbreaks No. Illnesses No. Hospitalizations No. Deaths
Scombroid toxin / Histamine Fish 25 68 1 0
Ciguatoxin Fish 15 50 6 0
Vibrio parahaemolyticus Mollusks 13 80 5 0
Salmonella Chicken 9 700 213 0
Campylobacter Dairy 9 114 5 0
Top 5 pathogen-food category pairs resulting in outbreak-associated illnesses
Etiology Food Category* No. Outbreaks No. Illnesses No. Hospitalizations No. Deaths
Salmonella Chicken 9 700 213 0
Salmonella Pork 8 436 65 0
Salmonella Seeded vegetables 5 268 44 0
Salmonella Beef 5 210 19 0
Norovirus Fruits 6 196 0 1
Top 5 pathogen-food category pairs resulting in outbreak-associated hospitalizations
Etiology Food Category* No. Outbreaks No. Illnesses No. Hospitalizations No. Deaths
Salmonella Chicken 9 700 213 0
Hepatitis A Fruits 2 159 71 0
Salmonella Pork 8 436 65 0
Escherichia coli, Shiga toxin-producing Vegetable row crops 7 188 63 1
Salmonella Seeded vegetables 5 268 44 0
Pathogen-food category pairs resulting in outbreak-associated deaths
Etiology Food Category* No. Outbreaks No. Illnesses No. Hospitalizations No. Deaths
Listeria monocytogenes Dairy 3 23 21 3
Escherichia coli, Shiga toxin-producing Vegetable row crops 7 188 63 1
Norovirus Fruits 6 196 0 1
Salmonella Fruits 5 49 18 1
Salmonella Nuts and seeds 2 25 2 1
Vibrio cholerae Mollusks 2 5 4 1
* Interagency Food Safety Analytics Collaboration (IFSAC) food categorization scheme: http://www.cdc.gov/foodsafety/ifsac/projects/completed.html.
Surveillance for Foodborne Disease Outbreaks, United States 2013 | Annual Report
Table 3a: Reported foodborne disease outbreaks and outbreak-associated illnesses, by location of food preparation —Foodborne Disease Outbreak Surveillance System, United States, 2013.
No. Outbreaks No. Illnesses
Location of food preparation Total % Total %
Restaurant 433 60 5585 51
Sit-down dining 351 49 4494 41
Fast-food 52 7 611 6
Other or unknown type 27 4 460 4
Multiple types 3 0 20 0
Catering or banquet facility 102 14 2435 22
Private home 86 12 1078 10
Institutional location 27 4 859 8
School 10 1 362 3
Prison or jail 8 1 311 3
Workplace cafeteria 3 0 116 1
Camp 1 0 6 0
Day care 2 0 19 0
Workplace, not cafeteria 1 0 12 0
Other 2 0 33 0
Other location 5 1 35 0
Other commercial location 40 6 442 4
Grocery store 15 2 86 1
Fair, festival, or temporary mobile service 9 1 171 2
Farm or dairy 14 2 178 2
Other 2 0 7 0
Hospital or nursing home 12 2 256 2
Nursing home 11 2 223 2
Hospital 1 0 33 0
Other private location 16 2 374 3
Place of worship 13 2 361 3
Picnic 2 0 9 0
Other 1 0 4 0
Single location* 720 88 11058 83
Multiple locations 43 5 903 7
Unknown location 55 7 1399 10
Total* 818 100 13360 100
* The denominator for the location percentages is the single location total. The denominator for the single location, multiple locations, and unknown location is the total. Because of rounding, numbers might not add up to the single location total or the total.
9
10 Surveillance for Foodborne Disease Outbreaks, United States 2013 | Annual Report
Table 3b: Reported foodborne disease outbreaks and outbreak-associated illnesses, by etiology (confirmed or suspected)* and location of food preparation† — Foodborne Disease Outbreak Surveillance System, United States, 2013.
Catering or banquet facility
RestaurantOther
commercial location
Hospital or nursing home
institutional location
Private home
Other private
location
Other location
Etiology NO NI NO NI NO NI NO NI NO NI NO NI NO NI NO NI
Bacterial
Salmonella 9 142 60 1118 12 193 2 7 10 310 28 475 6 179 2 11
Escherichia coli, Shiga toxin-producing 2 53 14 286 4 23 –‡ – 2 14 6 33 – – 2 11
Clostridium perfringens 8 339 11 127 – – – – 3 57 3 15 1 11 – –
Campylobacter 1 8 14 135 6 107 – – – – 1 2 – – – –
Vibrio parahaemolyticus – – 8 25 – – – – – – 1 5 – – – –
Staphylococcus aureus enterotoxin 1 9 4 49 1 4 – – 2 162 1 14 1 25 – –
Listeria monocytogenes – – 1 4 – – – – – – 2 17 – – – –
Bacillus cereus – – 3 12 1 5 – – – – – – – – – –
Shigella – – 2 22 – – – – – – 1 4 – – – –
Vibrio cholerae – – 1 2 – – – – – – – – – – – –
Staphylococcus spp – – 1 5 – – – – – – 1 33 – – – –
Clostridium botulinum – – – – – – – – – – 1 4 – – – –
Escherichia coli, Enteroaggregative 1 34 – – – – – – – – – – – – – –
Other – – 1 3 – – – – – – – – – – – –
Subtotal 22 585 120 1788 24 332 2 7 17 543 45 602 8 215 4 22
Chemical and toxin
Scombroid toxin/Histamine – – 15 42 3 7 – – 1 4 4 8 – – – –
Ciguatoxin – – 3 8 – – – – – – 10 33 1 4 – –
Amnesic shellfish poison – – 1 2 – – – – – – – – – – – –
Puffer fish tetrodotoxin – – – – – – – – – – 1 2 – – – –
Paralytic shellfish poison – – – – – – – – – – – – – – – –
Other – – – – 1 2 – – – – 1 3 – – – –
Subtotal – – 19 52 4 9 – – 1 4 16 46 1 4 0 –
Parasitic
Cryptosporidium – – – – 1 8 – – – – 2 21 – – – –
Trichinella – – – – – – – – – – 2 12 – – – –
Cyclospora – – 1 161 – – – – – – – – – – – –
Subtotal – – 1 161 1 8 – – – – 4 33 – – 0 –
Viral
Norovirus 48 1259 160 2411 4 40 8 228 5 244 11 176 3 113 1 13
Hepatitis A – – 1 9 1 4 – – – – 2 159 – – – –
Sapovirus – – 1 33 – – – – – – – – – – – –
Rotavirus 1 58 – – – – – – – – – – – – – –
Other 1 16 – – – – – – – – – – – – – –
Subtotal 50 1333 162 2453 5 44 8 228 5 244 13 335 3 113 1 13
Single etiology 72 1918 302 4454 34 393 10 235 23 791 78 1016 12 332 5 35
Multiple etiologies – – 7 59 2 16 1 9 2 51 1 7 1 13 0 –
Unknown etiology§ 30 517 124 1072 4 33 1 12 2 17 7 55 3 29 0 –
Total 102 2435 433 5585 40 442 12 256 27 859 86 1078 16 374 5 35
Abbreviations: NO = number of outbreaks; NI = number of illnesses.* If at least one etiology was laboratory-confirmed, the outbreak was considered to have a confirmed etiology. If no etiology was laboratory-confirmed, but an etiology was reported based on clinical or epidemiologic features; the outbreak was considered to have a suspected etiology.† Reported locations were grouped as follows: catering or banquet facility, restaurant, other commorcial location, hospital or nursing home, other institutional location, private home, other private location, and other location (see Table 3a).‡ No outbreaks in the data reported fall into this category.§ An etiologic agent was not confirmed or suspected based on clinical, laboratory, or epidemiologic information.
Surveillance for Foodborne Disease Outbreaks, United States 2013 | Annual Report
Table 4: Multistate foodborne disease outbreaks, United States, 2013.
Month of first illness onset Etiology
No. illnesses
No. hospitalizations
No. deaths
No. states involved Implicated food
Food recall
January Salmonella Saintpaul 84 17 0 18 Cucumber No
January Salmonella Senftenberg 8 1 0 6 Pistachio Yes
February Salmonella Mbandaka and Montevideo 17 1 1 10 Tahini Yes
March Salmonella Saintpaul 131 23 0 23 Cherry tomato; grape tomato No
March Salmonella Heidelberg 634 200 0 30 Chicken No
March Hepatitis A 157 70 0 10 Pomegranate seeds No
April Shiga toxin-producing E. coli O26 26 5 0 13 Lettuce No
April Salmonella Newport 39 9 0 8 Ground beef No
April Shiga toxin-producing E. coli O157:H7 14 9 1 9 Prepackaged leafy greens No
May Shiga toxin-producing E. coli O157:H7 7 0 0 3 Salmon No
May Listeria monocytogenes 6 6 1 5 French-style soft chesse Yes
May Vibrio parahaemolyticus 4 0 0 3 Raw oysters No
June Salmonella Thompson 13 6 1 4 Papaya No
June Cyclospora cayetanensis 161 10 0 2 Bagged salad mix No
June Salmonella Virchow 7 1 0 3 Sugarcane No
June Vibrio parahaemolyticus 15 0 0 6 Raw oysters; raw clams Yes
June Vibrio parahaemolyticus 10 1 0 3 Raw oysters; raw clams; steamed clams No
July Listeria monocytogenes 5 5 1 3 No food reported No
July Vibrio parahaemolyticus 20 3 0 5 Raw oysters; raw clams Yes
August Listeria monocytogenes 8 7 1 2 Latin-style soft cheese Yes
August Salmonella Adelaide 14 2 0 5 Pork No
September Listeria monocytogenes 9 8 1 6 Latin-style soft cheese Yes
October Shiga toxin-producing E. coli O157:H7 33 9 0 4 Romaine lettuce Yes
October Niacin 57 0 0 3 Infused rice products Yes
November Salmonella Stanley 18 4 0 3 Raw cashew cheese Yes
November Salmonella Javiana 33 6 0 6 Tilapia fish No
11
12 Surveillance for Foodborne Disease Outbreaks, United States 2013 | Annual Report
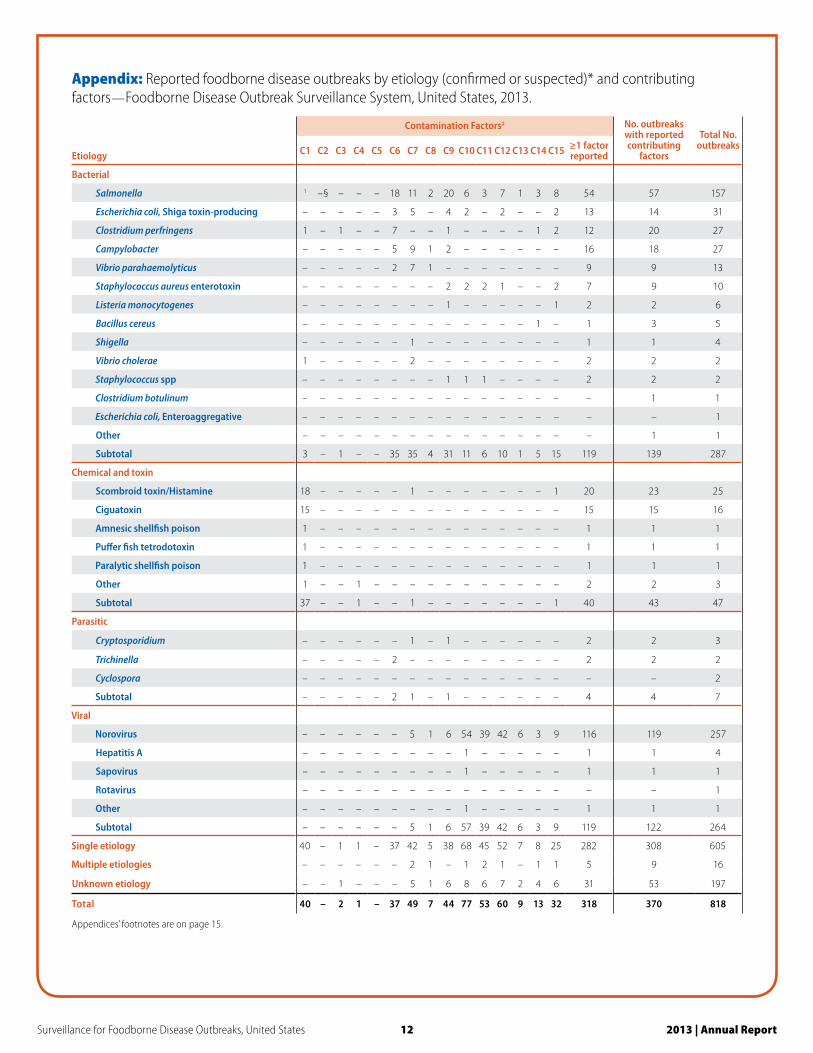
Appendix: Reported foodborne disease outbreaks by etiology (confirmed or suspected)* and contributing factors — Foodborne Disease Outbreak Surveillance System, United States, 2013.
Contamination Factors‡ No. outbreaks with reported contributing
factors
Total No. outbreaks
Etiology C1 C2 C3 C4 C5 C6 C7 C8 C9 C10 C11 C12 C13 C14 C15 ≥1 factor reported
Bacterial
Salmonella 1 –§ – – – 18 11 2 20 6 3 7 1 3 8 54 57 157
Escherichia coli, Shiga toxin-producing – – – – – 3 5 – 4 2 – 2 – – 2 13 14 31
Clostridium perfringens 1 – 1 – – 7 – – 1 – – – – 1 2 12 20 27
Campylobacter – – – – – 5 9 1 2 – – – – – – 16 18 27
Vibrio parahaemolyticus – – – – – 2 7 1 – – – – – – – 9 9 13
Staphylococcus aureus enterotoxin – – – – – – – – 2 2 2 1 – – 2 7 9 10
Listeria monocytogenes – – – – – – – – 1 – – – – – 1 2 2 6
Bacillus cereus – – – – – – – – – – – – – 1 – 1 3 5
Shigella – – – – – – 1 – – – – – – – – 1 1 4
Vibrio cholerae 1 – – – – – 2 – – – – – – – – 2 2 2
Staphylococcus spp – – – – – – – – 1 1 1 – – – – 2 2 2
Clostridium botulinum – – – – – – – – – – – – – – – – 1 1
Escherichia coli, Enteroaggregative – – – – – – – – – – – – – – – – – 1
Other – – – – – – – – – – – – – – – – 1 1
Subtotal 3 – 1 – – 35 35 4 31 11 6 10 1 5 15 119 139 287
Chemical and toxin
Scombroid toxin/Histamine 18 – – – – – 1 – – – – – – – 1 20 23 25
Ciguatoxin 15 – – – – – – – – – – – – – – 15 15 16
Amnesic shellfish poison 1 – – – – – – – – – – – – – – 1 1 1
Puffer fish tetrodotoxin 1 – – – – – – – – – – – – – – 1 1 1
Paralytic shellfish poison 1 – – – – – – – – – – – – – – 1 1 1
Other 1 – – 1 – – – – – – – – – – – 2 2 3
Subtotal 37 – – 1 – – 1 – – – – – – – 1 40 43 47
Parasitic
Cryptosporidium – – – – – – 1 – 1 – – – – – – 2 2 3
Trichinella – – – – – 2 – – – – – – – – – 2 2 2
Cyclospora – – – – – – – – – – – – – – – – – 2
Subtotal – – – – – 2 1 – 1 – – – – – – 4 4 7
Viral
Norovirus – – – – – – 5 1 6 54 39 42 6 3 9 116 119 257
Hepatitis A – – – – – – – – – 1 – – – – – 1 1 4
Sapovirus – – – – – – – – – 1 – – – – – 1 1 1
Rotavirus – – – – – – – – – – – – – – – – – 1
Other – – – – – – – – – 1 – – – – – 1 1 1
Subtotal – – – – – – 5 1 6 57 39 42 6 3 9 119 122 264
Single etiology 40 – 1 1 – 37 42 5 38 68 45 52 7 8 25 282 308 605
Multiple etiologies – – – – – – 2 1 – 1 2 1 – 1 1 5 9 16
Unknown etiology – – 1 – – – 5 1 6 8 6 7 2 4 6 31 53 197
Total 40 – 2 1 – 37 49 7 44 77 53 60 9 13 32 318 370 818
Appendices’ footnotes are on page 15.
13 Surveillance for Foodborne Disease Outbreaks, United States 2013 | Annual Report
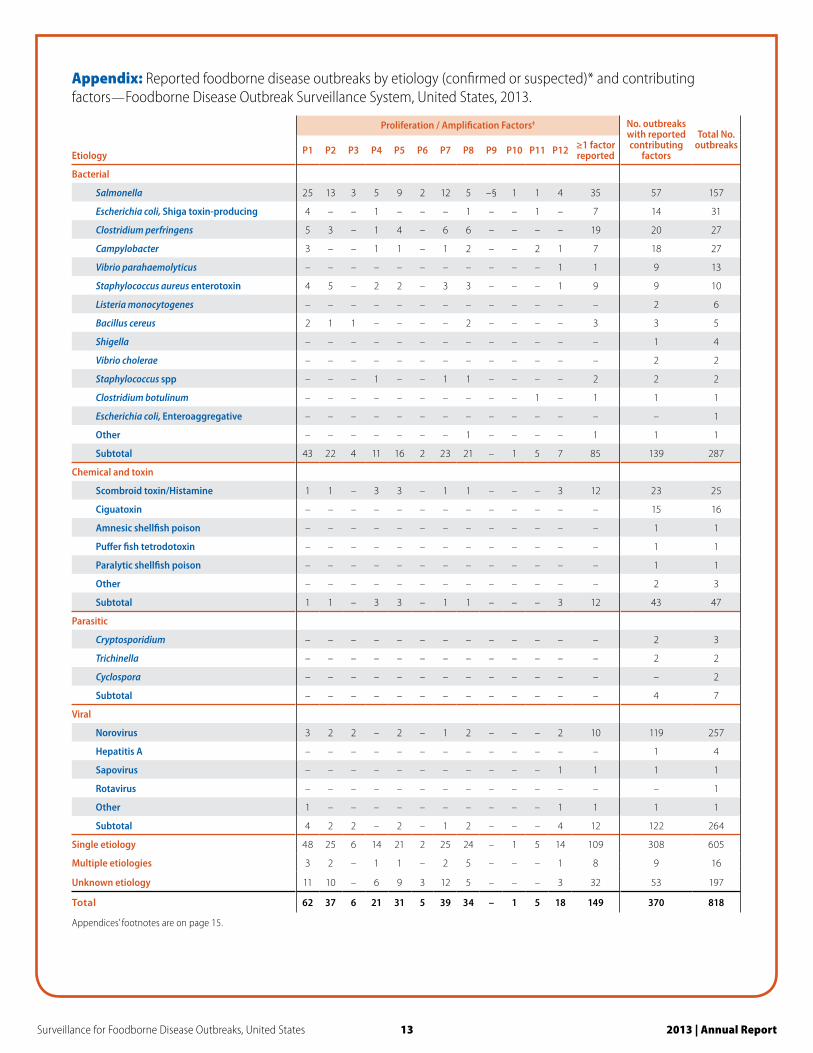
Appendix: Reported foodborne disease outbreaks by etiology (confirmed or suspected)* and contributing factors — Foodborne Disease Outbreak Surveillance System, United States, 2013.
Proliferation / Amplification Factors‡ No. outbreaks with reported contributing
factors
Total No. outbreaks
Etiology P1 P2 P3 P4 P5 P6 P7 P8 P9 P10 P11 P12 ≥1 factor reported
Bacterial
Salmonella 25 13 3 5 9 2 12 5 –§ 1 1 4 35 57 157
Escherichia coli, Shiga toxin-producing 4 – – 1 – – – 1 – – 1 – 7 14 31
Clostridium perfringens 5 3 – 1 4 – 6 6 – – – – 19 20 27
Campylobacter 3 – – 1 1 – 1 2 – – 2 1 7 18 27
Vibrio parahaemolyticus – – – – – – – – – – – 1 1 9 13
Staphylococcus aureus enterotoxin 4 5 – 2 2 – 3 3 – – – 1 9 9 10
Listeria monocytogenes – – – – – – – – – – – – – 2 6
Bacillus cereus 2 1 1 – – – – 2 – – – – 3 3 5
Shigella – – – – – – – – – – – – – 1 4
Vibrio cholerae – – – – – – – – – – – – – 2 2
Staphylococcus spp – – – 1 – – 1 1 – – – – 2 2 2
Clostridium botulinum – – – – – – – – – – 1 – 1 1 1
Escherichia coli, Enteroaggregative – – – – – – – – – – – – – – 1
Other – – – – – – – 1 – – – – 1 1 1
Subtotal 43 22 4 11 16 2 23 21 – 1 5 7 85 139 287
Chemical and toxin
Scombroid toxin/Histamine 1 1 – 3 3 – 1 1 – – – 3 12 23 25
Ciguatoxin – – – – – – – – – – – – – 15 16
Amnesic shellfish poison – – – – – – – – – – – – – 1 1
Puffer fish tetrodotoxin – – – – – – – – – – – – – 1 1
Paralytic shellfish poison – – – – – – – – – – – – – 1 1
Other – – – – – – – – – – – – – 2 3
Subtotal 1 1 – 3 3 – 1 1 – – – 3 12 43 47
Parasitic
Cryptosporidium – – – – – – – – – – – – – 2 3
Trichinella – – – – – – – – – – – – – 2 2
Cyclospora – – – – – – – – – – – – – – 2
Subtotal – – – – – – – – – – – – – 4 7
Viral
Norovirus 3 2 2 – 2 – 1 2 – – – 2 10 119 257
Hepatitis A – – – – – – – – – – – – – 1 4
Sapovirus – – – – – – – – – – – 1 1 1 1
Rotavirus – – – – – – – – – – – – – – 1
Other 1 – – – – – – – – – – 1 1 1 1
Subtotal 4 2 2 – 2 – 1 2 – – – 4 12 122 264
Single etiology 48 25 6 14 21 2 25 24 – 1 5 14 109 308 605
Multiple etiologies 3 2 – 1 1 – 2 5 – – – 1 8 9 16
Unknown etiology 11 10 – 6 9 3 12 5 – – – 3 32 53 197
Total 62 37 6 21 31 5 39 34 – 1 5 18 149 370 818
Appendices’ footnotes are on page 15.
14 Surveillance for Foodborne Disease Outbreaks, United States 2013 | Annual Report
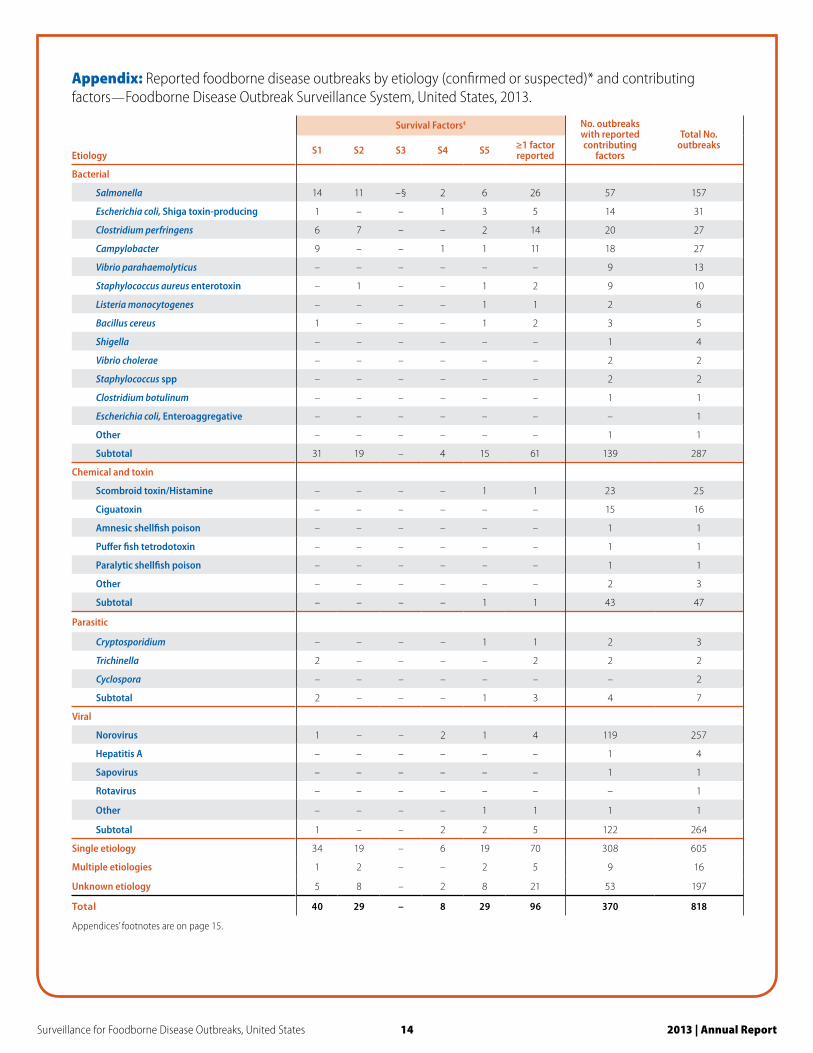
Appendix: Reported foodborne disease outbreaks by etiology (confirmed or suspected)* and contributing factors — Foodborne Disease Outbreak Surveillance System, United States, 2013.
Survival Factors‡ No. outbreaks with reported contributing
factors
Total No. outbreaks
Etiology S1 S2 S3 S4 S5 ≥1 factor reported
Bacterial
Salmonella 14 11 –§ 2 6 26 57 157
Escherichia coli, Shiga toxin-producing 1 – – 1 3 5 14 31
Clostridium perfringens 6 7 – – 2 14 20 27
Campylobacter 9 – – 1 1 11 18 27
Vibrio parahaemolyticus – – – – – – 9 13
Staphylococcus aureus enterotoxin – 1 – – 1 2 9 10
Listeria monocytogenes – – – – 1 1 2 6
Bacillus cereus 1 – – – 1 2 3 5
Shigella – – – – – – 1 4
Vibrio cholerae – – – – – – 2 2
Staphylococcus spp – – – – – – 2 2
Clostridium botulinum – – – – – – 1 1
Escherichia coli, Enteroaggregative – – – – – – – 1
Other – – – – – – 1 1
Subtotal 31 19 – 4 15 61 139 287
Chemical and toxin
Scombroid toxin/Histamine – – – – 1 1 23 25
Ciguatoxin – – – – – – 15 16
Amnesic shellfish poison – – – – – – 1 1
Puffer fish tetrodotoxin – – – – – – 1 1
Paralytic shellfish poison – – – – – – 1 1
Other – – – – – – 2 3
Subtotal – – – – 1 1 43 47
Parasitic
Cryptosporidium – – – – 1 1 2 3
Trichinella 2 – – – – 2 2 2
Cyclospora – – – – – – – 2
Subtotal 2 – – – 1 3 4 7
Viral
Norovirus 1 – – 2 1 4 119 257
Hepatitis A – – – – – – 1 4
Sapovirus – – – – – – 1 1
Rotavirus – – – – – – – 1
Other – – – – 1 1 1 1
Subtotal 1 – – 2 2 5 122 264
Single etiology 34 19 – 6 19 70 308 605
Multiple etiologies 1 2 – – 2 5 9 16
Unknown etiology 5 8 – 2 8 21 53 197
Total 40 29 – 8 29 96 370 818
Appendices’ footnotes are on page 15.
15 Surveillance for Foodborne Disease Outbreaks, United States 2013 | Annual Report
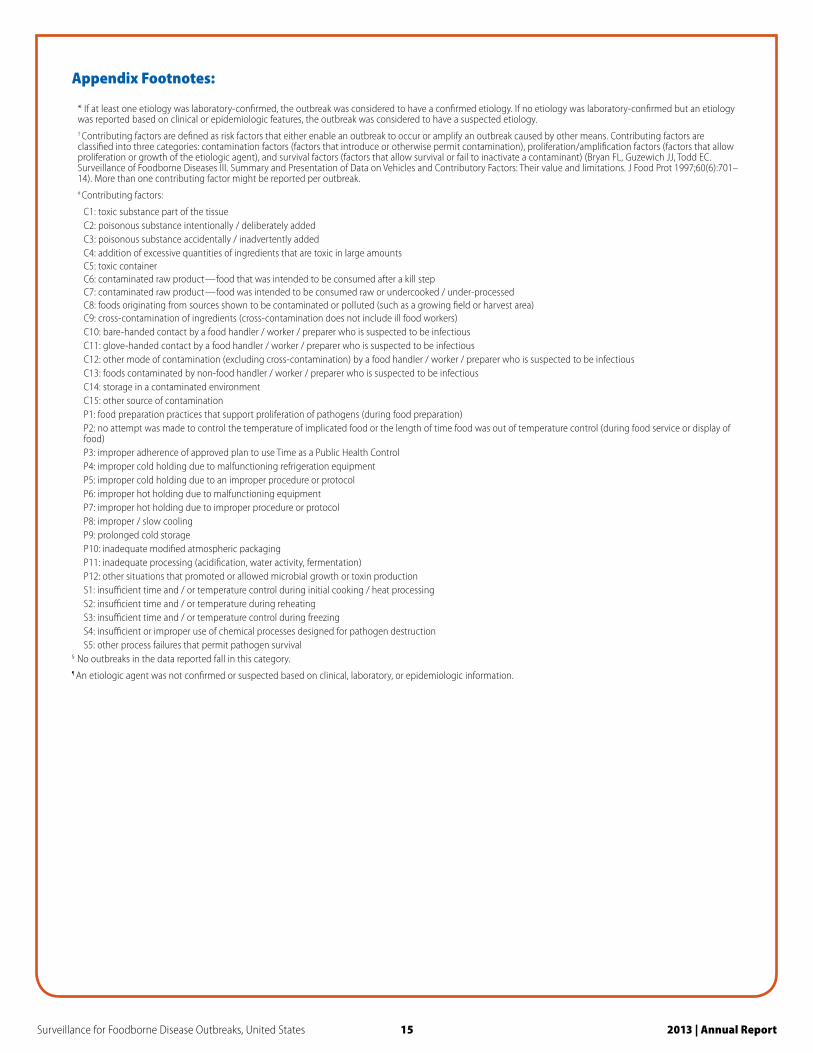
Appendix Footnotes:
* If at least one etiology was laboratory-confirmed, the outbreak was considered to have a confirmed etiology. If no etiology was laboratory-confirmed but an etiology was reported based on clinical or epidemiologic features, the outbreak was considered to have a suspected etiology.† Contributing factors are defined as risk factors that either enable an outbreak to occur or amplify an outbreak caused by other means. Contributing factors are classified into three categories: contamination factors (factors that introduce or otherwise permit contamination), proliferation/amplification factors (factors that allow proliferation or growth of the etiologic agent), and survival factors (factors that allow survival or fail to inactivate a contaminant) (Bryan FL, Guzewich JJ, Todd EC. Surveillance of Foodborne Diseases III. Summary and Presentation of Data on Vehicles and Contributory Factors: Their value and limitations. J Food Prot 1997;60(6):701–14). More than one contributing factor might be reported per outbreak. ‡ Contributing factors:
C1: toxic substance part of the tissueC2: poisonous substance intentionally / deliberately addedC3: poisonous substance accidentally / inadvertently addedC4: addition of excessive quantities of ingredients that are toxic in large amountsC5: toxic containerC6: contaminated raw product — food that was intended to be consumed after a kill stepC7: contaminated raw product — food was intended to be consumed raw or undercooked / under-processedC8: foods originating from sources shown to be contaminated or polluted (such as a growing field or harvest area)C9: cross-contamination of ingredients (cross-contamination does not include ill food workers)C10: bare-handed contact by a food handler / worker / preparer who is suspected to be infectiousC11: glove-handed contact by a food handler / worker / preparer who is suspected to be infectiousC12: other mode of contamination (excluding cross-contamination) by a food handler / worker / preparer who is suspected to be infectiousC13: foods contaminated by non-food handler / worker / preparer who is suspected to be infectiousC14: storage in a contaminated environmentC15: other source of contaminationP1: food preparation practices that support proliferation of pathogens (during food preparation)P2: no attempt was made to control the temperature of implicated food or the length of time food was out of temperature control (during food service or display of food)P3: improper adherence of approved plan to use Time as a Public Health ControlP4: improper cold holding due to malfunctioning refrigeration equipmentP5: improper cold holding due to an improper procedure or protocolP6: improper hot holding due to malfunctioning equipmentP7: improper hot holding due to improper procedure or protocolP8: improper / slow coolingP9: prolonged cold storageP10: inadequate modified atmospheric packagingP11: inadequate processing (acidification, water activity, fermentation)P12: other situations that promoted or allowed microbial growth or toxin productionS1: insufficient time and / or temperature control during initial cooking / heat processingS2: insufficient time and / or temperature during reheatingS3: insufficient time and / or temperature control during freezingS4: insufficient or improper use of chemical processes designed for pathogen destructionS5: other process failures that permit pathogen survival
§ No outbreaks in the data reported fall in this category.¶ An etiologic agent was not confirmed or suspected based on clinical, laboratory, or epidemiologic information.

For more information, please contactCenters for Disease Control and Prevention
1600 Clifton Road NE, Atlanta, GA 30333Telephone: 1-800-CDC-INFO (232-4636) / TTY: 1-888-232-6348
E-mail: [email protected]: http://www.cdc.gov