Embed Size (px)
Citation preview

Surveillance of Heart Diseases and Stroke Using Centers for Medicare and Medicaid (CMS) Data: A
Researcher’s Perspective
Judith H. Lichtman, PhD MPHAssociate Professor

• Need for strong population-based data to achieve surveillance goals.
Circulation, 2007;115:127-155

Current Gaps
• No comprehensive national surveillance system– Track patterns of disease, care, and
outcomes over time
• Cohort Studies– Provide valuable information, but have
limitations• CVD and stroke have a large impact in the
elderly population


Previous Strategies Using CMS Data
• Cross-sectional design• Subset of national cohort• Focus on short-term outcomes• Limited patient-level information• No individual follow-up over time


Prospective Surveillance
StrokeIndex Event
Outcomes• Mortality• Rehospitalization
• Recurrent Event• Other Events
• Utilization of Outpatient Resources
• Cost

Risk-Adjustment
Prior history
1 Year
Index Event: Comorbid or Complication?
OutcomesCohortCohortCohortCohortCohortCohort

Track Cohort over Time
OutcomesCohortCohortCohortCohortCohortCohort
Continuous FFS

Linked Hospitalizations: “Episode of Care”
Stroke IndexEvent
Hospital AOutcomes
Day 0
Stroke IndexEvent
Hospital B
Transfer
Day X

How to Access CMS Data: ResDAC
www.resdac.umn.edu/

CMS Data:Innovations have simplified the process

Readmission Rates by Sex122,063 hospital discharges for TIA (ICD-9 435)
Stroke 2009;40:2116-2122
1.1 1.3
0.5
5.35.9
4.5
1.1
1.8
0.7
4.9
6.9
5.8
0.0
2.0
4.0
6.0
8.0
TIA Stroke* CAD** TIA* Stroke* CAD*
30-Day 1-Year
Rat
e (%
)
Women Men
* p < 0.0001** p = 0.001

Risk-Adjusted Outcomes (Women / Men)
30-Day
0.5 1.0 1.5
1-Year
0.5 1.0 1.5
1.00(0.97-1.04)
1.01(0.90-1.13)
0.70(0.64-0.77)
0.86(0.74-1.00)
0.74(0.68-0.82)
Readmission(Hazards Ratio)
All-Cause
TIA
Stroke
CAD
Mortality(Odds Ratio)
All-Cause
1.02(1.01-1.04)
1.06(1.00-1.11)
0.85(0.81-0.89)
0.81(0.77-0.86)
0.78(0.75-0.81)
Analyses are risk-adjusted for age (continuous), race (white vs. other), admission source (ED, skilled nursing facility, vs. other), Deyo comorbidity score (≥ 3 vs. < 3), number of hospitalizations in prior year (≥2 vs. <2), and medical history (yes vs. no; cancer, dementia, chronic obstructive pulmonary disease, ischemic stroke, diabetes, hypertension, acute myocardial infarction, congestive heart failure, and atrial fibrillation). Stroke 2009;40:2116-2122
CAD and Mortality
WomenMen
1 30 60 90 120 150 180 210 240 270 300 330 365
0.8
0.85
0.9
0.9
51.
0
Pro
babi
lity
Fre
e of
CA
D R
eadm
issi
on
Days1 30 60 90 120 150 180 210 240 270 300 330 365
0.8
0.85
0.9
0.95
1.0
Sur
viva
l Pro
bab
ility
Days
(C) Coronary Artery Disease (D) Mortality
All analyses are adjusted for age (continuous), race (white vs. other), admission source (ED, skilled nursing facility, vs. other), Deyo comorbidity score (≥ 3 vs. < 3), number of hospitalizations in prior year (≥2 vs. <2), and medical history (yes vs. no; cancer, dementia, chronic obstructive pulmonary disorder, ischemic stroke, diabetes, hypertension, acute myocardial infarction, congestive heart failure, and atrial fibrillation). P<0.01
Stroke 2009;40:2116-2122

1-Year Recurrent Stroke Rates 1994-1996
A. Risk Standardized Recurrent Stroke Rates B. Counties with Standardized Rates Above the National Mean
<10.78
10.78 - 12.06
12.07 – 13.29
13.30 – 14.88
>14.89
No Data Available
Legend
Risk Standardized Rates(per 100 person years)
Cerebrovascular Diseases, in press

A. Risk Standardized Recurrent Stroke Rates B. Counties with Standardized Rates Above the National Mean
<10.43
10.43 – 11.59
11.60 – 12.62
12.63 – 14.06
>14.06
No Data Available
Legend
Risk Standardized Rates(per 100 person years)
1-Year Recurrent Stroke Rates 2000-2002
Cerebrovascular Diseases, in press

Legend>20% Decline
10% - 20% Decline
No Change
10% - 20% Increase
>20% Increase
No Data Available
*23 Counties Were Excluded Due to Percentage Errors greater than 20% for Risk-Standardized Rates at any of the time periods
Percentage Change in Risk Standardized 1-Year Recurrent Stoke Rates from 1994-1996 to 2000-2002
• Recurrent stroke hospitalization rates decreased by 5%• Marked geographic variation Cerebrovascular Diseases, in press
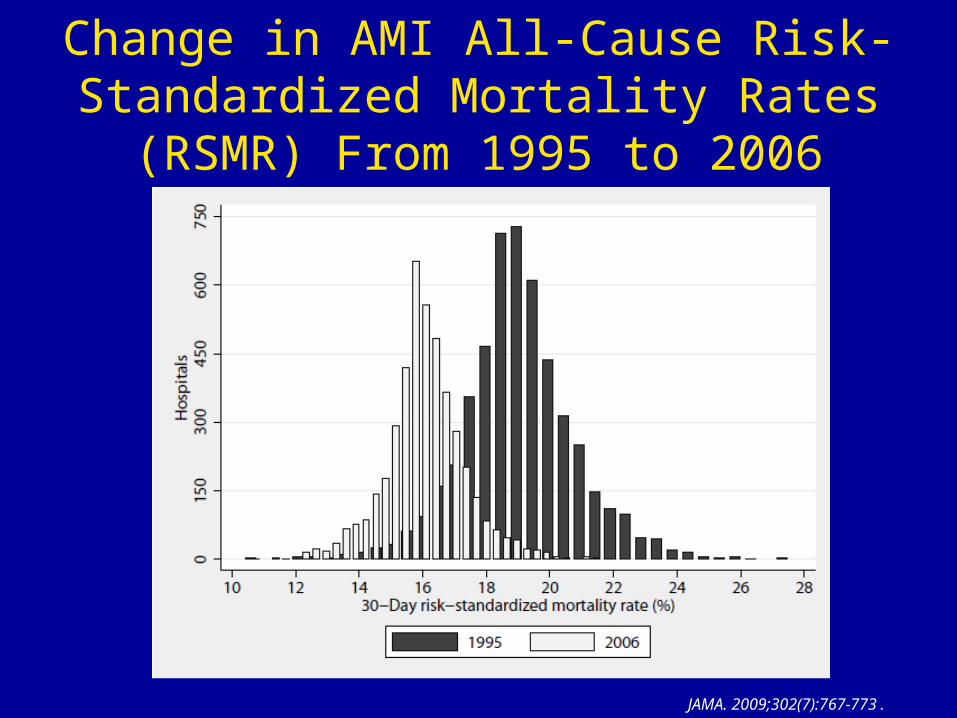
Change in AMI All-Cause Risk-Standardized Mortality Rates (RSMR)
From 1995 to 2006
JAMA. 2009;302(7):767-773.

AMI All-Cause Risk-Standardized Mortality Rates (RSMR)
From 1995 to 2006
JAMA. 2009;302(7):767-773.

1999(National Average RSMR = 10.5 [SD 2.6] %)
30-Day Stroke Risk Standardized Mortality Rate by HRR
Presented at ISC 2010

30-Day Stroke Risk Standardized Mortality Rate by HRR
2005(National Average RSMR = 11.2 [SD 1.7] %)
Presented at ISC 2010

Unadjusted Outcomes
9.8
13.8
11.3
0.0
2.0
4.0
6.0
8.0
10.0
12.0
14.0
16.0
30-Day Mortality 30-Day Readmission
Per
cen
tag
e (%
)
14.6
JCAHO Certified: Yes No
**
*p <.0001
Stroke 2009;40:3574-3579
Organization of Stroke Care: Joint Commission Certified Primary Stroke Centers

Risk Adjusted Analyses: Stroke Outcomes
Outcomes* OR (95% CI)
30-Day Mortality……………...…0.94 (0.92-0.97)
30-Day Readmission…...……...0.97 (0.95-0.99)
.Referent Group=Non-JCAHO Certified Hospitals*Adjusted for age, gender, race, Deyo score 3+, 2+ hospitalizations in prior year, prior stroke, diabetes, history of AMI, cancer, heart failure, COPD, dementia, hypertension, CABG and PTCA
Risk Adjusted Outcomes For Patients Treated at JCAHO Certified Stroke Centers vs Non-Accredited Hospitals
Stroke 2009;40:3574-3579

Advantages of Using CMS Data
• National perspective– Patient level and hospital level analyses
• “Aerial” view of disease in the elderly– Subgroups– Time trends– Utilization of resources
• Complements the perspective of cohort studies and registries
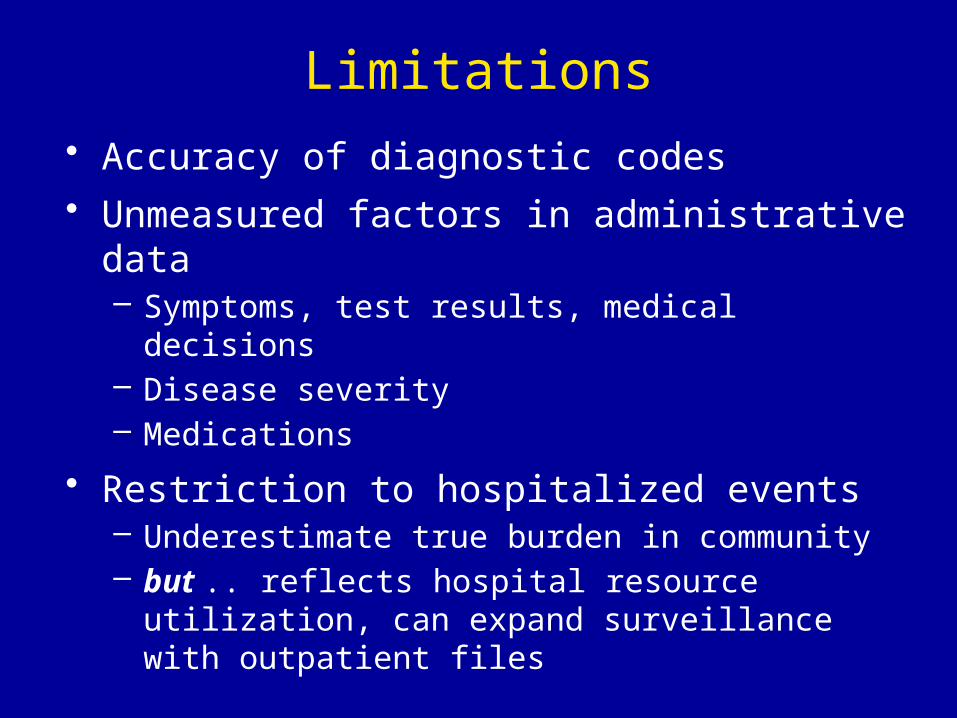
Limitations
• Accuracy of diagnostic codes• Unmeasured factors in administrative data
– Symptoms, test results, medical decisions– Disease severity– Medications
• Restriction to hospitalized events – Underestimate true burden in community– but .. reflects hospital resource utilization, can expand
surveillance with outpatient files

Future…..
• Develop expertise in using administrative data for disease surveillance (seminars, workshops)
• Use additional CMS data files (Outpatient, SNF)• Combine data resources
– Social economic status– Behavioral / lifestyle factors– Access and availability of care– Medications– Cost data– Registries with additional clinical detail

Thank you


![[Lichtman Stuart] Cybernetic Transposition(BookZZ.org)](https://img.pdfslide.net/doc/110x75/55cf9443550346f57ba0bcf0/lichtman-stuart-cybernetic-transpositionbookzzorg.jpg)