Embed Size (px)
Citation preview
Surveillance of influenza and other respiratory viruses in the United Kingdom: Winter 2015 to 2016
Surveillance of influenza and other respiratory viruses in the United Kingdom: Winter 2015 to 2016
About Public Health England
Public Health England exists to protect and improve the nation's health and wellbeing,
and reduce health inequalities. It does this through world-class science, knowledge and
intelligence, advocacy, partnerships and the delivery of specialist public health services.
PHE is an operationally autonomous executive agency of the Department of Health.
Public Health England
Wellington House
133-155 Waterloo Road
London SE1 8UG
Tel: 020 7654 8000
www.gov.uk/phe
Twitter: @PHE_uk
Facebook: www.facebook.com/PublicHealthEngland
Prepared by: Influenza Section, Respiratory Diseases Department, National Infection
Service, Colindale
For queries relating to this document, please contact: [email protected]
© Crown copyright 2014
You may re-use this information (excluding logos) free of charge in any format or
medium, under the terms of the Open Government Licence v3.0. To view this licence,
visit OGL or email [email protected]. Where we have identified any third
party copyright information you will need to obtain permission from the copyright
holders concerned. Any enquiries regarding this publication should be sent to [insert
email address].
Published May 2016
PHE publications gateway number: 2016086
Surveillance of influenza and other respiratory viruses in the United Kingdom: Winter 2015 to 2016
3
Contents
About Public Health England 2
Executive summary 4
Background 5
Observations 7
Community surveillance 7 Primary care consultations 14 Secondary care surveillance 16 Microbiological surveillance 22 Vaccination 27
Other respiratory viruses 33 Excess all-cause mortality surveillance 38 Emerging respiratory viruses 41
Conclusions 43
Acknowledgments 44
Surveillance of influenza and other respiratory viruses in the United Kingdom: Winter 2015 to 2016
4
Executive summary
Moderate levels of influenza activity were seen in the community in the UK in 2015 to 2016, with influenza A(H1N1)pdm09 the predominant circulating virus for the majority of the season peaking late in week 11 of 2016 and influenza B peaking afterwards. The impact of A(H1N1)pdm09 was predominantly seen in young adults, the pattern of those affected appeared to be different across parts of the UK; while a consistent pattern of numerous outbreaks in hospitals, high numbers of admissions to hospital and ICU/HDU was observed, the impact on general practice and schools was variable (moderate in England and Wales and low in Northern Ireland and Scotland). Peak admissions to hospital and ICU were higher than seen in the previous few seasons, but lower than the last notable A(H1N1)pdm09 season in 2010 to 2011. Levels of excess all-cause mortality were significantly lower than last season, but some excess mortality was seen in younger adults. The UK, as with many Northern Hemisphere countries has reported that the majority of circulating A(H1N1)pdm09 circulating strains was antigenically similar to the A/California/7/2009 Northern Hemisphere 2015/16 (H1N1)pdm09 vaccine strain. Influenza vaccine uptake in 2015 to 2016 in England was lower than last season in the elderly (71.0%); in healthcare workers (50.6%); in under 65 year olds in a pre-defined clinical risk group (45.1%) and in pregnant women (42.3%). In 2015 to 2016, the universal childhood influenza vaccine programme with live attenuated influenza vaccine (LAIV) was again offered to all two, three and four year olds across the UK, plus to all children of school age Year 1 and Year 2 for the first time in England. Uptake achieved in these groups was 35.4%, 37.7%, 30.0%, 54.4% and 52.9% respectively in England. For the pilot programme for the children of primary school age (five to 11 years) in England, an overall uptake of 57.9% was achieved. In Scotland, an uptake of 71.5% was achieved in primary school age children, in Northern Ireland an uptake of 76.8% also in primary school age children and in Wales, children aged two and three years and four to six years were offered vaccine, achieving uptakes of 44.5% and 63.4% respectively. The UK provisional end of season overall adjusted vaccine effectiveness (VE) in preventing influenza confirmed infection in primary care was 52.4%, similar to the mid-season estimate published earlier this year. Work continues to evaluate the impact of the LAIV programme in terms of both direct and indirect protection for the general population across the UK. The importance of ensuring high uptake in target groups for the national influenza vaccination programme for the forthcoming influenza season remains. Activity from other circulating seasonal respiratory viruses was similar to levels reported in recent years. Two novel respiratory viruses which emerged in 2012 to 2013, Middle East Respiratory Syndrome coronavirus (MERS-CoV) in the Middle East and avian-origin influenza A(H7N9) in Eastern China, have continued to result in human cases in affected countries in 2015 to 2016. Surveillance and public health measures established in the UK for travellers returning with severe respiratory disease from these regions are on-going while the risk remains.
Surveillance of influenza and other respiratory viruses in the United Kingdom: Winter 2015 to 2016
Background
Surveillance of influenza and other respiratory viruses in the United Kingdom (UK) is
undertaken throughout the year and collated by the Respiratory Diseases Department
(RDD) of Public Health England’s (PHE) National Infection Service (NIS), with weekly
outputs published during the winter season between October (week 40) and May (week
20) the period when influenza typically circulates1. This is in collaboration with teams
within PHE, Health Protection Scotland2, Public Health Wales3 and the Northern Ireland
Pulibc Health Agency4. A variety of data sources are collated to provide information on
circulating influenza strains (including antigenic and genetic characterisation) and
antiviral resistance monitoring, timing of influenza activity and to provide rapid estimates
of burden within the community, on the health service and in relation to excess all-cause
mortality. In addition, in-season and end-of-season monitoring of seasonal influenza
vaccine uptake and effectiveness is undertaken.
Background information on the data sources covered in this report has been previously
described5. The Moving Epidemic Method (MEM)6 is used by the European Centre for
Disease Prevention and Control to standardise reporting of influenza activity across
Europe. It has been adopted by the UK and is publicly presented for GP influenza-like
illness (ILI) consultation rates for each UK scheme and for the proportion of samples
positive for influenza through the respiratory DataMart scheme.
During the 2015 to 2016 season, the roll-out of a newly licensed live attenuated
influenza vaccine (LAIV) has continued across the UK. In England, LAIV was offered to
all two, three and four year olds through primary care and additionally was also offered
to children of school age Year 1 and Year 2 (four to seven year olds) this year.
Additional influenza vaccination activity for children was also carried out with strategies
varying by country of the UK. In England, there were geographical pilots targeting
children of school age Year 3 to Year 6. In Wales, all four year olds were offered LAIV in
school, whereas in Scotland and Northern Ireland, all primary school age children were
offered LAIV vaccination.
1 www.gov.uk/government/collections/seasonal-influenza-guidance-data-and-analysis
2 www.hps.scot.nhs.uk/resp/index.aspx 3 www.wales.nhs.uk/sites3/page.cfm?orgid=457&pid=34338
4 http://www.publichealth.hscni.net/directorate-public-health/health-protection/influenza
5 Health Protection Agency. Surveillance of influenza and other respiratory viruses in the UK: 2011-2012
report.Available from: http://webarchive.nationalarchives.gov.uk/20140714084352/http://www.hpa.org.uk/webc/HPAwebFile/HPAweb_C/1317134705939 6 Vega T, et al. Influenza surveillance in Europe: establishing epidemic thresholds by the Moving Epidemic
Method. Influenza and Other Respiratory Viruses 2012. doi: 10.1111/j.1750-2659.2012.00422.x.
Surveillance of influenza and other respiratory viruses in the United Kingdom: Winter 2015 to 2016
6
PHE also carries out surveillance for novel respiratory viruses, including Middle East
Respiratory Syndrome Coronavirus (MERS-CoV) which was first recognised in
September 2012, influenza A(H7N9) which emerged in Eastern China in 2013.
Influenza A(H5N1) which emerged in China in 2003 and influenza A(H5N6) which has
been seen in China since 2013.
This report describes influenza activity experienced in the UK in the 2015 to 2016
season from week 40 of 2015 (week commencing 28 September 2015) to week 17 of
2016 (week commencing 25 April 2016). This includes observations and commentary
from the childhood vaccination programme, activity of other seasonal and novel
respiratory viruses.
Surveillance of influenza and other respiratory viruses in the United Kingdom: Winter 2015 to 2016
7
Observations
Community surveillance
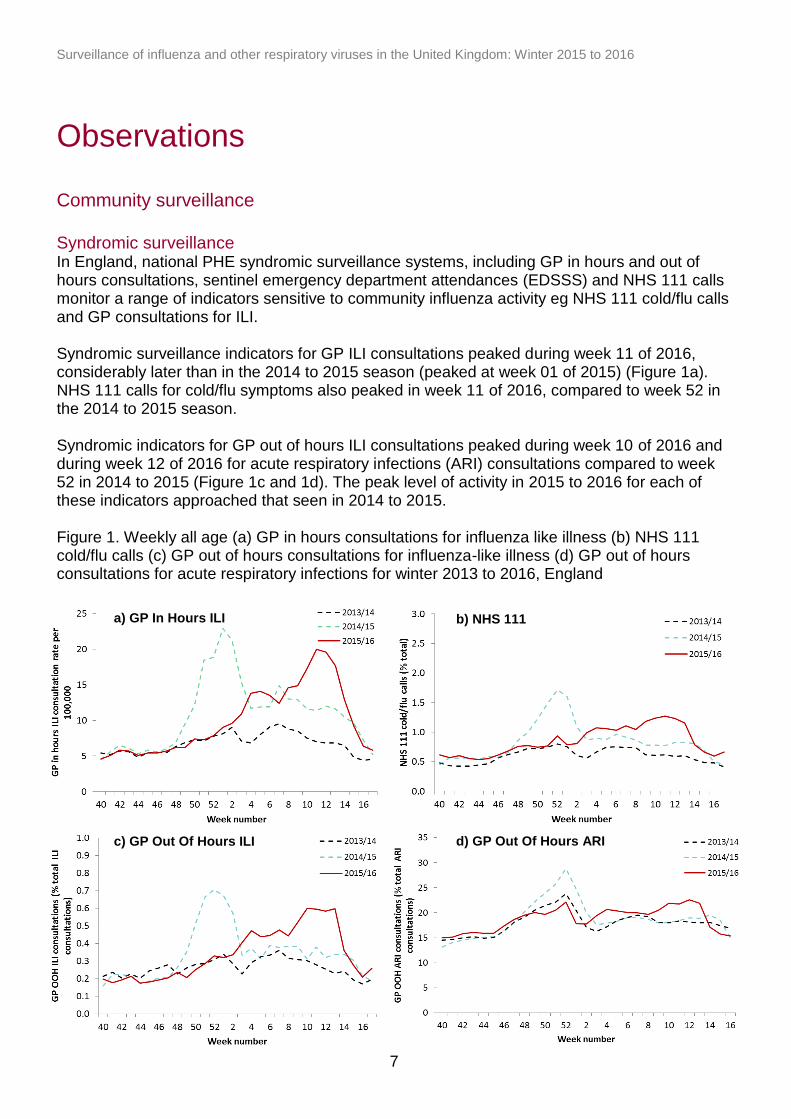
Syndromic surveillance In England, national PHE syndromic surveillance systems, including GP in hours and out of hours consultations, sentinel emergency department attendances (EDSSS) and NHS 111 calls monitor a range of indicators sensitive to community influenza activity eg NHS 111 cold/flu calls and GP consultations for ILI. Syndromic surveillance indicators for GP ILI consultations peaked during week 11 of 2016, considerably later than in the 2014 to 2015 season (peaked at week 01 of 2015) (Figure 1a). NHS 111 calls for cold/flu symptoms also peaked in week 11 of 2016, compared to week 52 in the 2014 to 2015 season. Syndromic indicators for GP out of hours ILI consultations peaked during week 10 of 2016 and during week 12 of 2016 for acute respiratory infections (ARI) consultations compared to week 52 in 2014 to 2015 (Figure 1c and 1d). The peak level of activity in 2015 to 2016 for each of these indicators approached that seen in 2014 to 2015. Figure 1. Weekly all age (a) GP in hours consultations for influenza like illness (b) NHS 111 cold/flu calls (c) GP out of hours consultations for influenza-like illness (d) GP out of hours consultations for acute respiratory infections for winter 2013 to 2016, England
a) GP In Hours ILI b) NHS 111
c) GP Out Of Hours ILI d) GP Out Of Hours ARI
Surveillance of influenza and other respiratory viruses in the United Kingdom: Winter 2015 to 2016
8
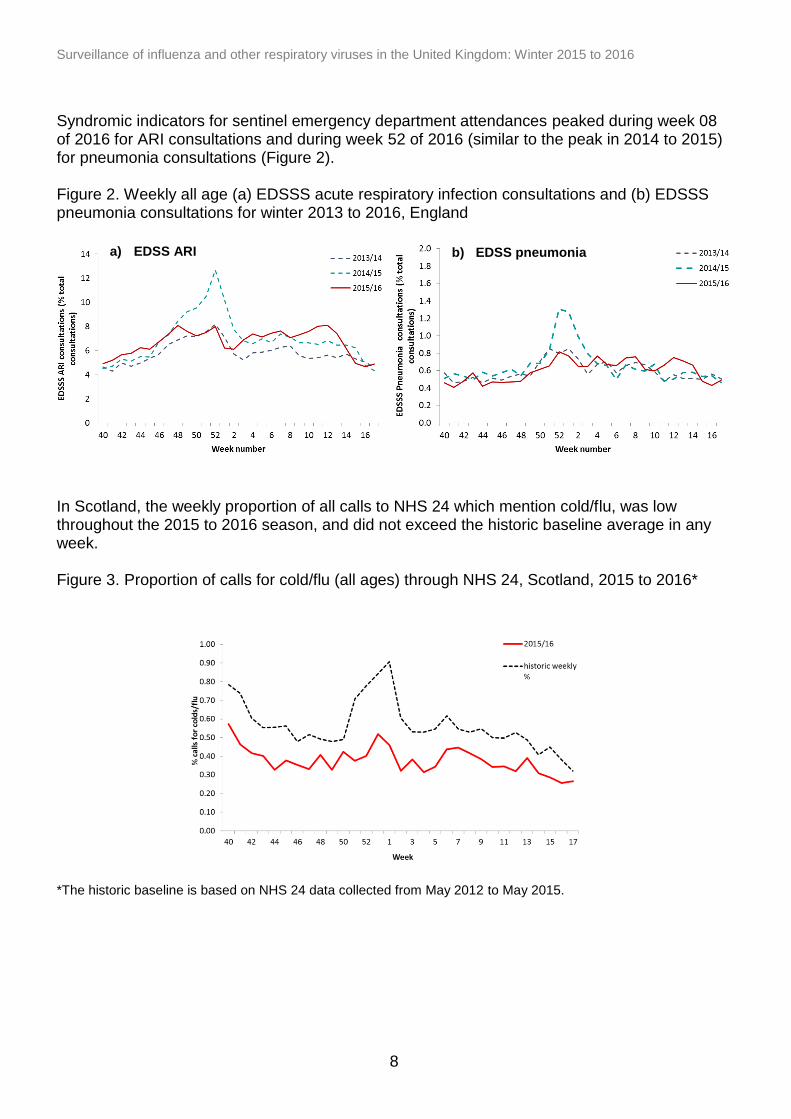
a) EDSS ARI b) EDSS pneumonia
Syndromic indicators for sentinel emergency department attendances peaked during week 08 of 2016 for ARI consultations and during week 52 of 2016 (similar to the peak in 2014 to 2015) for pneumonia consultations (Figure 2). Figure 2. Weekly all age (a) EDSSS acute respiratory infection consultations and (b) EDSSS pneumonia consultations for winter 2013 to 2016, England
In Scotland, the weekly proportion of all calls to NHS 24 which mention cold/flu, was low throughout the 2015 to 2016 season, and did not exceed the historic baseline average in any week. Figure 3. Proportion of calls for cold/flu (all ages) through NHS 24, Scotland, 2015 to 2016* *The historic baseline is based on NHS 24 data collected from May 2012 to May 2015.
Surveillance of influenza and other respiratory viruses in the United Kingdom: Winter 2015 to 2016
9
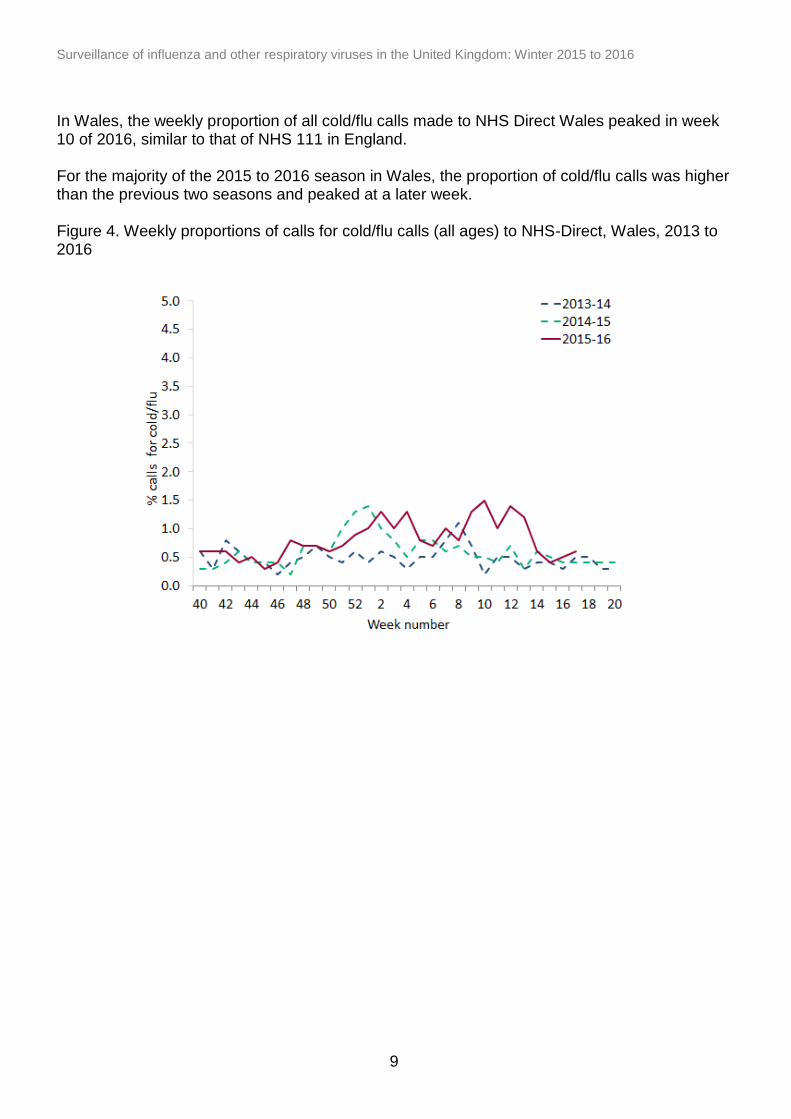
In Wales, the weekly proportion of all cold/flu calls made to NHS Direct Wales peaked in week 10 of 2016, similar to that of NHS 111 in England. For the majority of the 2015 to 2016 season in Wales, the proportion of cold/flu calls was higher than the previous two seasons and peaked at a later week. Figure 4. Weekly proportions of calls for cold/flu calls (all ages) to NHS-Direct, Wales, 2013 to 2016
Surveillance of influenza and other respiratory viruses in the United Kingdom: Winter 2015 to 2016
10
Outbreak reporting
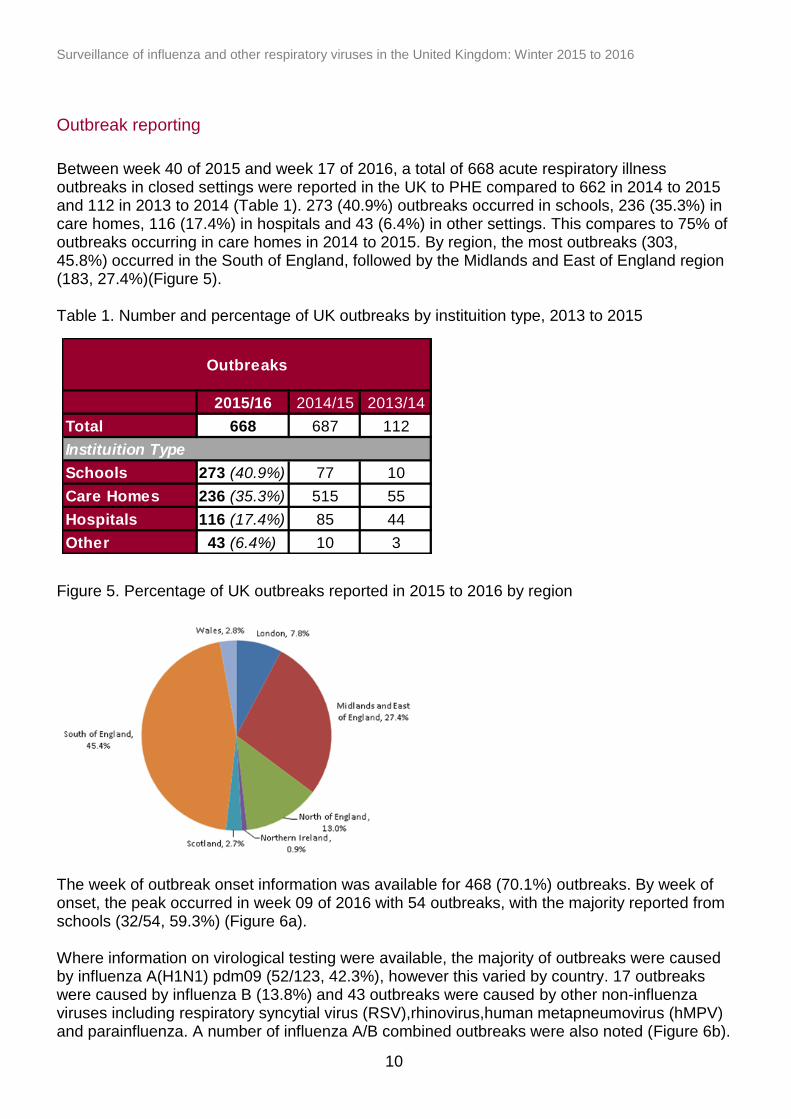
Between week 40 of 2015 and week 17 of 2016, a total of 668 acute respiratory illness outbreaks in closed settings were reported in the UK to PHE compared to 662 in 2014 to 2015 and 112 in 2013 to 2014 (Table 1). 273 (40.9%) outbreaks occurred in schools, 236 (35.3%) in care homes, 116 (17.4%) in hospitals and 43 (6.4%) in other settings. This compares to 75% of outbreaks occurring in care homes in 2014 to 2015. By region, the most outbreaks (303, 45.8%) occurred in the South of England, followed by the Midlands and East of England region (183, 27.4%)(Figure 5). Table 1. Number and percentage of UK outbreaks by instituition type, 2013 to 2015
Figure 5. Percentage of UK outbreaks reported in 2015 to 2016 by region
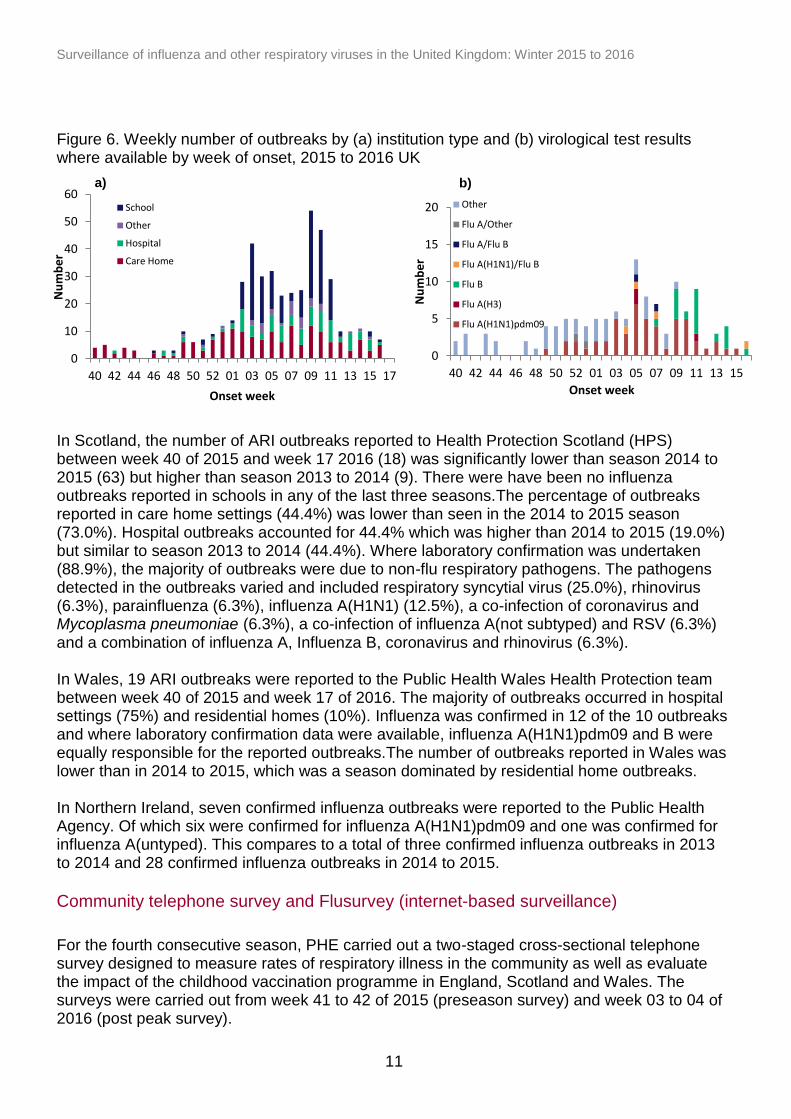
The week of outbreak onset information was available for 468 (70.1%) outbreaks. By week of onset, the peak occurred in week 09 of 2016 with 54 outbreaks, with the majority reported from schools (32/54, 59.3%) (Figure 6a). Where information on virological testing were available, the majority of outbreaks were caused by influenza A(H1N1) pdm09 (52/123, 42.3%), however this varied by country. 17 outbreaks were caused by influenza B (13.8%) and 43 outbreaks were caused by other non-influenza viruses including respiratory syncytial virus (RSV),rhinovirus,human metapneumovirus (hMPV) and parainfluenza. A number of influenza A/B combined outbreaks were also noted (Figure 6b).
2015/16 2014/15 2013/14
Total 668 687 112
Schools 273 (40.9%) 77 10
Care Homes 236 (35.3%) 515 55
Hospitals 116 (17.4%) 85 44
Other 43 (6.4%) 10 3
Outbreaks
Instituition Type
Surveillance of influenza and other respiratory viruses in the United Kingdom: Winter 2015 to 2016
11
Figure 6. Weekly number of outbreaks by (a) institution type and (b) virological test results where available by week of onset, 2015 to 2016 UK
In Scotland, the number of ARI outbreaks reported to Health Protection Scotland (HPS) between week 40 of 2015 and week 17 2016 (18) was significantly lower than season 2014 to 2015 (63) but higher than season 2013 to 2014 (9). There were have been no influenza outbreaks reported in schools in any of the last three seasons.The percentage of outbreaks reported in care home settings (44.4%) was lower than seen in the 2014 to 2015 season (73.0%). Hospital outbreaks accounted for 44.4% which was higher than 2014 to 2015 (19.0%) but similar to season 2013 to 2014 (44.4%). Where laboratory confirmation was undertaken (88.9%), the majority of outbreaks were due to non-flu respiratory pathogens. The pathogens detected in the outbreaks varied and included respiratory syncytial virus (25.0%), rhinovirus (6.3%), parainfluenza (6.3%), influenza A(H1N1) (12.5%), a co-infection of coronavirus and Mycoplasma pneumoniae (6.3%), a co-infection of influenza A(not subtyped) and RSV (6.3%) and a combination of influenza A, Influenza B, coronavirus and rhinovirus (6.3%). In Wales, 19 ARI outbreaks were reported to the Public Health Wales Health Protection team between week 40 of 2015 and week 17 of 2016. The majority of outbreaks occurred in hospital settings (75%) and residential homes (10%). Influenza was confirmed in 12 of the 10 outbreaks and where laboratory confirmation data were available, influenza A(H1N1)pdm09 and B were equally responsible for the reported outbreaks.The number of outbreaks reported in Wales was lower than in 2014 to 2015, which was a season dominated by residential home outbreaks. In Northern Ireland, seven confirmed influenza outbreaks were reported to the Public Health Agency. Of which six were confirmed for influenza A(H1N1)pdm09 and one was confirmed for influenza A(untyped). This compares to a total of three confirmed influenza outbreaks in 2013 to 2014 and 28 confirmed influenza outbreaks in 2014 to 2015.
Community telephone survey and Flusurvey (internet-based surveillance)
For the fourth consecutive season, PHE carried out a two-staged cross-sectional telephone survey designed to measure rates of respiratory illness in the community as well as evaluate the impact of the childhood vaccination programme in England, Scotland and Wales. The surveys were carried out from week 41 to 42 of 2015 (preseason survey) and week 03 to 04 of 2016 (post peak survey).
0
5
10
15
20
40 42 44 46 48 50 52 01 03 05 07 09 11 13 15
Nu
mb
er
Onset week
Other
Flu A/Other
Flu A/Flu B
Flu A(H1N1)/Flu B
Flu B
Flu A(H3)
Flu A(H1N1)pdm09
0
10
20
30
40
50
60
40 42 44 46 48 50 52 01 03 05 07 09 11 13 15 17
Nu
mb
er
Onset week
School
Other
Hospital
Care Home
a) b)
Surveillance of influenza and other respiratory viruses in the United Kingdom: Winter 2015 to 2016
12
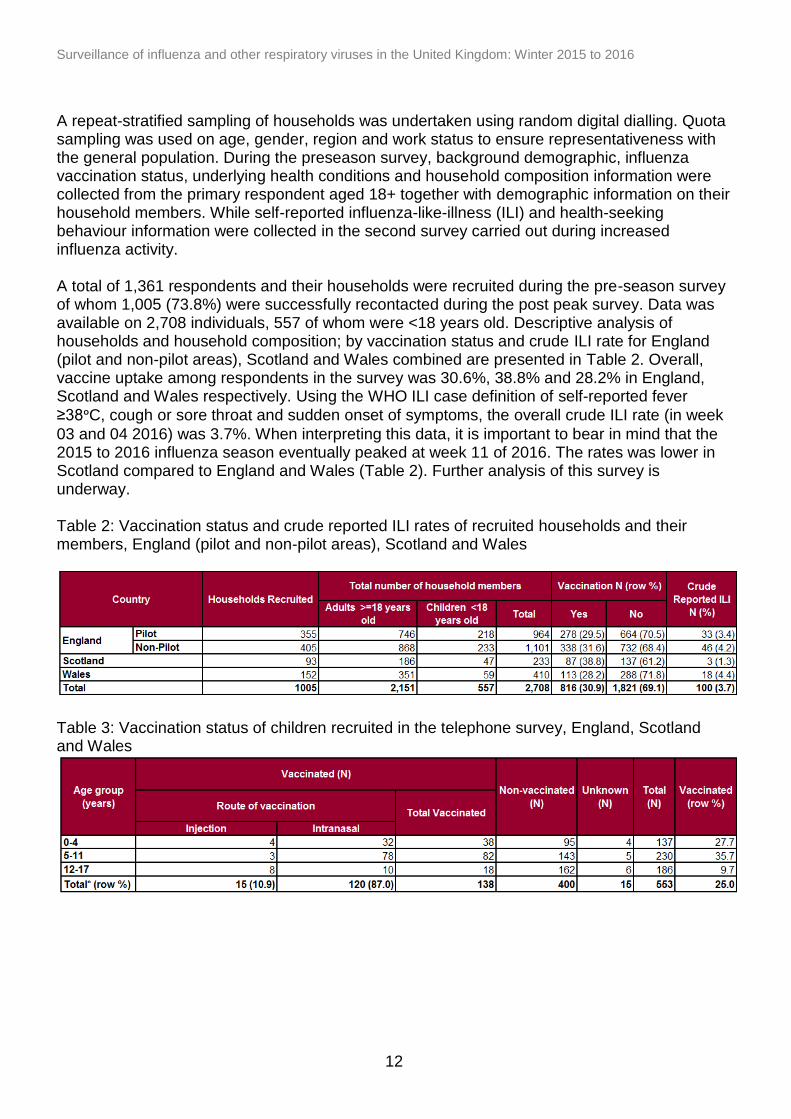
A repeat-stratified sampling of households was undertaken using random digital dialling. Quota sampling was used on age, gender, region and work status to ensure representativeness with the general population. During the preseason survey, background demographic, influenza vaccination status, underlying health conditions and household composition information were collected from the primary respondent aged 18+ together with demographic information on their household members. While self-reported influenza-like-illness (ILI) and health-seeking behaviour information were collected in the second survey carried out during increased influenza activity. A total of 1,361 respondents and their households were recruited during the pre-season survey of whom 1,005 (73.8%) were successfully recontacted during the post peak survey. Data was available on 2,708 individuals, 557 of whom were <18 years old. Descriptive analysis of households and household composition; by vaccination status and crude ILI rate for England (pilot and non-pilot areas), Scotland and Wales combined are presented in Table 2. Overall, vaccine uptake among respondents in the survey was 30.6%, 38.8% and 28.2% in England, Scotland and Wales respectively. Using the WHO ILI case definition of self-reported fever
≥38ᵒC, cough or sore throat and sudden onset of symptoms, the overall crude ILI rate (in week
03 and 04 2016) was 3.7%. When interpreting this data, it is important to bear in mind that the 2015 to 2016 influenza season eventually peaked at week 11 of 2016. The rates was lower in Scotland compared to England and Wales (Table 2). Further analysis of this survey is underway. Table 2: Vaccination status and crude reported ILI rates of recruited households and their members, England (pilot and non-pilot areas), Scotland and Wales
Table 3: Vaccination status of children recruited in the telephone survey, England, Scotland and Wales
Surveillance of influenza and other respiratory viruses in the United Kingdom: Winter 2015 to 2016
13
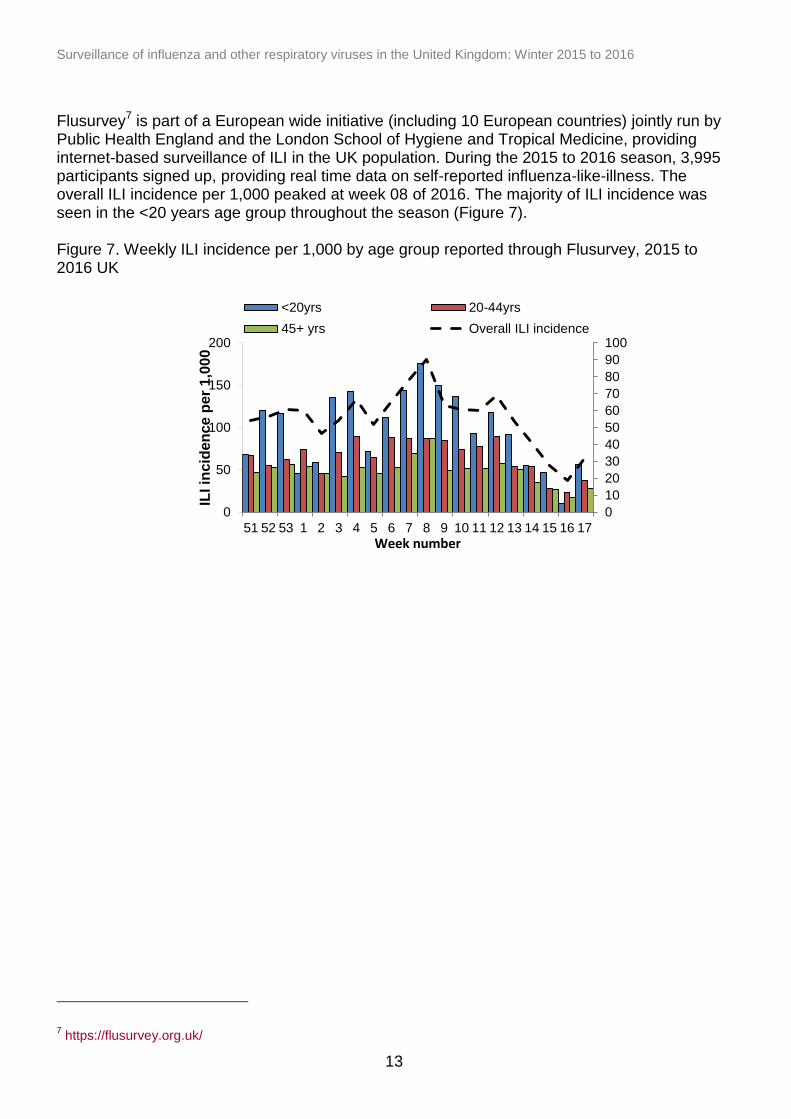
Flusurvey7 is part of a European wide initiative (including 10 European countries) jointly run by Public Health England and the London School of Hygiene and Tropical Medicine, providing internet-based surveillance of ILI in the UK population. During the 2015 to 2016 season, 3,995 participants signed up, providing real time data on self-reported influenza-like-illness. The overall ILI incidence per 1,000 peaked at week 08 of 2016. The majority of ILI incidence was seen in the <20 years age group throughout the season (Figure 7). Figure 7. Weekly ILI incidence per 1,000 by age group reported through Flusurvey, 2015 to 2016 UK
7 https://flusurvey.org.uk/
0
10
20
30
40
50
60
70
80
90
100
0
50
100
150
200
51 52 53 1 2 3 4 5 6 7 8 9 10 11 12 13 14 15 16 17
ILI in
cid
en
ce
per
1,0
00
Week number
<20yrs 20-44yrs
45+ yrs Overall ILI incidence
Surveillance of influenza and other respiratory viruses in the United Kingdom: Winter 2015 to 2016
14
0
5
10
15
20
25
30
35
40
<1yr 1-4yrs 5-14yrs 15-44yrs 45-64yrs 65-74yrs 75+yrs
Max
imu
m IL
I rat
e p
er
10
0,0
00
p
op
ula
tio
n
Age group
Primary care consultations
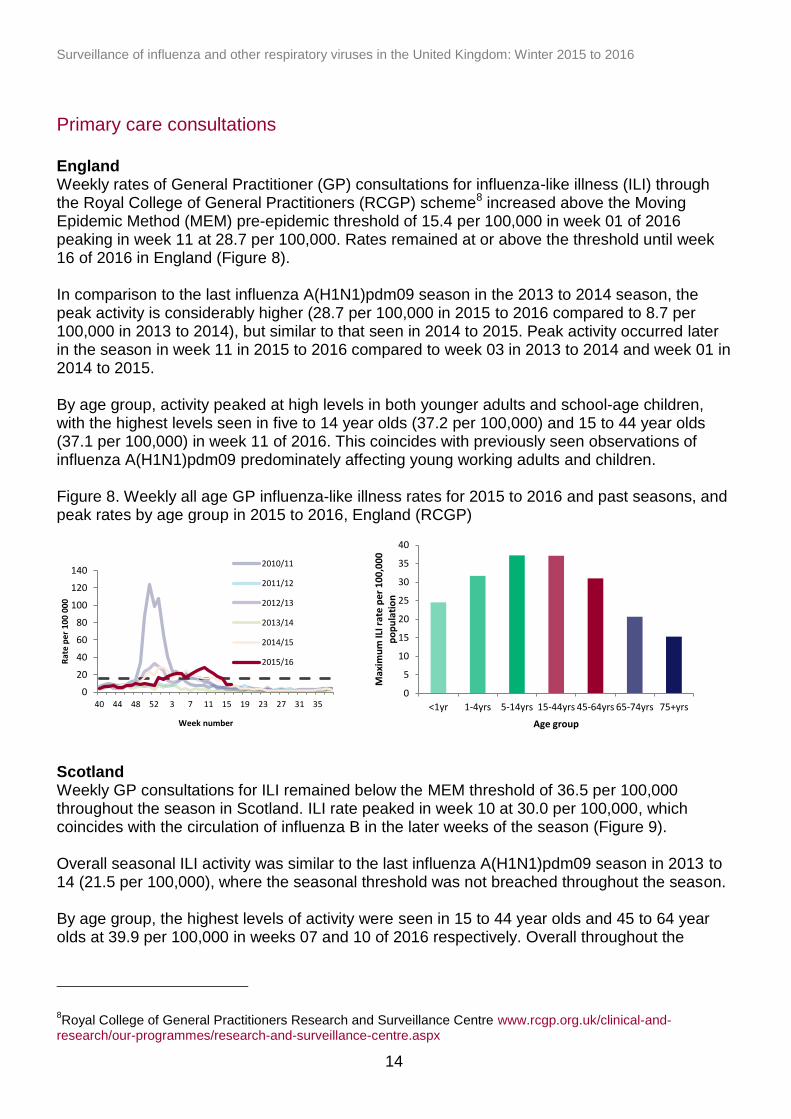
England Weekly rates of General Practitioner (GP) consultations for influenza-like illness (ILI) through the Royal College of General Practitioners (RCGP) scheme8 increased above the Moving Epidemic Method (MEM) pre-epidemic threshold of 15.4 per 100,000 in week 01 of 2016 peaking in week 11 at 28.7 per 100,000. Rates remained at or above the threshold until week 16 of 2016 in England (Figure 8). In comparison to the last influenza A(H1N1)pdm09 season in the 2013 to 2014 season, the peak activity is considerably higher (28.7 per 100,000 in 2015 to 2016 compared to 8.7 per 100,000 in 2013 to 2014), but similar to that seen in 2014 to 2015. Peak activity occurred later in the season in week 11 in 2015 to 2016 compared to week 03 in 2013 to 2014 and week 01 in 2014 to 2015. By age group, activity peaked at high levels in both younger adults and school-age children, with the highest levels seen in five to 14 year olds (37.2 per 100,000) and 15 to 44 year olds (37.1 per 100,000) in week 11 of 2016. This coincides with previously seen observations of influenza A(H1N1)pdm09 predominately affecting young working adults and children. Figure 8. Weekly all age GP influenza-like illness rates for 2015 to 2016 and past seasons, and peak rates by age group in 2015 to 2016, England (RCGP)
Scotland Weekly GP consultations for ILI remained below the MEM threshold of 36.5 per 100,000 throughout the season in Scotland. ILI rate peaked in week 10 at 30.0 per 100,000, which coincides with the circulation of influenza B in the later weeks of the season (Figure 9). Overall seasonal ILI activity was similar to the last influenza A(H1N1)pdm09 season in 2013 to 14 (21.5 per 100,000), where the seasonal threshold was not breached throughout the season. By age group, the highest levels of activity were seen in 15 to 44 year olds and 45 to 64 year olds at 39.9 per 100,000 in weeks 07 and 10 of 2016 respectively. Overall throughout the
8Royal College of General Practitioners Research and Surveillance Centre www.rcgp.org.uk/clinical-and-
research/our-programmes/research-and-surveillance-centre.aspx
0
20
40
60
80
100
120
140
40 44 48 52 3 7 11 15 19 23 27 31 35
Rat
e p
er 1
00 0
00
Week number
2010/11
2011/12
2012/13
2013/14
2014/15
2015/16
Surveillance of influenza and other respiratory viruses in the United Kingdom: Winter 2015 to 2016
15
0
5
10
15
20
25
30
35
40
45
<1yr 1-4yrs 5-14yrs 15-44yrs 45-64yrs 65-74yrs 75+yrs
Max
imu
m IL
I rat
e p
er
10
0,0
00
p
op
ula
tio
n
Age group
0
50
100
150
200
250
300
40 44 48 52 3 7 11 15 19 23 27 31 35
Rat
e p
er 1
00
00
0
Week number
2010/11
2011/12
2012/13
2013/14
2014/15
2015/16
0
5
10
15
20
25
30
35
40
45
<1yr 1-4yrs 5-14yrs 15-44yrs 45-64yrs 65-74yrs 75+yrs
Max
imu
m IL
I rat
e p
er
10
0,0
00
p
op
ula
tio
n
Age group
0
10
20
30
40
50
60
70
80
90
100
40 44 48 52 3 7 11 15 19 23 27 31 35
Rat
e p
er 1
00 0
00
Week number
2010/11
2011/12
2012/13
2013/14
2015/16
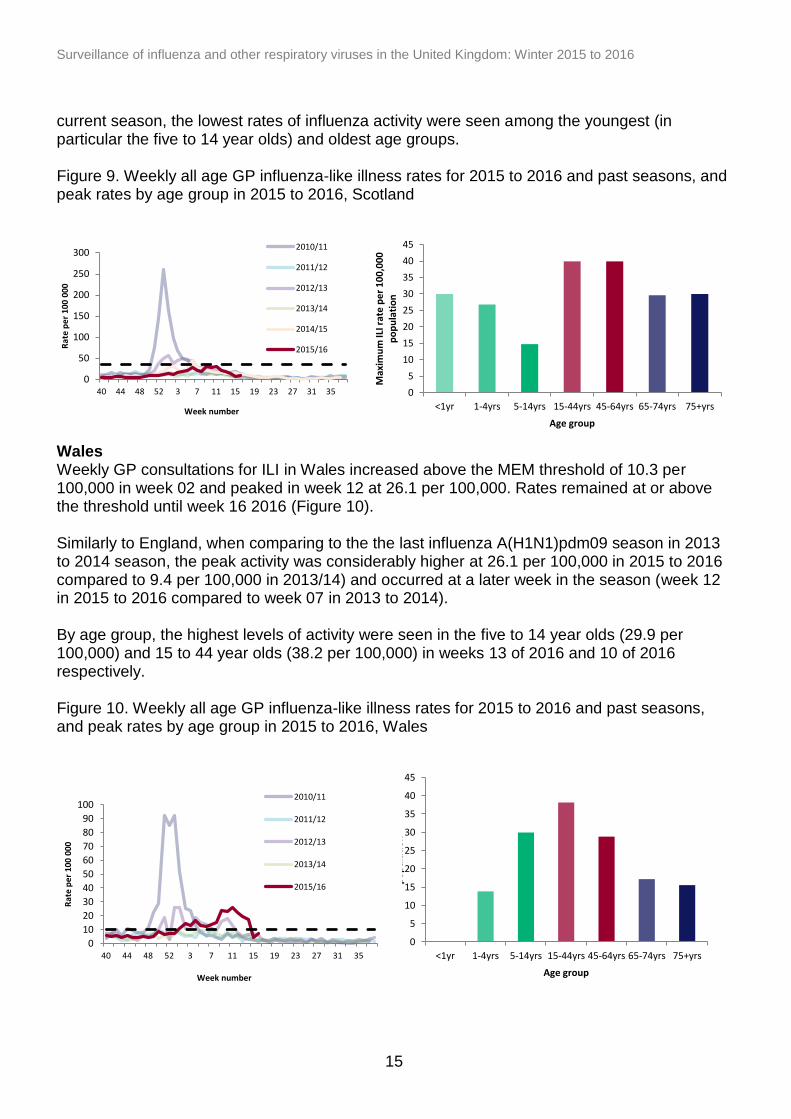
current season, the lowest rates of influenza activity were seen among the youngest (in particular the five to 14 year olds) and oldest age groups. Figure 9. Weekly all age GP influenza-like illness rates for 2015 to 2016 and past seasons, and peak rates by age group in 2015 to 2016, Scotland
Wales Weekly GP consultations for ILI in Wales increased above the MEM threshold of 10.3 per 100,000 in week 02 and peaked in week 12 at 26.1 per 100,000. Rates remained at or above the threshold until week 16 2016 (Figure 10). Similarly to England, when comparing to the the last influenza A(H1N1)pdm09 season in 2013 to 2014 season, the peak activity was considerably higher at 26.1 per 100,000 in 2015 to 2016 compared to 9.4 per 100,000 in 2013/14) and occurred at a later week in the season (week 12 in 2015 to 2016 compared to week 07 in 2013 to 2014). By age group, the highest levels of activity were seen in the five to 14 year olds (29.9 per 100,000) and 15 to 44 year olds (38.2 per 100,000) in weeks 13 of 2016 and 10 of 2016 respectively. Figure 10. Weekly all age GP influenza-like illness rates for 2015 to 2016 and past seasons, and peak rates by age group in 2015 to 2016, Wales
Surveillance of influenza and other respiratory viruses in the United Kingdom: Winter 2015 to 2016
16
0
50
100
150
200
250
300
40 44 48 52 3 7 11 15 19 23 27 31 35
Rat
e p
er 1
00 0
00
Week number
2010/11
2011/12
2012/13
2013/14
2014/15
2015/16
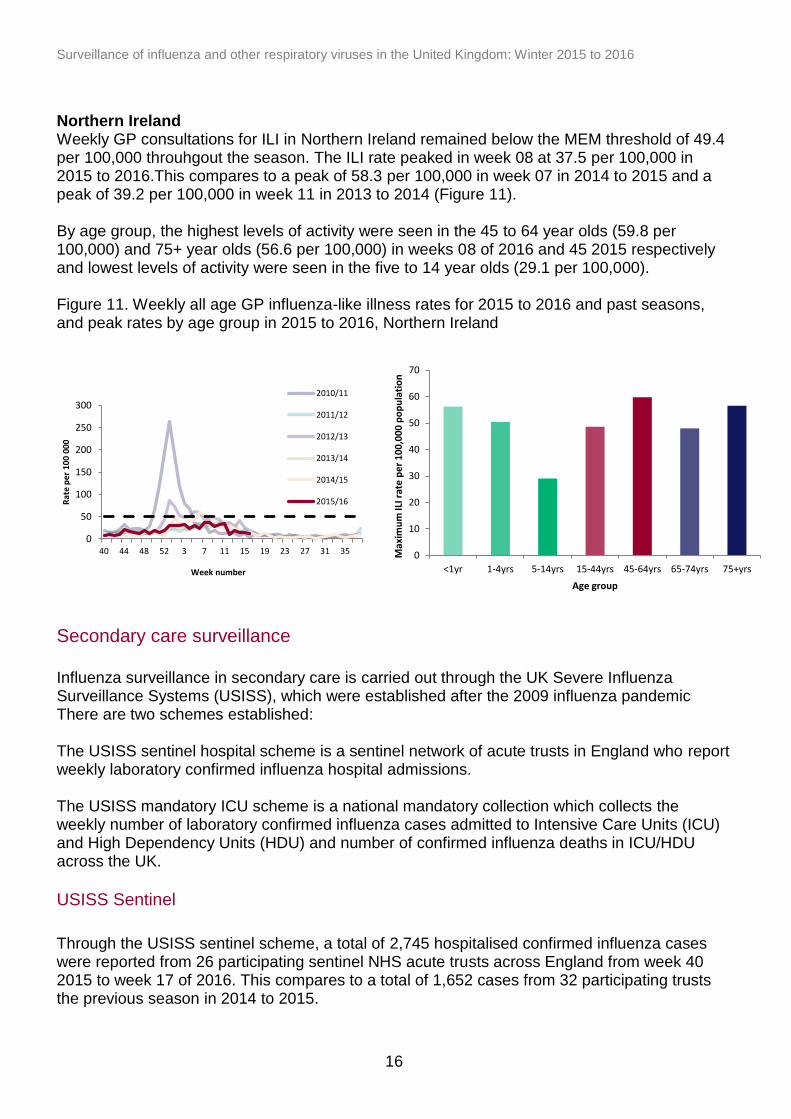
Northern Ireland Weekly GP consultations for ILI in Northern Ireland remained below the MEM threshold of 49.4 per 100,000 throuhgout the season. The ILI rate peaked in week 08 at 37.5 per 100,000 in 2015 to 2016.This compares to a peak of 58.3 per 100,000 in week 07 in 2014 to 2015 and a peak of 39.2 per 100,000 in week 11 in 2013 to 2014 (Figure 11). By age group, the highest levels of activity were seen in the 45 to 64 year olds (59.8 per 100,000) and 75+ year olds (56.6 per 100,000) in weeks 08 of 2016 and 45 2015 respectively and lowest levels of activity were seen in the five to 14 year olds (29.1 per 100,000). Figure 11. Weekly all age GP influenza-like illness rates for 2015 to 2016 and past seasons, and peak rates by age group in 2015 to 2016, Northern Ireland
Secondary care surveillance
Influenza surveillance in secondary care is carried out through the UK Severe Influenza Surveillance Systems (USISS), which were established after the 2009 influenza pandemic There are two schemes established: The USISS sentinel hospital scheme is a sentinel network of acute trusts in England who report weekly laboratory confirmed influenza hospital admissions. The USISS mandatory ICU scheme is a national mandatory collection which collects the weekly number of laboratory confirmed influenza cases admitted to Intensive Care Units (ICU) and High Dependency Units (HDU) and number of confirmed influenza deaths in ICU/HDU across the UK.
USISS Sentinel
Through the USISS sentinel scheme, a total of 2,745 hospitalised confirmed influenza cases were reported from 26 participating sentinel NHS acute trusts across England from week 40 2015 to week 17 of 2016. This compares to a total of 1,652 cases from 32 participating trusts the previous season in 2014 to 2015.
0
10
20
30
40
50
60
70
<1yr 1-4yrs 5-14yrs 15-44yrs 45-64yrs 65-74yrs 75+yrs
Max
imu
m IL
I rat
e p
er
10
0,0
00
po
pu
lati
on
Age group
Surveillance of influenza and other respiratory viruses in the United Kingdom: Winter 2015 to 2016
17
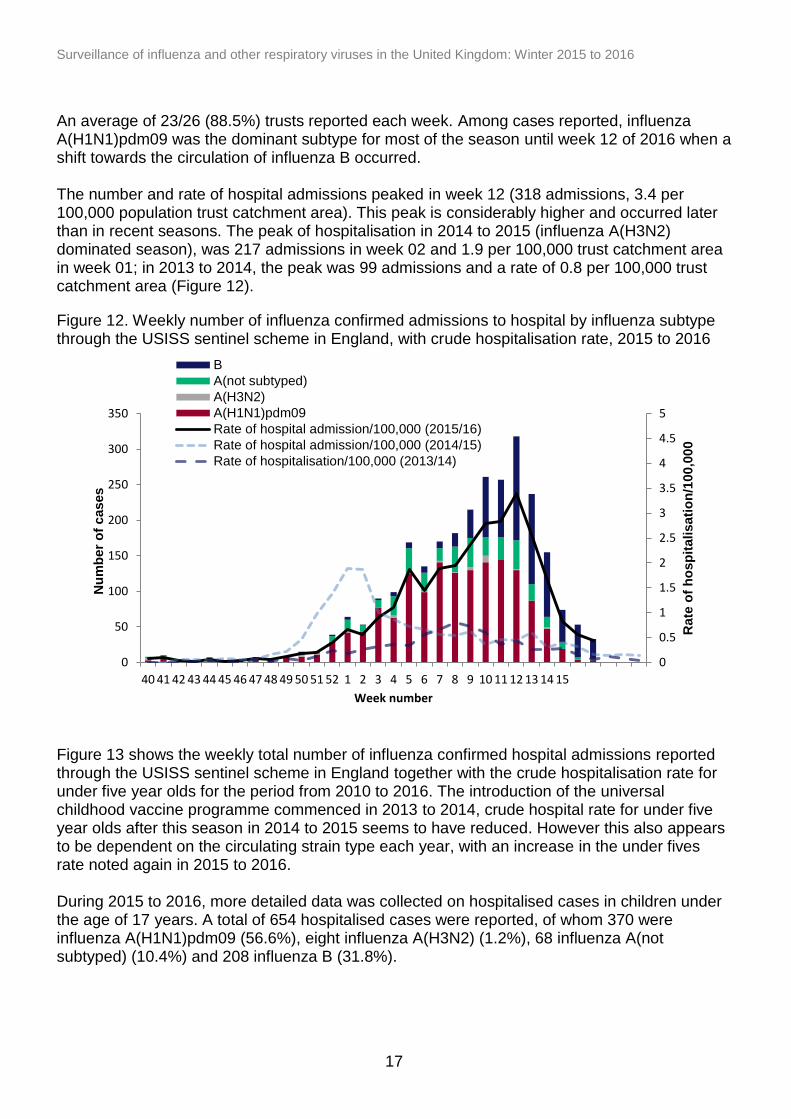
An average of 23/26 (88.5%) trusts reported each week. Among cases reported, influenza A(H1N1)pdm09 was the dominant subtype for most of the season until week 12 of 2016 when a shift towards the circulation of influenza B occurred. The number and rate of hospital admissions peaked in week 12 (318 admissions, 3.4 per 100,000 population trust catchment area). This peak is considerably higher and occurred later than in recent seasons. The peak of hospitalisation in 2014 to 2015 (influenza A(H3N2) dominated season), was 217 admissions in week 02 and 1.9 per 100,000 trust catchment area in week 01; in 2013 to 2014, the peak was 99 admissions and a rate of 0.8 per 100,000 trust catchment area (Figure 12). Figure 12. Weekly number of influenza confirmed admissions to hospital by influenza subtype through the USISS sentinel scheme in England, with crude hospitalisation rate, 2015 to 2016
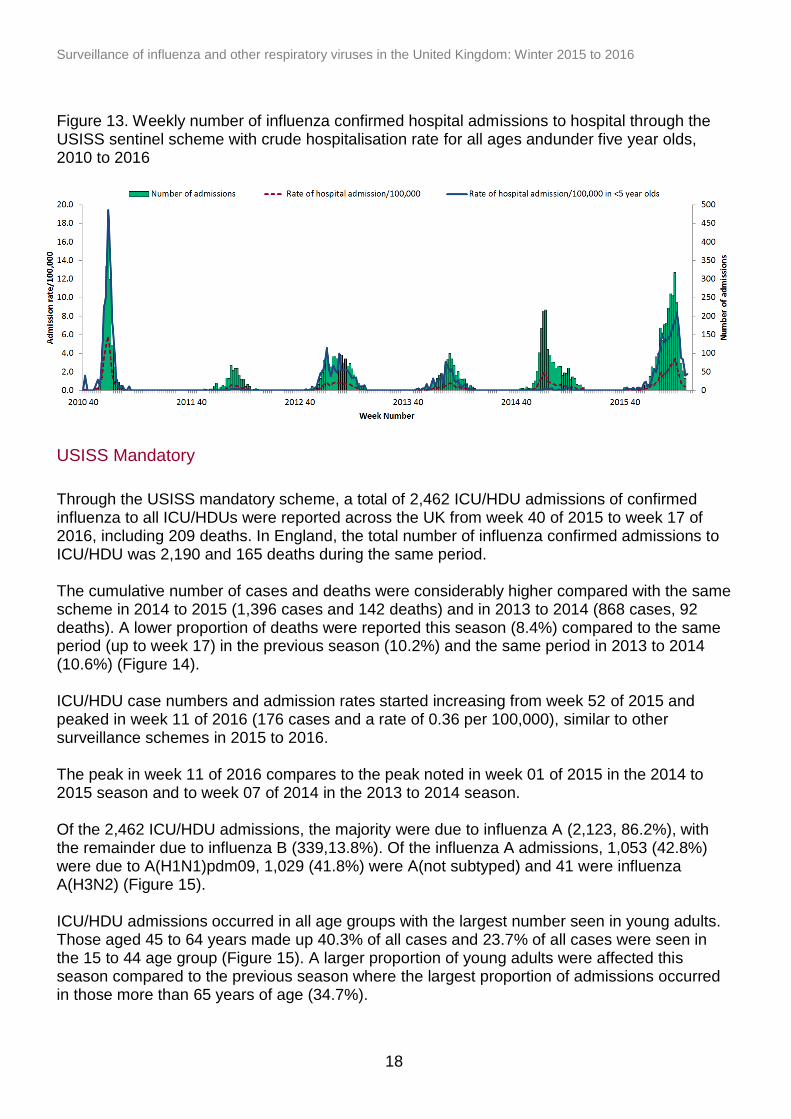
Figure 13 shows the weekly total number of influenza confirmed hospital admissions reported through the USISS sentinel scheme in England together with the crude hospitalisation rate for under five year olds for the period from 2010 to 2016. The introduction of the universal childhood vaccine programme commenced in 2013 to 2014, crude hospital rate for under five year olds after this season in 2014 to 2015 seems to have reduced. However this also appears to be dependent on the circulating strain type each year, with an increase in the under fives rate noted again in 2015 to 2016. During 2015 to 2016, more detailed data was collected on hospitalised cases in children under the age of 17 years. A total of 654 hospitalised cases were reported, of whom 370 were influenza A(H1N1)pdm09 (56.6%), eight influenza A(H3N2) (1.2%), 68 influenza A(not subtyped) (10.4%) and 208 influenza B (31.8%).
0
0.5
1
1.5
2
2.5
3
3.5
4
4.5
5
0
50
100
150
200
250
300
350
40 41 42 43 44 45 46 47 48 49 50 51 52 1 2 3 4 5 6 7 8 9 10 11 12 13 14 15R
ate
of
ho
sp
italisati
on
/100,0
00
Nu
mb
er
of
cases
Week number
B
A(not subtyped)
A(H3N2)
A(H1N1)pdm09
Rate of hospital admission/100,000 (2015/16)
Rate of hospital admission/100,000 (2014/15)
Rate of hospitalisation/100,000 (2013/14)
Surveillance of influenza and other respiratory viruses in the United Kingdom: Winter 2015 to 2016
18
Figure 13. Weekly number of influenza confirmed hospital admissions to hospital through the USISS sentinel scheme with crude hospitalisation rate for all ages andunder five year olds, 2010 to 2016
USISS Mandatory
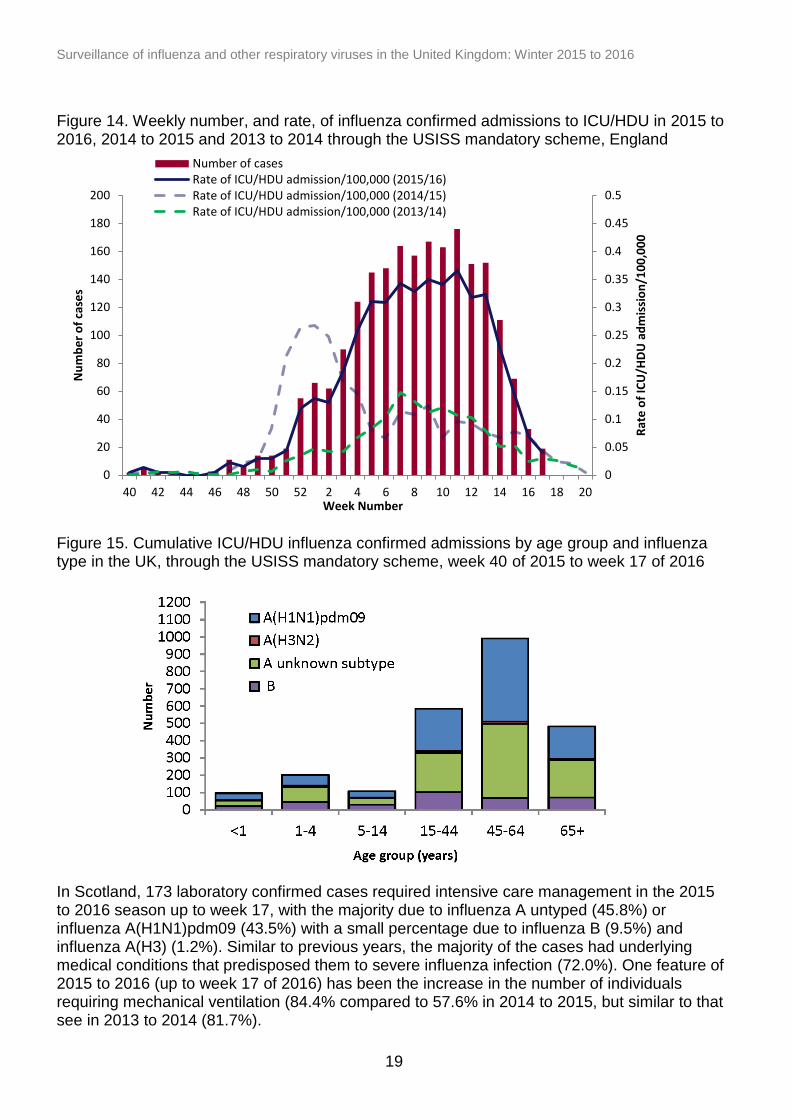
Through the USISS mandatory scheme, a total of 2,462 ICU/HDU admissions of confirmed influenza to all ICU/HDUs were reported across the UK from week 40 of 2015 to week 17 of 2016, including 209 deaths. In England, the total number of influenza confirmed admissions to ICU/HDU was 2,190 and 165 deaths during the same period. The cumulative number of cases and deaths were considerably higher compared with the same scheme in 2014 to 2015 (1,396 cases and 142 deaths) and in 2013 to 2014 (868 cases, 92 deaths). A lower proportion of deaths were reported this season (8.4%) compared to the same period (up to week 17) in the previous season (10.2%) and the same period in 2013 to 2014 (10.6%) (Figure 14). ICU/HDU case numbers and admission rates started increasing from week 52 of 2015 and peaked in week 11 of 2016 (176 cases and a rate of 0.36 per 100,000), similar to other surveillance schemes in 2015 to 2016. The peak in week 11 of 2016 compares to the peak noted in week 01 of 2015 in the 2014 to 2015 season and to week 07 of 2014 in the 2013 to 2014 season. Of the 2,462 ICU/HDU admissions, the majority were due to influenza A (2,123, 86.2%), with the remainder due to influenza B (339,13.8%). Of the influenza A admissions, 1,053 (42.8%) were due to A(H1N1)pdm09, 1,029 (41.8%) were A(not subtyped) and 41 were influenza A(H3N2) (Figure 15). ICU/HDU admissions occurred in all age groups with the largest number seen in young adults. Those aged 45 to 64 years made up 40.3% of all cases and 23.7% of all cases were seen in the 15 to 44 age group (Figure 15). A larger proportion of young adults were affected this season compared to the previous season where the largest proportion of admissions occurred in those more than 65 years of age (34.7%).
Surveillance of influenza and other respiratory viruses in the United Kingdom: Winter 2015 to 2016
19
0
0.05
0.1
0.15
0.2
0.25
0.3
0.35
0.4
0.45
0.5
0
20
40
60
80
100
120
140
160
180
200
40 42 44 46 48 50 52 2 4 6 8 10 12 14 16 18 20
Rat
e o
f IC
U/H
DU
ad
mis
sio
n/1
00
,00
0
Nu
mb
er
of
case
s
Week Number
Number of casesRate of ICU/HDU admission/100,000 (2015/16)Rate of ICU/HDU admission/100,000 (2014/15)Rate of ICU/HDU admission/100,000 (2013/14)
Figure 14. Weekly number, and rate, of influenza confirmed admissions to ICU/HDU in 2015 to 2016, 2014 to 2015 and 2013 to 2014 through the USISS mandatory scheme, England
Figure 15. Cumulative ICU/HDU influenza confirmed admissions by age group and influenza type in the UK, through the USISS mandatory scheme, week 40 of 2015 to week 17 of 2016 In Scotland, 173 laboratory confirmed cases required intensive care management in the 2015 to 2016 season up to week 17, with the majority due to influenza A untyped (45.8%) or influenza A(H1N1)pdm09 (43.5%) with a small percentage due to influenza B (9.5%) and influenza A(H3) (1.2%). Similar to previous years, the majority of the cases had underlying medical conditions that predisposed them to severe influenza infection (72.0%). One feature of 2015 to 2016 (up to week 17 of 2016) has been the increase in the number of individuals requiring mechanical ventilation (84.4% compared to 57.6% in 2014 to 2015, but similar to that see in 2013 to 2014 (81.7%).
Surveillance of influenza and other respiratory viruses in the United Kingdom: Winter 2015 to 2016
20
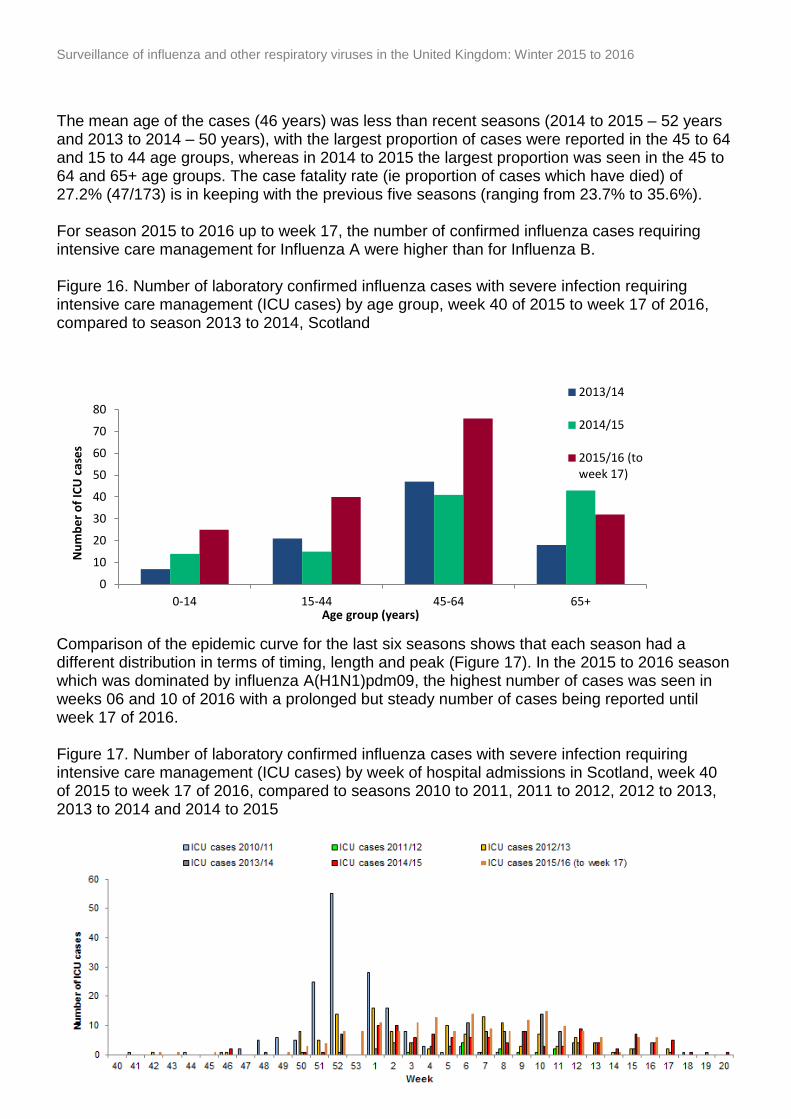
The mean age of the cases (46 years) was less than recent seasons (2014 to 2015 – 52 years and 2013 to 2014 – 50 years), with the largest proportion of cases were reported in the 45 to 64 and 15 to 44 age groups, whereas in 2014 to 2015 the largest proportion was seen in the 45 to 64 and 65+ age groups. The case fatality rate (ie proportion of cases which have died) of 27.2% (47/173) is in keeping with the previous five seasons (ranging from 23.7% to 35.6%). For season 2015 to 2016 up to week 17, the number of confirmed influenza cases requiring intensive care management for Influenza A were higher than for Influenza B. Figure 16. Number of laboratory confirmed influenza cases with severe infection requiring intensive care management (ICU cases) by age group, week 40 of 2015 to week 17 of 2016, compared to season 2013 to 2014, Scotland
Comparison of the epidemic curve for the last six seasons shows that each season had a different distribution in terms of timing, length and peak (Figure 17). In the 2015 to 2016 season which was dominated by influenza A(H1N1)pdm09, the highest number of cases was seen in weeks 06 and 10 of 2016 with a prolonged but steady number of cases being reported until week 17 of 2016. Figure 17. Number of laboratory confirmed influenza cases with severe infection requiring intensive care management (ICU cases) by week of hospital admissions in Scotland, week 40 of 2015 to week 17 of 2016, compared to seasons 2010 to 2011, 2011 to 2012, 2012 to 2013, 2013 to 2014 and 2014 to 2015
0
10
20
30
40
50
60
70
80
0-14 15-44 45-64 65+
Nu
mb
er
of
ICU
cas
es
Age group (years)
2013/14
2014/15
2015/16 (toweek 17)
Surveillance of influenza and other respiratory viruses in the United Kingdom: Winter 2015 to 2016
21
0
2
4
6
8
10
12
14
16
18
20
40 42 44 46 48 50 52 1 3 5 7 9 11 13 15 17
Nu
mb
er
of
con
firm
ed
cas
es
(n)
Week number
A (untyped)
Flu B
A-H1N1
A(H3)
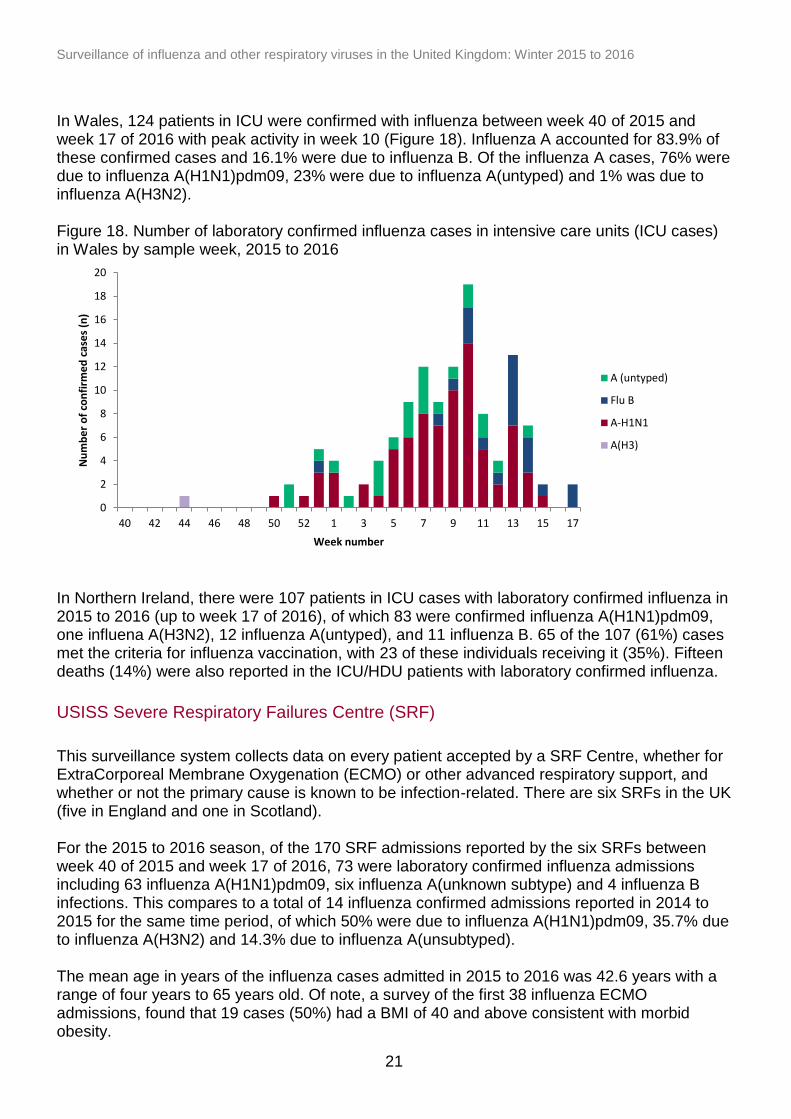
In Wales, 124 patients in ICU were confirmed with influenza between week 40 of 2015 and week 17 of 2016 with peak activity in week 10 (Figure 18). Influenza A accounted for 83.9% of these confirmed cases and 16.1% were due to influenza B. Of the influenza A cases, 76% were due to influenza A(H1N1)pdm09, 23% were due to influenza A(untyped) and 1% was due to influenza A(H3N2). Figure 18. Number of laboratory confirmed influenza cases in intensive care units (ICU cases) in Wales by sample week, 2015 to 2016
In Northern Ireland, there were 107 patients in ICU cases with laboratory confirmed influenza in 2015 to 2016 (up to week 17 of 2016), of which 83 were confirmed influenza A(H1N1)pdm09, one influena A(H3N2), 12 influenza A(untyped), and 11 influenza B. 65 of the 107 (61%) cases met the criteria for influenza vaccination, with 23 of these individuals receiving it (35%). Fifteen deaths (14%) were also reported in the ICU/HDU patients with laboratory confirmed influenza.
USISS Severe Respiratory Failures Centre (SRF)
This surveillance system collects data on every patient accepted by a SRF Centre, whether for ExtraCorporeal Membrane Oxygenation (ECMO) or other advanced respiratory support, and whether or not the primary cause is known to be infection-related. There are six SRFs in the UK (five in England and one in Scotland). For the 2015 to 2016 season, of the 170 SRF admissions reported by the six SRFs between week 40 of 2015 and week 17 of 2016, 73 were laboratory confirmed influenza admissions including 63 influenza A(H1N1)pdm09, six influenza A(unknown subtype) and 4 influenza B infections. This compares to a total of 14 influenza confirmed admissions reported in 2014 to 2015 for the same time period, of which 50% were due to influenza A(H1N1)pdm09, 35.7% due to influenza A(H3N2) and 14.3% due to influenza A(unsubtyped). The mean age in years of the influenza cases admitted in 2015 to 2016 was 42.6 years with a range of four years to 65 years old. Of note, a survey of the first 38 influenza ECMO admissions, found that 19 cases (50%) had a BMI of 40 and above consistent with morbid obesity.
Surveillance of influenza and other respiratory viruses in the United Kingdom: Winter 2015 to 2016
22
Microbiological surveillance
Respiratory DataMart
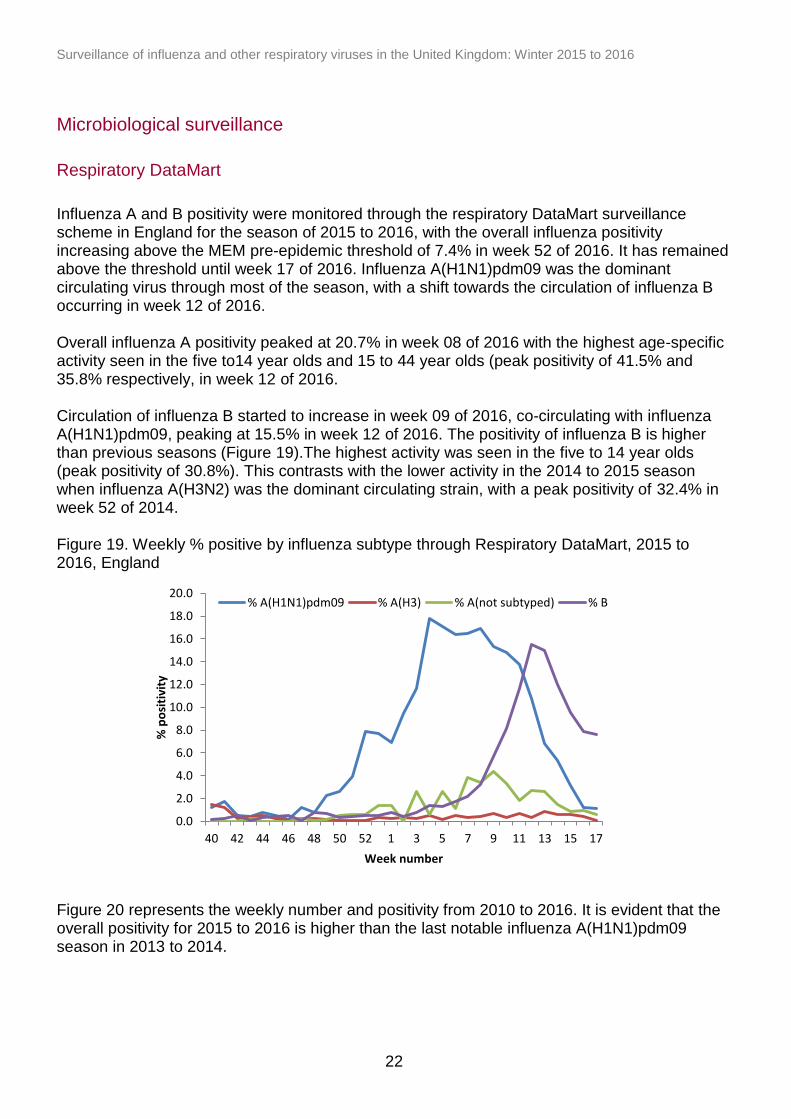
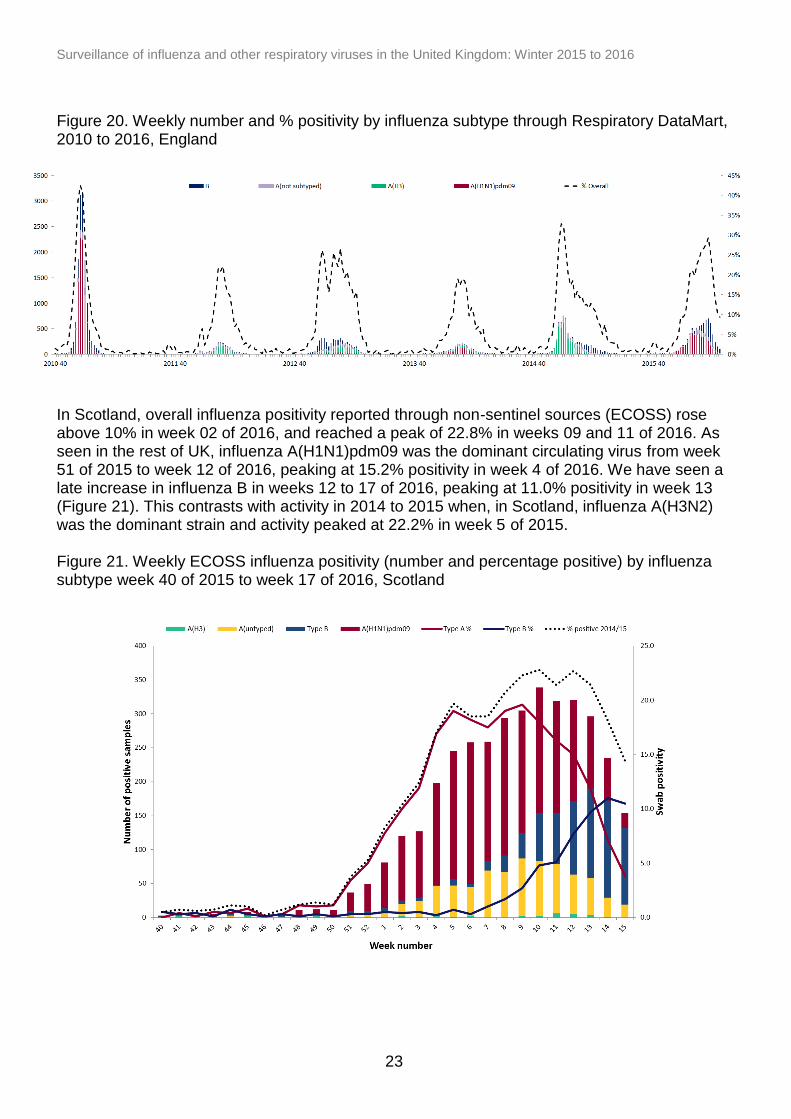
Influenza A and B positivity were monitored through the respiratory DataMart surveillance scheme in England for the season of 2015 to 2016, with the overall influenza positivity increasing above the MEM pre-epidemic threshold of 7.4% in week 52 of 2016. It has remained above the threshold until week 17 of 2016. Influenza A(H1N1)pdm09 was the dominant circulating virus through most of the season, with a shift towards the circulation of influenza B occurring in week 12 of 2016. Overall influenza A positivity peaked at 20.7% in week 08 of 2016 with the highest age-specific activity seen in the five to14 year olds and 15 to 44 year olds (peak positivity of 41.5% and 35.8% respectively, in week 12 of 2016. Circulation of influenza B started to increase in week 09 of 2016, co-circulating with influenza A(H1N1)pdm09, peaking at 15.5% in week 12 of 2016. The positivity of influenza B is higher than previous seasons (Figure 19).The highest activity was seen in the five to 14 year olds (peak positivity of 30.8%). This contrasts with the lower activity in the 2014 to 2015 season when influenza A(H3N2) was the dominant circulating strain, with a peak positivity of 32.4% in week 52 of 2014. Figure 19. Weekly % positive by influenza subtype through Respiratory DataMart, 2015 to 2016, England Figure 20 represents the weekly number and positivity from 2010 to 2016. It is evident that the overall positivity for 2015 to 2016 is higher than the last notable influenza A(H1N1)pdm09 season in 2013 to 2014.
0.0
2.0
4.0
6.0
8.0
10.0
12.0
14.0
16.0
18.0
20.0
40 42 44 46 48 50 52 1 3 5 7 9 11 13 15 17
% p
osi
tivi
ty
Week number
% A(H1N1)pdm09 % A(H3) % A(not subtyped) % B
Surveillance of influenza and other respiratory viruses in the United Kingdom: Winter 2015 to 2016
23
Figure 20. Weekly number and % positivity by influenza subtype through Respiratory DataMart, 2010 to 2016, England
In Scotland, overall influenza positivity reported through non-sentinel sources (ECOSS) rose above 10% in week 02 of 2016, and reached a peak of 22.8% in weeks 09 and 11 of 2016. As seen in the rest of UK, influenza A(H1N1)pdm09 was the dominant circulating virus from week 51 of 2015 to week 12 of 2016, peaking at 15.2% positivity in week 4 of 2016. We have seen a late increase in influenza B in weeks 12 to 17 of 2016, peaking at 11.0% positivity in week 13 (Figure 21). This contrasts with activity in 2014 to 2015 when, in Scotland, influenza A(H3N2) was the dominant strain and activity peaked at 22.2% in week 5 of 2015. Figure 21. Weekly ECOSS influenza positivity (number and percentage positive) by influenza subtype week 40 of 2015 to week 17 of 2016, Scotland
Surveillance of influenza and other respiratory viruses in the United Kingdom: Winter 2015 to 2016
24
Sentinel GP-based swabbing scheme
As seen through the respiratory DataMart scheme, activity through GP-based sentinel swabbing schemes in England was dominated by A(H1N1)pdm09 activity, with an increasing proportion of influenza B detections in the later weeks of the season. Following a sustained increase from week 52 of 2015, overall influenza positivity peaked at 61.7% in week 11 of 2016. Although swab numbers have declined, it has remained above 20.0% up to week 17 of 2015 (Figure 22). Influenza activity monitored through the GP Sentinel Scheme in Scotland peaked at 33.7% positivity in week 09 of 2016 with predominance of influenza A(H1N1)pdm09 from week 50 of 2015 to week 8 of 2016 (peak positivity seen in week 07); with influenza B predominance in weeks 10 to 17 of 2016 (peak in positivity seen in week 12). The overall swab positivity for influenza increased and remained above 20% between week 05 of 2016 and week 15 of 2016 (Figure 22).
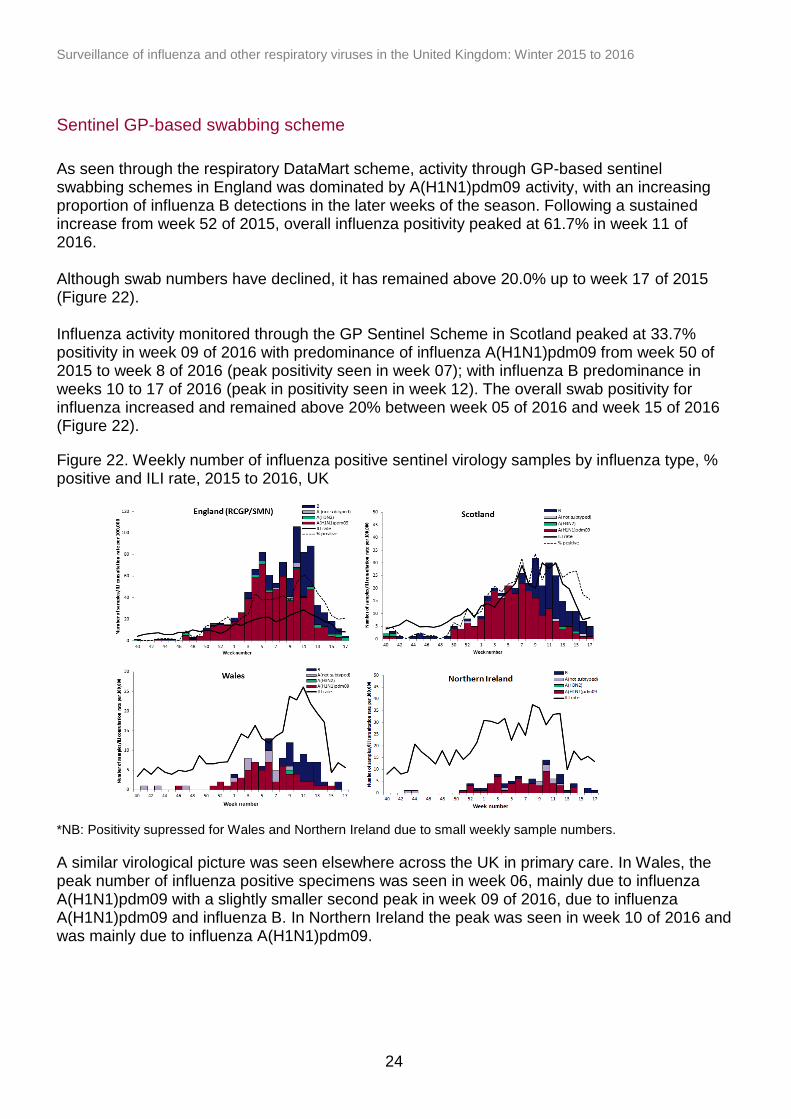
Figure 22. Weekly number of influenza positive sentinel virology samples by influenza type, % positive and ILI rate, 2015 to 2016, UK
*NB: Positivity supressed for Wales and Northern Ireland due to small weekly sample numbers.
A similar virological picture was seen elsewhere across the UK in primary care. In Wales, the peak number of influenza positive specimens was seen in week 06, mainly due to influenza A(H1N1)pdm09 with a slightly smaller second peak in week 09 of 2016, due to influenza A(H1N1)pdm09 and influenza B. In Northern Ireland the peak was seen in week 10 of 2016 and was mainly due to influenza A(H1N1)pdm09.
Surveillance of influenza and other respiratory viruses in the United Kingdom: Winter 2015 to 2016
25
Virus Characterisation
PHE characterises the properties of influenza viruses through one or more tests, including genome sequencing (genetic analysis) and haemagglutination inhibition (HI) assays (antigenic analysis). These data are used to compare how similar the currently circulating influenza viruses are to the strains included in seasonal influenza vaccines, and to monitor for changes in circulating influenza viruses. The interpretation of genetic and antigenic data sources is complex due to a number of factors, for example, not all viruses can be cultivated in sufficient quantity for antigenic characterisation, so that viruses with sequence information may not be able to be antigenically characterised as well. Since the start of the 2015 to 2016 winter influenza season in week 40 of 2015, the PHE Respiratory Virus Unit has characterised a total of 1,116 A(H1N1)pdm09 influenza viruses; 317 genetically and 72 both antigenically and genetically. The A(H1N1)pdm09 viruses genetically characterised to date all belong in the genetic subgroup 6B, which was the predominant genetic subgroup in the 2014 to 2015 season. Some heterogeneity has been seen in the A(H1N1)pdm09 viruses genetically characterised to date this season, with some genetic subgroups evident. Of 871 viruses analysed by HI assays to date, the majority were antigenically similar to the A/California/7/2009 Northern Hemisphere 2015 to 2016 (H1N1)pdm09 vaccine strain. Genetic characterisation of 21 A(H3N2) influenza viruses since week 38 showed that they belong to genetic group 3C.2a, and are genetically similar to the majority of A(H3N2) viruses circulating in the 2014 to 2015 season. Eight A(H3N2) influenza viruses have been isolated and antigenically characterised since week 38 of 2015. These eight viruses were antigenically similar to the A/Switzerland/9715293/2013 H3N2 Northern Hemisphere 2015 to 2016 vaccine strain. Of 63 influenza B viruses analysed genetically since week 40 of 2015, ten viruses have been characterised as belonging to the B/Yamagata/16/88-lineage and 53 viruses as belonging to the B/Victoria/2/87 lineage. One hundred and sixty six influenza B viruses have been isolated and antigenically characterised since week 40 of 2015. Seven viruses were characterised as belonging to the B/Yamagata/16/88-lineage and were antigenically similar to B/Phuket/3073/2013, the influenza B/Yamagata-lineage component of 2015 to 2016 Northern Hemisphere trivalent and quadrivalent vaccines. One hundred and fifty nine viruses were characterised as belonging to the B/Victoria/2/87 lineage and were antigenically similar to B/Brisbane/60/2008, the influenza B/Victoria-lineage component of 2015 of 2016 Northern Hemisphere quadrivalent vaccines. During the 2015 to 2016 season (up to week 17 of 2016), the West of Scotland Specialist Virology Centre (WOSSVC) has genetically characterised 167 influenza A(H1N1)pdm09 viruses, four influenza A(H3N2) viruses and 462 influenza B viruses. All 167 influenza A(H1N1)pdm09 virus isolates tested fell within group 6B (92.2% Gp6B.1, 7.2% Gp6B.2 and 0.6% Gp6B.3?). Four H3N2 virus samples were sequenced and two H3N2 sequences fell within the subclade 3C.2a classified as A/Hong Kong/3579/2014, one sequence fell within the subset 3C.2 classified as A/Hong Kong/146/2013 and the other fell within the subset 3C.3a classified a A/Switzerland/9715293/2013.
Surveillance of influenza and other respiratory viruses in the United Kingdom: Winter 2015 to 2016
26
For Influenza A(H1N1) the circulating strain (and sub clades) detected so far match the trivalent vaccine strains suggesting that the vaccine should give protection. One hundred and fifty-four of the one hundred and sixty-seven (92%) H1N1 sequences detected were in the Gp6B.1 sub clade, which are different from the previous year, although the significance as yet is unclear. For Influenza A H3N2 three of the circulating strains (3C.2a and 3C.3a) match the vaccine. The other H3N2 subset detected 3C.2 is antigenically closer to A/Texas/50/2012 present in the 2014 to 2015 vaccine. Four hundred and sixty two Flu B viruses have been detected by sequencing or real-time PCR. Of these 432 (94%) are of the Victoria lineage, which is not present in the trivalent vaccine. Nine have been sequenced, with six belonging to B/Victoria lineage (B/Brisbane/60/2008 a genetic clade 1A virus) and three belonging to B/Yamagata lineage (B/Phuket/3073/2013). In HI tests with post-infection ferret antisera, most viruses were antigenically closely related to the quadrivalent vaccine viruses B/Brisbane/60/2008 and B/Phuket/3073/2013. B/Brisbane/60/2008 is not present in the trivalent vaccine.
Antiviral resistance
Since week 40 of 2015, a total of 1,886 influenza A(H1N1)pdm09, ten influenza A(H3N2) and 80 influenza B have been tested for oseltamivir susceptibility in the UK by PHE RVU, all but 12 influenza A(H1N1)pdm09 virus and one influenza A(H3N2) were found to be susceptible. Eight of the 12 influenza A(H1N1)pdm09 resistant samples have information on antiviral use, while the remaining four are still under investigation. Six of the eight A(H1N1)pdm09 resistant samples were obtained from patients undergoing oseltamivir treatment and two cases had no exposure to oseltamivir. All A(H1N1)pdm09 resistance was due to the H275Y amino acid substitution. The A(H3N2) resistant sample was from an immunocompromised patient receiving oseltamivir treatment, with an E119V amino acid change. A total of 499 influenza A(H1N1)pdm09 and 80 influenza B have also been tested for zanamivir susceptibility in the UK and were all found to be sensitive.
Surveillance of influenza and other respiratory viruses in the United Kingdom: Winter 2015 to 2016
27
Vaccination
Seasonal influenza vaccine uptake in adults
Between country comparisons should be made with caution given that different methods are used to monitor uptake. In England, the uptake of seasonal influenza vaccine is monitored by PHE throughout the season based upon weekly and monthly extracts from GP information systems. Cumulative uptake on influenza vaccinations administered up to 31 January 2016 was reported from 99.8% of GP practices in England in 2015 to 2016. This showed a vaccine uptake of 71.0% in 65+ year-olds (compared to 72.7% in 2014/15) and 45.1% for those aged six months to under 65 years of age with one or more underlying clinical risk factor (excluding pregnant women without other risk factors and carers), compared to 50.3% in 2014 to 2015 (Table 4). Uptake in pregnant women up to 31 January 2016 was 42.3%, compared to 44.1% in 2014 to 2015.The more detailed final uptake reports are now publically available . In Scotland, the uptake of seasonal influenza vaccine is estimated by HPS throughout the season, based on automated weekly extracts from 99% of all Scottish GP practices. As such, vaccine uptake reported here should be regarded as provisional. Cumulative uptake in 2015 to 2016 showed vaccine uptake of 74.5% in 65+ year olds (compared to 76.3% in 2014 to 2015 ). Uptake amongst those aged six months to under 65 year olds in one or more clinical at-risk groups (excluding pregnant women without other risk factors and carers) was 48.0% (compared to 54.0% in 2014 to 2015). Uptake in pregnant women up to 31 January 2016 was 51.2%, compared to 50.9% in 2014 to 2015. In Wales, the uptake of seasonal influenza vaccine is monitored on a weekly basis by Public Health Wales throughout the season based on automated weekly extracts of Read coded data using software installed in all General Practices in Wales. Cumulative uptake data on influenza vaccinations administered were received from all GP practices in Wales in 2015 to 2016. This showed vaccine uptake of 66.6% in 65+ year olds (compared to 68.0% in 2014 to 2015) and 46.8% for those aged six months to under 65 years of age with one or more underlying clinical risk factor (excluding pregnant women without other risk factors, morbidly obese patients and carers), compared to 49.3% in 2014 to 2015. In Wales, uptake in pregnant women as measured through automatic collection of data from General Practices, increased to 47.8% in 2015 to 2016 compared to 45.5% in 2014 to 2015. Public Health Wales also carries out an annual vaccination coverage survey of women giving birth in Welsh maternity units during a five day period in March, in 2015 to 2016 coverage of influenza vaccination in this group has increased to 75.6% compared to 72.4% in 2014 to 2015. In Northern Ireland (NI) the uptake of seasonal influenza vaccine is monitored by the PHA of Northern Ireland. Cumulative uptake of influenza vaccination administered up to 31 March 2016 was reported from 100% of GP practices in NI in 2015 to 2016. In the population aged 65+ years uptake was 74.4% (compared to 73.4% in 2014 to 2015) and in the population of under 65 years at risk the uptake was 59.9% (compared to 71.8% in 2014 to 2015). Uptake in pregnant women up to 31 January 2016 was 55.1% compared to 56.1% in 2014 to 2015.
Surveillance of influenza and other respiratory viruses in the United Kingdom: Winter 2015 to 2016
28
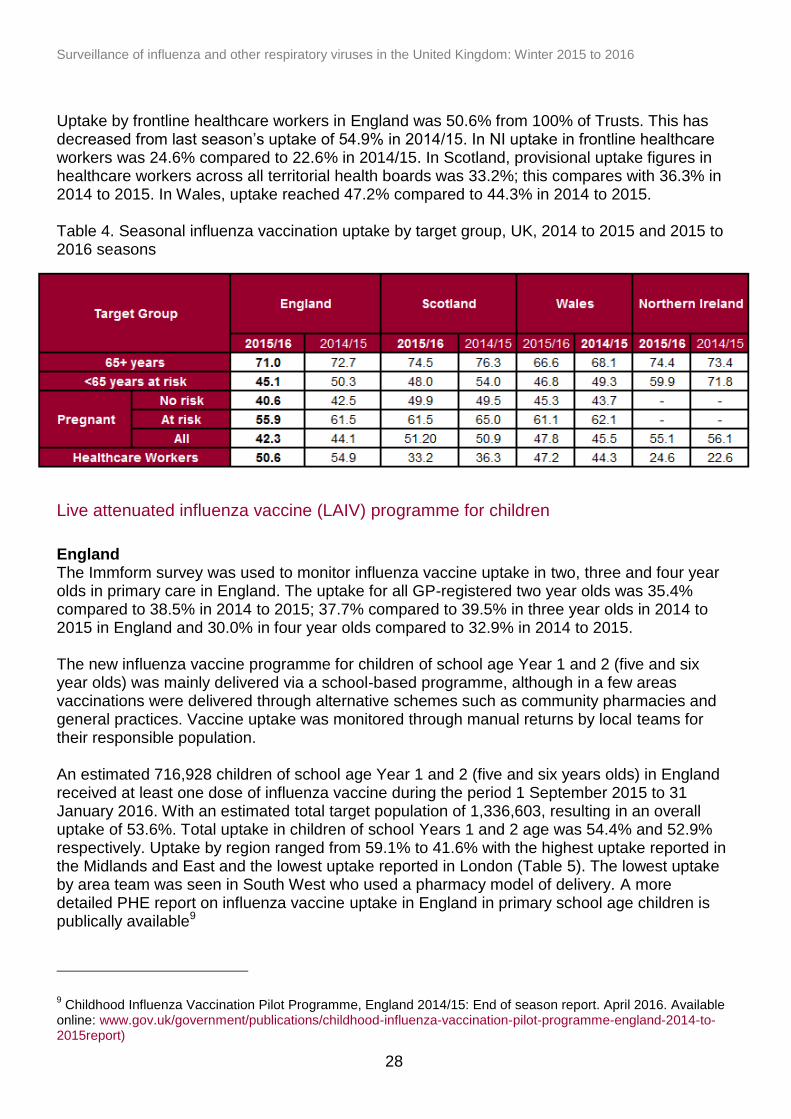
Uptake by frontline healthcare workers in England was 50.6% from 100% of Trusts. This has decreased from last season’s uptake of 54.9% in 2014/15. In NI uptake in frontline healthcare workers was 24.6% compared to 22.6% in 2014/15. In Scotland, provisional uptake figures in healthcare workers across all territorial health boards was 33.2%; this compares with 36.3% in 2014 to 2015. In Wales, uptake reached 47.2% compared to 44.3% in 2014 to 2015. Table 4. Seasonal influenza vaccination uptake by target group, UK, 2014 to 2015 and 2015 to 2016 seasons
Live attenuated influenza vaccine (LAIV) programme for children
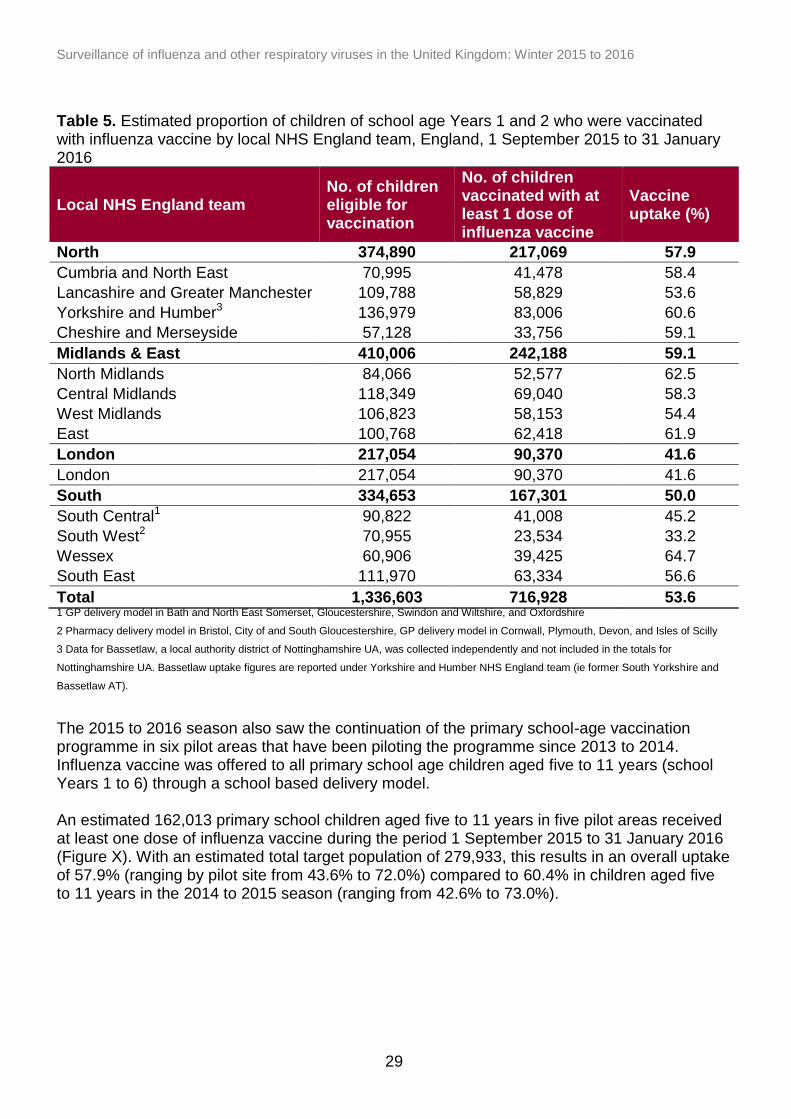
England The Immform survey was used to monitor influenza vaccine uptake in two, three and four year olds in primary care in England. The uptake for all GP-registered two year olds was 35.4% compared to 38.5% in 2014 to 2015; 37.7% compared to 39.5% in three year olds in 2014 to 2015 in England and 30.0% in four year olds compared to 32.9% in 2014 to 2015. The new influenza vaccine programme for children of school age Year 1 and 2 (five and six year olds) was mainly delivered via a school-based programme, although in a few areas vaccinations were delivered through alternative schemes such as community pharmacies and general practices. Vaccine uptake was monitored through manual returns by local teams for their responsible population. An estimated 716,928 children of school age Year 1 and 2 (five and six years olds) in England received at least one dose of influenza vaccine during the period 1 September 2015 to 31 January 2016. With an estimated total target population of 1,336,603, resulting in an overall uptake of 53.6%. Total uptake in children of school Years 1 and 2 age was 54.4% and 52.9% respectively. Uptake by region ranged from 59.1% to 41.6% with the highest uptake reported in the Midlands and East and the lowest uptake reported in London (Table 5). The lowest uptake by area team was seen in South West who used a pharmacy model of delivery. A more detailed PHE report on influenza vaccine uptake in England in primary school age children is publically available9
9 Childhood Influenza Vaccination Pilot Programme, England 2014/15: End of season report. April 2016. Available
online: www.gov.uk/government/publications/childhood-influenza-vaccination-pilot-programme-england-2014-to-2015report)
Surveillance of influenza and other respiratory viruses in the United Kingdom: Winter 2015 to 2016
29
Table 5. Estimated proportion of children of school age Years 1 and 2 who were vaccinated with influenza vaccine by local NHS England team, England, 1 September 2015 to 31 January 2016
Local NHS England team No. of children eligible for vaccination
No. of children vaccinated with at least 1 dose of influenza vaccine
Vaccine uptake (%)
North 374,890 217,069 57.9
Cumbria and North East 70,995 41,478 58.4
Lancashire and Greater Manchester 109,788 58,829 53.6
Yorkshire and Humber3 136,979 83,006 60.6
Cheshire and Merseyside 57,128 33,756 59.1
Midlands & East 410,006 242,188 59.1
North Midlands 84,066 52,577 62.5
Central Midlands 118,349 69,040 58.3
West Midlands 106,823 58,153 54.4
East 100,768 62,418 61.9
London 217,054 90,370 41.6
London 217,054 90,370 41.6
South 334,653 167,301 50.0
South Central1 90,822 41,008 45.2
South West2 70,955 23,534 33.2
Wessex 60,906 39,425 64.7
South East 111,970 63,334 56.6
Total 1,336,603 716,928 53.6 1 GP delivery model in Bath and North East Somerset, Gloucestershire, Swindon and Wiltshire, and Oxfordshire
2 Pharmacy delivery model in Bristol, City of and South Gloucestershire, GP delivery model in Cornwall, Plymouth, Devon, and Isles of Scilly
3 Data for Bassetlaw, a local authority district of Nottinghamshire UA, was collected independently and not included in the totals for
Nottinghamshire UA. Bassetlaw uptake figures are reported under Yorkshire and Humber NHS England team (ie former South Yorkshire and
Bassetlaw AT).
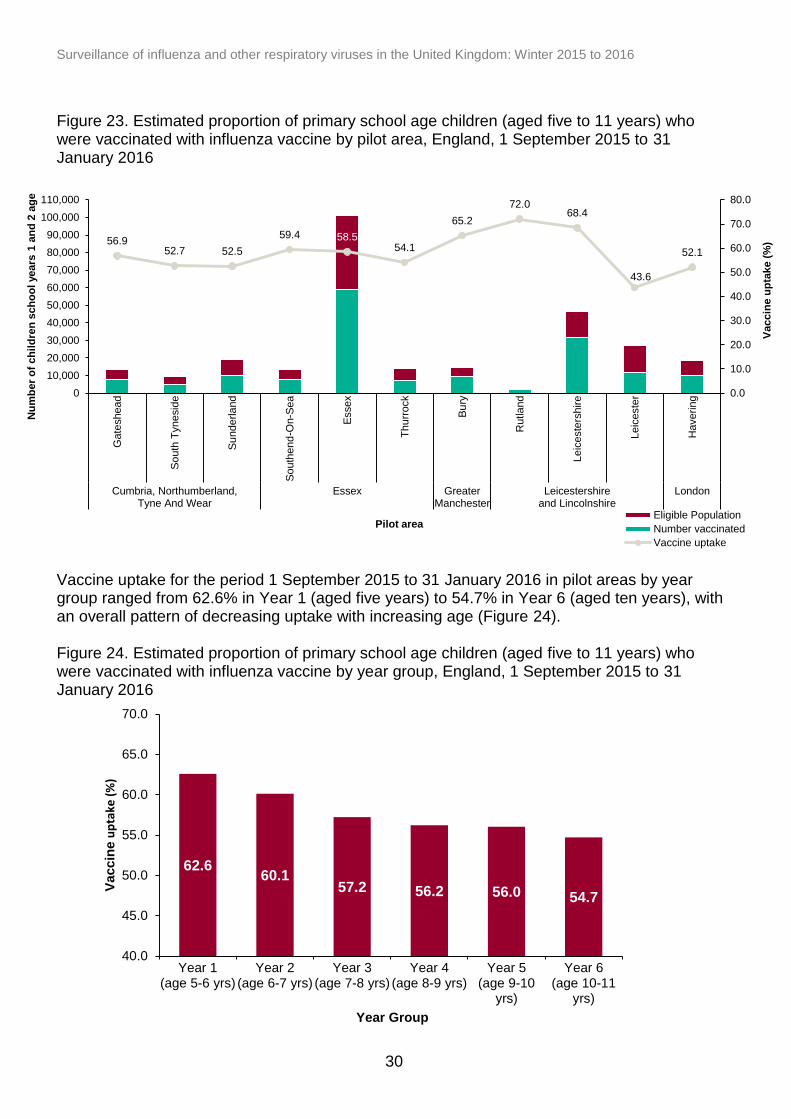
The 2015 to 2016 season also saw the continuation of the primary school-age vaccination programme in six pilot areas that have been piloting the programme since 2013 to 2014. Influenza vaccine was offered to all primary school age children aged five to 11 years (school Years 1 to 6) through a school based delivery model. An estimated 162,013 primary school children aged five to 11 years in five pilot areas received at least one dose of influenza vaccine during the period 1 September 2015 to 31 January 2016 (Figure X). With an estimated total target population of 279,933, this results in an overall uptake of 57.9% (ranging by pilot site from 43.6% to 72.0%) compared to 60.4% in children aged five to 11 years in the 2014 to 2015 season (ranging from 42.6% to 73.0%).
Surveillance of influenza and other respiratory viruses in the United Kingdom: Winter 2015 to 2016
30
56.9 52.7 52.5
59.4 58.5 54.1
65.2
72.0 68.4
43.6
52.1
0.0
10.0
20.0
30.0
40.0
50.0
60.0
70.0
80.0
0
10,000
20,000
30,000
40,000
50,000
60,000
70,000
80,000
90,000
100,000
110,000
Gate
shead
So
uth
Tynesid
e
Su
nderla
nd
So
uth
end
-On-S
ea
Essex
Th
urr
ock
Bu
ry
Rutla
nd
Leic
este
rshire
Leic
este
r
Haverin
g
Cumbria, Northumberland,Tyne And Wear
Essex GreaterManchester
Leicestershireand Lincolnshire
London
Vaccin
e u
pta
ke (
%)
Nu
mb
er
of
ch
ild
ren
sch
oo
l years
1 a
nd
2 a
ge
Pilot area Eligible Population
Number vaccinated
Vaccine uptake
62.6 60.1
57.2 56.2 56.0 54.7
40.0
45.0
50.0
55.0
60.0
65.0
70.0
Year 1(age 5-6 yrs)
Year 2(age 6-7 yrs)
Year 3(age 7-8 yrs)
Year 4(age 8-9 yrs)
Year 5(age 9-10
yrs)
Year 6(age 10-11
yrs)
Vaccin
e u
pta
ke (
%)
Year Group
Figure 23. Estimated proportion of primary school age children (aged five to 11 years) who were vaccinated with influenza vaccine by pilot area, England, 1 September 2015 to 31 January 2016
Vaccine uptake for the period 1 September 2015 to 31 January 2016 in pilot areas by year group ranged from 62.6% in Year 1 (aged five years) to 54.7% in Year 6 (aged ten years), with an overall pattern of decreasing uptake with increasing age (Figure 24). Figure 24. Estimated proportion of primary school age children (aged five to 11 years) who were vaccinated with influenza vaccine by year group, England, 1 September 2015 to 31 January 2016
Surveillance of influenza and other respiratory viruses in the United Kingdom: Winter 2015 to 2016
31
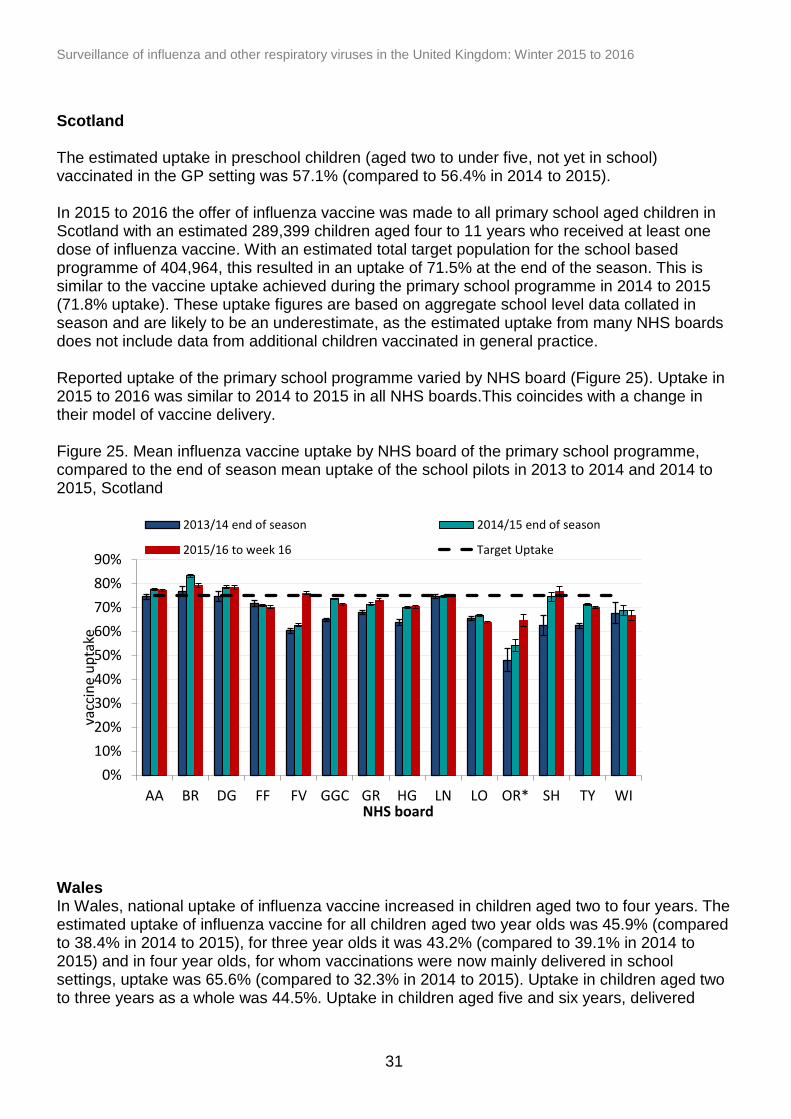
Scotland The estimated uptake in preschool children (aged two to under five, not yet in school) vaccinated in the GP setting was 57.1% (compared to 56.4% in 2014 to 2015). In 2015 to 2016 the offer of influenza vaccine was made to all primary school aged children in Scotland with an estimated 289,399 children aged four to 11 years who received at least one dose of influenza vaccine. With an estimated total target population for the school based programme of 404,964, this resulted in an uptake of 71.5% at the end of the season. This is similar to the vaccine uptake achieved during the primary school programme in 2014 to 2015 (71.8% uptake). These uptake figures are based on aggregate school level data collated in season and are likely to be an underestimate, as the estimated uptake from many NHS boards does not include data from additional children vaccinated in general practice. Reported uptake of the primary school programme varied by NHS board (Figure 25). Uptake in 2015 to 2016 was similar to 2014 to 2015 in all NHS boards.This coincides with a change in their model of vaccine delivery. Figure 25. Mean influenza vaccine uptake by NHS board of the primary school programme, compared to the end of season mean uptake of the school pilots in 2013 to 2014 and 2014 to 2015, Scotland
Wales In Wales, national uptake of influenza vaccine increased in children aged two to four years. The estimated uptake of influenza vaccine for all children aged two year olds was 45.9% (compared to 38.4% in 2014 to 2015), for three year olds it was 43.2% (compared to 39.1% in 2014 to 2015) and in four year olds, for whom vaccinations were now mainly delivered in school settings, uptake was 65.6% (compared to 32.3% in 2014 to 2015). Uptake in children aged two to three years as a whole was 44.5%. Uptake in children aged five and six years, delivered
0%
10%
20%
30%
40%
50%
60%
70%
80%
90%
AA BR DG FF FV GGC GR HG LN LO OR* SH TY WI
vac
cin
e u
pta
ke
NHS board
2013/14 end of season 2014/15 end of season
2015/16 to week 16 Target Uptake
Surveillance of influenza and other respiratory viruses in the United Kingdom: Winter 2015 to 2016
32
through school immunisation sessions, was 63.0% and 63.7% respectively. The uptake in children of school age four to six year of age (Years 0, 1 and 2) was 63.4%. Northern Ireland In 2015 to 2016 the childhood influenza vaccination programme continued to include all pre-school children aged two to four years old and all primary school aged children. The former group were offered vaccination through primary care, with the latter group offered vaccination through school health teams. The vaccination uptake rate in 2015 to 2016 for pre-school children aged two to four years old was 50.5% (compared to 54.4% in 2014/15). The vaccination uptake rate for children in primary school (aged approximately four to 11 years old) was 76.8% (compared to 79.7% in 2014 to 2015)
Seasonal influenza vaccine effectiveness (VE)
Preliminary results from an end of season vaccine effectiveness analysis highlight that the overall adjusted VE of the 2015 to 2016 influenza vaccine in preventing medical consultation in primary care with a laboratory confirmed ILI across the UK was 52.4 (95% confidence interval (CI) 41.0-61.6). This is based on a total of 5,811 persons who were swabbed, of which 3,841 were included in the analysis during the period of 1 October 2015 to 1 May 2016. A mid-season study was undertaken for the period of 1 October 2015 and 22 January 2016, which showed an adjusted VE of 41.5% (95% CI: 3.0–64.7) against influenza-confirmed primary care consultations and of 49.1% (95% CI: 9.3–71.5) against influenza A(H1N1)pdm0910. These estimates show levels of protection similar to the 2010 to 2011 season, when this new strain was first used in the seasonal vaccine.
Programme impact
With the rollout of the new LAIV programme for children across the UK, influenza surveillance systems have been adapted to be able to report the impact of the programme on disease incidence in pilot and non-pilot areas in England starting in 2013. The end-of-season results for the 2014 to 2015 season, the second year of the LAIV programme in England have now been published. They showed that despite circulation of a drifted A/H3N2 strain in 2014 to 2015, a consistent decrease in cumulative disease incidence and influenza positivity across a range of influenza surveillance indicators was seen in pilot relative to non-pilot areas in both targeted and non-targeted age groups. Differences in influenza activity across the countries of the UK also seem to be apparent this season, with GP consultation rates above baseline activity levels for prolonged periods in England and Wales compared to Scotland and Northern Ireland, where primary school age programmes are in place and where they were not (pages 27 to 31). A report will be published in summer 2016 describing the observations of the possible impact of vaccinating primary school age children in 2015 to 2016 on influenza activity in these areas.
10
Pebody et al. Effectiveness of seasonal influenza vaccine in preventing laboratory-confirmed influenza in primary care in the United Kingdom: 2015/16 mid-season results. Euro Surveill. 2016;21(13):pii=30179
Surveillance of influenza and other respiratory viruses in the United Kingdom: Winter 2015 to 2016
33
0
5
10
15
20
25
30
35
40 41424344 45464748 49505152 1 2 3 4 5 6 7 8 9 10111213 1415161718 1920
Po
siti
vity
(%
)
Week number
2015/16
2014/15
2013/14
Other respiratory viruses
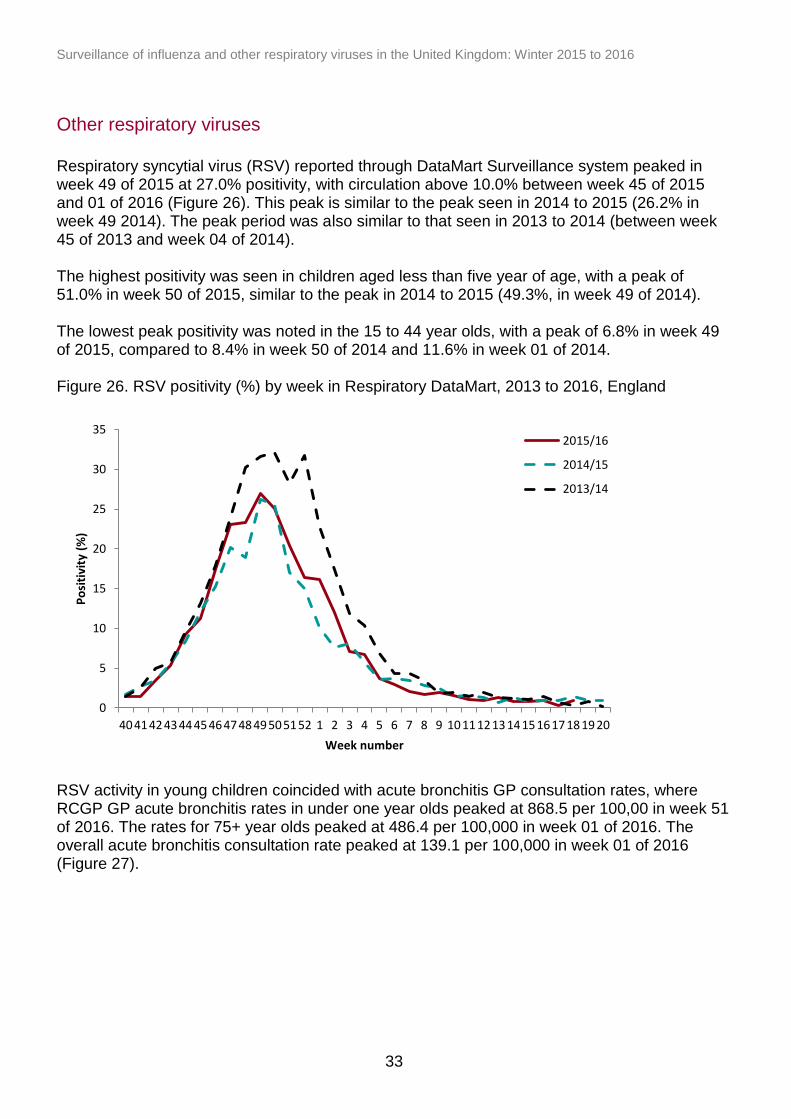
Respiratory syncytial virus (RSV) reported through DataMart Surveillance system peaked in week 49 of 2015 at 27.0% positivity, with circulation above 10.0% between week 45 of 2015 and 01 of 2016 (Figure 26). This peak is similar to the peak seen in 2014 to 2015 (26.2% in week 49 2014). The peak period was also similar to that seen in 2013 to 2014 (between week 45 of 2013 and week 04 of 2014). The highest positivity was seen in children aged less than five year of age, with a peak of 51.0% in week 50 of 2015, similar to the peak in 2014 to 2015 (49.3%, in week 49 of 2014). The lowest peak positivity was noted in the 15 to 44 year olds, with a peak of 6.8% in week 49 of 2015, compared to 8.4% in week 50 of 2014 and 11.6% in week 01 of 2014. Figure 26. RSV positivity (%) by week in Respiratory DataMart, 2013 to 2016, England
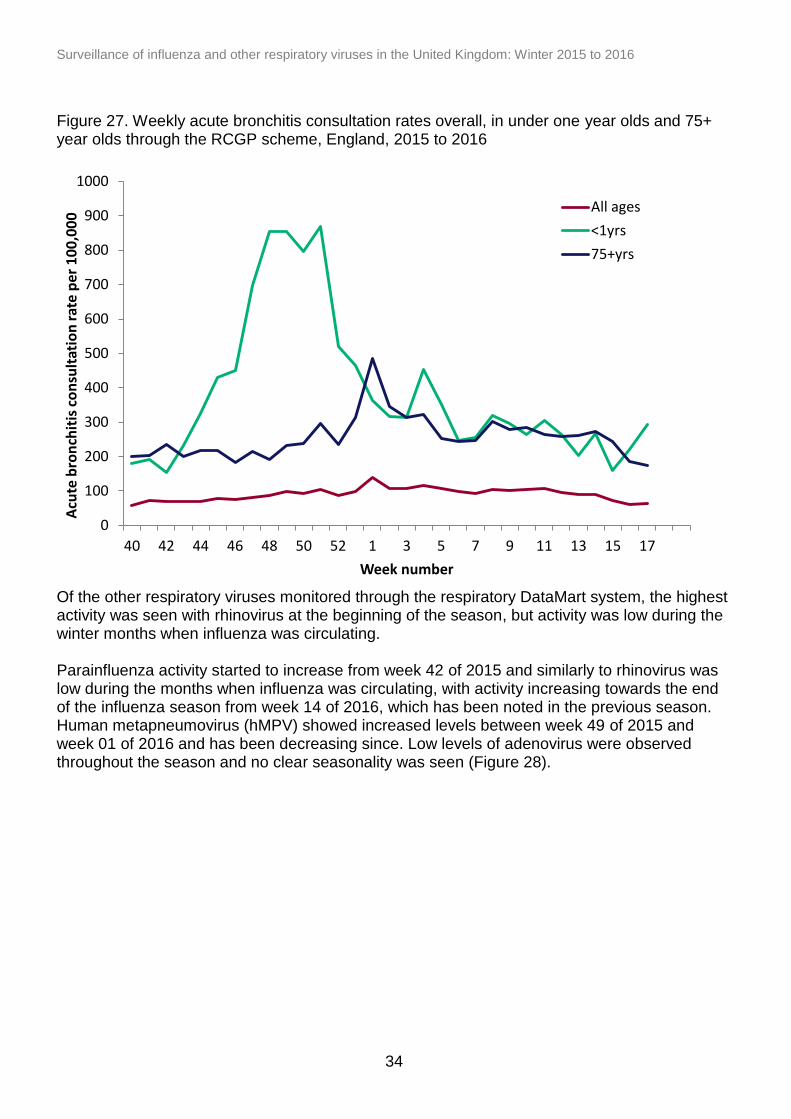
RSV activity in young children coincided with acute bronchitis GP consultation rates, where RCGP GP acute bronchitis rates in under one year olds peaked at 868.5 per 100,00 in week 51 of 2016. The rates for 75+ year olds peaked at 486.4 per 100,000 in week 01 of 2016. The overall acute bronchitis consultation rate peaked at 139.1 per 100,000 in week 01 of 2016 (Figure 27).
Surveillance of influenza and other respiratory viruses in the United Kingdom: Winter 2015 to 2016
34
Figure 27. Weekly acute bronchitis consultation rates overall, in under one year olds and 75+ year olds through the RCGP scheme, England, 2015 to 2016
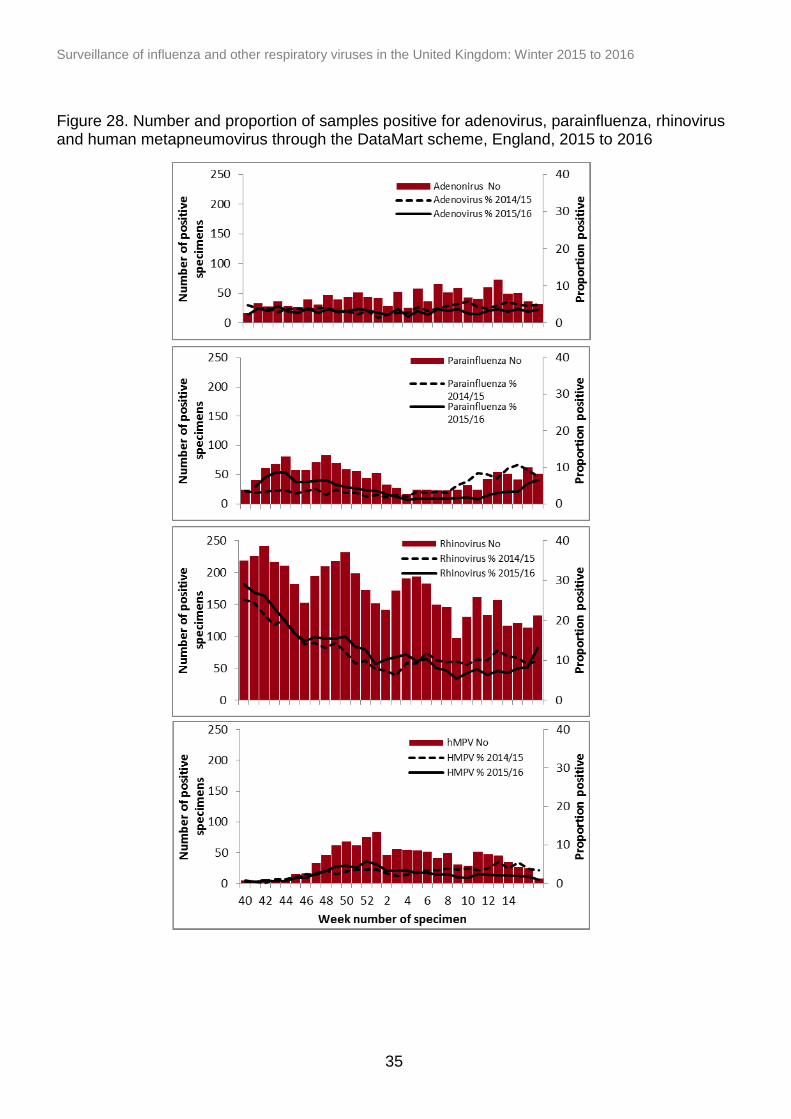
Of the other respiratory viruses monitored through the respiratory DataMart system, the highest activity was seen with rhinovirus at the beginning of the season, but activity was low during the winter months when influenza was circulating. Parainfluenza activity started to increase from week 42 of 2015 and similarly to rhinovirus was low during the months when influenza was circulating, with activity increasing towards the end of the influenza season from week 14 of 2016, which has been noted in the previous season. Human metapneumovirus (hMPV) showed increased levels between week 49 of 2015 and week 01 of 2016 and has been decreasing since. Low levels of adenovirus were observed throughout the season and no clear seasonality was seen (Figure 28).
0
100
200
300
400
500
600
700
800
900
1000
40 42 44 46 48 50 52 1 3 5 7 9 11 13 15 17
Acu
te b
ron
chit
is c
on
sult
atio
n r
ate
per
10
0,0
00
Week number
All ages
<1yrs
75+yrs
Surveillance of influenza and other respiratory viruses in the United Kingdom: Winter 2015 to 2016
35
Figure 28. Number and proportion of samples positive for adenovirus, parainfluenza, rhinovirus and human metapneumovirus through the DataMart scheme, England, 2015 to 2016
Surveillance of influenza and other respiratory viruses in the United Kingdom: Winter 2015 to 2016
36
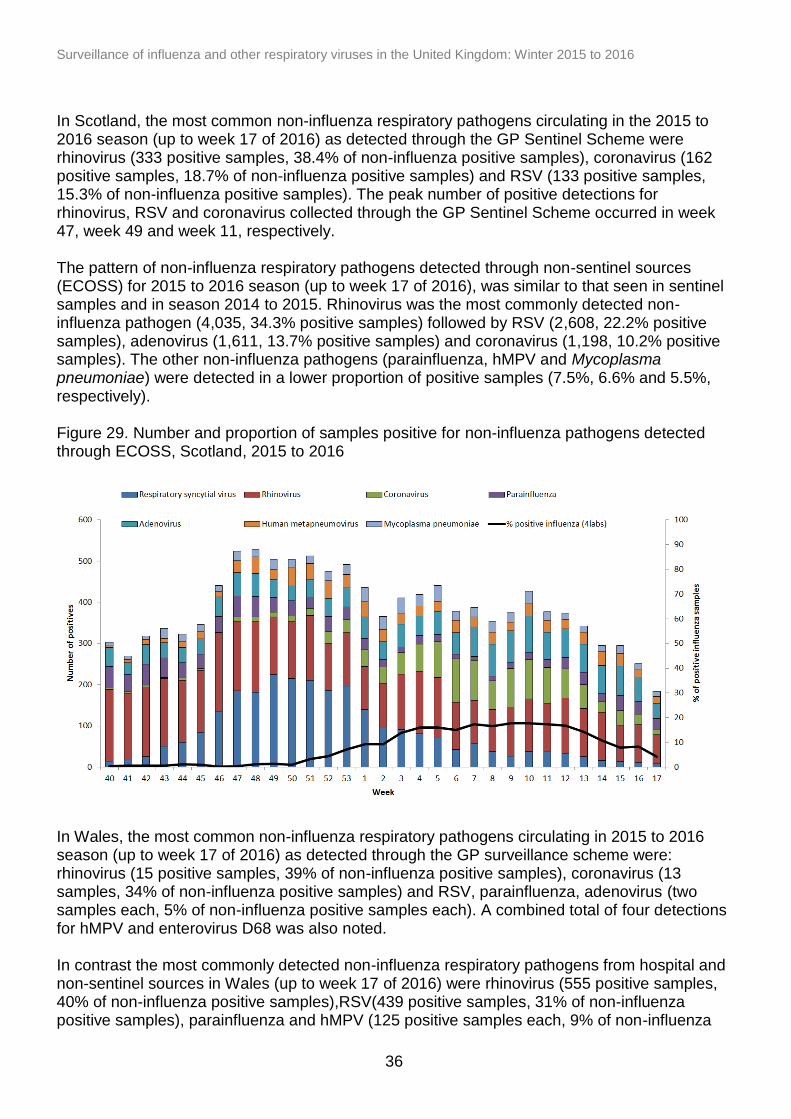
In Scotland, the most common non-influenza respiratory pathogens circulating in the 2015 to 2016 season (up to week 17 of 2016) as detected through the GP Sentinel Scheme were rhinovirus (333 positive samples, 38.4% of non-influenza positive samples), coronavirus (162 positive samples, 18.7% of non-influenza positive samples) and RSV (133 positive samples, 15.3% of non-influenza positive samples). The peak number of positive detections for rhinovirus, RSV and coronavirus collected through the GP Sentinel Scheme occurred in week 47, week 49 and week 11, respectively. The pattern of non-influenza respiratory pathogens detected through non-sentinel sources (ECOSS) for 2015 to 2016 season (up to week 17 of 2016), was similar to that seen in sentinel samples and in season 2014 to 2015. Rhinovirus was the most commonly detected non-influenza pathogen (4,035, 34.3% positive samples) followed by RSV (2,608, 22.2% positive samples), adenovirus (1,611, 13.7% positive samples) and coronavirus (1,198, 10.2% positive samples). The other non-influenza pathogens (parainfluenza, hMPV and Mycoplasma pneumoniae) were detected in a lower proportion of positive samples (7.5%, 6.6% and 5.5%, respectively). Figure 29. Number and proportion of samples positive for non-influenza pathogens detected through ECOSS, Scotland, 2015 to 2016
In Wales, the most common non-influenza respiratory pathogens circulating in 2015 to 2016 season (up to week 17 of 2016) as detected through the GP surveillance scheme were: rhinovirus (15 positive samples, 39% of non-influenza positive samples), coronavirus (13 samples, 34% of non-influenza positive samples) and RSV, parainfluenza, adenovirus (two samples each, 5% of non-influenza positive samples each). A combined total of four detections for hMPV and enterovirus D68 was also noted. In contrast the most commonly detected non-influenza respiratory pathogens from hospital and non-sentinel sources in Wales (up to week 17 of 2016) were rhinovirus (555 positive samples, 40% of non-influenza positive samples),RSV(439 positive samples, 31% of non-influenza positive samples), parainfluenza and hMPV (125 positive samples each, 9% of non-influenza
Surveillance of influenza and other respiratory viruses in the United Kingdom: Winter 2015 to 2016
37
positive samples each), adenovirus (118 samples, 8% of non-influenza positive samples) and mycoplasma pneumoniae (36 samples, 3% of non-influenza positive samples). The peak of non-influenza positive detections in hospital and non-sentinel samples occurred during week 53 of 2015 and was largely due to RSV and rhinovirus.
Surveillance of influenza and other respiratory viruses in the United Kingdom: Winter 2015 to 2016
38
0
2,000
4,000
6,000
8,000
10,000
12,000
14,000
40 44 48 52 3 7 11 15 19 23 27 31 35 39Esti
mat
ed n
um
ber
of
dea
th r
egi
stra
tio
ns
Week number
Prediction
Upper limit
Total deaths all ages
Excess all-cause mortality surveillance
Mortality by week of death registration
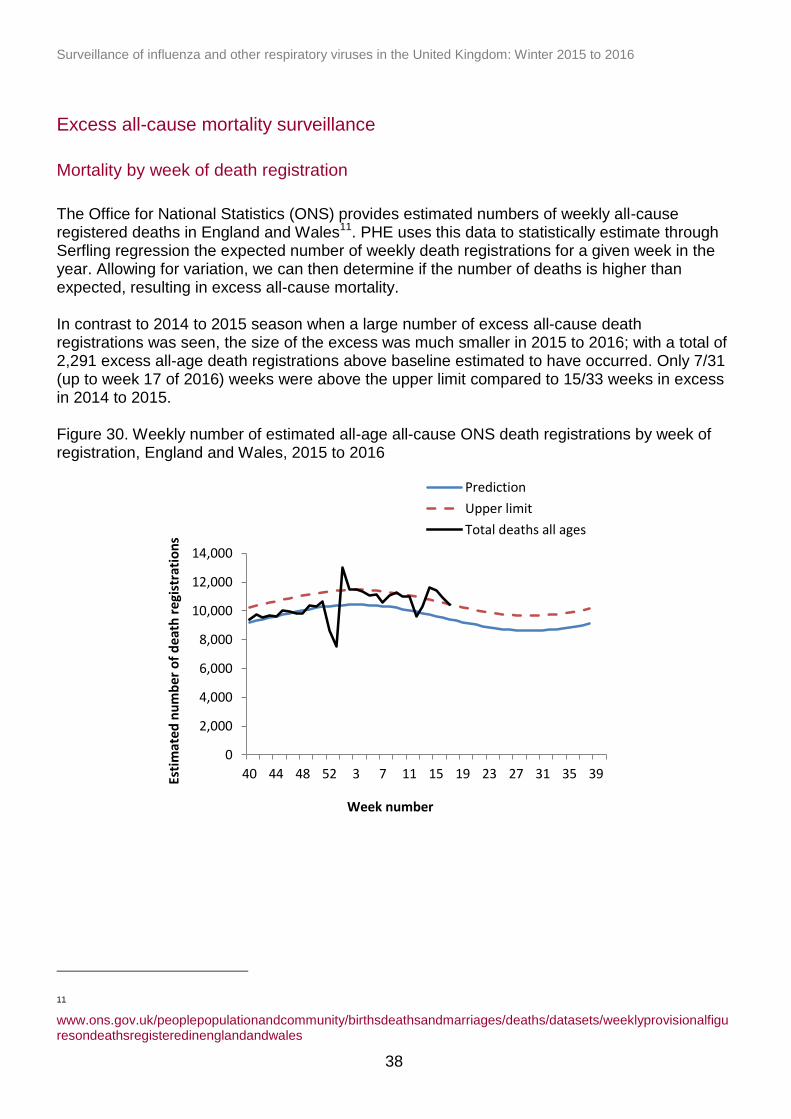
The Office for National Statistics (ONS) provides estimated numbers of weekly all-cause registered deaths in England and Wales11. PHE uses this data to statistically estimate through Serfling regression the expected number of weekly death registrations for a given week in the year. Allowing for variation, we can then determine if the number of deaths is higher than expected, resulting in excess all-cause mortality. In contrast to 2014 to 2015 season when a large number of excess all-cause death registrations was seen, the size of the excess was much smaller in 2015 to 2016; with a total of 2,291 excess all-age death registrations above baseline estimated to have occurred. Only 7/31 (up to week 17 of 2016) weeks were above the upper limit compared to 15/33 weeks in excess in 2014 to 2015. Figure 30. Weekly number of estimated all-age all-cause ONS death registrations by week of registration, England and Wales, 2015 to 2016
11
www.ons.gov.uk/peoplepopulationandcommunity/birthsdeathsandmarriages/deaths/datasets/weeklyprovisionalfiguresondeathsregisteredinenglandandwales
Surveillance of influenza and other respiratory viruses in the United Kingdom: Winter 2015 to 2016
39
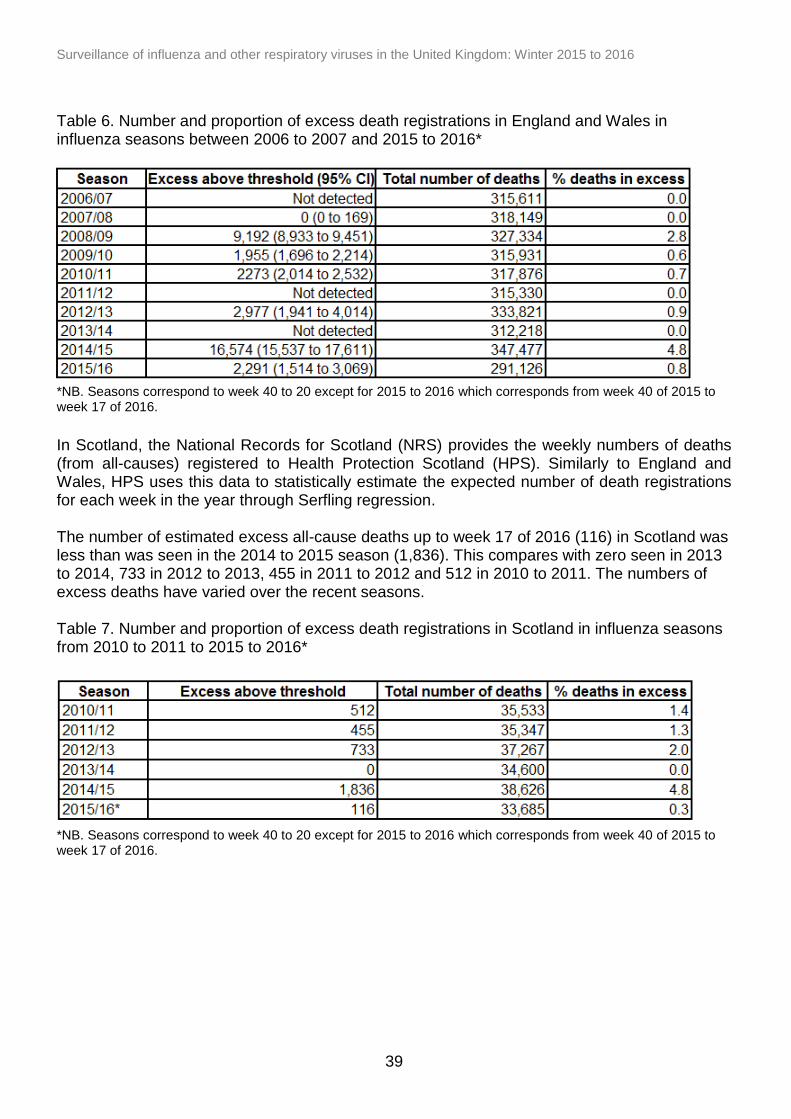
Table 6. Number and proportion of excess death registrations in England and Wales in influenza seasons between 2006 to 2007 and 2015 to 2016*
*NB. Seasons correspond to week 40 to 20 except for 2015 to 2016 which corresponds from week 40 of 2015 to week 17 of 2016.
In Scotland, the National Records for Scotland (NRS) provides the weekly numbers of deaths (from all-causes) registered to Health Protection Scotland (HPS). Similarly to England and Wales, HPS uses this data to statistically estimate the expected number of death registrations for each week in the year through Serfling regression. The number of estimated excess all-cause deaths up to week 17 of 2016 (116) in Scotland was less than was seen in the 2014 to 2015 season (1,836). This compares with zero seen in 2013 to 2014, 733 in 2012 to 2013, 455 in 2011 to 2012 and 512 in 2010 to 2011. The numbers of excess deaths have varied over the recent seasons. Table 7. Number and proportion of excess death registrations in Scotland in influenza seasons from 2010 to 2011 to 2015 to 2016*
*NB. Seasons correspond to week 40 to 20 except for 2015 to 2016 which corresponds from week 40 of 2015 to week 17 of 2016.
Surveillance of influenza and other respiratory viruses in the United Kingdom: Winter 2015 to 2016
40
0
2000
4000
6000
8000
10000
12000
14000
16000
Nu
mb
er
of
death
s
Expected number Upper prediction limit Number of deaths
2009/10 A(H1N1)pdm09
2010/11 A(H1N1)pdm09
2011/12 A(H3N2)
2012/13 A(H3N2)
2013/14 A(H1N1)pdm09
2014/15 A(H3N2)
2015/16 A(H1N1)pdm09
Mortality by week of death
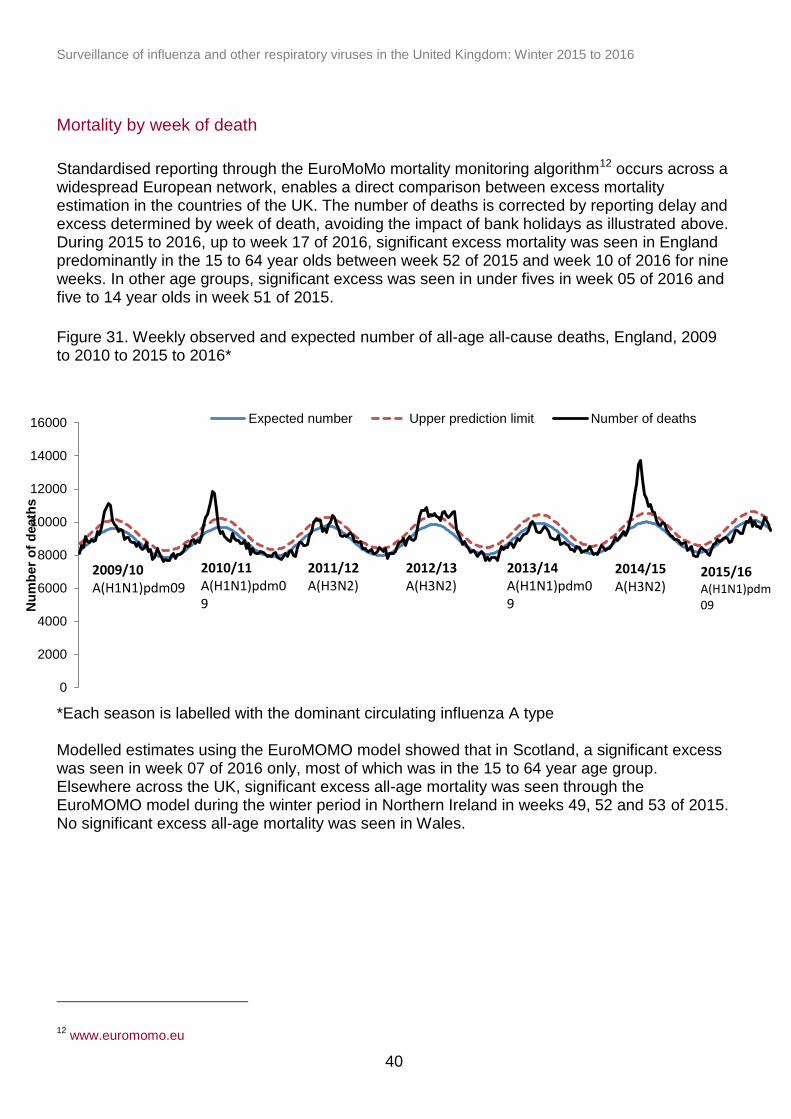
Standardised reporting through the EuroMoMo mortality monitoring algorithm12 occurs across a widespread European network, enables a direct comparison between excess mortality estimation in the countries of the UK. The number of deaths is corrected by reporting delay and excess determined by week of death, avoiding the impact of bank holidays as illustrated above. During 2015 to 2016, up to week 17 of 2016, significant excess mortality was seen in England predominantly in the 15 to 64 year olds between week 52 of 2015 and week 10 of 2016 for nine weeks. In other age groups, significant excess was seen in under fives in week 05 of 2016 and five to 14 year olds in week 51 of 2015.
Figure 31. Weekly observed and expected number of all-age all-cause deaths, England, 2009 to 2010 to 2015 to 2016*
*Each season is labelled with the dominant circulating influenza A type Modelled estimates using the EuroMOMO model showed that in Scotland, a significant excess was seen in week 07 of 2016 only, most of which was in the 15 to 64 year age group. Elsewhere across the UK, significant excess all-age mortality was seen through the EuroMOMO model during the winter period in Northern Ireland in weeks 49, 52 and 53 of 2015. No significant excess all-age mortality was seen in Wales.
12
www.euromomo.eu
Surveillance of influenza and other respiratory viruses in the United Kingdom: Winter 2015 to 2016
41
Emerging respiratory viruses
Human MERS-CoV infections
Since WHO first reported cases of Middle Eastern Respiratory Syndrome Coronavirus (MERS-CoV) in September 2012, a total of 1,728 laboratory confirmed cases have been reported globally up to 26 April 2016. This includes 624 deaths (case fatality ratio of 36%). Most cases have either occurred in the Middle East or have direct links to a primary case infected in the Middle East. Local secondary transmission following importation has been reported from the UK, Republic of Korea, France, and Tunisia. PHE continues to monitor potential cases in travellers returning from the Middle East with severe respiratory disease, with individuals tested for MERS-CoV if they met the suspect case definition13. Since the start of the MERS-CoV global outbreak up to 16 May 2016, 747 suspected cases amongst returning travellers have been identified in the UK and tested negative for MERS-CoV, with MERS-CoV infection confirmed in four cases with two imported cases detected in September 2012 and January 2013, respectively. The two secondary cases with non-sustained transmission in the UK were linked to the second imported UK case in January 2013. No positive cases have been reported in the UK since February 2013. In April and May 2014, two laboratory confirmed cases transited through London Heathrow Airport on separate flights to the USA. Contact tracing of flight contacts did not identify any further cases14 PHE remains vigilant, closely monitoring developments in countries where new cases emerge and continues to liaise with international colleagues to assess whether recommendations need to change in relation to MERS-CoV. The risk of infection to residents in the UK remains very low, although the risk of infection to UK travellers in the affected areas is slightly higher, but is still considered to be low. There does remain a risk of imported cases from affected countries; however, this risk remains low15. For further PHE information on management and guidance of possible cases, please see information online16.
Human influenza A(H7N9) infections
The first three human infections with avian influenza A(H7N9) was reported in China through WHO in April 201317. Up to 16 May 2016, 756 cases have been reported, including at least 283 deaths giving an overall case fatality ratio of 37.4%. The majority of cases have been reported from China (734) with other exported cases reported in Hong Kong (15), Taiwan (four), Malaysia (one) and Canada (two). Most cases are associated with contact with infected live poultry or their environments, and particularly as a result of visiting live animal markets. Only a few small clusters with possible human-to-human transmission have occurred among family
13
www.gov.uk/government/publications/mers-cov-public-health-investigation-and-management-of-possible-cases 14
Parry-Ford F, Boddington N, Pebody R, Phin N, on behalf of the Incident Management Team. Public health response to two incidents of confirmed MERS-CoV cases travelling on flights through London Heathrow Airport in 2014 – lessons learnt. Euro Surveill. 2015;20(18):pii=21114. Available online: www.eurosurveillance.org/images/dynamic/EE/V20N18/art21114.pdf 15
www.gov.uk/government/publications/mers-cov-risk-assessment 16
www.gov.uk/government/collections/middle-east-respiratory-syndrome-coronavirus-mers-cov-clinical-management-and-guidance 17
www.who.int/csr/don/2013_04_01/en
Surveillance of influenza and other respiratory viruses in the United Kingdom: Winter 2015 to 2016
42
members. There has been no evidence of sustained human-to-human transmission to date despite extensive contact tracing activity. There seems to be a seasonal pattern, with peaks tending to occur between December and March and lower activity during the rest of the year. This coincides with several weeks of celebrations related to the Chinese Lunar New Year and associated increases in travel to and from China, mass gatherings, and greater interactions between people and poultry. For further updates, please see the WHO website18 and for PHE advice on clinical management, please see information available online19.
Human influenza A(H5N1) and influenza A(H5N6) infections
Since 2003 to May 2016, 850 cases of avian influenza A(H5N1) have been reported including 449 deaths, giving an overall case fatality rate of 52.8%. Cases have been reported from 16 countries. During 2015 there has been an apparent spike in human infections with avian influenza A(H5N1), with 136 cases reported in Egypt. This is the highest ever annual total reported from any one country. Most human cases have been reported from rural areas of central Egypt, along the Nile River and in the Nile Delta. This overlaps with areas where there has been an increase in the number of outbreaks of highly pathogenic avian influenza (HPAI) A(H5N1) detected in poultry. During 2015, cases have also been reported from China (6), Indonesia (2) and Bangladesh (1). Up to 16 May 2016, four cases were reported from Egypt20. As of 16 May 2016, a total of 14 human influenza A(H5N6) cases have been reported since February 2014. 13 were reported by the National Health and Family Planning Commission (NHFPC) of China to WHO and the other was a case identified in February, 2014 and reported in the Journal of Infection (Chen T and Zhang R. Symptoms seem to be mild in children infected with avian influenza A (H5N6) and other subtypes. Journal of Infection, Vol. 71, Issue 6, p702–703). Nine of the fourteen cases have been detected since October 2015. Cases have been identified in seven different Provinces in China, with six of them having been reported in Guangdong Province. Two of the three most recent cases were reported by WHO on 6 May 2016 and the third on 10 May 201621. Most human cases were exposed to A(H5) viruses through contact with infected poultry or contaminated environments, including live poultry markets. Since the viruses continue to be detected in animals and environments, further human cases can be expected. Even though small clusters of A(H5N1) virus infections have been reported previously including those involving healthcare workers, current epidemiological and virological evidence suggests that this and other A(H5) viruses have not acquired the ability for sustained transmission among humans, thus the likelihood of person to person transmission is low. Should infected individuals from affected areas travel internationally, their infection may be detected in another country during travel or after arrival. If this were to occur, further community level spread is considered unlikely as evidence suggests these viruses have not acquired the ability to transmit easily among humans22.
18
www.who.int/influenza/human_animal_interface/influenza_h7n9/en 19
www.gov.uk/government/collections/avian-influenza-guidance-data-and-analysis 20
www.who.int/influenza/human_animal_interface/EN_GIP_20160404cumulativenumberH5N1cases.pdf?ua=1 21
www.who.int/csr/don/en 22
www.who.int/influenza/human_animal_interface/Influenza_Summary_IRA_HA_interface_04_04_2016.pdf?ua=1
Surveillance of influenza and other respiratory viruses in the United Kingdom: Winter 2015 to 2016
43
Conclusions
Moderate levels of influenza activity were seen in the UK community in 2015 to 2016, with influenza A(H1N1)pdm09 the predominant virus circulating for the majority of the season, with influenza B circulating towards the end of the season. The health impact of influenza was predominantly seen in the young adults, with high numbers of admissions to hospital and ICU/HDU and some levels of excess mortality seen in the 15 to 64 year olds.Peak admissions to hospital and ICU/HDU were higher than seen in the previous few seasons, but lower than the most notable A/H1N1pdm09 season of 2010 to 2011. The impact on general practice varied across the UK (with moderate levels in England and Wales, low in Scotland and Northern Ireland). The childhood LAIV programme which was first implemented in 2013 to 2014 continued it’s roll-out in 2015 to 2016, targeting two to four year olds in primary care and all children of school Years 1 and 2 age for the first time across the UK. There are promising observations through established surveillance systems of the population impact of the programme after the first two seasons. Further work from this current and future seasons will be critical to evaluate this programme and to inform its optimal rollout to children. The elderly, clinical at-risk and health care worker programmes continued in 2015 to 2016. Although influenza vaccine uptake was lower in many targeted groups across the UK, the total number of persons vaccinated often increased. The reasons for this apparent decline in coverage are likely to be multifactorial, but the impact of influenza this season, again highlights the importance of ensuring optimal vaccine uptake in target groups. Activity from other typical circulating respiratory viruses, including RSV, rhinovirus, adenovirus, parainfluenza and hMPV, was overall similar to that seen in the previous few seasons. Surveillance for potential imported cases continues within the UK for the two novel respiratory viruses which emerged in 2012 to 2013: MERS-CoV and influenza A(H7N9) in the Middle East and Far East respectively, and both of which have high reported case fatality ratios.
Surveillance of influenza and other respiratory viruses in the United Kingdom: Winter 2015 to 2016
44
Acknowledgments
Compiled by the Respiratory Diseases department, Centre for Infectious Disease Surveillance and Control, Public Health England With contributions from: Royal College of General Practitioners Health Protection Scotland Public Health, Wales Public Health Agency, Northern Ireland Real-time Syndromic Surveillance Team, Public Health England Flusurvey, London School of Hygiene & Tropical Medicine RVU, VRD, MS Colindale, Public Health England