Embed Size (px)
Citation preview
Centers for Disease Control and Prevention National Center for Injury Prevention and Control
Surveillance Report Highlights from the Annual Surveillance Report of Drug-Related Risks and Outcomes United States, 2017
August 31, 2017

Background: The Drug Epidemic in the United States
• Drug overdose deaths in the United States more than tripled from 1999 to 2015.
• Since 2010, the U.S. has seen sharp increases in deaths from heroin, synthetic opioids (e.g., fentanyl), cocaine, and methamphetamine.
• Drug overdoses are responsible for parallel increasing trends in nonfatal emergency department and hospital admissions.

Data Sources
Outcome Data Source Year(s)
Opioid prescribing practices QuintilesIMS Health® 2006-2016
Drug use, misuse, and substance use disorder
National Survey on Drug Use and Health (NSDUH)a
2014-2015
Nonfatal overdose hospitalizations and emergency department (ED) visits
Healthcare Cost and Utilization Project (HCUP)b
2014
Drug overdose mortality National Vital Statistics System (NVSS) Mortality Componentc
1999-2015
aA product of the Substance Abuse and Mental Health Services Administration bA product of the Agency for Healthcare Research and Quality (AHRQ), cMaintained by the National Center for Health Statistics, CDC.
Note: For a detailed description of data sources, definitions, and statistical analyses as well as an in-depth presentation of results, please refer to the report: Centers for Disease Control and Prevention. Annual Surveillance Report of Drug-Related Risks and Outcomes — United States, 2017. Surveillance Special Report 1. Centers for Disease Control and Prevention, U.S. Department of Health and Human Services. https://www.cdc.gov/drugoverdose/data Published [August 31, 2017].

Opioid Prescribing Practices

Opioid Prescribing Practices
National total number and rate of opioid prescriptions (Rx) dispensed per 100 persons annually — United States, 2016
Prescribing Opioids 2016
Rx Number Ratea
U. S. Census population 323,127,513 Total patients who had opioid Rx filled 61,862,364 19.1 Rx
All opioids 214,881,622 66.5 LA/ER opioidsb 20,394,389 6.3 Days of supply per Rx
< 30 days 126,546,618 39.2 ≥ 30 days 88,335,004 27.3
Average opioid Rx per patient 3.5 Average days of supply per Rx 18.1
Source: QuintilesIMS® Transactional Data Warehouse. Abbreviation: Rx, prescription. aRate per 100 persons adjusted to the U.S. census population. bLA/ER represents opioids that are long acting (LA) or extended release (ER).
Opioid Prescribing Practices
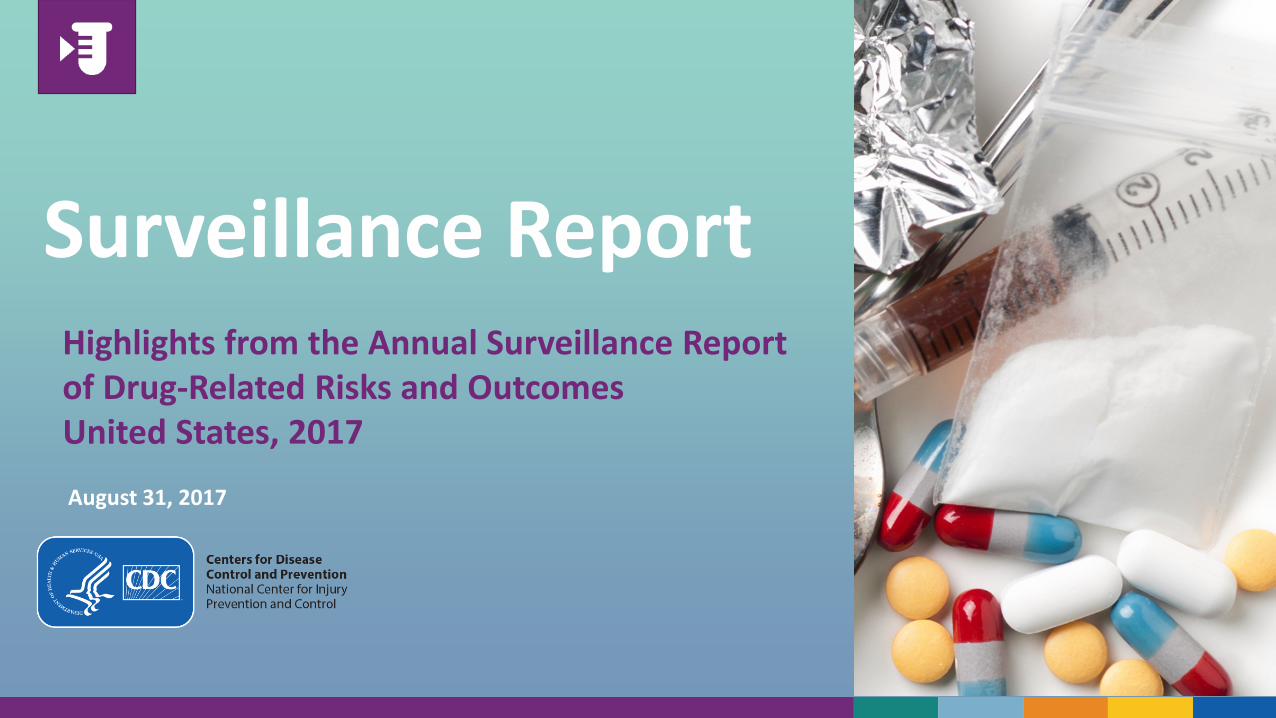
National total number and rate of morphine milligram equivalents (MME) dispensed per 100 persons annually — United States, 2016
Prescribing Opioids 2016
Rx Number Ratea
MME
Total MME 193,655,422,929
MME per capita 599.3
Average MME per Rx 901.2
Average daily MME per Rx 47.1
Daily dose per Rx
< 50 MME 158,045,552.3 48.9
≥ 50 but < 90 MME 37,087,168.8 11.5
≥ 90 MME (high-dose) 19,748,900.8 6.1
Source: QuintilesIMS ® Transactional Data Warehouse. Abbreviation: MME, morphine milligram equivalent; Rx, prescription. aRate per 100 persons adjusted to the U.S. census population.

Opioid Prescribing Practices
National opioid prescribing rate, by sex — United States, 2016
Male Female
16.4
21.8
0.0
5.0
10.0
15.0
20.0
25.0 Ra
tes p
er 1
00 P
erso
ns
Source: QuintilesIMS® Total Patient Tracker, 2016 Enhanced. Estimated rate of patients who had at least one opioid prescription filled or refilled

Opioid Prescribing Practices
National opioid prescribing rate, by age group — United States, 2016
2.0
11.6
15.1
19.9 22.7
25.3 28.2 28.9
0.0
5.0
10.0
15.0
20.0
25.0
30.0
35.0
Rate
s per
100
per
sons
0 - 14 15 - 19 20 - 24 25 - 34 35 - 44 45 - 54 55 - 64 ≥ 65
Age Group
Source: QuintilesIMS ® Total Patient Tracker, 2016 Enhanced. Estimated rate of patients who had at least one opioid prescription filled or refilled per100 persons, adjusted to the U.S. census population

Opioid Prescribing Practices
Trends in annual opioid prescribing rates by overall and high-dosage (≥ 90 MME/day) prescriptions — United States, 2006-2016
90 Overall
0
10
20
30
40
50
60
70
80
Pres
crib
ing
rate
per
100
per
sons
High Dosage
2006 2007 2008 2009 2010 2011 2012 2013 2014 2015 2016
Year
Source: QuintilesIMS ® Transactional Data Warehouse. Abbreviation: MME, morphine milligram equivalent. Rate per 100 persons adjusted to the U.S. census population. High-dosage prescriptions ( ≥ 90 MME/day)

Opioid Prescribing Practices
Trends in rates of average days of supply per opioid prescription per 100 persons — United States, 2006-2016
0
10
20
30
40
50
60
Pres
crib
ing
rate
per
100
per
sons
< 30 Days
≥ 30 Days
2006 2007 2008 2009 2010 2011 2012 2013 2014 2015 2016
Year
Source: QuintilesIMS® Transactional Data Warehouse. Rate per 100 persons adjusted to the U.S. census population.

Opioid Prescribing Practices
Trends in average daily morphine milligram equivalent (MME) per prescription — United States, 2006-2016
Aver
age
MM
E pe
r day
70
60
50
40
30
20
10
0 2006 2007 2008 2009 2010 2011 2012 2013 2014 2015 2016
Year
Source: QuintilesIMS ® Transactional Data Warehouse. Abbreviation: MME, morphine milligram equivalent

Opioid Prescribing Practices
Trends in annual opioid prescribing rates by days of supply per prescription, United States — 2006-2016
Aver
age
Days
of S
uppl
y
19
18
17
16
15
14
13
12
11
10 2006 2007 2008 2009 2010 2011 2012 2013 2014 2015 2016
Year
Source: QuintilesIMS ® Transactional Data Warehouse. Rate per 100 persons adjusted to the U.S. census population.

Drug Use, Misuse, and Substance Use Disorder
Drug Use, Misuse, and Substance Use Disorder
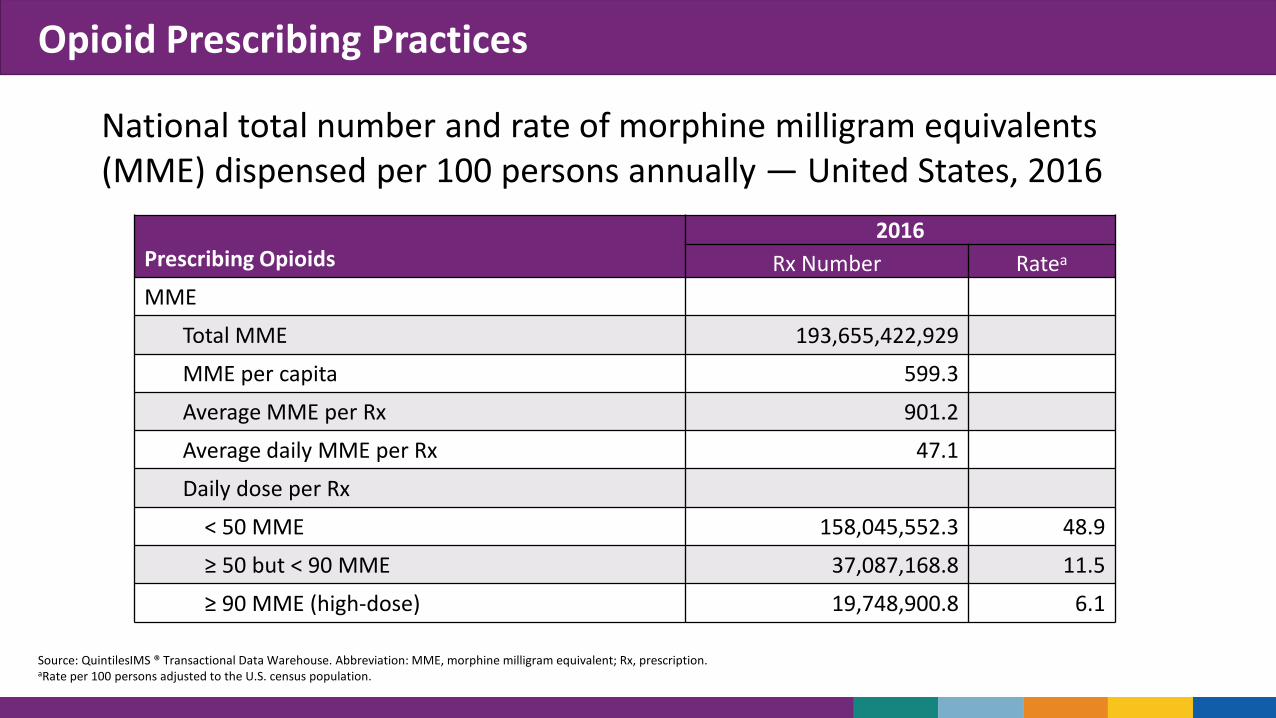
Self-reported prevalence of prescription drug misuse and illicit drug use in past year, persons 12+ years old — United States, 2015
5.0 4.7 Ra
tes p
er 1
00 p
erso
ns
4.5
4.0
3.5 Prescription Pain Relievers
Prescription Tranquilizers 3.0
Prescription Stimulants 2.5 Prescription Sedatives 2.0 Heroin 1.5 Cocaine 1.0 Methamphetamine
0.5
0.0
2.3 2.0
0.6 0.3
1.8
0.6
Source: Center for Behavioral Health Statistics and Quality. (2016). 2015 National Survey on Drug Use and Health. Substance Abuse and Mental Health Services Administration, Rockville, MD Misuse of prescription drugs is defined as use in any way not directed by a doctor, including use without a prescription of one's own medication; use in greater amounts, more often, or longer than told to take a drug; or use in any other way not directed by a doctor. Prescription drugs do not include over-the-counter drugs. Rates per 100 persons. NSDUH presents these as prevalence estimates in the form of percentages, rounded to the nearest tenth of a percent.

Drug Use, Misuse, and Substance Use Disorder
Self-reported prevalence of prescription drug misuse in past year by sex and race/ethnicity, persons 12+ years old — United States, 2015
Rate
s per
100
Per
sons
6.0
5.0
4.0
3.0
2.0
1.0
0.0
5.3
4.0
4.8 4.4
5.0
2.4 2.1
2.6
1.5 2.0
2.3
1.6
2.4
0.7
1.5
0.5 0.7 0.7 0.2 0.4
Prescription Pain Relievers
Prescription Tranquilizers
Prescription Stimulants
Prescription Sedatives
Male Female White, Black, Hispanic non-Hispanic non-Hispanic
Source: Center for Behavioral Health Statistics and Quality. (2016). 2015 National Survey on Drug Use and Health. Substance Abuse and Mental Health Services Administration, Rockville, MD Misuse of prescription drugs is defined as use in any way not directed by a doctor, including use without a prescription of one's own medication; use in greater amounts, more often, or longer than told to take a drug; or use in any other way not directed by a doctor. Prescription drugs do not include over-the-counter drugs. Rates per 100 persons. NSDUH presents these as prevalence estimates in the form of percentages, rounded to the nearest tenth of a percent.

Rate
s Per
100
Per
sons
9.0
8.0
7.0
6.0
5.0
4.0
3.0
2.0
1.0
0.0
Drug Use, Misuse, and Substance Use Disorder
Self-reported prevalence of prescription drug misuse in past year by age group, persons 12+ years old — United States, 2015
3.9
8.5
7.4
5.5
4.9
4.5
3.8
3.8
2.3
1.31.
6
5.4
3.5
2.3
2.2
1.6 2.
1
1.4
1.0
0.6
2.0
7.3
3.4
1.6
0.7
0.7 0.8
0.4
0.1
<0.1
0.4 0.
8 0.9
0.7
0.5
0.5
0.5 0.
8
0.2 0.3
12-17 18-25 26-34 35-39 40-44 45-49 50-54 55-59 60-64 65+ Age Group
Prescription Pain Relievers Prescribed Tranquilizers Prescribed Stimulants Prescribed Sedatives
Source: Center for Behavioral Health Statistics and Quality. (2016). 2015 National Survey on Drug Use and Health. Substance Abuse and Mental Health Services Administration, Rockville, MD Misuse of prescription drugs is defined as use in any way not directed by a doctor, including use without a prescription of one's own medication; use in greater amounts, more often, or longer than told to take a drug; or use in any other way not directed by a doctor. Prescription drugs do not include over-the-counter drugs. Rates per 100 persons. NSDUH presents these as prevalence estimates in the form of percentages, rounded to the nearest tenth of a percent.

Drug Use, Misuse, and Substance Use Disorder
Self-reported prevalence of prescription pain reliever misuse in past year, persons 12+ years old by region — United States, 2015
5.3 per 100 persons
4.6 per 100 persons
4.2 per 100 persons
4.4 per 100 persons
Source: Center for Behavioral Health Statistics and Quality. (2016). 2015 National Survey on Drug Use and Health. Substance Abuse and Mental Health Services Administration, Rockville, MD Misuse of prescription drugs is defined as use in any way not directed by a doctor, including use without a prescription of one's own medication; use in greater amounts, more often, or longer than told to take a drug; or use in any other way not directed by a doctor. Prescription drugs do not include over-the-counter drugs. Rates per 100 persons. NSDUH presents these as prevalence estimates in the form of percentages, rounded to the nearest tenth of a percent.

Drug Use, Misuse, and Substance Use Disorder
Self-reported prevalence of illicit drug use in past year by sex and race/ethnicity, persons 12+ years old — United States, 2015
Rate
s Per
100
Per
sons
3.0
2.5
2.0
1.5
1.0
0.5
0.0
0.4 0.2
0.3 0.4
0.3
2.4
1.3
1.8
2.4
1.7
0.9
0.4
0.7
0.4 0.6
Male Female
Heroin
Cocaine
Methamphetamine
White, non- Black, non- Hispanic Hispanic Hispanic
Source: Center for Behavioral Health Statistics and Quality. (2016). 2015 National Survey on Drug Use and Health. Substance Abuse and Mental Health Services Administration, Rockville, MD Rates per 100 persons. NSDUH presents these as prevalence estimates in the form of percentages, rounded to the nearest tenth of a percent.

Drug Use, Misuse, and Substance Use Disorder
Self-reported prevalence of illicit drug use in past year by age group, persons 12-44 years old — United States, 2015
6.0 5.4
5.0
4.0 3.2
3.0
2.0 2.0
1.4 1.1 1.1 0.9 0.8 0.8 1.0 0.6 0.6
0.3 0.2 0.2 0.1 0.0
12-17 18-25 26-34 35-39 40-44 Age Group
Heroin Cocaine Illicit Methamphetamine
Source: Center for Behavioral Health Statistics and Quality. (2016). 2015 National Survey on Drug Use and Health. Substance Abuse and Mental Health Services Administration, Rockville, MD Rates per 100 persons. NSDUH presents these as prevalence estimates in the form of percentages, rounded to the nearest tenth of a percent. Age categories presented in this slide are truncated due to the lack of available information on heroin use for persons in age groups 45 years and older.
Rate
s per
100
per
sons

Drug Use, Misuse, and Substance Use Disorder
Self-reported prevalence of heroin use in past year, persons 12+ years old by region — United States, 2015
0.5 per 100 persons
0.4 per 100 persons
0.3 per 100 persons
0.2 per 100 persons
Source: Center for Behavioral Health Statistics and Quality. (2016). 2015 National Survey on Drug Use and Health. Substance Abuse and Mental Health Services Administration, Rockville, MD Rates per 100 persons. NSDUH presents these as prevalence estimates in the form of percentages, rounded to the nearest tenth of a percent.

Drug Use, Misuse, and Substance Use Disorder
Self-reported prevalence of cocaine use in past year, persons 12+ years old by region — United States, 2015
2.2 per 100 persons
2.1 per 100 persons
1.7 per 100 persons
1.4 per 100 persons
Source: Center for Behavioral Health Statistics and Quality. (2016). 2015 National Survey on Drug Use and Health. Substance Abuse and Mental Health Services Administration, Rockville, MD Rates per 100 persons. NSDUH presents these as prevalence estimates in the form of percentages, rounded to the nearest tenth of a percent.
Drug Use, Misuse, and Substance Use Disorder
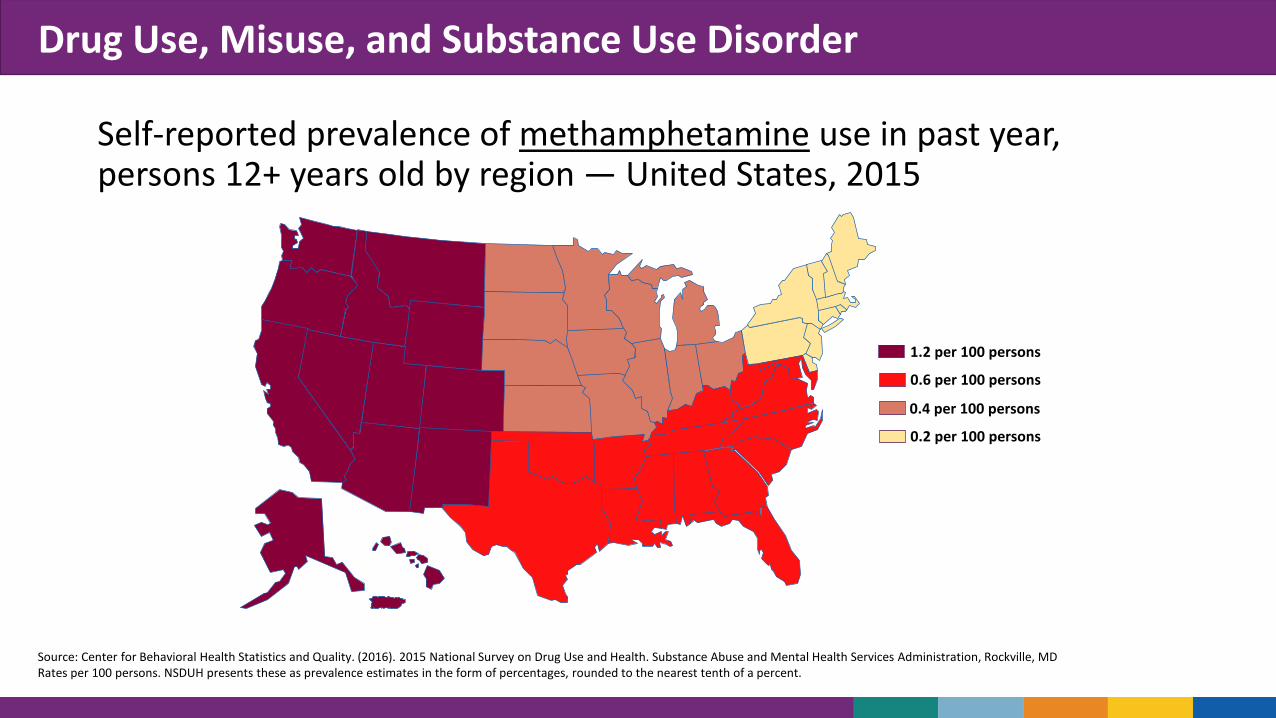
Self-reported prevalence of methamphetamine use in past year, persons 12+ years old by region — United States, 2015
1.2 per 100 persons
0.6 per 100 persons
0.4 per 100 persons
0.2 per 100 persons
Source: Center for Behavioral Health Statistics and Quality. (2016). 2015 National Survey on Drug Use and Health. Substance Abuse and Mental Health Services Administration, Rockville, MD Rates per 100 persons. NSDUH presents these as prevalence estimates in the form of percentages, rounded to the nearest tenth of a percent.
Drug Use, Misuse, and Substance Use Disorder
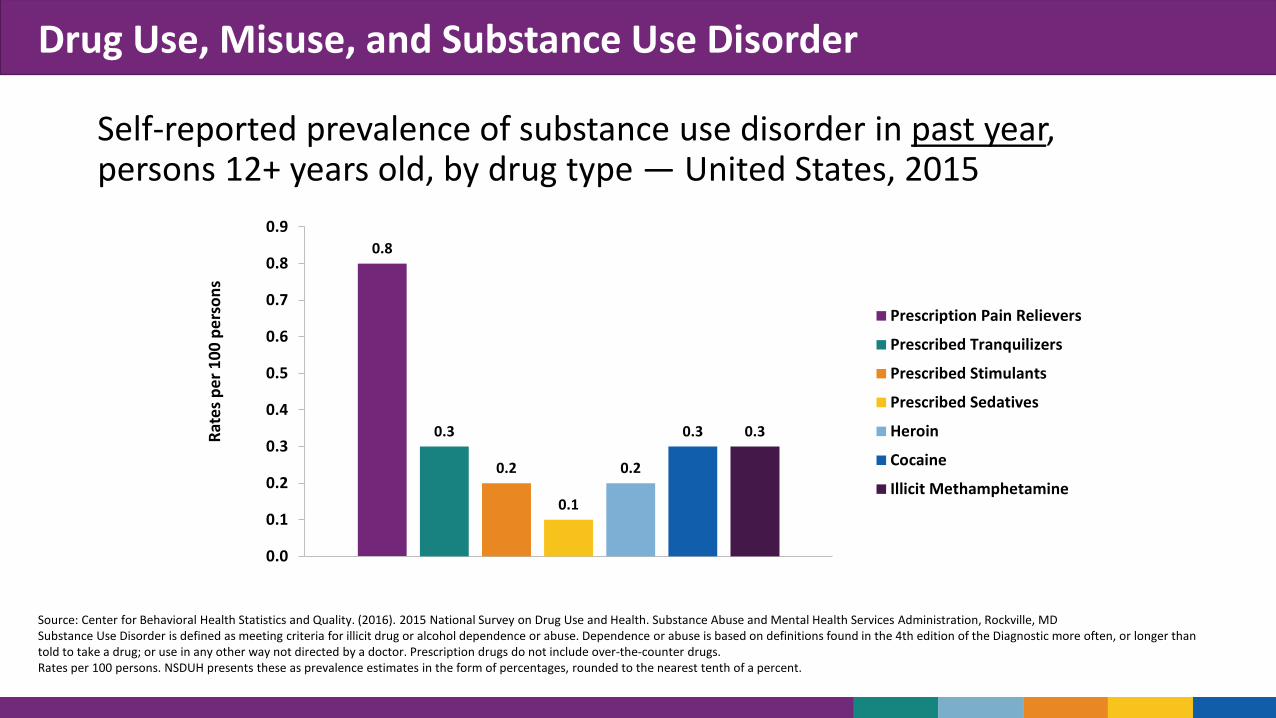
Self-reported prevalence of substance use disorder in past year, persons 12+ years old, by drug type — United States, 2015
0.9 Ra
tes p
er 1
00 p
erso
ns
0.8
0.7 Prescription Pain Relievers
0.6 Prescribed Tranquilizers
0.5 Prescribed Stimulants
Prescribed Sedatives 0.4 Heroin
0.3 Cocaine
0.2 Illicit Methamphetamine
0.1
0.0
0.8
0.3
0.2
0.1
0.2
0.3 0.3
Source: Center for Behavioral Health Statistics and Quality. (2016). 2015 National Survey on Drug Use and Health. Substance Abuse and Mental Health Services Administration, Rockville, MD Substance Use Disorder is defined as meeting criteria for illicit drug or alcohol dependence or abuse. Dependence or abuse is based on definitions found in the 4th edition of the Diagnostic more often, or longer than told to take a drug; or use in any other way not directed by a doctor. Prescription drugs do not include over-the-counter drugs. Rates per 100 persons. NSDUH presents these as prevalence estimates in the form of percentages, rounded to the nearest tenth of a percent.

Nonfatal Overdose Hospitalizations and Emergency Department (ED) Visits

Nonfatal Overdose Hospitalizations and ED Visits
Age-adjusted rate of drug poisoning related hospitalizations, by selected substances and sex — United States, 2014
87.0 90.0 80.0 71.2 70.0 60.0 50.0 40.0 30.0
15.7 15.4 20.0 12.1 9.2 5.5 5.0 10.0 2.6 3.5 1.9 2.1 1.5 1.2 0.0
All drug All opioid Heroin Methadone Other opioids Cocaine Methamphetamine
Male Female
Data source: Healthcare Cost and Utilization Project's 2014 National Inpatient Sample. All drug – includes ICD-9-CM principal diagnosis code of 960-979 (Poisoning by Drugs, Medicinal, and Biological Substances) or first listed cause of injury E850-E858 (Accidental Poisoning by Drugs, Medicinal Substances, and Biologicals). All opioid – includes ICD-9-CM principal diagnosis code of 965.00, 965.01, 965.02, 965.09 or first listed cause of injury E850.0, E850.1, E850.2. Heroin – includes ICD-9-CM principal diagnosis code of 965.01 or first listed cause of injury E850.0. Methadone – includes ICD-9-CM principal diagnosis code of 965.02 or first listed cause of injury E850.1. Other opioids – includes ICD-9-CM principal diagnosis code of 965.09, 965.00 or first listed cause of injury E850.2. Cocaine – includes ICD-9-CM principal diagnosis code of 970.81 or first listed cause of injury E854.3 or E855.2. Methamphetamine – includes ICD-9-CM principal diagnosis code of 969.72 or first listed cause of injury E854.2.
Rate
s per
100
,000
per
sons

Rate
s Per
100
,000
Per
sons
100.0
80.0
60.0
40.0
20.0
0.0
Nonfatal Overdose Hospitalizations and ED Visits
Rate of drug poisoning related hospitalizations, by selected substances and age group — United States, 2014
13.0
74.2 84
.0 98
.1
97.3
120.
5
105.
0
87.1
0.9 4.
4
15.7 20
.1
17.2 25
.0 28.9
21.1
1.7 9.
6
9.8
4.3
3.9
2.5
0.5
0.2
0.3
0.8
1.7
1.8
2.5
2.9
1.1
0.7 2.5 5.4 8.
7 11.1 18
.7 23.7
19.6
120.0
0-14 15-19 20-24 25-34 35-44 45-54 55-64 ≥65 Age Group
All drug All opioid Heroin Methadone Other opioids Data source: Healthcare Cost and Utilization Project's 2014 National Inpatient Sample. All drug – includes ICD-9-CM principal diagnosis code of 960-979 (Poisoning by Drugs, Medicinal, and Biological Substances) or first listed cause of injury E850-E858 (Accidental Poisoning by Drugs, Medicinal Substances, and Biologicals). All opioid – includes ICD-9-CM principal diagnosis code of 965.00, 965.01, 965.02, 965.09 or first listed cause of injury E850.0, E850.1, E850.2. Heroin – includes ICD-9-CM principal diagnosis code of 965.01 or first listed cause of injury E850.0. Methadone – includes ICD-9-CM principal diagnosis code of 965.02 or first listed cause of injury E850.1. Other opioids – includes ICD9-CM principal diagnosis code of 965.09, 965.00 or first listed cause of injury E850.2.

Nonfatal Overdose Hospitalizations and ED Visits
Rate of drug poisoning related hospitalizations, by selected substances and age group — United States, 2014
12.010.8
Rate
s per
100
,000
per
sons
10.0
8.0 7.2 6.2 5.8 6.0
4.5 4.2 4.2 4.0 2.9
2.2 1.9 1.7 1.4 2.0 0.6 0.7
0.2 0.0
0-14 15-19 20-24 25-34 35-44 45-54 55-64 ≥65
Age Group
Cocaine Methamphetamine
Data source: Healthcare Cost and Utilization Project's 2014 National Inpatient Sample. Cocaine – includes ICD-9-CM principal diagnosis code of 970.81 or first listed cause of injury E854.3 or E855.2. Methamphetamine – includes ICD-9-CM principal diagnosis code of 969.72 or first listed cause of injury E854.2.
0.4

Nonfatal Overdose Hospitalizations and ED Visits
Age-adjusted rate of all opioid poisoning related hospitalizations by region — United States, 2014
17.8 per 100,000 population
15.9 per 100,000 population
15.3 per 100,000 population
14.4 per 100,000 population
Source: Weighted national estimates from HCUP Nationwide Inpatient Sample (NIS), 2014, Agency for Healthcare Research and Quality (AHRQ). All opioid poisoning includes ICD-9-CM principal diagnosis code of 965.00, 965.01, 965.02, 965.09 or first listed cause of injury E850.0, E850.1, E850.2.
Nonfatal Overdose Hospitalizations and ED Visits
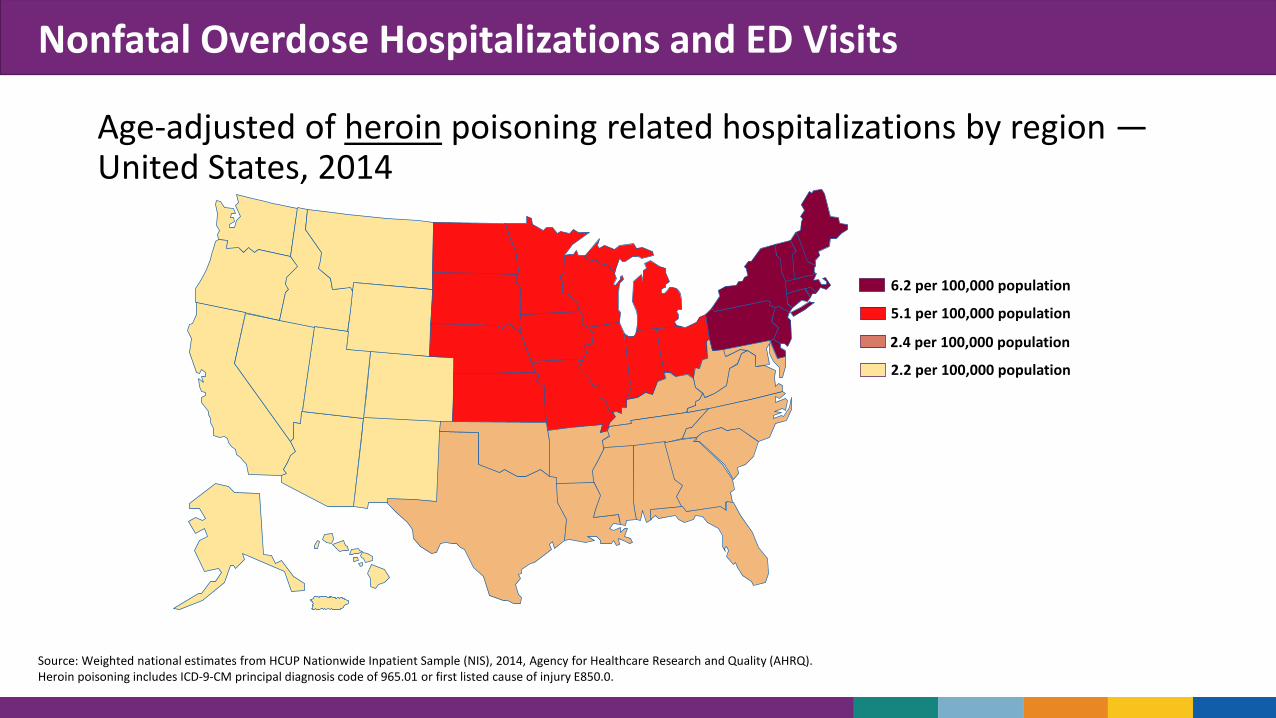
Age-adjusted of heroin poisoning related hospitalizations by region — United States, 2014
6.2 per 100,000 population
5.1 per 100,000 population
2.4 per 100,000 population
2.2 per 100,000 population
Source: Weighted national estimates from HCUP Nationwide Inpatient Sample (NIS), 2014, Agency for Healthcare Research and Quality (AHRQ). Heroin poisoning includes ICD-9-CM principal diagnosis code of 965.01 or first listed cause of injury E850.0.

Nonfatal Overdose Hospitalizations and ED Visits
Age-adjusted rate of methadone poisoning related hospitalizations by region — United States, 2014
1.7 per 100,000 population
1.4 per 100,000 population
1.3 per 100,000 population
1.2 per 100,000 population
Source: Weighted national estimates from HCUP Nationwide Inpatient Sample (NIS), 2014, Agency for Healthcare Research and Quality (AHRQ). Methadone poisoning includes ICD-9-CM principal diagnosis code of 965.02 or first listed cause of injury E850.1.

Nonfatal Overdose Hospitalizations and ED Visits
Age-adjusted rate of cocaine poisoning related hospitalizations by region — United States, 2014
7.5 per 100,000 population
4.3 per 100,000 population
3.3 per 100,000 population
1.5 per 100,000 population
Source: Weighted national estimates from HCUP Nationwide Inpatient Sample (NIS), 2014, Agency for Healthcare Research and Quality (AHRQ). Cocaine poisoning includes ICD-9-CM principal diagnosis code of 970.81 or first listed cause of injury E854.3 or E855.2.
Nonfatal Overdose Hospitalizations and ED Visits
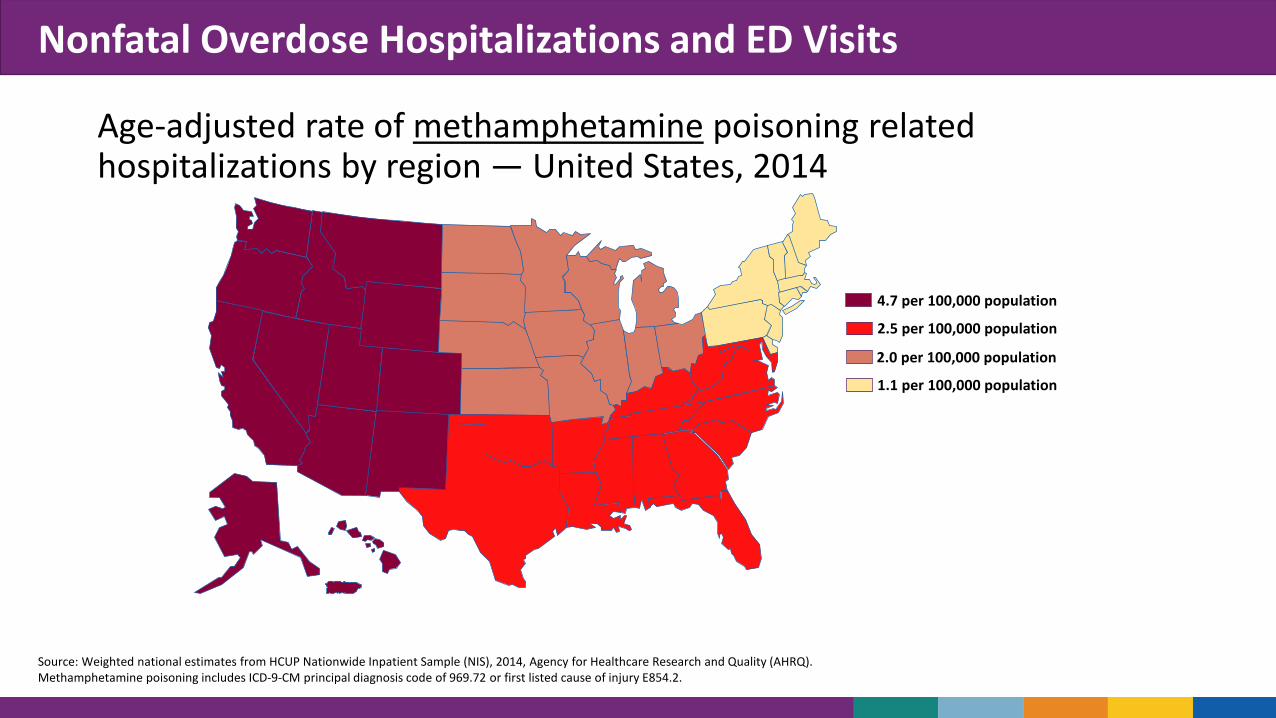
Age-adjusted rate of methamphetamine poisoning related hospitalizations by region — United States, 2014
4.7 per 100,000 population
2.5 per 100,000 population
2.0 per 100,000 population
1.1 per 100,000 population
Source: Weighted national estimates from HCUP Nationwide Inpatient Sample (NIS), 2014, Agency for Healthcare Research and Quality (AHRQ). Methamphetamine poisoning includes ICD-9-CM principal diagnosis code of 969.72 or first listed cause of injury E854.2.
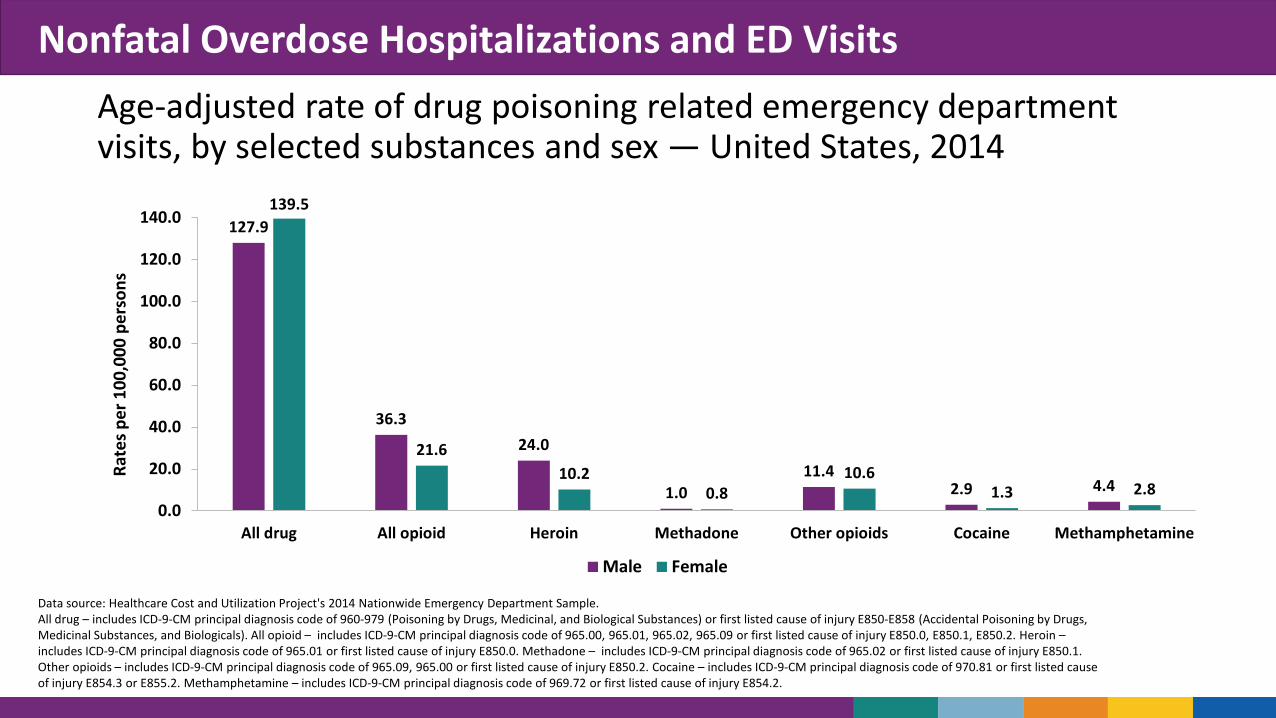
Nonfatal Overdose Hospitalizations and ED Visits Age-adjusted rate of drug poisoning related emergency department visits, by selected substances and sex — United States, 2014
139.5 140.0 127.9
120.0
100.0
80.0
60.0
36.3 40.0 24.0 21.6
20.0 10.2 11.4 10.6 2.9 1.3 4.4 2.8 1.0 0.8
0.0 All drug All opioid Heroin Methadone Other opioids Cocaine Methamphetamine
Male Female
Data source: Healthcare Cost and Utilization Project's 2014 Nationwide Emergency Department Sample. All drug – includes ICD-9-CM principal diagnosis code of 960-979 (Poisoning by Drugs, Medicinal, and Biological Substances) or first listed cause of injury E850-E858 (Accidental Poisoning by Drugs, Medicinal Substances, and Biologicals). All opioid – includes ICD-9-CM principal diagnosis code of 965.00, 965.01, 965.02, 965.09 or first listed cause of injury E850.0, E850.1, E850.2. Heroin – includes ICD-9-CM principal diagnosis code of 965.01 or first listed cause of injury E850.0. Methadone – includes ICD-9-CM principal diagnosis code of 965.02 or first listed cause of injury E850.1. Other opioids – includes ICD-9-CM principal diagnosis code of 965.09, 965.00 or first listed cause of injury E850.2. Cocaine – includes ICD-9-CM principal diagnosis code of 970.81 or first listed cause of injury E854.3 or E855.2. Methamphetamine – includes ICD-9-CM principal diagnosis code of 969.72 or first listed cause of injury E854.2.
Rate
s per
100
,000
per
sons
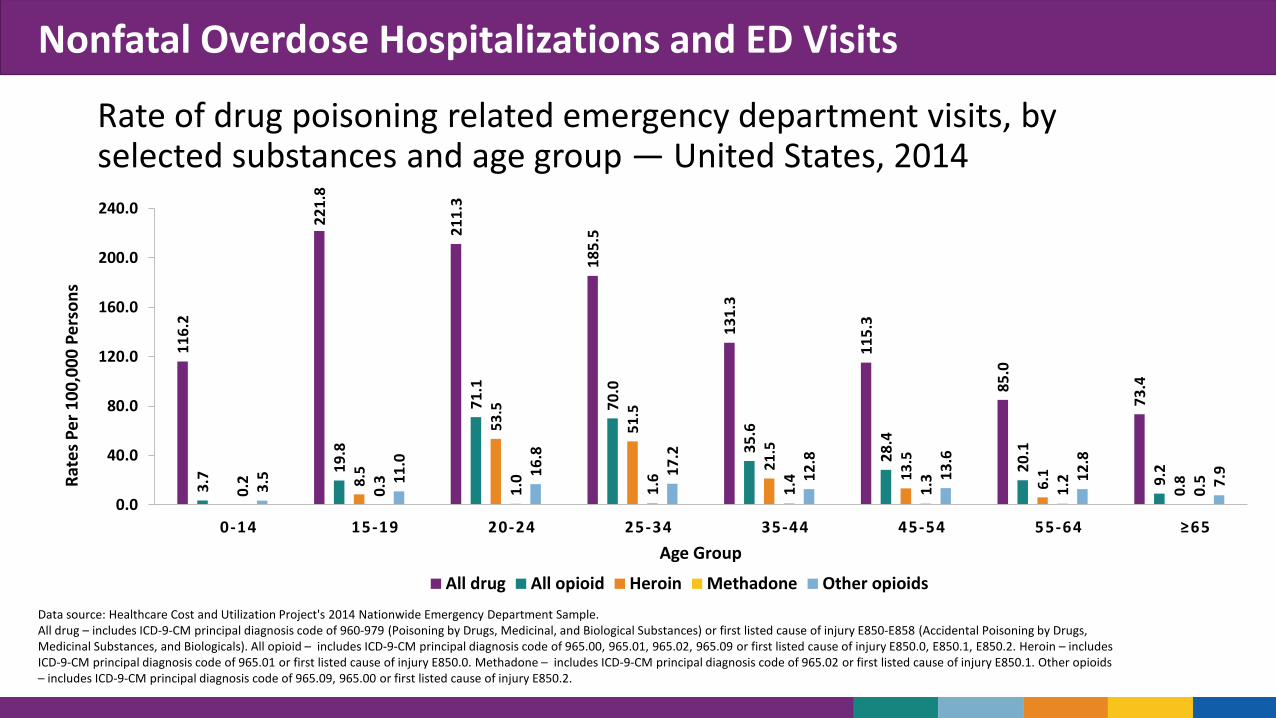
Nonfatal Overdose Hospitalizations and ED Visits
Rate of drug poisoning related emergency department visits, by selected substances and age group — United States, 2014
116.
2
221.
8
211.
3
185.
5
131.
3
115.
3
85.0
73.4
3.7 19
.8
71.1
70.0
35.6
28.4
20.1
9.2
8.5
53.5
51.5
21.5
13.5
6.1
0.8
0.2
0.3
1.0
1.6
1.4
1.3
1.2
0.5 3.5 11
.0 16.8
17.2
12.8
13.6
12.8
7.9
0.0
40.0
80.0
120.0
160.0
200.0
240.0
Rate
s Per
100
,000
Per
sons
0 -14 15-19 20-24 25-34 35-44 45-54 55-64 ≥65 Age Group
All drug All opioid Heroin Methadone Other opioids
Data source: Healthcare Cost and Utilization Project's 2014 Nationwide Emergency Department Sample. All drug – includes ICD-9-CM principal diagnosis code of 960-979 (Poisoning by Drugs, Medicinal, and Biological Substances) or first listed cause of injury E850-E858 (Accidental Poisoning by Drugs, Medicinal Substances, and Biologicals). All opioid – includes ICD-9-CM principal diagnosis code of 965.00, 965.01, 965.02, 965.09 or first listed cause of injury E850.0, E850.1, E850.2. Heroin – includes ICD-9-CM principal diagnosis code of 965.01 or first listed cause of injury E850.0. Methadone – includes ICD-9-CM principal diagnosis code of 965.02 or first listed cause of injury E850.1. Other opioids – includes ICD-9-CM principal diagnosis code of 965.09, 965.00 or first listed cause of injury E850.2.
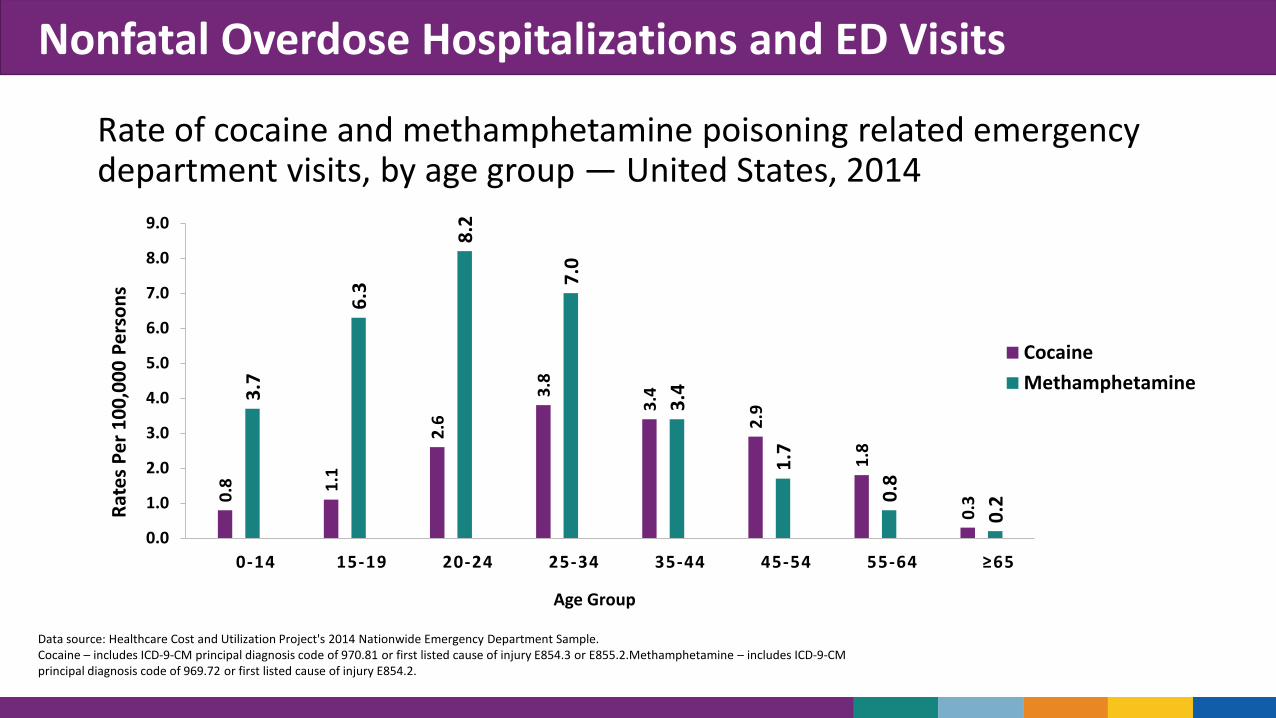
Nonfatal Overdose Hospitalizations and ED Visits
Rate of cocaine and methamphetamine poisoning related emergency department visits, by age group — United States, 2014
Rate
s Per
100
,000
Per
sons
9.0
8.0
7.0
6.0 Cocaine 5.0
0.8 1.
1
2.6
3.8
3.4
2.9
1.8
0.3
3.7
6.3
8.2
7.0
3.4
1.7
0.8
0.2
0-14 15-19 20-24 25-34 35-44 45-54 55-64 ≥65
4.0
3.0
2.0
1.0
0.0
Methamphetamine
Age Group
Data source: Healthcare Cost and Utilization Project's 2014 Nationwide Emergency Department Sample. Cocaine – includes ICD-9-CM principal diagnosis code of 970.81 or first listed cause of injury E854.3 or E855.2.Methamphetamine – includes ICD-9-CM principal diagnosis code of 969.72 or first listed cause of injury E854.2.

Nonfatal Overdose Hospitalizations and ED Visits
Age-adjusted rate of all opioid poisoning related emergency department visits by region — United States, 2014
49.9 per 100,000 population
37.9 per 100,000 population
20.9 per 100,000 population
19.0 per 100,000 population
Source: Weighted national estimates from HCUP Nationwide Emergency Department Sample (NEDS), 2014, Agency for Healthcare Research and Quality (AHRQ). Persons who were hospitalized, died, or transferred to another facility were excluded. All opioid poisoning includes ICD-9-CM principal diagnosis code of 965.00, 965.01, 965.02, 965.09 or first listed cause of injury E850.0, E850.1, E850.2.

Nonfatal Overdose Hospitalizations and ED Visits
Age-adjusted rate of heroin poisoning-related emergency department visits by region — United States, 2014
37.7 per 100,000 population
24.8 per 100,000 population
9.9 per 100,000 population
7.0 per 100,000 population
Source: Weighted national estimates from HCUP Nationwide Emergency Department Sample (NEDS), 2014, Agency for Healthcare Research and Quality (AHRQ). Persons who were hospitalized, died, or transferred to another facility were excluded. Heroin poisoning includes ICD-9-CM principal diagnosis code of 965.01 or first listed cause of injury E850.0.

Nonfatal Overdose Hospitalizations and ED Visits
Age-adjusted rate of methadone poisoning related emergency department visits by region — United States, 2014
1.2 per 100,000 population
1.0 per 100,000 population
0.8 per 100,000 population
0.7 per 100,000 population
Source: Weighted national estimates from HCUP Nationwide Emergency Department Sample (NEDS), 2014, Agency for Healthcare Research and Quality (AHRQ). Persons who were hospitalized, died, or transferred to another facility were excluded. Methadone poisoning includes ICD-9-CM principal diagnosis code of 965.02 or first listed cause of injury E850.1.

Nonfatal Overdose Hospitalizations and ED Visits
Age-adjusted rate of cocaine poisoning related emergency departmentvisits by region — United States, 2014
2.7 per 100,000 population
2.1 per 100,000 population
1.8 per 100,000 population
1.4 per 100,000 population
Source: Weighted national estimates from HCUP Nationwide Emergency Department Sample (NEDS), 2014, Agency for Healthcare Research and Quality (AHRQ). Persons who were hospitalized, died, or transferred to another facility were excluded. Cocaine poisoning includes ICD-9-CM principal diagnosis code of 970.81 or first listed cause of injury E854.3 or E855.2.

Nonfatal Overdose Hospitalizations and ED Visits
Age-adjusted rate of methamphetamine poisoning related emergency department visits by region — United States, 2014
5.1 per 100,000 population
3.7 per 100,000 population
3.2 per 100,000 population
2.2 per 100,000 population
Source: Weighted national estimates from HCUP Nationwide Emergency Department Sample (NEDS), 2014, Agency for Healthcare Research and Quality (AHRQ). Persons who were hospitalized, died, or transferred to another facility were excluded. Methamphetamine poisoning includes ICD-9-CM principal diagnosis code of 969.72 or first listed cause of injury E854.2.

Drug Overdose Mortality
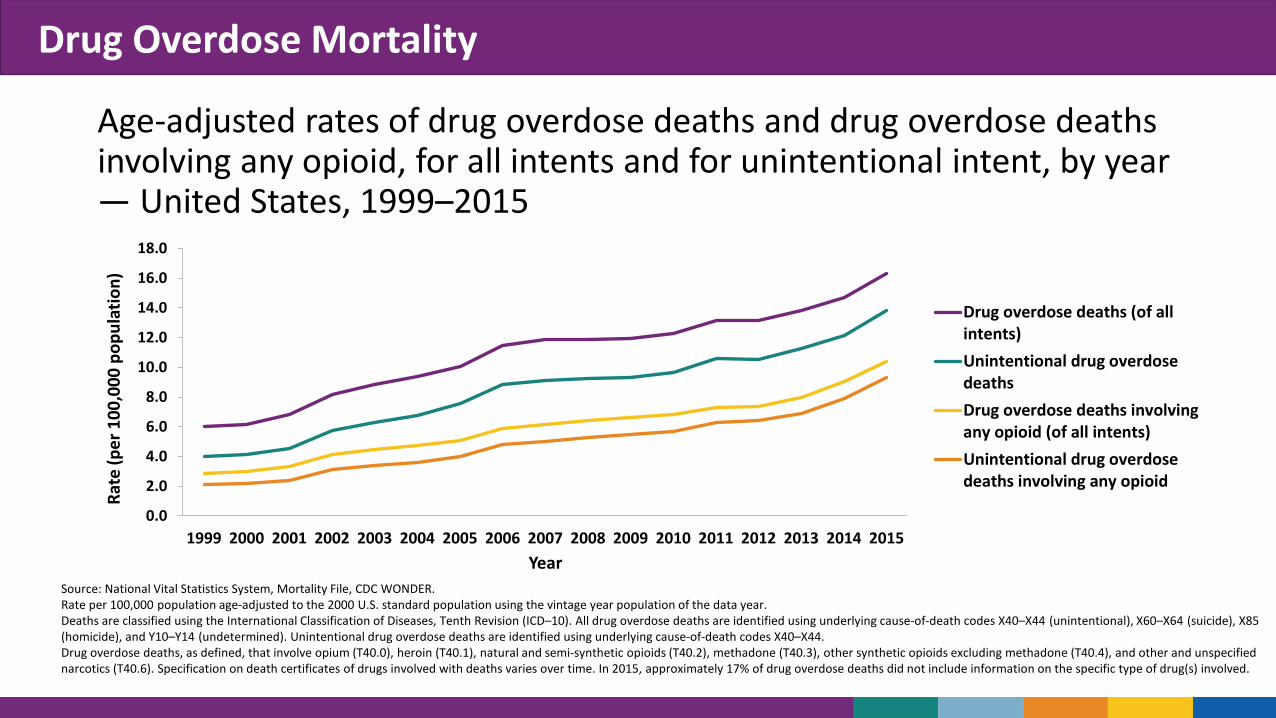
Drug Overdose Mortality
Age-adjusted rates of drug overdose deaths and drug overdose deaths involving any opioid, for all intents and for unintentional intent, by year — United States, 1999–2015
Rate
(per
100
,000
pop
ulat
ion)
18.0
16.0
14.0
12.0
10.0
8.0
6.0
4.0
2.0
0.0
Drug overdose deaths (of all intents) Unintentional drug overdose deaths Drug overdose deaths involving any opioid (of all intents) Unintentional drug overdose deaths involving any opioid
1999 2000 2001 2002 2003 2004 2005 2006 2007 2008 2009 2010 2011 2012 2013 2014 2015
Year Source: National Vital Statistics System, Mortality File, CDC WONDER. Rate per 100,000 population age-adjusted to the 2000 U.S. standard population using the vintage year population of the data year. Deaths are classified using the International Classification of Diseases, Tenth Revision (ICD–10). All drug overdose deaths are identified using underlying cause-of-death codes X40–X44 (unintentional), X60–X64 (suicide), X85 (homicide), and Y10–Y14 (undetermined). Unintentional drug overdose deaths are identified using underlying cause-of-death codes X40–X44. Drug overdose deaths, as defined, that involve opium (T40.0), heroin (T40.1), natural and semi-synthetic opioids (T40.2), methadone (T40.3), other synthetic opioids excluding methadone (T40.4), and other and unspecified narcotics (T40.6). Specification on death certificates of drugs involved with deaths varies over time. In 2015, approximately 17% of drug overdose deaths did not include information on the specific type of drug(s) involved.

Drug Overdose Mortality
Age-adjusted rates of drug overdose deaths, by drug or drug class and year — United States, 1999–2015
Rate
s pe
r 100
,000
per
sons
4.5
4.0
3.5
3.0
2.5
2.0
1.5
1.0
0.5
0.0
Natural and semi-synthetic opioids
Heroin
Synthetic opioids other than methadone Cocaine
Psychostimulants with abuse potential Methadone
Year
Source: National Vital Statistics System, Mortality File. Source: National Vital Statistics System, Mortality File, CDC WONDER. Rate per 100,000 population age-adjusted to the 2000 U.S. standard population using the vintage year population of the data year. Because deaths might involve more than one drug, some deaths are included in more than one category. Specification on death certificates of drugs involved with deaths varies over time. In 2015, approximately 17% of drug overdose deaths did not include information on the specific type of drug(s) involved. Some of these deaths may have involved opioids or stimulants. Deaths are classified using the International Classification of Diseases, Tenth Revision (ICD–10). Drug overdose deaths are identified using underlying cause-of-death codes X40–X44 (unintentional), X60–X64 (suicide), X85 (homicide), and Y10–Y14 (undetermined). Natural and semi-synthetic opioids: Drug overdose deaths, as defined, that involve natural and semi-synthetic opioids (T40.2). Heroin: Drug overdose deaths, as defined, that involve heroin (T40.1). Synthetic opioids other than methadone: Drug overdose deaths, as defined, that involve synthetic opioids other than methadone (T40.4). Cocaine: Drug overdose deaths, as defined, that involve cocaine (T40.5). Psychostimulants with abuse potential: Drug overdose deaths, as defined, that involve psychostimulants with abuse potential (T43.6). Methadone: Drug overdose deaths, as defined, that involve methadone (T40.3).

Drug Overdose Mortality
Rates of drug overdose deaths, by drug or drug class and age category — United States, 2015
Rate
s Per
100
,000
Per
sons
10.0
9.0
8.0
7.0
6.0
5.0
4.0
3.0
2.0
1.0
0.0
9.7
1.6
5.3
6.9
8.1
6.4
1.5
0.5
1.7 1.8 2.0
1.6
0.3
2.3
6.6
5.6
4.6
2.9
0.5
3.8
7.4
5.6
3.4
0.4 1.
0
3.6 3.8 4.
3
2.9
0.4 0.
9
3.0 3.
3 3.5
2.3
0.3
15–24 25–34 35–44 45–54 55–64 ≥65
Natural and semi-synthetic opioids Methadone Synthetic opioids other than methadone Heroin Cocaine Psychostimulants with abuse potential
Source: National Vital Statistics System, Mortality File. Source: National Vital Statistics System, Mortality File, CDC WONDER. Rate per 100,000 population age-adjusted to the 2000 U.S. standard population using the vintage year population of the data year. Because deaths might involve more than one drug, some deaths are included in more than one category. Specification on death certificates of drugs involved with deaths varies over time. In 2015, approximately 17% of drug overdose deaths did not include information on the specific type of drug(s) involved. Some of these deaths may have involved opioids or stimulants. Deaths are classified using the International Classification of Diseases, Tenth Revision (ICD–10). Drug overdose deaths are identified using underlying cause-of-death codes X40–X44 (unintentional), X60–X64 (suicide), X85 (homicide), and Y10–Y14 (undetermined). Natural and semi-synthetic opioids: Drug overdose deaths, as defined, that involve natural and semi-synthetic opioids (T40.2). Methadone: Drug overdose deaths, as defined, that involve methadone (T40.3). Synthetic opioids other than methadone: Drug overdose deaths, as defined, that involve synthetic opioids other than methadone (T40.4). Heroin: Drug overdose deaths, as defined, that involve heroin (T40.1). Cocaine: Drug overdose deaths, as defined, that involve cocaine (T40.5). Psychostimulants with abuse potential: Drug overdose deaths, as defined, that involve psychostimulants with abuse potential (T43.6).
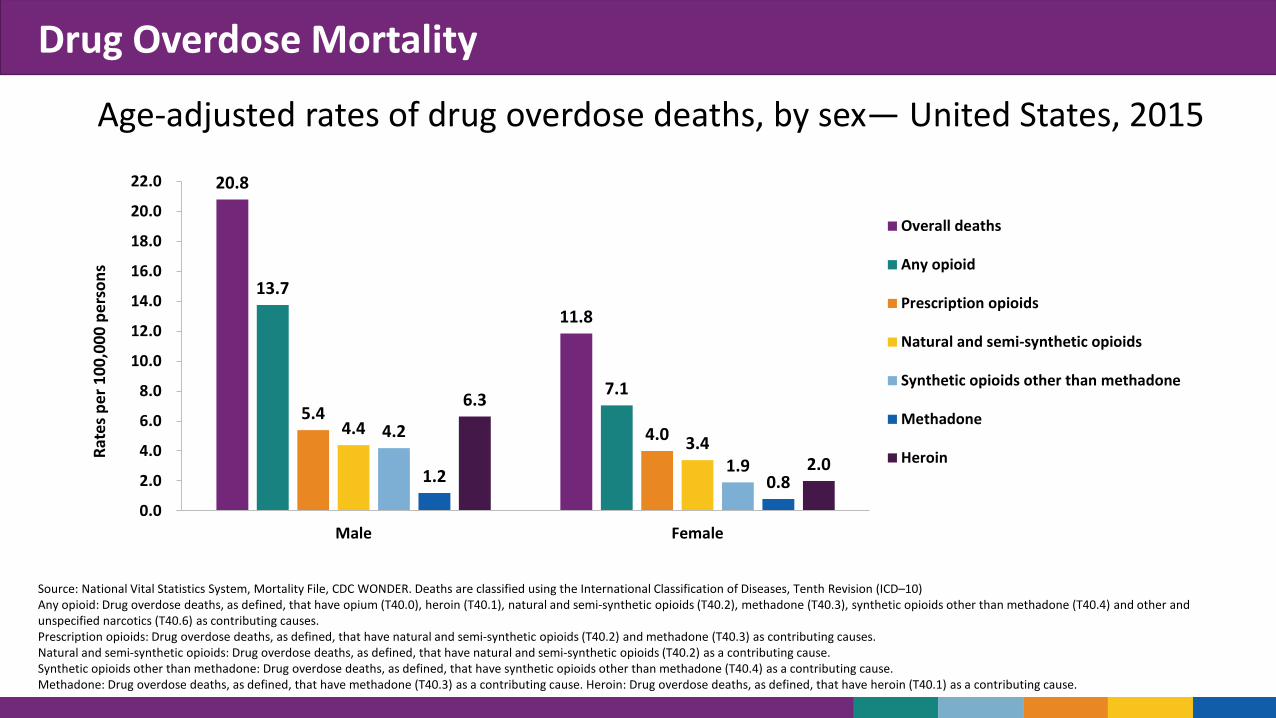
Drug Overdose Mortality
Age-adjusted rates of drug overdose deaths, by sex— United States, 2015 Ra
tes p
er 1
00,0
00 p
erso
ns
22.0
20.0
18.0
16.0
14.0
12.0
10.0
8.0
6.0
4.0
2.0
0.0
20.8
11.8 13.7
7.1 5.4
4.0 4.4 3.4
4.2
1.9 1.2 0.8
6.3
2.0
Male
Overall deaths
Any opioid
Prescription opioids
Natural and semi-synthetic opioids
Synthetic opioids other than methadone
Methadone
Heroin
Female
Source: National Vital Statistics System, Mortality File, CDC WONDER. Deaths are classified using the International Classification of Diseases, Tenth Revision (ICD–10) Any opioid: Drug overdose deaths, as defined, that have opium (T40.0), heroin (T40.1), natural and semi-synthetic opioids (T40.2), methadone (T40.3), synthetic opioids other than methadone (T40.4) and other and unspecified narcotics (T40.6) as contributing causes. Prescription opioids: Drug overdose deaths, as defined, that have natural and semi-synthetic opioids (T40.2) and methadone (T40.3) as contributing causes. Natural and semi-synthetic opioids: Drug overdose deaths, as defined, that have natural and semi-synthetic opioids (T40.2) as a contributing cause. Synthetic opioids other than methadone: Drug overdose deaths, as defined, that have synthetic opioids other than methadone (T40.4) as a contributing cause. Methadone: Drug overdose deaths, as defined, that have methadone (T40.3) as a contributing cause. Heroin: Drug overdose deaths, as defined, that have heroin (T40.1) as a contributing cause.
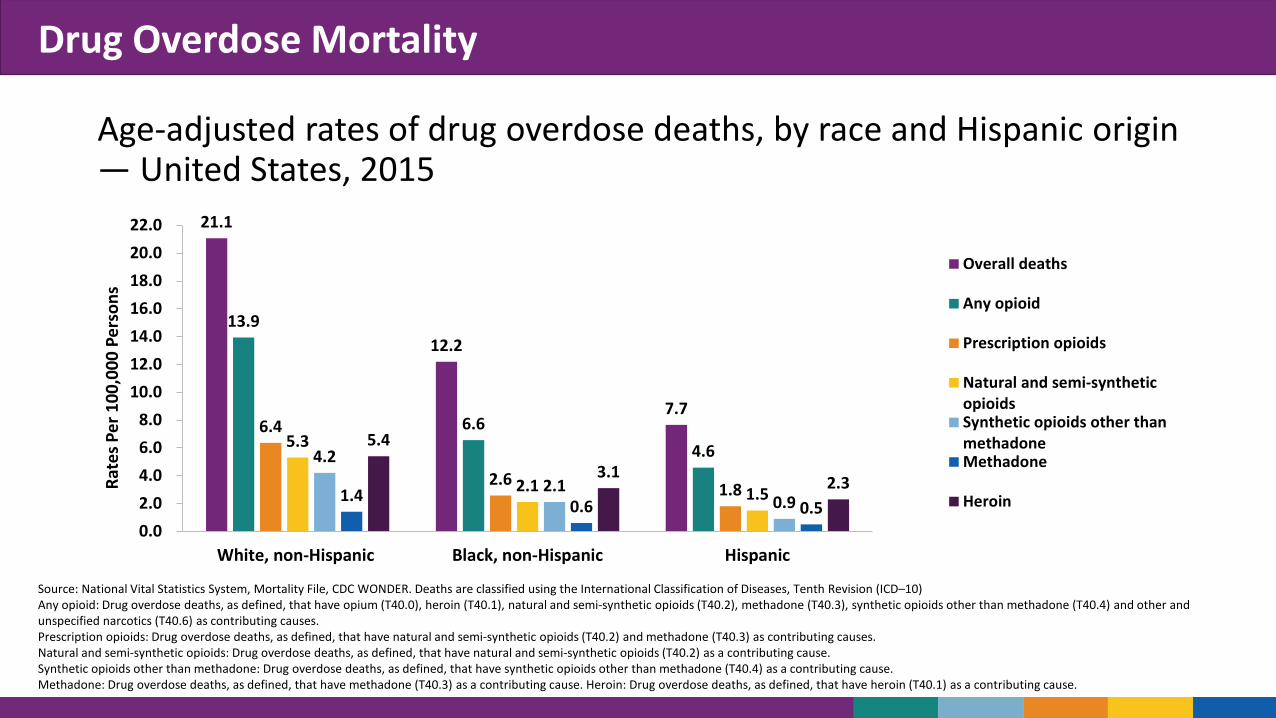
Drug Overdose Mortality
Age-adjusted rates of drug overdose deaths, by race and Hispanic origin — United States, 2015
21.1
12.2
7.7
13.9
6.6 4.6
6.4
2.6 1.8
5.3
2.1 1.5
4.2
2.1 0.9 1.4 0.6 0.5
5.4
3.1 2.3
0.0 2.0 4.0 6.0 8.0
10.0 12.0 14.0 16.0 18.0 20.0 22.0
Rate
s Per
100
,000
Per
sons
Overall deaths
Any opioid
Prescription opioids
Natural and semi-synthetic opioids Synthetic opioids other than methadone Methadone
Heroin
White, non-Hispanic Black, non-Hispanic Hispanic
Source: National Vital Statistics System, Mortality File, CDC WONDER. Deaths are classified using the International Classification of Diseases, Tenth Revision (ICD–10) Any opioid: Drug overdose deaths, as defined, that have opium (T40.0), heroin (T40.1), natural and semi-synthetic opioids (T40.2), methadone (T40.3), synthetic opioids other than methadone (T40.4) and other and unspecified narcotics (T40.6) as contributing causes. Prescription opioids: Drug overdose deaths, as defined, that have natural and semi-synthetic opioids (T40.2) and methadone (T40.3) as contributing causes. Natural and semi-synthetic opioids: Drug overdose deaths, as defined, that have natural and semi-synthetic opioids (T40.2) as a contributing cause. Synthetic opioids other than methadone: Drug overdose deaths, as defined, that have synthetic opioids other than methadone (T40.4) as a contributing cause. Methadone: Drug overdose deaths, as defined, that have methadone (T40.3) as a contributing cause. Heroin: Drug overdose deaths, as defined, that have heroin (T40.1) as a contributing cause.
Limitations
• Since multiple data sources were used, terminology and definitions were not standardized across all outcomes and most recent year of available data varied.
• Comparability of information across sections is limited
• Polysubstance use (i.e., the consumption of more than one drug over a defined period, simultaneously or at different times) was not addressed.
• For a detailed description of the data sources, definitions, and caveats please refer to the technical notes in the surveillance report.*
*Centers for Disease Control and Prevention. Annual Surveillance Report of Drug-Related Risks and Outcomes — United States, 2017. Surveillance Special Report 1. Centers for Disease Control and Prevention, U.S. Department of Health and Human Services. https://www.cdc.gov/drugoverdose/data Published [August 31, 2017].

Conclusions
1. Through 2015, drug overdose remained a large and growing publichealth crisis in the United States.
2. In 2015, misuse of prescription opioids and illicit use of heroin and fentanyl remain of concern; illicit use of cocaine and methamphetamineare increasing.
3. The leveling off and declines in opioid prescribing rates since 2012 and high-dose prescribing rates since 2009 suggest that healthcare providers have become more cautious in their opioid prescribingpractices.
4. Additional measures are now urgently needed to address a diverse and evolving array of drug types.

CDC Injury Center’s Opioid Overdose Prevention Efforts
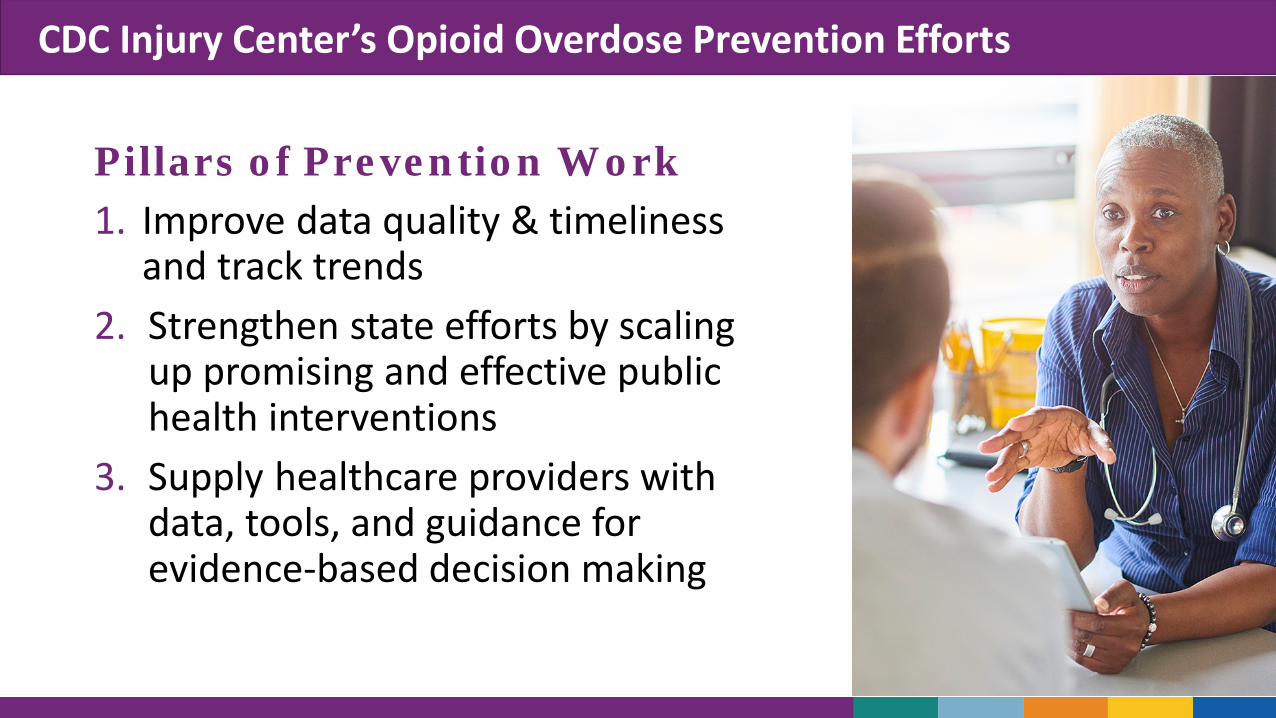
CDC Injury Center’s Opioid Overdose Prevention Efforts
Pillars of Prevention Work 1. Improve data quality & timeliness
and track trends 2. Strengthen state efforts by scaling
up promising and effective public health interventions
3. Supply healthcare providers with data, tools, and guidance for evidence-based decision making

CDC Injury Center’s Opioid Overdose Prevention Efforts
Overdose in States Prevention 1. Enhanced State Opioid Overdose Surveillance (ESOOS) –
funds 32 states and Washington DC• Increase timeliness of nonfatal and fatal opioid overdose reporting and
dissemination of results to key stakeholders
2. Prevention for States (PfS) funds 29 states• Enhance and maximize prescription drug monitoring programs,
implement interventions, evaluate impact of state policies
3. Data-Driven Prevention Initiative (DDPI) – funds 13 states and Washington DC• Improve data collection and analysis around opioid misuse, abuse,
overdose and develop comprehensive prevention programs

CDC Injury Center’s Opioid Overdose Prevention Efforts

For a detailed description of data sources, definitions, and statistical analyses as well as an in-depth presentation of results, please refer to:
Centers for Disease Control and Prevention. Annual Surveillance Report of Drug-Related Risks and Outcomes — United States, 2017. Surveillance Special Report 1. Centers for Disease Control and Prevention, U.S. Department of Health and Human Services. https://www.cdc.gov/drugoverdose/data Published [August 31, 2017].
For more information, see: https://www.cdc.gov/drugoverdose/index.html For more information, contact CDC 1-800-CDC-INFO (232-4636) TTY: 1-888-232-6348 www.cdc.gov
The findings and conclusions in this report are those of the authors and do not necessarily represent the official position of the Centers for Disease Control and Prevention.