Embed Size (px)
Citation preview

INDEX (PTY) LTD Compiled by Dr A Gouws
TEL (012) 346 5307, FAX: (012) 460 4045, [email protected]
September 18, 2012
Anderson - Dinaledi
SOIL SURVEY & AGRICULTURAL POTENTIAL STUDY
ANDERSON - DINALEDI TRANSMISSION LINE AND THE NEW ANDERSON SUBSTATION

1
TABLE OF CONTENTS 1. DESCRIPTION OF THE ENVIRONMENT ..................................................................................................... 4
1.1 PRESENT LAND USE .................................................................................................................................... 4
1.2 NATURAL RESOURCES ................................................................................................................................. 5 1.2.1 CLIMATE ......................................................................................................................................................................... 5 1.2.2 GEOLOGY ....................................................................................................................................................................... 6 1.2.3 GEOMORPHOLOGY ............................................................................................................................................................ 6 1.2.4 WATER .......................................................................................................................................................................... 7 1.2.5 VEGETATION ................................................................................................................................................................... 7 1.2.6 SOIL .............................................................................................................................................................................. 8
1.3 AGRICULTURAL POTENTIAL .......................................................................................................................... 9 1.3.1 SOIL QUALITY ................................................................................................................................................................... 9 1.3.2 GRAZING POTENTIAL ....................................................................................................................................................... 10
2. IMPACT ASSESSMENT ...................................................................................................................... 10
2.1 IMPACT ASSESSMENT METHODOLOGY.......................................................................................................... 11
2.2 IMPACT DESCRIPTION ............................................................................................................................... 12 2.2.1 LAND USE PER ALIGNMENT ................................................................................................................................................ 12 2.2.2 IMPACT DESCRIPTION ....................................................................................................................................................... 12
2.3 IMPACT ON LABOUR ................................................................................................................................. 12
2.4 IMPACT RATING ....................................................................................................................................... 13
2.5 MITIGATION ........................................................................................................................................... 13
2.6 RECOMMENDATIONS OR ROUTE ALIGNMENT ................................................................................................ 14
3. CONCLUSIONS & FINDINGS ............................................................................................................... 14
3.1 ANDERSON - DINALEDI TRANSMISSION LINE ................................................................................................. 14
3.2 NEW ANDERSON SUBSTATION ................................................................................................................... 14
4. REFERENCES .................................................................................................................................. 15

2
SUMMARY AND CONCLUSIONS Index was requested by Nemai Consulting to undertake a desk study to indicate the agricultural potential and land capability for the proposed expansion of the Anderson - Dinaledi Transmission Line and for the new Anderson Substation. The site is located in North West Province.
Anderson - Dinaledi Transmission Line
The central western portion of the study area, just north of the Magaliesberg consists of deep, reddish and vertic soils that is high potential if they can be irrigated. The balance of the land is either too shallow or rocky to cultivate and only suitable as grazing.

3
Approximately 400 hectares is under irrigation, of which 350 is from the Hartbeespoort Dam. All the irrigated land is within the western alignment.
According to the guidelines of NDA all irrigated land is considered as high potential land.
New Anderson Substation
The north-eastern portion is underlain by andesite, the topography is uneven. The rest of the site is underlain by quartzite, which normally weathers into shallow rocky soils. Both of these are not ideal for cultivation. The rainfall is highly variable with the result that rainfed commercial irrigation is not recommended.
The site proposed for the substation is only suitable for livestock grazing and is too small to make a meaningful difference in the income potential of the farm.
Impact rating
1. Loss of irrigated land:
The impact on loss if irrigated land is difficult if not impossible to mitigate against. The impact therefore is high. The extent of impact is high on Routes A and B and moderate on C. It is low in D and E.
2. Loss of grazing land:
All routed will equally be influenced. The impact is low.
Summary of impacts and preferred route
Routes D or E are preferred because of the lower impact that it will have on farming. It will lead to the lowest loss of high potential land and of income.
4
AGRICULTURAL ASSESSMENT
1. Description of the environment
1.1 Present land use
Most of the land is used for animal grazing with only a small portion that is cultivated. North of the Magaliesberg is an extensive canal system for irrigation. Water is supplied by the Hartbeespoort Dam.
Grazing and mining is the largest land users. It is expected that the role of mining will continue to increase as more mines open.
Land use Area (hectare) Dry 347 Hydro 8 Irrigation 397 Mine 518 Road 300 Town 158 Grazing/vacant 6 332 Total 8 060

5
1.2 Natural resources
1.2.1 Climate
1.2.1.1 Rainfal l
• The average annual rainfall for the region is between 638 mm and 653 mm.
TABLE 1. AVERAGE ANNUAL RAINFALL OF STATIONS WITHIN 8 KILOMETRES OF THE SITE
Station Distance to site(km) MAP mm/year Altitude Brits 0 649 1110 Uitvalgrond 4 652 1130 De Kroon 5.7 653 1139 Hartbeespoort 7.6 638 1150
1.2.1.2 Temperature
The highest average daily maximum temperature occurs in December when 200 Celsius is reached. From December it decrease and reaches a minimum of 0,60 in June and July.
1.2.1.3 Wind
Wind with moderately speeds occurs from late winter to early summer.
1.2.1.4 Hail
Hail is infrequent but occasionally may cause damage to crops.
6
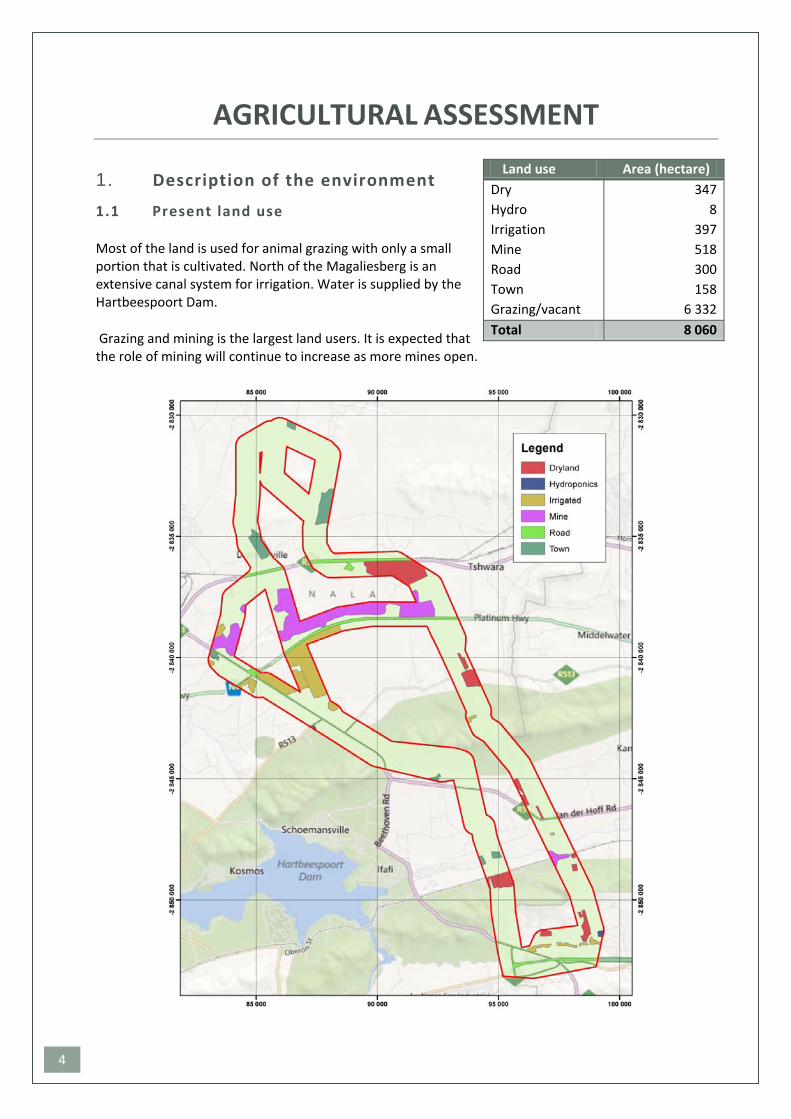
1.2.2 Geology
The geology is as follows:
1.2.3 Geomorphology
The site straddles the boundary between the Highveld and Bushveld Geomorphic Provinces (King 1963). The southern portion consists of rocky ridges with evenly slopes towards the main water courses. The central portion is mountainous with steep slopes towards the north and south. North of the Magaliesberg is the plains of the Bushveld Igneous Complex.

7
1.2.4 Water
1.2.4.1 Groundwater
The aquifers in the study are not large water stores and are normally not used for irrigation purposes, but are only used for household consumption and animal watering.
Groundwater quality
The total dissolved solids (TDS) of the wells closest to the site have TDS values between 190 and 259 mg/kg. The level where crops and animals start being influenced is at 1 200 and 4 000 mg/l respectively.
The TDS of boreholes in the area is low and at these levels are not expected to be harmful to animals or crops. Below is the analysis of two holes closest to the site.
Lat/Lon: 25.67194° S, 27.98778° E EC=24.1 pH=7.6 Ca=17 Mg=13 Na=8 TAL=108 SO4=4 Cl=5 NOX=1.35 F=0.1 TDS=190
Lat/Lon: 25.7925° S, 28.00556° E EC=31.8 pH=7.3 Ca=37 Mg=18 Na=1 TAL=154 SO4=12 Cl=1 NOX=0.00 F=0.3 TDS=259
1.2.4.2 Surface water
A number of small tributaries of the Swartspruit and Monganwe traverse the southern portion of the site. Some of this water is used for irrigation. The catchments are small and water is mainly from rainstorms in the summer months. The watercourses in the northern part are dry and only flows during storms.
1.2.5 Vegetation
According to Acocks the following vegetation types are found:
• Bankenveld • Sourish Mixed Bushveld • Sour Bushveld • Turf Thornveld
Most of the northern part was formerly cultivated.

8
1.2.6 Soil
The soil map indicates the dominant soils found according to ENPAT for North West Province. It is a broad description that only suitable for general analysis. It nevertheless indicates patterns.
The following is found:
1) Red – yellow apedal soils and Plinthic Catena eutrophic soils a. The area just north and south of the Magaliesberg consists of predominantly deep
reddish Hutton and Shortlands soil forms.

9
b. The clay content varies greatly depending on the geology and topography. Stones and loose rock are common.
c. Some land is serviced with irrigation by the canal from the Hartbeespoort and is considered as high potential land.
2) Rocky areas a. Predominantly the Magaliesberg and rocky ridges b. Mispah, Glenrosa and rock outcrops dominate
3) Vertic, melanic and red structured soil a. These soils occur on most of the northern portion of the site b. The dominant soils are Arcadia, Rensburg and Shortlands. c. The canal supplies water to portions of this group, but it seems that much has been
withdrawn for mining d. Although some of the vertic soils have been irrigated in the past, the deteriorating
water quality from Hartbeespoort is becoming problematic 4) Plinthic Catena dystrophic soils
a. Consists mostly of Hutton soils, often rocky and difficult to cultivate b. They are normally dryland and with a low arable potential. Where that are irrigated,
they are considered as moderate to high potential
1.3 Agricultural potential
1.3.1 Soil qual ity
The National Department of Agriculture has identified the following soil forms and criteria for high potential agricultural land within Gauteng:
Agricultural land is considered to be of high potential if it may be cultivated in terms of Part 1 of the regulations of Conservation of Agricultural Resources Act 43 of 1983, and is-
• under permanent irrigation, or • can be classified into one of the soil forms listed in the table below, and • the effective soil depth is equal to or greater than the minimum as stated in the table
below, and • the average topsoil clay content falls within the limits as stated in the table below.
TABLE 2 SOIL CLASSIFICATION OF HIGH POTENTIAL AGRICULTURAL (NDA) Qualifying soil forms Minimum effective
soil depth Topsoil clay content
Avalon, Bainsvlei, Bloemdal, Clovelly, Glencoe, Hutton, Oakleaf, Pinedene, Shortlands, Tukulu
900 mm 10 – 35%
Unfortunately the scale of data available will only allow for broad classification.
The map below, is based on ENPAT:

10
1.3.2 Grazing potential
According to the database of the Department of Agriculture the carrying capacity for natural veld is 7 ha per large stock unit (LSU) for the land north of the Magaliesberg, 5 for the portion just south and 10 for the mountain itself.
2. Impact Assessment
The impacts are based on information gained within the framework of the Terms of Reference, it will describe general impacts.

11
2.1 Impact assessment methodology
Loss of agricultural land and the income that can be derived from farming are the main impacts. As far as the agricultural land potential is concerned, there are two components,
1) if the land is under irrigation, then the potential is considered as high. This implies a water use licence is in place and that the land has irrigation infrastructure installed. Due to the poor rainfall distribution,
2) Rainfed farming land is not considered as high potential, regardless of the soil depth because of the unreliable rainfall pattern.
As first criteria, therefore, loss of irrigated land should be minimised. The second deals with the loss of income from farming, where grazing is also assessed. It should be taken into consideration that the transmission line may fragment farms that will impact on management. It is further accepted that land under the lines can be used as grazing and that only the footprint of the pylon will be lost.
The routes are indicated in the following map:

12
Within this framework, the following conclusions can be made:
2.2 Impact description
2.2.1 Land use per al ignment
TABLE 3. LAND USE PER ALIGNMENT Route Dryland Irrigated Hydro Grazing A 59 137 0 6 136 B 59 247 0 6 026 C 106 65 5 6 156 D 282 14 5 6 031 E 282 14 5 6 031
Routes A, B and to a lesser degree C will be lose high potential land according to the guidelines of the Department of Agriculture.
2.2.2 Impact description
The description of the economic impact on the development is as follows:
TABLE 4. DESCRIPTION OF IMPACTS Criteria Irrigated crops Grazing
Nature Existing crops will be destroyed during construction. Afterwards they can be replanted. The footprint of the pylon will permanently be sterilised. Routes A, B and C will be influenced, with B the most severely. D and E have little irrigated land.
Access to grazing will be impossible during construction. Only the footprint of the site will permanently be sterilised
Extent The land in the servitude will be impacted on. Routes A, B and to a lesser degree C will be lose high potential land.
All routes will be impacted on to a small degree. Only the footprint will be sterilised.
Duration Total withdrawal during construction. Permanent for the footprint of the pylon. The irrigation type may need to change.
Total withdrawal during the construction period. Permanent for the footprint of the pylon.
Intensity Destructive during construction. Benign after construction period. Probability Very likely to occur. Very likely to occur. Status Negative. Negative. Significance Moderate impact because a small portion of
land is influenced. The loss on income cannot be calculated from the available data.
Low. The land us withdrawn for the construction period.
2.3 Impact on Labour
During construction it can be expected that most or all the crops in the position where the transmission lines are erected, will be damaged or destroyed. After construction, however, the land will recover and can then again be gainfully used. It is assumed that Eskom will grant the farmers concessions that the land can be used.
Farm labour will therefore temporarily be reduced.
13
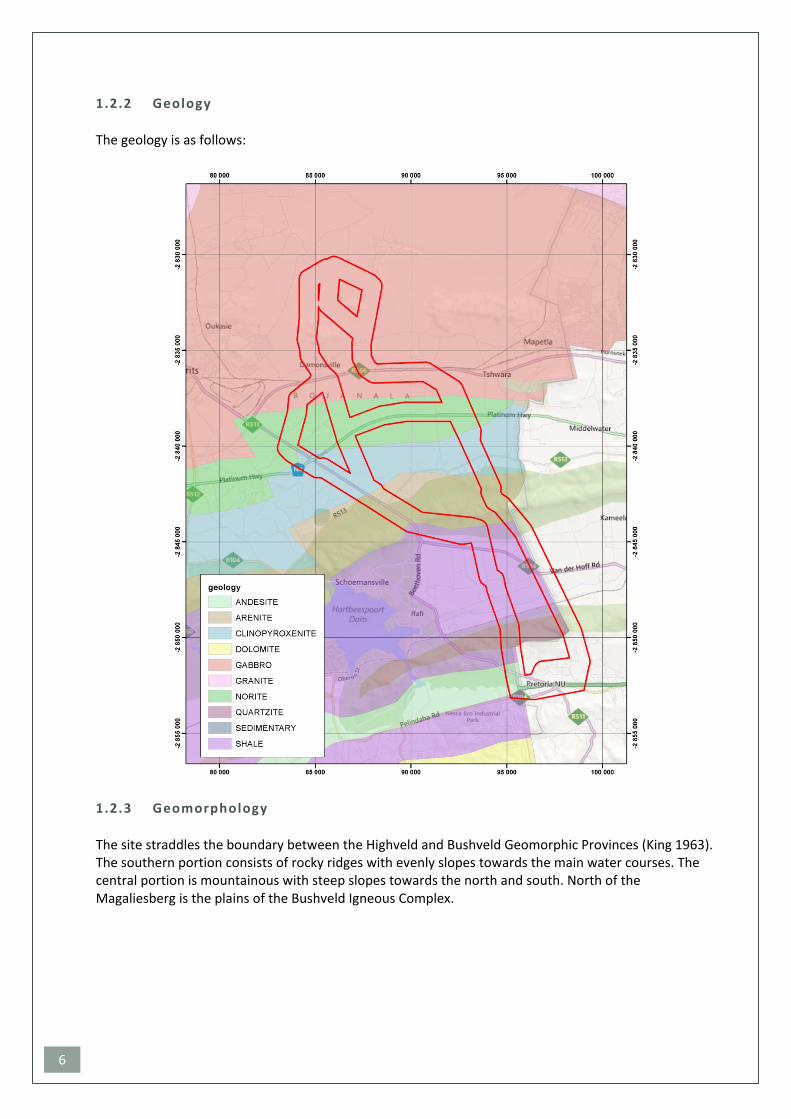
2.4 Impact rating
Loss of irrigated land:
The impact on loss if irrigated land is difficult if not impossible to mitigate. The impact therefore is high. The extern is high on Routes A and B and moderate on C. It is low in D and E
Loss of grazing land:
All routes will be influenced equally. The impact is low.
Summary of impacts and preferred route
Routes D or E are preferred because of the lower impact that it will have on farming. It will lead to the lowest loss of high potential land (as per definition of Department of Agriculture) and of income (as indicated by available information). The summary of route preference is as follows:
TABLE 5. ROUTE ALIGNMENT PREFERENCE Route Alignment Route preference Route Alignment A 4 Route Alignment B 3 Route Alignment C 2 Route Alignment D 1 Route Alignment E 1
2.5 Mitigation
The impact on farming land is temporary in the case of grazing, but is more damaging in the case of irrigated agriculture.
As discussed, for irrigated crops, pivot irrigation may change in favour of less desirable movable pipes and can be costly. If the pylons, however, are placed next to the lands or on road reserves, then the impact will be very small.
Construction brings with it security problems – this can be mitigated against. One must keep in mind that the theft and vandalism associated with construction is often perpetrated by people not related to the project.
Crop yield is impacted on by dust, which is normally associated with vehicle movement.
Mitigation measures proposed are as follows:
1) Keep the footprint during construction as small as possible; 2) Maintain security of the sites by appointing guards and providing support to the local farmers; 3) Spray water on roads to reduce dust, especially during harvest time.

14
2.6 Recommendations or route alignment
There is little choice between Route D and E from an agricultural land use perspective. More detailed assessment is required to quantify the loss.
It is recommended that Route E be considered as the preferred alignment.
3. Conclusions & findings
The conclusions and findings in this study are based on available data and the author’s knowledge of the site. It provides general information rather than detail.
3.1 Anderson - Dinaledi Transmission Line
The central western portion of the study area, just north of the Magaliesberg consists of deep, reddish and vertic soils that is high potential if they can be irrigated. The climate is not conducive to rainfed cropping because the rainfall is too unreliable.
The balance of the land is either too shallow or rocky to cultivate and only suitable as grazing.
Much of the land on the Rustenburg Layered Suite has been withdrawn from farming and is now mined.
Approximately 400 hectares is under irrigation, of which 350 is from the Hartbeespoort Dam. All the irrigated land is within the western power line alignment.
According to the guidelines of NDA all irrigated land is considered as high potential land.
3.2 New Anderson Substation
The substation is located directly north of the N4 highway. It is 9,6 hectares. The north-eastern portion is underlain by andesite, the topography is uneven. The rest of the site is underlain by quartzite, which normally weathers into shallow rocky soils. Both of these are not ideal for cultivation. The rainfall is highly variable with the result that rainfed commercial irrigation is not recommended.

15
Although the portion directly north of the river is irrigated, it seems that none on the southern parts are. It would, therefore, be improbable that there is an irrigation licence issued for the site.
From the data available, the conclusion it that the land is only suitable for livestock grazing and that the size of only 9,6 hectares. It is too small to make a meaningful difference in the income potential of the farm. Assuming that the carrying capacity is 5 hectares per LSU, the land that will be lost would only be sufficient for less than 2 livestock. As a Gross margin of around R4200 per LSU per year, the loss in annual income if the site is developed is around R8 000.
4. References Department of Water Affairs and Forestry, 2005. A practical field procedure for identification and delineation of wetland and riparian areas. DWAF, Pretoria.
Mucina, L. & Rutherford, M. C. (Eds) 2006. The vegetation of South Africa, Lesotho and Swaziland.
Gauteng Agricultural Potential Atlas (GAPA). DACE.
Groundwater database of the Department of Water Affairs.
16
Weather Bureau, Department of Transport.
Grazing capacity estimations. Department of Agriculture.
Internal report: Guidelines for the evaluation of land use potential. Index, 1998.