Embed Size (px)
Citation preview

SURVEY AND LOGISTICS REPORT ON A HELICOPTER BORNE VERSATILE TIME DOMAIN
ELECTROMAGNETIC (VTEM) SURVEY
on the
WILMOT, WARATAH, LOYETEA & HEAZLEWOOD AREAS
TASMANIA
for
BASS METALS LTD
by
GEOTECH AIRBORNE LIMITED Unit 1 / 29 Mulgul Road MALAGA 6090 Western Australia Tel: +61 (0)8 9249 8814 Fax: +61 (0)8 9249 8894 www.geotechairborne.com.au e-mail: [email protected]
Project A280 August, 2008

Report on Airborne Geophysical Survey for BASS METALS LTD. 2
TABLE OF CONTENTS
1. SURVEY SPECIFICATIONS .................................................................................. 3 1.1. General ............................................................................................................ 3 1.2. VTEM flight plan on Google EARTH
TM Background ....................................... 3
1.3. Survey block coordinates. ............................................................................... 4 1.4. Survey block specifications ............................................................................. 5 1.5. Survey schedule .............................................................................................. 5
2. SYSTEM SPECIFICATIONS .................................................................................. 6 2.1. Instrumentation ................................................................................................ 6 2.2. VTEM Configuration ........................................................................................ 7 2.3. VTEM decay sampling scheme ....................................................................... 7 2.4. VTEM Transmitter Waveform over one half-period ......................................... 8
3. PROCESSING ........................................................................................................ 9 3.1. Processing parameters .................................................................................... 9 3.2. Flight Path........................................................................................................ 9 3.3. Electromagnetic Data ...................................................................................... 9 3.4. Magnetic Data ................................................................................................. 9 3.5. Digital Terrain Model ..................................................................................... 10
4. DELIVERABLES ................................................................................................... 11 5. PERSONNEL ........................................................................................................ 13
APPENDICES
A. Modeling VTEM data ………………………….………………………….……14 B. Geophysical Maps ……………………………………………….…………….20

Report on Airborne Geophysical Survey for BASS METALS LTD. 3
SURVEY AND LOGISTICS REPORT ON A HELICOPTER-BORNE VTEM SURVEY
1. SURVEY SPECIFICATIONS
1.1. General
Job Number A280 Client BASS METALS LTD Project Areas Wilmot, Waratah, Loyetea & Heazlewood Location Tasmania, Australia
Number of Blocks 4 Total line kilometres 1160 Survey date 13 March to 6 April, 2008
Client Representative Travis Murphy Tel: +61 3 6439 1464, Fax: +61 3 6439 1465
Client address Hellyer Exploration Base. PO Box 1467, Burnie, Tasmania, 7320, Australia
Client Consultant (if applicable)
Dr Jovan Silic, Flagstaff GeoConsultants (JSA Pty Ltd) Tel: +61 3 9867 8931, Fax: +61 3 8420 6299 [email protected]
1.2. VTEM flight plan on Google EARTHTM
Background

Report on Airborne Geophysical Survey for BASS METALS LTD. 4
1.3. Survey blocks coordinates.
Easting UTM Z 55S Northing UTM Z 55S
BLOCK Heazlewood
360871.4 5414933
363611.4 5414933
363611.4 5410183
361111.4 5410183
361111.4 5408183
357111.4 5408183
357111.4 5406183
355061.4 5406183
355061.4 5410583
360871.4 5414933
Easting UTM Z 55S Northing UTM Z 55S BLOCK Loyetea
415111.7 5435183
420111.7 5435183
420111.7 5430183
414111.7 5430183
414111.7 5424183
412111.7 5424183
412111.7 5418183
406111.7 5418183
406111.7 5421773
410861.7 5427683
410886.7 5432183
415111.7 5432183
415111.7 5435183
Easting UTM Z 55S Northing UTM Z 55S
BLOCK Wilmot
415111.7 5414183
425111.8 5414183
425111.8 5410183
418111.7 5410183
418111.7 5409183
414111.7 5409183
414111.7 5410183
410111.7 5410183
410111.7 5413183
415111.7 5413183
415111.7 5414183
Easting UTM Z 55S Northing UTM Z 55S BLOCK Waratah
370111.4 5412103
374726.5 5414698
381111.5 5416058

Report on Airborne Geophysical Survey for BASS METALS LTD. 5
381111.5 5411763
377611.5 5411763
377611.5 5413183
375111.5 5413183
375111.5 5410183
370111.4 5410183
370111.4 5412103
1.4. Survey blocks specifications
Survey block
Line spacing (m)
Line-km (delivered)
Flight direction Line number
Heazlewood 200 221.1 090° - 270° L10010 - L10440
Loyetea 200 470.8 090° - 270° L20010 – L20850 L50010 – L50050
Wilmot 200 295 090° - 270° L30010 – L30250
Waratah 200 173.6 000° - 180° L40010 – L40550
1.5. Survey schedule
Date Flight #
Block Nominal
Production Km flown
Comments
12-Mar-08 Ferry Mobilisation
13-Nov-08 Recon,1,2,3 Waratah 173.6 Production
14-Mar-08 Test Bad weather
15-Mar-08 Recon Waratah Pilot change-over
16-Mar-08 4,5,6,7,8 Heazlewood,
Loyetea 317.1 Production
18-Mar-08 9 Loyetea 12 Production
22-Mar-08 10,11,12,13 Loyetea 187.7 Production
23-Mar-08 14,15,16 Loyetea, Wilmot
175 Production
24-Mar-08 Bad weather
25-Mar-08 Bad weather
27-Mar-08 17 Loyetea / Wilmot
12 Production
28-Mar-08 18,19 Wilmot 128 Production
29-Mar-08 Maintenance
30-Mar-08 Ferry Maintenance
31-Mar-08 Bad weather
1-Mar-08 Bad weather
2-Mar-08 Bad weather
3-Mar-08 Bad weather
4-Mar-08 Bad weather
5-Mar-08 Bad weather
6-Mar-08 20 Loyetea 15 Production – in-fills

Report on Airborne Geophysical Survey for BASS METALS LTD. 6
2. SYSTEM SPECIFICATIONS
2.1. Instrumentation
Survey Helicopter
Model AS 350 B3 Registration VH-IPW Operating Company United Aero Helicopters Nominal survey speed 80 km/h Nominal terrain clearance 80 m
VTEM Transmitter
Coil diameter 26 m Number of turns 4 Pulse repetition rate 25 Hz Peak current 200 Amp Duty cycle 36.8% Peak dipole moment 424,528 NIA Pulse width 7.36 ms Nominal terrain clearance 34 m
VTEM Receiver
Coil diameter 1.2 metre Number of turns 100 Effective area 113.1 m
2
Sampling interval 0.1 s
Nominal terrain clearance 34 m
Magnetometer Type Geometrics Model Optically pumped cesium vapour
Sensitivity 0.02 nT Sampling interval 0.1 s
Cable length 13 m Nominal terrain clearance 68 m
Radar Altimeter Type Terra TRA 3000/TRI 40
Position Beneath cockpit Sampling interval 0.2 s
GPS navigation system
Type NovAtel
Model WAAS enabled OEM4-G2-3151W Antenna position Helicopter tail
Sampling interval 0.2 s
Base Station Magnetometer/GPS
Type Geometrics Model Cesium vapour
Sensitivity 0.001 nT Sampling interval 1 s

Report on Airborne Geophysical Survey for BASS METALS LTD. 7
2.2. VTEM Configuration
2.3. VTEM decay sampling scheme
VTEM B-field System Decay Sampling scheme
Array Microseconds
Index Middle Start End Width
9 99 91 110 19
10 120 110 131 21
11 141 131 154 24
12 167 154 183 29
13 198 183 216 34
14 234 216 258 42
15 281 258 310 53
16 339 310 373 63
17 406 373 445 73
18 484 445 529 84
19 573 529 628 99
20 682 628 750 123
21 818 750 896 146
22 974 896 1063 167
23 1151 1063 1261 198
24 1370 1261 1506 245
25 1641 1506 1797 292
26 1953 1797 2130 333
27 2307 2130 2526 396
28 2745 2526 3016 490
29 3286 3016 3599 583
30 3911 3599 4266 667
31 4620 4266 5058 792
32 5495 5058 6037 979
33 6578 6037 7203 1167
34 7828 7203 8537 1334
35 9245 8537 10120 1584
Configuration
Cable angle with vertical 23 ˚ Cable length (EM receiver) 42 m Cable length (Magnetometer) 12 m

Report on Airborne Geophysical Survey for BASS METALS LTD. 8
2.4. VTEM Transmitter Waveform over one half-period

Report on Airborne Geophysical Survey for BASS METALS LTD. 9
3. PROCESSING
3.1. Processing parameters
Coordinates Projection MGA Zone 55 Datum GDA 94 Spheroid GDA 94
Spherics rejection (EM and Magnetic data)
Non-linear filter 4 point Non-linear filter sensitivity 0.0001 Low-pass filter wavelength 15 m
Lag correction of other sensors to GPS position
EM receiver 20 m Magnetometer 1 m
3.2. Flight Path The flight path, recorded by the acquisition program as WGS 84 latitude/longitude, was converted into the MGA coordinate system in Oasis Montaj. The flight path was drawn using linear interpolation between x,y positions from the navigation system. Positions are updated every second and expressed as MGA eastings (x) and MGA northings (y). 3.3. Electromagnetic Data A three stage digital filtering process was used to reject major sferic events and to reduce system noise. Local sferic activity can produce sharp, large amplitude events that cannot be removed by conventional filtering procedures. Smoothing or stacking will reduce their amplitude but leave a broader residual response that can be confused with geological phenomena. To avoid this possibility, a computer algorithm searches out and rejects the major sferic events. The signal to noise ratio was further improved by the application of a low pass linear digital filter. This filter has zero phase shift which prevents any lag or peak displacement from occurring, and it suppresses only variations with a wavelength less than the specified filter wavelength. 3.4. Magnetic Data The processing of the magnetic data involved the correction for diurnal variations by using the digitally recorded ground base station magnetic values. The base station magnetometer data was edited and merged into the Geosoft GDB database on a daily basis. The aeromagnetic data was corrected for diurnal variations by subtracting the observed magnetic base station deviations. A micro-levelling procedure was applied to the data to remove persistent low-amplitude components of flight-line noise. The corrected magnetic data was interpolated between survey lines using a random point gridding method to yield x-y grid values for a standard grid cell size of a quarter of the line spacing. The Minimum Curvature algorithm was used to interpolate values onto a rectangular regular spaced grid.

Report on Airborne Geophysical Survey for BASS METALS LTD. 10
3.5. Digital Elevation Model Subtracting the radar altimeter data from the GPS elevation data creates a digital elevation model. To correct for minor elevation differences that are evident in this data when gridded, Shuttle Radar Topography Mission (SRTM) data have been used.
Micro levelling techniques were also used to level the DEM data.

Report on Airborne Geophysical Survey for BASS METALS LTD. 11
4. DELIVERABLES
VTEM Survey and logistics report Format PDF
Copies 2 x Digital (DVD/CD) 2 x Hard copy
Database Format Digital Geosoft (.GDB) Channels
Name Description
X X positional data
Y Y positional data
Lon Longitude data
Lat Latitude data
Z GPS antenna elevation (metres above sea level)
Radar Helicopter terrain clearance from radar altimeter (metres above ground level)
Radarb EM Receiver and Transmitter terrain clearance (metres above ground level)
DEM Digital elevation model (metres)
Gtime UTC time (seconds of the day)
Mag1 Raw Total Magnetic field data (nT)
Basemag Magnetic diurnal variation data (nT)
Mag2 Total Magnetic field diurnal variation and lag corrected data (nT)
Mag3 Levelled Total Magnetic field data (nT)
Sf[9] to Sf[35] dB/dt, Time Gates 99 µs to 9245 µs (pV/A/m
4)
Bf[9] to Bf[35] B-field, Time Gates 99 µs to 9245 µs (pV.ms/A/m
4)
PLM Power line monitor
Grids Format Digital Geosoft (.GRD and .GI)
1
Grids
Name Description
A280_[Blk]_Mag3 Total Magnetic field (nT)
A280_[Blk]_DEM Digital Elevation Model (m)
Maps Format Digital Geosoft (.MAP and .GM)
2
Scale 1:25 000
Maps
Name Description
A280_blk _Mag3 Total Magnetic field colour
A280_blk_DEM Digital Elevation Model colour
A280_blk_FP Flight Path
A280_blk_EMLog_SF
VTEM dB/dt profiles, Time Gates 0.099 – 9.245 ms in linear - logarithmic scale
A280_blk_EMLog_BF (Heazlewood Block only)
VTEM B-field profiles, Time Gates 0.099 – 9.245 ms in linear - logarithmic scale
1
A Geosoft .GRD file has a .GI metadata file associated with it, containing grid projection information. 2
A Geosoft .MAP file has a .GM metadata file associated with it, containing projection information.
Report on Airborne Geophysical Survey for BASS METALS LTD. 12
Waveform
Format Digital Excel Spreadsheet (VTEM_Waveform.xls)
Columns
Name Description
Time Sampling rate interval, 10.416 µs
Volt Output voltage of the receiver coil (volt)
Current Transmitter current (normalised to 1A peak)
Google Earth Flight Path file Format Google Earth A280_[Blk]_Google_KML.kml
Free version of Google Earth software can be downloaded from, http://earth.google.com/download-earth.html

Report on Airborne Geophysical Survey for BASS METALS LTD. 13
5. PERSONNEL
Geotech Airborne Limited Personnel Operator / Crew chief Dae Cho, Jason Callaghan
Technical Support Stephen Carter, Andrew Carpenter, David Woodbridge
Data Processing (Preliminary) Simon Bailey, Stephen Carter Data Processing (Final) /Reporting Simon Bailey
Final data supervision Stephen Carter Data Processing Manager ([email protected])
Overall project management Keith Fisk Managing Partner and Director ([email protected])

Report on Airborne Geophysical Survey for BASS METALS LTD. 14
APPENDIX A
GENERALIZED MODELING RESULTS OF THE VTEM SYSTEM (by Roger Barlow)
Introduction The VTEM system is based on a concentric or central loop design, whereby, the receiver is positioned at the centre of a 26.1 metres diameter transmitter loop that produces a dipole moment up to 625,000 NIA at peak current. The wave form is a bi-polar, modified square wave with a turn-on and turn-off at each end. With a base frequency of 25 Hz, the duration of each pulse is approximately 7.5 milliseconds followed by an off time where no primary field is present. During turn-on and turn-off, a time varying field is produced (dB/dt) and an electro-motive force (emf) is created as a finite impulse response. A current ring around the transmitter loop moves outward and downward as time progresses. When conductive rocks and mineralization are encountered, a secondary field is created by mutual induction and measured by the receiver at the centre of the transmitter loop. Measurements are made during the off-time, when only the secondary field (representing the conductive targets encountered in the ground) is present. Efficient modeling of the results can be carried out on regularly shaped geometries, thus yielding close approximations to the parameters of the measured targets. The following is a description of a series of common models made for the purpose of promoting a general understanding of the measured results. Variation of Plate Depth Geometries represented by plates of different strike length, depth extent, dip, plunge and depth below surface can be varied with characteristic parametres like conductance of the target, conductance of the host and conductivity/thickness and thickness of the overburden layer. Diagrammatic models for a vertical plate are shown in figures A and G at two different depths, all other parametres remaining constant. With this transmitter-receiver geometry, the classic M shaped response is generated. Figure A shows a plate where the top is near surface. Here, amplitudes of the duel peaks are higher and symmetrical with the zero centre positioned directly above the plate. Most important is the separation distance of the peaks. This distance is small when the plate is near surface and widens with a linear relationship as the plate (depth to top) increases. Figure G shows a much deeper plate where the separation distance of the peaks is much wider and the amplitudes of the channels have decreased. Variation of Plate Dip As the plate dips and departs from the vertical position, the peaks become asymmetrical. Figure B shows a near surface plate dipping 80º. Note that the direction of dip is toward the high shoulder of the response and the top of the plate remains under the centre minimum. As the dip increases, the aspect ratio (Min/Max) decreases and this aspect ratio can be used as an empirical guide to dip angles from near 90º to about 30º. The method is not sensitive enough where dips are less than about 30º. Figure E shows a plate dipping 45º and, at this angle, the minimum shoulder starts to vanish. In Figure D, a

Report on Airborne Geophysical Survey for BASS METALS LTD. 15
flat lying plate is shown, relatively near surface. Note that the twin peak anomaly has been replaced by a symmetrical shape with large, bell shaped, channel amplitudes which decay relative to the conductance of the plate. Figure H shows a special case where two plates are positioned to represent a synclinal structure. Note that the main characteristic to remember is the centre amplitudes are higher (approximately double) compared to the high shoulder of a single plate. This model is very representative of tightly folded formations where the conductors where once flat lying. Variation of Prism Depth Finally, with prism models, another algorithm is required to represent current on the plate. A plate model is considered to be infinitely thin with respect to thickness and incapable of representing the current in the thickness dimension. A prism model is constructed to deal with this problem, thereby, representing the thickness of the body more accurately. Figures C, F and I show the same prism at increasing depths. Aside from an expected decrease in amplitude, the side lobes of the anomaly show a widening with deeper prism depths of the bell shaped early time channels.

Report on Airborne Geophysical Survey for BASS METALS LTD. 16
A B C
D E F
G H I

Report on Airborne Geophysical Survey for BASS METALS LTD. 17
General Modeling Concepts A set of models has been produced for the Geotech VTEM
® system with explanation
notes (see models A to I above). The reader is encouraged to review these models, so as to get a general understanding of the responses as they apply to survey results. While these models do not begin to cover all possibilities, they give a general perspective on the simple and most commonly encountered anomalies. When producing these models, a few key points were observed and are worth noting as follows: ● For near vertical and vertical plate models, the top of the conductor is always
located directly under the centre low point between the two shoulders in the classic M shaped response.
● As the plate is positioned at an increasing depth to the top, the shoulders of the M shaped response, have a greater separation distance.
● When faced with choosing between a flat lying plate and a prism model to represent the target (broad response) some ambiguity is present and caution should be exercised.
● With the concentric loop system and Z-component receiver coil, virtually all types of conductors and most geometries are most always well coupled and a response is generated (see model H). Only concentric loop systems can map this type of target.
The modelling program used to generate the responses was prepared by PetRos Eikon Inc. and is one of a very few that can model a wide range of targets in a conductive half space. General Interpretation Principals Magnetics The total magnetic intensity responses reflect major changes in the magnetite and/or other magnetic minerals content in the underlying rocks and unconsolidated overburden. Precambrian rocks have often been subjected to intense heat and pressure during structural and metamorphic events in their history. Original signatures imprinted on these rocks at the time of formation have, it most cases, been modified, resulting in low magnetic susceptibility values. The amplitude of magnetic anomalies, relative to the regional background, helps to assist in identifying specific magnetic and non-magnetic rock units (and conductors) related to, for example, mafic flows, mafic to ultramafic intrusives, felsic intrusives, felsic volcanics and/or sediments etc. Obviously, several geological sources can produce the same magnetic response. These ambiguities can be reduced considerably if basic geological information on the area is available to the geophysical interpreter.

Report on Airborne Geophysical Survey for BASS METALS LTD. 18
In addition to simple amplitude variations, the shape of the response expressed in the wave length and the symmetry or asymmetry, is used to estimate the depth, geometric parameters and magnetization of the anomaly. For example, long narrow magnetic linears usually reflect mafic flows or intrusive dyke features. Large areas with complex magnetic patterns may be produced by intrusive bodies with significant magnetization, flat lying magnetic sills or sedimentary iron formation. Local isolated circular magnetic patterns often represent plug-like igneous intrusives such as kimberlites, pegmatites or volcanic vent areas. Because the total magnetic intensity (TMI) responses may represent two or more closely spaced bodies within a response, the second derivative of the TMI response may be helpful for distinguishing these complexities. The second derivative is most useful in mapping near surface linears and other subtle magnetic structures that are partially masked by nearby higher amplitude magnetic features. The broad zones of higher magnetic amplitude, however, are severely attenuated in the vertical derivative results. These higher amplitude zones reflect rock units having strong magnetic susceptibility signatures. For this reason, both the TMI and the second derivative maps should be evaluated together. Theoretically, the second derivative, zero contour or colour delineates the contacts or limits of large sources with near vertical dip and shallow depth to the top. The vertical gradient map also aids in determining contact zones between rocks with a susceptibility contrast, however, different, more complicated rules of thumb apply. Concentric Loop EM Systems Concentric systems with horizontal transmitter and receiver antennae produce much larger responses for flat lying conductors as contrasted with vertical plate-like conductors. The amount of current developing on the flat upper surface of targets having a substantial area in this dimension, are the direct result of the effective coupling angle, between the primary magnetic field and the flat surface area. One therefore, must not compare the amplitude/conductance of responses generated from flat lying bodies with those derived from near vertical plates; their ratios will be quite different for similar conductances. Determining dip angle is very accurate for plates with dip angles greater than 30º. For angles less than 30º to 0º, the sensitivity is low and dips can not be distinguished accurately in the presence of normal survey noise levels. A plate like body that has near vertical position will display a two shoulder, classic M shaped response with a distinctive separation distance between peaks for a given depth to top. It is sometimes difficult to distinguish between responses associated with the edge effects of flat lying conductors and poorly conductive bedrock conductors. Poorly conductive bedrock conductors having low dip angles will also exhibit responses that may be interpreted as surfacial overburden conductors. In some situations, the conductive response has line to line continuity and some magnetic correlation providing possible evidence that the response is related to an actual bedrock source. The EM interpretation process used, places considerable emphasis on determining an understanding of the general conductive patterns in the area of interest. Each area has different characteristics and these can effectively guide the detailed process used.

Report on Airborne Geophysical Survey for BASS METALS LTD. 19
The first stage is to determine which time gates are most descriptive of the overall conductance patterns. Maps of the time gates that represent the range of responses can be very informative. Next, stacking the relevant channels as profiles on the flight path together with the second vertical derivative of the TMI is very helpful in revealing correlations between the EM and Magnetics. Next, key lines can be profiled as single lines to emphasize specific characteristics of a conductor or the relationship of one conductor to another on the same line. Resistivity Depth sections can be constructed to show the relationship of conductive overburden or conductive bedrock with the conductive anomaly.

Report on Airborne Geophysical Survey for BASS METALS LTD. 20
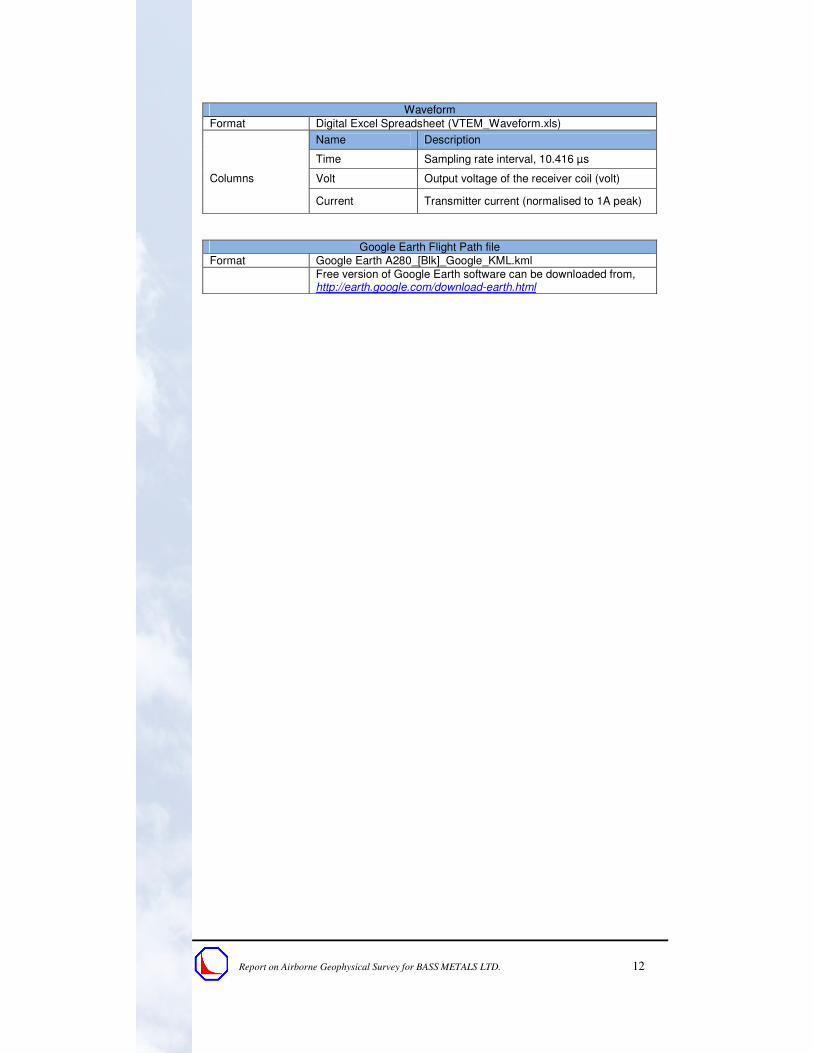
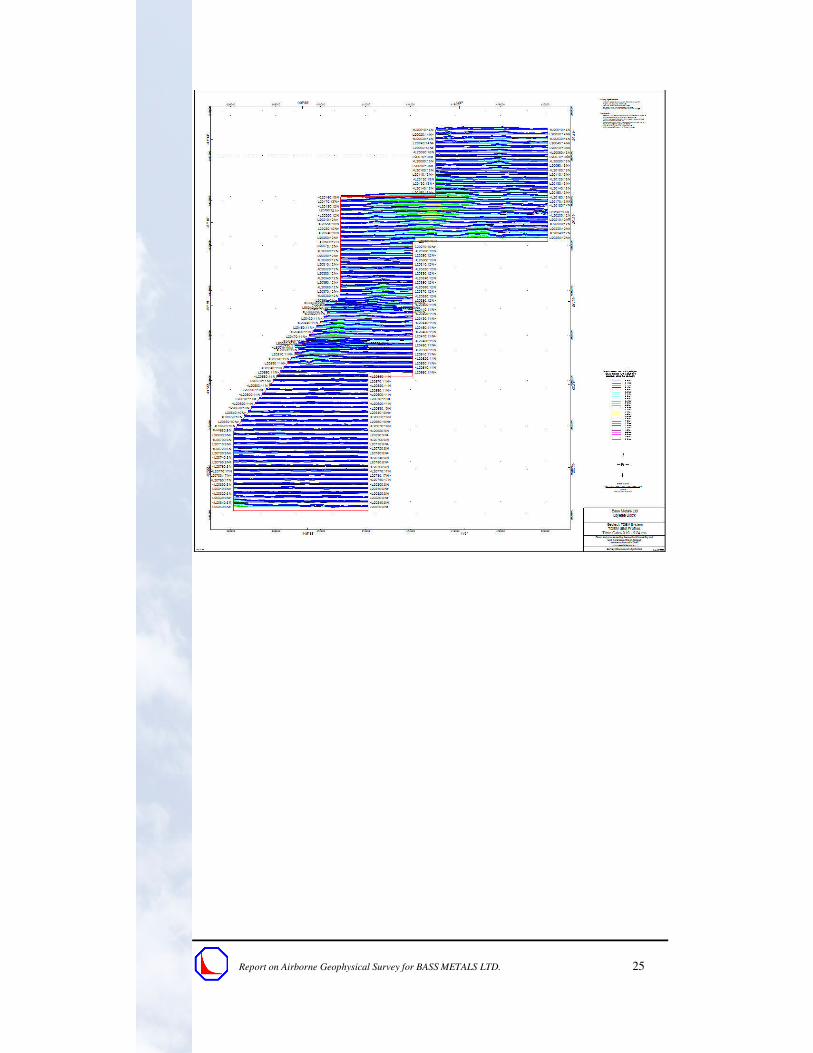
APPENDIX B
GEOPHYSICAL MAP IMAGES (not to scale)

Report on Airborne Geophysical Survey for BASS METALS LTD. 21

Report on Airborne Geophysical Survey for BASS METALS LTD. 22

Report on Airborne Geophysical Survey for BASS METALS LTD. 23

Report on Airborne Geophysical Survey for BASS METALS LTD. 24
Report on Airborne Geophysical Survey for BASS METALS LTD. 25

Report on Airborne Geophysical Survey for BASS METALS LTD. 26

Report on Airborne Geophysical Survey for BASS METALS LTD. 27

Report on Airborne Geophysical Survey for BASS METALS LTD. 28

Report on Airborne Geophysical Survey for BASS METALS LTD. 29
Report on Airborne Geophysical Survey for BASS METALS LTD. 30

Report on Airborne Geophysical Survey for BASS METALS LTD. 31

Report on Airborne Geophysical Survey for BASS METALS LTD. 32