Embed Size (px)
Citation preview
SURVEY CONCERNING THE USE OF
CHILD CARE FOR CHILDREN AGED BELOW 3 YEARS
AUTUMN 2002
Cynthia Bettens Bea Buysse
Kind en Gezin Hallepoortlaan 27 1060 Brussel +32.(0)2.533.14.11 Legal Deposit 2003/4112/3 May 2003
2
CONTENT
PREFACE 5 OVERVIEW OF THE TABLES 6 INTRODUCTION 9 1. Why a New Survey in 2002? 9 2. Method of Questioning 9 3. Target Group, Sample Size and Method of Drawing 10 4. Response 11 PART I. CHILDREN AGED BETWEEN 3 MONTHS AND 3 YEARS 12 A. USE OF CHILD-MINDING 12 1. To What Extent Do People Use Child-minding? 12
1.1. In the Flemish Region 12 1.2. According to the Province 13 1.3. According to the District 14 1.4. According to the Child’s Age 15 1.5. Preschool and Child-minding 17 1.6. According to the Intensity of Child-minding 18 1.7. Use of Child-minding per day per week 18
3
2. Which Facility is Responsible for Child-minding? 19
2.1. Regular Users of Child-minding Facilities 19 2.1.1. Types of Child-minding Used 19
2.1.1.1. Main Type of Child-minding 19 2.1.1.2. Second and Third Most Important Types of Child-minding 23
2.1.2. Use of the various Types of Child-minding: Geographical Differences 23 2.2. Limited Users of Child-minding Facilities 24
2.2.1. Types of Child-minding Used 24 B. CHILD-MINDING AND CHILDREN FROM A DISADVANTAGED FAMILY AND ETHNIC MINORITY FAMILIES 27 1. To What Extent Do People Use Child-minding Facilities? 27 2. Which Facility is Responsible for Child-minding? 28 C. USE OF ATYPICAL CHILD-MINDING 30 1. Definition of atypical Child-minding 30 2. Use of atypical Child-minding 30 3. Atypical Child-minding in Detail 31
3.1. According to the Child’s Age 31 3.2. According to the Province 31 3.3. According to the Child-minding Facility and the Child-minding Environment32
4. Studied Aspects of Atypical Child-minding 33
4.1. Duration of the Longest Day of Child-minding 33 4.2. Child-minding before 7 a.m. 35 4.3. Child-minding after 6 p.m. 37 4.4. Child-minding during Weekends 39 4.5. Child-minding at Night 39

4
D. PAID CHILD-MINDING? 41 1. Cost of Child-minding in a Family Environment 41 2. Cost of Child-minding outside a Family Environment 41 PART II. CHILDREN AGED BETWEEN 1 AND 3 MONTHS 42 1. To What Extent Do People Use Child-minding Facilities? 42 2. Which Facility is Responsible for Child-minding? 42 PART III. USE OF CHILD-MINDING IN CASE OF ILLNESS 44 1. Illness Situation: Occurrence of Illness in Children aged between 1 Month and 3 Years in the Flemish Region 44
1.1. According to the Child’s Age 44 1.2. According to the Type of Child-minding Most Commonly Used 46
2. Child-minding in Case of Illness 46
2.1. Changes in the Child-minding Situation 46 2.2. Nature of the Changes 50
CONCLUSION 53 QUESTIONNAIRE 56 ENCLOSURES 67
5
PREFACE In support of its policy, Kind en Gezin regularly conducts a survey concerning the use of Child-minding for children aged below 3 years. After a series of yearly surveys, from 1988 to 1991, the frequency of these surveys was reduced to one survey every two years. In 1999 the survey’s original content was replaced by a more large-scale questionnaire concerning the use of child-minding conducted by the Higher Institute for Labour. In the autumn of 2001, the ‘original’ questionnaire was reintroduced. In order to be able to monitor the evolutions in the use of child-minding, Kind en Gezin decided to conduct a new survey in the autumn of 2002. This current report presents the results of the 2002 survey and compares them with the results of the 2001 survey. This report provides an answer to the following questions: How many parents make use of child-minding? How often and how many hours per week? Which type of child-minding is used (informal or formal, private or subsidized child-minding facilities)? What happens when a child suddenly becomes ill? What about child-minding at so-called difficult hours? If you want to learn more about child care in Flanders, please consult the annual reports of Kind en Gezin, the annual reports concerning child care or the Kind en Gezin website (http://www.kindengezin.be).
6
OVERVIEW OF THE TABLES
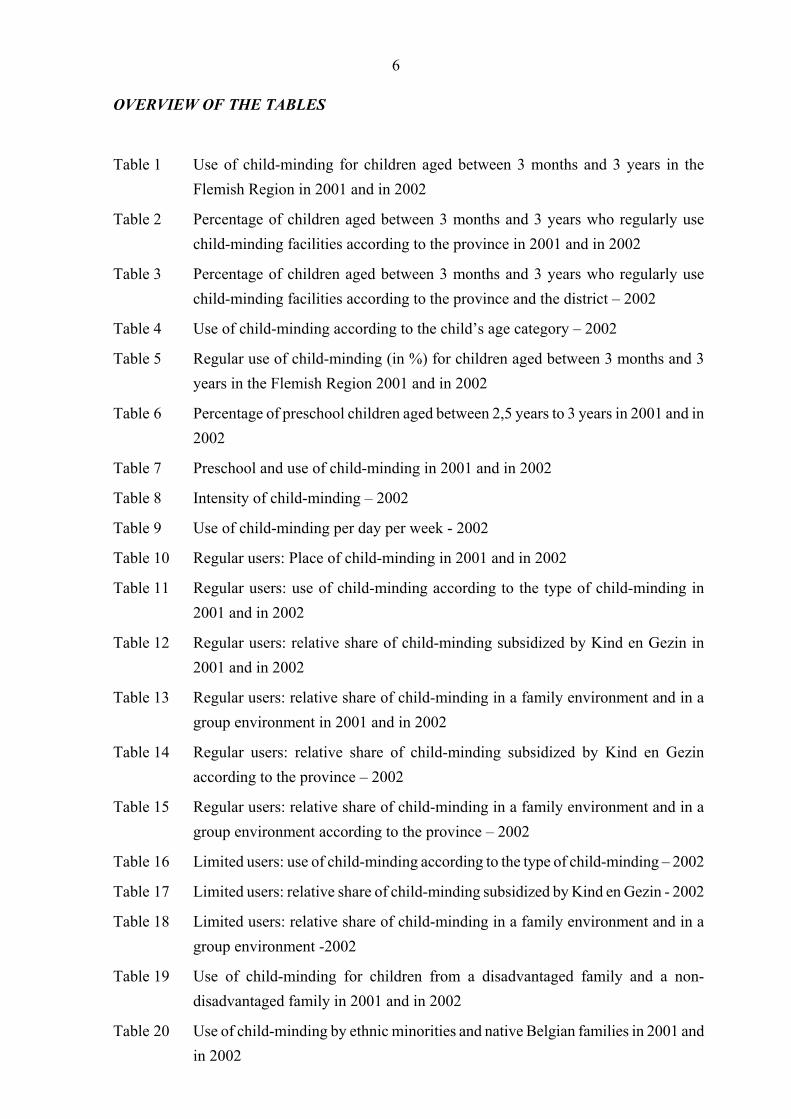
Table 1 Use of child-minding for children aged between 3 months and 3 years in the Flemish Region in 2001 and in 2002
Table 2 Percentage of children aged between 3 months and 3 years who regularly use child-minding facilities according to the province in 2001 and in 2002
Table 3 Percentage of children aged between 3 months and 3 years who regularly use child-minding facilities according to the province and the district – 2002
Table 4 Use of child-minding according to the child’s age category – 2002
Table 5 Regular use of child-minding (in %) for children aged between 3 months and 3 years in the Flemish Region 2001 and in 2002
Table 6 Percentage of preschool children aged between 2,5 years to 3 years in 2001 and in 2002
Table 7 Preschool and use of child-minding in 2001 and in 2002
Table 8 Intensity of child-minding – 2002
Table 9 Use of child-minding per day per week - 2002
Table 10 Regular users: Place of child-minding in 2001 and in 2002
Table 11 Regular users: use of child-minding according to the type of child-minding in 2001 and in 2002
Table 12 Regular users: relative share of child-minding subsidized by Kind en Gezin in 2001 and in 2002
Table 13 Regular users: relative share of child-minding in a family environment and in a group environment in 2001 and in 2002
Table 14 Regular users: relative share of child-minding subsidized by Kind en Gezin according to the province – 2002
Table 15 Regular users: relative share of child-minding in a family environment and in a group environment according to the province – 2002
Table 16 Limited users: use of child-minding according to the type of child-minding – 2002
Table 17 Limited users: relative share of child-minding subsidized by Kind en Gezin - 2002
Table 18 Limited users: relative share of child-minding in a family environment and in a group environment -2002
Table 19 Use of child-minding for children from a disadvantaged family and a non-disadvantaged family in 2001 and in 2002
Table 20 Use of child-minding by ethnic minorities and native Belgian families in 2001 and in 2002
7
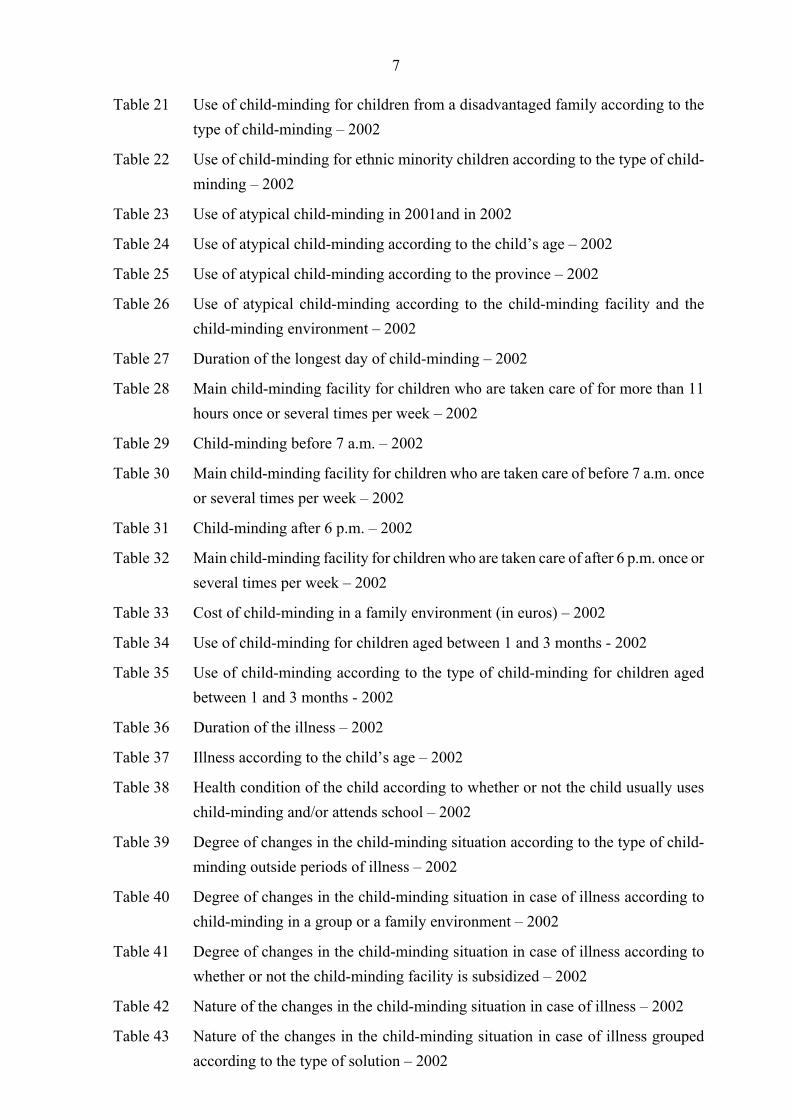
Table 21 Use of child-minding for children from a disadvantaged family according to the type of child-minding – 2002
Table 22 Use of child-minding for ethnic minority children according to the type of child-minding – 2002
Table 23 Use of atypical child-minding in 2001and in 2002
Table 24 Use of atypical child-minding according to the child’s age – 2002
Table 25 Use of atypical child-minding according to the province – 2002
Table 26 Use of atypical child-minding according to the child-minding facility and the child-minding environment – 2002
Table 27 Duration of the longest day of child-minding – 2002
Table 28 Main child-minding facility for children who are taken care of for more than 11 hours once or several times per week – 2002
Table 29 Child-minding before 7 a.m. – 2002
Table 30 Main child-minding facility for children who are taken care of before 7 a.m. once or several times per week – 2002
Table 31 Child-minding after 6 p.m. – 2002
Table 32 Main child-minding facility for children who are taken care of after 6 p.m. once or several times per week – 2002
Table 33 Cost of child-minding in a family environment (in euros) – 2002
Table 34 Use of child-minding for children aged between 1 and 3 months - 2002
Table 35 Use of child-minding according to the type of child-minding for children aged between 1 and 3 months - 2002
Table 36 Duration of the illness – 2002
Table 37 Illness according to the child’s age – 2002
Table 38 Health condition of the child according to whether or not the child usually uses child-minding and/or attends school – 2002
Table 39 Degree of changes in the child-minding situation according to the type of child-minding outside periods of illness – 2002
Table 40 Degree of changes in the child-minding situation in case of illness according to child-minding in a group or a family environment – 2002
Table 41 Degree of changes in the child-minding situation in case of illness according to whether or not the child-minding facility is subsidized – 2002
Table 42 Nature of the changes in the child-minding situation in case of illness – 2002
Table 43 Nature of the changes in the child-minding situation in case of illness grouped according to the type of solution – 2002
8
Enclosures
Table 1 Use of child-minding for children aged between 3 months and 3 years in the Flemish region – Period 1988 – 2002
Table 2 Percentage of children aged between 3 months and 3 years who regularly use child-minding according to the district / province in 2001 and in 2002
Table 3 Regular use of child-minding (%) for children aged between 3 months and 3 years – Period 1988 – 2002
Table 4 Use of child-minding for children aged between 3 months and 2 years and 6 months in 2001 and in 2002
Table 5 Intensity of child-minding – Period 1988 – 2002
Table 6 Relative share of child-minding facilities subsidized by Kind en Gezin according to the province in 2001 and in 2002
Table 7 Relative share of child-minding in a family and in a group environment according to the province in 2001 and in 2002
Table 8 Percentage of children aged between 3 months and 3 years who make use of atypical child-minding according to the district / province - 2002
9
INTRODUCTION From 7 to 31 October 2002 Kind en Gezin conducted a random sample survey concerning the use of child-minding for children aged between 1 month and 3 years in the Flemish Region. In this introduction we take a closer look at a number of technical aspects of the study. 1. Why a new Survey in 2002? During a period of more than ten years, the concise autumn surveys conducted by Kind en Gezin remained practically unchanged. Only in 1997, an additional section was added on child-minding of ill children and child-minding at difficult hours. Also the method of questioning remained unchanged, i.e. oral questionnaires conducted by regional health visitors of Kind en Gezin. In 1999 a more large-scale survey was conducted in writing which introduced a new definition of regular use of child-minding. The results of this 1999 survey demonstrated a strong increase of the use of child-minding. In the autumn of 2001 the ‘original’ survey was reintroduced in the form of a telephone questionnaire, except for the disadvantaged and ethnic minority families. The definition of regular use applied in the 1999 survey was left unchanged. The analysis showed that the use of child-minding had decreased in the meantime. Due to changes in the method of questioning during the last few years it has become very difficult or even impossible to compare the results throughout the years. In order to be able to follow-up the use of child-minding in an effective way, Kind en Gezin decided to conduct another survey in the autumn of 2002, with the same definition and according to the same method as the 2001 survey. 2. Method of Questioning Due to the positive experiences in 2001, Kind en Gezin again decided to conduct a telephone questionnaire, except for the disadvantaged and ethnic minority families. This telephone questionnaire was carried out by the MAS research agency of Leuven.
10
Since a low response level could be expected from the disadvantaged1 and ethnic minority families2 when using a telephone questionnaire, Kind en Gezin decided to question these groups by means of oral questionnaires carried out by regional health visitors as was done in the past. These regional health visitors interviewed the families at home. They could also appeal to intercultural co-workers or experiential experts in order to increase the response level and help clarify or translate the questions if necessary. The same list of questions was used for both the telephone and oral questionnaire. 3. Target Group, Scope of the Random Sample Survey and Method of Drawing Target Group Contrary to the previous autumn surveys where children aged from 3 months were questioned, the 2002 target group consists of children aged between 1 month and 3 years. The target group comprises all children of this age who live in the Flemish Region, including children from disadvantaged and ethnic minority families and children who are preventatively followed-up by the Kind en Gezin health centres as well as children who are not followed-up at these health centres. Scope of the Random Sample Survey and Method of Drawing In 2002, Kind en Gezin again opted for a larger number of respondents, i.e. 4.500; while in 2001 the number of respondents was limited to merely 2.500. The sample survey was randomly drawn from IKAROS, a database containing a number of data with regard to children in Flanders. The sample survey was drawn per province and per sub-group (‘standard group’, disadvantaged and ethnic minority group) in proportion of the share in the total population. As a result, the initial sample survey constitutes a correct reflection of the total population with regard to these elements. Within each of these sub-groups an extra number of respondents was drawn as a reserve. The initial sample survey for the telephone questionnaires consisted of 3.821 respondents, while 679 respondents were drawn for the oral questionnaire.
1 In order to determine whether a family is disadvantaged, the family is assessed by means of the following 6 criteria: monthly income of the family, employment situation of the parents, education of the parents, housing, development and health of the children. When a family experiences difficulties with 3 or more of these criteria it is considered as a disadvantaged family. 2 Children whose mother did not have the Belgian nationality at birth or children where the field ‘nationality of the mother at birth’ is left blank.

11
4. Response - for the telephone questionnaire Slightly more than the expected 3.821 questionnaires were filled in: in total 3.845 questionnaires. Keeping into account the fact that a number of addresses did not contain a telephone number, a telephone number without prefix or an incorrect telephone number, the response consisted of 74,4%, which is considerable. With regard to the use of child-minding the reserve respondents do not differ significantly from the respondents in the initial sample survey1. The reserve respondents were taken from the same age category. - for the oral questionnaire Slightly more than the expected 679 questionnaires were filled in, i.e. 685. The response consisted of 80,6 %. The differences in response between the oral and telephone questionnaires lead to a limited weighing in order to restore the proportions in the population. As a result the number of cases in the tables differ slightly.
1 χ² = 6,826 df = 2 p = 0,033 (ns.)

12
PART I. CHILDREN AGED BETWEEN 3 MONTHS AND 3 YEARS The 2002 survey also included children aged between 1 and 3 months. In order to be able to compare the previous reports and due to the specific situation of this group – a lot of mothers are still in maternity leave – Kind en Gezin decided to draw up a separate report on this (see part II). A. USE OF CHILD-MINDING 1. To what Extent Do People Use Child-minding? 1.1. In the Flemish Region In the autumn of 2002 more than 63 % of the children aged between 3 months and 3 years made use of child-minding: 52,2 % are regularly cared for by third parties such as family members, a child-minding family or a day care centre, 11,1 % are cared for during a limited period of time (less than one continuous period of 5 hours per week for children who do not yet attend school and less than once per week for children aged between 2,5 and 3 years attending preschool) and 36,7 % do not make use of child-minding at all. In comparison with the 2001 survey, both regular and limited use of child-minding has increased. The percentage of children who do not make use of child-minding has decreased. These changes are statistically significant1. Table 1 in the enclosures contains an overview starting from 1988. Table 1- Use of child-minding for children aged between 3 months and 3 years in the Flemish Region in 2001 and in 2002 2001
N = 2 555 2002
N = 4 358 Regular (1) 49,0 52,2 Limited 9,8 11,1 No 41,2 36,7 (1) At least 1 continuous period of at least 5 hours per week for children who do not attend school and at least once per week for children aged between 2,5 and 3 years attending preschool.
1 χ² = 13,934 df = 2 p = 0,001 (s.)
13
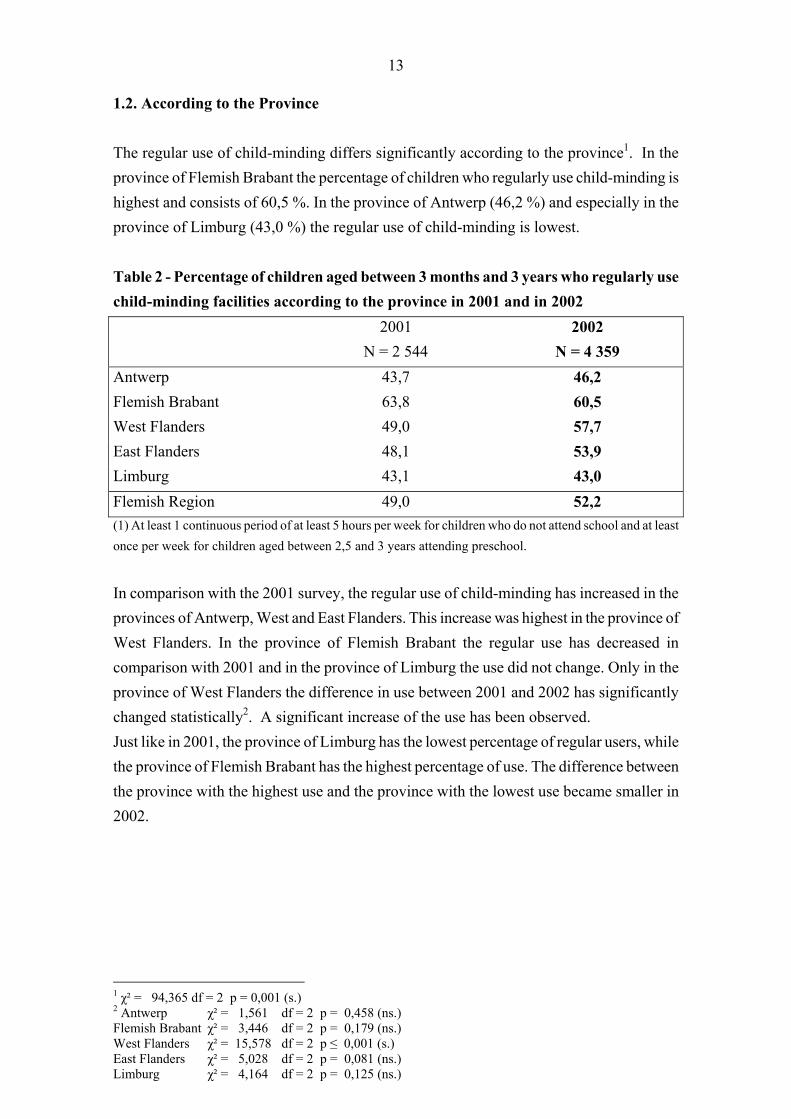
1.2. According to the Province The regular use of child-minding differs significantly according to the province1. In the province of Flemish Brabant the percentage of children who regularly use child-minding is highest and consists of 60,5 %. In the province of Antwerp (46,2 %) and especially in the province of Limburg (43,0 %) the regular use of child-minding is lowest. Table 2 - Percentage of children aged between 3 months and 3 years who regularly use child-minding facilities according to the province in 2001 and in 2002 2001
N = 2 544 2002
N = 4 359 Antwerp 43,7 46,2 Flemish Brabant 63,8 60,5 West Flanders 49,0 57,7 East Flanders 48,1 53,9 Limburg 43,1 43,0 Flemish Region 49,0 52,2 (1) At least 1 continuous period of at least 5 hours per week for children who do not attend school and at least once per week for children aged between 2,5 and 3 years attending preschool.
In comparison with the 2001 survey, the regular use of child-minding has increased in the provinces of Antwerp, West and East Flanders. This increase was highest in the province of West Flanders. In the province of Flemish Brabant the regular use has decreased in comparison with 2001 and in the province of Limburg the use did not change. Only in the province of West Flanders the difference in use between 2001 and 2002 has significantly changed statistically2. A significant increase of the use has been observed. Just like in 2001, the province of Limburg has the lowest percentage of regular users, while the province of Flemish Brabant has the highest percentage of use. The difference between the province with the highest use and the province with the lowest use became smaller in 2002.
1 χ² = 94,365 df = 2 p = 0,001 (s.) 2 Antwerp χ² = 1,561 df = 2 p = 0,458 (ns.) Flemish Brabant χ² = 3,446 df = 2 p = 0,179 (ns.) West Flanders χ² = 15,578 df = 2 p ≤ 0,001 (s.) East Flanders χ² = 5,028 df = 2 p = 0,081 (ns.) Limburg χ² = 4,164 df = 2 p = 0,125 (ns.)
14
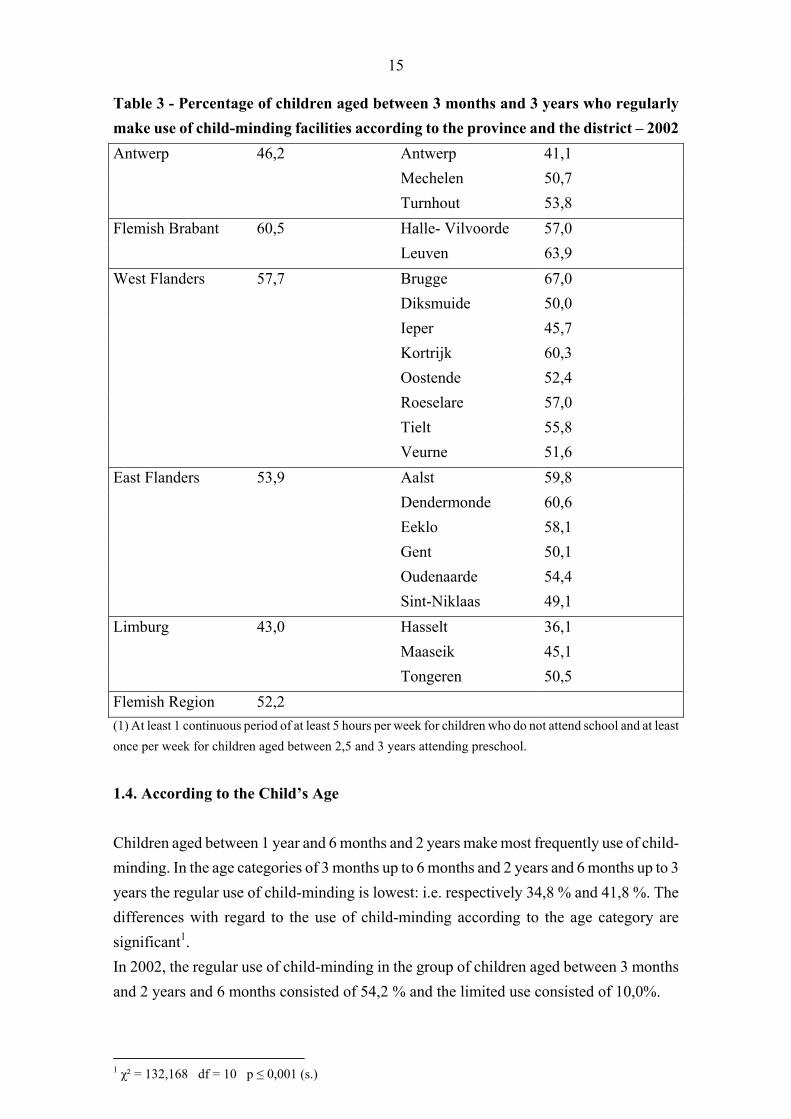
1.3. According to the District Also according to the district the regular use of child-minding differs significantly1. In the districts of Leuven and Bruges the regular use is more than 10 % higher than in the Flemish Region and in the districts of Kortrijk, Aalst, Dendermonde and Eeklo the regular use is 5 to 10 % higher. In the districts of Antwerp and Hasselt the use is more than 10 % lower than in the Flemish Region and in the districts of Ieper and Maaseik the use is 5 to 10 % lower. The use in the other districts is situated between 5 % below and 5 % above the Flemish Region. In comparison with 2001, the use of child-minding has not changed significantly in any district (see enclosure, table 2).
1 χ² =169,588 df = 42 p ≤ 0,001 (s.)
15
Table 3 - Percentage of children aged between 3 months and 3 years who regularly make use of child-minding facilities according to the province and the district – 2002 Antwerp 46,2 Antwerp 41,1 Mechelen 50,7 Turnhout 53,8 Flemish Brabant 60,5 Halle- Vilvoorde 57,0 Leuven 63,9 West Flanders 57,7 Brugge 67,0 Diksmuide 50,0 Ieper 45,7 Kortrijk 60,3 Oostende 52,4 Roeselare 57,0 Tielt 55,8 Veurne 51,6 East Flanders 53,9 Aalst 59,8 Dendermonde 60,6 Eeklo 58,1 Gent 50,1 Oudenaarde 54,4 Sint-Niklaas 49,1 Limburg 43,0 Hasselt 36,1 Maaseik 45,1 Tongeren 50,5 Flemish Region 52,2 (1) At least 1 continuous period of at least 5 hours per week for children who do not attend school and at least once per week for children aged between 2,5 and 3 years attending preschool.
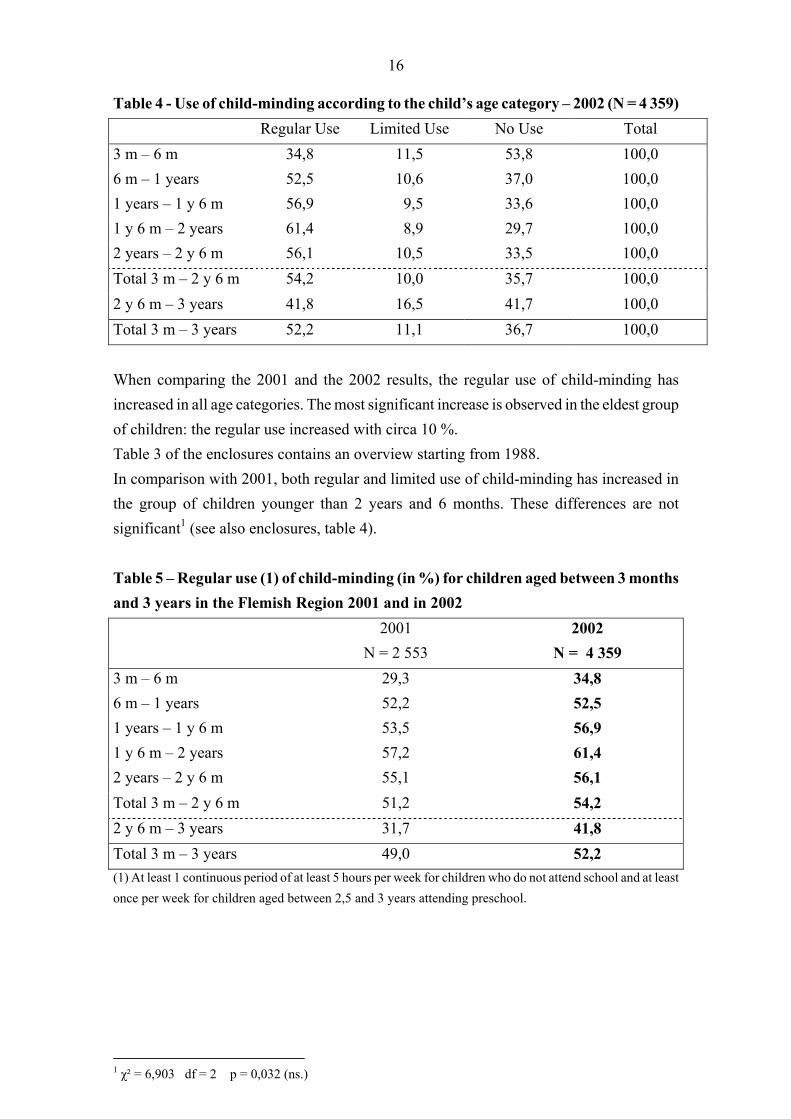
1.4. According to the Child’s Age Children aged between 1 year and 6 months and 2 years make most frequently use of child-minding. In the age categories of 3 months up to 6 months and 2 years and 6 months up to 3 years the regular use of child-minding is lowest: i.e. respectively 34,8 % and 41,8 %. The differences with regard to the use of child-minding according to the age category are significant1. In 2002, the regular use of child-minding in the group of children aged between 3 months and 2 years and 6 months consisted of 54,2 % and the limited use consisted of 10,0%.
1 χ² = 132,168 df = 10 p ≤ 0,001 (s.)
16
Table 4 - Use of child-minding according to the child’s age category – 2002 (N = 4 359) Regular Use Limited Use No Use Total 3 m – 6 m 34,8 11,5 53,8 100,0 6 m – 1 years 52,5 10,6 37,0 100,0 1 years – 1 y 6 m 56,9 9,5 33,6 100,0 1 y 6 m – 2 years 61,4 8,9 29,7 100,0 2 years – 2 y 6 m 56,1 10,5 33,5 100,0 Total 3 m – 2 y 6 m 54,2 10,0 35,7 100,0 2 y 6 m – 3 years 41,8 16,5 41,7 100,0 Total 3 m – 3 years 52,2 11,1 36,7 100,0 When comparing the 2001 and the 2002 results, the regular use of child-minding has increased in all age categories. The most significant increase is observed in the eldest group of children: the regular use increased with circa 10 %. Table 3 of the enclosures contains an overview starting from 1988. In comparison with 2001, both regular and limited use of child-minding has increased in the group of children younger than 2 years and 6 months. These differences are not significant1 (see also enclosures, table 4). Table 5 – Regular use (1) of child-minding (in %) for children aged between 3 months and 3 years in the Flemish Region 2001 and in 2002 2001
N = 2 553 2002
N = 4 359 3 m – 6 m 29,3 34,8 6 m – 1 years 52,2 52,5 1 years – 1 y 6 m 53,5 56,9 1 y 6 m – 2 years 57,2 61,4 2 years – 2 y 6 m 55,1 56,1 Total 3 m – 2 y 6 m 51,2 54,2 2 y 6 m – 3 years 31,7 41,8 Total 3 m – 3 years 49,0 52,2 (1) At least 1 continuous period of at least 5 hours per week for children who do not attend school and at least once per week for children aged between 2,5 and 3 years attending preschool.
1 χ² = 6,903 df = 2 p = 0,032 (ns.)
17
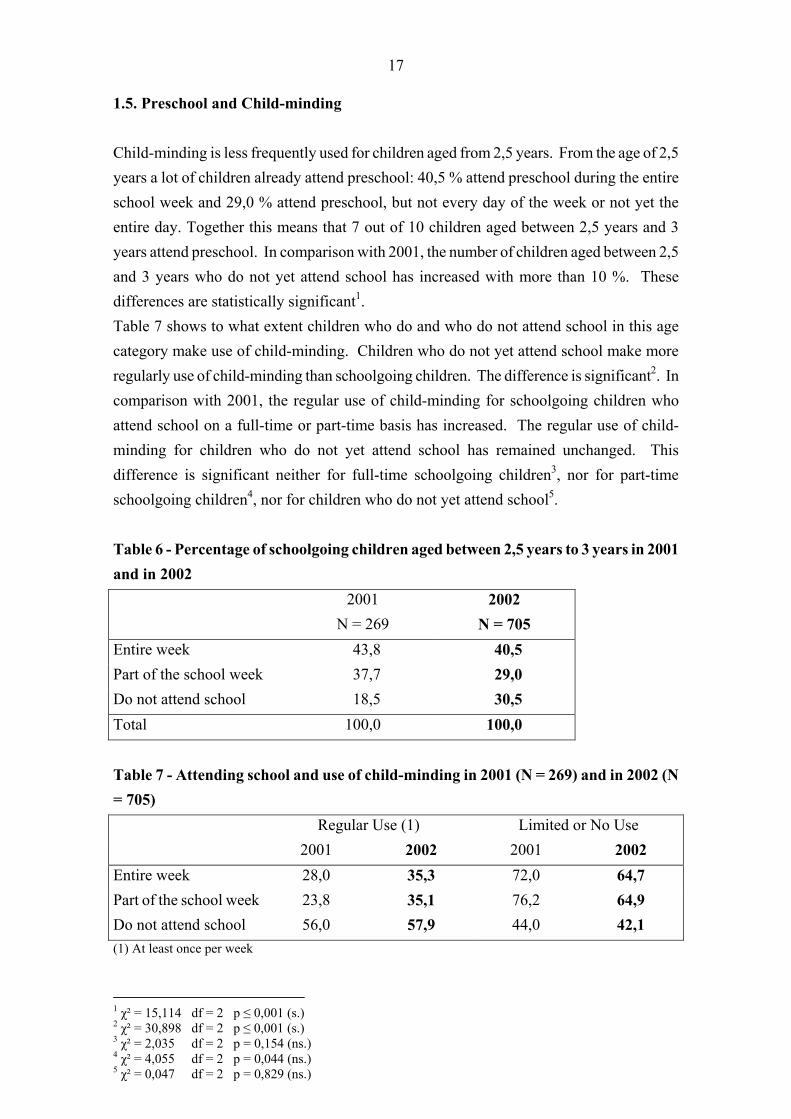
1.5. Preschool and Child-minding Child-minding is less frequently used for children aged from 2,5 years. From the age of 2,5 years a lot of children already attend preschool: 40,5 % attend preschool during the entire school week and 29,0 % attend preschool, but not every day of the week or not yet the entire day. Together this means that 7 out of 10 children aged between 2,5 years and 3 years attend preschool. In comparison with 2001, the number of children aged between 2,5 and 3 years who do not yet attend school has increased with more than 10 %. These differences are statistically significant1. Table 7 shows to what extent children who do and who do not attend school in this age category make use of child-minding. Children who do not yet attend school make more regularly use of child-minding than schoolgoing children. The difference is significant2. In comparison with 2001, the regular use of child-minding for schoolgoing children who attend school on a full-time or part-time basis has increased. The regular use of child-minding for children who do not yet attend school has remained unchanged. This difference is significant neither for full-time schoolgoing children3, nor for part-time schoolgoing children4, nor for children who do not yet attend school5. Table 6 - Percentage of schoolgoing children aged between 2,5 years to 3 years in 2001 and in 2002 2001
N = 269 2002
N = 705 Entire week 43,8 40,5 Part of the school week 37,7 29,0 Do not attend school 18,5 30,5 Total 100,0 100,0 Table 7 - Attending school and use of child-minding in 2001 (N = 269) and in 2002 (N = 705) Regular Use (1) Limited or No Use 2001 2002 2001 2002 Entire week 28,0 35,3 72,0 64,7 Part of the school week 23,8 35,1 76,2 64,9 Do not attend school 56,0 57,9 44,0 42,1 (1) At least once per week
1 χ² = 15,114 df = 2 p ≤ 0,001 (s.) 2 χ² = 30,898 df = 2 p ≤ 0,001 (s.) 3 χ² = 2,035 df = 2 p = 0,154 (ns.) 4 χ² = 4,055 df = 2 p = 0,044 (ns.) 5 χ² = 0,047 df = 2 p = 0,829 (ns.)

18
1.6. According to the Intensity of Child-minding Most children make use of child-minding on a part-time basis: seven out of ten children are cared for on a part-time basis and three out of ten children are cared for during 5 full days per week. Children who make use of child-minding on a part-time basis are mainly cared for during full days or during partly full and partly half days. Child-minding during only part of the day is less common. In comparison with 2001, the share of full-time child-minding has increased minimally. The differences are not statistically significant1. The Kind en Gezin surveys show that in the period of 1988 up to 1997 a shift of 10 % occurred from full-time to part-time child-minding (see enclosure, table 5). However, during the last 5 years the share of full-time and part-time child-minding has remained relatively stable. Table 8 - Intensity of child-minding – 2002 Percentage of all children
aged between 3 months and 3 years
(N = 4 336)
Percentage of regular users of child-minding
(N = 2 252)
Full-time 15,5 29,8 Part-time 36,4 70,2 Only full days 22,3 43,0 Part of the day during 5 days
0,5
0,9
Part of the day during a few days
1,6
3,1
Partly full and partly half days
12,0
23,2
Total regular use Limited use No use
52,2 11,1 36,7
100,0
Total 100,0 1.7. Use of Child-minding per Day per Week2 On Wednesdays, the number of children who do not use child-minding is higher than on other days of the week. The number of children using less than 5 hours of child-minding on Wednesdays is also higher than on other days. On Tuesdays, most children make use of child-minding; this is the case both for the total group and the group of regular users.
1 χ² = 0,226 df = 2 p = 0,634 (ns.) 2 The use of child-minding on Saturdays and Sundays is discussed under the section of atypical child-minding

19
Table 9 - Use of child-minding per day per week - 2002
Children aged between 3 months and 3 years More than
5 hours Less than 5 hours
No Use Total
Monday (N=4356) 36,7 3,9 59,4 100,0 Tuesday (N=4355) 37,8 4,2 58,0 100,0 Wednesday (N=4355) 28,3 7,3 64,4 100,0 Thursday (N=4352) 36,6 4,5 58,8 100,0 Friday (N=4354) 33,4 5,2 61,4 100,0
Regular users of child-minding More than
5 hours Less than 5 hours
No Use Total
Monday (N=2287) 69,9 7,4 22,6 100,0 Tuesday (N=2286) 72,1 8,1 19,6 100,0 Wednesday (N=2286) 54,1 13,9 31,8 100,0 Thursday (N=2283) 69,8 8,7 21,3 100,0 Friday (N=2284) 63,8 9,9 26,1 100,0 2. Which Facility is Responsible for Child-minding? In this paragraph we first take a closer look at the types of child-minding used for children who regularly use child-minding. What is the main type of child-minding? How many children make use of more than one type of child-minding and which group of children does this? Secondly, we take a closer look at the types of child-minding used for children who make limited use of child-minding. 2.1. Regular Users of Child-minding 2.1.1. Types of Child-minding Used 2.1.1.1. Main Type of Child-minding Child-minding of young children mainly occurs outside their home: 6,7 % of the children is cared for at home. Child-minding at home has slightly increased in 2002 in comparison with 2001, but the difference is not statistically significant1.
1 χ² = 2,202 df = 1 p = 0,138 (ns.)
20
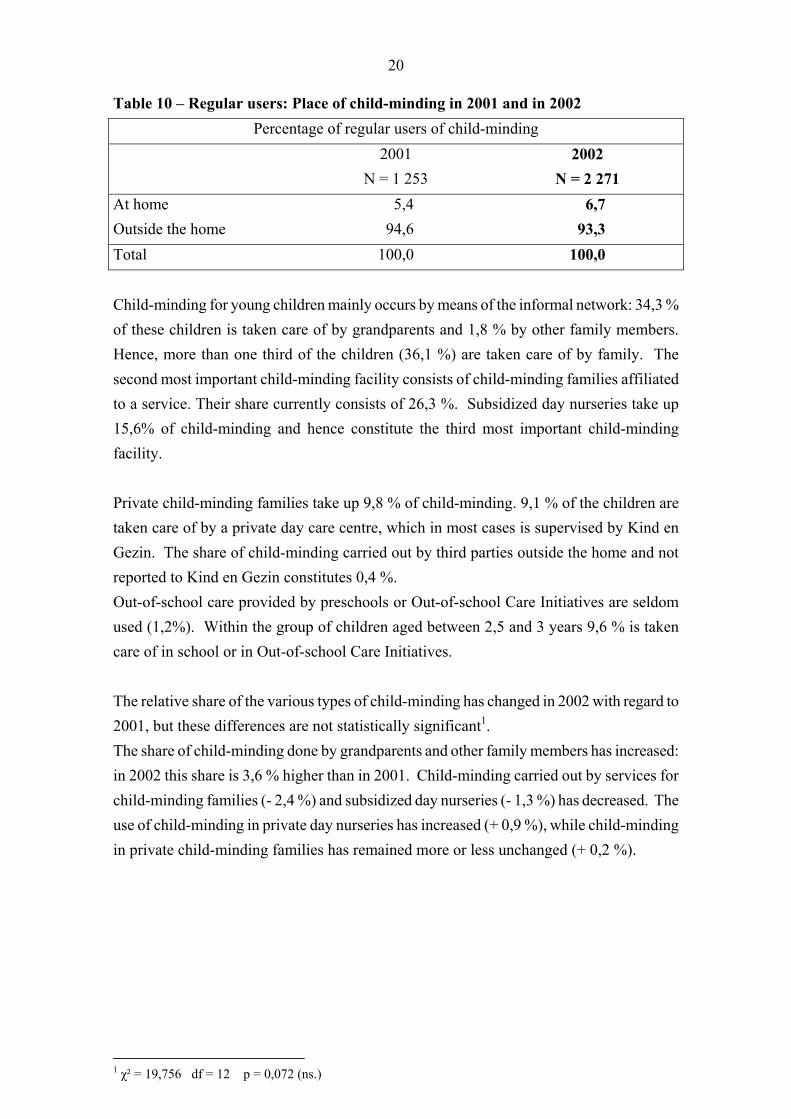
Table 10 – Regular users: Place of child-minding in 2001 and in 2002 Percentage of regular users of child-minding
2001 N = 1 253
2002 N = 2 271
At home 5,4 6,7 Outside the home 94,6 93,3 Total 100,0 100,0 Child-minding for young children mainly occurs by means of the informal network: 34,3 % of these children is taken care of by grandparents and 1,8 % by other family members. Hence, more than one third of the children (36,1 %) are taken care of by family. The second most important child-minding facility consists of child-minding families affiliated to a service. Their share currently consists of 26,3 %. Subsidized day nurseries take up 15,6% of child-minding and hence constitute the third most important child-minding facility. Private child-minding families take up 9,8 % of child-minding. 9,1 % of the children are taken care of by a private day care centre, which in most cases is supervised by Kind en Gezin. The share of child-minding carried out by third parties outside the home and not reported to Kind en Gezin constitutes 0,4 %. Out-of-school care provided by preschools or Out-of-school Care Initiatives are seldom used (1,2%). Within the group of children aged between 2,5 and 3 years 9,6 % is taken care of in school or in Out-of-school Care Initiatives. The relative share of the various types of child-minding has changed in 2002 with regard to 2001, but these differences are not statistically significant1. The share of child-minding done by grandparents and other family members has increased: in 2002 this share is 3,6 % higher than in 2001. Child-minding carried out by services for child-minding families (- 2,4 %) and subsidized day nurseries (- 1,3 %) has decreased. The use of child-minding in private day nurseries has increased (+ 0,9 %), while child-minding in private child-minding families has remained more or less unchanged (+ 0,2 %).
1 χ² = 19,756 df = 12 p = 0,072 (ns.)

21
Table 11 – Regular users: the use of child-minding according to the type of child-minding in 2001 and in 2002 (1)
Percentage of regular users of child-minding 2001
N = 1 253 2002
N = 2 274 Grandparents 29,9 = 32,5 34,3 = 36,1 Family member 2,6 1,8 Third parties/no family members at home
0,7 1,0
Third parties/no family members outside the home
0,4 0,4
Child-minding families affiliated to a service
28,7 26,3
Subsidized day care centre 16,9 15,6 Private child-minding family registered with Kind en Gezin
1,3 = 9,6
1,1 = 9,8
Private child-minding family supervised by Kind en Gezin
8,3 8,7
Private day care centre registered with Kind en Gezin
0,2 = 8,2
0,3 = 9,1
Private day care centre supervised by Kind en Gezin
8,0 8,8
Childcare and Family Support Centre 0,3 0,2 Out-of-school care (2) 1,4 1,2 Child-minding family, day care centre, not known which type
0,8 0,4
Other 0,3 0,0 Total 100,0 100,0 (1) Main type of child-minding (2) In preschool or in Out-of-school Care Initiatives
Slightly more than 4 out of 10 children are taken care of by a child-minding facility subsidized by Kind en Gezin. The relative share of child-minding subsidized by Kind en Gezin has decreased with 4,2 % with regard to 2001. This difference is not statistically significant1.
1 χ² = 6,251 df = 3 p = 0,100 (ns.)
22
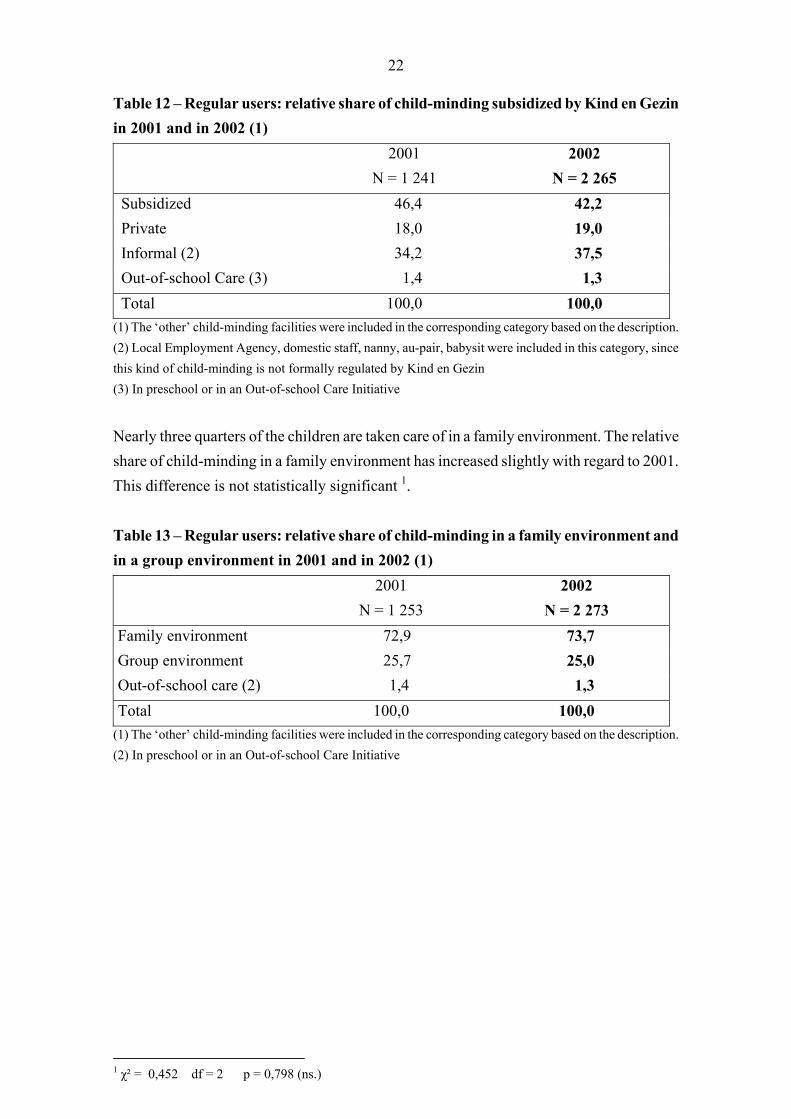
Table 12 – Regular users: relative share of child-minding subsidized by Kind en Gezin in 2001 and in 2002 (1)
2001 N = 1 241
2002 N = 2 265
Subsidized 46,4 42,2 Private 18,0 19,0 Informal (2) 34,2 37,5 Out-of-school Care (3) 1,4 1,3 Total 100,0 100,0
(1) The ‘other’ child-minding facilities were included in the corresponding category based on the description. (2) Local Employment Agency, domestic staff, nanny, au-pair, babysit were included in this category, since this kind of child-minding is not formally regulated by Kind en Gezin (3) In preschool or in an Out-of-school Care Initiative
Nearly three quarters of the children are taken care of in a family environment. The relative share of child-minding in a family environment has increased slightly with regard to 2001. This difference is not statistically significant 1. Table 13 – Regular users: relative share of child-minding in a family environment and in a group environment in 2001 and in 2002 (1)
2001 N = 1 253
2002 N = 2 273
Family environment 72,9 73,7 Group environment 25,7 25,0 Out-of-school care (2) 1,4 1,3 Total 100,0 100,0
(1) The ‘other’ child-minding facilities were included in the corresponding category based on the description. (2) In preschool or in an Out-of-school Care Initiative
1 χ² = 0,452 df = 2 p = 0,798 (ns.)
23
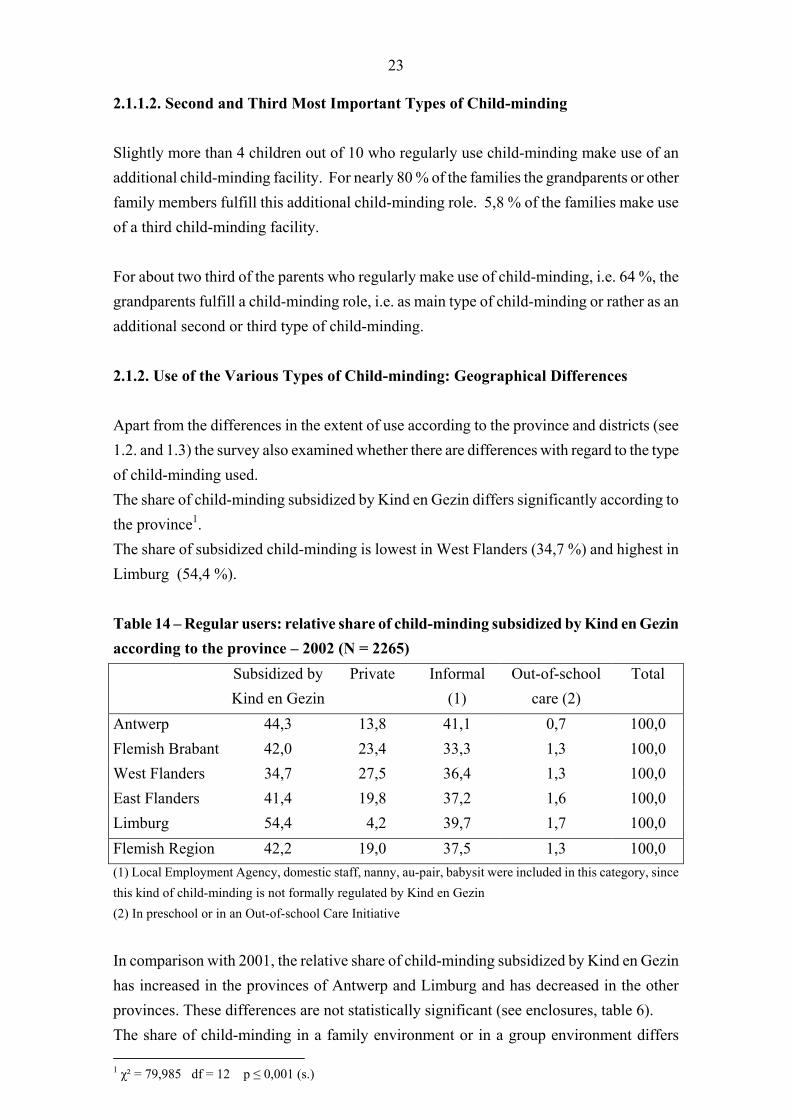
2.1.1.2. Second and Third Most Important Types of Child-minding Slightly more than 4 children out of 10 who regularly use child-minding make use of an additional child-minding facility. For nearly 80 % of the families the grandparents or other family members fulfill this additional child-minding role. 5,8 % of the families make use of a third child-minding facility. For about two third of the parents who regularly make use of child-minding, i.e. 64 %, the grandparents fulfill a child-minding role, i.e. as main type of child-minding or rather as an additional second or third type of child-minding. 2.1.2. Use of the Various Types of Child-minding: Geographical Differences Apart from the differences in the extent of use according to the province and districts (see 1.2. and 1.3) the survey also examined whether there are differences with regard to the type of child-minding used. The share of child-minding subsidized by Kind en Gezin differs significantly according to the province1. The share of subsidized child-minding is lowest in West Flanders (34,7 %) and highest in Limburg (54,4 %). Table 14 – Regular users: relative share of child-minding subsidized by Kind en Gezin according to the province – 2002 (N = 2265) Subsidized by
Kind en Gezin Private Informal
(1) Out-of-school
care (2) Total
Antwerp 44,3 13,8 41,1 0,7 100,0 Flemish Brabant 42,0 23,4 33,3 1,3 100,0 West Flanders 34,7 27,5 36,4 1,3 100,0 East Flanders 41,4 19,8 37,2 1,6 100,0 Limburg 54,4 4,2 39,7 1,7 100,0 Flemish Region 42,2 19,0 37,5 1,3 100,0 (1) Local Employment Agency, domestic staff, nanny, au-pair, babysit were included in this category, since this kind of child-minding is not formally regulated by Kind en Gezin (2) In preschool or in an Out-of-school Care Initiative
In comparison with 2001, the relative share of child-minding subsidized by Kind en Gezin has increased in the provinces of Antwerp and Limburg and has decreased in the other provinces. These differences are not statistically significant (see enclosures, table 6). The share of child-minding in a family environment or in a group environment differs 1 χ² = 79,985 df = 12 p ≤ 0,001 (s.)
24
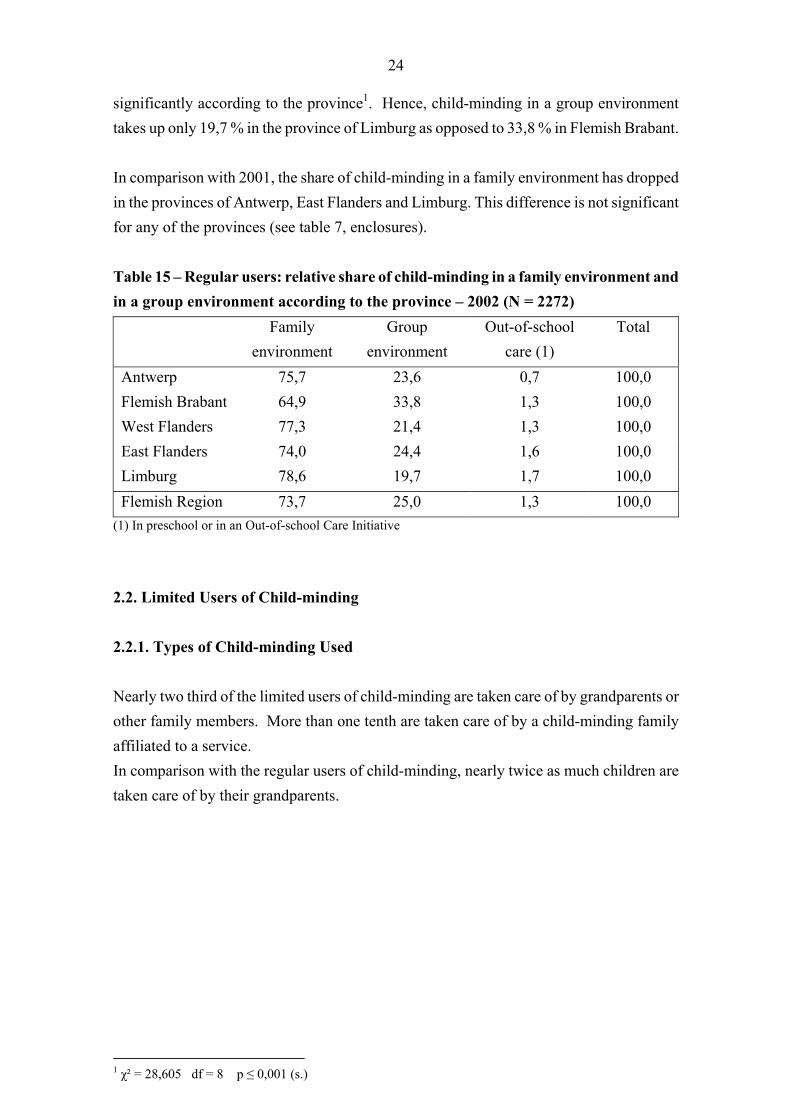
significantly according to the province1. Hence, child-minding in a group environment takes up only 19,7 % in the province of Limburg as opposed to 33,8 % in Flemish Brabant. In comparison with 2001, the share of child-minding in a family environment has dropped in the provinces of Antwerp, East Flanders and Limburg. This difference is not significant for any of the provinces (see table 7, enclosures). Table 15 – Regular users: relative share of child-minding in a family environment and in a group environment according to the province – 2002 (N = 2272)
Family environment
Group environment
Out-of-school care (1)
Total
Antwerp 75,7 23,6 0,7 100,0 Flemish Brabant 64,9 33,8 1,3 100,0 West Flanders 77,3 21,4 1,3 100,0 East Flanders 74,0 24,4 1,6 100,0 Limburg 78,6 19,7 1,7 100,0 Flemish Region 73,7 25,0 1,3 100,0
(1) In preschool or in an Out-of-school Care Initiative
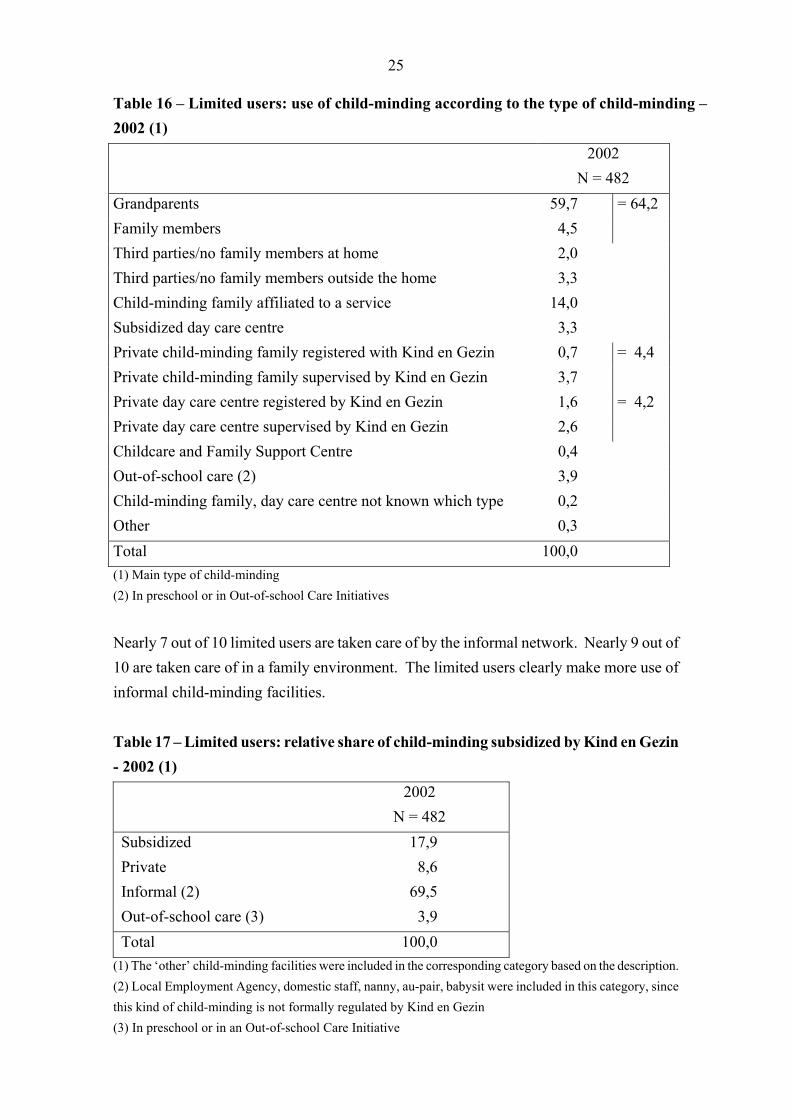
2.2. Limited Users of Child-minding 2.2.1. Types of Child-minding Used Nearly two third of the limited users of child-minding are taken care of by grandparents or other family members. More than one tenth are taken care of by a child-minding family affiliated to a service. In comparison with the regular users of child-minding, nearly twice as much children are taken care of by their grandparents.
1 χ² = 28,605 df = 8 p ≤ 0,001 (s.)
25
Table 16 – Limited users: use of child-minding according to the type of child-minding – 2002 (1) 2002
N = 482 Grandparents 59,7 = 64,2 Family members 4,5 Third parties/no family members at home 2,0 Third parties/no family members outside the home 3,3 Child-minding family affiliated to a service 14,0 Subsidized day care centre 3,3 Private child-minding family registered with Kind en Gezin 0,7 = 4,4 Private child-minding family supervised by Kind en Gezin 3,7 Private day care centre registered by Kind en Gezin 1,6 = 4,2 Private day care centre supervised by Kind en Gezin 2,6 Childcare and Family Support Centre 0,4 Out-of-school care (2) 3,9 Child-minding family, day care centre not known which type 0,2 Other 0,3 Total 100,0 (1) Main type of child-minding (2) In preschool or in Out-of-school Care Initiatives
Nearly 7 out of 10 limited users are taken care of by the informal network. Nearly 9 out of 10 are taken care of in a family environment. The limited users clearly make more use of informal child-minding facilities. Table 17 – Limited users: relative share of child-minding subsidized by Kind en Gezin - 2002 (1)
2002 N = 482
Subsidized 17,9 Private 8,6 Informal (2) 69,5 Out-of-school care (3) 3,9 Total 100,0
(1) The ‘other’ child-minding facilities were included in the corresponding category based on the description. (2) Local Employment Agency, domestic staff, nanny, au-pair, babysit were included in this category, since this kind of child-minding is not formally regulated by Kind en Gezin (3) In preschool or in an Out-of-school Care Initiative

26
Table 18 – Limited users: relative share of child-minding in a family environment and in a group environment -2002 (1)
2002 N = 482
Family environment 87,7 Group environment 8,4 Out-of-school care (2) 3,9 Total 100,0
(1) The ‘other’ child-minding facilities were included in the corresponding category based on the description. (2) In preschool or in an Out-of-school Care Initiative
27
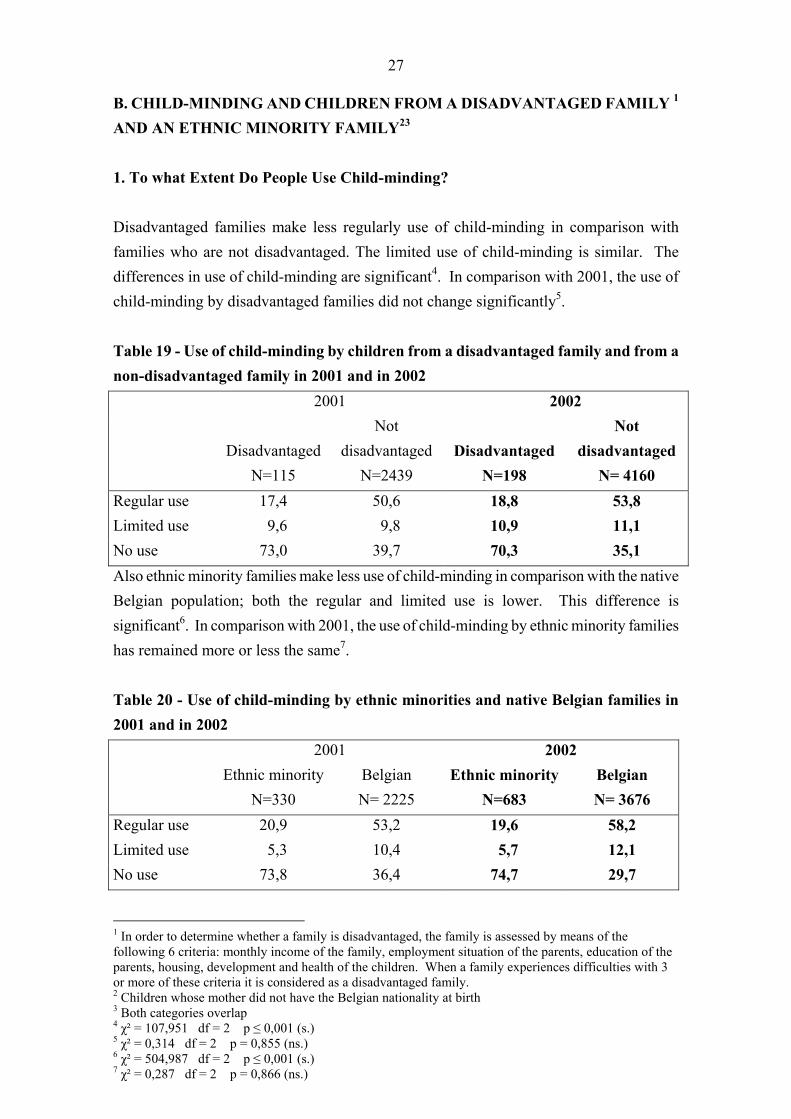
B. CHILD-MINDING AND CHILDREN FROM A DISADVANTAGED FAMILY 1 AND AN ETHNIC MINORITY FAMILY23 1. To what Extent Do People Use Child-minding? Disadvantaged families make less regularly use of child-minding in comparison with families who are not disadvantaged. The limited use of child-minding is similar. The differences in use of child-minding are significant4. In comparison with 2001, the use of child-minding by disadvantaged families did not change significantly5. Table 19 - Use of child-minding by children from a disadvantaged family and from a non-disadvantaged family in 2001 and in 2002 2001 2002
Disadvantaged N=115
Not disadvantaged
N=2439
Disadvantaged
N=198
Not disadvantaged
N= 4160 Regular use 17,4 50,6 18,8 53,8 Limited use 9,6 9,8 10,9 11,1 No use 73,0 39,7 70,3 35,1 Also ethnic minority families make less use of child-minding in comparison with the native Belgian population; both the regular and limited use is lower. This difference is significant6. In comparison with 2001, the use of child-minding by ethnic minority families has remained more or less the same7. Table 20 - Use of child-minding by ethnic minorities and native Belgian families in 2001 and in 2002 2001 2002 Ethnic minority
N=330 Belgian N= 2225
Ethnic minorityN=683
Belgian N= 3676
Regular use 20,9 53,2 19,6 58,2 Limited use 5,3 10,4 5,7 12,1 No use 73,8 36,4 74,7 29,7 1 In order to determine whether a family is disadvantaged, the family is assessed by means of the following 6 criteria: monthly income of the family, employment situation of the parents, education of the parents, housing, development and health of the children. When a family experiences difficulties with 3 or more of these criteria it is considered as a disadvantaged family. 2 Children whose mother did not have the Belgian nationality at birth 3 Both categories overlap 4 χ² = 107,951 df = 2 p ≤ 0,001 (s.) 5 χ² = 0,314 df = 2 p = 0,855 (ns.) 6 χ² = 504,987 df = 2 p ≤ 0,001 (s.) 7 χ² = 0,287 df = 2 p = 0,866 (ns.)
28
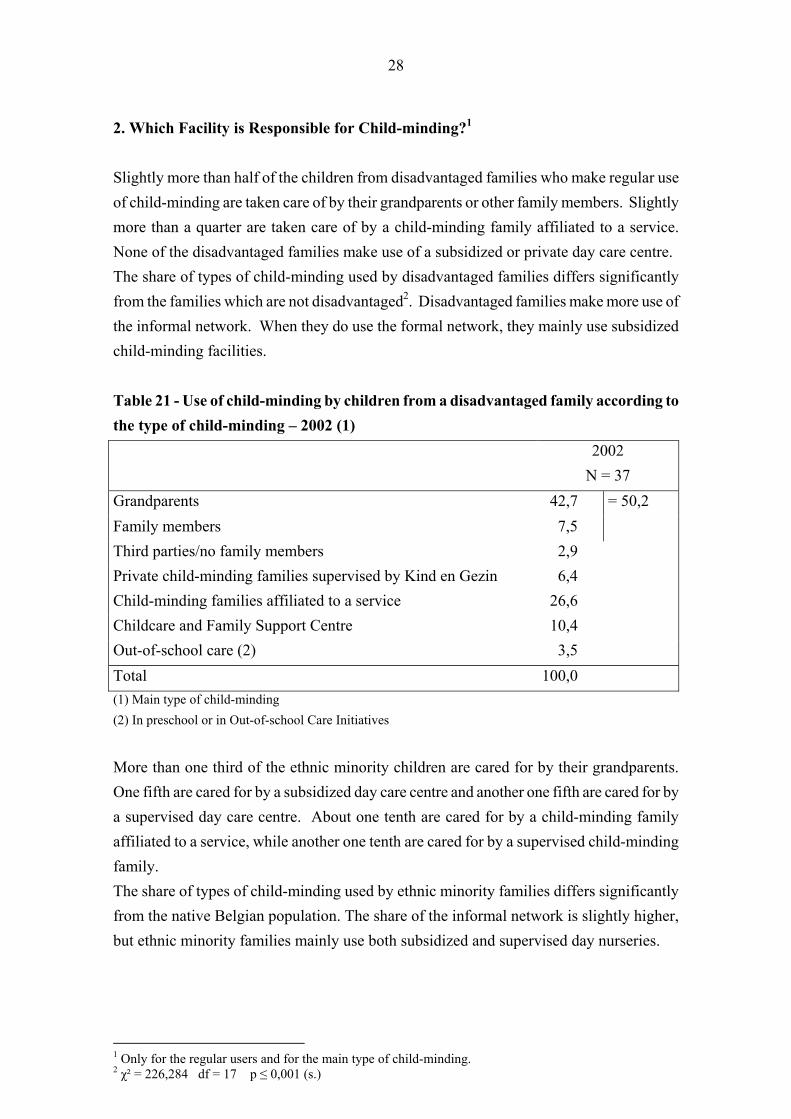
2. Which Facility is Responsible for Child-minding?1 Slightly more than half of the children from disadvantaged families who make regular use of child-minding are taken care of by their grandparents or other family members. Slightly more than a quarter are taken care of by a child-minding family affiliated to a service. None of the disadvantaged families make use of a subsidized or private day care centre. The share of types of child-minding used by disadvantaged families differs significantly from the families which are not disadvantaged2. Disadvantaged families make more use of the informal network. When they do use the formal network, they mainly use subsidized child-minding facilities. Table 21 - Use of child-minding by children from a disadvantaged family according to the type of child-minding – 2002 (1) 2002
N = 37 Grandparents 42,7 Family members 7,5
= 50,2
Third parties/no family members 2,9 Private child-minding families supervised by Kind en Gezin 6,4 Child-minding families affiliated to a service 26,6 Childcare and Family Support Centre 10,4 Out-of-school care (2) 3,5 Total 100,0 (1) Main type of child-minding (2) In preschool or in Out-of-school Care Initiatives
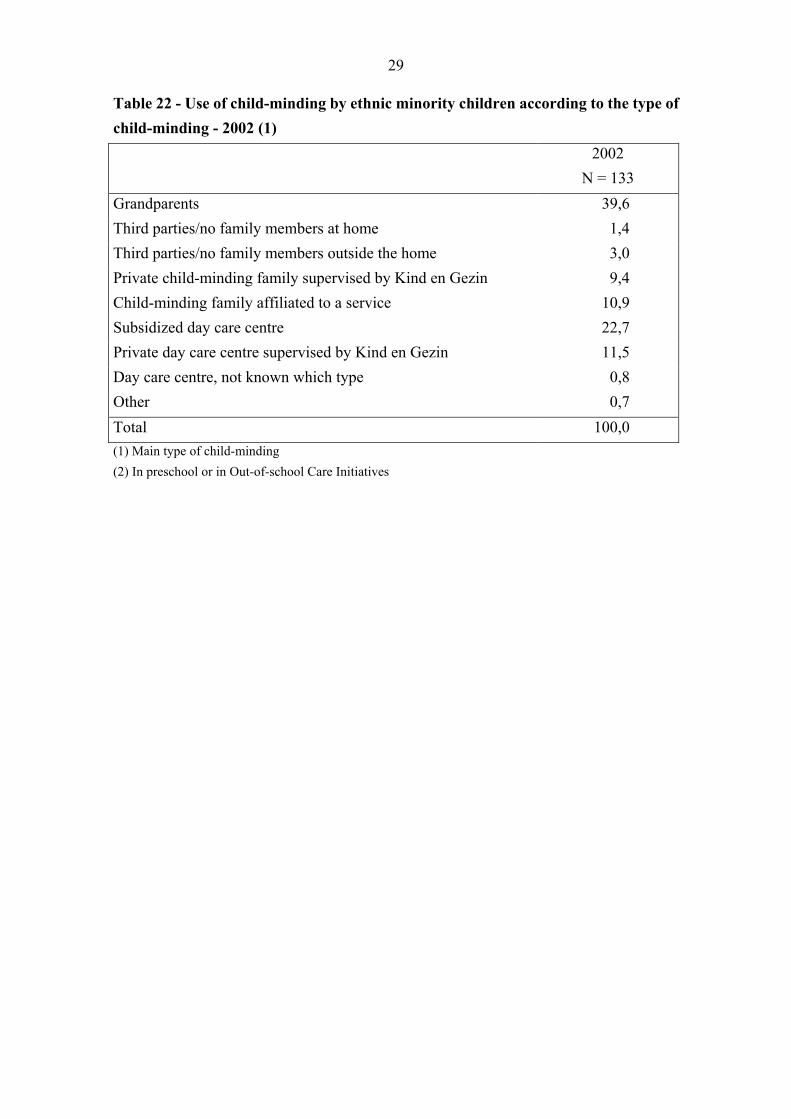
More than one third of the ethnic minority children are cared for by their grandparents. One fifth are cared for by a subsidized day care centre and another one fifth are cared for by a supervised day care centre. About one tenth are cared for by a child-minding family affiliated to a service, while another one tenth are cared for by a supervised child-minding family. The share of types of child-minding used by ethnic minority families differs significantly from the native Belgian population. The share of the informal network is slightly higher, but ethnic minority families mainly use both subsidized and supervised day nurseries.
1 Only for the regular users and for the main type of child-minding. 2 χ² = 226,284 df = 17 p ≤ 0,001 (s.)
29
Table 22 - Use of child-minding by ethnic minority children according to the type of child-minding - 2002 (1) 2002
N = 133 Grandparents 39,6 Third parties/no family members at home 1,4 Third parties/no family members outside the home 3,0 Private child-minding family supervised by Kind en Gezin 9,4 Child-minding family affiliated to a service 10,9 Subsidized day care centre 22,7 Private day care centre supervised by Kind en Gezin 11,5 Day care centre, not known which type 0,8 Other 0,7 Total 100,0 (1) Main type of child-minding (2) In preschool or in Out-of-school Care Initiatives

30
C. USE OF ATYPICAL CHILD-MINDING 1 1. Definition of Atypical Child-minding Atypical child-minding refers to child-minding early in the morning (before 7 a.m.) and/or late in the evening (after 6 p.m.) and/or long periods of child-minding (more than 11 hours per day, child-minding at night) and/or child-minding on non-working days (Saturdays, Sundays and holidays). All 4 aspects were questioned. 2. Use of Atypical Child-minding First, we take a closer look at the use of atypical child-minding in general. Table 23 shows that nearly one third of the children who regularly use child-minding make use of at least one aspect of atypical child-minding. This means that 31,4 % of the children are cared for at least 1 day per week before 7 a.m. and/or after 6 p.m. and/or during more than 11 hours per day and/or during the night and/or during the weekend. The use of atypical child-minding has not changed significantly with regard to 20012. Table 23 - Use of atypical child-minding in 2001and in 2002 Type of child-minding 2001
N = 1 253 2002
N = 2 259 Atypical child-minding 28,9 31,4 Typical child-minding 71,1 68,6 Total 100,0 100,0
1 The figures mentioned in this chapter only refer to children who regularly use child-minding. 2 χ² = 2,534 df = 1 p = 0,111 (ns.)

31
3. Atypical Child-minding in Detail First, we take a closer look at the use of atypical child-minding according to the child’s age and according to the province. Then, we focus on the child-minding facilities used. 3.1. According to the Child’s Age In the age category between 2 years 6 months and 3 years the use of atypical child-minding is highest, but there are no significant changes with regard to the use of atypical child-minding according to the child’s age1. Table 24 - Use of atypical child-minding according to the child’s age – 2002 (N = 2 259) Age Category % of users of
atypical child-minding
% of users of typical child-
minding
Total
3 m – 1 years 30,7 69,3 100,0 1 years - 1 years 6 m 28,6 71,4 100,0 1 years 6 m - 2 years 31,0 69,0 100,0 2 years - 2 years 6 m 31,5 68,5 100,0 2 years 6 m - 3 years 38,0 62,0 100,0 Total 31,4 68,6 100,0
3.2. According to the Province2 The differences between the provinces in the use of atypical child-minding are small and insignificant3.
1 χ² = 8,054 df = 4 p = 0,090 (ns.) 2 The use of atypical child-minding according to the district is included in the enclosures (table 8). 3 χ² = 2,547 df = 4 p = 0,636 (ns.)

32
Table 25 - Use of atypical child-minding according to the province – 2002 (N = 2 261) Province % of users of
atypical child-minding
% of users of typical child-
minding
Total
Antwerp 30,7 69,3 100,0 Flemish Brabant 30,1 69,9 100,0 West Flanders 34,4 65,6 100,0 East Flanders 30,8 69,2 100,0 Limburg 31,6 68,4 100,0 Total 31,4 68,6 100,0
3.3. According to the Child-minding Facility and the Child-minding Environment There is a significant difference with regard to the use of atypical child-minding according to the child-minding facility used1. Children who are cared for by the informal network make more use of atypical child-minding. With regard to the other types of facilities about one out of five to one out of four children makes use of atypical child-minding. There is a significant difference with regard to the use of atypical child-minding in a group or a family environment2. Children who are cared for in a family environment more frequently make use of atypical child-minding (32,2 %). In the informal network relatively more children make use of atypical child-minding. In the subsidized network the share of atypical child-minding is smallest. These differences are significant3.
1 χ² = 208,736 df = 6 p ≤ 0,001 (s.) 2 χ² = 36,228 df = 2 p ≤ 0,001 (s.) 3 χ² = 205,774 df = 3 p ≤ 0,001 (s.)
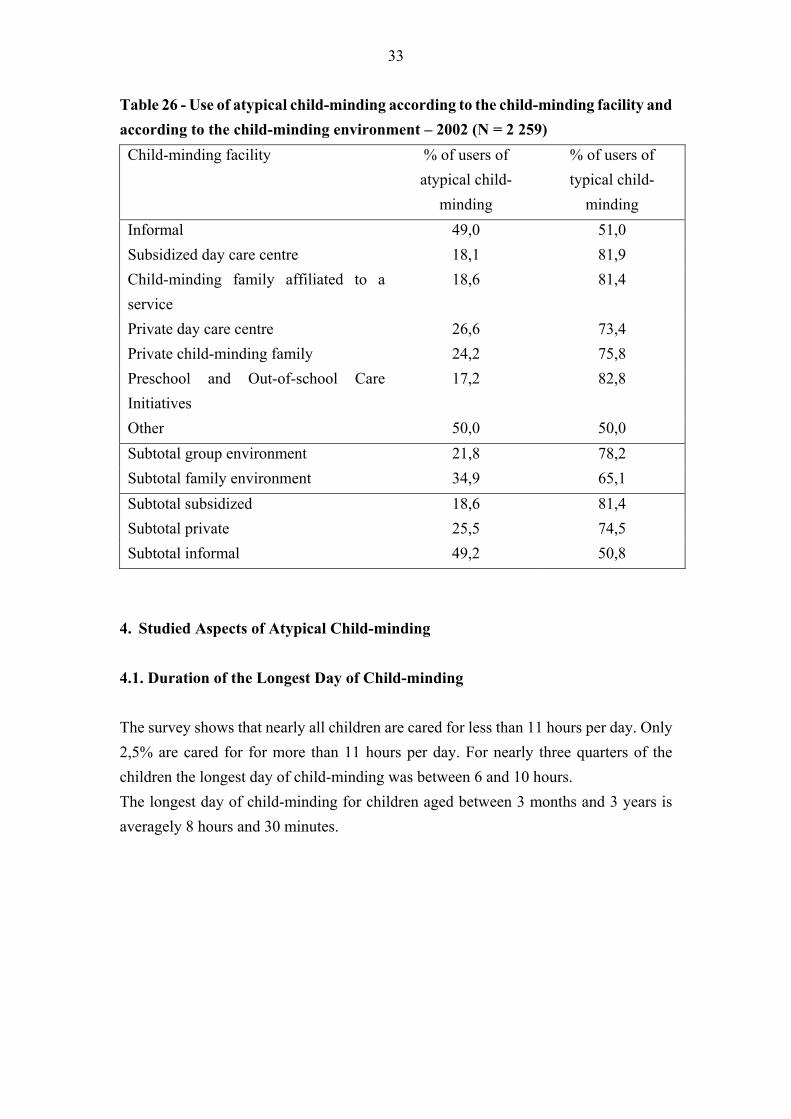
33
Table 26 - Use of atypical child-minding according to the child-minding facility and according to the child-minding environment – 2002 (N = 2 259) Child-minding facility % of users of
atypical child-minding
% of users of typical child-
minding Informal 49,0 51,0 Subsidized day care centre 18,1 81,9 Child-minding family affiliated to a service
18,6 81,4
Private day care centre 26,6 73,4 Private child-minding family 24,2 75,8 Preschool and Out-of-school Care Initiatives
17,2 82,8
Other 50,0 50,0 Subtotal group environment 21,8 78,2 Subtotal family environment 34,9 65,1 Subtotal subsidized 18,6 81,4 Subtotal private 25,5 74,5 Subtotal informal 49,2 50,8
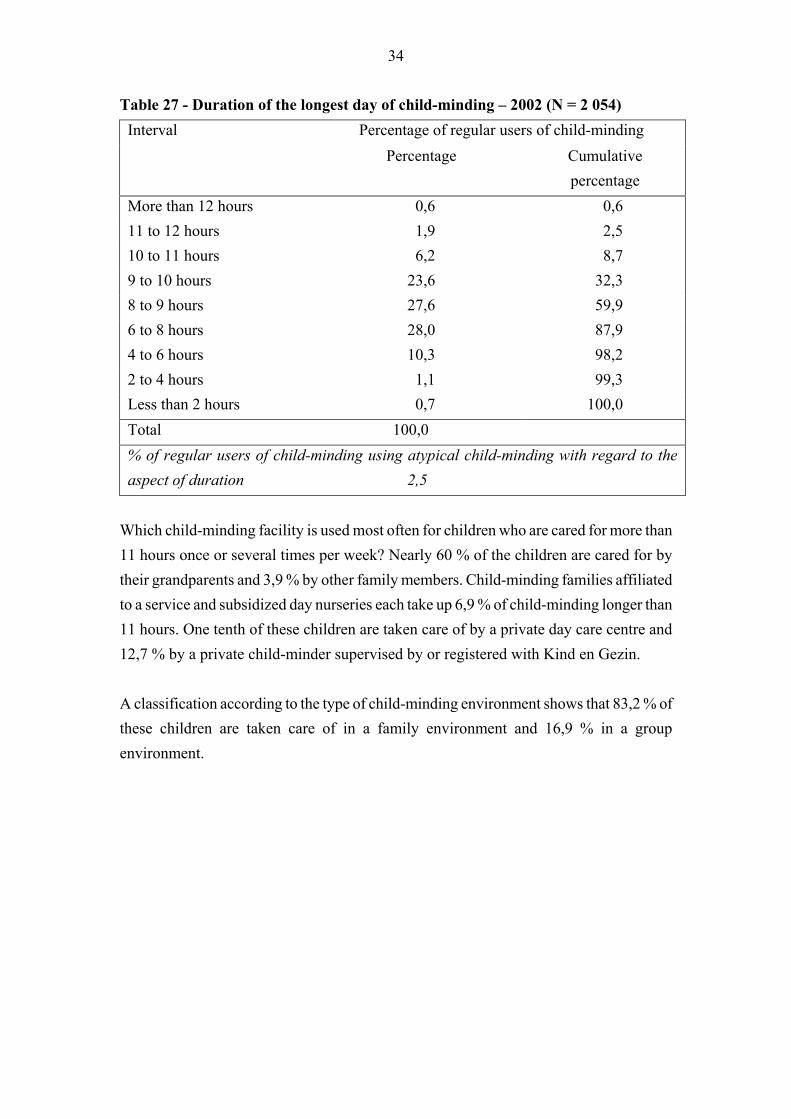
4. Studied Aspects of Atypical Child-minding 4.1. Duration of the Longest Day of Child-minding The survey shows that nearly all children are cared for less than 11 hours per day. Only 2,5% are cared for for more than 11 hours per day. For nearly three quarters of the children the longest day of child-minding was between 6 and 10 hours. The longest day of child-minding for children aged between 3 months and 3 years is averagely 8 hours and 30 minutes.
34
Table 27 - Duration of the longest day of child-minding – 2002 (N = 2 054) Percentage of regular users of child-minding Interval
Percentage Cumulative percentage
More than 12 hours 0,6 0,6 11 to 12 hours 1,9 2,5 10 to 11 hours 6,2 8,7 9 to 10 hours 23,6 32,3 8 to 9 hours 27,6 59,9 6 to 8 hours 28,0 87,9 4 to 6 hours 10,3 98,2 2 to 4 hours 1,1 99,3 Less than 2 hours 0,7 100,0 Total 100,0 % of regular users of child-minding using atypical child-minding with regard to the aspect of duration 2,5
Which child-minding facility is used most often for children who are cared for more than 11 hours once or several times per week? Nearly 60 % of the children are cared for by their grandparents and 3,9 % by other family members. Child-minding families affiliated to a service and subsidized day nurseries each take up 6,9 % of child-minding longer than 11 hours. One tenth of these children are taken care of by a private day care centre and 12,7 % by a private child-minder supervised by or registered with Kind en Gezin. A classification according to the type of child-minding environment shows that 83,2 % of these children are taken care of in a family environment and 16,9 % in a group environment.
35
Table 28 - Main child-minding facility for children who are taken care of for more than 11 hours once or several times per week – 2002 (N = 52) Child-minding facility Percentage of users of long periods of
child-minding (more than 11 hours) Grandparents 58,0 Other family members 3,9 Third parties, no family members 1,7 Private child-minding family, registered or supervised 12,7 Child-minding family affiliated to a service 6,9 Subsidized day care centre 6,9 Private day care centre, registered or supervised 10,0 Total 100,0
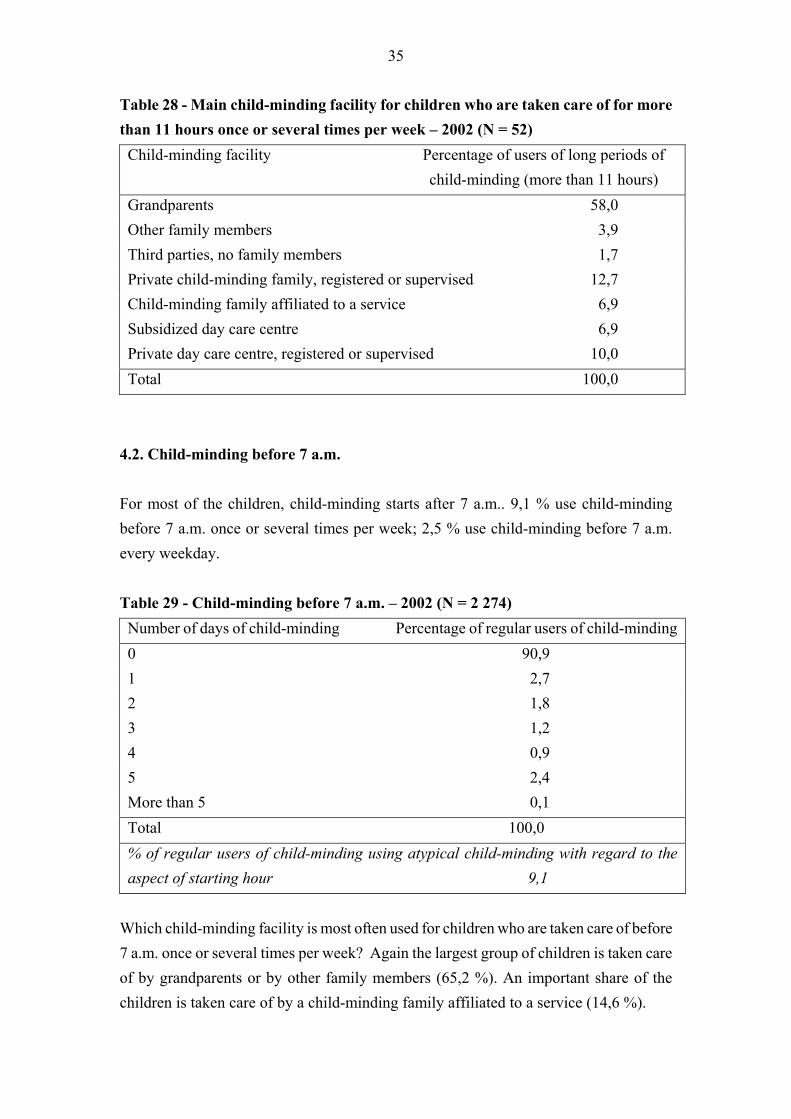
4.2. Child-minding before 7 a.m. For most of the children, child-minding starts after 7 a.m.. 9,1 % use child-minding before 7 a.m. once or several times per week; 2,5 % use child-minding before 7 a.m. every weekday. Table 29 - Child-minding before 7 a.m. – 2002 (N = 2 274) Number of days of child-minding Percentage of regular users of child-minding 0 90,9 1 2,7 2 1,8 3 1,2 4 0,9 5 2,4 More than 5 0,1 Total 100,0 % of regular users of child-minding using atypical child-minding with regard to the aspect of starting hour 9,1
Which child-minding facility is most often used for children who are taken care of before 7 a.m. once or several times per week? Again the largest group of children is taken care of by grandparents or by other family members (65,2 %). An important share of the children is taken care of by a child-minding family affiliated to a service (14,6 %).

36
37
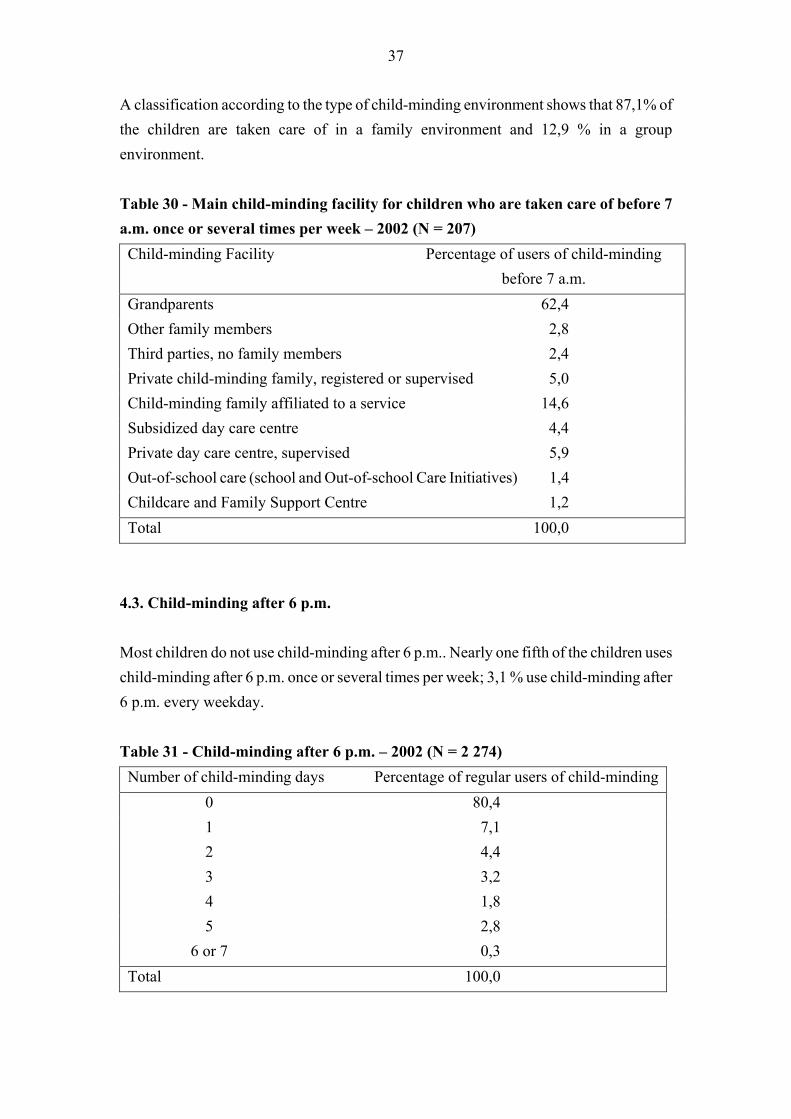
A classification according to the type of child-minding environment shows that 87,1% of the children are taken care of in a family environment and 12,9 % in a group environment. Table 30 - Main child-minding facility for children who are taken care of before 7 a.m. once or several times per week – 2002 (N = 207) Child-minding Facility Percentage of users of child-minding
before 7 a.m. Grandparents 62,4 Other family members 2,8 Third parties, no family members 2,4 Private child-minding family, registered or supervised 5,0 Child-minding family affiliated to a service 14,6 Subsidized day care centre 4,4 Private day care centre, supervised 5,9 Out-of-school care (school and Out-of-school Care Initiatives) 1,4 Childcare and Family Support Centre 1,2 Total 100,0
4.3. Child-minding after 6 p.m. Most children do not use child-minding after 6 p.m.. Nearly one fifth of the children uses child-minding after 6 p.m. once or several times per week; 3,1 % use child-minding after 6 p.m. every weekday. Table 31 - Child-minding after 6 p.m. – 2002 (N = 2 274) Number of child-minding days Percentage of regular users of child-minding
0 80,4 1 7,1 2 4,4 3 3,2 4 1,8 5 2,8
6 or 7 0,3 Total 100,0

38
% of regular users of child-minding using atypical child-minding with regard to the aspect of end hour 19,6
39
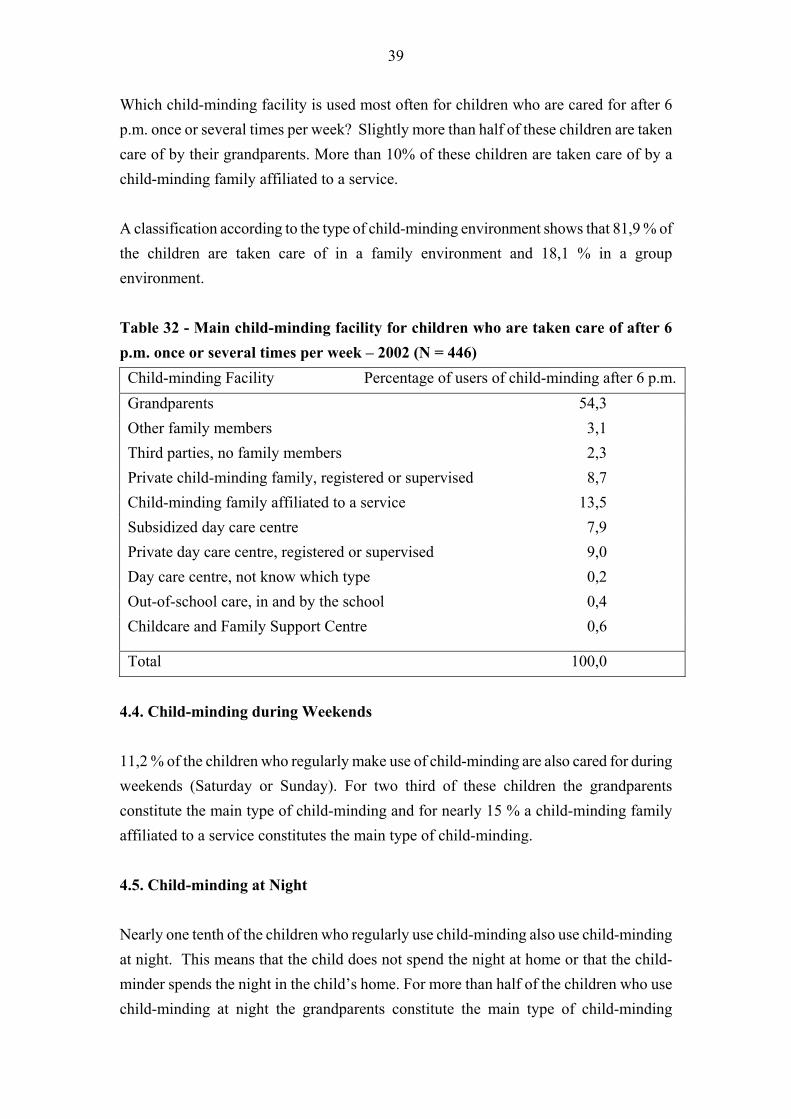
Which child-minding facility is used most often for children who are cared for after 6 p.m. once or several times per week? Slightly more than half of these children are taken care of by their grandparents. More than 10% of these children are taken care of by a child-minding family affiliated to a service. A classification according to the type of child-minding environment shows that 81,9 % of the children are taken care of in a family environment and 18,1 % in a group environment. Table 32 - Main child-minding facility for children who are taken care of after 6 p.m. once or several times per week – 2002 (N = 446) Child-minding Facility Percentage of users of child-minding after 6 p.m.Grandparents 54,3 Other family members 3,1 Third parties, no family members 2,3 Private child-minding family, registered or supervised 8,7 Child-minding family affiliated to a service 13,5 Subsidized day care centre 7,9 Private day care centre, registered or supervised 9,0 Day care centre, not know which type 0,2 Out-of-school care, in and by the school 0,4 Childcare and Family Support Centre 0,6
Total 100,0 4.4. Child-minding during Weekends 11,2 % of the children who regularly make use of child-minding are also cared for during weekends (Saturday or Sunday). For two third of these children the grandparents constitute the main type of child-minding and for nearly 15 % a child-minding family affiliated to a service constitutes the main type of child-minding. 4.5. Child-minding at Night Nearly one tenth of the children who regularly use child-minding also use child-minding at night. This means that the child does not spend the night at home or that the child-minder spends the night in the child’s home. For more than half of the children who use child-minding at night the grandparents constitute the main type of child-minding

40
facility. For nearly 15% of these children the main type of child-minding facility consists of a child-minding family affiliated to a service.
41
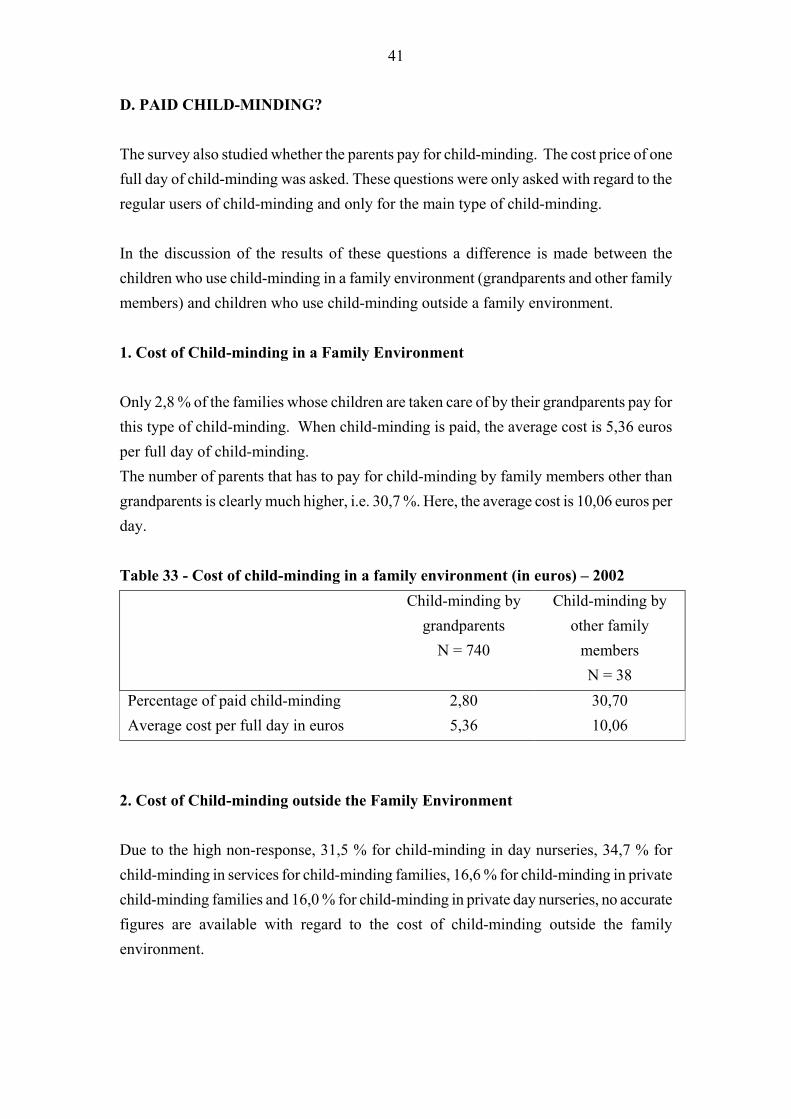
D. PAID CHILD-MINDING? The survey also studied whether the parents pay for child-minding. The cost price of one full day of child-minding was asked. These questions were only asked with regard to the regular users of child-minding and only for the main type of child-minding. In the discussion of the results of these questions a difference is made between the children who use child-minding in a family environment (grandparents and other family members) and children who use child-minding outside a family environment. 1. Cost of Child-minding in a Family Environment Only 2,8 % of the families whose children are taken care of by their grandparents pay for this type of child-minding. When child-minding is paid, the average cost is 5,36 euros per full day of child-minding. The number of parents that has to pay for child-minding by family members other than grandparents is clearly much higher, i.e. 30,7 %. Here, the average cost is 10,06 euros per day. Table 33 - Cost of child-minding in a family environment (in euros) – 2002 Child-minding by
grandparents N = 740
Child-minding by other family
members N = 38
Percentage of paid child-minding 2,80 30,70 Average cost per full day in euros 5,36 10,06
2. Cost of Child-minding outside the Family Environment Due to the high non-response, 31,5 % for child-minding in day nurseries, 34,7 % for child-minding in services for child-minding families, 16,6 % for child-minding in private child-minding families and 16,0 % for child-minding in private day nurseries, no accurate figures are available with regard to the cost of child-minding outside the family environment.
42
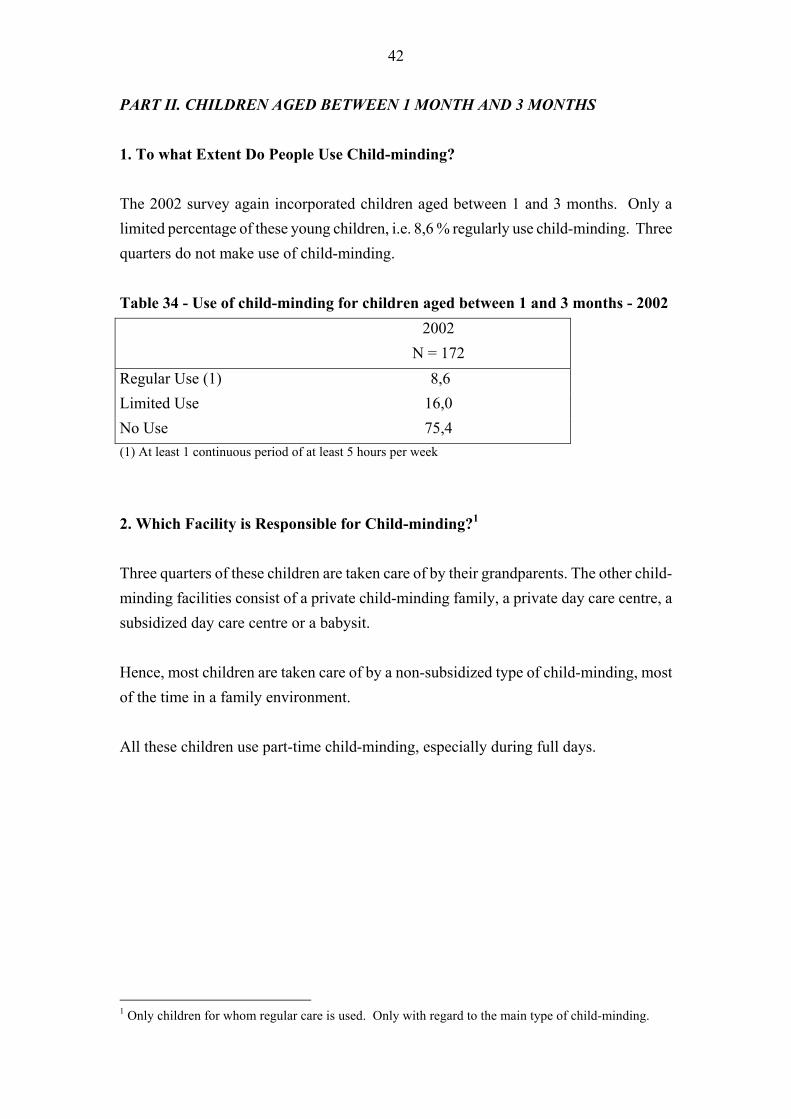
PART II. CHILDREN AGED BETWEEN 1 MONTH AND 3 MONTHS 1. To what Extent Do People Use Child-minding? The 2002 survey again incorporated children aged between 1 and 3 months. Only a limited percentage of these young children, i.e. 8,6 % regularly use child-minding. Three quarters do not make use of child-minding. Table 34 - Use of child-minding for children aged between 1 and 3 months - 2002 2002
N = 172 Regular Use (1) 8,6 Limited Use 16,0 No Use 75,4 (1) At least 1 continuous period of at least 5 hours per week
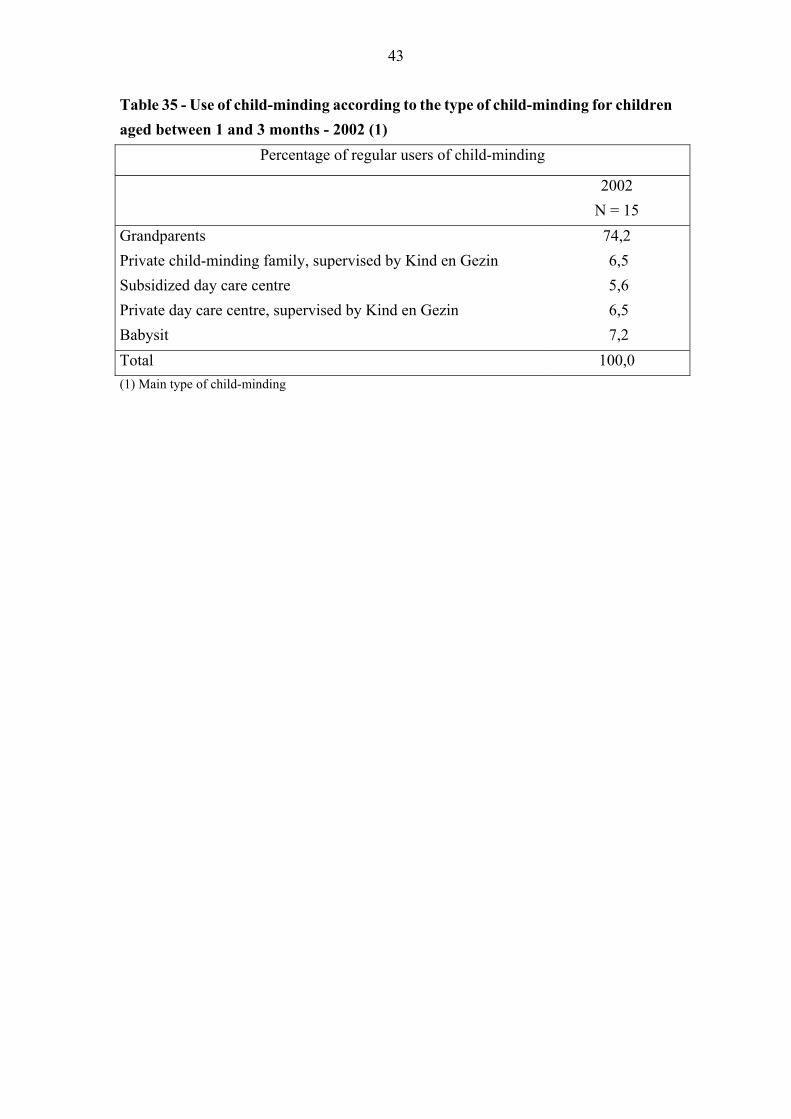
2. Which Facility is Responsible for Child-minding?1 Three quarters of these children are taken care of by their grandparents. The other child-minding facilities consist of a private child-minding family, a private day care centre, a subsidized day care centre or a babysit. Hence, most children are taken care of by a non-subsidized type of child-minding, most of the time in a family environment. All these children use part-time child-minding, especially during full days.
1 Only children for whom regular care is used. Only with regard to the main type of child-minding.
43
Table 35 - Use of child-minding according to the type of child-minding for children aged between 1 and 3 months - 2002 (1)
Percentage of regular users of child-minding
2002 N = 15
Grandparents Private child-minding family, supervised by Kind en Gezin Subsidized day care centre Private day care centre, supervised by Kind en Gezin Babysit
74,2 6,5 5,6 6,5 7,2
Total 100,0 (1) Main type of child-minding

44
PART III. USE OF CHILD-MINDING IN CASE OF ILLNESS 1. Illness Situation: the Occurrence of Illness in Children Aged between 1 Month and 3 Years in the Flemish Region In the autumn of 2002, 17,5 % of the children in the Flemish Region were ill during the week previous to the survey. Half of the children were ill 1 to 3 days. Nearly one third of the children were ill during the entire week. Table 36 – Duration of the illness – 2002 (N = 791) Duration Percentage of all ill children 1 to 3 days 48,1 4 to 5 days 20,9 6 to 7 days 30,9 Total 100,0 Percentage of ill children (N = 4530) 17,5
1.1. According to the Child’s Age Table 37 – Illness according to the Child’s Age - 2002 Age Category % of ill children % of healthy children Total 1 month - 1 years 20,6 79,4 100,0 1 years - 1 y 6 m 19,6 80,4 100,0 1 y 6 m - 2 years 16,3 83,7 100,0 2 years - 2 y 6 m 12,7 87,3 100,0 2 y 6 m - 3 years 16,1 83,9 100,0 Total (N = 4530) 17,5 82,5 100,0
The younger children, children younger than 1 year and children aged between 1 and 1,5 years, are most often ill. Children aged between 2 and 2,5 years are least often ill. The differences in illness according to the child’s age are statistically significant1.
1 χ² = 26,923 df = 4 p ≤ 0,001 (s.)

45

46
1.2. According to the Type of Child-minding Most Commonly Used The survey also examined whether the illness differs according to whether the child normally uses child-minding and/or attends school. Schoolgoing children who do not make use of child-minding and children who do not yet attend school and regularly use child-minding are most often ill. The other categories show a similar percentage of illness1. Table 38 – Health of the child according to whether the child normally uses child-minding and/or attends school – 2002 Condition of the child with regard to child-minding and school
% of ill children
% of healthy children
Total
Schoolgoing and no use of child-minding 21,7 78,3 100,0 Schoolgoing and limited use of child-minding 15,8 84,2 100,0 Schoolgoing and regular use of child-minding 14,5 85,5 100,0 Not schoolgoing and no use of child-minding 15,8 84,2 100,0 Not schoolgoing and limited use of child-minding 15,9 84,1 100,0 Not schoolgoing and regular use of child-minding 19,0 81,0 100,0 Total (N = 4 530) 17,5 82,5 100,0
2. Child-minding in Case of Illness 2.1. Changes in the Child-minding Situation The regular users of child-minding were asked whether the child-minding situations changed due to the fact that the child was ill. For 60,6 % of the parents the child-minding situations remained unchanged, despite their child’s illness. With regard to the total group of regular users of child-care this means that in the course of one week 7,4 % of the children’s child-minding situations changed due to their illness. Most changes occur in the group of children who are taken care of by a subsidized day care centre. The least changes occurred for children who are taken care of by the
1 χ² = 11,248 df = 5 p = 0,047 (ns.)
47
informal network. This difference is significant 1.
1 χ² = 36,050 df = 4 p ≤ 0,001 (s.)
48
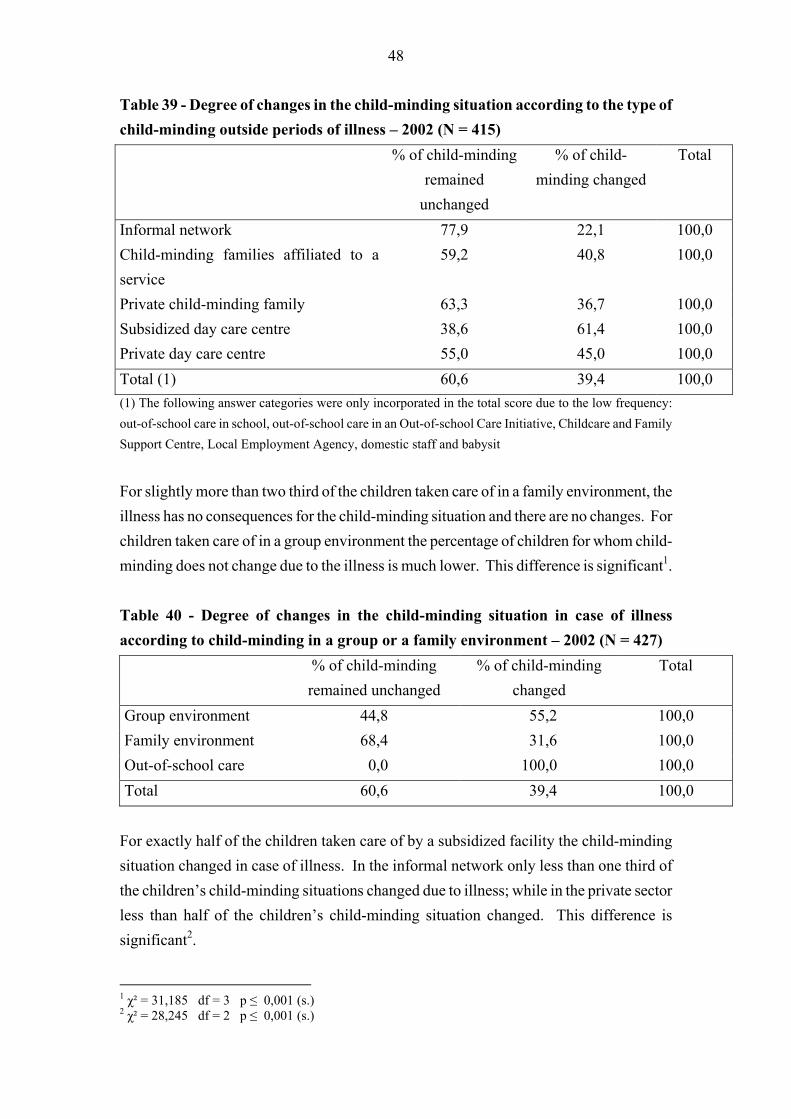
Table 39 - Degree of changes in the child-minding situation according to the type of child-minding outside periods of illness – 2002 (N = 415) % of child-minding
remained unchanged
% of child-minding changed
Total
Informal network 77,9 22,1 100,0 Child-minding families affiliated to a service
59,2 40,8 100,0
Private child-minding family 63,3 36,7 100,0 Subsidized day care centre 38,6 61,4 100,0 Private day care centre 55,0 45,0 100,0 Total (1) 60,6 39,4 100,0 (1) The following answer categories were only incorporated in the total score due to the low frequency: out-of-school care in school, out-of-school care in an Out-of-school Care Initiative, Childcare and Family Support Centre, Local Employment Agency, domestic staff and babysit
For slightly more than two third of the children taken care of in a family environment, the illness has no consequences for the child-minding situation and there are no changes. For children taken care of in a group environment the percentage of children for whom child-minding does not change due to the illness is much lower. This difference is significant1. Table 40 - Degree of changes in the child-minding situation in case of illness according to child-minding in a group or a family environment – 2002 (N = 427) % of child-minding
remained unchanged % of child-minding
changed Total
Group environment 44,8 55,2 100,0 Family environment 68,4 31,6 100,0 Out-of-school care 0,0 100,0 100,0 Total 60,6 39,4 100,0
For exactly half of the children taken care of by a subsidized facility the child-minding situation changed in case of illness. In the informal network only less than one third of the children’s child-minding situations changed due to illness; while in the private sector less than half of the children’s child-minding situation changed. This difference is significant2. 1 χ² = 31,185 df = 3 p ≤ 0,001 (s.) 2 χ² = 28,245 df = 2 p ≤ 0,001 (s.)

49
50
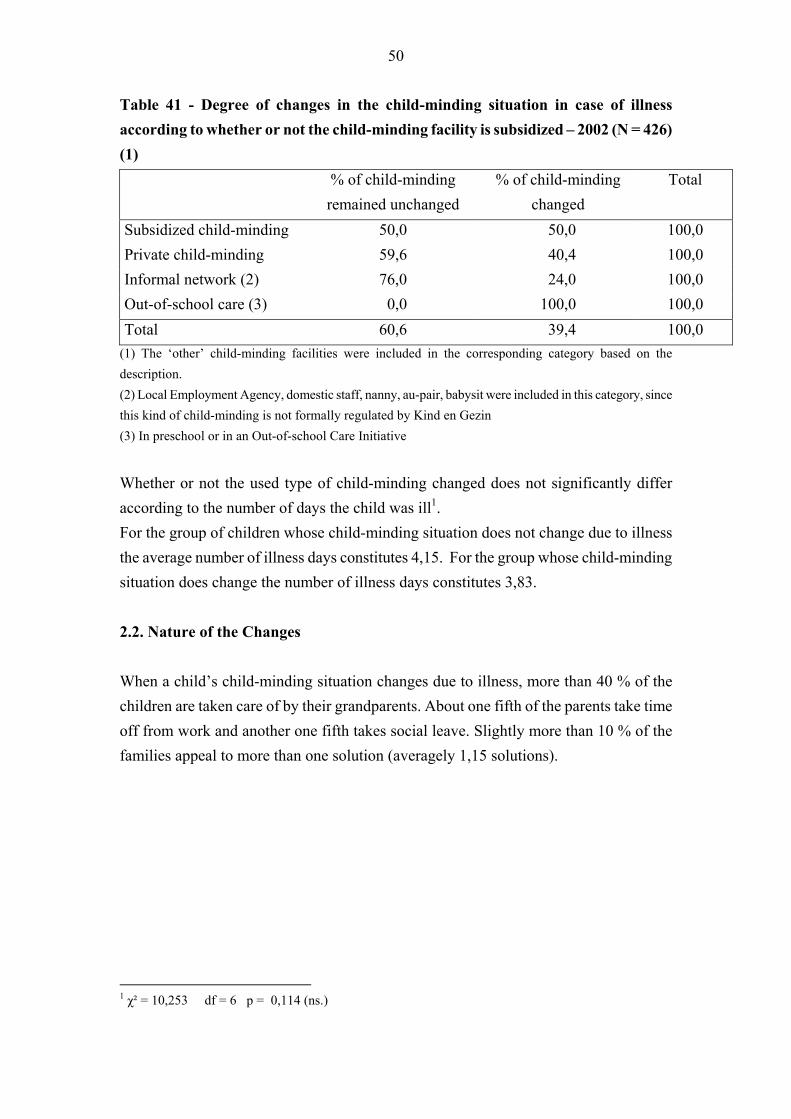
Table 41 - Degree of changes in the child-minding situation in case of illness according to whether or not the child-minding facility is subsidized – 2002 (N = 426) (1) % of child-minding
remained unchanged % of child-minding
changed Total
Subsidized child-minding 50,0 50,0 100,0 Private child-minding 59,6 40,4 100,0 Informal network (2) 76,0 24,0 100,0 Out-of-school care (3) 0,0 100,0 100,0 Total 60,6 39,4 100,0
(1) The ‘other’ child-minding facilities were included in the corresponding category based on the description. (2) Local Employment Agency, domestic staff, nanny, au-pair, babysit were included in this category, since this kind of child-minding is not formally regulated by Kind en Gezin (3) In preschool or in an Out-of-school Care Initiative
Whether or not the used type of child-minding changed does not significantly differ according to the number of days the child was ill1. For the group of children whose child-minding situation does not change due to illness the average number of illness days constitutes 4,15. For the group whose child-minding situation does change the number of illness days constitutes 3,83. 2.2. Nature of the Changes When a child’s child-minding situation changes due to illness, more than 40 % of the children are taken care of by their grandparents. About one fifth of the parents take time off from work and another one fifth takes social leave. Slightly more than 10 % of the families appeal to more than one solution (averagely 1,15 solutions).
1 χ² = 10,253 df = 6 p = 0,114 (ns.)
51
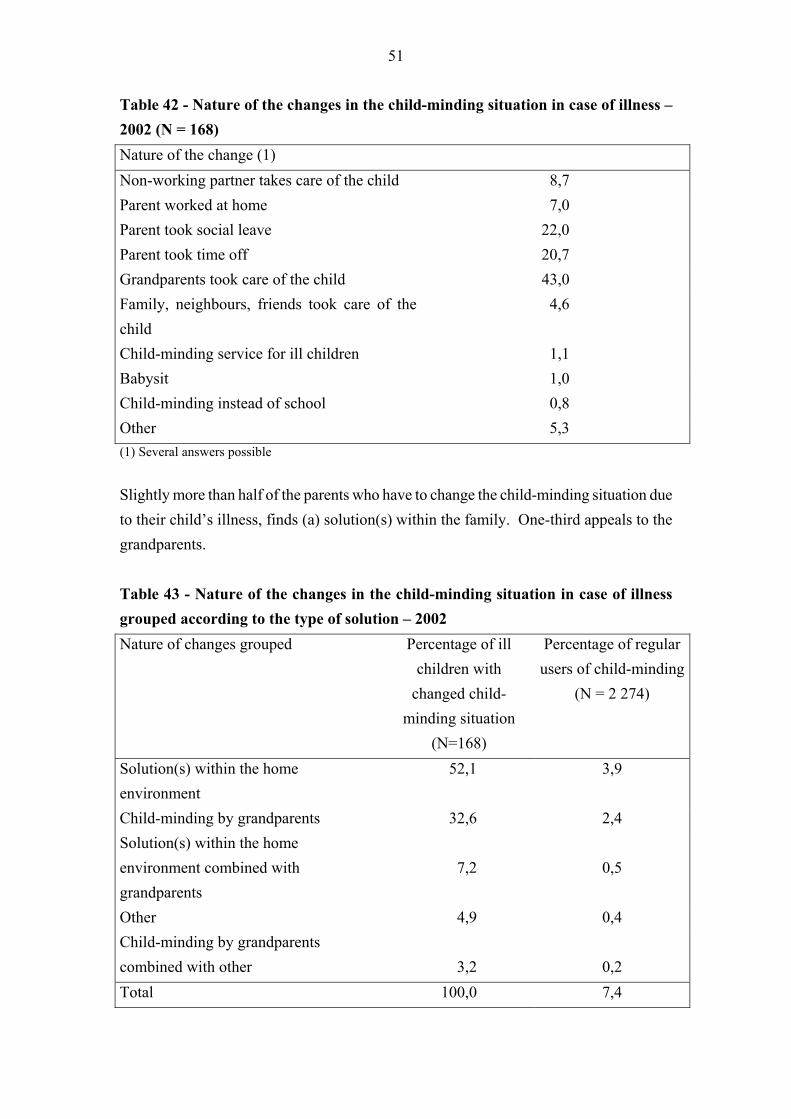
Table 42 - Nature of the changes in the child-minding situation in case of illness – 2002 (N = 168) Nature of the change (1) Non-working partner takes care of the child 8,7 Parent worked at home 7,0 Parent took social leave 22,0 Parent took time off 20,7 Grandparents took care of the child 43,0 Family, neighbours, friends took care of the child
4,6
Child-minding service for ill children 1,1 Babysit 1,0 Child-minding instead of school 0,8 Other 5,3 (1) Several answers possible
Slightly more than half of the parents who have to change the child-minding situation due to their child’s illness, finds (a) solution(s) within the family. One-third appeals to the grandparents. Table 43 - Nature of the changes in the child-minding situation in case of illness grouped according to the type of solution – 2002 Nature of changes grouped Percentage of ill
children with changed child-
minding situation (N=168)
Percentage of regular users of child-minding
(N = 2 274)
Solution(s) within the home environment
52,1 3,9
Child-minding by grandparents 32,6 2,4 Solution(s) within the home environment combined with grandparents
7,2
0,5
Other 4,9 0,4 Child-minding by grandparents combined with other
3,2
0,2
Total 100,0 7,4

52
53
CONCLUSION In the autumn of 2002, more than 63 % of the children aged between 3 months and 3 years made use of child-minding: 52,2 % are regularly taken care of by family, a child-minding family or a day care centre. This means at least one continuous period of 5 hours per week for children who do not yet attend school or at least once per week for schoolgoing children aged between 2,5 and 3 years. 11,1 % make limited use of child-minding. The percentage of regular users has increased with regard to the 2001 survey, as well as the percentage of limited users. The percentage of children who do not use child-minding has dropped. Children aged between 1,5 and 2 years make most frequently use of child-minding. The lower use of child-minding for children aged between 3 and 6 months is significant. Only 34,8 % regularly use child-minding; 53,8 % do not use child-minding at all. From the age of 2,5 years a lot of children go to preschool and therefore the regular use of child-minding is lower. The regular use of child-minding for this age category constitutes 41,8 %. However, the regular use for this group has increased with about 10 % with regard to the 2001 survey. The degree of use of child-minding differs significantly according to the province and according to the district. Children in Flemish Brabant make most frequently use of child-minding with 60,5 %. The provinces of Limburg and Antwerp have the lowest share of users. The differences between the provinces have however become smaller with regard to the 2001 survey. 7 out of 10 children who regularly use child-minding, make use of part-time child-minding. In comparison with 2001 the share of full-time child-minding has increased minimally. On Wednesdays the number of children who do not use child-minding is higher than on other days of the week. On Tuesdays the largest number of children uses child-minding. For the group of regular users the main type of child-minding are family members: 34,3 % of the children are taken care of by their grandparents and 1,8 % by another family member, together 36,1 %. The child-minding families affiliated to a service constitute the second most important type of child-minding and take up 26,3 %. The subsidized day nurseries take up the third place (15,6 %).
54
The relative share of the various types of child-minding has changed, but not significantly. The survey shows an increase in child-minding by grandparents and other family members and a decrease of child-minding by child-minding families affiliated to a service, while the share of private child-minding families remains unchanged. Child-minding by subsidized day nurseries has dropped slightly, while child-minding by private day nurseries has increased. The relative share of child-minding subsidized by Kind en Gezin constituted 42,2 % in 2002, i.e. an insignificant decrease with regard to 2001. The strong provincial differences remain with regard to the share of child-minding facilities subsidized by Kind en Gezin. The relative share of child-minding in a family environment has increased with regard to 2001 and constitutes in 2002 73,7 %. Again the differences according to the province remain. Children who make rather limited use of child-minding are mainly taken care of by their grandparents. In comparison with the regular users this group consists of twice as much children. Both children from a disadvantaged family and ethnic minority children make less frequently use of child-minding with regard to the respective families that are not disadvantaged and the Belgian families. Both groups constitute slightly less than 20 %. Children from a disadvantaged family are mainly taken care of by their grandparents or a child-minding family affiliated to a service. For ethnic minority children the main types of child-minding facilities consist of grandparents and subsidized day nurseries. 31,4 % of the children aged between 3 months and 3 years who regularly use child-minding make use of atypical child-minding: 2,5 % of the children are taken care of for more than 11 hours once or several days per week, 9,1% are taken care of before 7 a.m. once or several times per week and 19,6 % are taken care of after 6 p.m. once or several times per week, 9,7 % are taken care of at night and 11,2 % during weekends. The use of atypical child-minding does not significantly differ according to the child’s age or according to the province. There is however a significant difference according to the type of child-minding facility used: children who are taken care of by the informal network more frequently make use of atypical child-minding. Children who are taken care of in a family environment also make more frequently use of atypical child-minding.
55
Only a very limited number of families whose children are taken care of by their grandparents pay for child-minding, averagely 5,36 euros per full day. The number of parents that has to pay for child-minding by other family members than the grandparents is much higher. These families pay an average of 10,06 euros per full day. Only a very limited number of children aged between 1 and 3 months regularly uses child-minding, i.e. 8,6 %. Three quarters of these children are taken care of by their grandparents. This concerns part-time child-minding. 17,5 % of the children were ill in the week previous to the survey. In nearly half of the cases the children were ill during 1 to 3 days. Children younger than 1,5 years are most often ill. However, there is no significant difference in illness according to the child-minding situation. For 60 % of the parents the child-minding situation remained unchanged during their child’s illness. Most of the changes occur for children who are taken care of by a subsidized day care centre. For children who are taken care of by the informal network, the least changes occur. This difference is significant. The child-minding situations does also change more often in case of illness for children who are taken care of in a group environment with regard to children who are taken care of in a family environment. Also the number of children whose child-minding situation changes in case of illness is highest in subsidized facilities and lowest in the informal network. Slightly more than half of the parents who change the child-minding situation due to their child’s illness find a solution within the family environment. In most cases the parent takes time off or takes social leave. One third of these children are taken care of by their grandparents.
56
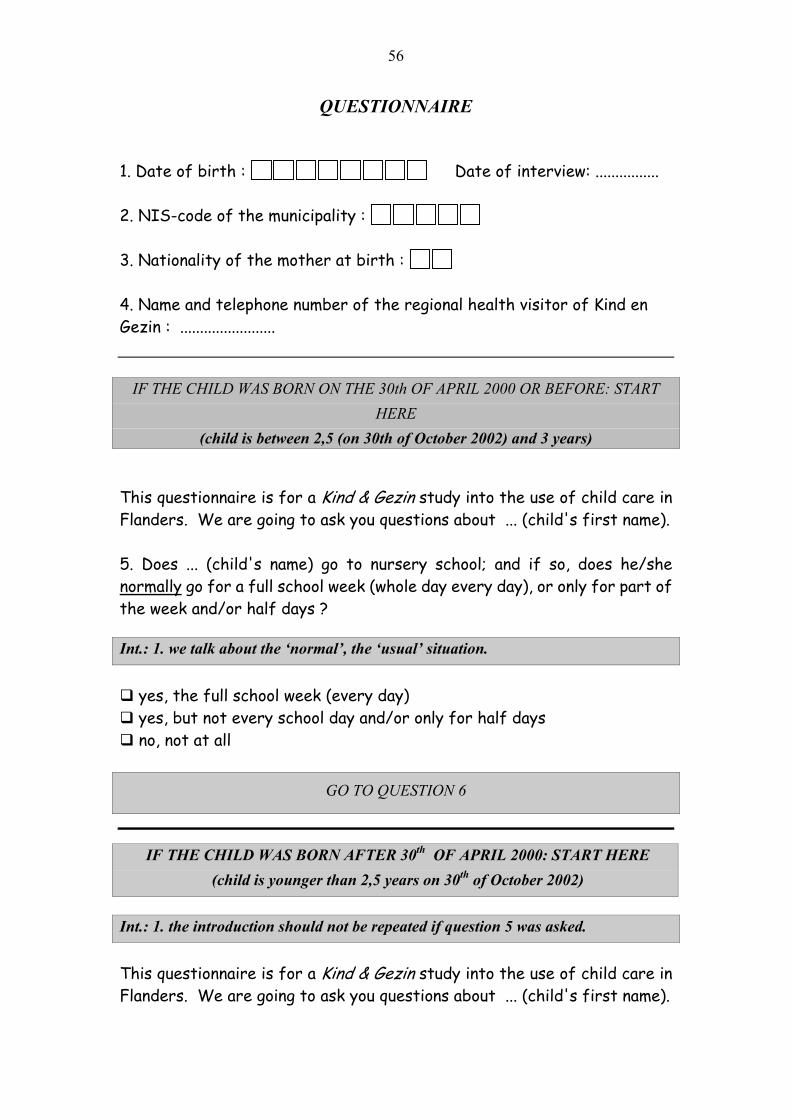
QUESTIONNAIRE 1. Date of birth : Date of interview: ................ 2. NIS-code of the municipality : 3. Nationality of the mother at birth : 4. Name and telephone number of the regional health visitor of Kind en Gezin : ........................
IF THE CHILD WAS BORN ON THE 30th OF APRIL 2000 OR BEFORE: START HERE
(child is between 2,5 (on 30th of October 2002) and 3 years) This questionnaire is for a Kind & Gezin study into the use of child care in Flanders. We are going to ask you questions about ... (child's first name). 5. Does ... (child's name) go to nursery school; and if so, does he/she normally go for a full school week (whole day every day), or only for part of the week and/or half days ? Int.: 1. we talk about the ‘normal’, the ‘usual’ situation.
yes, the full school week (every day) yes, but not every school day and/or only for half days no, not at all
GO TO QUESTION 6
IF THE CHILD WAS BORN AFTER 30th OF APRIL 2000: START HERE (child is younger than 2,5 years on 30th of October 2002)
Int.: 1. the introduction should not be repeated if question 5 was asked. This questionnaire is for a Kind & Gezin study into the use of child care in Flanders. We are going to ask you questions about ... (child's first name).
57
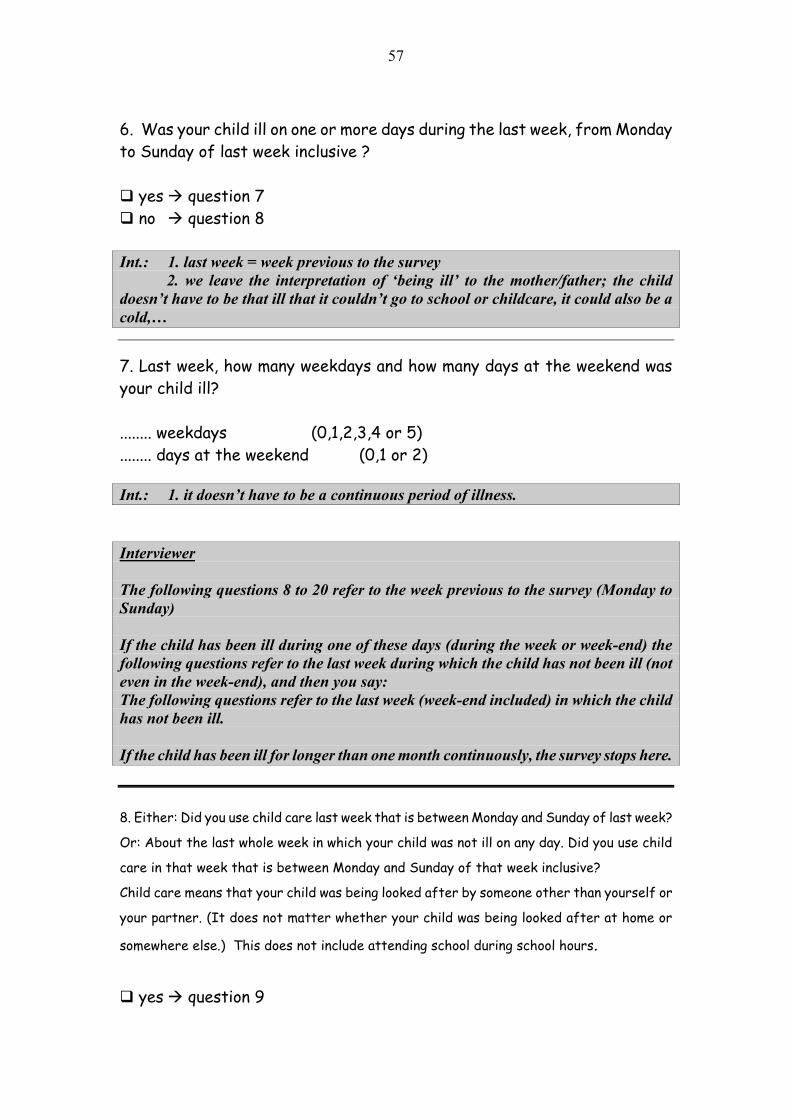
6. Was your child ill on one or more days during the last week, from Monday to Sunday of last week inclusive ?
yes question 7 no question 8
Int.: 1. last week = week previous to the survey
2. we leave the interpretation of ‘being ill’ to the mother/father; the child doesn’t have to be that ill that it couldn’t go to school or childcare, it could also be a cold,…
7. Last week, how many weekdays and how many days at the weekend was your child ill? ........ weekdays (0,1,2,3,4 or 5) ........ days at the weekend (0,1 or 2) Int.: 1. it doesn’t have to be a continuous period of illness. Interviewer The following questions 8 to 20 refer to the week previous to the survey (Monday to Sunday) If the child has been ill during one of these days (during the week or week-end) the following questions refer to the last week during which the child has not been ill (not even in the week-end), and then you say: The following questions refer to the last week (week-end included) in which the child has not been ill. If the child has been ill for longer than one month continuously, the survey stops here. 8. Either: Did you use child care last week that is between Monday and Sunday of last week?
Or: About the last whole week in which your child was not ill on any day. Did you use child
care in that week that is between Monday and Sunday of that week inclusive?
Child care means that your child was being looked after by someone other than yourself or
your partner. (It does not matter whether your child was being looked after at home or
somewhere else.) This does not include attending school during school hours.
yes question 9

58
no = not at all STOP SURVEY Int. 1. including childcare by the grandparents at the child’s home 2. Also including: before and after school hours 3. Also including: babysit IF THE CHILD DOES NOT GO TO SCHOOL YET OR NOT YET FULLTIME (child is younger than 2,5 years or child is between 2,5 and 3 years: see question 5) 9a. About the child care you used last week, did it include at least one continuous period of care of 5 hours or more ? Int.: 1. it has to be at least one continuous period of at least 5 hours, it cannot be the sum of various periods (ex. 2 + 3 hours on one day)
yes, at least one continuous period of care of 5 hours or more no go to question 15, then question 16 and then STOP survey.
IF THE CHILD GOES TO SCHOOL FULLTIME (see question 5) 9b. About the child care you used last week, did it include at least one period of care before or after school or on Wednesday afternoon, or a continuous period of care of 5 hours or more on another day ? Int.: 1. note ‘yes’ if one of the four possibilities is met (before school, after school, Wednesday afternoon, 5 hours continuous).
yes, at least one period of care before or after school, on Wednesday afternoon or 5 hours' continuous
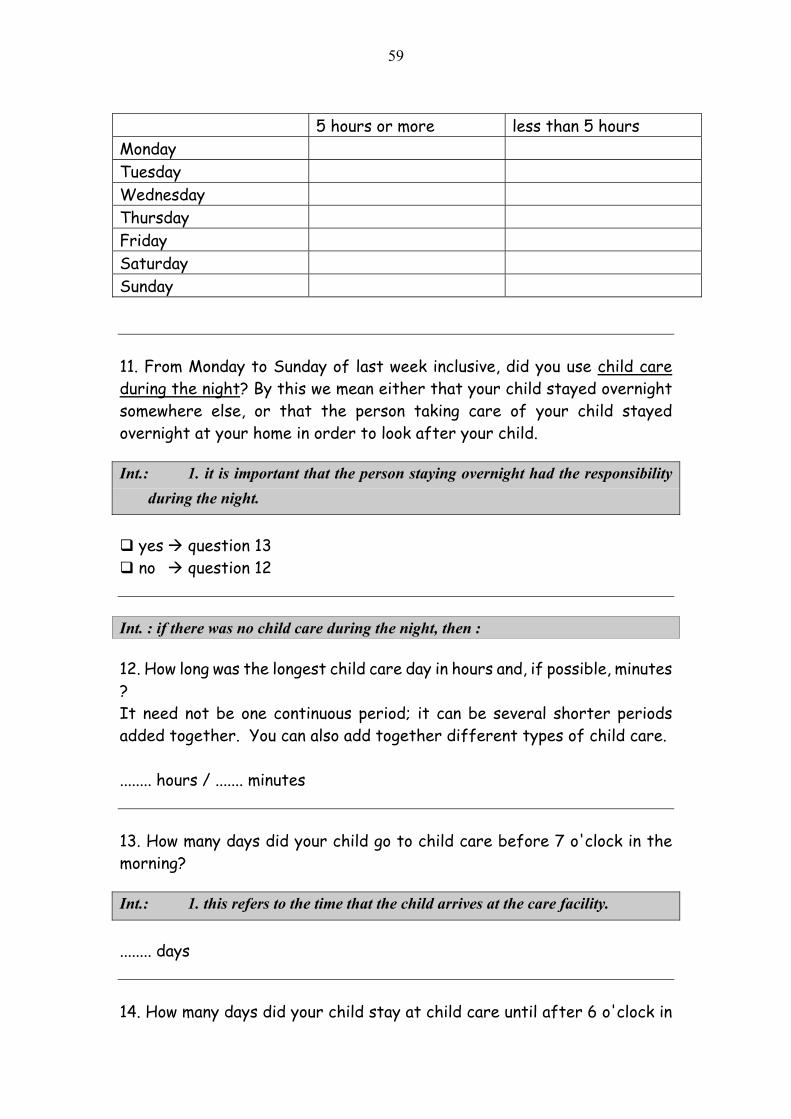
no go to question 15, then question 16 and then STOP survey. 10. Now I would like to go through the different days of the week. For each day can you say whether you used child care for 5 hours or more on that day. It need not be a continuous period of 5 hours; it can be several shorter periods added together. You can also add together different types of child care. Put a cross in the appropriate column for each day. Int.: 1. it can be the sum of several different types of child care (ex. sum of (a)
grandparents before school + (b) after school in preschool + (c) neighbor in the evening).
59
5 hours or more less than 5 hours Monday Tuesday Wednesday Thursday Friday Saturday Sunday 11. From Monday to Sunday of last week inclusive, did you use child care during the night? By this we mean either that your child stayed overnight somewhere else, or that the person taking care of your child stayed overnight at your home in order to look after your child. Int.: 1. it is important that the person staying overnight had the responsibility
during the night.
yes question 13 no question 12
Int. : if there was no child care during the night, then : 12. How long was the longest child care day in hours and, if possible, minutes ? It need not be one continuous period; it can be several shorter periods added together. You can also add together different types of child care. ........ hours / ....... minutes 13. How many days did your child go to child care before 7 o'clock in the morning? Int.: 1. this refers to the time that the child arrives at the care facility.
........ days 14. How many days did your child stay at child care until after 6 o'clock in

60
the evening? Int.: 1. . this refers to the time that the child leaves at the care facility.
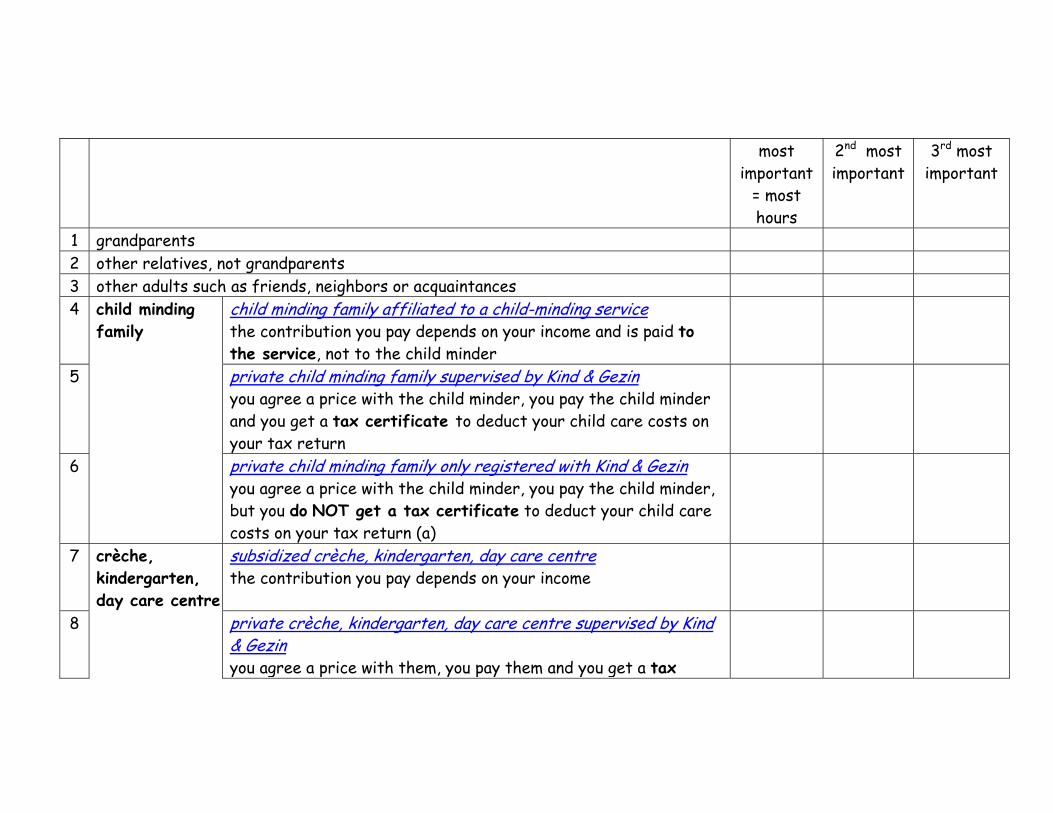
........ days 15. When we look at the number of hours that your child was looked after last week, who provided the most care or where was your child looked after the most ? (Put cross in the right column) Int.: 1. open questions.
2. let the parent answer and then ask the question : Who or which facility came in second and third place? (Put cross in columns that apply, if any) Int.: 1. there doesn’t have to be a second or a third facility.
most
important = most hours
2nd most important
3rd most important
1 grandparents2 other relatives, not grandparents 3 other adults such as friends, neighbors or acquaintances 4 child minding
family child minding family affiliated to a child-minding service the contribution you pay depends on your income and is paid to the service, not to the child minder
5 private child minding family supervised by Kind & Gezin you agree a price with the child minder, you pay the child minder and you get a tax certificate to deduct your child care costs on your tax return
6 private child minding family only registered with Kind & Gezin you agree a price with the child minder, you pay the child minder, but you do NOT get a tax certificate to deduct your child care costs on your tax return (a)
7 crèche, kindergarten, day care centre
subsidized crèche, kindergarten, day care centre the contribution you pay depends on your income
8 private crèche, kindergarten, day care centre supervised by Kind & Gezin you agree a price with them, you pay them and you get a tax
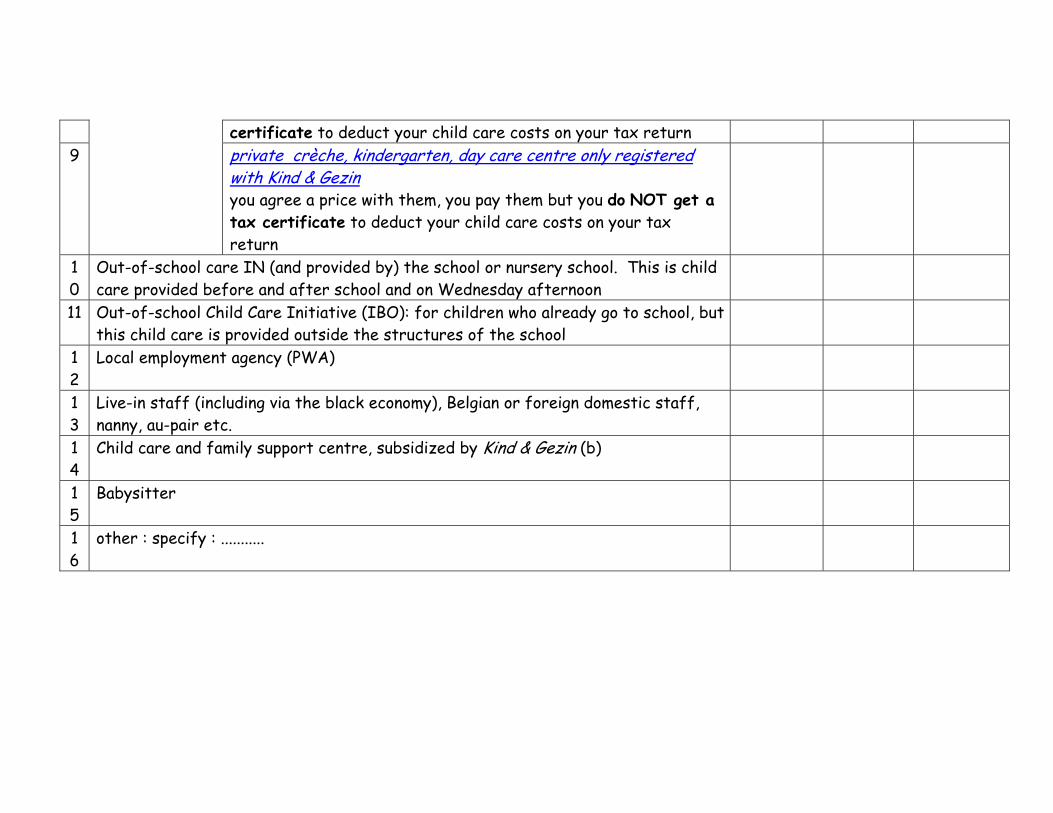
certificate to deduct your child care costs on your tax return 9 private crèche, kindergarten, day care centre only registered
with Kind & Gezin you agree a price with them, you pay them but you do NOT get a tax certificate to deduct your child care costs on your tax return
10
Out-of-school care IN (and provided by) the school or nursery school. This is child care provided before and after school and on Wednesday afternoon
11 Out-of-school Child Care Initiative (IBO): for children who already go to school, but this child care is provided outside the structures of the school
12
Local employment agency (PWA)
13
Live-in staff (including via the black economy), Belgian or foreign domestic staff, nanny, au-pair etc.
14
Child care and family support centre, subsidized by Kind & Gezin (b)
15
Babysitter
16
other : specify : ...........
Int. Question 16should only be asked if the main type of child care is 1 grandparents 2 other relatives, not grandparents 3 other adults, such as friends, neighbours, acquaintances 15 babysitter 16 other
16. Where did ... (Int.: name the main type of child care) look after your child? Was it at your home or somewhere else ?
at the parent's home somewhere else (home of the grandparent, other relative, other person)
Int. The questions 17, 17b en 18 refer to the main type of child care, whoever this may be 17. Was your child cared for last week by/at ... (Int.: name the main type of child care) for at least one day for a continuous period of at least 5 hours ?
yes go to question 17b no or STOP survey or go to question 19
17b. Did you have to pay for the child care provided last week by .... (Int.: name the main type of child care)?
yes go to question 18 no or STOP survey or go to question 19

18. How much did you pay for the child care provided by ... (Int.: name the main type of child care) for a full day? ........ BEF for a full day ........ euros for a full day
Int. The following questions should only be asked if the child has been ill in the week previous to the survey (‘yes’ to question 6) AND when also question 9a or question 9b was answered with ‘yes’. 19. On the days when your child was ill last week, was he/she looked after as usual or did you change your child care arrangements on account of your child's illness (this also includes the child not going to school as usual)?
yes, everything stayed the same as usual; nothing changed STOP survey Int.: if the parents take care of the child during the weekend and the child has only been ill during the weekend, this answer should be marked.
no, I had to change my child care arrangements go to question 20
Int. 1. either for part of the week or for the whole week 2. this change of arrangements has to be the direct result of the illness
of the child and not because for instance the grandparents planned a trip.
20. What did you do, who looked after your child? Int. 1. Several answers are possible.
my partner does not work and looked after my child I (or my partner) worked at home (work to be understood here as to do
with the parent's occupation/profession) I (or my partner) took leave for social or family reasons I (or my partner) took one or more days' holiday or day(s) off in lieu grandparents looked after my child

others (relatives, friends, neighbors etc.) looked after my child I used an organization that provides child care for sick children I arranged a babysitter my child went to his/her child care (child minder, day care centre)
instead of school other solution, specify ......
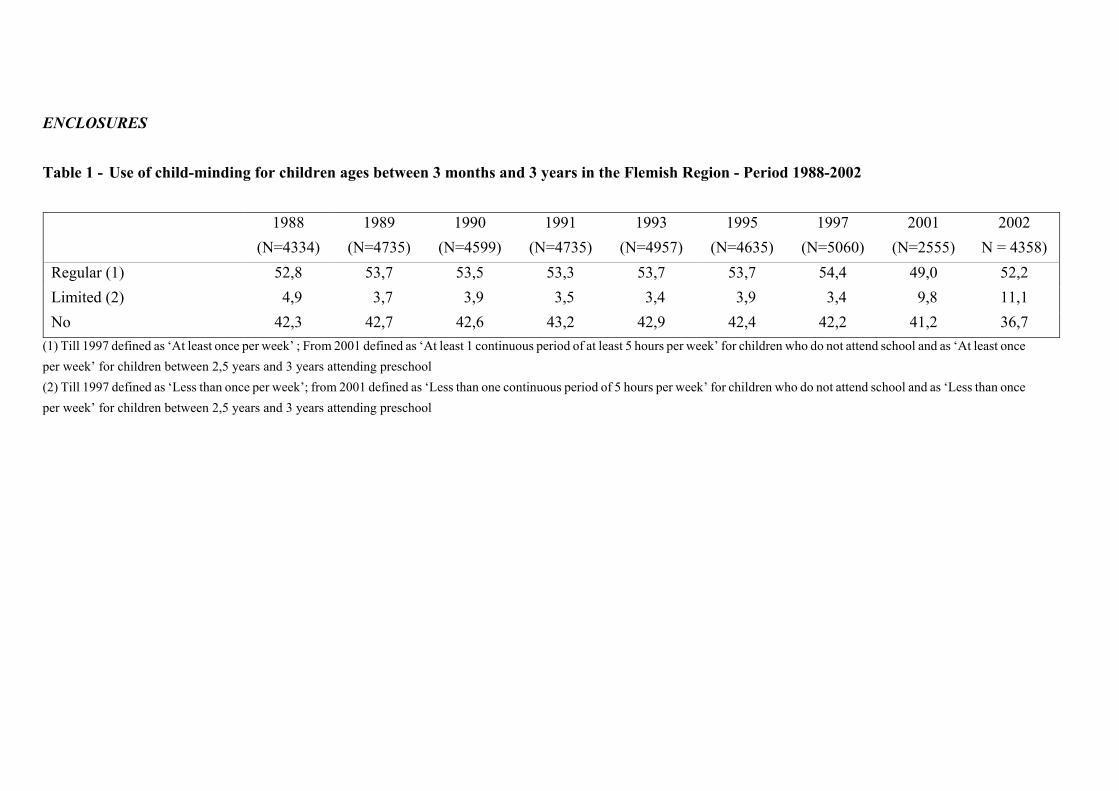
ENCLOSURES
Table 1 - Use of child-minding for children ages between 3 months and 3 years in the Flemish Region - Period 1988-2002
1988 (N=4334)
1989 (N=4735)
1990 (N=4599)
1991 (N=4735)
1993 (N=4957)
1995 (N=4635)
1997 (N=5060)
2001 (N=2555)
2002 N = 4358)
Regular (1) 52,8 53,7 53,5 53,3 53,7 53,7 54,4 49,0 52,2Limited (2) 4,9 3,7 3,9 3,5 3,4 3,9 3,4 9,8 11,1 No 42,3 42,7 42,6 43,2 42,9 42,4 42,2 41,2 36,7
(1) Till 1997 defined as ‘At least once per week’ ; From 2001 defined as ‘At least 1 continuous period of at least 5 hours per week’ for children who do not attend school and as ‘At least once per week’ for children between 2,5 years and 3 years attending preschool (2) Till 1997 defined as ‘Less than once per week’; from 2001 defined as ‘Less than one continuous period of 5 hours per week’ for children who do not attend school and as ‘Less than once per week’ for children between 2,5 years and 3 years attending preschool
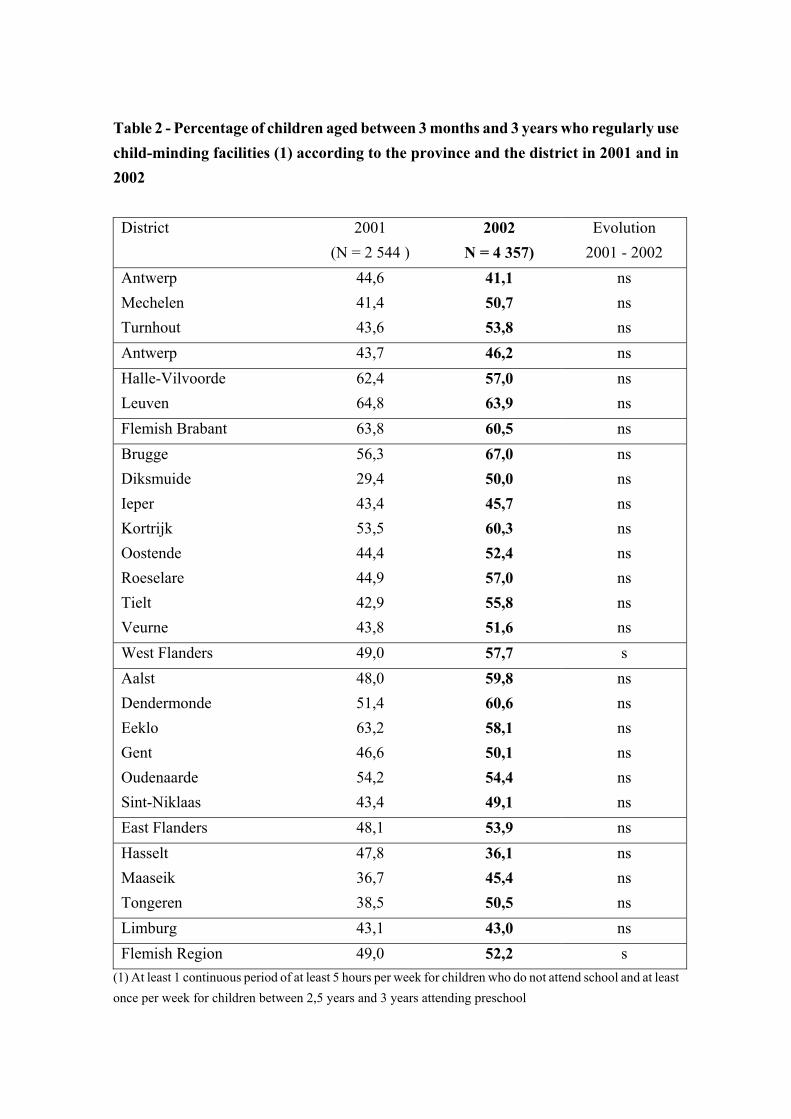
Table 2 - Percentage of children aged between 3 months and 3 years who regularly use child-minding facilities (1) according to the province and the district in 2001 and in 2002 District 2001
(N = 2 544 ) 2002
N = 4 357) Evolution
2001 - 2002 Antwerp Mechelen Turnhout
44,6 41,4 43,6
41,1 50,7 53,8
ns ns ns
Antwerp 43,7 46,2 ns Halle-Vilvoorde Leuven
62,4 64,8
57,0 63,9
ns ns
Flemish Brabant 63,8 60,5 ns Brugge Diksmuide Ieper Kortrijk Oostende Roeselare Tielt Veurne
56,3 29,4 43,4 53,5 44,4 44,9 42,9 43,8
67,0 50,0 45,7 60,3 52,4 57,0 55,8 51,6
ns ns ns ns ns ns ns ns
West Flanders 49,0 57,7 s Aalst Dendermonde Eeklo Gent Oudenaarde Sint-Niklaas
48,0 51,4 63,2 46,6 54,2 43,4
59,8 60,6 58,1 50,1 54,4 49,1
ns ns ns ns ns ns
East Flanders 48,1 53,9 ns Hasselt Maaseik Tongeren
47,8 36,7 38,5
36,1 45,4 50,5
ns ns ns
Limburg 43,1 43,0 ns Flemish Region 49,0 52,2 s
(1) At least 1 continuous period of at least 5 hours per week for children who do not attend school and at least once per week for children between 2,5 years and 3 years attending preschool
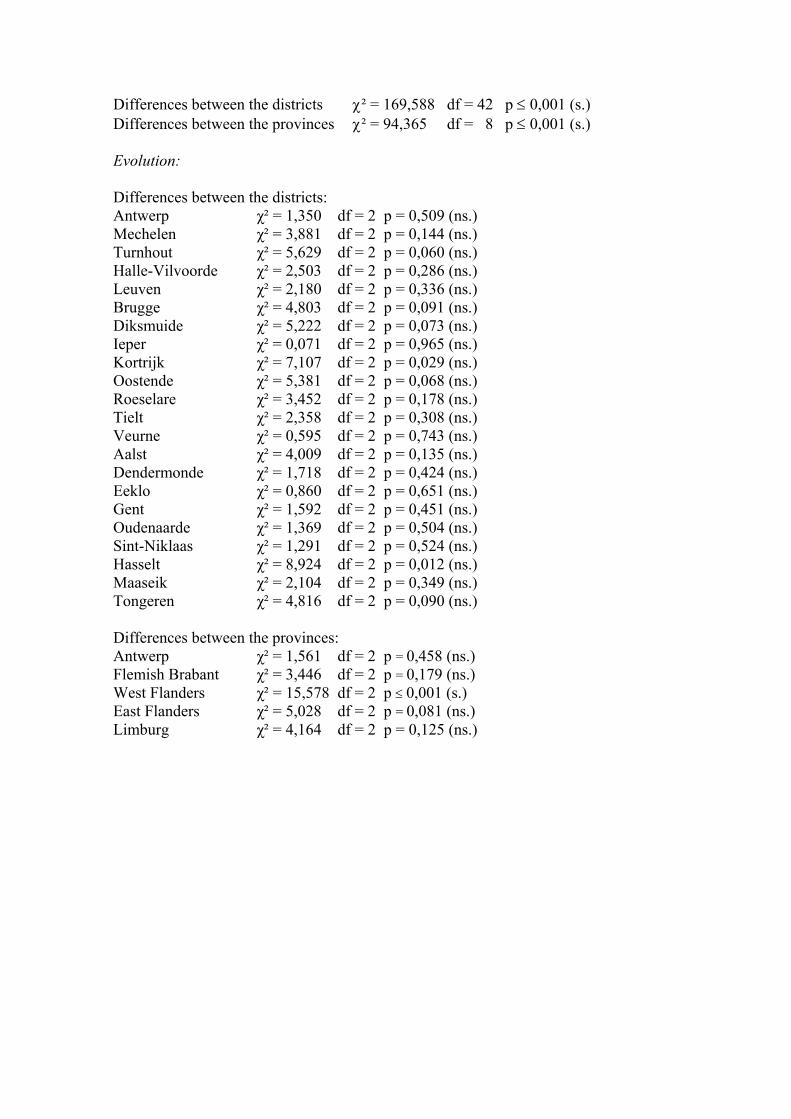
Differences between the districts χ² = 169,588 df = 42 p ≤ 0,001 (s.) Differences between the provinces χ² = 94,365 df = 8 p ≤ 0,001 (s.) Evolution: Differences between the districts: Antwerp χ² = 1,350 df = 2 p = 0,509 (ns.) Mechelen χ² = 3,881 df = 2 p = 0,144 (ns.) Turnhout χ² = 5,629 df = 2 p = 0,060 (ns.) Halle-Vilvoorde χ² = 2,503 df = 2 p = 0,286 (ns.) Leuven χ² = 2,180 df = 2 p = 0,336 (ns.) Brugge χ² = 4,803 df = 2 p = 0,091 (ns.) Diksmuide χ² = 5,222 df = 2 p = 0,073 (ns.) Ieper χ² = 0,071 df = 2 p = 0,965 (ns.) Kortrijk χ² = 7,107 df = 2 p = 0,029 (ns.) Oostende χ² = 5,381 df = 2 p = 0,068 (ns.) Roeselare χ² = 3,452 df = 2 p = 0,178 (ns.) Tielt χ² = 2,358 df = 2 p = 0,308 (ns.) Veurne χ² = 0,595 df = 2 p = 0,743 (ns.) Aalst χ² = 4,009 df = 2 p = 0,135 (ns.) Dendermonde χ² = 1,718 df = 2 p = 0,424 (ns.) Eeklo χ² = 0,860 df = 2 p = 0,651 (ns.) Gent χ² = 1,592 df = 2 p = 0,451 (ns.) Oudenaarde χ² = 1,369 df = 2 p = 0,504 (ns.) Sint-Niklaas χ² = 1,291 df = 2 p = 0,524 (ns.) Hasselt χ² = 8,924 df = 2 p = 0,012 (ns.) Maaseik χ² = 2,104 df = 2 p = 0,349 (ns.) Tongeren χ² = 4,816 df = 2 p = 0,090 (ns.) Differences between the provinces: Antwerp χ² = 1,561 df = 2 p = 0,458 (ns.) Flemish Brabant χ² = 3,446 df = 2 p = 0,179 (ns.) West Flanders χ² = 15,578 df = 2 p ≤ 0,001 (s.) East Flanders χ² = 5,028 df = 2 p = 0,081 (ns.) Limburg χ² = 4,164 df = 2 p = 0,125 (ns.)
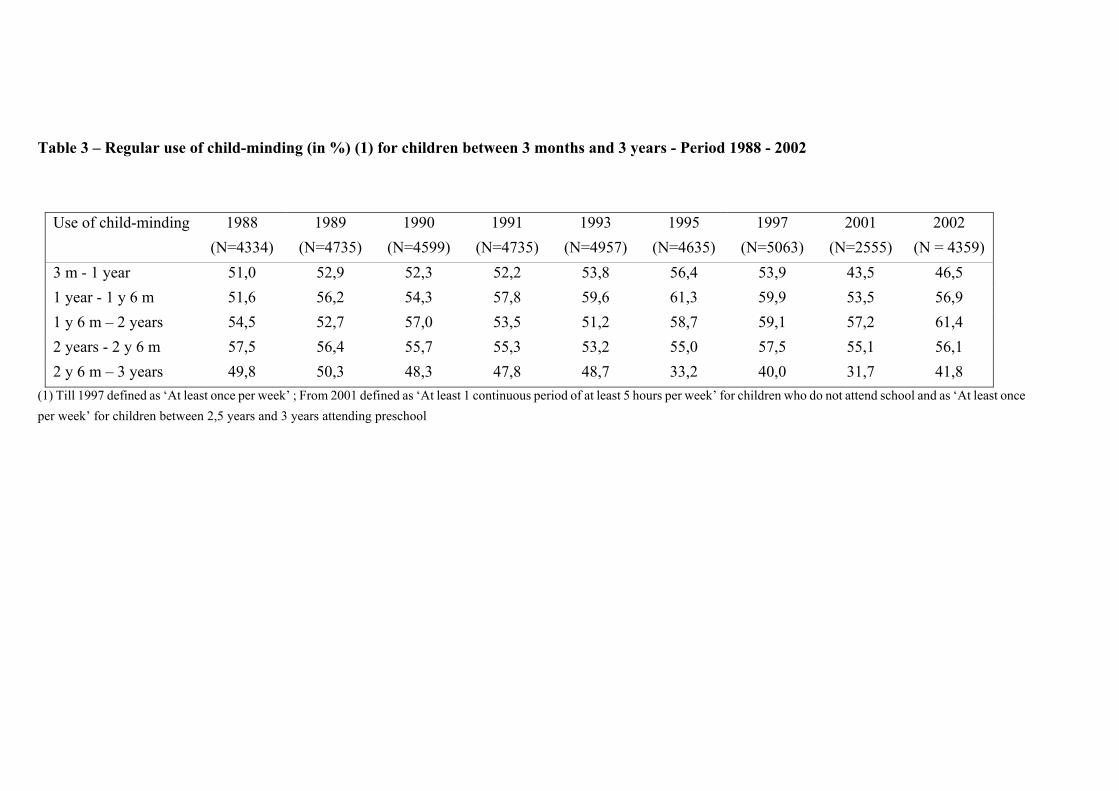
Table 3 – Regular use of child-minding (in %) (1) for children between 3 months and 3 years - Period 1988 - 2002
Use of child-minding 1988 (N=4334)
1989 (N=4735)
1990 (N=4599)
1991 (N=4735)
1993 (N=4957)
1995 (N=4635)
1997 (N=5063)
2001 (N=2555)
2002 (N = 4359)
3 m - 1 year 51,0 52,9 52,3 52,2 53,8 56,4 53,9 43,5 46,51 year - 1 y 6 m 51,6 56,2 54,3 57,8 59,6 61,3 59,9 53,5 56,91 y 6 m – 2 years 54,5 52,7 57,0 53,5 51,2 58,7 59,1 57,2 61,42 years - 2 y 6 m 57,5 56,4 55,7 55,3 53,2 55,0 57,5 55,1 56,12 y 6 m – 3 years 49,8 50,3 48,3 47,8 48,7 33,2 40,0 31,7 41,8
(1) Till 1997 defined as ‘At least once per week’ ; From 2001 defined as ‘At least 1 continuous period of at least 5 hours per week’ for children who do not attend school and as ‘At least once per week’ for children between 2,5 years and 3 years attending preschool

Table 4 – Use of child-minding for children between 3 months and 2,5 years in 2001 and in 2002 Use of child-minding 2001
(N=2 268) 2002
(N=3 646) Regular (1) 51,2 54,2 Limited (2) 9,6 10,0 No 39,2 35,7
(1) At least 1 continuous period of at least 5 hours per week for children who do not attend school and at least once per week for children between 2,5 years and 3 years attending preschool (2) Less than one continuous period of 5 hours per week for children who do not attend school and less than once per week for children between 2,5 years and 3 years attending preschool
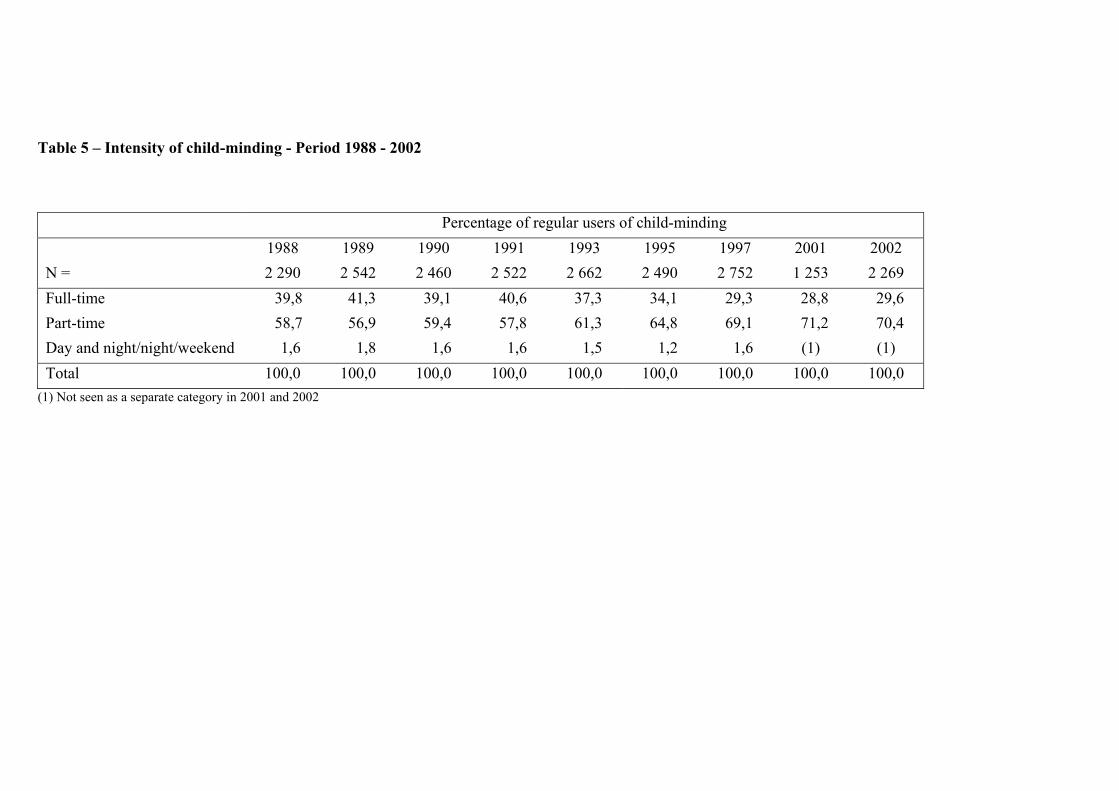
Table 5 – Intensity of child-minding - Period 1988 - 2002
Percentage of regular users of child-minding N =
1988 2 290
1989 2 542
1990 2 460
1991 2 522
1993 2 662
1995 2 490
1997 2 752
2001 1 253
2002 2 269
Full-time 39,8 41,3 39,1 40,6 37,3 34,1 29,3 28,8 29,6 Part-time 58,7 56,9 59,4 57,8 61,3 64,8 69,1 71,2 70,4 Day and night/night/weekend 1,6 1,8 1,6 1,6 1,5 1,2 1,6 (1) (1) Total 100,0 100,0 100,0 100,0 100,0 100,0 100,0 100,0 100,0
(1) Not seen as a separate category in 2001 and 2002
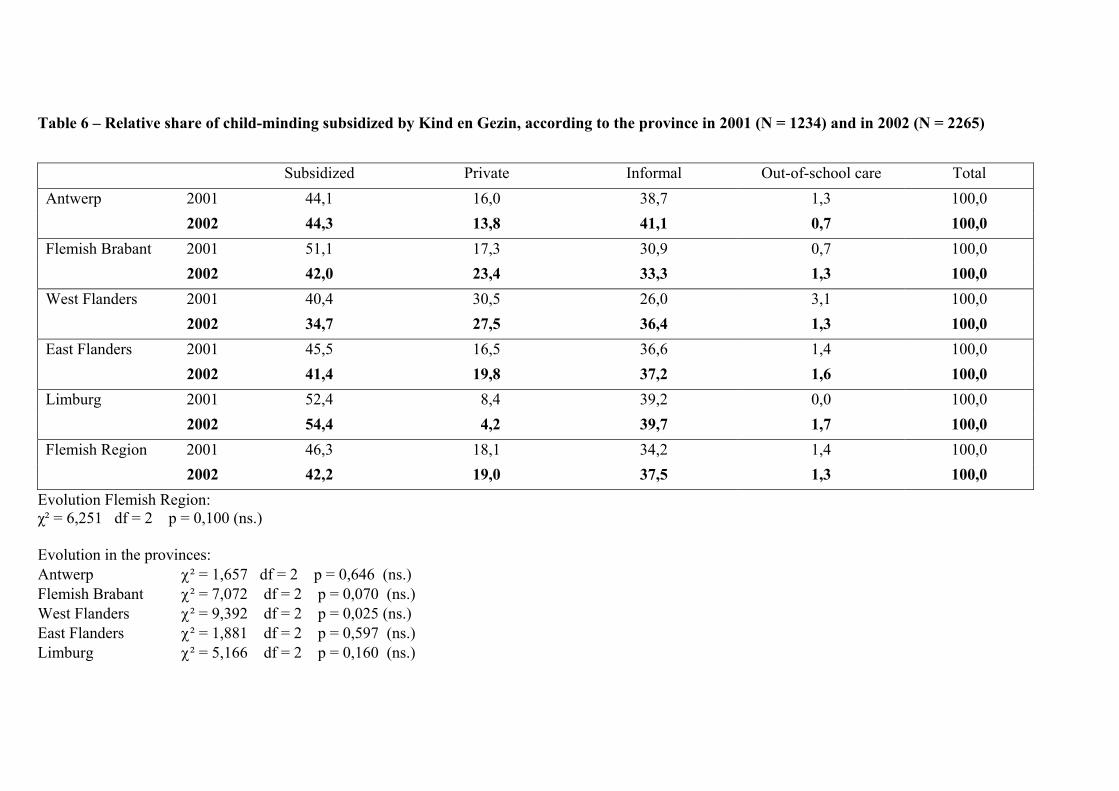
Table 6 – Relative share of child-minding subsidized by Kind en Gezin, according to the province in 2001 (N = 1234) and in 2002 (N = 2265)
Subsidized Private Informal Out-of-school care TotalAntwerp 2001 44,1 16,0 38,7 1,3 100,0
2002 44,3 13,8 41,1 0,7 100,0Flemish Brabant 2001 51,1 17,3 30,9 0,7 100,0
2002 42,0 23,4 33,3 1,3 100,0West Flanders 2001 40,4 30,5 26,0 3,1 100,0
2002 34,7 27,5 36,4 1,3 100,0East Flanders 2001 45,5 16,5 36,6 1,4 100,0
2002 41,4 19,8 37,2 1,6 100,0Limburg 2001 52,4 8,4 39,2 0,0 100,0 2002 54,4 4,2 39,7 1,7 100,0 Flemish Region 2001 46,3 18,1 34,2 1,4 100,0
2002 42,2 19,0 37,5 1,3 100,0
Evolution Flemish Region: χ² = 6,251 df = 2 p = 0,100 (ns.) Evolution in the provinces: Antwerp χ² = 1,657 df = 2 p = 0,646 (ns.) Flemish Brabant χ² = 7,072 df = 2 p = 0,070 (ns.) West Flanders χ² = 9,392 df = 2 p = 0,025 (ns.) East Flanders χ² = 1,881 df = 2 p = 0,597 (ns.) Limburg χ² = 5,166 df = 2 p = 0,160 (ns.)
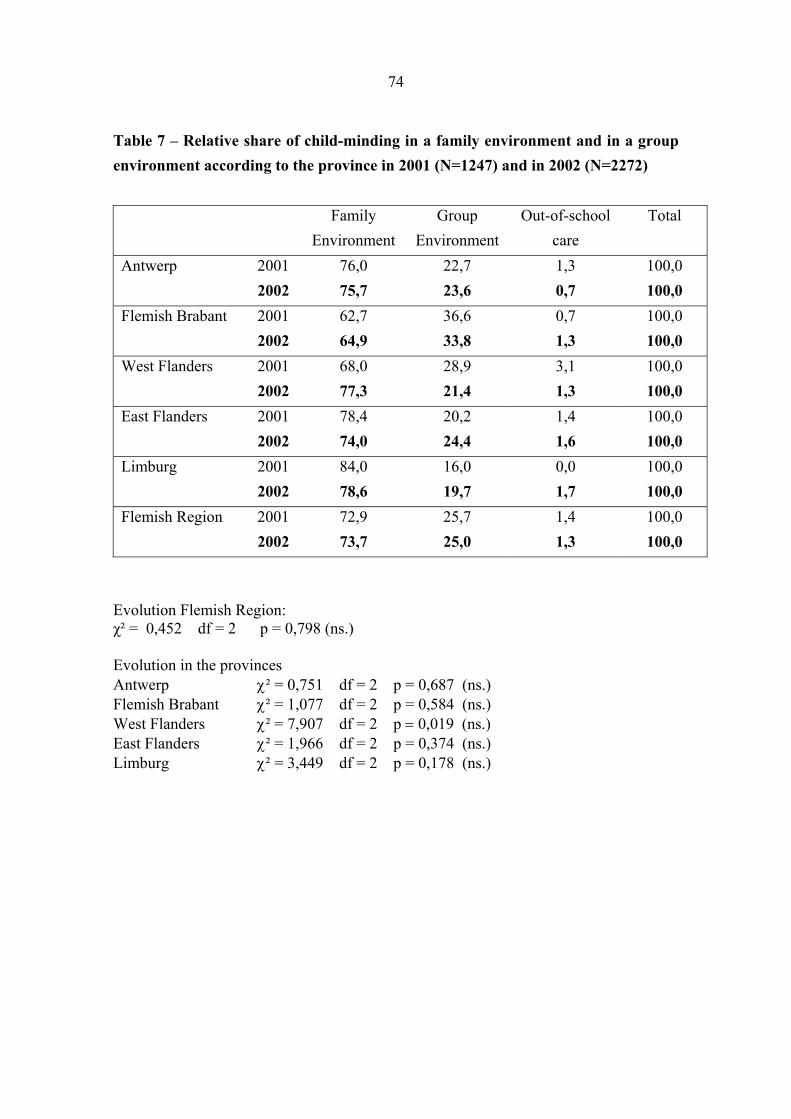
74
Table 7 – Relative share of child-minding in a family environment and in a group environment according to the province in 2001 (N=1247) and in 2002 (N=2272) Family
Environment Group
Environment Out-of-school
care Total
Antwerp 2001 76,0 22,7 1,3 100,0 2002 75,7 23,6 0,7 100,0 Flemish Brabant 2001 62,7 36,6 0,7 100,0 2002 64,9 33,8 1,3 100,0 West Flanders 2001 68,0 28,9 3,1 100,0 2002 77,3 21,4 1,3 100,0 East Flanders 2001 78,4 20,2 1,4 100,0 2002 74,0 24,4 1,6 100,0 Limburg 2001 84,0 16,0 0,0 100,0 2002 78,6 19,7 1,7 100,0 Flemish Region 2001 72,9 25,7 1,4 100,0 2002 73,7 25,0 1,3 100,0
Evolution Flemish Region: χ² = 0,452 df = 2 p = 0,798 (ns.) Evolution in the provinces Antwerp χ² = 0,751 df = 2 p = 0,687 (ns.) Flemish Brabant χ² = 1,077 df = 2 p = 0,584 (ns.) West Flanders χ² = 7,907 df = 2 p = 0,019 (ns.) East Flanders χ² = 1,966 df = 2 p = 0,374 (ns.) Limburg χ² = 3,449 df = 2 p = 0,178 (ns.)
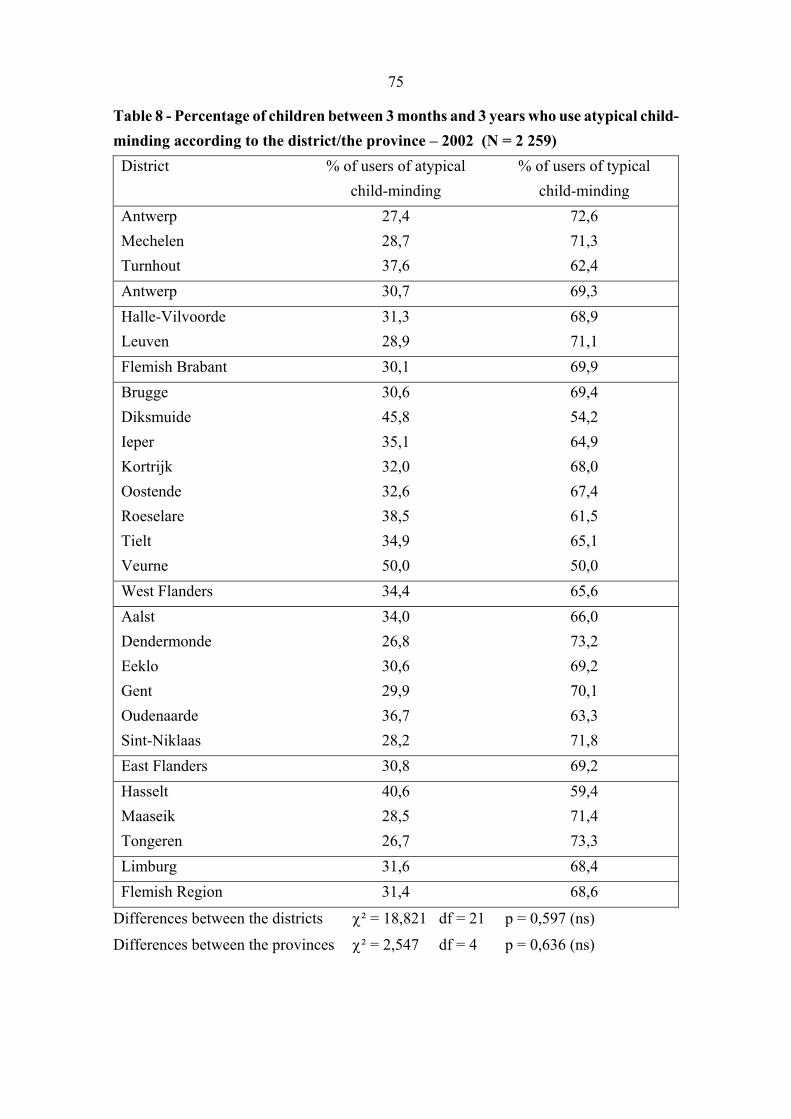
75
Table 8 - Percentage of children between 3 months and 3 years who use atypical child-minding according to the district/the province – 2002 (N = 2 259) District % of users of atypical
child-minding % of users of typical
child-minding Antwerp Mechelen Turnhout
27,4 28,7 37,6
72,6 71,3 62,4
Antwerp 30,7 69,3 Halle-Vilvoorde Leuven
31,3 28,9
68,9 71,1
Flemish Brabant 30,1 69,9 Brugge Diksmuide Ieper Kortrijk Oostende Roeselare Tielt Veurne
30,6 45,8 35,1 32,0 32,6 38,5 34,9 50,0
69,4 54,2 64,9 68,0 67,4 61,5 65,1 50,0
West Flanders 34,4 65,6 Aalst Dendermonde Eeklo Gent Oudenaarde Sint-Niklaas
34,0 26,8 30,6 29,9 36,7 28,2
66,0 73,2 69,2 70,1 63,3 71,8
East Flanders 30,8 69,2 Hasselt Maaseik Tongeren
40,6 28,5 26,7
59,4 71,4 73,3
Limburg 31,6 68,4 Flemish Region 31,4 68,6
Differences between the districts χ² = 18,821 df = 21 p = 0,597 (ns)
Differences between the provinces χ² = 2,547 df = 4 p = 0,636 (ns)