Embed Size (px)
Citation preview
www.elsevier.com/locate/ecolecon
Ecological Economics 49 (2004) 431–455
SURVEY
Environmental Kuznets Curve Hypothesis: A Survey
Soumyananda Dinda*
Economic Research Unit, Indian Statistical Institute, 203, B.T. Road, Kolkata-108, India
S.R. Fatepuria College, Beldanga, Murshidabad, W.B., India
Received 26 September 2002; received in revised form 15 December 2003; accepted 4 February 2004
Available online 14 July 2004
Abstract
The Environmental Kuznets Curve (EKC) hypothesis postulates an inverted-U-shaped relationship between different
pollutants and per capita income, i.e., environmental pressure increases up to a certain level as income goes up; after that, it
decreases. An EKC actually reveals how a technically specified measurement of environmental quality changes as the fortunes
of a country change. A sizeable literature on EKC has grown in recent period. The common point of all the studies is the
assertion that the environmental quality deteriorates at the early stages of economic development/growth and subsequently
improves at the later stages. In other words, environmental pressure increases faster than income at early stages of development
and slows down relative to GDP growth at higher income levels. This paper reviews some theoretical developments and
empirical studies dealing with EKC phenomenon. Possible explanations for this EKC are seen in (i) the progress of economic
development, from clean agrarian economy to polluting industrial economy to clean service economy; (ii) tendency of people
with higher income having higher preference for environmental quality, etc. Evidence of the existence of the EKC has been
questioned from several corners. Only some air quality indicators, especially local pollutants, show the evidence of an EKC.
However, an EKC is empirically observed, till there is no agreement in the literature on the income level at which environmental
degradation starts declining. This paper provides an overview of the EKC literature, background history, conceptual insights,
policy and the conceptual and methodological critique.
D 2004 Elsevier B.V. All rights reserved.
Keywords: Economic growth; Environmental Kuznets Curve; EKC; Environmental quality; Environmental protection; Pollution; Turning point;
Inverted-U-shape
JEL classification: N50; O13; Q20
0921-8009/$ - see front matter D 2004 Elsevier B.V. All rights reserved.
doi:10.1016/j.ecolecon.2004.02.011
* c/o Dipankor Coondoo, Economic Research Unit, Indian
Statistical Institute, 203, B.T. Road, Kolkata-108, India. Fax: +91-
33-2577-8893.
E-mail addresses: [email protected],
[email protected], [email protected] (S. Dinda).
1. Introduction
Worldwide deterioration of environmental quality
has made many feel concerned about the issue and
mounting public concern over environmental issues
has sparked efforts to understand more clearly the
reasons for environmental degradation. The environ-
mental effects of economic growth have been receiv-
1 This line of thinking was present in the World Development
Report-1992 of the World Bank.
S. Dinda / Ecological Economics 49 (2004) 431–455432
ing increasing attention of economists in recent years.
One particular aspect, the linkage of environment with
economic growth/development, evoked much discus-
sion in the last decade (i.e., 1990s) and a sizeable
literature on the pollution–income growth relation-
ship has grown in recent period. The common point of
all the studies is the assertion that environmental
quality deteriorates in early stage of economic devel-
opment/growth and improves in later stage as an
economy develops. In other words, environmental
pressure increases faster than income in the early
stage of development and slows down relative to
GDP growth in higher income levels. This systematic
relationship between income change and environmen-
tal quality has been called the Environmental Kuznets
Curve (EKC). The inverted-U relationship derives its
name from the work of Kuznets (1955) who postulat-
ed a similar relationship between income inequality
and economic development. The logic of EKC rela-
tion is intuitively appealing. In the first stage of
industrialization, pollution grows rapidly because high
priority is given to increase material output, and
people are more interested in jobs and income than
clean air and water (Dasgupta et al., 2002). The rapid
growth inevitably results in greater use of natural
resources and emission of pollutants, which in turn
put more pressure on environment. People are too
poor to pay for abatement, and/or disregard environ-
mental consequences of growth. In later stage of
industrialization, as income rises, people value the
environment more, regulatory institutions become
more effective and pollution level declines. Thus,
EKC hypothesis posits a well-defined relationship
between level of economic activity and environmental
pressure (defined as the level of concentration of
pollution or flow of emissions, depletion of resources,
etc.). An Environmental Kuznets Curve reveals how a
technically specified measurement of environmental
quality changes as the fortunes of a country or a large
human community change. In brief, Environmental
Kuznets Curves are statistical artifacts that summarize
a few important aspects of collective human behav-
iour in two-dimensional space. The EKC hypothesizes
an inverted-U-shaped curve when pollution indicators
are plotted against income per capita.
The EKC results have shown that economic growth
could be compatible with environmental improvement
if appropriate policies are taken. It is a significant
condition that only when income grows, the effective
environmental policies can be implemented.1 Clearly,
before adopting a policy, it is important to understand
the nature and causal relationship between economic
growth and environmental quality (Coondoo and
Dinda, 2002). Therefore the relevant question is:
Can economic growth be part of the solution rather
than the cause of environmental problem? This has
been the primary motivation for empirical studies on
EKC searching for evidence of link between income
and environmental degradation. It has provoked a vast
empirical research over the last decade (i.e., 1990s).
The 1990s have seen the advent of EKC hypothesis
and an explosion of studies that tested it for several
pollutants. The aim of the present paper is not to go
further on these issues, but to visualize the current
state of knowledge about the EKC. Stern (1998),
Ekins (1997), de Bruyn and Heintz (1998) and Stagl
(1999) provide good overviews and comparisons.
This EKC-Review is slightly different from earlier
reviews and here the literature added since then is
taken into consideration.
The second section of this paper provides the
background history of the environment–economic
growth debate and genesis of the EKC; the third
section provides a general idea and some conceptual
insights and the fourth section deals with theoretical
reviews. Empirical evidences have been reviewed in
the fifth section, policy implication in the sixth
section, and a conceptual and methodological critique
has been presented in the seventh section. Finally, the
paper concludes with some remarks for direction of
future research.
2. Background history of EKC
2.1. Growth controversy
The origin of the EKC debate is the growth
controversy and related policies. Researchers hypoth-
esize that a higher level of income increases environ-
mental degradation. Actually, higher levels of income
may reduce environmental degradation (Beckerman,
S. Dinda / Ecological Economics 49 (2004) 431–455 433
1992), and thus, economic growth may be a precon-
dition for environmental improvement (Bhagawati,
1993). So, growth could be a powerful way for
improving environmental quality in developing
countries (Panayotou, 1993). The argument according
to which economic growth is ultimately beneficial for
environment is, however, controversial2 since it
prompts the idea of a development path,3 a stage-
based link between environmental quality and eco-
nomic growth.
Truly, the relationship between economic growth
and environmental quality has been an object of a long
debate for many years. Before 1970, there was a belief
that the consumption of raw materials, energy and
natural resources grow almost at the same rate (viz.,
steady state) as economy grows. In the early 1970s, the
Club of Rome’s Limits to Growth view (Meadows et
al., 1972) was forwarded about the concern for avail-
ability of natural resource of the Earth. The environ-
mental economists of the Club of Rome argued that the
finiteness of environmental resources would prevent
economic growth and urged for a steady-state econo-
my with zero growth to avoid dramatic ecological
scenarios in the future. This view has been criticized
on both theoretical and empirical grounds. Empirical
works show that the ratio of consumption of some
metals to income was declining in developed econo-
mies during the 1970s, which conflicts with the
predictions set out in the Limits to Growth view
(Malenbaum, 1978). This view induced to examine
the relationship between the intensity of metal use and
income, and an inverted-U curve was found. This
inverted-U curve (known as intensity-of-use hypothe-
sis (Auty, 1985)) reveals that intensity of materials-
use4 decreases beyond a threshold level of income
(Canas et al., 2003, de Bruyn and Heintz, 1998).
From the beginning of the 1990s, empirical data on
various pollutants become available through the Global
2 Existing environmental regulation, by reducing economic
growth, may actually be reducing environmental quality (Bartlett,
1994).3 In recent time, this link raises the issue of potential conflicts
between the globalization and protection of the environment.4 Other studies have found a general tendency of an absolute
decline in consumption of several materials after 1973, and it is
mostly pronounced in developed economies (Williams et al., 1987;
Tilton, 1990).
Environmental Monitoring System (GEMS), the envi-
ronmental data compendium of the OECD, the CO2
emission estimates from the Oak Ridge National Lab-
oratory (ORNL), etc. These data availability induce
several authors to test the validity of the inverted-U
curve hypothesis for income and environmental quality
indicators. The first empirical study appears in the
NBER working paper by Grossman and Krueger
(1991); after that, a number of studies follow.
2.2. Genesis of EKC
Kuznets (1955) predicted that the changing rela-
tionship between per capita income and income in-
equality is an inverted-U-shaped curve. As per capita
income increases, income inequality also increases at
first and then starts declining after a turning point
(TP). In other words, the distribution of income
becomes more unequal in early stage of income
growth and then the distribution moves towards
greater equality as economic growth continues (Kuz-
nets, 1955). This relationship between income per
capita and income inequality can be represented by
a bell-shaped curve. This observed empirical phenom-
enon is popularly known as the Kuznets Curve.
In the 1990s and onwards, the Kuznets Curve took
on a new existence. There is evidence that the level of
environmental degradation and per capita income
follows the same inverted-U-shaped relationship as
does income inequality and per capita income in the
original Kuznets Curve. Now, Kuznets Curve has
become a vehicle for describing the relationship
between measured levels of environmental quality
(for example, concentration of SO2) and per capita
income. This inverted-U-shaped relationship between
economic growth and measured pollution indicators
(environmental quality) is known as the EKC.
First set of empirical EKC studies appeared inde-
pendently in three working papers: an NBER working
paper as part of a study of the environmental impacts of
NAFTA (Grossman and Krueger, 1991), the World
Bank’s 1992 World Development Report (Shafik and
Bandyopadhyay, 1992) and a Development Discussion
paper as part of a study for the International Labour
Organisation (Panayotou, 1993). Grossman and
Krueger (1991) in an NBER working paper, which
was later published in 1993 (Grossman and Krueger,
1993), first pointed out an inverted-U relationship
S. Dinda / Ecological Economics 49 (2004) 431–455434
between pollutants (SO2 and smoke) and income per
capita. Kuznets’ name was attached to the inverted-U
relationship between pollution and economic develop-
ment later due to its resemblance to Kuznets’ inverted-
U relationship between income inequality and econom-
ic development. However, Panayotou (1993) first
coined it as the Environmental Kuznets Curve or EKC.
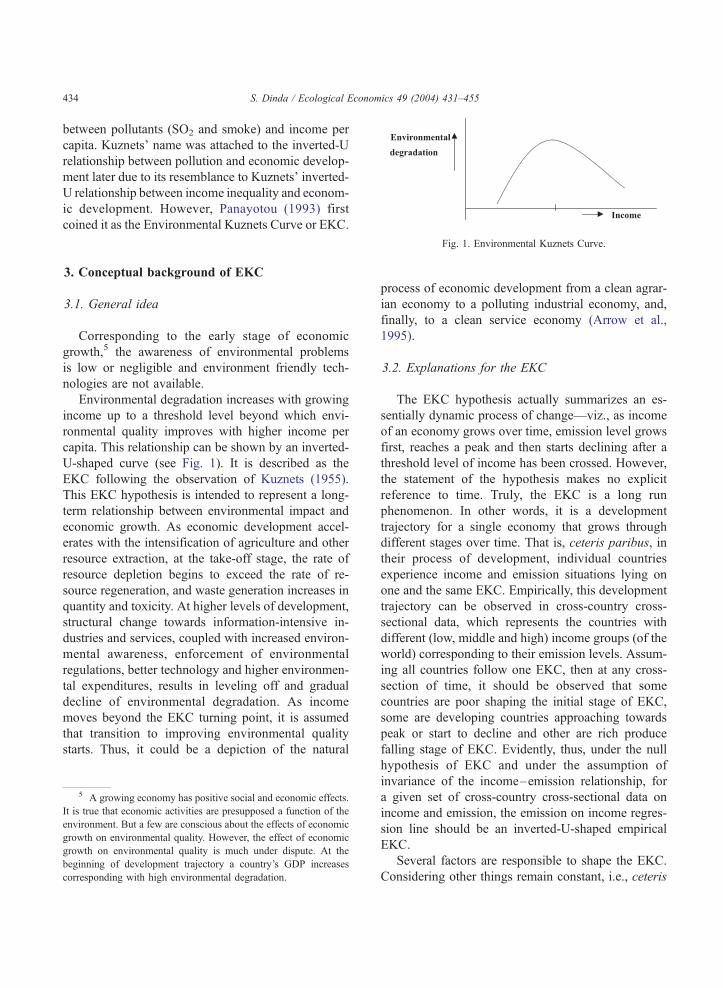
Fig. 1. Environmental Kuznets Curve.
3. Conceptual background of EKC
3.1. General idea
Corresponding to the early stage of economic
growth,5 the awareness of environmental problems
is low or negligible and environment friendly tech-
nologies are not available.
Environmental degradation increases with growing
income up to a threshold level beyond which envi-
ronmental quality improves with higher income per
capita. This relationship can be shown by an inverted-
U-shaped curve (see Fig. 1). It is described as the
EKC following the observation of Kuznets (1955).
This EKC hypothesis is intended to represent a long-
term relationship between environmental impact and
economic growth. As economic development accel-
erates with the intensification of agriculture and other
resource extraction, at the take-off stage, the rate of
resource depletion begins to exceed the rate of re-
source regeneration, and waste generation increases in
quantity and toxicity. At higher levels of development,
structural change towards information-intensive in-
dustries and services, coupled with increased environ-
mental awareness, enforcement of environmental
regulations, better technology and higher environmen-
tal expenditures, results in leveling off and gradual
decline of environmental degradation. As income
moves beyond the EKC turning point, it is assumed
that transition to improving environmental quality
starts. Thus, it could be a depiction of the natural
5 A growing economy has positive social and economic effects.
It is true that economic activities are presupposed a function of the
environment. But a few are conscious about the effects of economic
growth on environmental quality. However, the effect of economic
growth on environmental quality is much under dispute. At the
beginning of development trajectory a country’s GDP increases
corresponding with high environmental degradation.
process of economic development from a clean agrar-
ian economy to a polluting industrial economy, and,
finally, to a clean service economy (Arrow et al.,
1995).
3.2. Explanations for the EKC
The EKC hypothesis actually summarizes an es-
sentially dynamic process of change—viz., as income
of an economy grows over time, emission level grows
first, reaches a peak and then starts declining after a
threshold level of income has been crossed. However,
the statement of the hypothesis makes no explicit
reference to time. Truly, the EKC is a long run
phenomenon. In other words, it is a development
trajectory for a single economy that grows through
different stages over time. That is, ceteris paribus, in
their process of development, individual countries
experience income and emission situations lying on
one and the same EKC. Empirically, this development
trajectory can be observed in cross-country cross-
sectional data, which represents the countries with
different (low, middle and high) income groups (of the
world) corresponding to their emission levels. Assum-
ing all countries follow one EKC, then at any cross-
section of time, it should be observed that some
countries are poor shaping the initial stage of EKC,
some are developing countries approaching towards
peak or start to decline and other are rich produce
falling stage of EKC. Evidently, thus, under the null
hypothesis of EKC and under the assumption of
invariance of the income–emission relationship, for
a given set of cross-country cross-sectional data on
income and emission, the emission on income regres-
sion line should be an inverted-U-shaped empirical
EKC.
Several factors are responsible to shape the EKC.
Considering other things remain constant, i.e., ceteris
S. Dinda / Ecological Economics 49 (2004) 431–455 435
paribus, each factor is analyzed in the following sub-
sections one by one to explain the EKC.
3.2.1. Income elasticity of environmental quality
demand
As income grows, people achieve a higher standard
of living and care more for the quality of environment
they live in and demand for better environment
induces structural changes in economy that tends to
reduce environmental degradation. The most common
explanation for the shape of an EKC is the notion that
when a country achieves a sufficiently high standard
of living, people attach increasing value to environ-
mental amenities (Pezzey, 1989; Selden and Song,
1994; Baldwin, 1995). After a particular level of
income, the willingness to pay for a clean environ-
ment rises by a greater proportion than income (Roca,
2003). This will be reflected through defensive expen-
ditures, donations to environmental organizations or
choice of less environmentally damaging products.
Thus, rich people value the clean environment and
preserve it. Generally, it is recognized that income
elasticity of environmental quality demand and re-
source goods is in excess of unity, i.e., clean environ-
ment and preservation are ‘luxury goods’. But major
indicators of environmental degradation are monoton-
ically rising in income though the income elasticity is
less than one and is not a simple function of income
alone. However, most of the EKC models have
emphasized the role of income elasticity6 of environ-
mental quality demand (Beckerman, 1992; Carson et
al., 1997; Chaudhuri and Pfaff, 1998; McConnell,
1997) and this elasticity is often invoked in the
literature as the main reason to explain the reduction
of emission level. An adequate explanation of ob-
6 A household-level income–environment relationship can be
derived from the purchase of private goods with environmental
characteristics (for example, Water-Filter Acqua-guard, Zeoline,
etc., against water pollution; mask, air conditioning against air
pollution, etc.). As household income rises, (s)he is expected to
increase (her) his expenditure on the purchase of environmental
quality enhancing goods, that means Engel Curve for such goods
can be estimated. Using household-level data of Pakistan, Engel’s
Curve is estimated and the EKC relationship between indoor air
quality and household income is found after simulation (Chaudhuri
and Pfaff, 1998). Micro-data of the USA also support the existence
of the EKC relationship between income and vehicle emissions at
household level (Kahn, 1998).
served EKC relationships for some pollutants,7 are
consistent with the high-income elasticity of environ-
mental quality demand (McConnell, 1997; Shafik,
1994). Poor people have little demand for environ-
mental quality, however, as a society becomes richer,
its members may intensify their demands for a more
healthy and cleaner environment. The consumers with
higher incomes are not only willing to spend more for
green products but also create pressure for environ-
mental protection and regulations. In most cases
where emissions have declined with rising income,
the reductions have been due to local and national
institutional reforms, such as environmental legisla-
tion and market-based incentives to reduce environ-
mental degradation.
3.2.2. Scale, technological and composition effects
Economic growth affects the quality of environ-
ment in three different channels—viz., scale effects,
technological effects and composition effects (Gross-
man and Krueger, 1991). Increasing output requires
more input and thus more natural resources are used
up in production process. More output also implies
more wastes and emissions as by-product, which also
contributes to degrade environmental quality. Eco-
nomic growth, thus, exhibits a scale effect that has a
negative impact on environment. However, economic
growth has also a positive impact on environment
through a composition effect: As income grows,
structure of the economy tends to change and gradu-
ally increases cleaner activities that produce less
pollution. Environmental degradation tends to in-
crease as structure of the economy changes from rural
to urban or agricultural to industrial, but it starts to fall
with another structural change from energy intensive
industry to services and knowledge based technology-
intensive industry. As a wealthy nation can afford to
spend more on R&D (Komen et al., 1997), techno-
logical progress occurs with economic growth and
the dirty and obsolete technologies are replaced
by upgraded new and cleaner technology, which
improves environmental quality. This is the technique
effect of economic growth. The EKC suggests that the
7 The most contingent valuation studies have found an income
elasticity of demand for environmental services smaller than unity
(Kristrom and Riera, 1996).
S. Dinda / Ecological Econom436
negative impact on environment of the scale effect
that tends to prevail in initial stages of growth, but it
will eventually be outweighed by positive impact of
the composition and technique effects8 that tend to
lower the emission level (Vukina et al., 1999).
3.2.3. International trade
International trade is one of the most important
factors that can explain EKC. Trade leads to increase in
size of the economy that increases pollution, thus,
trade is the cause of environmental degradation ceteris
paribus. But many economists have long argued that
trade is not the root cause of environmental damage
(Birdsall and Wheeler, 1993; Lee and Roland-Holst,
1997; Jones and Rodolfo, 1995). However, free trade
has the contradictory impacts on environment, both
increasing pollution and motivating reductions in it.
Environmental quality could decline through the scale
effect as increasing trade volume (especially export)
raises the size of economy, which increases pollution.
On the other hand, trade can improve the environment
through composition effect and/or technique effect
(i.e., as income rises through trade, environmental
regulation is tightened that spurs pollution reducing
innovation). The pollution from the production of
pollution-intensive good declines in one country as it
increases in other country via international trade. This
composition effect is attributed to two related hypoth-
eses: Displacement Hypothesis and Pollution Haven
Hypothesis. Fundamentally, these two hypotheses
have no difference. These hypotheses are basically
the same with respect to comparative advantage in
international trade. As trade relates one country with
international communities, one underdeveloped econ-
omy may rely on technology transfer through foreign
direct investment (FDI) that may reduce pollution.
8 With regard to the technique effect there are many examples
of efficient resource use, substitutions between resources, and
containment of wastes. The most dramatic are reduction of SO2 in
Germany, France and Japan by the installation of flue-gas
desulphurization equipment (in Germany), a switch over to nuclear
power (in France), and a combination of these two (in Japan).
However, both alternatives have secondary environmental effects,
i.e., quarrying and transport of large quantities of limestone for flue-
gas desulphurization, waste disposal, radioactive emissions and risk
of accidents for nuclear power. These secondary effects should
always be incorporated into an environmental assessment when
benefits from advances in technology are appraised.
3.2.3.1. Displacement Hypothesis. The alleged
emergence of structural change in production has been
linked with consumption and international trade (Ar-
row et al., 1995; Stern et al., 1996; Ekins, 1997;
Rothman, 1998). The changes in the structure of
production in developed economies are not accompa-
nied by equivalent changes in the structure of con-
sumption, therefore, EKC actually records displace-
ment of dirty industries to less developed economies.
Under certain circumstances, the pollution intensive
industries migrate from countries with stronger envi-
ronmental regulations to those with weaker regulations
(Copeland and Taylor, 1995). The composition of
international trade, however, actually reflects the ener-
gy consumption of a country (Agras and Chapman,
1999), and countries that export more manufactured
goods tend to have a higher energy consumption (Suri
and Chapman, 1998). Poor countries are likely to be net
exporters and rich countries to be net importer of
pollution-intensive goods (Saint-Paul, 1994). The ob-
served inverted-U curves may be the result of changes
in international specialization. That means, poor
countries are concentrated in ‘dirty’ and material in-
tensive production while richer countries specialize in
‘clean’ and service intensive production, without alter-
ing consumption patterns (Cole et al., 2000; Janicke et
al., 1997; Stern et al., 1996). This is true only when
environmental effects are being displaced from one
country to another, rather than reduced. These obser-
vations are consistent with the Displacement Hypoth-
esis. The Displacement Hypothesis expects that trade
liberalization or openness (Harrison, 1996) will lead
more rapid growth of pollution-intensive industries in
less developed economies as developed economies
enforce strict environmental regulations9 (Rock,
1996; Tobey, 1990).
The composition effect and the displacement effect
seem not to be independent. So far, as the composition
effect is due to displacement, later developing
ics 49 (2004) 431–455
9 For example, toxic intensity decreases with openness of the
economy and growth rate of the toxic intensity of manufacturing
increases in poor countries. Toxic intensity has grown quickly in
high-income countries during the 1960s, this pattern has sharply
reversed during the 1970s and 1980s, after the advent of stricter
OECD environmental regulation, . . .toxic intensity in LDC
manufacturing has grown quickly (Hettige et al., 1992). Other
studies also agree with the displacement hypothesis (Low and Yeats,
1992).
S. Dinda / Ecological Economics 49 (2004) 431–455 437
countries will not be able to derive benefit from it, for
lack of other countries to which environmentally
intensive activities can be displaced.
3.2.3.2. Pollution Haven Hypothesis. Free trade can
be good for environment (Antweiler et al., 2001;
Liddle, 2001). Trade raises income levels of people
in developing countries, and by raising real incomes,
it will create demands for tighter environment protec-
tion because higher income individuals want a cleaner
environment. But lower trade barriers could hurt
environment if heavy polluters move to countries with
weaker regulations. Economists call this the Pollution
Haven Hypothesis (PHH). The PHH refers to the
possibility that multinational firms, particularly those
engaged in highly polluting activities, relocate to
countries with lower environmental standards.10 The
PHH argues that low environmental standards become
a source of comparative advantage, and thus shifts in
trade patterns. The PHH is basically a theory that
suggests that high regulation countries will lose all the
‘dirty industries’ and poor countries will get them all.
3.2.3.3. Foreign direct investment. Developing
countries can be said to provide a ‘pollution haven’
if they set environmental standards below their effi-
ciency levels in order to attract foreign investment.
Most of the developing countries rely on technology
transfer through foreign direct investment from devel-
oped countries as a primary means of technology
acquisition.11 These clean and upgraded technologies
will reduce pollution level. However, recent increased
global eco-consciousness and linking of trade and
investment with environmental issues has the poten-
tial of disrupting these investments flow.12
3.2.3.4. Race to bottom. In a race to bottom scenario,
relatively high environmental standards in developed
economies impose high costs on polluters. So, pollut-
ing activities in high-income economies face higher
10 See Cole (2004), Eskeland and Harrison (2003), Friedl and
Getzner (2003), Jha et al. (1999), Mani and Wheeler (1998),
Ratnayake (1998), Smarzynska and Wei (2001) and Wu (2003).
12 See Bommer (1999), Dean (2004), Letchumanan and
Kodama (2000) and Xing and Kolstad (1995).
11 See Dasgupta et al. (2001a,b), Dean (2004), Dessus and
Bussolo (1998), Letchumanan and Kodama (2000), Neumayer
(2003), Smarzynska and Wei (2001) and Wheeler (2000).
regulatory costs than their counterparts in developing
countries (Jaffe et al., 1995; Mani and Wheeler, 1998).
This creates an incentive for at least some highly
polluting industries13 to relocate and thereby interna-
tional capital reallocations take place. Rising capital
outflows force governments in high-income countries
to begin relaxing environmental standards. As the race
to bottom accelerates, the EKC flattens and rises
toward higher existing level of pollution.
3.2.3.5. Diffusion of technology. With international
trade, technological innovation is more important than
in a closed market economy. Developed countries
must continually innovate, not just to grow but even
to maintain their real incomes.14 Diffusion of technol-
ogy prevents economic latecomers from requiring the
same levels of materials and energy inputs per unit of
GDP than older industrialized countries needed in
past. International trade enhances diffusion of clean
technology (Martin and Wheeler, 1992; Reppelin-Hill,
1999). Some authors have suggested that this might
allow developing countries to ‘dive through’ the EKC.
3.2.3.6. International assistance. International com-
munities15 also play an important role in lowering and
flattening EKC by financing for appropriate training,
policy reforms, information collection and public
environmental education. Their aided research pro-
grammes provide easily accessible information about
polluters, pollution damages, local environmental
quality, cost of pollution abatement, stronger regula-
tory institutions, cost-effective measures, etc., should
help to reduce pollution (Dasgupta et al., 2002).
3.2.3.7. Globalization. Globalization could trigger
the environmental ‘race to bottom’ (Wheeler, 2000),
in which competition increases for investment and
jobs. In fact, ‘the bottom’ rises with economic growth.
Poor economies improve their environmental quality
as investment increases income and employment. So,
globalization is compatible with pollution reduction
13 The firms are relocated to low-income countries with weak
environmental regulation.14 For developing countries, transfer of technology, in addition
to direct benefits, brings the indirect benefit of improved terms of
trade.15 For example, World Bank Aided India: Environment
Management Capacity Building Technical Assistance Project.
S. Dinda / Ecological Economics 49 (2004) 431–455438
(Dessus and Bussolo, 1998; Grether and Melo, 2002;
Robinson, 1988). Economic globalization16 is a driv-
ing force for global economic growth, yet, opinion is
divided about the benefits of this process (Tisdell,
2001). This global, liberal, open economy raises the
issue of potential conflicts between two powerful
current trends—one, the worldwide acceptance of
market oriented economic reform process, and another
is environmental protection.
3.2.4. Market mechanism
An argument (World Bank, 1992; Unruh and
Moomaw, 1998) that the existence of an endogenous
‘self-regulatory market mechanism’ for those natural
resources that are traded in markets might prevent
environmental degradation from continuing to grow
with income has been suggested. Economic develop-
ment may strengthen the market mechanism such that
a developing economy may gradually shift from non-
market to market energy resources that are less
polluting (Kadekodi and Agarwal, 1999).
3.2.4.1. Role of price. The early stages of growth are
often associated with heavy exploitation of natural
resources due to relative importance of the agricultural
sector. This tends to reduce the stock of natural capital
over time. Efficiency in use of natural resources
increases after a certain stage of development has been
reached, as markets for environmental resources de-
velop and prices begin to reflect the value of natural
resources. The consequent increase in the price of
natural resources reduces their exploitation at later
stages of growth as well as environmental degradation
associated with it. Moreover, higher prices of natural
resources also contribute to accelerate the shift toward
less resource-intensive technologies (Torras and
Boyce, 1998). The rising oil price during the 1970s
promoted shift to alternative sources of electricity
power production (Unruh and Moomaw, 1998).
Hence, not only induced policy interventions, but also
market signals may explain the shape of EKC.
3.2.4.2. Role of economic agents. Among other
things, the relationship between economic growth
16 There has been intense pressure from environmentalists
and policy makers to include environmental standards in trade
agreements.
and environmental quality will be determined by the
way economic agents (including citizens, businesses,
policy makers, regulators, non-government organiza-
tions and other market participants) react to economic
growth and its side effects. Market agents can also
play an important role in creating pressures for envi-
ronmental protection. For example, bankers may re-
fuse to advance credit because of the environmental
liabilities; consumers may avoid products known to be
heavy polluters. Evidence suggests that capital mar-
kets also play an important role in encouraging
cleaner products (Dasgupta et al., 2001a,b; Gupta
and Goldar, 2003; Lanoie et al., 1998). Heavy emis-
sions may also give signal to investors about firm’s
production techniques, which are inefficient (Lanoie
and Laplante, 1994). The news related to environ-
mental damage due to firm’s production activities
affect the stock prices (Hamilton, 1995; Dasgupta et
al., 2001a) and subsequently such environmental
news may help to reduce emissions (Konar and
Cohen, 1997) as shareholders discourage it and also
create pressure to adopt new technology. Shareholders
of high-income countries drive heavy polluting firms
to relocate to low-income countries (Levinson, 1996),
and thus, investors also encourage clean production.
3.2.4.3. Transition to market economy. A country’s
transition from a centrally planned to a market-driven
economy, or, in theory at least, transition from com-
plete market failure to less market failure is consistent
with an overall improvement in environmental quality.
The environment in the transitional economies is
cleaned up quickly because of rising energy prices
and penalizing of energy-intensive activities (Nilsson,
1993; Vukina et al., 1999).
3.2.4.4. Information accessibility. Degree of com-
petition in the market depends on the information
about the product quality and production process.
Given the stock nature of many pollution problems,
emissions only partially account for the environmental
impacts. Other than economic growth, several other
variables like income distribution, education, infor-
mation accessibility, etc., may also help to determine
environmental quality (Bimonte, 2002). Social policy
decision heavily depends on information accessibility
corresponding to the position of economy as well as
that of environmental quality. Thus, the information
18 See Afsah et al. (1996), Dasgupta et al. (2000), Hartman et
al. (1995), Hettige et al. (1996, 2000a), Huq and Wheeler (1992),
Pargal and Wheeler (1996) and World Bank (1999).19 In India, (High/Supreme) Courts direct the Government to
implement law and regulations to control pollution or shut down
dirty industries, or sometime, order to shift polluting industries to
other places. For example, the Supreme Court has directed to West
Bengal Government to shift tannery industries from Kolkata to
S. Dinda / Ecological Economics 49 (2004) 431–455 439
accessibility may play a vital role to curve down the
pollution level through proper regulations.
3.2.5. Regulation
3.2.5.1. Formal regulation. Pollution grows unless
environmental regulation is strengthened (Hettige et
al., 2000a). With economic growth, economies ad-
vance with their social institutions that are essential to
enforce environmental regulation (Dasgupta et al.,
2001b). Developing countries are moving, now, from
command-and-control policies to market-oriented
forms of regulation (Dasgupta et al., 2002; Panayotou,
1999; Vukina et al., 1999). Information about pollut-
ers, damages, local environmental quality, abatement,
etc., significantly improve the ability of regulators to
enforce environmental standards. Market agents also
reward clean firms and punish heavy polluters. Envi-
ronmental regulatory institutions are either weak or
absent in less developed countries. In this situation,
pollution can be reduced if these poor countries focus
on few sources, which are responsible for most of the
pollution (Hettige et al., 1995). So, targeting regula-
tory monitoring and enforcement on those dominant
sources can significantly reduce emissions.
3.2.5.2. Informal regulation. When formal regula-
tion is weak or absent, societies often use other
channels to induce pollution abatement by local fac-
tories through a process of ‘informal regulation’. The
resulting ‘pollution equilibrium’ reflects the relative
bargaining power of the community and the plant
(Pargal and Wheeler, 1996). For example, Agarwal
et al. (1982) describe a situation where confronted by
community complaints a paper mill in India installed
pollution abatement equipment and also compensated
residents for repairing the damage caused. Non-Gov-
ernmental Organizations (NGOs) and social groups
(including religious institutions, social organizations
and politicians) may pursue informal regulation17
17 Two major formal channels of informal regulation are (i)
reporting violations of standards to the regulatory agencies and (ii)
putting pressure on regulators (through politicians and adminis-
trators) to tighten the monitoring and enforcement. These pressures
vary from region to region, but the basic pattern remains the same
everywhere. However, there also exist informal channels of
informal regulation—like public disclosure, rating, etc., where use
of market is made to punish polluters.
(Dasgupta et al., 2002; Afsah et al., 1996). Evidences18
from Asia and Latin America show that neighbouring
communities can strongly influence factories’ environ-
mental performance. Actually, informal pressure has to
be highly localized. A proactive vernacular media is
one such localized informal regulation that can easily
trigger formal regulations19 that reduce emission level.
So, the design of policy instruments for industrial
pollution in the case of developing countries is very
challenging20 (Xu, 1999). Thus, in principle, the
regulator has an array of physical, legal, monetary
and other instruments such as property rights.
3.2.5.3. Property rights. Most of the resource base
may be treated as a commons in primitive societies.
With growing scarcity, times come when some aspects
of the commons become defined as private property.
Private property is the most incentive-enriched form:
Individuals have greater incentive to manage, to
conserve and to accumulate wealth that can be traded
or passed to future generations. The economic prog-
ress is determined partly by the extent to which
environmental assets are protected by private property
rights21 (Chichilinsky, 1994; Lopez, 1994). Countries
with a high degree of private ownership and proper
allocation of property rights have more efficient
resource allocation, which help to increase income
and decrease environmental problems (Cropper and
Griffiths, 1994). A new approach to the EKC rela-
tionship is adopted to incorporate policy consideration
(Panayotou, 1997). Policies related to secure property
20 Informal regulations are not directly reflected in EKC
generating data in low-income countries, but these are indirectly
help to reduce pollution and thereby shape EKC through policy
designs.21 Chichilinsky (1994) develops a model using environment as
a factor of production with two regions: North and South. In this
model, trade is harmful to South, and to the World as a whole,
because too much environmental degradation occurs. His analysis is
based on property rights.
Bantala within 2002.
S. Dinda / Ecological Economics 49 (2004) 431–455440
rights under a rule of law and better enforcement, and
effective environmental regulations can help flatten
the EKC. Thus, the EKC may be a proxy for a
property rights model that begins with a commons
and ends with private property rights.
4. Theoretical analysis of EKC
The conceptual arguments make the EKC con-
ceivable from a theoretical viewpoint. Recently, the
EKC has been explained theoretically. Income
growth is driven by accumulation of production
factors (Lopez, 1994), which increases firms’ de-
mand for polluting inputs. At the same time, demand
for environmental quality rises with income as the
willingness to pay for a clean environment increases.
A basic comparative static analysis of the costs and
benefits associated with a better environmental qual-
ity provides an interesting conceptual insight as to
how the EKC might emerge. The Environmental
Kuznets Curve is derived from the interaction points
of marginal cost (MC) and marginal benefit (MB)
curves (Munasinghe, 1999). An EKC can be derived
directly from the technological link between con-
sumption of a desired good and abatement of its
undesirable byproduct22 (Andreoni and Levinson,
2001). It is also consistent with either Pareto effi-
cient policy or a decentralized market economy. If
pollution is not priced, firm will use it until its
marginal product is zero, when pollution is consid-
ered as a factor of production, but not the stock of
environmental capital. Extending this model, stock
of environmental quality is included as a factor of
production (Lopez, 1994), then the predictions of
this model depend crucially on the existence of
property rights. The EKC emerges from a dynamic
process, as one part of capital goes for development
of the environmental sectors. Total capital is divided
into two parts—one is used in production process
that creates pollution and damage the existing envi-
ronment and the other is used to clean up environ-
ment or improve it (Dinda, 2002). The role of
abatement expenditure is crucial to reduce the pol-
lution in production side (Dessus and Bussolo, 1998;
22 It is a simple and straightforward static model of the micro-
foundations of the pollution– income relationship.
Jaeger, 1998; Selden and Song, 1994). But the
abatement expenditure may not be a determining
factor behind the EKC for long-lived pollutants like
hazardous waste sites that are neither easily abated
nor shifted elsewhere. A stylized theoretical model
of the EKC based on perfect mobility of household
and labour is developed, and a general equilibrium
model that emphasizes spatial separation on the
consumer side as the reason behind the EKC for
hazardous waste sites23 (Gawande et al., 2001).
Under various conditions, the EKC relationship
between pollution and income can be obtained
theoretically (Beltratti, 1997; Bulte and van Soest,
2001; Dinda, 2002; John and Pecchenino,24 1994;
Jones and Rodolfo, 1995; Kadekodi and Agarwal,
1999; Selden and Song, 1995; Stokey, 1998). It
should be noted that the EKC relation may also
take shape from the interaction between ecological
and economic factors (Ezzati et al., 2001).
4.1. Empirical evidence for EKC
The empirical evidence for the existence of an
EKC has been found in various studies. These studies
share some common characteristics with respect to the
data and methods employed. Most of the data used in
these studies are cross-sectional panel data. The fol-
lowing reduced form model is used to test the various
possible relationships between pollution level/envi-
ronmental pressure and income:
yit ¼ ai þ b1xit þ b2x2it þ b3x
3it þ b4zit þ eit ð1Þ
where y is environmental indicators, x is income and z
relates to other variables of influence on environmen-
tal degradation. Here, the subscript i is a country, t is
time, a is constant, bk is the coefficient of the k
explanatory variables. Model (1) provides us to test
several forms of environment–economic develop-
ment/growth relationships:
(i) b1 = b2 = b3 = 0. A flat pattern or no relationship
between x and y.
23 Gawande et al. (2001) first attempted to develop a
consumption-based theory of the EKC.24 They have used overlapping generation growth model.
26 See Grossman and Krueger (1995), Selden and Song (1994),
S. Dinda / Ecological Economics 49 (2004) 431–455 441
(ii) b1>0 and b2 = b3 = 0. A monotonic increasing
relationship or a linear relationship between x and
y.
(iii) b1 < 0 and b2 = b3 = 0. A monotonic decreasing
relationship between x and y.
(iv) b1>0, b2 < 0 and b3 = 0. An inverted-U-shaped
relationship, i.e., EKC.
(v) b1 < 0, b2>0 and b3 = 0. A U-shaped relationship.
(vi) b1>0, b2 < 0 and b3>0. A cubic polynomial or
N-shaped figure.
(vii) b1 < 0, b2>0 and b3 < 0. Opposite to the N-
shaped curve.
From these, we observe that the EKC is only one of
the possible outcomes of model (1). From (iv), the TP
of EKC is obtained at x* ¼ � b1
2b2.
A large number of econometric studies have used
the model (1)25 to test for the emergence of an EKC in
a wide variety of income based environmental pres-
sure/pollution levels.
4.2. Empirical findings
The empirical analyses are based on data for
various sources. Most of the data used in empirical
tests are drawn from cross-sections of countries,
cross-sectional panel data and pooled data. Most of
the studies have used water and air pollution data from
GEMS, ORNL (CO2), World Resources, UN Statisti-
cal Yearbook, compendium of the OECD, FAO Pro-
duction Yearbook, WHO’s Health database, IEA, EPA
for US data, different sources for micro-data, etc.
Economic data (GDP per capita, trade, etc.) are taken
mostly from the Penn World Tables (Summers and
Heston) or the World Bank. Using these data, several
authors study the EKC hypothesis and their empirical
evidences provide controversy about it. In the absence
of a single environmental indicator, it is possible to
distinguish three main categories that have been used
in the literature: air quality, water quality and other
environmental quality indicators.
4.2.1. Air quality indicators
The urban or/and local air quality indicators (SO2:
sulphur dioxide, SPM: suspended particulate matters,
25 Or the log value of the variables is used in Model (1).
CO: carbon monoxide and NOx: nitrous oxides, etc.,
directly affect human health) generally reveal the
inverted-U relationship with income. Several stud-
ies26 confirm this outcome. Generally, the literature
does not find the evidence of EKC for air pollutants
that have direct little impact on health. Both early
and recent studies find that the global pollutants
(such as carbon dioxide emissions) either monoton-
ically increase or decrease as income grows.
4.2.2. Water quality indicators
For water quality indicators, empirical evidence of
EKC is even more mixed. Three main categories of
indicators are used as measures of water quality: (a)
concentration of pathogens in water (fecal and total
coliforms), (b) amount of heavy metals (lead, cadmium,
mercury, arsenic and nickel) and toxic chemicals dis-
charge in water by human activities and c) measure of
deterioration of the water oxygen regime (dissolved
oxygen, biological and chemical oxygen demand, i.e.,
BOD and COD). There is evidence of EKC for some
indicators, but many studies reach conflicting results
about the shape and peak of the curve (Beede and
Wheeler, 1992; Hettige et al., 2000b). Several authors
find evidence of N-shaped curve for some indicators (for
example, fecal coliforms in river water, see Shafik, 1994).
4.2.3. Other environmental indicators
Some other environmental indicators (municipal
solid wastes, urban sanitation, access to safe drinking
water, energy use and traffic volumes, etc.) have been
used to test the EKC hypothesis. Most of these
indicators do not support EKC. All studies find that
environmental problems having direct impact on hu-
man health (such as access to urban sanitation and
clean water) tend to improve steadily with economic
growth. On contrary, when environmental problems
can be externalized (as in the case of municipal solid
wastes) curve does not even fall at high-income levels.
The empirical evidence of EKC is controversial in case
of deforestation (Bhattarai and Hammig, 2001; Bulte
and van Soest, 2001; Koop and Tole, 1999).
Stern and Common (2001), List and Gallet (1999), Shukla and
Parikh (1992), Barbier (1997), Brandoford et al. (2000), Matyas et
al. (1998), Jaeger et al. (1995), Ansuategi et al. (1998), Jha (1996),
Horvath (1997) and Tucker (1995), Roca (2003).
conomics 49 (2004) 431–455
4.2.4. Turning point
It is clear that the EKC-type relations exist for
some environmental pressure factors and a transition
is expected at a crucial point, i.e., turning point. The
turning points of these inverted-U-shaped relation-
ships vary for different pollutants or environmental
indicators.27 For most of the pollution indicators, the
estimated turning point lies within the income range
of US$3000–10,000 (at a constant price, 1985 US
dollar). Moreover, there are also large variations
across studies for same indicators. Economic growth
may be associated with worsening environmental
conditions in less developed or poor countries but
air and water quality appears to be benefited from
economic growth if the critical level of income has
been reached. Several pollution indicators, such as
SO2, NOx, CO, CO2, SPM and air toxic emission
matters; oxygen regime in river basins (BOD, COD),
fecal contamination of river water, heavy metals in
water (mercury, arsenic, cadmium, nickel, lead);
hazardous28 and municipal waste, deforestation
(Bhattarai and Hammig, 2001; Koop and Tole,
1999), etc.; have been used to study the EKC
relation. These studies assume that each country
should follow EKC with same shape but level of
the curve may vary across countries as per their
economic position. The social and political factors
are also crucial for shaping the EKC.
4.2.5. A meta-analysis
However, various EKC studies have employed
different methods, evaluated several environmental
indicators and used different data, resulting in a broad
spectrum of findings and leading to sometimes
conflicting interpretations. It is important to use
meta-analysis to synthesize the EKC literatures. A
meta-analysis is a statistical method of synthesizing
results of similar empirical studies to determine
whether credible conclusions about prior study results
S. Dinda / Ecological E442
27 For example, the TPs of different air pollutants occur at
income of less than US$8000 per capita income (Grossman and
Krueger, 1995), below US$10,000 (Selden and Song, 1994), lead
emission at US$7000 (Hilton and Levinson, 1998) and hazardous
waste at US$23,000 (Wang et al., 1998), hydrocarbon emission at
US$35,000 per capita income (Kahn, 1998), etc.28 See Gawande et al. (2000, 2001), Bohara et al. (1999) and
Berrens et al. (1997).
can be made. Methodological choices and pollutant
types affect the estimated income turning point (Cav-
lovic et al., 2000).
4.3. Important lessons from the EKC studies
The EKC’s paradoxical outcome inspired a large
amount of research. A number of important lessons
for the EKC debate are already emerging from the
literature.
4.3.1. Local versus global pollution
The EKC relationships are more likely to hold for
certain types of environmental damage, e.g., pollu-
tants with more short-term and local impacts, rather
than those with more global, indirect and long-term
impacts (Arrow et al., 1995; Cole et al., 1997; John et
al., 1995). The significant EKCs exist only for local
air pollutants like SO2, SPM, NOx and CO (Cole et
al., 1997), and urban air concentrations with a peak at
lower income levels than total per capita emissions
(Selden and Song, 1994). In contrast, the global
environmental indicators (indirect impact) like CO2,
municipal waste, energy consumption (Horvath,
1997) and traffic volumes, either increase monotoni-
cally with income or have high turning points with
large standard errors (Holtz-Eakin and Selden, 1995).
4.3.2. The role of national and local policy
Most of the EKC studies have concluded that
income–environmental degradation relationship is
likely to be affected significantly by national and local
policies ceteris paribus. Several studies in this issue
have attempted to estimate the influence of policy
explicitly. The strong policies and institutions in the
form of more secure property rights, better enforce-
ment and effective environmental regulations can help
to ‘flatten’ the EKC (Panayotou, 1997). In case of the
Netherlands and West Germany, the impact of techno-
logical change in reducing SO2 emissions is largely
attributable to the installation of better end-of-pipe
(EOP) abatement technology, which is in turn related
to tougher environmental policy and regulation (de
Bruyn, 1997). As income level rises, public spending
on environmental research and development also
increases. These R&D spending may not directly
account for greater environmental improvement but
also act as a catalyst for private spending on develop-
29 Their results may inform the development of structural
models (rather than reduced form model) relating economic growth
and environmental quality.
S. Dinda / Ecological Economics 49 (2004) 431–455 443
ment of cleaner technologies (Komen et al., 1997). The
income of a country may be significant in determining
the ‘zeal and effectiveness’ of its air pollution regula-
tory structure. Mainly because a richer state is likely to
have more resources available to regulatory agencies,
higher public preferences for improved air quality and
a greater perceived danger from emission (Carson et
al., 1997).
4.3.3. Country specific effects
A more fruitful approach to the analysis of the
relationship between economic growth and environ-
mental impact would be the examination of historical
experience of individual countries, using econometric
and also qualitative historical analysis (Stern et al.,
1996). There is a large difference in state level per
capita emissions due to the enforcement of federal
pollution laws and possibly employment of outdated
industrial technology in some states of the USA
(Carson et al., 1997; List and Gallet, 1999; Selden et
al., 1999). The increasing relationship between SPM
and income in Malaysia may be due to the fact that
low-income states are still sources of emissions be-
cause of land conversion through burning and replant-
ing of tree crops, while high-income states are emitting
increasing emissions because of industrial and munic-
ipal wastes (Vincent, 1997). Rapid urbanization and
industrialization, which are correlated with rising in-
come in Malaysia, are responsible for the increasing
concentrations of ammoniac nitrogen and PH in water,
as expansion of municipal and industrial sewage
treatment has lagged behind (Vincent, 1997).
The sources of EKC are summarized into two
major groups: (a) structural change and (b) techno-
logical progress.
4.3.4. Structural change
Several authors have attempted to explore empiri-
cally which structural factors are responsible for EKC.
The scale and the composition of economic activity,
and techniques of production (Grossman and Krueger,
1991; Vukina et al., 1999; Xiaoli and Chatterjee,
1997), which may lend explanatory power to the
observed relationships between income levels and
measures of environmental impacts. Although struc-
tural change is a very intuitive notion, empirical
evidence is found for the impact of difference in the
structure of production on toxic manufacturing emis-
sions (Lucas et al., 1992). Several authors have tried
to explain the downward segment of EKC in different
ways.
4.3.4.1. Production structure. Developed countries
have fairly stable production structures, whereas rap-
idly industrializing and developing countries have
unstable production structure and the effects of struc-
tural change on emissions may be less obvious. In
comparison, structural change is less important than
technological innovation, represented by the change
in emission intensity across sectors, in explaining
declining SO2 emissions in the Netherlands and West
Germany (de Bruyn, 1997). Structural changes have
not been a dominant factor in reduction of SO2
emissions in either country, at least during the
1980s. The changes in production structure in devel-
oped economics are not accompanied by equivalent
changes in composition of production. The hypothesis
of spatial displacement of environmental impacts and
empirical evidences also reflect the composition of
consumption instead of production. A change in the
composition of consumption has resulted in a down-
ward turn in pollutants (Rothman, 1998).
4.3.4.2. Migration. The solution of environmental
problems associated with growth must mean more than
passing them off to people in other time and places. It
can be speculated that improvements in environmental
quality may in reality be indicators of increased ability
of consumers in wealthy nations to distance them-
selves from environmental degradation associated with
their consumption. To extend this speculation, mech-
anisms for such distancing might include both moving
polluting sources (viz., flow pollutants which is em-
phasized by Rothman, 1998) and selected households
moving away from pollution concentration (viz., stock
pollutant which is the study of Gawande et al., 2000).
Considering general hypothesis of ‘distancing’ as a
possible source of EKC results in which internal
migration plays a central explanatory role for an
observed EKC for hazardous waste sides (Gawande
et al., 2000, 2001; Wang et al., 1998).29 Different
social groups are differentially able to migrate away
30 In case of weak regulators, different social groups and local
communities pursue informal regulation and often use other
channels to induce pollution reduction by local factories in a
process of ‘informal regulation’ (Pargal and Wheeler, 1996;
Dasgupta et al., 2002; Afsah et al., 1996).31 They analyze EKC issue using 1996 data on threatened bird
and mammal species and per capita income levels for 15 countries.
S. Dinda / Ecological Economics 49 (2004) 431–455444
from areas with critical build-ups of hazardous waste
sites, then a migration mechanism is likely to be a
source of increasing environmental inequality. Thus,
migration is an important factor behind an EKC.
4.3.4.3. Share of GDP. A high share of manufactur-
ing in total GDP is associated with higher levels of
energy consumption. The importance of trade in
combination with composition of economic activity
is investigated in the decomposition of EKC for SO2
concentrations across countries (Kaufmann et al.,
1998). The effect of shifts in the sectoral structure
of economy (Panayotou, 1997) can be represented by
industry’s share of GDP (Dinda et al., 2000; Friedl
and Getzner, 2003). It should be noted that the
manufacturing share in developed economies starts
to decline rapidly after oil crisis.
4.3.4.4. External shock. The oil crisis in the 1970s
affects individual country’s production. There is a
positive correlation between CO2 emission and in-
come for the pre- oil shock period (i.e., before 1973)
and a negative correlation for the post oil shock crisis
(Unruh and Moomaw, 1998). The EKC analyses is
largely attributable to structural economic transition,
and a significant break in the positive CO2 emission–
GDP correlation is found only in 16 OECD countries
(Moomaw and Unruh, 1997). It is clear from the
evidence that emission levels decline in every nation
after the oil shock in the 1970s.
4.3.4.5. Corruption. The modified EKC analysis is
also ready to allow for differences in EKCs between
countries due (for instance) to inter-country variations
in the presence of corruption. One of the determinants
of environmental policy is the socio-political regime of
a particular country. Corruption and rent-seeking be-
haviour can influence the relationship between income
and environment (Lopez and Mitra, 2000). However,
for any level of per capita income, the pollution levels
corresponding to corrupt behaviour are always above
the socially optimal level. So, the turning point of EKC
takes place at income and pollution levels above those
corresponding to the social optimum, which depends
on the existing social institutions.
4.3.4.6. Institutional change. Along with economic
development, societies advance with their social, legal
and fiscal infrastructures that are essential to enforce
environmental regulation30 (Bhattarai and Hammig,
2001). Institutional changes triggered by citizens’
demand for cleaner environments are more likely to
occur in democratic countries. The influence of polit-
ical and civil rights on these are better in more
democratic countries (Shafik and Bandyopadhyay,
1992). However, opposite results can be found when
the samples are divided into a subset of high- and low-
income countries (Torras and Boyce, 1998). Most of
the pollutants investigated in their study are substan-
tially lower in more democratic low-income countries.
Population density causes an increase in threatened
species with the effect strongest in low-income
countries. More species are threatened where freedom
(political rights and civil liberties) is limited (McPher-
son and Nieswiadomy, 2001).31
4.3.5. Technological progress
Generally, technological progress leads to greater
efficiency in the use of energy and materials. Thus, a
given amount of goods can be produced with succes-
sively reduced burdens on natural resources and
environment. One aspect of this progress may be
better and more efficient reuse and recycling of
materials, which (coupled with greater efficiency in
use) can yield large resource savings.
4.3.5.1. R&D. As income grows, people can adopt
better and efficient technology that provide cleaner
environment. This preferential behaviour of people
should be reflected through their income elasticity.
The income elasticity of public research and develop-
ment funding for environmental protection is positive
(Komen et al., 1997). It is true for public expenditure
on R&D for environmental protection in the case of
19 OECD countries over the period 1980–1994
(Magnani, 2000). This indicates the key role of such
public investments for environmental improvements
in reducing environmental degradation as income
S. Dinda / Ecological Economics 49 (2004) 431–455 445
levels rise and even decreasing relationships found for
some pollution indicators in developed countries. The
effect of economic growth on pollution/emissions
differs substantially among high-income countries.
Relative income32 and political framework in which
policy decisions are taken determine the emergence of
downward sloping segment of EKC. This also
depends on the adoption of new technology.
4.3.5.2. Innovation and adoption. New technolo-
gies, unambiguously, improve productivity but create
potential dangers to the society such as new hazardous
wastes, risk and other human problems. These exter-
nalities are unknown in the early phase of diffusion of
technology, in later stages regulation becomes war-
ranted to address it. Once the technology is regulated,
this may stimulate the gradual phase out of existing
technology. So, a cyclical pattern arises in technolo-
gies, which first diffuse, then become regulated and
finally are phased out by next generation of technol-
ogies (Smulder and Bretschger, 2000). Thus, an
inverted-U shape can be observed with reference to
each technology. Since the pattern of innovation,
income growth and pollution over cycles, a sequence
of Environmental Kuznets Curves emerge related to
each technology. This may produce an envelope of
EKCs, which may be again an inverted-U- or N-
shaped or inverted-L curve (Dinda, 2003b). The
Environmental Kuznets Curve hypothesis is con-
firmed with empirical evidence for several pollutants.
Earlier EKCs studies provide that some pollutants
follow N-shaped relationship with income, and pollu-
tants have different turning points. This implies that
over a certain period during which income grows, one
pollutant may decline but another may rise due to
adoption of new technology.33
4.3.5.3. Technological and organizational change.
Improved technology not only significantly increases
productivity in the manufacture of old products but
also the development of new products. There is a
32 A gap between country’s ability to pay (ATP) for environ-
mental protection and a country’s willingness to pay (WTP) provide
the existing income inequality (Heerink et al., 2001).33 Some pollutants are phased out completely in developed
economies (CFC), while other pollutants are rising (CO2). There is
no evidence, therefore, that a relevant composite index of pollution
declines with income.
growing trend among industries to reconsider their
production processes and thereby take environmental
consequences of production into account. This con-
cerns not only traditional technological aspects but
also the organization of production as well as the
design of products. Technological changes associated
with the production process that may also result in
changes in the input mix of materials and fuels (Lind-
mark, 2002). Material substitution may be an impor-
tant element of advance economics (Labys andWadell,
1989) that may result in lower environmental impacts.
The economy-wide reforms often contribute simulta-
neously to the economic, social and environmental
gains (Anderson and Cavandish, 2001; Pasche, 2002).
The EKC approach seeks to relate the stages of
economic development of a country to that of envi-
ronmental degradation. Developing countries could
learn from the experiences of industrialized nations,
and restructure growth and development to tunnel
through (Munasinghe, 1999) any potential EKC—
thereby avoiding going through the same stages of
growth that involve relatively high (and even irrevers-
ible) levels of environmental harm.
However, it is not clear which effective environ-
mental policies should encompass to reduce pollution.
Yet, virtually all of the studies that investigated EKCs
have hinted at the important policy implications of
their work.
5. Policy implication for EKC
Now EKC has become standard fare in technical
conversations about environmental policy. Under-
standing the impact of economic growth on environ-
mental quality is becoming increasing important as
environmental concerns are making their way into
main public policy agenda (Anderson and Cavandish,
2001). The policy implication of EKCs is that pro-
moting economic growth are sufficient criteria to
safeguard the environment. In the long run, the surest
way to improve the environment is to become rich34
(Beckerman, 1992). But environmental policies may
or may not be implemented when economy develops
(Shafik and Bandyopadhyay, 1992). There are several
34 Various authors have criticized these conclusions, most
significantly in an article by Arrow et al. (1995).
S. Dinda / Ecological Economics 49 (2004) 431–455446
points that impede a clear policy conclusion derived
from the EKCs: Few questions are raised regarding
EKC related policy, such as: (i) Is EKC valid for all
types of environmental pressure? (ii) Is EKC perma-
nent? (iii) Is EKC valid both for individual countries
and the World? and, lastly, (iv) Does EKC follow a
sustainable development path? Positive answers to
these questions would grant the EKC policy rele-
vance. Negative answers would indicate that the
validity and policy relevance of EKCs is partial—
partial with respect to countries, indicators, time and
cost-effectiveness.
5.1. Is EKC valid for all types of environmental
pressure?
Empirical evidences suggest that environmental
problems may be solved at higher levels of income
only for some environmental quality indicators. This
is true when there is a direct link between environ-
mental quality and human health impacts (Gangad-
haran and Valenzuela, 2001). The EKC applies only to
environmental problems that are easy to solve and
which are well documented and well known. Most of
the air pollutants (that have been investigated) are
energy related, such as SO2, NOx, SPM, CO and CO2.
EKC is valid for SO2, CO emissions and particulate
matters, etc., other pollutants follow either monoto-
nicity or N-shaped.
5.2. Is EKC permanent?
The EKC hypothesis assumes that the initial
increases in environmental pressure are temporary,
but that the subsequent decreases in environmental
pressure are permanent. Only a few authors have
questioned whether these observed decreases could
also be a temporary phenomenon due to technological
limitation (Dinda et al., 2000). The result would be an
‘N’-shaped curve.35 An upswing of EKC can be
explained by the difficulty of keeping up efficiency
improvements (innovation) with continuing growth of
production. On an aggregated indicator of material and
energy throughput suggest that the second half of the
35 De Bruyn and Opschoor (1997) and Sengupta (1997) found
N-shaped curve. Grossman and Krueger (1995) also found it for
SO2.
1980s most developed economies have gone through a
phase of re-linking their throughput with economic
growth (de Bruyn and Opschoor, 1997). The fact that
re-linking cannot be found for pollutants such as SO2,
particulate matter and CO2 may reflect the continuing
importance of end-of-pipe solutions over more funda-
mental changes in the economy, such as reducing
throughput. Pollutants for which the end-of-pipe solu-
tion is costly may follow a similar N-shaped pattern.
5.3. Is EKC valid both for individual countries and
the world?
Generally, the EKC is estimated in a cross-section
panel of countries. Such estimates do not guarantee
that over time individual countries will move along
the estimated relationship (de Bruyn et al., 1998). The
results of panel countries and that of individual or sub-
sample countries vary widely (Dijkgraaf and Volle-
bergh, 1998; Stern and Common, 2001). Developed
countries are often associated with lower emission
reductions but in developing countries, the environ-
mental pressure increases over time. Developing
countries have not yet reached income levels high
enough to be able to derive their turning points. The
worldwide emission prospects are not optimistic as it
might be expected on the basis of EKC results.
According to EKC hypothesis, the improvements in
environmental quality are not attainable for the ma-
jority of the world population that has the standards of
living substantially below the estimated turning points
(Stern et al., 1996). Therefore, worldwide emissions
are expected to continue to increase due to economic
growth (Selden and Song, 1994).
5.4. Does EKC follow a sustainable development
path?
EKCs represent the patterns of flows of pollutants,
whereas environmental impacts are often character-
ized as a stock problem (Arrow et al., 1995). The
EKC, therefore, does not necessarily reflect a sustain-
able time path of pollution (Dinda, 2003a; Ekins,
1998; Gruver, 1976; Zang, 1998). Maximum level
of pollution depends on costs and benefits of pollution
abatement, which differ among countries. Differences
in absorptive capacities, social preferences and dis-
count rates give rise to different costs–benefits struc-
S. Dinda / Ecological Economics 49 (2004) 431–455 447
tures, which implies different optimal levels of pollu-
tion among countries. This limits the policy relevance
of an estimated collective turning point for a whole
sample of countries. There is no guarantee that the
rising part and top of EKC bypass ecological thresh-
olds and sustainability constraints beyond which en-
vironmental deterioration is irreversible (Arrow et al.,
1995; Panayotou, 1993).
5.5. Socio-political regime
Restructuring the environment may become unnec-
essarily expensive, and it may be less costly to prevent
or abort today than in future. Most of authors agree that
environmental policies are key determinants of the
future path of income–environment relationship. Ac-
tually, public preferences are reflected through envi-
ronmental quality related public policy that influence
the relationship between income and pollution. In other
words, researchers have identified some demand-side
characteristics that influence the state’s environmental
policy regime, and they also explained the mechanism
through which these preferences are manifested.
Provision of public good, especially with regard to
air and water quality, comes from state because
individuals of the society are unable to purchase
abatement technology directly. So, the environmental
policy is a function of the preferences of society.
Actual levels of environmental quality depend on
weights placed on various heterogeneous societal
preferences by policy makers, which can be generally
characterized as the policy regime. One major deter-
minant of environmental policy is the socio-political
regime of a particular country. Corruption and rent
seeking behaviour may influence the income–envi-
ronment relationship (Lopez and Mitra, 2000). Awell-
defined property rights, democratic voting systems
and respect of human rights can create synergies,
which lead to increased levels and efficacy of envi-
ronmental policy36 (Magnani, 2000).
36 The EKC is observed for some pollutants underlying the
process of growth and structural change, and demand shifts are also
slow and gradual. It takes several decades to improve environmental
quality unless active environmental policy intervenes. The possible
insight is the advance of a country along its EKC may not only
relate to its own level of economic development and environmental
policies, but also to its competitive position relative to other
countries (Panayotou, 1999).
Policies are generally formulated at national level
and it is implemented at local levels. These command-
and-control policies are inefficient and ineffective
because policy makers suffer from lack of proper infor-
mation about local environmental damage. Local com-
munities should properly protect their environment.
The demand for environmental protection therefore
comes from local levels to national levels, which there-
by leads to global level. It is demand led policies that
are emerging which will actually rule the FutureWorld.
6. A critique
The Environmental Kuznets Curve model has eli-
cited conflicting reactions from researchers and policy-
makers. The stakes in the EKC debate are high for both
developing and developed countries. It is clear that
EKC can take shape from a multiplicity of possible
outcomes of economic development. So, proper atten-
tion is required for multiple factors that form the
economic–environmental system, rather than a single
dominant one (Ezzati et al., 2001). Since these factors
are interdependent, it is difficult to determine the
factors that may dominate and govern the shape of
EKC. The uses of reduced form models,37 as explained
above, deny any insight into the underlying causes of
EKCs. The lack of insight into the process that causes
pollution to curve downwards beyond a particular
income level makes designing of specific policy
implications from an EKC difficult. The EKC analysis
thus has significant deficiencies. There are increasing
grounds to be cautious about EKC hypothesis.
6.1. A conceptual critique
As already mentioned, the inverted-U relation or
EKC cannot be generalized for all types of pollutants.
There is little empirical support for an inverted-U-
shaped relationship between income and several im-
portant air pollutants (Harbaugh et al., 2002). Envi-
ronmental indicators, for which the EKC hypothesis is
most plausible, are various indicators of air pollutants
37 Since both income and environmental quality are endoge-
nous variables, i.e., the impact each other, therefore, the estimation
of single equation relationships where simultaneity exists will
produce biased and inconsistent estimates (Hung and Shaw, 2002).
39 Better policies and institutional setup can help to flatten the
EKC (Panayotou, 1997).40 Incorporating spatial intensity of economic activity may turn
the relationship between per capita income and atmospheric
S. Dinda / Ecological Economics 49 (2004) 431–455448
such as SO2 and SPM. However, this EKC relation is
only confirmed for pollutants involving local short-
term cost (for example, SPM, SO2, CO, etc.), not for
the accumulated stocks of waste or for pollutants
involving long-term and more dispersed costs (such
as CO2), which are often increasing functions of
income. For example, for some pollutants, notably
CO2 emission, the EKC relationship does not hold in
any meaningful way (Holtz-Eakin and Selden, 1995;
Dinda, 2001; Robers and Grimes, 1997).
The EKC may not hold even in the long run (de
Bruyn et al., 1998; Dinda et al., 2000). Economy can
foresee a so-called N-shaped curve, which exhibits the
inverted-U curve initially, but beyond a certain income
level, the relationship between environmental pressure
and income turns positive38 again. This suggests that
the re-linking hypothesis may be plausible (de Bruyn
andOpschoor, 1997; Sengupta, 1997). For example, the
levels of aggregate materials consumption over time
may show an N shape rather than an inverted-U shape.
Environmental quality also degrades due to water
pollution. The relationship between industrial share of
national output and industrial water pollution follows
a Kuznets-type trajectory. However, other two deter-
minants (share of polluting sectors in industrial output
and end-of-pipe pollution intensities in polluting sec-
tors) do not (Hettige et al., 2000b). Moreover, the
EKC relation does not hold even for total industrial
water pollution and toxic pollution (Lucas et al., 1992;
Hettige et al., 2000b).
Environmental quality may also deteriorate as pop-
ulation pressure increases more and more. It is clear
from the existing literature that most of the world’s
population lies on the upward sloping portion of EKCs.
This implies that, even if the EKC exists, income
growth across the global population will increase
environmental damage (Ekins, 1997). Such damage is
considered to be the main obstacle or hindrance to
attaining sustainable development (O’Neill et al.,
38 This is a secondary turning point (between income levels of
US$10,000 and US$16,000; for instance, see Sengupta, 1997 and
Dinda et al., 2000 and the footnotes in Grossman and Krueger,
1995) at which the levels of ambient air pollution tends to increase.
This N-shaped relationship may be justified as an efficient
technology improves the resource uses that have been exhausted,
at the same time abatement opportunities become too expensive. In
this situation, further income growth will result in net environmental
degradations (De Bruyn et al., 1998).
1996). Thus, economic growth may not automatically
lead to a higher environmental quality and only strong
pressure for environmental policy39 may help in this
regard (Grossman and Krueger, 1995).
Environmental policy is designed on the basis of
empirical findings, which actually depends on the
choice of appropriate variables (measured in terms of
relative or absolute level). Empirical studies have
mostly used absolute measure of pollution like amount
of emission or pollution rather than a relative measure
(like pollution or emission per unit of output or per
square kilometer, etc.). Use of a relative measure of
pollution or emission, i.e., pollution intensity, may
reveal a U shape or a monotonic relation with income
rather than an inverted-U shape40 (which may be true
for absolute level). It should be noted in this context
that the effect of income on pollution intensity tends to
be negative in open economies, but positive in closed
economies.
The objective of empirical study is not only to find
the existing relationship but also to help predict the
future. Forecasting (or predictions) of environmental
quality actually depends on the estimated income–
environment relationship (which is based on observed
data). Prediction will be meaningful and correct if the
existing relations hold in future. Predictive success is
really a very limited conception over a longer period of
time. For example, the immediate past has allowed
much growth and technological progress that does not
mean the same holds for an indefinite period of time
into the future. The existence of EKC does not ensure
to exist in future because of pressures of global
competitions41 for environmental standards and regu-
lations. The EKC analysis does not yet establish the
concentration of SO2 upside down (Kaufmann et al., 1998).41 The different pressure groups should be created for betterment
of environment or to protect it. These pressure groups set up mainly
on the regional basis like European Community (EC), North Ameri-
can Free Trade Agreement (NAFTA), SAARC Preferential Trading
Agreement (SAPTA), etc. These pressure groups set up their own
environmental standards and force to internationalize their standards.
The top pressure group is the USA and European Union, who are so
eager to adopt their environmental norms in the international level
through World Trade Organization (see the results of recent WTO
meetings in Seattle, 1999, Doha, 2001, and Cancun, 2003).
S. Dinda / Ecological Economics 49 (2004) 431–455 449
channels through which economic globalization
affects the pollution levels or existing environmental
quality (Tisdell, 2001).
Finally, the concept of EKC cannot be applied to all
the environmental factors. For example, land-use
change and/or bio-diversity loss, which are irrevers-
ible, are conceptually different from air or water
pollution.
6.2. A methodological critique
As mentioned above, several authors have applied
various methodologies in their empirical studies. Most
of the studies have used cross-section data to examine
the EKC hypothesis for group of countries and enough
attention has not been given to country-specific EKC.
The basic assumption behind pooling42 the data of
different countries in one panel is that economic
development trajectory would be the same for all. This
assumption should be criticized because wide cross-
country variations are observed in social, economical,
political and biophysical factors that may affect envi-
ronmental quality. (For example, the percentage of
forest covered area in total area varies from country
to country.) Under such heterogeneity of conditions,
the use of random effect model may be appropriate for
examining shape of economic growth–environment
relationship based on cross-country, cross-sectional
data43 (Koop and Tole, 1999).
It should be noted that the global environmental
degradation (GED) level instead of country’s pollu-
tion or emission levels due to economic development
might be an important factor (for global EKC), which
has been ignored in the existing EKC literature. Using
environmental degradation index (EDI) and an appro-
priate measure of economic development (i.e., Human
Development Index [HDI]), one can develop a global
EKC model (Jha and Bhanu Murth, 2003). It should
be noted that empirical support for the existence of a
global EKC for CO2 emissions44 has not been found,
42 A critique raises about assumptions underlying pooling of
observations relating to different countries in one panel.43 With regards to the data, Stern et al. (1996) has criticized the
deforestation data, which informed the analysis of Panayotou (1993)
and Cropper and Griffiths (1994).44 The EKC may be a problematic concept, as simple global
EKC models are mis-specified (Perman and Stern, 1999; Dinda,
2001).
although some meaningful relationships between in-
come and CO2 emissions in individual countries have
been observed (Dijkgraaf and Vollebergh, 1998). The
coefficient estimates for carbon emissions45 for a
panel of OECD countries differ from those obtained
for individual country-specific time series that consti-
tute the panel. Little attention has been paid to time
series properties of the data, whether variables used in
EKC are stationary or/and integrated (Perman and
Stern, 1999; Coondoo and Dinda, 2002).
A number of relevant factors have so far been
omitted in the EKC studies, such as transboundary
and intergenerational externalities (Ansuategi et al.,
1998; Copeland, 1996). Trade is supposed to be an
important explanatory factor for EKC relationship. As
argued above, high-income countries have greater
emission reduction possibilities because they may
shift polluting industries to other countries through
trade. The export and import of manufactured goods
are likely to be much stronger determinants of the
level of energy consumption than income (Suri and
Chapman, 1998). The amount of energy consumption
depends on its prices. Thus, the energy price may be a
relevant variable for explaining EKC (Agras and
Chapman, 1999).
The non-availability of actual data on environmen-
tal quality is the major limitation of all EKC studies.
Truly speaking, environmental quality is something
that is not easy to be measured accurately. Therefore,
an index of environmental quality, which could be
better measurement, should be developed and used to
examine the EKC hypothesis (Fare et al., 2001).
The empirical robustness of EKC relation still
remains an open issue (Grossman and Krueger,
1996). The reduced form rather than structural form
equations have been used in most of the EKC studies.
Actually, environmental outcomes are related to
endowments of individual countries but (economic
measures in) reduced forms are silent about causal
mechanisms.46 More structural forms may warrant
exploration, for some interdependence in our environ-
mental indicators is probable (Dinda and Coondoo,
45 In this situation, non-parametric, Bayesian or/and agent-
based approach can fit the data better than regression models
(Taskin and Zaim, 2000; Halkos and Tsionas, 2001; Bartoszezuk et
al., 2001).46 Causal mechanism is discussed in details in Coondoo and
Dinda (2002).
S. Dinda / Ecological Economics 49 (2004) 431–455450
2001). For example, use of pesticide may destroy
useful insects or micro-organisms (and thus hamper
soil fertility) or threaten bird species, but this kind of
interdependence remains yet to be explored.
7. Conclusion
This paper reviews a number of studies on the
Environmental Kuznets Curve hypothesis. The EKC
hypothesis postulates an inverted-U-shaped relation-
ship between different pollution indicators and in-
come, that is, environmental pressure increases up to
a certain level as income goes up, after that it
decreases. An EKC actually reveals how a technically
specified measurement of environmental quality may
change as the fortunes of a country change. Evidence
of the existence of the EKC has been questioned from
several corners. Only some air quality indicators,
especially local pollutants, show the evidence of an
EKC. Moreover, there is no agreement in the litera-
ture about the income level (turning point) at which
environmental degradation starts to improve. This
paper discusses about the results, methods, explana-
tions and policy implications of the studies that have
found empirical evidence for the EKC hypothesis. A
critical evaluation follows these discussions. There
are increasing grounds to be cautious about EKC
hypothesis and related policies. Environmental deg-
radation, actually, is a multifaceted problem and
different stages of environmental damage have some
definite relations with economic growth. Since one
such relation is EKC, which can be explained in
multidimensional ways or in terms of multidimen-
sional issues. From the EKC literature, it is clear that
there is no single policy, which can reduce pollution
levels with rising economic growth. However, the
subject is open-ended and EKC analysis continues to
be widely used. Evidence for the existence of EKC is
inconclusive.
From this mixed evidence about the relationship of
economic growth and environmental quality, we can
draw some conclusions and some points require elab-
oration for future research. Firstly, we need economic
models, which properly reflect the physical and eco-
logical basis of economic activity, and important
feedback between the economy and the environment.
Secondly, identification of the dominant factors that
explain the EKC should have a high priority in
research. One can design a policy that affects the
course of the EKC only when the factors behind
EKC have been properly identified. Thirdly, estima-
tion of structural models, instead of reduced-form
models, may be needed to identify the actual mecha-
nism for this purpose. Fourthly, decomposition analy-
sis can provide more insight into which combination of
explanations is dominant, such as technological prog-
ress and structural changes. Fifthly, in addition to panel
data analysis, efforts should be devoted to time-series
analysis that may provide a better picture of the
development of pollution associated with specific
phases of development in individual countries. Sixthly,
on a political level (there is no automatic process)
courageous policy measures are necessary to allow for
economic sustainability. Lastly, in case of adoption of
new technology, society should be cautious about the
possible unknown pollutants and waste hazards.
Acknowledgements
I am grateful to two anonymous referees of this
Journal for helpful suggestions and comments on
earlier drafts of this paper. I gratefully acknowledge
Professor Dipankor Coondoo for helpful suggestions
and valuable comments.
References
Afsah, S., Laplante, B., Wheeler, D., 1996. Controlling industrial
pollution: a new paradigm. World Bank, Policy Research De-
partment. working paper 1672.
Agarwal, A., Chopra, R., Sharma, K., 1982. The State of India’s
Environment 1982. Centre for Science and Environment, New
Delhi, India.
Agras, J., Chapman, D., 1999. A dynamic approach to the Envi-
ronmental Kuznets Curve hypothesis. Ecological Economics 28
(2), 267–277.
Anderson, D., Cavandish, W., 2001. Dynamic simulation and en-
vironmental policy analysis: beyond comparative statics and
environmental Kuznets curve. Oxford Economic Papers 53,
721–746.
Andreoni, J., Levinson, A., 2001. The simple analytics of the En-
vironmental Kuznets Curve. Journal of Public Economics 80
(2), 269–286.
Ansuategi, A., Barbier, E., Perrings, C., 1998. The Environmental
Kuznets Curve. In: van den Bergh, J.C.J.M., Hofkes, M.W.
S. Dinda / Ecological Economics 49 (2004) 431–455 451
(Eds.), Theory and Implementation of Sustainable Development
Modelling. Kluwer Academic, Dordrecht.
Antweiler, W., Copeland, B.R., Taylor, M.S., 2001. Is free trade
good for the environment? American Economic Review 91 (4),
877–908.
Arrow, K., Bolin, B., Costanza, R., Folke, C., Holling, C.S., Janson,
B., Levin, S., Maler, K., Perrings, C., Pimental, D., 1995. Eco-
nomic growth, carrying capacity, and the environment. Science
15, 91–95 (reprint in Ecological Economics).
Auty, R., 1985. Materials intensity of GDP: research issues on the
measurement and explanation of change. Resource Policy 11,
275–283.
Baldwin, R., 1995. Does sustainability require growth? In: Goldin,
I., Winters, L.A. (Eds.), The Economics of Sustainable Devel-
opment. Cambridge Univ. Press, Cambridge, UK, pp. 19–47.
Barbier, E., 1997. Introduction to the Environmental Kuznets curve
special issue. Environment and Development Economics 2 (4),
369–381.
Bartlett, B., 1994. The high cost of turning green. Wall Street
Journal (September 14) Sec. A. Page 18.
Bartoszezuk, P., Ma, T., Nakamari, Y., 2001. Environmental Kuznets
curve for some countries—regression and agent-based approach.
Japan Advance Institute of science and Technology (mimeo).
Beckerman, W., 1992. Economic growth and the environment:
whose growth? Whose environment? World Development 20,
481–496.
Beede, D., Wheeler, D., 1992. Measuring and explaining cross-
establishment variation in the generation and management of
Industrial waste. World Bank mimeo.
Beltratti, A., 1997. Models of Economic Growth with Environmen-
tal Assets. Kluwer Academic, London.
Berrens, R., Bohara, A., Gawande, K., Wang, P., 1997. Testing the
inverted U-hypothesis for U.S. hazardous waste: an application
of the generalized gamma model. Economics Letters 55 (3),
435–440.
Bhagawati, J., 1993. The case for free trade. Scientific American,
42–49.
Bhattarai, M., Hammig, M., 2001. Institutions and the Environmen-
tal Kuznets Curve for deforestation: a cross-country analysis for
Latin America, Africa, and Asia. World Development 29 (6),
995–1010.
Bimonte, S., 2002. Information access, income distribution, and
the Environmental Kuznets Curve. Ecological Economics 41,
145–156.
Birdsall, N., Wheeler, D., 1993. Trade policy and industrial pollu-
tion in Latin America: where are the pollution havens? Journal
of Environment and Development 2, 137–149.
Bohara, A., Gawande, K., Berrens, R., Wang, P., 1999. Environ-
mental Kuznets Curve(s) for U.S. Hazardous waste sites: theory
and evidence. Manuscript, Department of Economics, Univer-
sity of Mexico.
Bommer, R., 1999. Environmental policy and industrial com-
petitiveness: the Pollution Haven Hypothesis reconsidered. Re-
view of International Economics 7 (2), 342–355.
Brandoford, D.F., Schlieckert, R., Shore, S.H., 2000. The Environ-
mental Kuznets Curve: exploring a fresh specification. NBER.
Working paper 8001.
Bulte, E.H., van Soest, D.P., 2001. Environmental degradation in
developing countries: households and the (reverse) environ-
mental Kuznets curve. Journal of Development Economics
65, 225–235.
Canas, A., Ferrao, P., Conceicao, P., 2003. A new environmental
Kuznets curve? Relationship between direct material input and
income per capita: evidence from industrialized countries. Eco-
logical Economics 46, 217–229.
Carson, R.T., Jeon, Y., McCubbin, D.R., 1997. The relationship
between air pollution emissions and income : US data. Environ-
ment and Development Economics 2, 433–450.
Cavlovic, T.A., Baker, K.H., Berrens, R.P., Gawande, K., 2000. A
meta-analysis of Environmental Kuznets Curve studies. Agricul-
tural and Resource Economics Review 29 (1), 32–42.
Chaudhuri, S., Pfaff, A., 1998. Household income, fuel choice, and
indoor air quality: micro-foundations of an Environmental Kuz-
nets Curve. Economics Department, Columbia University.
Mimeo.
Chichilinsky, G., 1994. North–South trade and the global environ-
ment. American Economic Review 84, 851–874.
Cole, M.A., Rayner, A.J., Bates, J.M., 1997. The Environmental
Kuznets Curve : an empirical analysis. Environment and Devel-
opment Economics 2, 401–416.
Cole, M.A., Elliott, R.J.R., Azhar, A.K., 2000. The determinants of
trade in pollution intensive industries: North–South evidence.
University of Birmingham, UK. Mimeo.
Cole, M.A., 2004. Trade, the pollution haven hypothesis and envi-
ronmental kuznets curve: examining the linkages. Ecological
Economics 48, 71–81.
Coondoo, D., Dinda, S., 2002. Causality between income and emis-
sion: a country group-specific econometric analysis. Ecological
Economics 40 (3), 351–367.
Copeland, B.R., 1996. Pollution content tariffs, environmental rent
shifting, and the control of cross-border pollution. Journal of
International Economics 40, 459–476.
Copeland, B.R., Taylor, M.S., 1995. Trade and environment: a
partial synthesis. American Journal of Agricultural Economics
77, 765–771.
Cropper, M., Griffiths, C., 1994. The interaction of populations,
growth and environmental quality. American Economic Review
84, 250–254.
Dasgupta, S., Hettige, H., Wheeler, D., 2000. What improves en-
vironmental compliance? Evidence from Mexican industry.
Journal of Environmental Economics and Management 39,
39–66.
Dasgupta, S., Laplante, B., Mamingi, N., 2001a. Pollution and
capital market in developing countries. Journal of Environmen-
tal Economics and Management 42, 310–335.
Dasgupta, S., Mody, A., Roy, S., Wheeler, D., 2001b. Environmen-
tal regulation and development: a cross-country empirical anal-
ysis. Oxford Development Studies 29 (2), 173–187.
Dasgupta, S., Laplante, B., Wang, H., Wheeler, D., 2002. Confront-
ing the Environmental Kuznets Curve. Journal of Economic
Perspectives 16 (1), 147–168.
Dean, J.M., 2004 (January). Foreign direct investment and pollution
havens: evaluating the evidence from China. Meeting of Amer-
ican Associations.
S. Dinda / Ecological Economics 49 (2004) 431–455452
de Bruyn, S.M., 1997. Explaining the Environmental Kuznets
Curve: structural change and international agreements in reduc-
ing sulphur emissions. Environment and Development Econom-
ics 2, 485–503.
de Bruyn, S.M., Heintz, R.J., 1998. The Environmental Kuznets
Curve hypothesis. Handbook of Environmental Economics
Blackwell Publishing Co., Oxford, 656–677.
de Bruyn, S.M., Opschoor, J.B., 1997. Developments in the
throughput – income relationship: theoretical and empirical
observations. Ecological Economics 20, 255–268.
de Bruyn, S.M., van den bergh, J.C.J.M., Opschoor, J.B., 1998.
Economic growth and emissions: reconsidering the empirical
basis of Environmental Kuznets Curves. Ecological Economics
25, 161–175.
Dessus, S., Bussolo, M., 1998. Is there a trade-off between trade
liberalization and pollution abatement? A computable general
equilibrium assessment applied to Costa Rica. Journal of Policy
Modeling 20 (1), 11–31.
Dijkgraaf, E., Vollebergh, H.R.S., 1998. Growth and environ-
ment—is there a Kuznets curve for carbon emissions?. 2nd
ESEE conference, University of Geneva.
Dinda, S., 2001. A note on global EKC in case of CO2 emission.
Economic Research Unit, Indian Statistical Institute, Kolkata.
Mimeo.
Dinda, S., 2002. A theoretical basis for Environmental Kuznets
Curve. Economic Research Unit, Indian Statistical Institute,
Kolkata. Mimeo.
Dinda, S., 2003. Economic growth with environmental and physical
capital: a convergence approach. Mimeo.
Dinda, S., 2003. Technology and envelope of EKCs. Mimeo.
Dinda, S., Coondoo, D., 2001. Income and emission: a panel data
based cointegration analysis. Economic Research Unit, Indian
Statistical Institute, Kolkata. Mimeo.
Dinda, S., Coondoo, D., Pal, M., 2000. Air quality and economic
growth: an empirical study. Ecological Economics 34 (3),
409–423.
Ekins, P., 1997. The Kuznets Curve for the environment and eco-
nomic growth: examining the evidence. Environment and Plan-
ning A 29, 805–830.
Ekins, P., 1998. . Economic Growth and Environmental Sustain-
ability, 182–214 (chap. 7).
Eskeland, G.S., Harrison, A.E., 2003. Moving to greener pastures?
Multinationals and the pollution haven hypothesis. Journal of
Development Economics 70 (1), 1–23.
Ezzati, M., Singer, B.H., Kammen, D.M., 2001. Towards an inte-
grated framework for development and environmental policy:
the dynamics of Environmental Kuznets Curves. World Devel-
opment 29 (8), 1421–1434.
Fare, R., Grosskopt, S., Zaim, O., 2001. An index number approach
to measuring environmental performance: an Environmental
Kuznets Curve for the OECD countries, (mimeo), Department
of economics, Oregon State University, USA.
Friedl, B., Getzner, M., 2003. Determinants of CO2 emissions
in a small open economy. Ecological Economics 45 (1),
133–148.
Gangadharan, L., Valenzuela, M.R., 2001. Inter-relationships be-
tween income, health and the environment: extending the Envi-
ronmental Kuznets curve hypothesis. Ecological Economics 36
(3), 513–531.
Gawande, K., Bohara, A.K., Berrens, R.P., Wang, P., 2000. Internal
migration and the Environmental Kuznets Curve for U.S. haz-
ardous waste sites. Ecological Economics 33 (1), 151–166.
Gawande, K., Berrens, R.P., Bohara, A.K., 2001. A consumption-
based theory of the environmental Kuznets curve. Ecological
economics 37 (1), 101–112.
Grether, J.-M., Melo, J. de., 2002. Globalization and dirty indus-
tries: do pollution havens matter? Department d’economie and
Politique, Neuchatel, Switzerland. Mimeo.
Grossman, G.M., Krueger, A.B., 1991. Environmental impacts of
the North American Free Trade Agreement. NBER. Working
paper 3914.
Grossman, G.M., Krueger, A.B., 1993. Environmental impacts of
the North American Free Trade Agreement. In: Garber, P. (Ed.),
The U.S. –Mexico Free Trade Agreement. MIT Press, Cam-
bridge, pp. 13–56.
Grossman, G.M., Krueger, A.B., 1995. Economic growth and the
environment. Quarterly Journal of Economics 110 (2), 353–377.
Grossman, G.M., Krueger, A.B., 1996. The inverted-U: what does
it mean? Environment and Development Economics 1 (2),
119–122.
Gruver, G.W., 1976. Optimal investment in pollution control capital
in a neoclassical growth context. Journal of Environmental Eco-
nomics and Management 5, 165–177.
Gupta, S., Goldar, B., 2003. Do stock markets penalize environ-
ment-friendly behaviour. Evidence from India, Institute of Eco-
nomic Growth. Mimeo.
Halkos, G.E., Tsionas, E.G., 2001. Environmantal Kuznets Curves:
Bayesian evidence from switching regime models. Energy Eco-
nomics 23, 191–210.
Hamilton, J.T., 1995. Pollution as news: media and stock market
reactions to the toxics release inventory date. Journal of Envi-
ronmental Economics and Management 28 (1), 98–113.
Harbaugh, W., Levinson, A., Wilson, D.M., 2002. Re-examining
the empirical evidence for an Environmental Kuznets Curve.
The Review of Economics and Statistics 84 (3), 541–551.
Harrison, A., 1996. Openness and growth: a time-series, cross-
country analysis for developing countries. Journal of Develop-
ment Economics 48, 419–447.
Hartman, R., Huq, M., Wheeler, D., 1995. Why paper mills clean
up: determinants of pollution abatement in four Asian countries.
World Bank, Policy Research Department working paper
no. 1710.
Heerink, N., Mulatu, A., Bulte, E., 2001. Income inequality and the
environment: aggregation bias in environmental Kuznet curves.
Ecological Economics 38, 359–367.
Hettige, H., Lucas, R.E.B., Wheeler, D., 1992. The toxic intensity
of industrial production: global patterns, trends and trade policy.
American Economic Review 82, 478–481.
Hettige, H., Martin, P., Singh, M., Wheeler, D., 1995. The industrial
pollution projection system. World Bank Policy Research De-
partment working paper no. 1431.
Hettige, H., Huq, M., Pargal, S., Wheeler, D., 1996. Determinants
of pollution abatement in developing countries: evidence from
South and Southeast Asia. World Development 24, 1891–1906.
S. Dinda / Ecological Economics 49 (2004) 431–455 453
Hettige, H., Dasgupta, S., Wheeler, D., 2000a. What improves en-
vironmental compliance? Evidence from Mexican industry.
Journal of Environmental Economics and Management 39 (1),
39–66.
Hettige, H., Mani, M., Wheeler, D., 2000b. Industrial pollution in
economic development: the environmental Kuznets curve revis-
ited. Journal of Development Economics 62, 445–476.
Hilton, F.G.H., Levinson, A., 1998. Factoring the Environmental
Kuznets Curve: evidence from automotive lead emissions.
Journal of Environmental Economics and Management 35,
126–141.
Holtz-Eakin, D., Selden, T.M., 1995. Stoking the fires?: CO2 emis-
sions and economic growth. Journal of Public Economics 57,
85–101.
Horvath, R.J., 1997. Energy consumption and the Environmental
Kuznets Curve debate. Department of Geography, University of
Sydney, Australia. Mimeo.
Hung, M.-F., Shaw, D., 2002. Economic growth and the Environ-
mental Kuznets Curve in Taiwan: a simultaneity model analysis.
Department of Economics, National Cheng-Chi University.
Mimeo.
Huq, M., Wheeler, D., 1992. Pollution reduction without formal
regulation: evidence from Bangladesh. World Bank Environ-
ment Department working paper no. 39.
Jaeger, W., 1998. A theoretical basis for the environmental inverted
U curve and implications for international trade. Williams Col-
lege. Mimeo.
Jaeger, W., Patel, S., Pinckney, T., 1995 (November). Smallholder
wood production and population pressure in East Africa: evi-
dence of an Environmental Kuznets Curve? Land Economics
vol. 71, 1–21.
Jaffe, A., Peterson, S., Portney, P., Stavins, R., 1995. Environmental
regulation and the competitiveness of U.S. manufacturing: what
does the evidence tell us? Journal of Economic Literature 33 (1),
132–163.
Janicke, M., Binder, M., Monch, H., 1997. Dirty industries: patterns
of change in industrial countries. Environmental and Resource
Economics 9, 467–491.
Jha, S.K., 1996. The Kuznets Curve: a reassessment. World Devel-
opment 24 (4), 773–780.
Jha, R., Bhanu Murth, K.V., 2003. An inverse global environmen-
tal Kuznets curve. Journal of Comparative Economics 31,
352–368.
Jha, V., Markandya, A., Vossenaar, R., 1999. Reconciling Trade and
the Environment. Lessons from Case Studies in Developing
Countries. Edward Elgar Publishing, Northampton, Mass.
John, A., Pecchenino, R., 1994. An overlapping generations mod-
el of growth and the environment. Economic Journal 104,
1393–1410.
John, A., Pecchenino, R., Schimmelpfenning, D., Schreft, S., 1995.
Short-lived agents and the long-lived environment. Journal of
Public Economics 58, 127–141.
Jones, L.E., Rodolfo, E.M., 1995. A positive model of growth and
pollution controls. NBER working paper 5205.
Kadekodi, G., Agarwal, S., 1999. Why an inverted U-shaped En-
vironmental Kuznets Curve may not exist? Institute of Econo-
mic Growth, Delhi. Mimeo.
Kahn, M.E., 1998. A household level Environmental Kuznets
Curve. Economics Letters 59, 269–273.
Kaufmann, R.K., Davidsdottir, B., Garnham, S., Pauly, P., 1998.
The determinants of atmospheric SO2 concentrations: reconsi-
dering the environmental Kuznets curve. Ecological Economics
25, 209–220.
Komen, R., Gerking, S., Folmer, H., 1997. Income and environ-
mental R&D: empirical evidence from OECD countries. Envi-
ronment and Development Economics 2, 505–515.
Konar, S., Cohen, M., 1997. Information as regulation: the effect of
community right to know laws on toxic emissions. Journal of
Environmental Economics and Management 32, 109–124.
Koop, G., Tole, L., 1999. Is there an environmental Kuznets curve
for deforestation? Journal of Development Economics 58,
231–244.
Kristrom, B., Riera, P., 1996. Is the income elasticity of environ-
mental improvements less than one? Environmental and Re-
source Economics 7, 45–55.
Kuznets, P., Simon, P., 1955. Economic growth and income in-
equality. American Economic Review 45, 1–28.
Labys, W.C., Wadell, L.M., 1989. Commodity lifecycles in US
materials demand. Resources Policy 15, 238–252.
Lanoie, P., Laplante, B., 1994. The market response to environmen-
tal incidents in Canada: a theoretical and empirical analysis.
Southern Economic Journal 60, 657–672.
Lanoie, P., Laplante, B., Roy, M., 1998. Can capital markets create
incentives for pollution control? Ecological Economics 26 (1),
31–41.
Lee, H., Roland-Holst, D., 1997. The environment and welfare
implications of trade and tax policy. Journal of Development
Economics 52 (1), 65–82.
Letchumanan, R., Kodama, F., 2000. Reconciling the conflict be-
tween the ‘pollution haven’ hypothesis and an emerging trajec-
tory of international technology transfer. Research Policy 29 (1),
59–79.
Levinson, A., 1996. Environmental regulations and manufacturers’
location choices: evidence from the census of manufactures.
Journal of Public Economics 62, 5–29.
Liddle, B., 2001. Free trade and the environment–development
system. Ecological Economics 39 (1), 21–36.
Lindmark, M., 2002. An EKC-pattern in historical perspective:
carbon dioxide emissions, technology, fuel prices and growth
in Sweden 1870–1997. Ecological Economics 42, 333–347.
List, J.A., Gallet, C.A., 1999. The Environmental Kuznets Curve:
does one size fit all? Ecological Economics 31, 409–423.
Lopez, R., 1994. The environment as a factor of production: the
effects of economic growth and trade liberalization. Journal of
Environmental Economics and management 27, 163–184.
Lopez, R., Mitra, S., 2000. Corruption, pollution, and the Kuznets
environment curve. Journal of Environmental Economics and
Management 40 (2), 137–150.
Low, P., Yeats, A., 1992. Do ‘dirty’ industries migrate? In: Low,
P. (Ed.), International Trade and Environment World Bank,
Washington, DC, 89–103.
Lucas, R.E.B., Wheeler, D. and Hettige, H., 1992. Economic de-
velopment, environmental regulation and the international mi-
gration of toxic industrial pollution: 1960–1988, In: Low P.
S. Dinda / Ecological Economics 49 (2004) 431–455454
(Ed.) International Trade and the Environment, World Bank
discussion paper 159, 67–87.
Magnani, E., 2000. The Environmental Kuznets Curve, environ-
mental policy and income distribution. Ecological Economics
32, 431–443.
Malenbaum, W., 1978. World Demand for Raw Materials in 1985
and 2000. McGraw-Hill, New York.
Mani, M., Wheeler, D., 1998. In search of pollution havens? Dirty
industry in the world economy: 1960–1995. Journal of Envi-
ronment and Development 7 (3), 215–247.
Martin, P., Wheeler, D., 1992. Price, policies and the international
diffusion of clean technology: the case of wood pulp production.
In: Low, P. (Ed.), International Trade and the Environment.
World Bank, Washington, 197–224.
Matyas, L., Konya, L., Macquaries, L., 1998. The Kuznets U-Curve
hypothesis: some panel data evidence. Applied Economics Let-
ters 5 (11), 693–697.
McConnell, K.E., 1997. Income and the demand for environmen-
tal quality. Environment and Development Economics 2,
383–399.
McPherson, M.A. and Nieswiadomy, M.L., 2001. Sliding along the
Environmental Kuznets Curve: the case of biodiversity, Univer-
sity of North Texas. Mimeo.
Meadows, D.H., Meadows, D.L., Randers, J., Behrens, W., 1972.
The Limits to Growth. Universe Books, New York.
Moomaw, W.R., Unruh, G.C., 1997. Are Environmental Kuznets
Curve misleading us? The case of CO2 emissions. Environment
and Development Economics 2, 451–463.
Munasinghe, M., 1999. Is environmental degradation an inevitable
consequence of economic growth: tunneling through the envi-
ronmental Kuznets curve. Ecological Economics 29, 89–109.
Neumayer, E., 2003. Pollution havens: why be afraid of interna-
tional capital mobility? London School of Economics and Po-
litical Science, London, UK. Mimeo.
Nilsson, L.J., 1993. Energy intensity trends in 31 industrial and
developing countries: 1950–1988. Energy 18, 309–322.
O’Neill, R.V., Kahn, J.R., Duncan, J.R., Elliott, S., Efroymson, R.,
Cardwell, H., Jones, D.W., 1996. Economic growth and sustain-
ability: a new challenge. Ecological Applications 6 (1), 23–24.
Panayotou, T., 1993. Empirical tests and policy analysis of envi-
ronmental degradation at different stages of economic develop-
ment, ILO, Technology and Employment Programme, Geneva.
Panayotou, T., 1997. Demystifying the environmental Kuznets
curve: turning a black box into a policy tool. Environment
and Development Economics 2, 465–484.
Panayotou, T., 1999. The economics of environments in transition.
Environment and Development Economics 4 (4), 401–412.
Pargal, S., Wheeler, D., 1996. Informal regulation of industrial
pollution in developing countries: evidence from Indonesia.
Journal of Political Economy 104 (6), 1314–1327.
Pasche, D., Markus, D., 2002. Technical progress, structural
change, and the environmental Kuznets curve. Ecological Eco-
nomics 42, 381–389.
Perman, R. and Stern, D.I., 1999. The Environmental Kuznets
Curve: implications of non-stationarity. Australian National
University. Mimeo.
Pezzey, J.C.V., 1989. Economic analysis of sustainable growth and
sustainable development. Environment Department working pa-
per 15. World Bank.
Ratnayake, R., 1998, The multinational corporation and the envi-
ronment: testing the Pollution Heaven Hypothesis. University of
Auckland working papers in Economics (New Zealand) no. 179.
Reppelin-Hill, V., 1999. Trade and environment: an empirical anal-
ysis of the technology effect in the steel industry. Journal of
Environmental Economics and Management 38, 283–301.
Robers, J.T., Grimes, P.K., 1997. Carbon intensity and economic
development 1962–1991: a brief exploration of the Environ-
mental Kuznets Curve. World Development 25 (2), 191–198.
Robinson, D.H., 1988. Industrial pollution abatement: the impact
on the balance of trade. Canadian Journal of Economics 21,
187–199.
Roca, J., 2003. Do individual preferences explain Environmental
Kuznets Curve? Ecological Economics 45 (1), 3–10.
Rock, M.T., 1996. Pollution intensity of GDP and trade policy: can
the World Bank be wrong. World Development 24, 471–479.
Rothman, D.S., 1998. Environmental Kuznets Curve—real prog-
ress or passing the buck?: a case for consumption-base
approaches. Ecological Economics 25, 177–194.
Saint-Paul, G., 1994. ch.2 . In: Goldin, I., Winter, A.L. (Eds.), The
Economics of Sustainable Development. Cambridge Univ.
Press, Cambridge, UK, 47–50.
Selden, T., Song, D., 1994. Environmental quality and develop-
ment: is there a Kuznets Curve for air pollution emissions?
Journal of Environmental Economics and management 27,
147–162.
Selden, T., Song, D., 1995. Neoclassical growth, the J Curve for
abatement, and the inverted-U Curve for pollution. Journal of
Environmental Economics and management 29, 162–168.
Selden, T., Forrest, A.S., Lockhart, J.E., 1999. Analyzing the reduc-
tions in US air pollution emissions: 1970–1999. Land Econom-
ics 75 (1), 1–21.
Sengupta, R.P., 1997. CO2 emission– income relationship: policy
approach for climate control. Pacific Asia Journal of Energy 7
(2), 207–229.
Shafik, N., 1994. Economic development and environmental qual-
ity: an econometric analysis. Oxford Economic Papers 46,
757–773.
Shafik, N., Bandyopadhyay, S., 1992. Economic Growth and En-
vironmental Quality: Time Series and Cross-Country Evidence.
Background Paper for the World Development Report. The
World Bank, Washington, DC.
Shukla, V., Parikh, K., 1992. The environmental consequences of
urban growth: cross-national perspectives on economic devel-
opment, air pollution, and city size. Urban Geography 12,
422–449.
Smarzynska, B.K. and Wei, S., 2001. Pollution haven and foreign
direct investment: dirty secret or popular myth? World Bank
working paper 2673.
Smulder, S. and Bretschger, L., 2000. Explaining Environmental
Kuznets Curves: how pollution induces policy and new technol-
ogies. Center for Economic Research working paper No. 2000-
95, Tilburg University.
Stagl, S., 1999. Delinking economic growth from environmental
degradation? A literature survey on the Environmental Kuznets
S. Dinda / Ecological Economics 49 (2004) 431–455 455
Curve hypothesis. Vienna University of Economics and Busi-
ness Administration. Mimeo.
Stern, D.I., 1998. Progress on the environmental Kuznets curve?
Environment and Development Economics 3, 175–198.
Stern, D.I., Common, M.S., 2001. Is there an environmental Kuz-
nets curve for sulfur? Journal of Environmental Economics and
Management 41 (2), 162–178.
Stern, D.I., Common, M.S., Barbier, E.B., 1996. Economic growth
and environmental degradation: a critique of the environmental
Kuznets curve. World Development 24, 1151–1160.
Stokey, N.L., 1998. Are there limits to growth? International Eco-
nomic Review 39 (1), 1–31.
Suri, V., Chapman, D., 1998. Economic growth, trade and the en-
vironment: implications for the environmental Kuznets curve.
Ecological Economics 25, 195–208.
Taskin, F., Zaim, O., 2000. Searching for a Kuznets Curve in en-
vironmental efficiency using kernel estimation. Economics Let-
ters 68, 217–223.
Tilton, J.E., 1990. The OECD countries: demand trend setters. In:
Tilton, J.E. (Ed.), World Metal Demand: Trend and Prospects.
Resource for the Future, Washington, DC, pp. 35–76.
Tisdell, C., 2001. Globalisation and sustainability: environmen-
tal Kuznets curve and the WTO. Ecological Economics 39,
185–196.
Tobey, J.A., 1990. The effects of domestic environmental policies
on patterns of world trade: an empirical test. Kyklos 43,
191–209.
Torras, M., Boyce, J.K., 1998. Income, inequality, and pollution: a
reassessment of the Environmental Kuznets Curve. Ecological
Economics 25, 147–160.
Tucker, M., 1995. Carbon dioxide emissions and global GDP. Eco-
logical Economics 15, 215–223.
Unruh, G.C., Moomaw, W.R., 1998. An alternative analysis of
apparent EKC-type transitions. Ecological Economics 25,
221–229.
Vincent, J.R., 1997. Testing for environmental Kuznets curves with-
in a developing country. Environment and Development Eco-
nomics 2, 417–431.
Vukina, T., Beghin, J.C., Solakoglu, E.G., 1999. Transition to mar-
kets and the environment: effects of the change in the compo-
sition of manufacturing output. Environment and Development
Economics 4 (4), 582–598.
Wang, P., Bohara, A.K., Berrens, R.P., Gawande, K., 1998. A risk
based environmental Kuznets curve for hazardious waste sites.
Application of Economics Letters 5, 761–763.
Wheeler, D., 2000. Racing to the bottom? Foreign investment and
air pollution in developing countries. World Bank Development
Research Group working paper no. 2524.
Williams, R.H., Larson, E.D., Ross, M.H., 1987. Materials afflu-
ence and industrial energy use. Annual Review of Energy 12,
99–144.
World Bank, 1992. World Development Report. Oxford Univ.
Press, New York.
World Bank, 1999. Greening Industry: New Roles for Communities
Markets and Governments. Oxford Univ. Press, New York.
Wu, X., 2003, Pollution havens and the regulation of multinationals
with asymmetric information. Department of Economics, Uni-
versity of North Carolina at Chapel Hill. Mimeo.
Xiaoli, H., Chatterjee, L., 1997. Impact of growth and structural
change on CO2 emissions of developing countries. World De-
velopment 25 (3), 395–407.
Xing, Y. and Kolstad, C., 1995. Do lax environmental regulation
attract foreign investments? University of California, Santa Bar-
bara, working papers in Economics: 06/95, May.
Xu, X., 1999. Do stringent environmental regulations reduce the
international competitiveness of environmentally sensitive
goods? A global perspective. World Development 27 (7),
1215–1226.
Zang, H., 1998. The stability of the Kuznets Curve: some further
evidence. Application of Economics Letters 5, 131–133.