Embed Size (px)
Citation preview
General rights Copyright and moral rights for the publications made accessible in the public portal are retained by the authors and/or other copyright owners and it is a condition of accessing publications that users recognise and abide by the legal requirements associated with these rights.
Users may download and print one copy of any publication from the public portal for the purpose of private study or research.
You may not further distribute the material or use it for any profit-making activity or commercial gain
You may freely distribute the URL identifying the publication in the public portal If you believe that this document breaches copyright please contact us providing details, and we will remove access to the work immediately and investigate your claim.
Downloaded from orbit.dtu.dk on: May 30, 2020
Survey of 800+ datasets from human tissue and body fluid reveals XenomiRs are likelyartifacts
Kang, Wenjing; Bang-Berthelsen, Claus Heiner; Holm, Anja; Houben, Anna; Muller, Anne Holt; Thymann,Thomas; Pociot, Flemming; Estivill, Xavier; Riemer Friedländer, Marc
Published in:R N A
Link to article, DOI:10.1261/rna.059725.116
Publication date:2017
Document VersionPublisher's PDF, also known as Version of record
Link back to DTU Orbit
Citation (APA):Kang, W., Bang-Berthelsen, C. H., Holm, A., Houben, A., Muller, A. H., Thymann, T., Pociot, F., Estivill, X., &Riemer Friedländer, M. (2017). Survey of 800+ datasets from human tissue and body fluid reveals XenomiRsare likely artifacts. R N A, 23, 433-445. https://doi.org/10.1261/rna.059725.116
Survey of 800+ data sets from human tissue and body fluidreveals xenomiRs are likely artifacts
WENJING KANG,1,12 CLAUS HEINER BANG-BERTHELSEN,2,3,4,12 ANJA HOLM,5 ANNA J.S. HOUBEN,6,7
ANNE HOLT MÜLLER,8 THOMAS THYMANN,9 FLEMMING POCIOT,2,10,11 XAVIER ESTIVILL,6,7
and MARC R. FRIEDLÄNDER1
1Science for Life Laboratory, Department of Molecular Biosciences, The Wenner-Gren Institute, Stockholm University, S-10691 Stockholm, Sweden2Center for Non-Coding RNA in Technology and Health, University of Copenhagen, 1870 Copenhagen, Denmark3Department of Diabetes Biology, Novo Nordisk, 2760 Måløv, Denmark4National Food Institute, Technical University of Denmark, 2800 Lyngby, Denmark5Molecular Sleep Laboratory, Department of Clinical Biochemistry, Rigshospitalet, 2600 Glostrup, Denmark6Bioinformatics and Genomics Program, Centre for Genomic Regulation (CRG), The Barcelona Institute of Science and Technology, 08003Barcelona, Spain7Universitat Pompeu Fabra (UPF), 08002 Barcelona, Spain8Department of Clinical Experimental Research, Glostrup Research Institute, Rigshospitalet, 2600 Glostrup, Denmark9Comparative Pediatrics and Nutrition, Department of Veterinary and Animal Science, University of Copenhagen, 1870 Frederiksberg C, Denmark10Department of Paediatrics, Herlev Hospital, University of Copenhagen, 2730 Copenhagen, Denmark11Faculty of Health and Medical Sciences, University of Copenhagen, 2200 Copenhagen, Denmark
ABSTRACT
miRNAs are small 22-nucleotide RNAs that can post-transcriptionally regulate gene expression. It has been proposed that dietaryplant miRNAs can enter the human bloodstream and regulate host transcripts; however, these findings have been widely disputed.We here conduct the first comprehensive meta-study in the field, surveying the presence and abundances of cross-species miRNAs(xenomiRs) in 824 sequencing data sets from various human tissues and body fluids. We find that xenomiRs are commonly presentin tissues (17%) and body fluids (69%); however, the abundances are low, comprising 0.001% of host human miRNA counts.Further, we do not detect a significant enrichment of xenomiRs in sequencing data originating from tissues and body fluidsthat are exposed to dietary intake (such as liver). Likewise, there is no significant depletion of xenomiRs in tissues and bodyfluids that are relatively separated from the main bloodstream (such as brain and cerebro-spinal fluids). Interestingly, themajority (81%) of body fluid xenomiRs stem from rodents, which are a rare human dietary contribution but common laboratoryanimals. Body fluid samples from the same studies tend to group together when clustered by xenomiR compositions, suggestingtechnical batch effects. Last, we performed carefully designed and controlled animal feeding studies, in which we detected notransfer of plant miRNAs into rat blood, or bovine milk sequences into piglet blood. In summary, our comprehensivecomputational and experimental results indicate that xenomiRs originate from technical artifacts rather than dietary intake.
Keywords: miRNA; microRNA; meta-study; exogenous miRNAs; next-generation sequencing; contamination; artifacts
INTRODUCTION
Over the past decade, RNAs extracted from cell-free bodyfluids have received increasing attention as novel diagnosticmarkers for disorders as diverse as narcolepsy, cancers, andviral infections (Mitchell et al. 2008; Winther et al. 2013;Holm et al. 2014a). Many distinct body fluids have beenprofiled for biomarkers (Weber et al. 2010; Holm et al.2014b). Blood samples are most commonly used, as theyare obtained from the human body with minimal invasionand can give snapshots of the transcriptome of many tissues
that are communicating with the bloodstream (Chen et al.2008; Schwarzenbach et al. 2014). Profiling of microRNAs(miRNAs), a group of small noncoding RNAs, is particularlypromising because the only ∼22 nucleotides (nt) short fullymatured miRNAs are considerably stable compared to otherRNA species, such as mRNAs (Jung et al. 2010). The matu-ration is a process of sequential endonucleolytic cleavagesof the primary miRNA transcript by RNase III enzymes(Ha and Kim 2014). After cleavage the mature miRNA isincorporated into the miRISC complex, where it servesto guide the complex to target sites in mRNAs. Oncebound, the complex can regulate mRNA gene expression
12Joint first authorsCorresponding author: [email protected] is online at http://www.rnajournal.org/cgi/doi/10.1261/rna.059725.
116. Freely available online through the RNA Open Access option.
© 2017 Kang et al. This article, published in RNA, is available under aCreative Commons License (Attribution-NonCommercial 4.0 International),as described at http://creativecommons.org/licenses/by-nc/4.0/.
BIOINFORMATICS
RNA 23:433–445; Published by Cold Spring Harbor Laboratory Press for the RNA Society 433
Cold Spring Harbor Laboratory Press on March 21, 2017 - Published by rnajournal.cshlp.orgDownloaded from

by inhibiting translation, promoting degradation or reloca-tion to subcellular foci where mRNA is no longer accessibleto the translational machinery. miRNAs in human bodyfluids have been identified as emerging effective biomarkersin many different biological states as well as diseases(Simonson and Das 2015; Fabris and Calin 2016). Whilemost cell-free body fluid biomarker studies have been con-ducted by conventional quantitative PCR-based methods,an increasing number of more recent studies use deep se-quencing as a method that is independent of prior knowledgeof transcript sequence composition (Freedman et al. 2016).
The current state-of-the-art method for profiling body flu-id miRNAs is next-generation sequencing of small RNAs(sRNA-seq). This technique detects millions of miRNAs ina single experiment and allows discovery of new transcripts(Burgos et al. 2014; Byron et al. 2016). Sequencing allowsdetection of miRNAs in an unbiased way that can lead to sur-prising results. For example, a recent report from Zhang et al.(2012) suggested that a miRNA (osa-MIR168) from a rice-rich diet can cross the human gut epithelium and enter thebloodstream where it can interact with and repress the hu-man high-density lipoprotein RAP1 transcript. The ramifica-tions of this observation are profound, since it implies thatcross-species miRNAs (“xenomiRs”) can impact the humantranscriptome through diet. This could open up a new re-search field of nutrition-specific RNA-based remedies anddevelopment of oral delivery of RNA-based medicine.
The xenomiR hypothesis is indirectly supported by studiesshowing that miRNAs extracted from plants (Philip et al.2015) or from body fluids (Chen et al. 2008) are stable whensubjected to high temperature or enzymatic digestions. Somein vivo studies support the initial finding that xenomiRs arepresent in body fluids of humans and other animals, howeverat a very low expression level (Wang et al. 2012, 2013). Themost highly abundant Brassica oleracea MIR172 was foundin stomach, intestine, serum, and feces of mice that were fedplant RNA extracts. The MIR172 abundance and peak timeinmultiple origins of samples was consistent with ordered di-etary update: stomach > intestine > feces > serum(Liang et al.2014). Another study found several plant and insect xenomiRsin serum and plasma samples. Interestingly, the rice-derivedxenomiRs were dominating in the serum sample from Chi-nese ethnicity compared to theplasma sample fromCaucasianethnicity, which was dominated by corn-derived xenomiRs(Wang et al. 2012). In a recent study, new evidence ofxenomiRs was presented showing that food-derived miRNAswere transferred to mammalian placenta and directly regulat-ing fetus gene expression (Li et al. 2015). In another mousestudy, the authors reported that MIR2911, derived from thehoneysuckle plant, was present in animals drinking or gavagefeeding honeysuckle. Additionally, the authors showed thatthe miRNAs were able to regulate influenza virus by reducingreplication and rescued viral infection (Zhou et al. 2015).
In contrast, several studies were unable to reproduce theoriginal findings or have provided direct evidence that the
xenomiRs are the result of technical contaminations ratherthan diet-dependent cellular uptake. A number of groupshave searched for plant xenomiRs in human body fluids buthave been unable to find these sequences at any substantiallevel (Snow et al. 2013; Witwer et al. 2013). Similarly, othergroups were unable to detect dietary xenomiRs when con-ducting controlled feeding studies in humans, mice, bees,and other insects (Dickinson et al. 2013; Witwer et al. 2013;Auerbach et al. 2016). Further, one independent researchgroup investigated the xenomiR composition of sRNA-seqdata from amphioxus animals, generated by the team of theoriginal Zhang et al. (2012) publication. It was found thatthe amphioxus data contained rice miRNAs in exactly thesame composition as in the previous human serum studyfrom the same group (Tosar et al. 2014). Given that amphibiahave an exclusive algae-based diet, this strongly suggests thatthe rice miRNAs identified in both studies are the result ofcontamination. In general, contaminations can occur at sev-eral steps in sequence data generation. They can happen iftraces of samples are mixed, either in the field, clinic, or lab-oratory. Since next-generation sequencing is tremendouslysensitive, a few molecules could feasibly cause false detectionof xenomiRs. Functional contaminations can also occur dur-ing sequencing or the data analysis. Often, several samplecDNA libraries are sequenced together, and each read is as-signed back to the sample through a barcode. If cDNA mole-cules are in spatial proximity during sequencing, theirrespective barcodes can be swapped. Additionally, if the barc-odes are similar in sequence, the defaults analysis software canmisassign the reads to the wrong sample (Kircher et al. 2012).Despite the many studies on xenomiRs, it still remains
unresolved if they originate from diet or from laboratorycontaminations. Public sequence repositories contain hun-dreds of sRNA-seq data sets from human tissues and bodyfluids. Surprisingly, this resource has not beenmined in a sys-tematic manner to study the presence and compositions ofxenomiRs. To address this, we conducted the first compre-hensive meta-study of xenomiRs in 824 public human datasets. We developed a new computational pipeline to stand-ardize and normalize the raw sequence data, allowing us tocompare the results from multiple studies. We found thatxenomiRs are present in many human sRNA-seq data sets,although in very low abundances. There is no enrichmentof xenomiRs in samples that are exposed to dietary intake(liver and serum) compared to samples that are protectedby the blood–brain barrier (brain and cerebrospinal fluid,CSF). The body fluid samples are dominated by xenomiRsfrom rodents, which are rare in human diets, but are com-mon laboratory animals. We observe that the body fluidxenomiR profiles group by study (batch effects), suggestingthat technical factors influence the xenomiR presence. Incomplementary controlled animal feeding studies, we seeno transfer of dietary plant miRNAs into the bloodstreamof rats, nor of cow milk miRNAs into piglets. In summary,our computational and wet-lab results provide evidence for
Kang et al.
434 RNA, Vol. 23, No. 4
Cold Spring Harbor Laboratory Press on March 21, 2017 - Published by rnajournal.cshlp.orgDownloaded from
a technical rather than a biological origin of xenomiRs inhuman body fluids and tissues.
RESULTS
Meta-study of 824 human sRNA-seq data sets
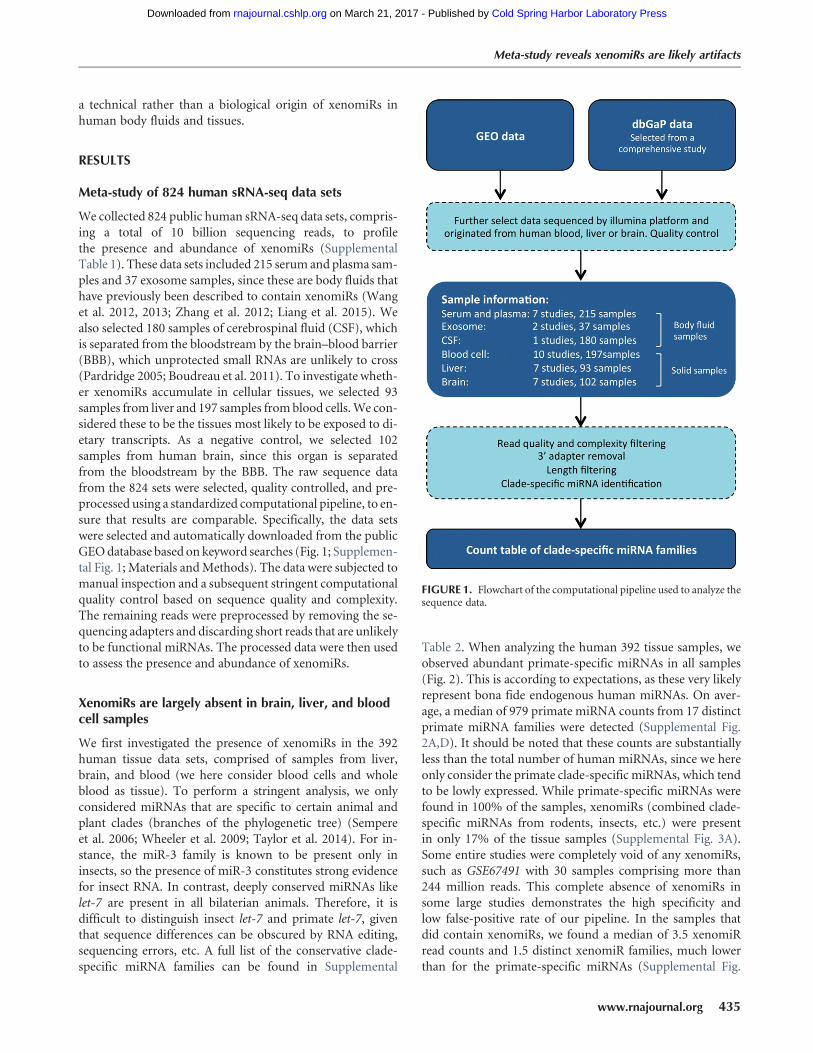
We collected 824 public human sRNA-seq data sets, compris-ing a total of 10 billion sequencing reads, to profilethe presence and abundance of xenomiRs (SupplementalTable 1). These data sets included 215 serum and plasma sam-ples and 37 exosome samples, since these are body fluids thathave previously been described to contain xenomiRs (Wanget al. 2012, 2013; Zhang et al. 2012; Liang et al. 2015). Wealso selected 180 samples of cerebrospinal fluid (CSF), whichis separated from the bloodstream by the brain–blood barrier(BBB), which unprotected small RNAs are unlikely to cross(Pardridge 2005; Boudreau et al. 2011). To investigate wheth-er xenomiRs accumulate in cellular tissues, we selected 93samples from liver and 197 samples fromblood cells.We con-sidered these to be the tissues most likely to be exposed to di-etary transcripts. As a negative control, we selected 102samples from human brain, since this organ is separatedfrom the bloodstream by the BBB. The raw sequence datafrom the 824 sets were selected, quality controlled, and pre-processed using a standardized computational pipeline, to en-sure that results are comparable. Specifically, the data setswere selected and automatically downloaded from the publicGEOdatabase based on keyword searches (Fig. 1; Supplemen-tal Fig. 1; Materials andMethods). The data were subjected tomanual inspection and a subsequent stringent computationalquality control based on sequence quality and complexity.The remaining reads were preprocessed by removing the se-quencing adapters and discarding short reads that are unlikelyto be functional miRNAs. The processed data were then usedto assess the presence and abundance of xenomiRs.
XenomiRs are largely absent in brain, liver, and bloodcell samples
We first investigated the presence of xenomiRs in the 392human tissue data sets, comprised of samples from liver,brain, and blood (we here consider blood cells and wholeblood as tissue). To perform a stringent analysis, we onlyconsidered miRNAs that are specific to certain animal andplant clades (branches of the phylogenetic tree) (Sempereet al. 2006; Wheeler et al. 2009; Taylor et al. 2014). For in-stance, the miR-3 family is known to be present only ininsects, so the presence of miR-3 constitutes strong evidencefor insect RNA. In contrast, deeply conserved miRNAs likelet-7 are present in all bilaterian animals. Therefore, it isdifficult to distinguish insect let-7 and primate let-7, giventhat sequence differences can be obscured by RNA editing,sequencing errors, etc. A full list of the conservative clade-specific miRNA families can be found in Supplemental
Table 2. When analyzing the human 392 tissue samples, weobserved abundant primate-specific miRNAs in all samples(Fig. 2). This is according to expectations, as these very likelyrepresent bona fide endogenous human miRNAs. On aver-age, a median of 979 primate miRNA counts from 17 distinctprimate miRNA families were detected (Supplemental Fig.2A,D). It should be noted that these counts are substantiallyless than the total number of human miRNAs, since we hereonly consider the primate clade-specific miRNAs, which tendto be lowly expressed. While primate-specific miRNAs werefound in 100% of the samples, xenomiRs (combined clade-specific miRNAs from rodents, insects, etc.) were presentin only 17% of the tissue samples (Supplemental Fig. 3A).Some entire studies were completely void of any xenomiRs,such as GSE67491 with 30 samples comprising more than244 million reads. This complete absence of xenomiRs insome large studies demonstrates the high specificity andlow false-positive rate of our pipeline. In the samples thatdid contain xenomiRs, we found a median of 3.5 xenomiRread counts and 1.5 distinct xenomiR families, much lowerthan for the primate-specific miRNAs (Supplemental Fig.
FIGURE 1. Flowchart of the computational pipeline used to analyze thesequence data.
Meta-study reveals xenomiRs are likely artifacts
www.rnajournal.org 435
Cold Spring Harbor Laboratory Press on March 21, 2017 - Published by rnajournal.cshlp.orgDownloaded from

2A,D). In summary, we find xenomiRs absent frommost hu-man tissue samples. In the samples where they are present,they are very lowly abundant.
XenomiRs are not enriched in tissues exposedto dietary intake
Of the tissues in the human body, we would expect liver andblood cells to be relatively exposed to dietary molecules.Conversely, brain cells would be insulated frommiRNAmol-ecules by the BBB (Pardridge 2005; Boudreau et al. 2011).Despite this, we found that xenomiRs were present in similarfractions (28%) in the exposed liver and in the relativelyprotected brain samples. In addition, xenomiRs were presentat a lower fraction of the blood cells (7%) than in the brainand liver samples (28%) (Supplemental Fig. 4: p1.1). Sincethe BBB can be permeabilized by neurodegenerative diseases,we repeated the analyses above considering only healthy con-trol brains, with the comparable results (Supplemental Fig. 4:p1.2). These results support a nondietary origin of the detect-ed xenomiRs. Interestingly, summed over all the 392 tissuesamples, the xenomiRs were significantly overrepresented in
older studies from before the year 2013 relative to the newerstudies (88% versus 12%, P-value <0.001, SupplementalFig. 4: p2). In addition, the older studies were more likely tocontain xenomiRs from multiple clades than were the recentones (P-value <0.001, Supplemental Fig. 4: p3). This observa-tion suggests that the presence of xenomiRs in tissue samplesis influenced by technical factors.
XenomiRs are commonly present in body fluids
We next analyzed the occurrence of miRNAs in the 432human body fluid data sets, comprised of samples fromserum, plasma, exosome, and CSF. As in the tissue samples,we found primate-specific (presumably endogenous human)miRNAs present in all body fluid samples (Fig. 3). However,the primate-specific miRNAs were overall less abundant andless diverse (in terms of distinct miRNA families) in the bodyfluid samples than in the tissue samples described above (me-dian of count: 204 versus 979, P-value <0.001, distinct miRNAfamilies: 11 versus 17, P-value <0.001; Supplemental Fig. 4:p4–5). Interestingly, xenomiRs were present in more bodyfluid samples (69% of samples) than in tissue samples
FIGURE 2. Presence and abundance of xenomiRs in tissue samples from human blood cell, liver, and brain. Every column represents one sample.Samples are grouped in studies (facets) based on database accession number (GSE number shown below each study). Every row represents one type ofanimal or plant clade. A dot indicates the presence of one or more xenomiRs belonging to the clade in the given sample. The dot size indicates howmany distinct xenomiRs belonging to the clade were detected. The dot gradient from light to dark indicates the overall abundance of the xenomiRs.Dot color codes: green, plant clades; red, mammal clades; purple, bird, reptile, fish, echinochozoa, or lophotrochozoa; gray, insect, nematode, or an-imal sponge. The brain samples collected from the individual with brain diseases are shaded with gray background. Consistent with all samples de-riving from humans, the primate-specific miRNAs (the large red dots) are consistently present across all samples. XenomiRs are overall rarely presentand lowly expressed compared to the primate-specific miRNAs.
Kang et al.
436 RNA, Vol. 23, No. 4
Cold Spring Harbor Laboratory Press on March 21, 2017 - Published by rnajournal.cshlp.orgDownloaded from
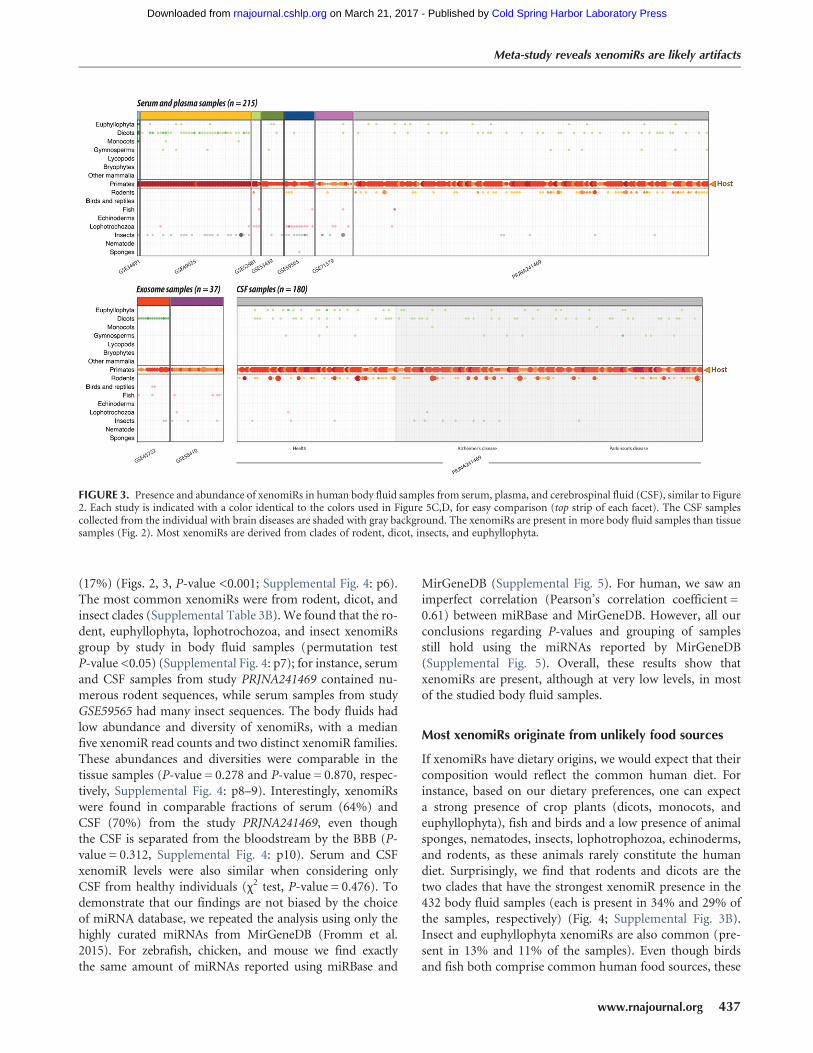
(17%) (Figs. 2, 3, P-value <0.001; Supplemental Fig. 4: p6).The most common xenomiRs were from rodent, dicot, andinsect clades (Supplemental Table 3B). We found that the ro-dent, euphyllophyta, lophotrochozoa, and insect xenomiRsgroup by study in body fluid samples (permutation testP-value <0.05) (Supplemental Fig. 4: p7); for instance, serumand CSF samples from study PRJNA241469 contained nu-merous rodent sequences, while serum samples from studyGSE59565 had many insect sequences. The body fluids hadlow abundance and diversity of xenomiRs, with a medianfive xenomiR read counts and two distinct xenomiR families.These abundances and diversities were comparable in thetissue samples (P-value = 0.278 and P-value = 0.870, respec-tively, Supplemental Fig. 4: p8–9). Interestingly, xenomiRswere found in comparable fractions of serum (64%) andCSF (70%) from the study PRJNA241469, even thoughthe CSF is separated from the bloodstream by the BBB (P-value = 0.312, Supplemental Fig. 4: p10). Serum and CSFxenomiR levels were also similar when considering onlyCSF from healthy individuals (χ2 test, P-value = 0.476). Todemonstrate that our findings are not biased by the choiceof miRNA database, we repeated the analysis using only thehighly curated miRNAs from MirGeneDB (Fromm et al.2015). For zebrafish, chicken, and mouse we find exactlythe same amount of miRNAs reported using miRBase and
MirGeneDB (Supplemental Fig. 5). For human, we saw animperfect correlation (Pearson’s correlation coefficient =0.61) between miRBase and MirGeneDB. However, all ourconclusions regarding P-values and grouping of samplesstill hold using the miRNAs reported by MirGeneDB(Supplemental Fig. 5). Overall, these results show thatxenomiRs are present, although at very low levels, in mostof the studied body fluid samples.
Most xenomiRs originate from unlikely food sources
If xenomiRs have dietary origins, we would expect that theircomposition would reflect the common human diet. Forinstance, based on our dietary preferences, one can expecta strong presence of crop plants (dicots, monocots, andeuphyllophyta), fish and birds and a low presence of animalsponges, nematodes, insects, lophotrophozoa, echinoderms,and rodents, as these animals rarely constitute the humandiet. Surprisingly, we find that rodents and dicots are thetwo clades that have the strongest xenomiR presence in the432 body fluid samples (each is present in 34% and 29% ofthe samples, respectively) (Fig. 4; Supplemental Fig. 3B).Insect and euphyllophyta xenomiRs are also common (pre-sent in 13% and 11% of the samples). Even though birdsand fish both comprise common human food sources, these
FIGURE 3. Presence and abundance of xenomiRs in human body fluid samples from serum, plasma, and cerebrospinal fluid (CSF), similar to Figure2. Each study is indicated with a color identical to the colors used in Figure 5C,D, for easy comparison (top strip of each facet). The CSF samplescollected from the individual with brain diseases are shaded with gray background. The xenomiRs are present in more body fluid samples than tissuesamples (Fig. 2). Most xenomiRs are derived from clades of rodent, dicot, insects, and euphyllophyta.
Meta-study reveals xenomiRs are likely artifacts
www.rnajournal.org 437
Cold Spring Harbor Laboratory Press on March 21, 2017 - Published by rnajournal.cshlp.orgDownloaded from
xenomiRs were only rarely observed in the serum, plasma,and exosome samples (0.8% and 4% percentages of samples,respectively). Regarding the prevalence of rodent sequencesin the body fluid samples, rodents are accepted as a sourceof protein in the tropical world, but even there they only servedas a supplement to the regular diets of humans (Fiedler 1990).Notably, rodents are of course widely used as model organ-isms (Wolff and Sherman 2008). Since most rodent-specificxenomiRs originate from a single study PRJNA241469 wherethe subjects were recruited in the USA, we speculate that therodent xenomiRs are more likely derived from model organ-isms such asmouse and rat rather than from rodents suppliedas a meat source. Regarding the insect sequences, it is not sur-prising that the human diet comprises traces of insects evenin the developed world, as for instance wheat flour can har-bor more than 150 insect fragments per 100 g (U.S. Foodand Drug Administration). However, the human diet cer-tainly includes many orders of magnitude more plant thaninsect material, and this disproportion is not reflected inthe xenomiR abundances. We observe that although theabundances of plant dicot xenomiRs were statistically signifi-cantly higher than the insect (count median: three versustwo, P-value = 0.004, Supplemental Fig. 4: p12), the countdifference was not as huge as the disproportion of plant–in-sect content in diet. Last, the euphyllophyta xenomiRs likethe previously reported MIR168 were present in a minority(11%) of the body fluid samples, showing that it is notcommonly found in humans. These results show that thexenomiR composition does not reflect human food sources.
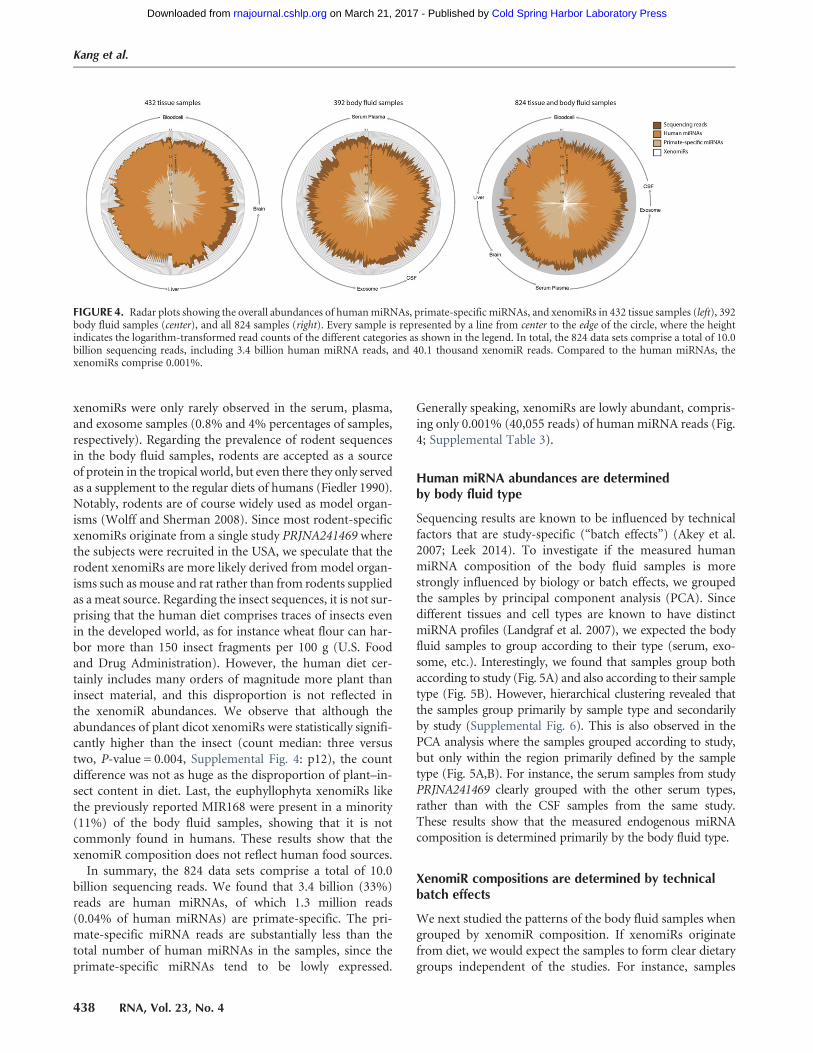
In summary, the 824 data sets comprise a total of 10.0billion sequencing reads. We found that 3.4 billion (33%)reads are human miRNAs, of which 1.3 million reads(0.04% of human miRNAs) are primate-specific. The pri-mate-specific miRNA reads are substantially less than thetotal number of human miRNAs in the samples, since theprimate-specific miRNAs tend to be lowly expressed.
Generally speaking, xenomiRs are lowly abundant, compris-ing only 0.001% (40,055 reads) of human miRNA reads (Fig.4; Supplemental Table 3).
Human miRNA abundances are determinedby body fluid type
Sequencing results are known to be influenced by technicalfactors that are study-specific (“batch effects”) (Akey et al.2007; Leek 2014). To investigate if the measured humanmiRNA composition of the body fluid samples is morestrongly influenced by biology or batch effects, we groupedthe samples by principal component analysis (PCA). Sincedifferent tissues and cell types are known to have distinctmiRNA profiles (Landgraf et al. 2007), we expected the bodyfluid samples to group according to their type (serum, exo-some, etc.). Interestingly, we found that samples group bothaccording to study (Fig. 5A) and also according to their sampletype (Fig. 5B). However, hierarchical clustering revealed thatthe samples group primarily by sample type and secondarilyby study (Supplemental Fig. 6). This is also observed in thePCA analysis where the samples grouped according to study,but only within the region primarily defined by the sampletype (Fig. 5A,B). For instance, the serum samples from studyPRJNA241469 clearly grouped with the other serum types,rather than with the CSF samples from the same study.These results show that the measured endogenous miRNAcomposition is determined primarily by the body fluid type.
XenomiR compositions are determined by technicalbatch effects
We next studied the patterns of the body fluid samples whengrouped by xenomiR composition. If xenomiRs originatefrom diet, we would expect the samples to form clear dietarygroups independent of the studies. For instance, samples
FIGURE 4. Radar plots showing the overall abundances of humanmiRNAs, primate-specific miRNAs, and xenomiRs in 432 tissue samples (left), 392body fluid samples (center), and all 824 samples (right). Every sample is represented by a line from center to the edge of the circle, where the heightindicates the logarithm-transformed read counts of the different categories as shown in the legend. In total, the 824 data sets comprise a total of 10.0billion sequencing reads, including 3.4 billion human miRNA reads, and 40.1 thousand xenomiR reads. Compared to the human miRNAs, thexenomiRs comprise 0.001%.
Kang et al.
438 RNA, Vol. 23, No. 4
Cold Spring Harbor Laboratory Press on March 21, 2017 - Published by rnajournal.cshlp.orgDownloaded from
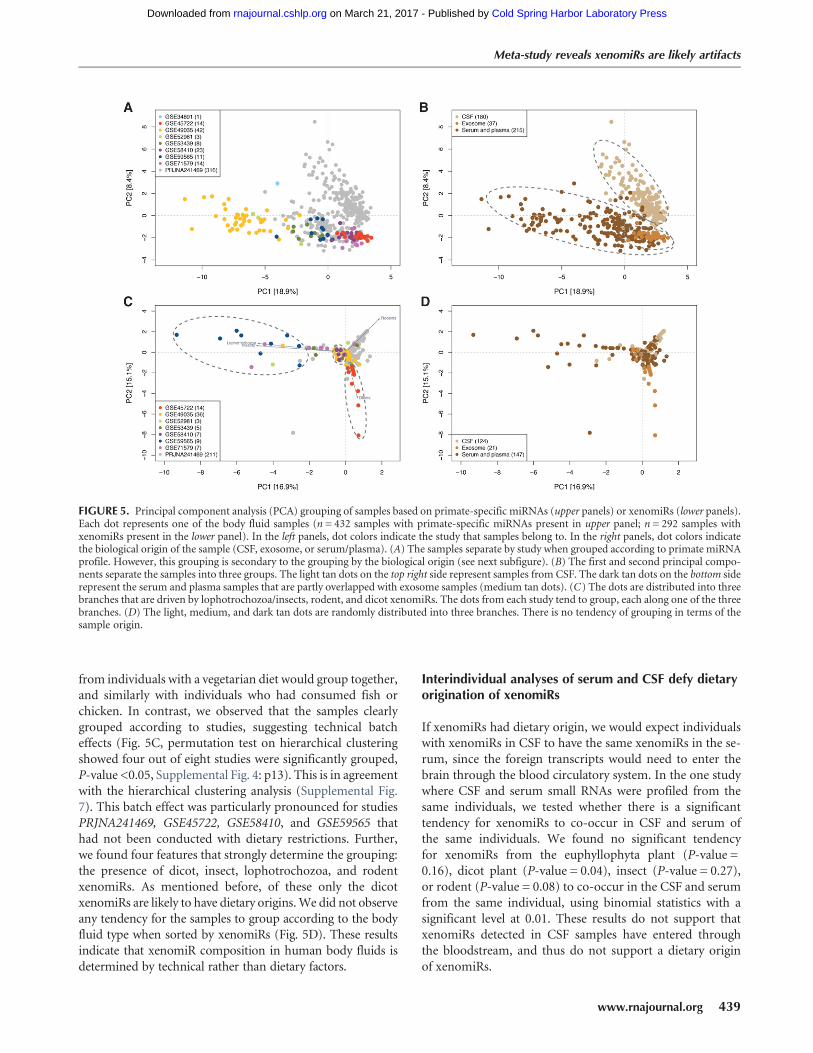
from individuals with a vegetarian diet would group together,and similarly with individuals who had consumed fish orchicken. In contrast, we observed that the samples clearlygrouped according to studies, suggesting technical batcheffects (Fig. 5C, permutation test on hierarchical clusteringshowed four out of eight studies were significantly grouped,P-value <0.05, Supplemental Fig. 4: p13). This is in agreementwith the hierarchical clustering analysis (Supplemental Fig.7). This batch effect was particularly pronounced for studiesPRJNA241469, GSE45722, GSE58410, and GSE59565 thathad not been conducted with dietary restrictions. Further,we found four features that strongly determine the grouping:the presence of dicot, insect, lophotrochozoa, and rodentxenomiRs. As mentioned before, of these only the dicotxenomiRs are likely to have dietary origins.We did not observeany tendency for the samples to group according to the bodyfluid type when sorted by xenomiRs (Fig. 5D). These resultsindicate that xenomiR composition in human body fluids isdetermined by technical rather than dietary factors.
Interindividual analyses of serum and CSF defy dietaryorigination of xenomiRs
If xenomiRs had dietary origin, we would expect individualswith xenomiRs in CSF to have the same xenomiRs in the se-rum, since the foreign transcripts would need to enter thebrain through the blood circulatory system. In the one studywhere CSF and serum small RNAs were profiled from thesame individuals, we tested whether there is a significanttendency for xenomiRs to co-occur in CSF and serum ofthe same individuals. We found no significant tendencyfor xenomiRs from the euphyllophyta plant (P-value =0.16), dicot plant (P-value = 0.04), insect (P-value = 0.27),or rodent (P-value = 0.08) to co-occur in the CSF and serumfrom the same individual, using binomial statistics with asignificant level at 0.01. These results do not support thatxenomiRs detected in CSF samples have entered throughthe bloodstream, and thus do not support a dietary originof xenomiRs.
FIGURE 5. Principal component analysis (PCA) grouping of samples based on primate-specific miRNAs (upper panels) or xenomiRs (lower panels).Each dot represents one of the body fluid samples (n = 432 samples with primate-specific miRNAs present in upper panel; n = 292 samples withxenomiRs present in the lower panel). In the left panels, dot colors indicate the study that samples belong to. In the right panels, dot colors indicatethe biological origin of the sample (CSF, exosome, or serum/plasma). (A) The samples separate by study when grouped according to primate miRNAprofile. However, this grouping is secondary to the grouping by the biological origin (see next subfigure). (B) The first and second principal compo-nents separate the samples into three groups. The light tan dots on the top right side represent samples from CSF. The dark tan dots on the bottom siderepresent the serum and plasma samples that are partly overlapped with exosome samples (medium tan dots). (C) The dots are distributed into threebranches that are driven by lophotrochozoa/insects, rodent, and dicot xenomiRs. The dots from each study tend to group, each along one of the threebranches. (D) The light, medium, and dark tan dots are randomly distributed into three branches. There is no tendency of grouping in terms of thesample origin.
Meta-study reveals xenomiRs are likely artifacts
www.rnajournal.org 439
Cold Spring Harbor Laboratory Press on March 21, 2017 - Published by rnajournal.cshlp.orgDownloaded from

Controlled feeding in rat does not support dietarytransfer of xenoRNAs
To investigate the influence of diet on blood xenomiR abun-dances, we performed a controlled feeding study in adult rats.Three different diets were applied and for each diet group weused three biological replicates: (i) three rats were fed onlymonocot plant material (rice), (ii) three rats were fed onlydicot material (potatoes), and (iii) three rats were fed hus-bandry chow containing a defined mixture of grains, cereals,vitamins, minerals, and fats. After 28 d of controlled feeding(see Materials and Methods), small RNAs were isolatedfrom the serum and sequenced. In these sRNA-seq libraries,we profiled rat miRNAs and searched for xenomiRs usingthe conservative method that we previously applied to thehuman data (Materials and Methods). If xenomiRs are in-deed dietary-dependent, we would expect to see monocot-specific miRNAs in the rice-fed rats, dicot-specific sequencesin the potato-fed rats, and both types in the rats that werefed chow. As expected, we identified abundant rodent-spe-cific miRNAs in all nine samples (Supplemental Fig. 8).Interestingly, we observed a lack of plant xenomiRs in therat serum. Specifically, we only observed two plant euphyllo-phyte sequences in a single rat sample.
We applied even more sensitive computational methods,by considering not only clade-specific sequences, but alsomiRNAs that are conserved but differ in sequence betweenspecies (see Materials and Methods). This method canpotentially cause false positives when miRNAs are edited orsubjected to sequencing errors. To account for this, we in-cluded negative and positive control samples. We used publicA. thaliana sRNA-seq data as negative controls and public riceand potato sRNA-seq data as positive controls. If our compu-tational approach is sound, we would expect many of the riceand potato sequences to be flagged as belonging to their re-spective species, but few of the A. thaliana sequences to beflagged as rice or potato. Indeed the rice and potato positivecontrol sRNAs were clearly identified as such, each with>20,000 reads, while the relatively few A. thaliana sequencesmisidentified as rice suggest relatively low false-positive rates(Fig. 6). As in the previous analysis, abundant rat miRNAswere observed (>10,000 reads summing over triplicates);however, only three rice-specific reads were seen in the rice-fed rats, and two rice-specific reads in the potato-fed rats.Given these extremely low numbers, and the fact that we ob-serve rice-specific reads in the potato-fed rats, these are likelyfalse positives of our sensitive computational method.
Controlled feeding in piglets does not support transferof milk xenomiRs
It has been suggested that miRNAs can be transferred frombreast milk to the bloodstream (Munch et al. 2013; Baieret al. 2014; Izumi et al. 2015), although these results havealso been contested (Laubier et al. 2015; Title et al. 2015).
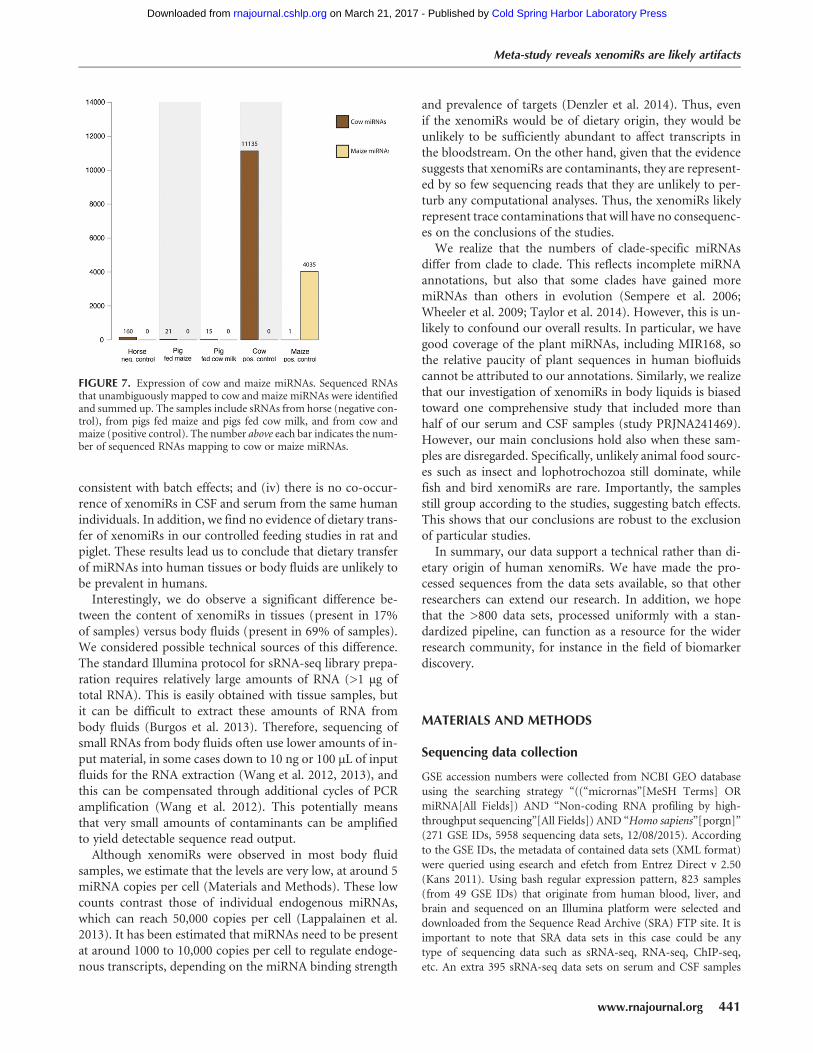
To investigate this, we fed piglets either with cow milk orlet them feed from sow’s milk for 4 wk followed by 7 wkof feeding with maize. If miRNAs can be transferred frommilk to the bloodstream, we would expect to observe cow-specific miRNAs in the serum of piglets fed cow milk, butnot in the piglets that were fed maize. We applied the sensi-tive computational approach above to detect cow or maizemiRNAs in the piglet data. Our positive control data yielded>11,000 cow-specific reads, showing the sensitivity of ourmethod (Fig. 7). In contrast, we observed few cow-specificsequences in the piglets fed cowmilk (15 reads) and, surpris-ingly, the piglets fed maize (21 reads). Since these two num-bers are comparable, they likely stem from false positives ofour sensitive analysis. In summary, we do not see anyevidence of dietary transfer of xenomiRs in either of our con-trolled animal feeding studies.
DISCUSSION
Public sequence repositories represent valuable resourcesin these times, when generating sequencing data is easierthan providing meaningful analyses of the data. We havehere analyzed 824 public human data sets for the presenceof xenomiRs and have applied numerous analyses to evaluateif xenomiRs originate from diet or contamination. Thedata sets cover most existing sRNA-seq samples from humanbody fluids. We find that body fluids contain more xenomiRsthan tissues, consistent with a dietary origin. However, wefind several lines of evidence that xenomiRs in human sam-ples originate from contamination: (i) XenomiRs are not en-riched in tissues that are exposed to dietary intake; (ii) mostxenomiRs originate from unlikely food sources like rodentand insect; (iii) xenomiR composition group by study,
FIGURE 6. Expression of rat, rice, and potato miRNAs. SequencedRNAs that unambiguously mapped to rat, rice, or potato miRNAswere identified and summed up. The samples include sRNAs fromArabidopsis (negative control), rats fed a regular chow diet, rats fedrice, rats fed potato, and from rice and potato (positive controls). Therat feeding was performed in triplicate, and the three brown shadesshow the number of rat miRNAs in each replicate.
Kang et al.
440 RNA, Vol. 23, No. 4
Cold Spring Harbor Laboratory Press on March 21, 2017 - Published by rnajournal.cshlp.orgDownloaded from
consistent with batch effects; and (iv) there is no co-occur-rence of xenomiRs in CSF and serum from the same humanindividuals. In addition, we find no evidence of dietary trans-fer of xenomiRs in our controlled feeding studies in rat andpiglet. These results lead us to conclude that dietary transferof miRNAs into human tissues or body fluids are unlikely tobe prevalent in humans.Interestingly, we do observe a significant difference be-
tween the content of xenomiRs in tissues (present in 17%of samples) versus body fluids (present in 69% of samples).We considered possible technical sources of this difference.The standard Illumina protocol for sRNA-seq library prepa-ration requires relatively large amounts of RNA (>1 μg oftotal RNA). This is easily obtained with tissue samples, butit can be difficult to extract these amounts of RNA frombody fluids (Burgos et al. 2013). Therefore, sequencing ofsmall RNAs from body fluids often use lower amounts of in-put material, in some cases down to 10 ng or 100 µL of inputfluids for the RNA extraction (Wang et al. 2012, 2013), andthis can be compensated through additional cycles of PCRamplification (Wang et al. 2012). This potentially meansthat very small amounts of contaminants can be amplifiedto yield detectable sequence read output.Although xenomiRs were observed in most body fluid
samples, we estimate that the levels are very low, at around 5miRNA copies per cell (Materials and Methods). These lowcounts contrast those of individual endogenous miRNAs,which can reach 50,000 copies per cell (Lappalainen et al.2013). It has been estimated that miRNAs need to be presentat around 1000 to 10,000 copies per cell to regulate endoge-nous transcripts, depending on the miRNA binding strength
and prevalence of targets (Denzler et al. 2014). Thus, evenif the xenomiRs would be of dietary origin, they would beunlikely to be sufficiently abundant to affect transcripts inthe bloodstream. On the other hand, given that the evidencesuggests that xenomiRs are contaminants, they are represent-ed by so few sequencing reads that they are unlikely to per-turb any computational analyses. Thus, the xenomiRs likelyrepresent trace contaminations that will have no consequenc-es on the conclusions of the studies.We realize that the numbers of clade-specific miRNAs
differ from clade to clade. This reflects incomplete miRNAannotations, but also that some clades have gained moremiRNAs than others in evolution (Sempere et al. 2006;Wheeler et al. 2009; Taylor et al. 2014). However, this is un-likely to confound our overall results. In particular, we havegood coverage of the plant miRNAs, including MIR168, sothe relative paucity of plant sequences in human biofluidscannot be attributed to our annotations. Similarly, we realizethat our investigation of xenomiRs in body liquids is biasedtoward one comprehensive study that included more thanhalf of our serum and CSF samples (study PRJNA241469).However, our main conclusions hold also when these sam-ples are disregarded. Specifically, unlikely animal food sourc-es such as insect and lophotrochozoa still dominate, whilefish and bird xenomiRs are rare. Importantly, the samplesstill group according to the studies, suggesting batch effects.This shows that our conclusions are robust to the exclusionof particular studies.In summary, our data support a technical rather than di-
etary origin of human xenomiRs. We have made the pro-cessed sequences from the data sets available, so that otherresearchers can extend our research. In addition, we hopethat the >800 data sets, processed uniformly with a stan-dardized pipeline, can function as a resource for the widerresearch community, for instance in the field of biomarkerdiscovery.
MATERIALS AND METHODS
Sequencing data collection
GSE accession numbers were collected from NCBI GEO databaseusing the searching strategy “((“micrornas”[MeSH Terms] ORmiRNA[All Fields]) AND “Non-coding RNA profiling by high-throughput sequencing”[All Fields]) AND “Homo sapiens”[porgn]”(271 GSE IDs, 5958 sequencing data sets, 12/08/2015). Accordingto the GSE IDs, the metadata of contained data sets (XML format)were queried using esearch and efetch from Entrez Direct v 2.50(Kans 2011). Using bash regular expression pattern, 823 samples(from 49 GSE IDs) that originate from human blood, liver, andbrain and sequenced on an Illumina platform were selected anddownloaded from the Sequence Read Archive (SRA) FTP site. It isimportant to note that SRA data sets in this case could be anytype of sequencing data such as sRNA-seq, RNA-seq, ChIP-seq,etc. An extra 395 sRNA-seq data sets on serum and CSF samples
FIGURE 7. Expression of cow and maize miRNAs. Sequenced RNAsthat unambiguously mapped to cow and maize miRNAs were identifiedand summed up. The samples include sRNAs from horse (negative con-trol), from pigs fed maize and pigs fed cow milk, and from cow andmaize (positive control). The number above each bar indicates the num-ber of sequenced RNAs mapping to cow or maize miRNAs.
Meta-study reveals xenomiRs are likely artifacts
www.rnajournal.org 441
Cold Spring Harbor Laboratory Press on March 21, 2017 - Published by rnajournal.cshlp.orgDownloaded from

with BioProject ID PRJNA241469 (Burgos et al. 2014) were down-loaded from NCBI dbGaP. In total, 1218 data sets were collected.
De novo 3′ adapter identification
The SRA format data sets were converted to FASTQ files using fastq-dump with option –split-3 from SRA Toolkit v 2.3.5. The paired-end reads were split into two FASTQ files with corresponding suffix_1.fastq and _2.fastq, while single reads were extracted into oneFASTQ file. According to the file name, 75 paired-end sequencingdata sets were removed. Since 3′ adapter sequences were not alwaysprovided together with FASTQ files and trimming the right adaptersequence is essential for the later efficient miRNA identification, allthe remaining FASTQ files were processed for 3′ adapter identificationusing our in-house script in the following manner: Each FASTQ filewas converted to FASTA file with collapsing duplicate reads to speedup later processing. Homo sapiens mature miRNA sequences frommiRBase v 21 were mapped to the reads of each FASTA file consider-ing all the perfect alignment using bowtie v 1.1.0. The 8 nucleotides(nt) subsequent to the aligned location in the FASTA reads wererecorded and the most frequently appearing 8-mer was assignedas potential 3′ adapter sequence for that file. Besides determiningthe 3′ adapter sequences, the most abundant 8-mer can also approx-imately represent the number of miRNA reads profiled in that file.
Selection of sRNA-seq data
To exclude other types of sequencing data such as RNA-seq data, theabundance and sequences of the identified 3′ adapter were used astwo filtering parameters. First, the file that has less than 100,000identified 3′ adapter sequences (artificial cutoff) was excluded. Theother types of libraries are not designed to capture miRNAs andunlikely to have a large amount of miRNA reads and the commonlyused 3′ adapter sequence for sRNA-seq. Although some sRNA-seqdata sets with low miRNA content might be discarded as well,these data sets are less likely to ensure a good representation of theeukaryotic small transcriptome. Second, among all the identified3′ adapter sequences, only the data sets (n = 824) with the commonlyused sRNA-seq 3′ adapter sequences (first 8-mer: TGGAATTCT,TCGTATGCC, ATCTCGTAT, AGATCGGA) were selected, as theyare most likely to be sRNA-seq data (Supplemental Table 1).
sRNA-seq quality control
The raw files of these sRNA-seq data sets were processed applyingthe same quality control pipeline. The low quality, low complexityreads were removed using FASTX-Toolkit and custom script. Theremaining reads were processed to check whether they containedthe 3′ adapter sequence (8-mer) using regular expression of thePython programming language. For each adapter recognized read,the last appearing 8-mer together with subsequent nucleotides wastrimmed. Reads shorter than 18 nt after adapter removal were dis-carded, since they are too short to be unambiguously traced backto reference sequences. The reads passing these quality control filterswere collapsed to a FASTA file (Supplemental source) where thenumber after “_x” in the ID field indicates the read abundance.The FASTA files were used for miRNA expression analysis andclade-specific miRNA identification.
miRNA expression analysis
miRNA expression analysis was performed using Miraligner fromSeqbuster (Pantano et al. 2010) with the Homo sapiens precursormiRNA (pre-miRNA) sequences and mature miRNA locationsfrom miRBase v18 as reference. Briefly, the collapsed reads of eachFASTA file were mapped to pre-miRNA sequences with allowingone mismatch (miraligner option -sub 1). Pre-miRNA and maturemiRNA can be modified by extension, trimming, and substitutionof nucleotides, resulting in distinct mature miRNA isoforms thathave variations with respect to the reference sequences frommiRBase (Ameres and Zamore 2013). The reads were also allowedto trim three nucleotides (-trim 3) or add one additional nucleotide(-add 1) in either the 3′ or 5′ end to reach the highest amount ofalignments to pre-miRNA sequences. The miRNA expression ma-trix of 824 samples × 1787 known miRNAs (Supplemental Table4) was generated by counting the number of reads that aligned toeach annotated mature miRNA location on pre-miRNA.
Clade-specific miRNA identification and counting
According to the previous curated clade-specific miRNA familynumbers (Supplemental Table 2), the reference catalog of clade-specific miRNA sequences was extracted from miRBase v21 byselecting the mature miRNAs with ID containing the family num-bers using regular expression of the Perl programing language. Forinstance, the primate 1200 family yields two sequences withmiRBase ID hsa-miR-1200 and ppy-miR-1200. A read was identi-fied as a clade-specific miRNA read and assigned to the correspond-ing family such as primate_1200 if its first 20 nt are matched to thefirst 20 nt of the reference sequences. By counting how many readswere assigned to each family, we obtained a family matrix, including129 clade-specific miRNA families from 16 clades × 824 samples(Supplemental Table 5). By further summing up the counts fromthe same clade, we got a clade matrix, including 16 clades × 824samples (Supplemental Table 6). Note that we discarded the nema-tode miRNAs that were detected in samples from BioprojectPRJNA241469, where the nematode miRNAs were spiked in on pur-pose to normalize the human miRNA abundance. The two countmatrixes were used to generate Figures 2, 3. A summary table show-ing the total number of raw reads, human miRNA, primate-specificmiRNA, and exogenous clade-specific miRNA counts can be foundin Supplemental Table 3.
Statistical analysis
The associations between the presence of xenomiRs or primatemiRNAs with biological origins, study year, or sample types wereevaluated with likelihood-ratio χ2 test using loglm() function fromMASS package in R v 3.1.1 (R Development Core Team 2010). Ifthe χ2 test revealed a strong relationship between multiple variables(n > 2) and outcomes, the partitioning analysis was further used toresolve which variable is associated. Since xenomiR counts were con-tinuous variables and skewed distributed, we applied the Wilcoxonrank sum test for the comparisons that involved xenomiR abundancein different conditions; for instance, if xenomiR counts are differentin body fluid versus tissue samples, we use wilcox.text() functionin R. To test whether the hierarchically clustered samples are ran-domly distributed and whether the xenomiRs from each clade are
Kang et al.
442 RNA, Vol. 23, No. 4
Cold Spring Harbor Laboratory Press on March 21, 2017 - Published by rnajournal.cshlp.orgDownloaded from
randomly present across samples, we applied a permutation test,where the sample IDs were randomly shuffled 1000 times to getthe sampling distribution of test statistics. The ranking of the realtest statistic among the shuffled test statistic gives a P-value. A smallP-value is assigned if the real test statistic is beyond or located to thetails of the distribution.
Principal component analysis
The counts in the family matrix (Supplemental Table 5) and theclade matrix (Supplemental Table 6) were first normalized to readsper million (RPM) for each sample.
nr,s = cr,s/cs × 106,
where cr,s is the raw counts of clade-specific family r (ranged from 1to 129) or clade r (ranged from 1 to 16) for sample s, cs represents thetotal number of endogenous human miRNA counts estimated byseqbuster (see section “miRNA Expression Analysis”) for samples, nr,s is RPM of clade-specific family or clade r that normalized toendogenous miRNA counts for sample s. In order to get a clear pat-tern of sample grouping, the nr,s is further logarithm-transformed tolog10(nr,s+1).The principal component analysis (PCA) of primate-specific
miRNA families was performed on a subset of the normalizedmatrix including 41 primate-specific miRNA families × 432 bodyfluid samples, using the prcomp() function in R v 3.1.1. The samplepoints were projected in a subspace formed by the first and secondprincipal components that explained 27.3% of the variability. Thesample points were colored based on the study (Fig. 5A) and thesample biological origins (Fig. 5B). The count matrix of xenomiRfamilies was much sparser than the corresponding primate matrix,containing many zero values. Therefore we summed up thexenomiR family counts of families belonging to the same clade,and performed the PCA on the clade matrix including 15 non-pri-mate clades × 296 body fluid samples (Fig. 5C,D). Four outliers wereremoved, including GSE34891_serum_A10, GSE59565_serum_C83, PRJNA241469_CSF_C22, and PRJNA241469_CSF_B13.
Animal feeding studies
Two different animal experimental designs were examined in thispaper. The experiments were conducted in two different animalfacilities. All studies were performed according to animal ethicalapproval and current Danish legislation. The rat experiments wereconducted at Glostrup Research Institute and included maleSprague-Dawley rats weighing 300 g and randomly divided intothree groups (n = 3 in each group). In the first 7 d of the experiment,the two groups had access to both regular chow and either boiledpotatoes or boiled rice. The next 28 d, they were given exclusivelyeither potatoes or rice ad libitum. As control group, three ratswere fed with regular chow for 35 d (#1320, Brogaarden). Ratswere anesthetized by subcutaneous injection with 2.5 mL/kg of amixture of Hypnorm–Midazolam (1:1:2) in sterile water (contain-ing 0.079 mg/mL fentanyl, 2.50 mg/mL fluansion, Hypnorm,VetaPharma Ltd. and 1.25 mg/mL, Midazolam “Hameln”). Ratswere drained for blood by punctuation of the ophthalmic venousplexus into a VacutainerSST II Advance (BD, Becton, Dickinsonand Company). The piglet experiments were conducted on threefemale crossbred pigs (Durox × Danish landrace × Yorkshire). The
piglets were weaned at 28 d of age, and then transferred to a formu-lated diet for 5 d (detailed in Lykke et al. 2013). After this acclima-tization, the piglets were fed a pure maize diet for 49 d. In anotherpig experiment, three newborn piglets were kept on a bovine milkbased diet for 26 d. The first 5 d, the piglets were given parenteralnutrition via the umbilical cord and bovine colostrum via an esoph-ageal catheter. For details, the reader is referred to Andersen et al.(2016). During the 5 d, the piglets were gradually transferred toan enteral diet of bovine milk and kept on this for 21 d. Bloodwas collected and serum was prepared as described below.
Feeding study preparation of serum samplesand RNA extraction
After coagulation for 30 min at room temperature, the blood wascentrifuged at 2000g for 10 min at 4°C, and serum was collectedand stored at−80°C until RNA extraction. Serum (250 µL) was cen-trifuged at 1000g for 5 min at 4°C. Supernatant serum (200 μL) wasused for RNA extraction. QiaZol and chloroform were added to theserum, and total RNA was extracted using the Qiagen miRNeasyMini Kit (QIAGEN). The general instructions from themanufactur-er were followed with a minor addition.We added three washes withthe supplied RPE wash buffer instead of ×2 and eluted in 40 µL.
Feeding study library preparation and sRNAsequencing
Extracted total serum RNA from the two different animal modelswas concentrated in a speedvac to a final volume of 10 µL. Fromthis 5µL was used as the input in the libraries, which were preparedaccordingly with TruSeq Small RNA Sample Preparation kit(Illumina). There was made one modification to the Illumina pro-tocol, since we increased the number of PCR cycles from 11 to 16for total RNA with a 1 µg as the starting material. Additionally, weapplied TruSeq SR Cluster Kit v3 for cluster generation, and further-more, for sequencing, TruSeq SBS Kit v3 was applied. Both wereused according to the instructions. sRNA sequencing was conductedon an Illumina HiSeq2000 instrument at the core facility at theCentre for Genomic Regulation (CRG). We sequenced libraries as50-bp single-end with a total fragment size of ∼150 bp reads. Basecalling and quality score calculation was performed from raw inten-sities using Illumina’s pipeline version 1.8.1.
Feeding study sRNA preprocessing and analysis
The sensitive sequence analyses applied to the feeding study datawere as follows. The called rat and pig reads were trimmed withthe command line: fastx_trimmer -f 1 -l 36 and low-quality readsdiscarded with fastx_artifacts_filter using the options -q 10 -p 50(http://hannonlab.cshl.edu/fastx_toolkit/). Adapters were clippedusing the AdRec.jar program from the Seqbuster suite with thefollowing options: java -jar AdRec.jar 1 8 0.3. A custom search sub-sequently clipped shorter adapters: If there were no matches to thefirst 8 nt, then matches to the first 7 nt of the adapter were searchedin the last 7 nt of the read, then matches of the first six to the last sixpositions and so on. Reads that had no matches were retained, butnot clipped. Last, reads shorter than 18 nt were discarded. Thenine rat data sets were analyzed with public Arabidopsis thaliana
Meta-study reveals xenomiRs are likely artifacts
www.rnajournal.org 443
Cold Spring Harbor Laboratory Press on March 21, 2017 - Published by rnajournal.cshlp.orgDownloaded from

(SRR404277), potato (SRR1035231), and rice (SRR037746) sRNA-seq data, which served as controls. Each data set was mapped againstthe full set of miRBase miRNA precursor hairpins (version 20),using bowtie with the following options: bowtie -f -v 0 -m 1. Onlyreads mapping unambiguously to a single hairpin were considered,and the ones that mapped in this manner to rat, rice, or potato hair-pins were identified and summed up. The two pig data sets weresupplemented with public data sets from horse (SRR871532), cow(SRR3993674), and maize (SRR2089715), which served as negative,positive, and positive controls, respectively. For each data set, readslikely originating from pig were first identified and removed, bymapping against the pig genome (Sscrofa10.2) with the followingoptions: bowtie -f -v 1 -k 1 Sscrofa10.2. Next, the remaining readswere mapped against the miRBase hairpins (version 21) with theseoptions: bowtie -f -v 0 -m 1. As with the rat analysis, only readsmap-ping unambiguously to the cow and maize hairpins were consideredas high confidence cow and maize miRNAs.
Estimating miRNA copies per cell
We assume that a mammalian cell contains around 100,000 endog-enous miRNA molecules per cell (Calabrese et al. 2007). We thenestimate the number of copies of an individual miRNA as: TPM(transcripts per million) × 100,000/1,000,000.
DATA DEPOSITION
Raw reads in the form of fastq files from the animal feeding studieshave been stored in Gene Expression Omnibus GEO under accessionnumber GSE92897. Furthermore, the processed sequence data fromhuman tissue and body fluid in the form of fasta files can be down-loaded from https://figshare.com/s/36e1c536a573011e4248.
SUPPLEMENTAL MATERIAL
Supplemental material is available for this article.
ACKNOWLEDGMENTS
Wenjing Kang and Marc R. Friedländer acknowledge funding fromthe Swedish Research Council and from the Strategic Research Areaprogram of the Swedish Research Council through StockholmUniversity. Expenses for piglet experimentation were covered viathe NEOMUNE program, the Danish Council for StrategicResearch. Anna J.S. Houben was funded as a Marie Curie post-doctoral fellow supported by the European Commission 7thFramework Program under grant agreement no. 330133. The com-putations were performed on resources provided by SNIC throughUppsala Multidisciplinary Center for Advanced ComputationalScience (UPPMAX) under Project SNIC b2015182. We are gratefulto Kevin Peterson from Dartmouth College for advice on the clade-specific miRNAs, and we thank Claudia Kutter from the KarolinskaInstitute for her constructive comments on the manuscript.
Received October 25, 2016; accepted December 19, 2016.
REFERENCES
Akey JM, Biswas S, Leek JT, Storey JD. 2007. On the design and analysisof gene expression studies in human populations. Nat Genet 39:807–808; author reply 808–809.
Ameres SL, Zamore PD. 2013. Diversifying microRNA sequence andfunction. Nat Rev Mol Cell Biol 14: 475–488.
Andersen AD, Sangild PT, Munch SL, van der Beek EM, Renes IB,Ginneken Cv, Greisen GO, Thymann T. 2016. Delayed growth,motor function and learning in preterm pigs during early postnatallife. Am J Physiol Regul Integr Comp Physiol 310: R481–R492.
Auerbach A, Vyas G, Li A, Halushka M, Witwer K. 2016. Uptake of di-etary milk miRNAs by adult humans: a validation study. F1000Res 5:721.
Baier SR, Nguyen C, Xie F, Wood JR, Zempleni J. 2014. MicroRNAs areabsorbed in biologically meaningful amounts from nutritionallyrelevant doses of cow milk and affect gene expression in peripheralblood mononuclear cells, HEK-293 kidney cell cultures, and mouselivers. J Nutr 144: 1495–1500.
Boudreau RL, Rodríguez-Lebrón E, Davidson BL. 2011. RNAi medicinefor the brain: progresses and challenges. Hum Mol Genet 20:R21–R27.
Burgos KL, Javaherian A, Bomprezzi R, Ghaffari L, Rhodes S, CourtrightA, Tembe W, Kim S, Metpally R, Van Keuren-Jensen K. 2013.Identification of extracellular miRNA in human cerebrospinal fluidby next-generation sequencing. RNA 19: 712–722.
Burgos K, Malenica I, Metpally R, Courtright A, Rakela B, Beach T,Shill H, Adler C, Sabbagh M, Villa S, et al. 2014. Profiles of extracel-lular miRNA in cerebrospinal fluid and serum from patients withAlzheimer’s and Parkinson’s diseases correlate with disease statusand features of pathology. PLoS One 9: e94839.
Byron SA, Van Keuren-Jensen KR, Engelthaler DM, Carpten JD,Craig DW. 2016. Translating RNA sequencing into clinical diagnos-tics: opportunities and challenges. Nat Rev Genet 17: 257–271.
Calabrese JM, Seila AC, Yeo GW, Sharp PA. 2007. RNA sequence anal-ysis defines Dicer’s role in mouse embryonic stem cells. Proc NatlAcad Sci 104: 18097–18102.
Chen X, Ba Y, Ma L, Cai X, Yin Y, Wang K, Guo J, Zhang Y, Chen J,Guo X, et al. 2008. Characterization of microRNAs in serum: a novelclass of biomarkers for diagnosis of cancer and other diseases. CellRes 18: 997–1006.
Denzler R, Agarwal V, Stefano J, Bartel DP, Stoffel M. 2014. Assessingthe ceRNA hypothesis with quantitative measurements of miRNAand target abundance. Mol Cell 54: 766–776.
Dickinson B, Zhang Y, Petrick JS, Heck G, Ivashuta S, Marshall WS.2013. Lack of detectable oral bioavailability of plant microRNAs afterfeeding in mice. Nat Biotechnol 31: 965–967.
Fabris L, Calin GA. 2016. Circulating free xeno-microRNAs—the newkids on the block. Mol Oncol 10: 503–508.
Fiedler LA. 1990. Rodents as a food source. In Proceedings ofthe Fourteenth Vertebrate Pest Conference, p. 30, University ofCalifornia, Davis.
Freedman JE, Gerstein M, Mick E, Rozowsky J, Levy D, Kitchen R,Das S, Shah R, Danielson K, Beaulieu L, et al. 2016. Diverse humanextracellular RNAs are widely detected in human plasma. NatCommun 7: 11106.
Fromm B, Billipp T, Peck LE, Johansen M, Tarver JE, King BL,Newcomb JM, Sempere LF, Flatmark K, Hovig E, et al. 2015. A uni-form system for the annotation of vertebrate microRNA genes andthe evolution of the human microRNAome. Annu Rev Genet 49:213–242.
HaM, Kim VN. 2014. Regulation of microRNA biogenesis.Nat RevMolCell Biol 15: 509–524.
Holm A, Bang-Berthelsen CH, Knudsen S, Kornum BR, Modvig S,Jennum P, Gammeltoft S. 2014a. miRNA profiles in plasma frompatients with sleep disorders reveal dysregulation of miRNAs innarcolepsy and other central hypersomnias. Sleep 37: 1525–1533.
Holm A, Bang-Berthelsen CH, Knudsen S, Modvig S, Kornum BR,Gammeltoft S, Jennum PJ. 2014b. MiRNA profiles in cerebrospinal
Kang et al.
444 RNA, Vol. 23, No. 4
Cold Spring Harbor Laboratory Press on March 21, 2017 - Published by rnajournal.cshlp.orgDownloaded from

fluid from patients with central hypersomnias. J Neurol Sci 347:199–204.
Izumi H, Tsuda M, Sato Y, Kosaka N, Ochiya T, Iwamoto H, Namba K,Takeda Y. 2015. Bovine milk exosomes contain microRNA andmRNA and are taken up by human macrophages. J Dairy Sci 98:2920–2933.
Jung M, Schaefer A, Steiner I, Kempkensteffen C, Stephan C,Erbersdobler A, Jung K. 2010. Robust microRNA stability in degrad-ed RNA preparations from human tissue and cell samples. ClinChem 56: 998–1006.
Kans J. 2011. Entrez direct: E-utilities on the UNIX command line. CurrTop Med Chem 11: 2171–2179.
Kircher M, Sawyer S, Meyer M. 2012. Double indexing overcomes inac-curacies in multiplex sequencing on the Illumina platform. NucleicAcids Res 40: e3.
Landgraf P, Rusu M, Sheridan R, Sewer A, Iovino N, Aravin A, Pfeffer S,Rice A, Kamphorst AO, Landthaler M, et al. 2007. A mammalianmicroRNA expression atlas based on small RNA library sequencing.Cell 129: 1401–1414.
Lappalainen T, Sammeth M, Friedlander MR, ‘t Hoen PA, Monlong J,Rivas MA, Gonzalez-Porta M, Kurbatova N, Griebel T, FerreiraPG, et al. 2013. Transcriptome and genome sequencing uncoversfunctional variation in humans. Nature 501: 506–511.
Laubier J, Castille J, Le Guillou S, Le Provost F. 2015. No effect of an el-evated miR-30b level in mouse milk on its level in pup tissues. RNABiol 12: 26–29.
Leek JT. 2014. svaseq: removing batch effects and other unwanted noisefrom sequencing data.Nucleic Acids Res 42. doi: 10.1093/nar/gku864
Li J, Zhang Y, Li D, Liu Y, Chu D, Jiang X, Hou D, Zen K, Zhang CY.2015. Small non-coding RNAs transfer through mammalian placen-ta and directly regulate fetal gene expression. Protein Cell 6: 391–396.
Liang G, Zhu Y, Sun B, Shao Y, Jing A, Wang J, Xiao Z. 2014. Assessingthe survival of exogenous plant microRNA in mice. Food Sci Nutr 2:380–388.
Liang H, Zhang S, Fu Z, Wang Y, Wang N, Liu Y, Zhao C, Wu J, Hu Y,Zhang J, et al. 2015. Effective detection and quantification of dieteti-cally absorbed plant microRNAs in human plasma. J Nutr Biochem26: 505–512.
Lykke M, Hother AL, Hansen CF, Friis H, Molgaard C, Michaelsen KF,Briend A, Larsen T, Sangild PT, Thymann T. 2013. Malnutrition in-duces gut atrophy and increases hepatic fat infiltration: studies in apig model of childhood malnutrition. Am J Transl Res 5: 543–554.
Mitchell PS, Parkin RK, Kroh EM, Fritz BR, Wyman SK, Pogosova-Agadjanyan EL, Peterson A, Noteboom J, O’Briant KC, Allen A,et al. 2008. Circulating microRNAs as stable blood-based markersfor cancer detection. Proc Natl Acad Sci 105: 10513–10518.
Munch EM, Harris RA, Mohammad M, Benham AL, Pejerrey SM,Showalter L, Hu M, Shope CD, Maningat PD, Gunaratne PH,et al. 2013. Transcriptome profiling of microRNA by Next-Gendeep sequencing reveals known and novel miRNA species in the lip-id fraction of human breast milk. PLoS One 8: e50564.
Pantano L, Estivill X, Marti E. 2010. SeqBuster, a bioinformatic tool forthe processing and analysis of small RNAs datasets, reveals ubiqui-tous miRNA modifications in human embryonic cells. NucleicAcids Res 38: e34.
Pardridge WM. 2005. The blood-brain barrier: bottleneck in brain drugdevelopment. NeuroRx 2: 3–14.
Philip A, Ferro VA, Tate RJ. 2015. Determination of the potential bioa-vailability of plant microRNAs using a simulated human digestionprocess. Mol Nutr Food Res 59: 1962–1972.
R Development Core Team. 2010. R: a language and environmentfor statistical computing. R Foundation for Statistical Computing,Vienna, Austria.
Schwarzenbach H, Nishida N, Calin GA, Pantel K. 2014. Clinical rele-vance of circulating cell-free microRNAs in cancer. Nat Rev ClinOncol 11: 145–156.
Sempere LF, Cole CN, McPeekMA, Peterson KJ. 2006. The phylogenet-ic distribution of metazoan microRNAs: insights into evolutionarycomplexity and constraint. J Exp Zool B Mol Dev Evol 306: 575–588.
Simonson B, Das S. 2015. MicroRNA therapeutics: the next magic bul-let? Mini Rev Med Chem 15: 467–474.
Snow JW, Hale AE, Isaacs SK, Baggish AL, Chan SY. 2013. Ineffectivedelivery of diet-derived microRNAs to recipient animal organisms.RNA Biol 10: 1107–1116.
Taylor RS, Tarver JE, Hiscock SJ, Donoghue PC. 2014. Evolutionary his-tory of plant microRNAs. Trends Plant Sci 19: 175–182.
Title AC, Denzler R, Stoffel M. 2015. Uptake and function studies of ma-ternal milk-derived microRNAs. J Biol Chem 290: 23680–23691.
Tosar JP, Rovira C, Naya H, Cayota A. 2014. Mining of public sequenc-ing databases supports a non-dietary origin for putative foreignmiRNAs: underestimated effects of contamination in NGS. RNA20: 754–757.
U.S. Food and Drug Administration. Defect Levels Handbook. Vol. 2016.Wang K, Li H, Yuan Y, Etheridge A, Zhou Y, Huang D, Wilmes P,
Galas D. 2012. The complex exogenous RNA spectra in human plas-ma: an interface with human gut biota? PLoS One 7: e51009.
Wang K, Yuan Y, Li H, Cho JH, Huang D, Gray L, Qin S, Galas DJ. 2013.The spectrum of circulating RNA: a window into systems toxicology.Toxicol Sci 132: 478–492.
Weber JA, Baxter DH, Zhang S, Huang DY, Huang KH, Lee MJ,Galas DJ, Wang K. 2010. The microRNA spectrum in 12 body fluids.Clin Chem 56: 1733–1741.
Wheeler BM, Heimberg AM, Moy VN, Sperling EA, Holstein TW,Heber S, Peterson KJ. 2009. The deep evolution of metazoanmicroRNAs. Evol Dev 11: 50–68.
Winther TN, Bang-Berthelsen CH, Heiberg IL, Pociot F, Hogh B. 2013.Differential plasma microRNA profiles in HBeAg positive andHBeAg negative children with chronic hepatitis B. PLoS One 8:e58236.
Witwer KW, McAlexander MA, Queen SE, Adams RJ. 2013. Real-timequantitative PCR and droplet digital PCR for plant miRNAs inmammalian blood provide little evidence for general uptake of die-tary miRNAs: limited evidence for general uptake of dietary plantxenomiRs. RNA Biol 10: 1080–1086.
Wolff JO, Sherman PW. 2008. Rodent societies: an ecological and evolu-tionary perspective. University of Chicago Press, Chicago, IL.
Zhang L, Hou D, Chen X, Li D, Zhu L, Zhang Y, Li J, Bian Z, Liang X,Cai X, et al. 2012. Exogenous plant MIR168a specifically targetsmammalian LDLRAP1: evidence of cross-kingdom regulation bymicroRNA. Cell Res 22: 107–126.
Zhou Z, Li X, Liu J, Dong L, Chen Q, Liu J, Kong H, Zhang Q, Qi X,Hou D, et al. 2015. Honeysuckle-encoded atypical microRNA2911directly targets influenza A viruses. Cell Res 25: 39–49.
Meta-study reveals xenomiRs are likely artifacts
www.rnajournal.org 445
Cold Spring Harbor Laboratory Press on March 21, 2017 - Published by rnajournal.cshlp.orgDownloaded from

10.1261/rna.059725.116Access the most recent version at doi: 2017 23: 433-445 originally published online January 6, 2017RNA
Wenjing Kang, Claus Heiner Bang-Berthelsen, Anja Holm, et al. xenomiRs are likely artifactsSurvey of 800+ data sets from human tissue and body fluid reveals
Material
Supplemental
http://rnajournal.cshlp.org/content/suppl/2017/01/06/rna.059725.116.DC1
References
http://rnajournal.cshlp.org/content/23/4/433.full.html#ref-list-1
This article cites 51 articles, 15 of which can be accessed free at:
Open Access
Open Access option.RNAFreely available online through the
License
Commons Creative
.http://creativecommons.org/licenses/by-nc/4.0/(Attribution-NonCommercial 4.0 International), as described at
, is available under a Creative Commons LicenseRNAThis article, published in
ServiceEmail Alerting
click here.right corner of the article or
Receive free email alerts when new articles cite this article - sign up in the box at the top
http://rnajournal.cshlp.org/subscriptions go to: RNATo subscribe to
© 2017 Kang et al.; Published by Cold Spring Harbor Laboratory Press for the RNA Society
Cold Spring Harbor Laboratory Press on March 21, 2017 - Published by rnajournal.cshlp.orgDownloaded from