Embed Size (px)
Citation preview

NASA Contractor Report 177615
"?z!"]
Survey of Lift-Fan AerodynamicTechnology
David H. Hickey and Jerry V. Kirk
CONTRACT A25364D
September 1993
(NASA-CR-177615) SURVEY OFLIFT.FAN AERODYNAMIC TECHNOLOGY
(NASA) 74 p
f_'94-21592
Unclas
RI/_SANational Aeronautics andSpace Administration
G3/05 0198083
https://ntrs.nasa.gov/search.jsp?R=19940017119 2018-06-12T22:35:42+00:00Z

NASA Contractor Report 177615
Survey of Lift-Fan AerodynamicTechnology
David H. Hickey, RetiredNASA Ames Researcher
Sunnyvale, California
Jerry V. KirkAmes Research Center
Moffett Field, California
Prepared forAmes Research CenterCONTRACT A25364D
September 1993
N/_SANational Aeronautics andSpace Administration
Ames Research CenterMoffett Field, California 94035-1000

qlL

Notation
a
A
AR
b
BLC
c
Cl
CL
CL51
Cp.f
d
D
f
F
FG
F2
H
K
L
M
PNL
Po
Pt
PWL
ql
q2
distance form fan axis to center of
pressure, ft
area, sq ft R
aspect ratio, b2/S or D/c S
span, ft T
boundary layer control Tc
wing chord, ft V
two-dimensional lift coefficientx
lift coefficient, L/(qS) or LD/(qcDF )
rate of change of lift coefficient with y
full span flap deflection, per radian z
BLC blowing momentum coefficient, ctBLC nozzle
thrust/(2AFqFBLC OFF)
suction plate diameter b
diameter, ft
acoustic frequency A
force, pounds
gross thrust, pAVj 2, pounds p
force on vane in exhaust, pounds Subscripts
serration chord and height above o
ground, ft1
relationship between induced lift andmomentum coefficient 2
lift, pounds 2d
pitching moment, foot-pounds 3
perceived noise level, PNdb D
eambient static pressure, pounds per
square foot F
total pressure, pounds per square foot i
sound power level, db j
dynamic pressure 1/2pV 2, pounds per n
square foots
average fan exhaust dynamic pressurein the streamwise direction, pounds t
per square foot x
average fan exhaust dynamic pressure
in the spanwise direction, pounds
per square foot
Reynolds number, dimensionless, or fan
radius, ft
area, sq ft, or serration spacing, ft
thrust, pounds
thrust coefficient, To/qS
free stream airspeed,
distance in a streamwise direction or
from fan axis to center of pressure,ft
distance in a spanwise direction, ft
distance in a vertical directon, ft
angle of attack, degrees
exit louver angle from the fan axis,
degrees
flap deflection or jet exhaust deflection,
degrees
increment in a value, downstream
minus upstream, or outboard minusinboard
air density, slugs/(cu ft)
ct=0,5=0
surface upstream from fan
fan area or fan exhaust
two-dimensional chord through fan axis
surface aft of the fan
duct
effective diameter
fan or flap ,--
incidence or induced
jet
nozzle
static
total
along the flight path or distance fromthe nozzle
iii Pl_C_OtN@ PAGE Bf..ANK NOT FILMED


Introduction
Representatives of NASA Ames Research Center asked
that a summary of technology appropriate for lift fan
powered short takeoff/vertical landing (STOVL) aircraft
be prepared so that new programs could more easily
benefit from past research efforts. This paper represents
one of six prepared for that purpose. The authors have
conducted or supervised the conduct of research on lift
fan powered STOVL designs and some of their important
components for decades.
This paper will first address aerodynamic modeling
requirements for experimental programs to assure realis-
tic, trustworthy results. It will next summarize the results
of efforts to develop satisfactory specialized STOVL
components such as inlets and flow deflectors. It will also
discuss problems with operation near the ground, aerody-
namics while under lift fan power, and aerodynamic
prediction techniques. Finally, results of studies to reduce
lift fan noise will be presented. The paper will emphasize
results from large scale experiments, where available, for
reasons that will be brought out in the discussion. Some
work with lift engine powered STOVL aircraft is also
applicable to lift fan technology, and will be presentedherein. Small-scale data will be used where necessary to
fill gaps.
Experimental Modeling
When planning aerodynamic modeling for conventional
aircraft studies, both viscous effects (Reynolds number
effect) and scale effects must be considered. The term"scale effect" is meant as the likelihood that structural
details of small scale models will probably be differentthan the details of aircraft construction, and in sensitive
aerodynamic areas can influence the results. For STOVL
aircraft, where the propulsion flow has a major influenceon the aircraft flow environment, the situation is further
complicated by the necessity to model the propulsion and
free stream flow mixing and entrainment. The require-
ment has a significant impact on selection of powerplantsimulators.
Transition Flight
Figures 1 and 2 from references 1 and 2 contain data
showing viscous effects on the angle-of-attack for tilting
duct lip flow separation on several tilting ducts and the
performance of a cascade of turning vanes behind lift
fans. Although the small scale X-22 duct was a reason-
able size (about 17 inches diameter), the upstream inlet
flow separation at a given velocity ratio occurred about
35 degrees before the full scale duct flow separation. On
the downstream lip, the separation occurred about
50 degrees before full scale. In order to obtain meaningful
overall performance results, it is necessary to enlarge thesmall scale inlet radius in the sensitive areas to avoid this
premature flow separation. The data in figure 2 showsthat the 1/6 scale cascade had a major loss in turning
efficiency compared to a full scale cascade. The chord of
the small scale cascade was only 1 1/4 inches, so the
performance detriment may have partially been caused
by manufacturing anomalies as well as viscous effects. In
addition, the poor vectoring performance accelerated the
back pressuring of the fan, further reducing performance.
It would be very difficult to make a cascade this size
comparable in efficiency to a large scale cascade.
In 1960, in cooperation with the Army and the GeneralElectric Co., NASA Ames studied the first large scale
model with a lift fan mounted in the fuselage
(5.2 foot diameter GE X-353). The model is shown in
figure 3, from reference 3. A 1/9 model of the Amesmodel was later fabricated by NASA Langley. The test
setup for the small scale model duplicated as closely as
possible the Ames 40 × 80 test section and mounting
struts. Figure 4 from reference 4 shows the setup. A cross
section of the propulsion systems for the two models is
shown in figure 5. The two models had scaled inlet radiiand inlet vanes. The fans, however, were very different.
The fan in the large scale model was a typical axial flowfan with a 36 bladed rotor and a stator. The fan was
powered by a J-85 engine and had an augmentationratio of 2.8. The small scale fan had 4 blades, no stator,
with the exception of vanes designed to turn the flow for
thrust, and was powered by shop air through nozzles
on the fan blades. The augmentation ratio of the fan is
believed to be in the neighborhood of 1.5, with an exit
velocity distribution that peaks at the tip due to the perva-siveness of the drive jets. In addition, the velocity distri-
bution had a large flow deficit in the center. The lift tostatic thrust ratio as a function of airspeed for the two
models is presented in figure 6. The upper curve is for the
large scale model (the two symbols are with and without
wall corrections) and the lower curve is for the smallscale model. The results indicate that the wall corrections
were small, but more importantly, that there was a major
problem with the small model simulation. After consid6Y-
able analysis, reference 4 attributed most of the lower lift
of the small scale model to more negative pressures on
the bottom of the fuselage. The difference is contrary to
expectations from Reynolds number differences.
Reference 5 argues that the decay rate of a jet must
be modeled for a correct aerodynamic simulation. Theswirl in the small scale exhaust and the different exhaust
profiles probably resulted in different mixing andentrainment rates thus decay rates for the two models,

andproducedthediscrepancyinlowersurfacepressuresandlift.
TheresultsoftheworkdescribedabovestimulatedadditionalworktohelpdefinemodelingrequirementsforVTOLpropulsion.Reference2presentsresultsfromanotherinvestigationusingtheAmes 40 x 80 foot wind
tunnel. Two 3 foot diameter fans were independently
installed in a large scale semi-span wing. One fan was
designed to be a 1.3 pressure ratio lift fan. The other wasa 0.6 scale version of the 1.1 pressure ratio GE X-353 fan.While the diameters of the fans were the same, the inter-
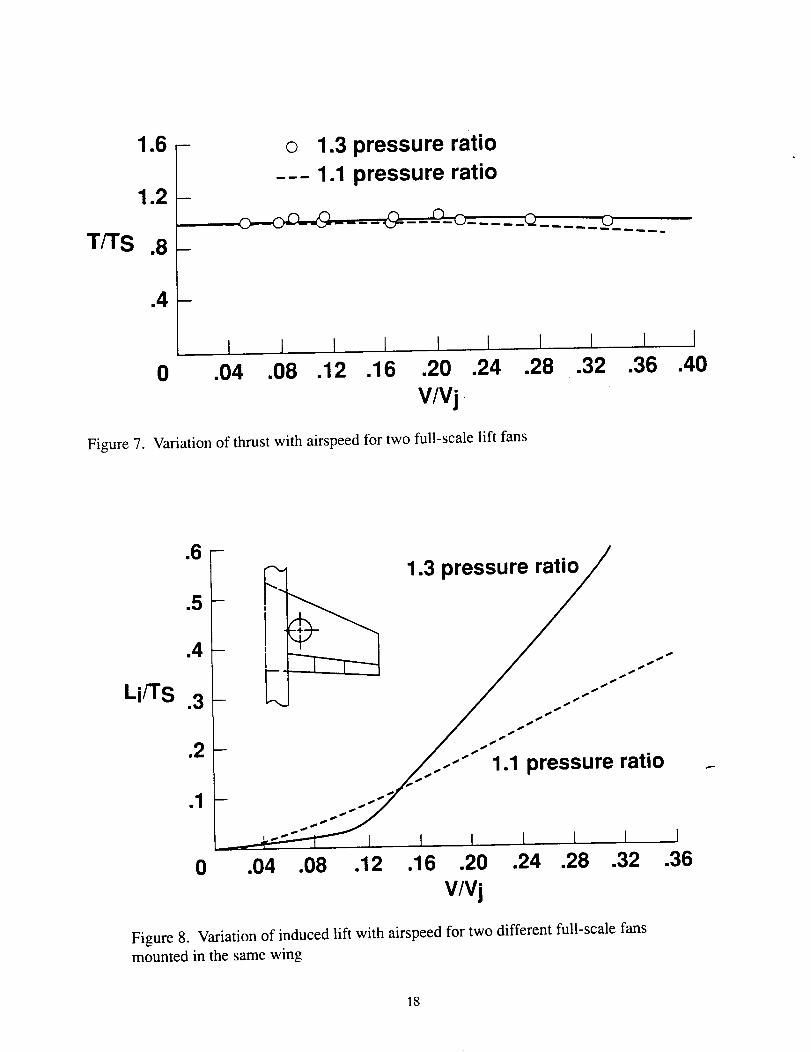
nal flow paths were quite different. Figure 7 shows that
the thrust variation with forward speed was similar on anon-dimensional basis, however, figure 8 shows that the
lift induced by the propulsive flow was not only different,
but the shape of the lift variation with forward speed was
different. As show in figure 9, the pitching moment due to
the propulsive flow also varied for the two fans. In this
case, the physical fan exhausts are different. The turbine
of the 1.3 pressure ratio fan completely surrounds the
exhaust periphery, while the 1.1 pressure ratio fan exhaust
covers 180 degrees. This difference, along with the differ-
ent internal flow paths may have caused different
entrainment rates and the discrepancy shown. This work
indicates that it may not be enough to model a good axial
flow fan with another good axial flow fan; exhaust char-
acteristics must be appropriately modeled as well. Otherresults from reference 2 are shown in figure 10. The thrust
variation with forward speed of the 3 foot diameter 1.1
pressure ratio fan, presented in figure 7, is compared with
results from a 15 inch diameter fan powered by a coaxial
hub turbine, mounted in a thick wing. Internal design of
the two fans is quite different; the larger fan had high
aspect ratio blading while the smaller fan had low aspect
ratio blading. Thrust variation with forward speed is simi-
lar for the two fans, but as just observed, this doesn'tmean that induced lift and moment would be similar.
Finally, the thrust variation with forward speed for a3 foot diameter, 1.1 pressure ratio fan is compared with
that of a tip turbine driven 8 inch fan. Both were installed
in similar wings. For this comparison, in figure 11 fromreference 2, the variation of thrust with forward speed
was substantially different.
Hover
Classical fundamental studies done at Langley Research
Center, reference 6, showed the importance of exhaust
decay on the induced hover lift loss. These results are
reproduced in figure 12. The exhaust decay is a functionof the entrainment of outside air by the jet, which depends
on such things as scale and frequency of the jet turbu-
lence, and the physical environment at the jet exhaust.
To examine some of these factors at full scale, Ames per-
formed a fundamental ground-effect test using a J-97 jet
engine and a TF-34 turbofan engine. The results are
compared with one prediction equation derived fromsmall scale data in figure 13, from reference 7. Out of
ground effect, the equation under predicts the lift losssomewhat, indicating that the decay rate of the small
scale data used to derive the equation was slower than for
the large scale data. In ground effect, at heights less than5 exhaust diameters, the full scale engines had as much as
double the lift loss, indicating a major difference in the jet
impingement and ground-jet small and large scale flows.
More recent studies (SAE Paper 901060, by Corsiglia,
Wardell, and Kuhn) have not been able to reproduce the
small scale results in figure 13. Indeed, few fundamental
ground effect experiments are above reproach for reasonssuch as test room size, ground plane size, jet flow quality
(turbulence content and flow profile), ground plane
surface texture, etc. Even the large scale results can be
questioned because the engine was horizontal so that
one side of the ground plane could be influenced by
real ground proximity.
If the fundamental studies are suspect, what results can
be trusted? Removing the questionable factors mentioned
above is done by testing outside, using the ground for the
ground plane, and having full scale modeling and propul-
sion very similar to the planned propulsion. Figure 14,from reference 8 shows the hover lift increment due to
ground effect for the VAK 191B lift engine STOVLaircraft and a 10% scale model of the aircraft. The aircraft
suckdown is approximately twice that of the model. A
comparison of ground effect between a large scale model
(fig. 15) using 3 three foot diameter fans and a small scale
model using 2 inch air jets to stimulate fans is shown in
the other part of figure 14. Again the large scale model
had more sever adverse ground effect. Another size
effects comparison is available from the Grumman 698
configuration (fig. 16). Figure 16 shows a full scale
model using TF-34 engines for propulsion. Figure 17,
from reference 9 shows a ground effect test set up with a
detailed 11% scale model using two sophisticated 5 inch
diameter turbofan simulators. In this case, adverse ground
effect (if any with the large scale model was less thanwith the small scale model (fig. 18) and the fountain
effect at large scale was more pronounced.
Figure 19 shows one more reason for realistic simulation
of VTOL propulsion when hover testing in ground effect.
The ground proximity can back-pressure the fan andreduce the fan thrust. Ground effect data from the models
reported in references 3 and 10 is shown. The fan thrustwas reduced about the same amount for both models, but
the fan-in-fuselage model had a further lift reduction due
to negative induced lift. The fan-in-wing model had

fountainflowthatoffsetthe fan thrust loss and gave
neutral ground effect. Without true propulsion system
characteristics, the ground effect results would be in error
by as much as 15%. It should be noted that the fan in
wing data from figure 19 were from an approximate fullscale GE XV-5 model with full scale GE XV-5 propul-
sion, and the flight and ground test results were the same,
verifying the earlier hypothesis that the way to test for
ground effects with confidence is by full scale modeling.
Shaft and gear or pneumatic drive (that is by engine
exhaust or engine exhaust driven compressor) may be
feasible for a lift fan powered aircraft. For hub driven fans
of any type, blade pitch may be a suitable option for rapid
response control, whereas tip driven fans can probably
not use this control method. On a variable pitch fan, flow
mixing and entrainment will vary as a function of blade
pitch because the exhaust turbulence and profile will vary
with blade angle at a fixed rpm. This means that with
variable pitch fans, induced effects from flow entrainment
may vary as much as the discrepancies noted in figures 6,
13, 14, and 18. With fixed pitch fans such as the GE tip
driven fans, internal aerodynamics may be unchanged to
the first order when thrust is changed, so that the flow
environment of the aircraft is unchanged as long as the
flight velocity ratio, V/Vj, is constant.
It is apparent from the results presented here, that if
ground-based facilities are to provide accurate results in
the hover and transition flight regimes of STOVL aircraft,
appropriate simulation of the flow from full scale power-
plants must be simulated, and performance of inlets and
vectoring components must be comparable with real
hardware. The flow simulation requirement is further
complicated because the properties to be simulated have
not been fully defined. Even when the modeling require-
ments are known, it may not be acceptable to perform
experiments at small scale because of viscous and scale
detail effects. Therefore, experimental work should be at
the largest practical scale, with real engines as near to the
planned full scale engines as possible. When compared to
the cost of a precision small scale model with simulators,as discussed in reference 11, the cost of large scale hard-
ware can be competitive; especially when confidence inthe results is factored into the evaluation.
Components For Lift Fan Installations
The components considered here are inlet arrangements to
take flow to lifting powerplants and the exhaust deflecting
devices to provide lift or drag in transition flight.
Inlets
Inlets for STOVL aircraft can range from the very shal-
low inlets of a fan-in-wing design to the much deeper
inlets that are compatible with fuselage installations,therefore this discussion will include the considerable
amount of work done on lift engine inlets.
Fan-in-wing inlets- In 1956, Ames conducted its first
wind tunnel test of a fan-in-wing model using a propeller
in a semispan wing (ref. 12). Results from this study were
limited because the propeller failed after a half hour of
wind-on time. This enhanced our fears about cyclic loads
of a fan located in the modified rotary wing environment.
In 1958, we continued our research with a stronger
20 inch diameter propeller in a semispan wing (fig. 20).
Upon learning of our enterprise, the General Electric Co.
joined us and provided the inlet and exhaust cascades
and professional assistance. This investigation was more
successful and provided much useful information for
the Army sponsored Ryan/GE XV-5 design. Figure 21,
from reference 13, shows that flow distortion through the
fan in the streamwise and spanwise directions. Figure 22
from reference 14 shows the distortion more clearly. The
measured total pressure ratio around the fan midpassage
circumference is shown at several forward speeds along
with the theoretical blade angl'e of incidence. In figure 21,distortion in the streamwise direction was small below a
V/Vj of 0.6 and in the spanwise direction the distortion
was small below a V/Vj of 0.4 for some inlet vane config-
urations, including no inlet vanes. In the range of velocity
ratios where fan blade are highly stressed (below
V/Vj = 0.3), the distortion is low, thus the need for inlet
vanes can be questioned. With the extremely short inlet
for wing mounted lift fans, the fan seems to act as an inletflow control to minimize the effects of inlet flow
separation.
Full scale GE X-353 (5.2 foot diameter, 1.1 pressure
ratio, tip turbine driven) fans were exposed to the short
duct, wing environment in a joint Army, NASA, GE
program in the 40 x 80 foot wind tunnel in 1961. The
complete model is shown in figure 23, from reference 15,
and figure 24 shows the inlets tested. The more compli-cated articulated inlet did reduce flow distortion through
the fan but reduced lift at low speed unless the vane
angles were programmed with airspeed, and it providedless net transition thrust than the fixed vanes. Conse- ---
quently, the fixed vane arrangement was chosen for the
GE XV-5A airplane.
The GE X-353 fan is a conventional rotor-stator turboma-
chinery design which permits installation in relatively
thick wings designed for subsonic flight. Design of thin,
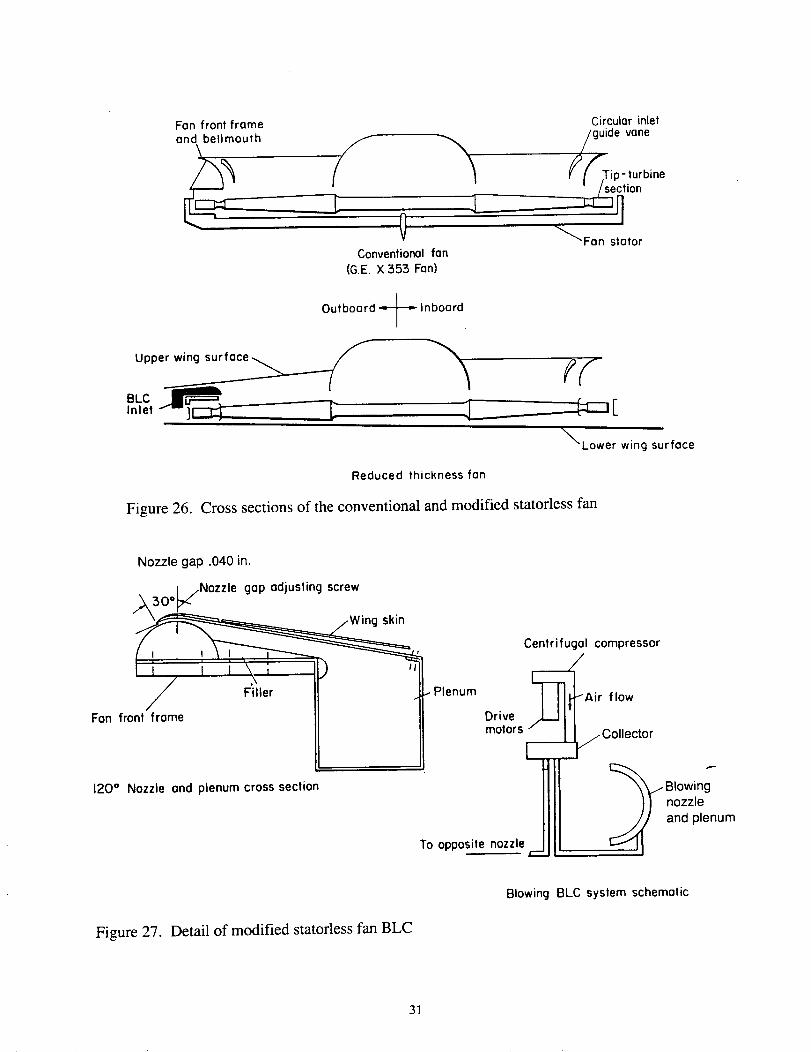
statorless fans for thinner wings is discussed in refer-
ence 16. To provide a thin fan for wind tunnel models with
thin wings, the stator was removed from the GE X-353
and the outboard 180 degrees of inlet was replaced by a
blowing boundary layer control (BLC) inlet which much

reduced the radius and hence height. Except for the hub,this modified fan could fit in a 60 degrees swept back
triangular wing 5% thick. Figure 25, from reference 17, is
a photograph of the fan mounted in the wing, with theconventional inlet on the inboard side of the fan, and the
BLC inlet on the outboard side of the fan. Figure 26shows cross sections of the conventional and modified
fan, and figure 27 shows details of the BLC inlet. Figure
28 presents the static performance of the statorless fan
and the conventional fan. Surprisingly, the performance is
about the same, probably because the thrust from the BLCinlet was about 2.4% of the fan thrust and the exhaust
deflection vanes partially fulfilled the mission of the
removed stator. Forward speed performance of the stator-
less fan, figure 29, is slightly better than for a conven-
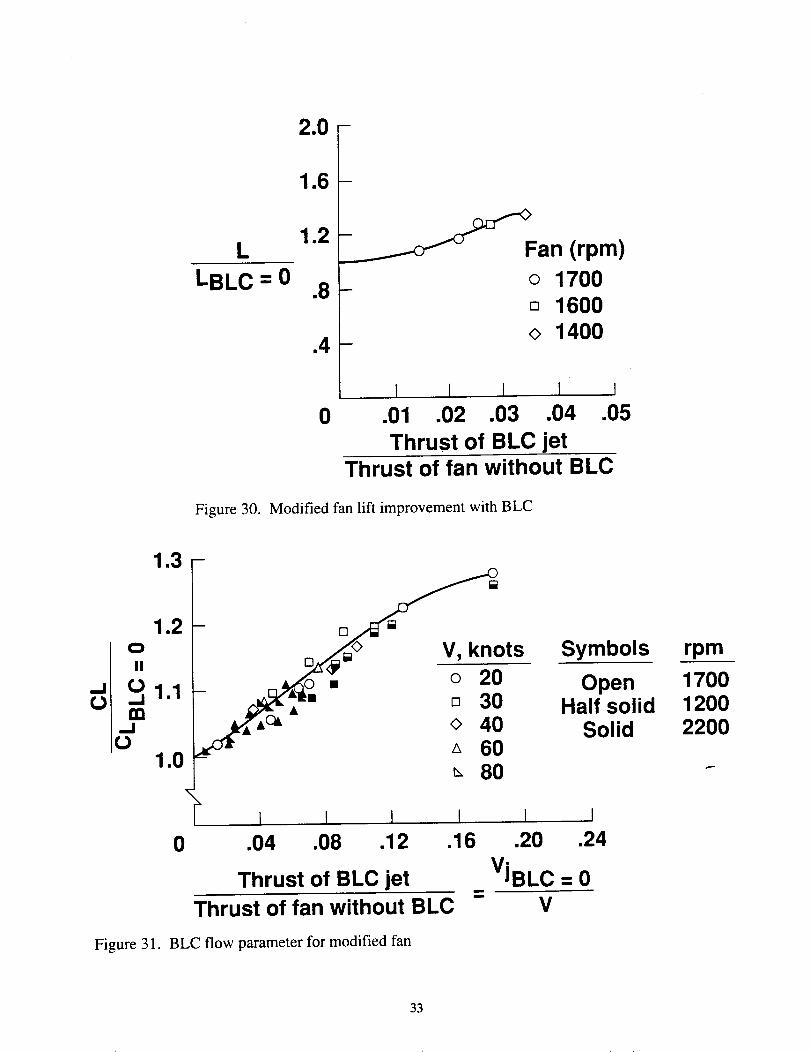
tional fan. Figure 30 gives an indication of BLC require-
ments. If the thrust of the BLC jet is 3% of the fan thrustwithout BLC, the thrust of the fan is increased 30%.
Figure 31 presents an attempt to find a dimensionless
parameter to describe the overall lift increase with the
application of BLC. The parameter shown collapsed the
effect of airspeed and fan rpm to ±6%.
Study of the thin fan designs in reference ]6 and themodified thin fan can lead one to question that a thin fan
in a supersonic wing can be driven by a shaft because of
the depth of a right angle gear drive, or that it could have
variable pitch because of the depth needed for the changemechanism. Reference 16 studied fans with inlet guide
vanes rather than outlet guide vanes as well as the
statorless fans for thin applications.
Deep fan mounting- Figure 3 from reference 3 shows themounting of the GE X-353 fan in a fuselage. The fan is
mounted one diameter deep, the upstream side of the inlet
has a large radius and is protected by a long chord vane
(fig. 32). Figure 32 also shows the ram pressure recovery
of the inlet. The vane nearly doubles the velocity over
which good ram recovery is obtained. Work done on lift
engine inlets can be applicable to deep mounted lift fansinstallations. Reference 18 contains a body of results on
inlet pressure recovery and distortion for five inline
J-85 engines canted forward 10 degrees, and with a
forward inlet radius of 0.56 diameters. Figure 33 shows
the layout of the model and figure 34 presents total
pressure recovery and distortion for the plain inlet. Up toa V/Vj of 3, the distortion stayed within the 0.1 limit at 0
degrees angle of attack. The upstream engine had
relatively high distortion because it didn't have the
benefit of an engine in front drawing in air, thus inducinga flow toward the inlet. The effect of angle of attack on
recovery and distortion is shown in figure 35. At a
V/Vj = 0.45, the distortion stayed within limits, but theinlet on engine 2 was influenced by the proximity of the
wing leading edge so that inflow became distorted as
angle of attack was increased. Reference 18 considers the
effect of scoop and folding door inlet covers on distortionas well. If the reader wishes, he can peruse reference 18
for additional information, however, the data show that
the best recovery and distortion results were obtainedwith the clean, no doors configuration.
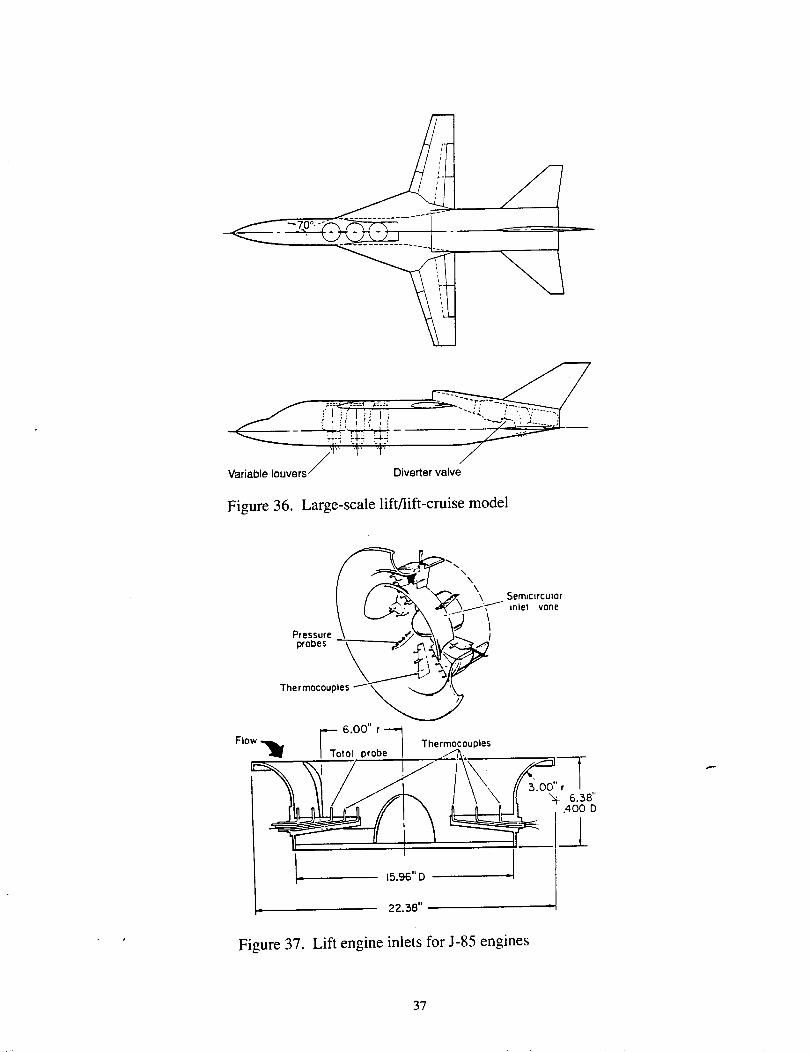
Results from another lift engine study featuring a more
realistic model, although still using J-85 engines for lift
engine simulators, are presented in reference 19. Here,three lift engines are mounted vertically inside of a highly
swept glove, as shown in figure 36. Figure 37 is a detailof the engine inlet. The inlet radius-to-diameter ratio is
0.19, which is the most severe at the upstream station of
any inlet shown here. An inlet vane scaled from the lift
fan deep inlet was available to help flow around the
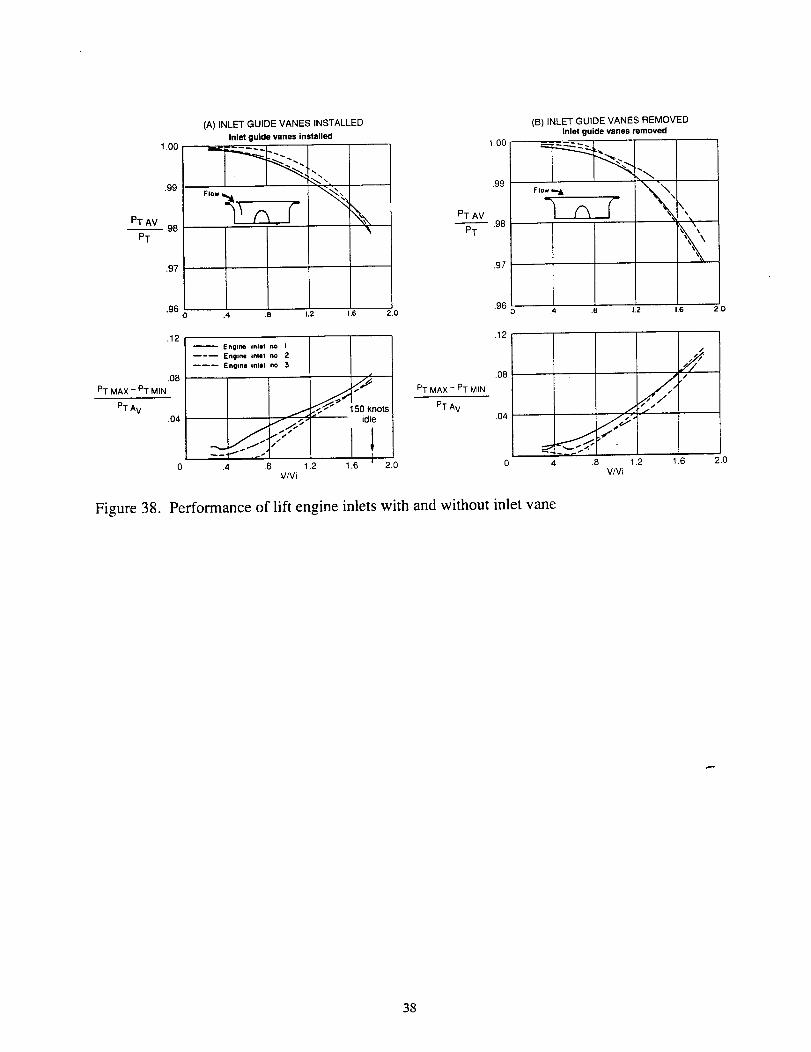
upstream radius. Figure 38 presents pressure recovery anddistortion with this inlet at 0 degrees angle of attack, with
and without the inlet vane. The vane was beneficial, espe-
cially at high velocity ratios. Figure 39 shows the varia-tion of distortion and pressure recovery with angle of
attack. Unlike the other example, flow to all three engines
was insensitive to angle of attack.
Consideration of data from the fan-in-wing arrangements
as well as from the deep inlets indicates that the fan is an
excellent boundary layer control device when placed nearthe inlet radius. Placing the fan well downstream from the
inlet (ref. 3) allows a significant portion of the fan to
operate in turbulent flow when the inlet flow is separated.Data from all three models with deep inlets discussed
here, are in figure 40. Comparison of the results indicatesthat a small amount of tilt and taking advantage of that to
increase the upstream radius is a powerful tool to improve
recovery and minimize distortion.
Exhaust Deflectors
Lift fan or cruise fan exhaust deflectors to provide
horizontal force or lift in transition flight range from
cascades of vanes to multi-segmented hoods to rotating
tail pipes.
Figure 41 from references 20 and 2 show the effective-ness of a cascade of vanes in this capacity. The results'5"re
shown as lift as a function of thrust so that the effective
exhaust angle and the reduction in fan thrust can be seen.The 7 inch chord GE XV-5 cascade is shown for refer-
ence. A swept or chevron planform intended to reduce
backpressure at the hub improved performance at high
deflections slightly. Doubling the chord to increase
Reynolds number also improved performance over the
baseline slightly. The flapped cascade was the best, but
not markedly so, however, it did increase effectiveness at
negative vectoring thus providing the possibility of even

moreextremedescentperformance.Finally,aswivelingcascadecanted45degreesprovidedsuperiorperformance,butprobablyataweightandvolumepenalty.Avanearrangementformodestamountsofthrustdeflec-tionispicturedinfigure42,asdevelopedbyGrummanwithNASA'shelp,fortheGrumman698design(ref.21).As shown in figure 43, from reference 22, a single vane
mounted in the exhaust provides 35% thrust deflection.With the vane out of the hot exhaust core, but in the fan
flow, the vane still provided a 30% side force.
The performance of exhaust deflectors, as would be used
to lift/cruise applications is summarized in figure 44,
from reference 21. Both the "D-shaped" hood (ref. 23)
and canted variable camber vanes approach a lift-thrust
ratio of 0.94 at 90 degrees, which, though remarkably
good, would probably sill make a significant reduction in
VTOL payload. Perhaps an even larger concern is the
weight and size these structures can assume. For
lift/cruise applications, designers may wish to also con-
sider tilting engines.
STOVL Aerodynamics
This section of the paper discusses ground effects and
aerodynamics when in the powered lift flight range.
Ground Effects
Ground effects during hover have been treated by many
authors (for example, refs. 24-26). The existence of
fountains in multijet cases and of the wall jet type of flow
on the ground is well known and understood in a general
way. Effects of variables such as nozzle arrangement,
wing height, lower surface contour, and special fountain
containment devices on ground effects have been studied
exhaustively at small scale and to a much lesser degree at
large scale. This data base has spawned ground effect
prediction techniques that are still being verified.
However, the failure of large and small scale ground
effect results to agree in the simplest of cases, as
discussed earlier, indicates a need for further knowledge
of flow details and makes the many small scale contribu-
tions to the data base for empirical ground effect predic-
tion techniques suspect. Unfortunately, the lack of largeand small scale correlation also casts a shadow on predic-
tions using these results. A program to examine ground
effect sensitivity to exhaust flow parameters could yieldvaluable results. The explanation of the phenomena of
ground effect has been addressed well and often, so willnot be covered herein.
The flows that make ground effect forces are sometimes
hot, depending on the engine type and the mixing along
the flow path length. While modest temperature risesin the aircraft, environment reduce lift-off capability,
the catastrophic problem of engine stalls from the inges-tion of cells of hot air can be much more serious. This
difficulty was recognized early and was the driving
reason for the shape and arrangement of the GE XV-5.
The engine inlets were placed above the fuselage and
over the wing to provide direct intervention to ingestion
of exhaust gases on a short path. This effort was largelysuccessful for the GE XV-5, but it was necessary to derate
the engine to avoid stall. Inspite of a bypass ratio of 8,
derating the engine, and interventional design, engine
stalls did occur (rarely) when hovering near the ground.Because of the GE XV-5 two-engine, balanced design,
engine stall was not catastrophic. New designs will prob-
ably have higher temperature engines and the problemcould be more severe. In evaluating .the ingestion prob-
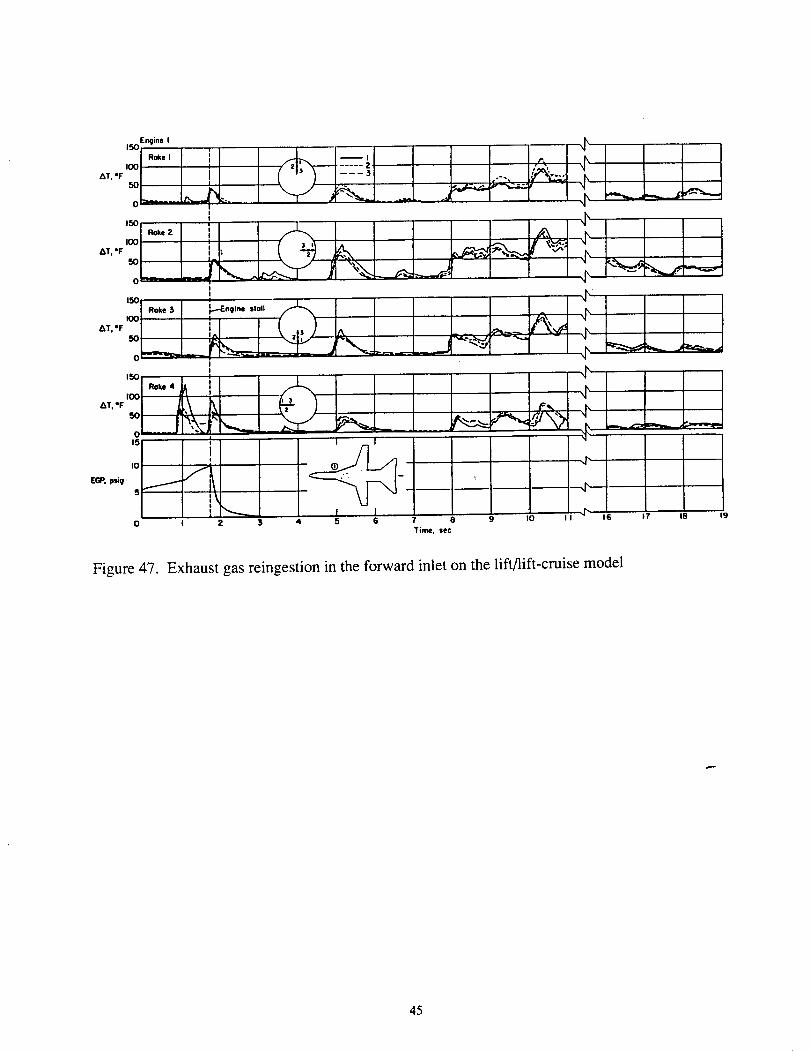
lems with a configuration, it is suggested that methods asused in reference 19 be used. That is, engine and fan
inlets be equipped with rapid-response thermocouples and
time histories of inlet temperature be obtained both instatic free air conditions and near the ground in a wind
tunnel at forward speed. Figures 45 and 46 are pho-
tographs of a lift engine fighter model in the 40 x 80 windtunnel and a static test stand. Figure 47 shows an example
of temperature time histories in engine inlets when an
engine stalled.
Ground effects at forward speed can be measured in wind
tunnel even though the wind tunnel may not be specially
equipped with devices to eliminate the wind tunnel
boundary layer. Reference 11 shows reingestion at
forward speed for the GE XV-5. The temperature rise
shown predicted the rise in flight and the onset of turbu-
lence from the ground vortex. Sometimes investigators, in
quest of free air data accuracy, artificially limit their test-
ing because of so called wind tunnel flow breakdown anddo not avail themselves of the opportunity to acquire
valuable ground effect data. Tests should go to the low
speed at which exhaust flow reflected from the wind
tunnel walls impinge on the model and interfere with th,._e
ground effect simulation. Model mounted dynamic pres-
sure measuring equipment to augment the usual wind
tunnel static pressure rings will help determine true speed
when the ground vortex is present.
Aerodynamics in Transition
Operation of lift fans and engines to provide lift during
transition flight can induce major forces and momentsover and above those from direct thrust. Research in this
area has consisted of fundamental studies of jet exhaust
5

physics,suchasthatdescribedinreference5,andsmallandlargescalestudiesofcompleteconfigurationsasinfigure48.
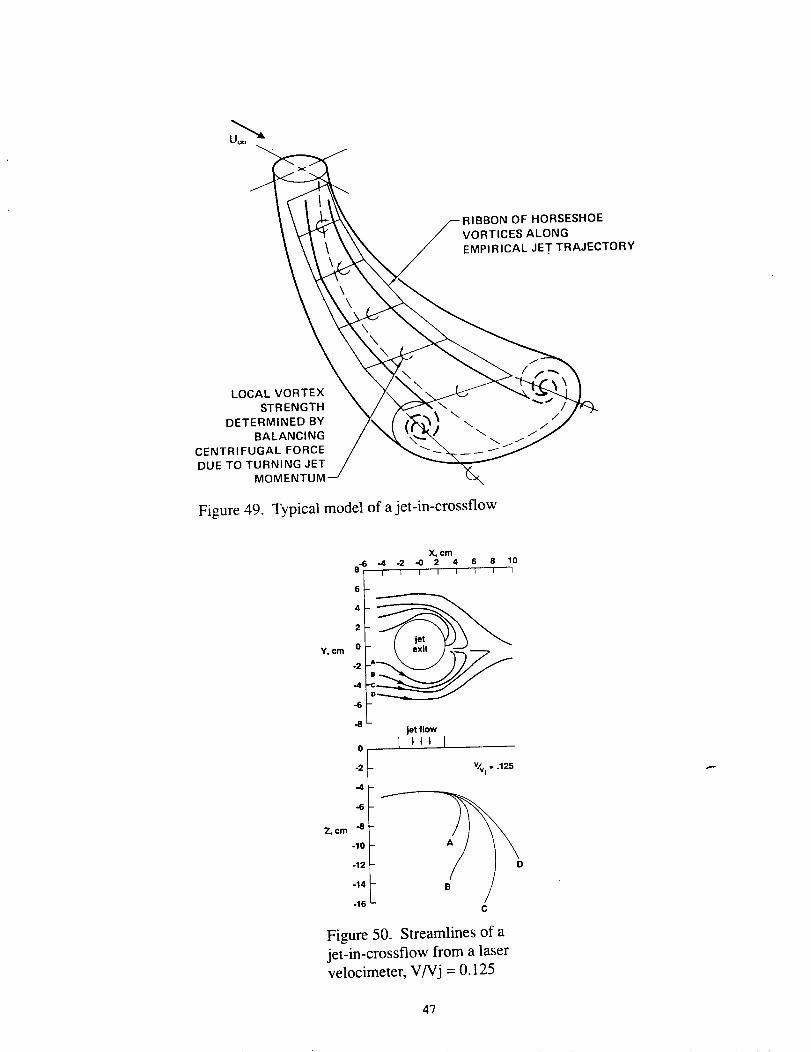
Ajetorientedtoissueintoacrossflowwill bendbackandrollupintocontrarotatingvortices(fig.49).Immediatelyatthejetexhaustsurface,flowseparationoccurs,thenasthevorticesformdownstreamfromthejetexit,thejetentrainsagreatdealofairformthesurroundingenviron-mentasshownin figure50fromreference27.Figure50showstheresultofflowstreamlinetracingwithathree-dimensionallaservelocimeter.Streamlinesfarfromthejetaredrawndownintothecenteroftherolling-upvorticesshowingthepowerfulentrainmentbyajet-in-crossflow.If thejet issurroundedbyalargesurface,especiallybehindthejet,thejet flowfieldwill inducenegativelift onthesurfaceandadjacentwingandtailsurfaces.Thishasbeendemonstratedinmanysmallscaleexperiments(ref.5).If afanissurroundedbyalargearea,thislift lossin transitionshouldbeestimated.
Mostsmallscaleexperimentsdidnotincludetheeffectsofinletflow.InearlypostWorldWarII experiments,itwasshownthatsuckingairintheuppersurfaceofawingatornearthetrailingedge,provided"CirculationControl,"thatis,increasedlift.Inflowtoafanorenginewhenin theproperlocationwithrespecttotheairframecanbeexpectedtocontributetotheinducedeffects.Whenquantifyinginducedeffects,careshouldbetakentoaccountfortheinletflowaswellastheexhaustflow.Negativeinducedlift hasbeennotedonfull scaletestrigs,andisgraphicallyshowninfigure51fromrefer-ence10.Here,theGEXV-5nosefanwasoperatedoveranairspeedrangeandthethrustvariationandmodelliftvariationareshown.Negativepressurebehindthefananddownflowonthewingfromthejetentrainmentproducednegativelift. ThisisnotarepresentativeofGEXV-5operation,however,becausetheairplaneusedathrustreverserinthepitchfanflowforapitchcontroldevice.Inthe1960sand1970s,anumberoflargescalemodelsofvaryingconfigurationsweretestedintheAmes40-by80-FootWindTunnel.Figure52,fromreference28,tabulatesthemajorparametersofthirteenconfigurationsvaryingfromfuselagemountedfanstowingmountedfanstopodmountedfans.Thefansusedin thesemodelswereeitherthe5.2footdiameterGEX-353orthe3footdiameterX-376tipturbinedrivenfans.Figure53showsthevariationofinducedlift withairspeedforseveralliftfanarrangements.Inducedlift isdefinedastotalliftmeasuredonthewindtunnelscalesminusaerodynamiclift duetoangleofattackorliftingsurfacecamberminusfanthrust.A fan mounted near the wing trailing edge
produces positive induced lift while a fan near the wing
leading edge produces negative induced lift. Data in
figure 54 indicate that to maximize induced lift, the fanshould be inboard at the wing trailing edge. These results
are consistent with conventional flap loading theory and
tend to support the view of a lift fan flow field as beingsimilar to that of a thick, low aspect ratio jet flap. Induced
lift from forward mounted lift fans, figure 55, shows that
if a fan is to be mounted forward of the wing, it should be
mounted outboard, if possible.
Induced lift also induces pitching moments. Non-
dimensionalized pitching moment is shown as a function
of airspeed in figure 56. Data for the fan-in-wing
configuration shows a large positive change in pitching
moment. This characteristic is typical of fan-in-wing
configuration. While a trailing edge flap can eventuallyreverse the direction of moment change, that tends to
introduce a control reversal with airspeed that would be
looked on unfavorably by a pilot. The moment variation
with airspeed for podded configurations, shown in fig-ure 56, is much less and would be much easier to handle.
The variation of pitching moment with airspeed issensitive to the vertical as well as the horizontal location
of the center of gravity. With a deep duct, deflection of
the fan exhaust for thrust in transition can be a major
contributor to pitching moments.
Lift fan powered aircraft could have retractable or foldinglift fans distributed around the airframe, as well as
lift/cruise in front of a wing, in figure 57 from
reference 29, shows that the fan flow significantly reduces
wing lift. At low speed, the fan in all three locationswould reduce wing lift an amount equal to an average of
8 degrees angle of attack at velocity ratios of about 0.1.
When possible, it would be desirable to mount the fan
well below the wing chord plane. Lift induced by a jet
only, without an inlet, is shown for various locations
around a wing in figure 58 from reference 30. These
results compliment those from the lift fans in that a jetlocated in front of the wing induced negative lift and a jet,
located at the trailing edge produced positive induced lift.
Finally, results (fig. 59) from the large scale lift engine
test rig of reference 18 show that the lift engines induced
lift. As might be anticipated from the previous discussion,
the upstream engine induced negative lift while the "-
downstream engine induced positive lift.
The location of fans and engines can be important in
terms of lifting capacity at low speeds, because ofinduced lift. A STOVL aircraft, being designed for short,
high load takeoffs should take advantage of theses
induced lift capabilities if at all possible. The induced lift
data is nearly all from fans within the same configura-
tional family so that jet turbulence and entrainmentshould be similar and the data should define trends
accurately. With variable pitch or fans with other

geometry,thetrendsshouldremainthe same, but the
quantitative results will probably differ.
Prediction Methods
Sophisticated prediction techniques using paneling
techniques and complex models of the jet in crossflow
have been developed (refs. 31 and 32). These methods are
valuable for final prediction of aerodynamic characteris-
tics where they can be merged with semi-empirical means
of account for the effects of flow separation on the
airframe caused by propulsion flows. Development of
complicated aircraft geometry for paneling approaches
can be difficult and time consuming for some applica-
tions. Relatively, simple semiempirical prediction tech-niques are useful for preliminary study of transition flightand for simulation. These methods can also be used to
separate good from bad when examining preliminary
design options. The methods that will be described can
easily be combined and incorporated in the spread sheet
of a personal computer.
Ground Effects
Empirical methods to estimated ground effects, including
fountain flow, have been developed from generalizedsmall scale data. References 25, 26, and 33 are examples
of this effort. The upper set of data in figure 60 shows
that excellent agreement between the estimate and exper-
iment is possible. However, the lower set of results prob-
ably shows the danger of making estimates outside the
parameters used in the method development. As discussed
in the modeling section of this paper, some of the resultsof fundamental studies are being questioned, so care must
be exercised in interpreting the results of predictionsbased on small scale data.
Jet-in-Crossflow
If it is desired to locate a fan or engine in a surface with a
considerable amount of surface behind the jet, suckdown
in transition should be calculated using the relationships
developed from small scale data such as those in
reference 32. Good agreement with small scale experi-
ments is possible. However, these results are susceptible
to the same modeling problems as previously discussed,
and care must be taken with their interpretation.
Fan-in-Wing
For prediction purposes, a fan-in-wing arrangement canbe presented by a mid-chord jet flap. The jet flap can be at
any spanwise or chordwise location as long as it is
bounded by the wing. As shown in figure 61, from refer-
ence 28, a two dimensional lift coefficient is developed
for the wing section through the fan. Two-dimensional jet
flap theory (ref. 34) was used to calculate the lift on the
wing section upstream of the fan. The aft section of the
wing behind the fan has separated flow on the under
surface. A lift coefficient of-VNj 3/2was found to givereasonable agreement with experiment and has been used
for computational purposes. The front and rear section lift
coefficient are joined to give one complete two-dimensional lift coefficient inside the brackets. One term
outside the brackets, from reference 35, converts from
two dimensions to three dimensions, and the rest of the
terms convert from lift coefficient to lift ratio. The results
from this equation are compared with experiment in
figure 62 for some of the models listed in figure 52. For
the four velocity ratios shown, and for a vertical jet, the
equation generally gives the correct trend with configura-tion variables and, in many cases, reasonable agreement.
Figures 63 and 64 show the variation of lift ratio with
flight velocity ratio for models 2 (ref. 15) and 3 (ref. 10)with the exit louvers deflected to give thrust. The lift
calculated for model 2 does not agree well with the test
results with the louvers deflected 20 and 35 degrees. It
would appear that the down load behind the fan at lower
velocity ratios is substantially more than calculated. Thecalculated lift is the difference between large loads
upstream and downstream from the fan, so that smallerrors in either value can yield large percentage changes
in the final calculated induced lift. Model 3, in figure 64,
has a smaller area behind the fan and agreement at low
velocity ratios is much better for all vane settings, butdeviation is growing at the highest velocity ratio used in
the comparison. A more sophisticated representation of
the lift aft of the fan could probably improve agreement.
If lift on the wing is known, moment can be calculated
assuming that the center of pressure for a jet flap is at
midchord. The slope of non-dimensional moment varia-
tion with flight-velocity ratio was calculated for models
one through six and is compared with experiment in
figure 65. Since moment would be expected to be asensitive indicator of the accuracy of a method, the
agreement shown tends to give confidence in thecalculation method, at least for a vertical vane setting.
Drag and thrust from deflecting the lift fan exhaust can becalculated but must include the ram drag, the force real-
ized from turning the free stream airflow into the fan.
Ram drag can be expressed as D/T s = (T/Ts) (V/Vj). As
shown in figure 66, the variation of ram drag with veloc-
ity ratio, as calculated from data in reference 10, was
actually 1.1 Cl'ffs)(VNj). This relationship held well to avelocity ratio of 0.4. Next, the equation for the total
horizontal force, Fx/Ts was derived.

Fx--![Vj vjjj
The equation is ram drag, assumed to vary by the
reduction in flow area by deflecting the turning vanes,
minus the thrust force reduced by the residual momentum
of the air turned into the fan. Figure 67 shows the varia-tion of horizontal force ratio with flight velocity ratio forthe data in reference 10. The data from the reference
should be nearly a straight line, and can be extended to
zero airspeed to determine the actual flow angle. Thecalculations on the figure use the actual flow angle. The
experiment and calculation agree quite well for zero and
35 1/2 degrees flow turning, but do not agree well with
the intermediate flow turning angle. A similar comparison
is shown with data from reference 17 in figure 68. This
data is for a statorless fan with a boundary layer control
inlet. This agreement was good through a flow turning
angle of 25 degrees. The above equation seems to give
results that can only be made more accurate by test of
actual hardware. If thought to be appropriate, the airplane
drag can be included in the calculation.
Tilting Lift/Cruise Fans
This component produces lift and thrust be rotating thefan from horizontal to vertical. Since it is used for cruise
propulsion, the inlet and nacelle must be compatible with
that requirement. The basic equation for net thrust is
-vvj]As a thrust coefficient, Tc, the equation becomes
rc (,qSDJct=0- -s--Q_.Q--
This equation is compared with data from reference 36 in
figure 69. The results agree very well inspite of ignoring
the duct drag. Tc is the thrust coefficient at zero degrees
angle of attack. The horizontal force coefficient, FrdqS, is
the same as T c at zero degrees, but reflects the effect of
angle of attack as shown below
FXD =2 oA---E-F#Isin2ctD-/_---J-1)cos(txD + 8)]°D v L
The sin 2 o_D term empirically compensates for increased
duct drag. As shown in figure 70, results from theequation and reference 36 agree quite well.
An expression for Fx/Ts can be derived if constant power
is assumed. This means that Vj = V + Vjs. At constant
power, Vj increases as airspeed increases because of theram effect. Either fan blade pitch or fan rpm varies to
keep power absorption constant. The resulting equation is
xo:_v/v+,ls,n oofv+i/ osooTs Vjst,VJs J tJs
Expressions for duct lift have also been derived. The
equation is of the form
CLD =FXD sino_D + CLcxDO_D+K(FXD/1/62qSD [, qSD )
where the first expression is the lift of a jet at some angle
to the flight path, the second is the power off lift of the
duct and the third represents lift induced on the duct by
the jet exhaust. The empirical relationships were derivedfrom data in references 36-38. The equation for duct lift
coefficient is, with apologies for length
CLD = FXD sin(or D + _)+ (0.005+ 0.048ARD)IX DqS D "
+[(0.011+0.00716ARD) (_D + 5)
-(0"00011 + 0"0000121ARD)(IXD ,,21(Fxo ,1_+ o)]tq- -fJ
Results from reference 36, for thrust coefficients other
than used in the empirical derivations are shown with
calculations from the equation in figure 71. Except at thesmallest thrust coefficient (highest speed) the agreement
was good. Figure 72 contains a comparison with a duct of
similar geometry from reference 37. Except for a mid
range thrust coefficient, agreement was good. Figure 73shows similar results from reference 38. This comparison,
for an engine of normal turbofan dimensions, showed
good agreement to maximum lift which was over
predicted by as much as 10%, but the angle for maximum
lift agreed well. Finally, in figure 74, data from refer-

notusedinthe derivation of the equation, and falls
somewhat out of the geometric range (smaller aspect
ratio) of those powerplants. Agreement is adequate for
preliminary design purposes. More precise definition of
parameters such as aspect ratio might yield a more
accurate equation.
The results for duct lift coefficient may be easily
converted to LD/T s with the following equation
LD ..1CLD SD V 2Ts 2 A F V "2
Js
Acoustics
Airplane dcsign studies conducted in the 1960s indicated
than fan pressure ratio should be much higher than thc 1.1
prcssurc ratio fans provided for the GE XV-5 and uscd in
the models that provided most of the wind tunnel dataherein. NASA Ames contracted with GE for thc fan
whose cross section is shown in figure 75. This fan,
dcsignated the LF336, was 36 inches in diamctcr, had a
design pressure ratio of 1.3, and was powered by a J-85engine. The fan met design spccifieations but was noisy
bccausc it uscd convcntional 1970 design techniques. Thefan had 42 blades and 45 stator vanes with 0.15 fan blade
chord spacing bctwccn. Onc design goal of most lift fans
is to kcep them thin, especially for wing-mounted installa-
tions. However, this goal is at odds with producing a
"quiet" fan. To establish practical quicting techniques, theLF336 was used as a test vehicle to examine the effec-
tiveness of several techniques as applied with lift fan
constraints. Reference 40 presents the results of this
program.
The noise of a lift fan consists of the so called machinery
noise and the noise due to exhaust jet mixing. Machinery
noise occurs at blade passing frequency and its har-
monics, and is caused by the potential field interactionbetween the rotor and stator, the fluctuation loading of the
stator caused by the wakes from the rotor, inflow distor-
tion, and inflow distortion caused by quasi-steady
distortion from atmospheric turbulence. Machinery noise
can be reduced by spacing between the rotor and stator
(or eliminating the stator), reducing rotor tip speed,controlling propagation with vane-blade ratio and vane
lean, careful design of hub support struts, and use of
acoustically absorbent material in the flow path.
The test set up for noise measurements is shown in
figure 76. Several stator designs are shown in figure 77.
In addition, spacing could be changed to one or two chord
lengths by inserting plain or acoustically treated spacers
between the rotor and the stator. Results of these studies
are summarized in figures 78--80. Figure 78, with one
chord spacing, shows the effect of increasing stator blade
number. While the 90 vane stator reduced the peak per-
ceived noise level only 2 PNdb, over a range from 30 to
100 degrees, noise was reduced 4-5 PNdb. Figure 79, at
80% rpm, shows that the stator with 90 leaned vanesreduced peak noise about 8 PNdb. This was done with noincrease in fan thickness. Two chords spacing with acous-
tic treatment further reduced peak noise 4 PNdb, while
acoustically treated louvers reduced the noise peakanother 2 PNdb. Similar results at 95% fan rpm are
shown in figure 80. The total noise reduction, withoutacoustic louvers, was 10 PNdb compared with 12 PNdb at
the lower power setting.
In the early 1970s, a single stage fan designed to functionwithout a stator did not exist, but was thought to offer the
best chance for a quiet thin fan for a thin wing. Therefore,
under contract to NASA, GE designed and fabricated a
statorless fan to fit the LF336 frame. Figure 81 is a cross
section of this fan. While the fan turbomachinery worked
to specification, as discussed in reference 41, the hub base
pressure was much more negative then expected, so thattotal thrust was less than expected. Peak PNL is compared
with a fan with stator from reference 40. Figure 82 showsthe statorless fan noise was about the same level as the
conventional rotor-stator fan with two chords.
Another research topic was included in this program.Reference 42 described noise reductions from a serrated
edge on a low speed rotor. This idea was studied atturbomachinery Mach numbers and Reynolds numbers in
a two dimensional cascade (ref. 43). Figure 83 shows the
serration configurations studied. All serration configu-
rations reduced noise and improved aerodynamic perfor-
mance. Configuration SR6 was chosen for study on thestatorless fan. Data in figure 84 show that the serrations
reduced PNL for the three fan speeds. Although not
shown by PNL comparisons, the serrations reduced broadband noise substantially in the forward arc. Perhaps more
interesting are the gains in performance due to the serra-
tions shown in figure 85. Both the flow deviation angle
and the total pressure loss coefficient were reduced by ,.-serrations, and flow noise from the cascade, shown in
figure 86, also was reduced by serrations.
Fan noise variation with flight speed received limited
study. Figure 87 shows on installation in the 40 x 80 foot
wind tunnel. The semispan model had the LF336 fan
mounted in a wing. Acoustic treatment was put on the
floor of the tunnel and the J-85 drive engine inlet was
heavily muffled. Figure 88 shows another model powered
with X-376 fans that was used in the study. The data in
figure 89, from reference 44, show the variation of blade

passingfrequencysoundpowerlevelwithairspeed.Twoofthedatacurvesarefromthemodelsjustdescribed,andoneisfromtheGEXV-5Bin flight.Whiletheshapesofthecurvesvary,thenoiseincreaseswithairspeed.Itwasstatedatthebeginningofthissectionthatbladepassingfrequencynoiseiscausedbydistortedinletflow,soit isnotsurprisingthatnoiseincreasedasflightspeedandhencedistortionincreased.BroadbandjetmixingnoiseispresentedasafunctionofStrouhalnumberforseveralairspeedsinfigure90,fromreference45.Thejetnoiseincreasedwithflightspeed,illustratingthehighlyturbu-lentnatureofajet incrossflow.TheseeffectsofforwardspeedonnoiseshouldbeincludedinSTOVLlift fannoiseestimates.
Noiseofalift fancanbereducedbyappropriatenoisecontroldesigntechniques,withlittle,if anyperformanceorweightpenalty.Noisecanbefurtherreducedbyliningtheflowpathwithnoiseattentuatingmaterial.
Concluding Remarks
The salient points made in the above text are summarizedhcrc.
Experimental expericncc indicates that, if ground bascd
facilities arc to provide accuratc results in thc hover and
transition flight regimes of lift fan aircraft, thc propulsion
systcms, jct turbulence, and flow entrainmcnt must be
aceuratcly simulated. Large or full scale powcrplants, as
similar as possible to those planned for the aircraft, arc
most likely to provide an adcquate simulation.
For lift fans in any installation, minimum inlet hardwareis bcst to minimize flow anomalies that arc induced into
the inlet. Placing the fan rotor very ncar thc inlet radius,
even in a dccp installation, forces the fan to act as an inlctflow control device. Small angularity in deep ducts can
dramatically improve performance.
An inlet boundary layer control system was shown to bc
effectivc in a very short inlet. This is a method that canreducc fan thickness in installations where that is
important.
For a 1.3 pressure ratio fan, a flow deflection of
90 degrees is possible with only 6% losses. This could,
however, be a major portion of the payload on a VTOL
mission. Weight and complcxity of a flow turning dcvicc
may makc tilting powerplants, as in thc V J-101,attractive.
Flows from lift fans and engines induce sizable forces and
moments on the airframe. These induced effects may be
favorable or unfavorable in hover and transition flight,
depending on fan location. Careful utilization of these
effects can augment STOVL performance.
Unsophisticated semiempirical prediction techniques
were presented for some forces and moments on wingsand tilt duct nacelles. These methods can be incorporated
in the spread sheet of personal computers for preliminary
design purposes. Where necessary, configuration specific
equations can be developed for the same use.
A number of ways to minimize lift fan noise will not
compromise performance or increase volume, and should
be included in any design. An increase in fan depth and
adding acoustic treatment can further reduce noise with
some penalty. A statorless fan can provide a relativelythin installation with noise levels comparable to the best
conventional fan.
Forward speed increases lift fan noise in two ways. Theinlet flow distortion increases the noise at blades passing
frequency and its harmonics, and the jet mixing noise in
increased by the jet-in-crossflow environment.
References
1. Mort, Kenneth.: Summary of Large-Scale Tests of
Ducted Fans. NASA SP 116, Paper 8, April,1966.
2. Hickey, David H.; and Cook, Woodrow L.:
Aerodynamics of V/STOL Aircraft Powered byLift Fans. AGARD CP 22, September 11-13,1967.
3. Aoyagi, Kiyoshi; Hickey, David H.; and deSavigny,Richard A.: Aerodynamic Characteristics of a
Large-Scale Model with a High Disk-LoadingFan Mounted in the Fuselage, NASA TN D-775,
October, 1961.
4. Davenport, Edwin E.; and Kuhn, Richard E.: WindTunnel-Wall Effects and Scale Effects on a
VTOL Configuration With a Fan Mounted in a
Fuselage. NASA TN D-2560, January, 1965.
5. Margason, Richard: Propulsion-lnduced EffectsCaused by Out-of-Ground Effects. Proceeding_of the International Powered Lift Conference,
December 7-10, 1987, pp. 31-57.
6. Gentry, G. L.; and Margason, R. J.: Jet-induced LiftLosses on VTOL Configurations Hovering Inand Out of Ground Effect. NASA TN D-3166,
February, 1966.
10

7.Kuhn,RichardE.:HoverSuckdownandFountainEffects.ProceedingsoftheInternationalPoweredLift Conference,December7-10,1987,pp.1-18.
8.Christiansen,R.S.:A Large Scale Investigation ofVSTOL Ground Effects. AIAA Paper 84-0336,
presented at the 22nd Aerospace Sciences
Meeting, January 9-12, 1984.
9. Schmidt, Susan B.: Hover Test Results of a Small-
Scale Twin-Tilt Nacelle Model. NASA
TM-86665, March 1984.
10. Kirk, Jerry V.; Hickey, David H; and Hall, Leo P.:
Aerodynamics of a Full-Scale Fan-In-Wing
Model Including Results in Ground Effect WithNose-Fan Pitch Control. NASA TN-2368, July
1964.
11. Koenig, D. G.: Wind Tunnel Testing, Special Courseon V/STOL Aerodynamics. AGARD
Report 710, June 1984, pp. 9-1 to 9-71.
12. Hickey, David H.: Preliminary Investigation of the
Characteristics of a Two-Dimensional Wing and
Propeller with the Propeller Plane of Rotation in
the Wing-Chord Plane. NACA RM A57F03,1957.
13. Hickey, David H.; and Ellis, David R.: Wind-Tunnel
of a Semispan Wing with a Fan Rotating in the
Plane of the Wing. NASA TN D-88, 1959.
14. Diedrich, J. H.: Summary of Model VTOL Lift FanTests Conducted at NASA Lewis Research
Center, Proceedings of NASC Workshop onPrediction Methods for Jet V/STOL Propulsion
Aerodynamics, July 28-31, 1975.
15. Hickey, David H.; and Hall, Leo P.: Aerodynamic
Characteristics of a Large-Scale Model with
Two High-Disk-Loading Fans Mounted in the
Wing. NASA TN-1650, February 1963.
16. Przedpelski, Zygmunt J.: Lift Fan Technology
Studies. NASA CR-761, April, 1967.
17. Hodder, Brent K.; Kirk, Jerry V.; and Hall, Leo P."
Aerodynamic Characteristics of a Large-ScaleModel with a Lift Fan Mounted in a 5-Percent-
Thick Triangular Wing, Including the Effects ofBLC on the Lift-Fan Inlet. NASA TN D-7031.
18. Tolhurst, William H., Jr.; and Kelly, Mark W.:
Characteristics of Two Large-Scale Jet-Lift
Propulsion Systems. NASA SP-I 16,
Paper 15, April 4-5, 1966.
19. Kirk, Jerry V.; and Barrack, Jerry P.: ReingestionCharacteristics and Inlet Flow Distortion of
V/STOL Lift-Engine Fighter Configurations.NASA TN D-7014, December, 1970.
20. Hodder, Brent K.; and Kirk, Jerry V.: Large-Scale
Studies of Propulsion-Flow Turning Devices forPan-Powered V/STOL Aircraft, Proceedings of
NASC Workshop on Prediction Methods for Jet
V/STOL Propulsion Aerodynamics. Vol 1,
July 28-31, 1975.
21. Anonymous: Full-Scale Tests of Grumman Design698-411 Tilt-Nacelle V/STOL Model at the
NASA Ames Research Center. Grumman
Aerospace Corp., December, 1981.
22. Anonymous: Large-Scale Tests of a Tilt-Nacelle
V/STOL Propulsion/Attitude Control System.NASA CR-152181, 1978.
23. Esker, D. W.: Ground Tests of the "D" Shaped
Vented Thrust Vectoring Nozzle.
NASA CR-137959, October, 1976.
24. Kuhn, R. E.: An Empirical Method for Estimating JetInduced Lift Losses of V/STOL Aircraft. NADC
Proceedings of a Workshop on V/STOL
Aerodynamics, May 1979.
25. Foley, W. H.: Development of an Experimental Basisfor a Handbook-Method to Predict Ground-
Induced Forces on a Hovering V/STOL Aircraft.
NADC Proceedings of a Workshop on V/STOL
Aerodynamics, May 1979.
26. Kotansky, D. R.; and Glaze, L. W.: Development of
an Empirical Data Base and Analytical Modelingof Multi-Jet V/STOL Flow Fields in Ground
Effect. NADC proceedings of a Workshop on
V/STOL Aerodynamics, May 1979.
27. Orioff, Kenneth L.; Snyder, Philip K.; and Reinath,Michael S.: Laser Velocimetry in the Low Speed
Wind Tunnels at Ames Research Center.
NASA TM-85885, January, 1984.
28. Hickey, David H., and Kirk, J. V.: Studies of Forces"-Induced on V/STOL Aircraft by Propulsion
Flows. Proceeding of NASC Workshop onPrediction Methods for Jet V/STOL Propulsion
Aerodynamics, July 28-31, 1975.
29. Hickey, David H., Kirk, Jerry V.; and Hall, Leo P.:
Aerodynamic Characteristics of a V/STOL
Transport Model with Lift and Lift-Cruise FanPower Plants. NASA SP-116, Paper 7,
April 4-5, 1966.
11

30.Winston,M.M.:PropulsionInducedAerodynamicInterferenceEffectsonJet-LiftAircraft.ProceedingsofNASCWorkshoponPredictionMethodsforJetV/STOLPropulsionAerodynamics,July28--31,1975.
31.Beatty,T.D.:A PredictionMethodologyforPropulsiveInducedForcesandMomentsinTransitionandSTOLFlight.ProceedingsofaNADCWorkshoponV/STOLAerodynamics,May16-18,1979.
32.Margason,Richard;andKuhn,Richard:Applicationof EmpiricalandLinearMethodstoV/STOLPowered-LiftAerodynamics,ProceedingsoftheInternationalPoweredLift Conference,December10,1987.
33.Spong,DavidE.;Kamman,J.H.;andFlood,J.D.:V/STOLJet-InducedInteractions.ProceedingofaNADCWorkshoponV/STOLAerodynamics,May16-18,1979.
34.Malavard,LucienC.:RecentDevelopmentsintheMethodof Rheo-ElectricAnalogyAppliedtoAerodynamics.JournalofAerospaceScience,vol.24,no.5,May1957,pp.321-331,
35.DeYoung,John:TheoreticalSymmetricSpanLoadingDuetoFlapDeflectionforWingsofArbitraryPlanformatSubsonicSpeeds.NACATR-1071,1952.
36.Mort,KennethW.;andGamse,BerhA Wind Tunnel
Investigation of a 7-Foot-Diameter Ducted
Propeller. NASA TN-4142.
37. Mort, Kenneth W., and Yaggy, Paul F.: Aerodynamiccharacteristics of a 4-Foot-Diameter Ducted Fan
Mounted on the Tip of a Semispan Wing.
NASA TN D-1301, April, 1962.
38. Betzina, Mark D.; and Kita, Richard: AerodynamicEffects of an Attitude Control vane on a Tilt-
Nacelle V/STOL Propulsion System.
39. Giulianetti, Demo J.; Biggers, James C.; and
Corsiglia, Victor R.: Wind-Tunnel Test of a Full-Scale, 1.1 Pressure Ratio, Ducted Lift-CruiseFan. NASA TN D-2498, November, 1964.
40. Kazin, S. B.; and Volk, L. J.: LF336 Lift Fan and
Acoustic Test Program. NASA CR-1934,
December, 1971.
41. Smith, E. G.; Stempert, D. L.; and Uhl, W. R.:
Design, Fabrication and Acoustic Tests of a
36 inch (.914 meter) Statorless Turbotip Fan.NASA CR-2597, September, 1975.
42. Soderman, Paul T.: Leading Edge Serrations Which
Reduce the Noise of Low-Speed Rotors.
NASA TN D-7371, 1973.
43. Smith E. G.; and Sowers, H. D.: Cascade Tests of
Serrated Leading Edge Blading at High Subsonic
Speeds. NASA CR-2472, December, 1974.
44. Stimpert, D. L.: Effect of Crossflow Velocity onVTOL Lift Fan Blade Passing Frequency Noise
Generation. NASA CR-114566, February, 1973.
45. Stimpert, D. L.; and Fogg, R. G.: Effect of CrossflowVelocity of the Generation of Lift Fan Jet Noisein VTOL Aircraft. NASA CR-114571,
February, 1973.
12

_ I_, • Lq _ _

DUCT ANGLE OF ATTACK AT WHICH INNERLIP STALL OCCURS
LEADING-EDGE
IOO -- RAOIUS, in /.INSIDE SURFACE
50 _\,. ....
SMALL SCALE
I I l [ I
0 .5 _.0
I/To
.3 .5 .7
V/Vj
DUCT ANGLE OF ATTACK AT WHICH OUTERLIP STALL OCCURS
,DO.\
\ INSIOE SURFACE
i i i = i
.5
I/T C
.3 .5
VNi
X- Z2A
SMALL SCALE
i
I.O
Figure 1. Effect of Reynolds number on duct inlet flow separation
L
L/_ =0
1.0
.8
.6
.4
.2
O
__ 1.59 m (5.2 ft) DIA. FAN,
17.8 cm (7 in ) CHORD,R= 1.4 xlO 6
p (deg) 0.25m (0.85 ft) 10 in DIA. FAN,
oO
n I0
0 20
_, 40
I.2
2.86 cm ( 1.125 in) CHORD,
R = 0.22 x 10⁶
I I I i.4 .6 .8 1.0Fx /
L/9_ = 0
Figure 2. Effect of Reynolds number on vane cascade turning efficiency
P_fN6 PAGE EH..ANK NOT F_k_D14

_, i_ _!_,,i__ _!!iii!!_iii!!!!ii!i?i:i!!!iii!i!ii!_i!_ _ _ _!!_i_,_
_,ii _,_!!C¸̧ ¸_¸ '_ii:̧̧
Figure 3. View of full-scale fan-in-fuselage model mounted in the 40x80- foot wind tunnel
15

Figure4. Testsetupfor the 1/9scalefan-in-fuselagemodelin theLangleyResearchCenter's7x10- foot wind tunnel
16

1.64 radius_
=Forward
0.42 radiusI
I
I
Air jet.... . . . | • • • |J
iiil iii
Air flow
j Fuselage top surface
Inlet vane j Ti "
Small-scale propulsion system Large-scale propulsion system
Figure 5. Powerplant cross sections for the full- and small-scale fan-in-fuselage models
L/'I's
1.5
1.0 _
.5
Small-scale
o No wall correctionsm With wall corrections
Large-scaleNo wall correctionsWith wall corrections
[]
I I i I I
0 .1 .2 .3 .4 .5V/Vj
Figure 6. Comparison of small- and large-scale model lift
variation with forward speed
17
1.6
1.2
T/Ts .8
.4
Figure 7.
o 1.3 pressure ratio
--- 1.1 pressure ratio
....... Q..... _o_....
0
I I I I I I 1 I.04 .08 .12 .16 .20 .24 .28 .32
v/vj
Variation of thrust with airspeed for two full-scale lift fans
I I.36 .40
.4
LifTs .3
1.3 pressure ratio
0 .04 .08 .12 .16 .20v/vj
I I I I.24 .28 .32 .36
Figure 8. Variation of induced lift with airspeed for two different full-scale fans
mounted in the same wing
18

1.2
.8
.4
M/TsD0
=.4
-.8
1.1 pressure ratio
sure ratio
i I I ]
0 .1 .2 .3 .4
v/vj
Figure 9. Variation of pitching moment with airspeed for a small- and full-scale fan
1.2
1.0
T/Ts .8
.6
.4
Figure 10.
36 in. diameter fan
/
15 in. diameter fan
I I I I I0 .1 .2 .3 .4 .5
v/vj
Variation of thrust with airspeed for a small- and full-scale fan
19

T/T S
Figure 11.
fan
1.2F _ 0.67ftDIA.
1.0 r____ ",-,,__pressure atio fan
.8
.6 - 3 ft DIA.1.1 pressure ratio fan
.4 --
•2 --
I I I I I I
0 .1 .2 .3 .4 .5 .6
v/vj
Variation of thrust with airspeed for a small- and full-scale
TOTAL PRESSURE DECAY FOR JETS WITHVARYING UPSTREAM FLOW CONDITIONS
0
-O2
-.O4 I I I I ]1.2 t4 1.6 1.8 2.0 2.2
PRESSURE RATIO, Pl//Po
OIO
pt
I I I I I2 4 6 8 I0
x/D
©CIRCULAR PLENUM
O SMOOTH FLOWO ROUGHENED FLOW
RECTANGULAR PLENUM
O ORIGINAL CONDITIONA FLOW SMOOTHED
Figure 12. Total pressure decay for jets with varying upstream flow
conditions
20

0
.//
///e
TF-34
D-- = 7.93d
J-97 t H/d t -2.3Wyatt -0.012 D/d. 1
I I I I
1 3 5 7 9
Height above ground, H/d
Figure 13. Hover induced lift in ground effect for two full-scale engines
and an empirical result from small-scale experiments
Li/T
-.04
-.08
-.120
VAK - 191 B
-- FLIGHT TEST (VERTICAL LANDING)---- 10% SCALE MODEL
I 1 I I I I I
.4 .8 1.2 1.6 2.0 2.4 2.8HIb. WING SPAN
Li/'l"s
0
-.1
-.2
3-FAN V/STOL CONFIGURATIONo 70% SCALE MODEL• 4.1% SCALE MODEL
--.3 I I I I I I
0 1 2 3 4 5 6
H/da. AVERAGE JET DIAMETER
Figure 14. Small- and large-scale comparisons of ground
effect for complete aircraft configurations
21

!:
Figure A5. The McDonnel Douglas model 260 in the 40x80-foot wind tunnel
22

Figure 16. Full-scaleGrummanmodel698on the Ames Outside Aerodynamic Research Facility
23

Figure 17. Setup for small-scalegroundeffecttestsof theGrummanmodel698
24

.10
Li
rs
.06,
.02
-.02
-.06
A 11% SCALE MODEL
O FULL SCALE MODEL
s
I I I I I I I I I
-'100 1 2 3 4 5 6 7 8 9HID
Figure 18. Ground effects for the small- and large-scale Grummanmodel 698
1.2
_l.0
II
¢g .8I--
.6
n .4..J
.2
>I
I I
0 1 2
h/D
I
3
Figure 19. Ground effect for two full-scale models
I
4
25

Ii • •
Figure 20.
With inlet vanes. With exit vanes.
1958 arrangement for semispan fan-in-wing model in the Ames 7x10 foot wind tunnel
25

V
Streamwise
.8
<; .4
0 .2 .4 .6 .8 1.0 1.2
v/vj
Figure 21. Distortion of fan flow
3.2
2.8
2.4
2.0
1.6O"
•< 1.2
o8 --
.4 --
0-
°.4
0
Spanwise
Inlet vaneconfiguration
o None[] 1O 2z_ 3
_- 4
SI _r_"T'l '''_ I
.2 .4 .6 .8
VNj
Design point
Vj
.95
.72
.5
.4
I1.0
I1.2
ROTOR
EXIT
TOTAL
PRESSURE
RATIO,
P21Po
CHANGE
IN ROTOR
INCIDENCE
ANGLE,
Ai,DEE;
Figure 22.
1.4
1.3
1.2
1.1
+10 --
-10
CROSSFLOW VELOCITY,
V, FIISEC
0---,
. 7o<,,50 ....
- ,_,._?_.-_.-__® -,_I I
r 240- 200/ r
f-,-
i 1 l 10 90 180 270 360
CIRCUMFERENTIAL POSITION, O, DEE;
/ 1
7 -x
Fan-in-wing internal aerodynamics at forward speed
27

Figure 23. Full-scale fan-in-wing model in the Ames 40x80-foot wind tunnel
28

t
i
Inlet number 2Fixed inlet vanes
Inlet number 3Articulated inlet vanes
Figure 24. Full-scale fan-in-wing inlets
29

Figure25. Full-scalemodifiedstatorlessfan with aBLC inlet
3o
Fan front frame
and bellmouth / _X_
Conventional fan
(G.E. X 35:5 Fan)
Circular inlet
guide vane
Y '(_/Tip- turbine
ei"°n_Fan stator
Outboard _ Inboard
Upper wing surface
BLCInlet
_Lower wing surface
Reduced thickness fan
Figure 26. Cross sections of the conventional and modified statorless fan
Nozzle gap;.040 in.
f_30.__jNozzle gap adjusting screw
Filler
Fan front frame
120 ° Nozzle and plenum cross section
.. Plenum
To opposite nozzler-
Centrifugal compressor
Drive ._Air flow
motors II/- Collector
F
nozzle
and plenum
Figure 27. Detail of modified statorless fan BLC
Blowing BLC system schematic
31

7
6
0
,..5
3
- Ref. 17 with BLC /
a_3dfex i_._5es /
(1700 rpm)/
Re
2 I I I I I t8 10 12 14 16 18 20
rpm/lO0
Figure 28. Static thrust of the modified statorless fan
1.2 _with BLC
.8 Conventional fan
T/T s
.4-
I I I I I I I0 .1 .2 .3 .4 .5 .6 .7
V/Vj
Figure 29. Variation of modified statorless fan thrust with forward
speed
32
2,0 --
1.6
L 1.2
LBLC = 0 .8
.4
0
_Fan (rpm)
o 1700[] 1600<_ 1400
I I I I I.01 .02 .03 .04 .05
Thrust of BLC jetThrust of fan without BLC
Figure 30. Modified fan lift improvement with BLC
1.3
1.2
II
1.1
1.0
- D_ _- knotS2_o Symbo's _rpmo • Open ,,uu
_ =o=_ _• [] 30 Half solid 1200<_ 40 Solid 2200
6080 "-
I I I I I I
0 .04 .08 .12 .16 .20 .24
Thrust of BLC jetmm
Thrust of fan without BLC
VjBLC = 0
V
Figure 31. BLC flow parameter for modified fan
33

_' 1.0 ->0
o_ .8-
if)
_ .6-<llc
c .40
Air flow
Fuselage top su_ace/ I
Inlet vane j
6.28_ _-' 'l_'l'l' /' ' "1'
(Typical)\With vane_ Exit vane
\
Without_
I I I I.1 .2 .3 .4
VNj
Figure 32. Fan-in-fuselage inlet performance
34

Figure 33.
m 2 ]L
"._----- 6' -'_
_ 21.91 -,
Lift engine research test bed in the Ames 40x80-foot wind tunnel
35

.08 r
t oz .06 ..-"
'=.#'J / z\ ,__/ j __ .s6 26D
0
1.1_0 [ -.
.g80 i. I , \\ I
I 2 3V ./V i
Figure 34. Flow distortion in the lift engine inlets as a function of airspeed
BELL-MOUTH INLET
v /Vi ;. 0.45V- - BO knots
F/FMAX m 50% I0"
zJ .06
_'l .o_L /._-,7 F'T,v.,,oL- 9BO _"
0 4 8 12 16 " 0 4 8 12 16
a, deg a, deg
Figure 35. Variation of lift engine inlet flow distortion with angle of attack
36
WriableIouvers_ _Diverter valve
Figure 36. Large-scale lift/lift-cruise model
"k"*_'jX,\\ Sem_ctrcutar
_/j_....--_, ,nlel vone
P
\ ___Y:7
IL 15.96" D -,
22.38"
Figure 37. Lift engine inlets for J-85 engines
37
1.00
.99
PT AV-- 98
PT
.97
.960
.12
.08
PT MAX - PT MIN
PT AM.04
Figure 38.
(A) INLET GUIDE VANES INSTALLED
Inlet guide vanes installed
:.
%
.4 .8 1.2 1.6 2.0
-- Engine inlel no I------ Engine inlet no 2------ Engine inlll no 3
. 150 knots
_/_.- idle--S,- i.4 .8 1.2 1.6 2.0
V/Vi
1.00
.99
PT AV.98
PT
.97
PT MAX - PT MIN
PT Av
.96
.12
.O8
.04
0
(B) INLET GUIDE VANES REMOVEDInlet guide vanes removed
-__._ _\.
Flow ,l_ "_-, (- \%
.4 .8 1.2 1.6 2.0
.4 .8 1.2 1.6 2.0V/Vi
Performance of lift engine inlets with and without inlet vane
38

1.00 -
.991_..=-.
.98 -
.97 -
n-.96 -
.95 -
.94 i.
.12 -
.10 -
E > .08 -
_I= .o6_---
.04 -
.02 -
OI-.4
V/V I = 0.66
1",,'-8::8::8,-a--'---O--O--O--O
"_ 1.46
1.80
I I I I I
V/V i = 1.80
1.46
....o °"°"° 0.66
Inlet
o No. 1
A No. 2
D No. 3
Fg
V _ Fgmax
150 0 Idle
-----120 0 Idle
--_--1'00 0 0.375
.... _._--A-._._3..O__::D0.,66 I
4 8 12 16 20
Angle of attack (o., deg)
Figure 39. Effect of angle of attack on lift engine
inlet performance
39

1.00
.99
_1o .98
.97
.96
.12
il ,,,.o_1-1 >1
_-b .o,
0
Figure 40.
\I'\\
\
.4 .8 1.2
VNi
10
150 knots V
I // 0.56D -" _ Ref. 18
i D
_' _ _ -. .--- 6.00" r _ Thermocouples Ref. 19
_ PlOW "_ I Total probe I -_ ,
\ I _ _/,,..--;+. i\ ,?°°,:_.38,,--. I J!_'Jk_-_ /I\ L_t_______, o.,ooD
"x LL--'::;: tlRef.19 _Airflow e
I . _" Fuselag" "Ref 18 top surlace
Inlet vane I
Tip turbine
1.6 2.0 /___R;tor
.._._=-_ ,._ _ __--=_
_, Y_:_._._T_.,_._,\,', !, \,- }
Comparison of performance of 3 lift engine inlets
1.00
L
.50
.25
Figure 41. Flow turning effectiveness of several fan
louver systems
4O

• 56.30"
__" Compressor
_____ .... =.._._.°--4 r--_____--
side lip, 180 =)
Figure 42. Q-fan engine with exhaust vane for control
_//-_ Corenozzle
Vane pivot axis
2
® OFF CENTERra CENTERLINE POSITION
0.4 J
0.2 --
F2-- 0Ts
-0.2-
-0.4--
Figure 43. Force generating capability of a single vane in the exhaust
41

:l.O0
t--"09
D .75l-r-1-I--
£.)
.50 /'_ II--
I
_- 25-/U- •
._1
0-I.0
Figure 44.
VARIABLE CAMBER
SINGLE SWIVEL NOZZLE CASCADE
\ 90 ° /y----_' _r=.78
.'/7, __---_--_-_T.. / _-s..._oHOOO
l/ i ,"_ \/ /', I/ ,I X_'.i. z _\ \. ItI / ,"xl /',_z--\ _ It
-.75 -.50 -.25 O .25 .50 .75 1.0
HORIZONTAL FORCE/STATIC THRUST
Flow turning performance of several exhaust hood deflectors
42

Figure 45. Lift/lift-cruise fighter model in 40x80-foot wind tunnel
43

Figure46. Lift/lift-cruise fightermodelonstatictestfacility
44
• I150 Engine
I00 I ..... 2
£1T. eF I -- -- -- .3
_oIo..... ,./_o_ )_
1
Roke 2 I
iO01 i
_0' i-
0
150 0I-._1 _E.,,o..,o._-_ I I I I I I_ I
"l 1I
,_o I
,,,.-, i.\0,s I , i
i
'°EI_, pllg.
i
0 I 2 3 4 5 6
4
,1,1,1
,I
II? 8 9 I0
Time, sic
44J lira..._ L'_
J IDl_.,m,. _e
16 17 18 19
Figure 47. Exhaust gas reingestion in the forward inlet on the lift/lift-cruise model
45

46
3BON OF HORSESHOE
VORTICES ALONG
EMPIRICAL JET TRAJECTORY
\
\
LOCAL VORTEX
STRENGTH
DETERMINED BY
BALANCING
CENTRIFUGAL FORCE
DUE TO TURNING JET
MOMENTUM
Figure 49. Typical model of a jet-in-crossflow
Y, cm
8-6
6
4
2
0
-2
-4
-6
-8
-4
-6
Z, cm -8
-10
-12
-14
-16
X, cm•.4 -2 ,4) 2 4 6 8 I0
I l I I I I I "1
Jetflow
V/vj = .125
Figure 50. Streamlines of a
jet-in-crossflow from a laser
velocimeter, V/Vj = 0.125
47

1.2
1.0
T/T sOR
L/T S
,....
\\
\
°e -
.6
.4
.2
0
Figure 51.
THRUST_
\\
\
\\/LIFT
I l I I I 1 I
.I .2 .3 .4 .5 .6 .7
V/Vj
Loss of lift from a nose-mounted lift fan
48

_IODEL TYPE
1 Fan-in-fuselage F
2 Fan4n-wing k
3 Fan4n-wlng
Fan4n-wing, 6 fans AFTFan-in-wing, 4 fans AFT _1_ 3.434Fan-In-wing, 2 fans AFT PFan-in-wing, 6 fans forward
5 Fan-in-wing k
Tandem lift fan m_6 Fan-in-wing, 2 fans AFT
Fan-in-wing, 2 fans forward
Folding lift fan
L
7 Rotating cruise fanr
Tandem podded lift fan L8 2 fans forward P
2 fans AFT
lift-cruise fan I_9 2 fans forward (podded)2 cruise fans AFTLow wing tandem lift fan L
10 2 fans forward (podded) PFan-in-wing, 2 fans AFT
Low wing, 2 lift11 Fans forward L"2 lift/cruise fans AFT
1 fan forward _._ 4.512 2 lifVcruise/'D' deflector
2 tilting lift fans _, 7.613F
WING SWEEP OFASPECT QUARTER
RATIO CHORD LINE
5 0 °
3.5 16°
3.11 16"/25"
2.2 52.4 °
5.8 (basic) 35 °3.44 (gross)
5.8 35 °
5.8 (basic)4.00 (gross) 35°
5.8 (basic)4.4 (gross) 35°
5.6 (basic) 35 °3.7 (gross)
8.14 23.5 °
Af D D XTAPER REFERENCE
S C b C
.5 .064 .552 147 .25 3
.5 .099 .428 269 .392 14
.32 .147 .48 .349 .43 9
.115 .292 .505 .42
20 ° .47 .076 .268 .336 .43 NASA038 .245 ! .168 .44 TN D-4233115 .292 .505 .322
0 .12 .335 .363 .63 16
.073 .796 .164 .286.3 .036 398 164 1.24 29
.036 .398 .164 -.657
.3 i .123 29
.086 .946 164 -- NASA.3 .043 .473 .164 -.80
.043 .473 .164 1.16 TN D-6234
.094 -- .164 m NASA.3 .047 i.473 .164 -.80 TM X-62151.007 -- .164
.080 D .165 NASA.3 .040 .473 .165 1-.80
.040 .370 .165 i 1.19 TM X-62102
.115 _ .134 _ NASA.23 .057 .48 .134 -2.56
.057 .48 .134 2.61 TM X-62231
NASA25 ° .3 .101 CR-152181
0/10 .47 .12 _ .101 D 20
Figure 52. Geometry of large-scale lift-fan-powered models tested in the 40x80-foot wind tunnel
49

Li / Ts
1.6 i Model6b
1.2
°8 --
.4 - 2
-.4
V/Vj
I I I I I I I0 40 80 120 160 200 240
V, knots
Figure 53. Induced lift variation with airspeed for several fan-in-wing
configurations
1.6
1.2
Li
Ts.8
.4
I I
0 .I .2 .3
v/vj
I I I
0 50 IO0
VELOCITY, knots
.4
I
150
Figure 54. Induced lift variation with airspeed for several
aft-mounted lift fan installations
50

.8
.4
Li
0
-.4
-.8 I 1 I I 1
0 .I .2 .3 .4 .5
v/v i
I I I l
0 50 I O0 150VELOCITY, knols
Figure 55. Induced lift variation with forward speed for several
forward mounted lift fan installations
I
.6
.6
.4
//
//
//_MODEL
//
//
/
0
lad u.I_E > .2
ogbt.l
-- ILl
_× oI- l,-Et,-
/ ..I-
---- _-I ...............-'40 .I .2 .3 .4 .5 .6
FLIGHT VELOCITY RATIO, V/Vl
0 25 50 75 m/sec
t il I l I I
0 50 I00 150 knots
VELOCITY
Figure 56. Pitching moment variation with airspeedfor several fan installations
51

.4
.2
o
-.2
-.4
O I
.1
3
f
12
I I I I I I
(a) Wing lift
I ] I 1 I
.2 .3 .4 .5 .6
VNj
Figure 57. Effect of fan downwash on the wing
2 1\ \
\3
.4
+ O "t" 4" + +
+_----_+ ++[] 4- + " +----++++0.+ + t",t
\\\+ + -Jr
.2
Li-- 0Ts
-.2
-.4
-.6 1 I J 1 ! 1-4 -3 -2 -1 O 1 2
x/c
Figure 58. Lift induced on a wing by a vertically-oriented jet in
several locations
52

Pi vJ2
Figure 59. Induced lift from operation of the engines in the test rig
I
.08
AL
T
0
-.1
-.2
-7-
-.3 I
0 2 4 6 8h
de
o ;;o 3
10 12 14
Figure 60. Comparison of predicted and measured lift in ground effect
-O
53

SCHEMATIC FOR INDUCEDLIFT CALCULATION
THEFLOW FIELDWITH FANOPERATING
Li - V2 CL_I F C_ S 1
TS V2js 47rAf/S L-_J " _j S2d
aj= 9o-/
Figure 61. Schematic for induced lift calculation
AREAS FOR INDUCEDLIFT CALCULATION
01 E34d A4a t_6b1-12 Q5 1_4b e6c
_3 O6a (_4c
.4 - (a) V/V] = .1
.2-
ol I- '- i
.d
=E-.2 L_ ="- -.6 -.4 -.2"oq)o
qD1.2--
"O2= ,8-
_ .4_
• I
I I
.2 .4
-.4 0 .4 .8 1.2
.8-
.4-
ol
;/--.4
- ///_ (b) VNj=.25
J[_
I I I I
0 .4 .8 1.2 1.6
(c) V_t
Agreement
I i I ol
/.-1
(d)VNj =.55
= L i I
_ I I I I
0 1 2 3 4
Calculated induced lift, LifT s
Figure 62. Comparison of measured and calculatedinduced lift with exit
vanes vertical
54

1.4
1.2
1.0
L
Ts
.8
.6
.4
.2
13eft
20 °
35 °
ref. 15
calculated
L Li T- + _ cos_
Ts Ts Ts
2 ° a (C L = .125)
.1 .2 .3 .4 .5
v/vj
I.6
Figure 63. Calculated and measured variation with
airspeed for 3 exit louver angles
1.4 _ef
=l: 6÷
.4
.2
Figure 64.
0
......... - ..... 35.5
ref. 10
..... calculated
I I I I 1 I
.1 .2 .3 .4 .5 .6
v/vj
Calculated and measured variation with
airspeed for 3 exit louver angles
55

>
>
A
{E
O
ZLIJ:E
(Z:
MEASURED AND CALCULATED SLOPE OF
PITCHING MOMENT VERSUS AIRSPEED
wo_xw
1080 /',nOMODEL40231 / _,,
4b
r_ 4C /_ _.
O 4d
6 o 5 / c_0 60 / _ e-_
0 6b / o
0 / Q
F Li I (X__+o__ Li3 (C
// R ^/T . Li2 Li3_
{ I I i I
0 2 4 6 8 I0
CALCULATED CENTER OF PRESSURE, a(a/R)/a (v/vj)
Figure 65. Measured and calculated slope of pitching
moment versus airspeed
.6- (2)
C)
.5 - //
.4- /
/_2// O Fie( 10
.2 - // _T_V
/ ---- 1.1T_ V
"1I/ "' TsVj
I/ i I I I I I0 .1 .2 .3 .4 .5 .6
V
vj
Figure 66. Calculated and measured variation of drag with
airspeed
D .3Ts
I.7
56

.6 0 Re| 10 I I I i• =
• SL i IJ t.4 Vl _B=21
.3
0
.2
[}=35.1
Fx V
,-: o v-_
-.1
-.2
-.3
-.4
..5 I I I I I J
.1 .2 .3 .4 .5 .6
V/Vi
Figure 67. Calculated and measuredhorizontal force with a lift fan
operating with 3 exit louver angles
.s [(9
.4
0
Fx V
"r_ vi
- .5 Fx T V V-- T,:_E'_,c°__N_"_,)_-.6 I
.1 .2 .3 .4 .5 .6
V/Vj
Figure 68. Calculated and measuredhorizontal force with a lift fan
operating with 3 exit louver angles
57

--30--
-20 --
Fx
qs
-10
I I0 .1 .2
I I I I I.3 .4 .5 .6 .7
V
vj
Figure 69. Variation of cruise fan horizontal force with airspeed
at zero angle of attack
VRef. 36 calc. --
vi
O_ .29
I*-i ...... 35
_ - -- .52
A .... 7o
Fxmqs
°10
lo I I I I0 20 40 60 80
o (¢_g)
Figure 70. Variation of cruise fan
horizontal force with angle of attack
for several airspeeds
Iot D
58
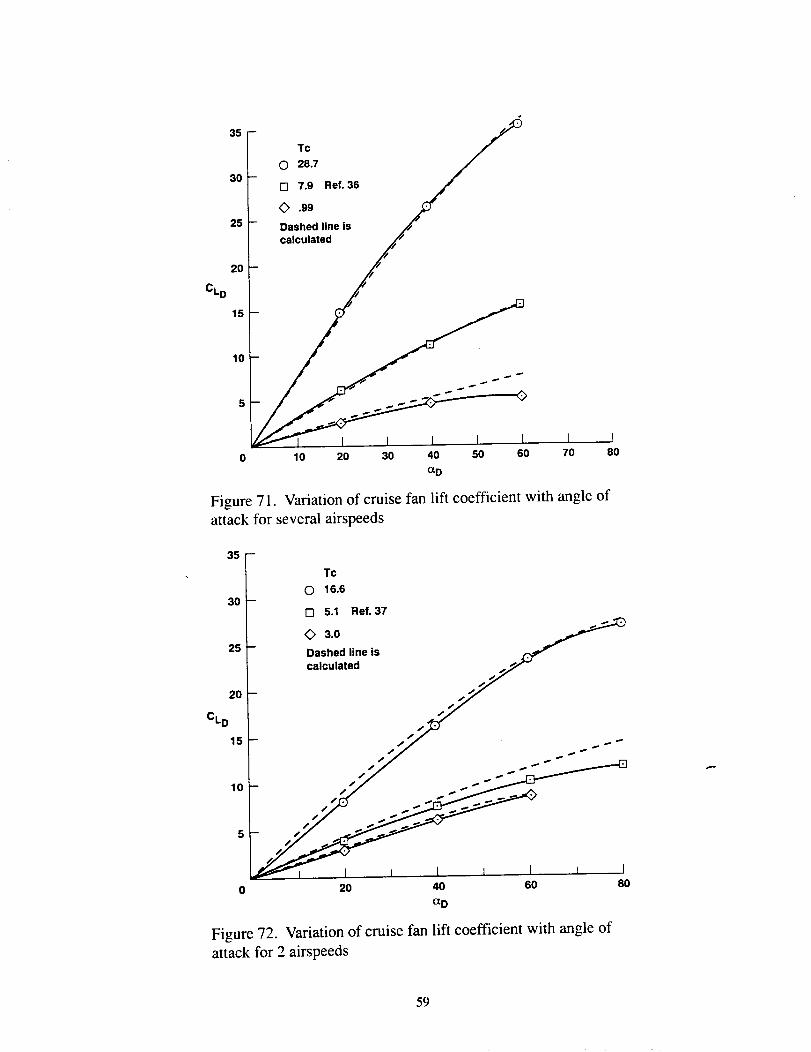
CL D
35
3O
25
2O
15
10
Figure 71.
Tc
0 28.7
[] 7.9 Ref. 36
.99Dashed llne Iscalculated
I I I I I I10 20 30 40 50 60 70
aD
Variation of cruise fan lift coefficient with angle of
attack for several airspeeds
I8O
35 -
Tc
O 16.630--
[] 5.1 Ref. 37
3.0
25 -- Dashed line is
_ calculated ,,_
.y10 -- t7 -- " -_--
6 r -/" ..s._",.._'-
_ I I I I I I I0 20 40 60 80
aD
Figure 72. Variation of cruise fan lift coefficient with angle of
attack for 2 airspeeds
2O
CL D
15
59

CL D
Tc
0 4.7Ref. 38
[] 2.0
Dashed line is
calculated
l I l I t I t I t0 20 40 60 80
Figure 73. Variation of cruise fan lift coefficient with angle of attack for
2 airspeeds
6
Tc
0 3.28 1
5 -- Ref. 39 ,. -" "
[] 1.2 ,, -" Tc = 3.28
Dashed line is ,, ,- " _,O
4 -- calculated ,,_
/
, - ,'2" .-_
// •_ ,S/'-
I I I I I I
0 10 20 30 40 50 60
_D
Figure 74. Variation of cruise fan lift coefficient with angle of attack
for 2 airspeeds
CL 3
IIO0
60

A A
t_ _2
-- I
Figure 75. Cross section of LF-336 1.3 pressure ratio lift fan
61

Inlet acoustic probe
\
Exhaust acoustic probe
'_.2.
/_ 1'Rotor discharge pressure
and temperature probe
"L
Test stand fixture for configuration
changes with fan in place
Instrumentation duct
J85 Engine
Engine inlet sound
suppressor
/k
Figure 76. Set up acoustic measurements on the LF-336
62

45 vanes 90/45 vanes
90 vanes 90 vanes with 30 ° lean
Figure 77. Stators for LF-336 acoustic tests
r.rl
Z13.
_JZO..
I I 1• _ r 45 Vanes /
N°°;'°_'_:n_'°° /I I _
I
_ - .Lr.k. / L.J _ ...- - \ 90 Vanes {_ _ _ _ "%.' /_ [] 0",.\
_', //133- [] \ I I "
_/" L___ 90,45 Vanes I
125'
120
110 0 20 40 60 80 100 120140 16U
150' Arc Angle, Deg
Figure 78. Perceived noise of the LF-336 with 3 different stators, 95% RPM
63

0
45 vanes
.15 chords m
i i
_ 90 Leaned vanes
.15 chords spacing
O
O
00 I
90 leaned vanes 90 leaned vanes
2 chords spacing 2 chords spacing
with treotment with treatment
O° aCOUStiC louver lngle
I ] I I
100 12020 40 60 80 140 160
150' Arc angle, degrees
Figure 79. Effect of the rotor-stator spacing and stators on the LF-336 perceived
noise level at 80% RPM
130
125
[]
[]
I
90 leaned vanes
.15 chocd spacing
IA
I40
©90 leaned vanes
2 chords spacing
with _l_
©' 0
I11(] 0 20 60 80 100 120 140
150' Arc angle, degrees
Figure 80. Effect of rotor-stator spacing, stator configuration, and acoustic treatment on
perceived noise level at 95% RPM
64

Figure 81. Cross section of statorless fan
• 200 ft. (61 m.) Sideline
• 110 ° Acoustic angle
V
Statorless fen ( •
120 O
110t O_
1000 ,5 1 0 1.5
130 1 _ 5400 rpm
120
II 11.0 1.51100 .5
6000 rpm
O
120
110
2.0 _ x
L_2.0 --_! ,0 .5 1 0 1.5
Spacing, true rotor tip chords
Figure 82. Comparison of the maximum
perceived noise level of the statorlessfan and the conventional fan
65

Chord 1o Root of
Serratlons = 1.846 in.
(4.688 cm)
Serration H/C S L R
Serratlon (in.) (cm) (in.) (in.) (cm) (in.) (cm) (in.) (cm) (in.) (cm)
BL1 0.116 0.295 .........
SR1 0.116 0.295 0.063 0.036 0.091 0.153 0.389 0.024 0.061 3.2 1.32
SR2 0.077 0.196 0.042 0.024 0.061 0.102 0.259 0.016 0.041 3.2 1.32
SR3 0.116 0.295 0.063 0.076 0.193 0.193 0.490 0.024 0.061 1.5 1.66
SR4 0.152 0.386 0.083 0.100 0.254 0.253 0.643 0.031 0.079 1.5 1.66
SR5 0.077 0.196 0.042 0.072 0.183 0.150 0.381 0.016 0.041 1.1 1.95
SR6 0.116 0.295 0.063 0.076 0.193 0.193 0.490 0.061 0.155 1.5 1.66
BL2 0.000 0.000 .........
Figure 83. Serrated leading-edge configurations tested in
cascade facility
66

130
120a.
_ 110
0c 100qD
o 90
D.
8%
200 ft sideline -- Unserrated rotor
4800 rpm - - - Serrated rotor
/I I I I [ I I
20 40 60 80 100 120 140 160
130
m
120
_ 110
0
¢ 100
u 90
80 0
200 ft sideline _ Unserrated rotor
5300 rpm - - - Serrated rotor
j.'"
I20
. ......
I I ] [ I ]40 60 80 100 120 140 160
130
m120
_ 110
o¢ 100
_ 90
8O
Figure 84.
200 ft sideline _ Unserrated rotor
6000 rpm - - - Serrated rotor
/I [ 1 L I I I
20 40 60 80 100 120 140
Acoustic angle, deg
Effect of leading-edge
configurations tested in cascade facility
160
67

o
i
I
|uelolt|eoo SSOl eJnsseJd le|Oj_ .__J¢
c
o.9
L.
g.
II
0
II
ff
saaJ6ep 'el6Ue UOl|el^aO
ou_
c)
_J
r-
c_
c)
c.)
0
,-J
.=.
0
L_
¢/l (N u_
u_0
J¢
oo¢o
<L)
_c;=
*-, C.)
C)
r-L10
oo 0
co

Figure 87. Semispan wing with a LF-336 in the 40x80-foot wind tunnel
69

.................... . 4_7_7.5,
I -- 14.5 m
Figure 88. Lift fan model used for noise studies
20
an¢O
15II
10
0
- _'/XV5_ight test
- "J__.._ V/STOL model lift fans
_.___ i LF336' Fan'in'wing't/st I
.1 .2 .3
V/VTi p
Figure 89. Variation of blade passing frequency noise with airspeed
70

6-
14--
m
2 _
o._
.1 i,t,il I I I I I
.6 1.o 2.o _.o 6.0fD
STROU_LLRUMS_-__et
I !
I0.0
Figure 90. Variation of jet mixing noise with airspeed
71

Form Approved
REPORT DOCUMENTATION PAGE OMBNo.0704-0188Public reporting burden for this collection of information is estimated to average I hour per response, including the time for reviewing instructions, aearching existing data sources,
gatheringand maintainingthe data needed, and completing and reviewingthe collectionof information. Bend comments regardingthis burdenestimate or any other aspect of thiscollectionof information, including suggestions for reducing this burden, to WashingtonHeadquarters Services, Directoratefor information Operatiensand Reports, 1215 JefferaonDavis Highway, Suite 1204, Arlington, VA 222024302, and to the Office of Management and Budget, Paperwork Reduction Pro ect (0704-0188), Washington, DC 20503.
1. AGENCY USE ONLY (Leave blank) 2. REPORT DATE
September 19934. TITLE AND SUBTITLE
Survey of Lift-Fan Aerodynamic Technology
6. AUTHOR(S)
David H. Hickey and Jerry V. Kirk
7. PERFORMING ORGANIZATION NAME(S) AND ADDRESS(ES)
NASA Ames Research Center
STOVl_/Powered-Lift Technology BranchMoffett Field, CA 94035-1000
9. SPONSORING/MONITORING AGENCY NAME(S) AND ADDRESS(ES)
National Aeronautics and Space Administration
Washington, DC 20546-0001
3. REPORT TYPE AND DATES COVERED
Contractor Report5. FUNDING NUMBERS
A25364D
8. PERFORMING ORGANIZATIONREPORT NUMBER
A-93106
10. SPONSORING/MONITORINGAGENCY REPORT NUMBER
NASA CR-177615
11. SUPPLEMENTARY NOTES
Point of Contact: K. Clark White, Ames Research Center, MS 237-3, Moffett Field, CA94035-1000;
(415) 604-5653
124. DISTRIBUTION/AVAILABILITY STATEMENT
Unclassified -- Unlimited
Subject Category 05
12b. DISTRIBUTION CODE
13. ABSTRACT (Maximum 200 words)
Representatives of NASA Ames Research Center asked that a summary of technology appropriate for lift-
fan powered short takeoff/vertical landing (STOVL) aircraft be prepared so that new programs could more easily
benefit from past research efforts. This paper represents one of six prepared for that purpose. The authors have
conducted or supervised the conduct of research on lift-fan powered STOVLdesigns and some of their important
components for decades.
This paper will first address aerodynamic modeling requirements for experimental programs to assure
realistic, trustworthy results. It will next summarize the results or efforts to develop satisfactory specialized
STOVL components such as inlets and flow deflectors. It will also discuss problems with operation near the
ground, aerodynamics while under lift-fan power, and aerodynamic prediction techniques. Finally, results ofstudies to reduce lift-fan noise will be presented. The paper will emphasize results from large scale experiments,
where available, for reasons that will be brought out in the discussion. Some work with lift-engine powered
STOVL aircraft is also applicable to lift-fan technology and will be presented herein. Small-scale data will be
used where necessary to fill gaps.
14. SUBJECTTERMS
Lift-fan, Powered-lift, Short takeoff/vertical landing (STOVL)
17. SECURITY CLASSIFICATIONOF REPORT
Unclassified
NSN 7540-01-280-5500
18. SECURITY CLASSIFICATIONOF THIS PAGE
Unclassified
19. SECURITY CLASSIFICATIONOF ABSTRACT
15. NUMBER OF PAGES
7616. PRICE CODE
A05
20. LIMITATION OF ABSTRAC1
Standard Form 298 (Rev. 2-89)Prescribed by ANSI Std. Z39-18
298-102