Embed Size (px)
Citation preview

Survey of Occupational Injuriesand Illnesses, 1995U.S. Department of LaborBureau of Labor StatisticsMay 1997
Summary 97-7
Wide variations exist in the frequency of nonfatal workplace incidents by industry,even for industries producing similar types of goods and services. For example, at thedetailed industry level within the industry group millwork, plywood, and structuralmembers (Standard Industrial Classification, SIC 243), the total case rate for injuries andillnesses per 100 full-time workers was 8.8 in softwood veneer and plywood (SIC 2436)and 15.0 in hardwood veneer and plywood (SIC 2435) in 1995. (See table 1.)
There were approximately 6.6 million nonfatal injuries and illnesses reported inprivate industry in 1995, and they were found in every major industry. Manufacturingaccounted for one-third of the total (2.1 million cases), and wholesale and retail trade andservices each accounted for about one-fourth of the cases. Table 2 shows the number ofinjuries and illnesses in 1995, by industry.
This summary report provides industry detail on results of the 1995 Survey ofOccupational Injuries and Illnesses conducted by the Bureau of Labor Statistics. Data formajor industrial groups (such as special trade contractors, fabricated metal products, andhealth services) were published in March 1997.1 The tables in this report provide detailedindustry information (incidence rates and number of cases) on nonfatal workplace injuriesand illnesses for 3- and 4-digit industries (e.g., water well drilling, automotive stampings,and hospitals), as defined in the 1987 edition of the Standard Industrial ClassificationManual.
The 1995 survey measured nonfatal injuries and illnesses only, sampling 250,000establishments. BLS surveys of occupational injuries and illnesses before 1992 coveredboth fatal and nonfatal incidents. Because of their relatively rare occurrence, work relatedfatalities cannot be accurately measured through a sample survey of this size. To betteraddress fatalities in the workplace, BLS developed the National Census of FatalOccupational Injuries. Nationwide results of the 1995 fatality census were released inAugust 1996.2
In addition to the injury and illness summary data presented in this report, the 1995BLS survey provides details on the characteristics of the more seriously injured and illworkers (occupations, age, sex, race, and length of service) and on the circumstances of 1 See, "Workplace Injuries and Illnesses in 1995," USDL-97-76, U.S. Department ofLabor (March 12, 1997).
2 See, "National Census of Fatal Occupational Injuries, 1995," USDL-96-315, U.S.Department of Labor (August 8, 1996).

their injuries and illnesses (nature of the injury/illness, part of body affected, event orexposure, and primary and secondary sources of the injury/illness). "More seriously" isdefined in this survey as involving at lest one day away from work not counting the daythe incident occurred. This information is scheduled for publication in a news release inJune 1997. A comprehensive bulletin containing additional details on, for example, size ofestablishment and broad illness category, will be available at a later date.
Incidence rates per 100 full-time employees for nonfatal workplace injuries andillnesses are presented in table 1; the corresponding number of nonfatal injuries andillnesses are presented in table 2. The annual survey estimates of the number andfrequency (incidence rates) of nonfatal workplace injuries and illnesses are based on logskept by private industry employers during the year. These records reflect the year's injuryand illness experience as well as the employer's understanding of which cases are work-related under current recordkeeping guidelines of the U.S. Department of Labor. Thenumber of injuries and illnesses reported in any given year also can be influenced bychanges in the level of economic activity, working conditions and work practices, workerexperience and training, and the number of hours worked.
Information in this report is available to sensory impaired individuals on request.Voice phone: (202) 606-7828; TDD phone: (202) 606-5897; TDD message referralphone: 1-800-326-2577. This material is in the public domain and, with appropriatecredit, may be reproduced without permission. If you have questions about theinformation contained in this report, or for additional copies of this report, write to:Bureau of Labor Statistics, Office of Safety, Health and Working Conditions, Room 3180,2 Massachusetts Avenue, NE., Washington, DC 20212-0001, or call (202) 606-6179.

Table 1. Incidence rate of nonfatal occupational injuries and illnesses,1 by industry and case type, 1995
Industry 2 SICcode 3
1995Annualaverageemploy-ment 4(000’s)
Injuries and Illnesses Injuries
Totalcases
Lost workdaycases Cases
withoutlost
work-days
Totalcases
Lost workdaycases Cases
withoutlost
work-daysTotal 5
Withdaysawayfrom
work 6
Total 5
Withdaysawayfrom
work 6
Private industry 7 .......................................... 96,886.0 8.1 3.6 2.5 4.4 7.5 3.4 2.4 4.1
Agriculture, forestry, and fishing 7 ................. 1,641.3 9.7 4.3 3.4 5.4 9.3 4.2 3.3 5.1
Agricultural production 7 ..................................... 01-02 734.9 10.4 4.7 3.5 5.7 9.9 4.5 3.4 5.3
Agricultural production-crops 7 ......................... 01 566.6 9.8 4.5 3.4 5.3 9.3 4.4 3.3 4.9 Cash grains 7 ................................................... 011 23.7 5.9 3.2 2.2 2.8 5.7 3.2 2.2 2.6 Field crops, except cash grains 7 .................... 013 71.0 11.4 5.7 4.5 5.7 11.0 5.6 4.4 5.5 Vegetables and melons 7 ................................ 016 87.2 9.2 3.9 2.9 5.3 8.6 3.7 2.7 4.9 Fruits and tree nuts 7 ....................................... 017 169.2 9.1 4.5 3.8 4.7 8.6 4.4 3.7 4.2 Horticultural specialties 7 ................................. 018 155.9 10.2 4.6 3.0 5.7 9.6 4.4 2.9 5.2 General farms, primarily crop 7 ....................... 019 59.5 10.6 4.4 3.4 6.2 10.4 4.4 3.3 6.0
Agricultural production - livestock 7 .................. 02 168.3 12.4 5.5 4.0 6.9 11.8 5.1 3.8 6.7 Livestock, except dairy and poultry 7 ............... 021 56.6 14.2 6.1 4.8 8.1 13.7 5.8 4.6 7.9 Dairy farms 7 ................................................... 024 45.3 10.1 4.4 3.8 5.7 10.0 4.3 3.8 5.6 Poultry and eggs 7 ........................................... 025 46.1 13.3 5.9 3.4 7.4 12.1 5.3 3.2 6.9 Animal specialties 7 ......................................... 027 15.5 9.4 4.7 3.9 4.7 9.1 4.7 3.9 4.5 General farms, primarily animal 7 .................... 029 4.8 10.2 5.0 3.8 5.2 9.9 4.9 3.8 5.0
Agricultural services ......................................... 07 869.1 9.3 4.0 3.3 5.3 8.9 3.9 3.2 5.0 Crop services .................................................. 072 108.3 11.2 5.3 3.2 5.9 10.6 5.1 3.1 5.5 Veterinary services .......................................... 074 164.8 7.9 2.4 1.8 5.5 7.7 2.4 1.8 5.4 Animal services, except veterinary .................. 075 46.9 8.6 3.6 3.4 5.0 8.3 3.4 3.3 4.8 Farm labor and management services ............ 076 168.3 6.7 3.3 2.8 3.3 6.5 3.3 2.8 3.3 Landscape and horticultural services .............. 078 377.2 10.5 4.6 4.0 5.9 10.1 4.5 3.9 5.6
Forestry ............................................................ 08 24.4 10.0 4.9 4.4 5.1 9.3 4.7 4.2 4.6 Timber tracts ................................................... 081 9.7 11.7 6.2 5.3 5.5 10.6 5.8 5.0 4.8 Forest products ............................................... 083 2.1 13.1 5.2 4.3 7.9 12.4 4.6 3.8 7.7 Forestry services ............................................. 085 12.5 8.1 3.8 3.7 4.3 7.7 3.8 3.6 4.0
Fishing, hunting, and trapping .......................... 09 12.9 9.2 5.5 4.4 3.7 8.4 5.0 4.0 3.4 Commercial fishing .......................................... 91 10.4 8.9 5.3 4.6 3.6 8.0 4.7 4.1 3.2
Mining 8 ............................................................. 582.4 6.2 3.9 3.3 2.4 6.0 3.8 3.2 2.2
Metal mining 8 .................................................. 10 51.4 5.2 2.8 1.9 2.4 4.9 2.8 1.8 2.2 Iron ores 8 ........................................................ 101 8.6 6.8 3.5 2.5 3.4 6.4 3.3 2.3 3.1 Copper ores 8 .................................................. 102 15.5 3.6 1.8 1.6 1.7 3.4 1.8 1.6 1.5 Lead and zinc ores 8 ....................................... 103 2.4 5.2 2.5 2.1 2.7 5.1 2.5 2.1 2.6 Gold and silver ores 8 ...................................... 104 18.3 5.5 3.2 1.7 2.4 5.3 3.1 1.6 2.2 Ferroalloy ores, except vanadium 8 ................. 106 .9 5.9 3.3 1.9 2.6 5.7 3.3 1.9 2.4 Miscellaneous metal ores 8 ............................. 109 2.2 6.7 4.5 3.1 2.3 6.7 4.5 3.1 2.3
Coal mining 8 .................................................... 12 104.5 9.1 6.7 6.3 2.3 8.7 6.6 6.2 2.0 Bituminous coal and lignite mining 8 ............... 122 97.3 9.0 6.7 6.3 2.3 8.6 6.6 6.2 2.0 Anthracite mining 8 .......................................... 123 1.3 13.7 10.4 9.5 3.3 13.2 10.1 9.2 3.1
Oil and gas extraction ....................................... 13 319.5 5.9 3.4 2.8 2.5 5.6 3.3 2.7 2.3 Crude petroleum and natural gas .................... 131 150.5 2.4 1.0 .8 1.4 2.2 .9 .8 1.3 Oil and gas field services ................................ 138 163.6 8.9 5.5 4.5 3.4 8.6 5.3 4.4 3.2
Nonmetallic minerals, except fuels 8 ................ 14 107.0 5.4 3.2 2.5 2.2 5.3 3.2 2.5 2.1 Dimension stone 8 ........................................... 141 4.3 9.1 5.6 5.2 3.5 9.0 5.5 5.1 3.5 Crushed and broken stone 8 ........................... 142 40.1 5.8 3.4 2.5 2.4 5.7 3.3 2.5 2.4 Sand and gravel 8 ............................................ 144 35.0 4.9 3.1 2.7 1.8 4.8 3.0 2.6 1.8 Clay, ceramic, and refractory minerals 8 ......... 145 7.5 4.6 2.9 2.2 1.7 4.5 2.8 2.2 1.6 Chemical and fertilizer minerals 8 .................... 147 13.8 3.6 2.2 1.5 1.4 3.5 2.2 1.4 1.3 Miscellaneous nonmetallic minerals 8 ............. 149 5.1 6.6 3.7 3.1 2.9 6.3 3.6 2.9 2.7
See footnotes at end of table.
2

Table 1. Incidence rate of nonfatal occupational injuries and illnesses,1 by industry and case type, 1995 — Continued
Industry 2 SICcode 3
1995Annualaverageemploy-ment 4(000’s)
Injuries and Illnesses Injuries
Totalcases
Lost workdaycases Cases
withoutlost
work-days
Totalcases
Lost workdaycases Cases
withoutlost
work-daysTotal 5
Withdaysawayfrom
work 6
Total 5
Withdaysawayfrom
work 6
Construction ..................................................... 5,088.1 10.6 4.9 4.2 5.8 10.4 4.8 4.1 5.7
General building contractors ............................ 15 1,202.0 9.8 4.4 3.8 5.4 9.6 4.3 3.7 5.3 Residential building construction ..................... 152 608.6 8.6 4.2 3.9 4.4 8.5 4.2 3.8 4.3 Operative builders ........................................... 153 26.9 6.4 3.1 2.7 3.3 6.3 3.1 2.7 3.3 Nonresidential building construction ................ 154 566.6 11.2 4.7 3.7 6.5 10.9 4.6 3.6 6.4 Heavy construction, except building ................. 16 748.9 9.9 4.8 3.9 5.1 9.6 4.7 3.8 4.9 Highway and street construction ..................... 161 222.6 10.4 5.0 4.0 5.4 10.1 4.8 3.9 5.3 Heavy construction, except highway ............... 162 526.2 9.7 4.8 3.9 4.9 9.4 4.7 3.8 4.8
Special trade contractors .................................. 17 3,137.2 11.1 5.0 4.4 6.1 10.9 5.0 4.3 6.0 Plumbing, heating, air-conditioning ................. 171 712.2 12.9 5.4 4.7 7.5 12.7 5.3 4.6 7.4 Painting and paper hanging ............................ 172 178.9 7.3 4.0 3.7 3.4 7.2 3.9 3.6 3.3 Electrical work ................................................. 173 592.4 10.8 4.1 3.4 6.6 10.7 4.1 3.4 6.6 Masonry, stonework, and plastering ................ 174 409.3 10.8 5.5 5.1 5.3 10.7 5.4 5.0 5.2 Carpentry and floor work ................................. 175 219.1 10.8 5.4 4.9 5.3 10.5 5.3 4.7 5.2 Roofing, siding, and sheet metal work ........... 176 208.3 14.8 7.8 6.8 7.0 14.6 7.7 6.7 6.9 Concrete work ................................................. 177 247.4 10.6 5.0 4.5 5.6 10.2 4.9 4.3 5.4 Water well drilling ............................................ 178 21.4 9.4 4.2 3.9 5.2 9.3 4.1 3.8 5.2 Miscellaneous special trade contractors ......... 179 548.2 9.6 4.5 3.8 5.1 9.4 4.4 3.7 5.0
Manufacturing ................................................... 18,473.4 11.6 5.3 2.9 6.3 9.9 4.6 2.6 5.3
Durable goods ................................................... 10,658.9 12.8 5.6 3.1 7.2 11.0 4.9 2.8 6.2
Lumber and wood products .............................. 24 767.0 14.9 7.0 4.7 7.9 14.2 6.7 4.5 7.4
Logging ............................................................ 241 82.0 10.5 6.7 6.2 3.8 10.0 6.6 6.1 3.4
Sawmills and planing mills .............................. 242 187.1 13.4 6.1 4.3 7.3 12.6 5.9 4.2 6.7 Sawmills and planing mills, general ............... 2421 148.2 12.2 5.8 4.0 6.4 11.6 5.7 3.9 5.9 Hardwood dimension and flooring mills .......... 2426 37.2 18.0 7.4 5.4 10.7 16.7 6.9 5.1 9.8
Millwork, plywood and structural members ..... 243 279.0 15.2 6.9 4.3 8.3 14.4 6.5 4.1 7.8 Millwork .......................................................... 2431 110.5 15.5 7.5 4.6 8.1 14.5 6.9 4.3 7.5 Wood kitchen cabinets ................................... 2434 76.0 14.8 6.1 3.9 8.7 13.7 5.5 3.6 8.2 Hardwood veneer and plywood ...................... 2435 28.2 15.0 7.7 3.9 7.4 14.4 7.4 3.8 6.9 Softwood veneer and plywood ....................... 2436 29.5 8.8 3.3 1.6 5.5 8.3 3.2 1.5 5.2 Structural wood members, n.e.c. .................... 2439 34.9 21.0 9.8 7.4 11.2 20.8 9.7 7.4 11.1
Wood containers ............................................. 244 50.6 17.1 8.4 6.5 8.7 16.9 8.4 6.5 8.5 Wood pallets and skids .................................. 2448 39.6 16.7 8.2 6.5 8.6 16.5 8.1 6.5 8.3
Wood buildings and mobile homes ................. 245 80.6 23.7 10.5 5.5 13.2 23.2 10.3 5.4 12.9 Mobile homes ................................................. 2451 61.5 24.3 10.1 5.0 14.2 23.9 9.9 4.9 14.0 Prefabricated wood buildings ......................... 2452 19.1 21.4 12.0 7.4 9.3 20.8 11.8 7.3 9.0
Miscellaneous wood products ......................... 249 87.7 11.5 5.4 3.7 6.1 10.5 5.0 3.5 5.5 Wood preserving ............................................ 2491 11.4 12.6 5.6 4.4 7.0 12.1 5.3 4.1 6.8 Reconstituted wood products ......................... 2493 20.1 8.1 3.4 2.0 4.7 7.7 3.4 2.0 4.3 Wood products, n.e.c. .................................... 2499 56.2 12.6 6.1 4.2 6.5 11.3 5.5 3.9 5.8
Furniture and fixtures ....................................... 25 508.9 13.9 6.4 3.4 7.4 12.5 5.7 3.1 6.8
Household furniture ......................................... 251 280.4 13.2 6.2 3.4 7.0 12.0 5.6 3.1 6.3 Wood household furniture .............................. 2511 126.3 12.9 5.6 3.0 7.2 11.5 5.2 2.8 6.3 Upholstered household furniture .................... 2512 88.9 11.4 5.3 2.9 6.2 10.3 4.6 2.6 5.7 Metal household furniture ............................... 2514 22.4 14.8 7.6 3.8 7.1 13.1 6.7 3.2 6.4 Mattresses and bedsprings ............................ 2515 31.2 18.1 10.0 6.2 8.2 17.3 9.5 5.9 7.8 Wood television and radio cabinets ................ 2517 4.8 12.1 3.8 2.2 8.3 10.7 3.6 2.1 7.0 Household furniture, n.e.c. ............................. 2519 6.8 13.7 7.0 2.6 6.7 13.2 6.7 2.4 6.5
See footnotes at end of table.
3

Table 1. Incidence rate of nonfatal occupational injuries and illnesses,1 by industry and case type, 1995 — Continued
Industry 2 SICcode 3
1995Annualaverageemploy-ment 4(000’s)
Injuries and Illnesses Injuries
Totalcases
Lost workdaycases Cases
withoutlost
work-days
Totalcases
Lost workdaycases Cases
withoutlost
work-daysTotal 5
Withdaysawayfrom
work 6
Total 5
Withdaysawayfrom
work 6
Office furniture ................................................. 252 62.8 13.8 6.6 2.4 7.1 12.2 5.7 2.2 6.5 Wood office furniture ...................................... 2521 28.6 10.7 5.6 2.6 5.2 9.5 4.9 2.4 4.6 Office furniture, except wood .......................... 2522 34.2 16.2 7.5 2.3 8.7 14.3 6.3 2.0 8.1
Public building and related furniture ................ 253 42.7 19.4 10.0 4.8 9.5 15.4 7.4 3.7 7.9
Partitions and fixtures ...................................... 254 85.5 14.8 6.5 4.0 8.3 14.1 6.1 3.9 8.0 Wood partitions and fixtures ........................... 2541 48.0 14.9 6.0 3.8 8.8 14.3 5.7 3.7 8.6 Partitions and fixtures, except wood ............... 2542 37.4 14.7 7.0 4.2 7.7 13.9 6.6 4.1 7.4
Miscellaneous furniture and fixtures ................ 259 37.5 11.0 4.2 2.4 6.8 9.9 3.6 2.2 6.3 Drapery hardware and blinds and shades ...... 2591 21.2 10.1 3.7 2.0 6.4 8.9 2.9 1.7 6.0 Furniture and fixtures, n.e.c. ........................... 2599 16.3 12.0 4.7 2.9 7.3 11.2 4.4 2.8 6.7 Stone, clay, and glass products ....................... 32 539.5 12.3 5.7 3.5 6.5 11.3 5.3 3.3 6.0
Flat glass ......................................................... 321 15.3 20.9 7.4 2.6 13.5 17.0 6.1 2.2 10.9
Glass and glassware, pressed or blown .......... 322 73.4 12.8 6.1 2.7 6.7 11.2 5.4 2.3 5.8 Glass containers ............................................. 3221 30.4 14.8 7.5 3.1 7.3 13.3 7.0 2.9 6.3 Pressed and blown glass, n.e.c. ..................... 3229 43.1 11.3 5.1 2.3 6.2 9.7 4.2 1.9 5.5
Products of purchased glass ........................... 323 62.4 13.1 5.9 2.5 7.2 11.9 5.2 2.4 6.6
Structural clay products ................................... 325 34.0 14.4 5.8 2.9 8.6 13.5 5.4 2.8 8.1 Brick and structural clay tile ............................ 3251 14.1 15.4 6.9 3.3 8.5 14.6 6.4 3.1 8.2 Ceramic wall and floor tile .............................. 3253 10.1 8.4 4.3 1.8 4.1 7.4 3.8 1.7 3.6
Pottery and related products ........................... 326 41.5 12.2 5.8 3.2 6.4 11.0 5.3 2.8 5.7 Vitreous plumbing fixtures .............................. 3261 10.3 15.6 8.9 2.4 6.7 14.7 8.3 2.1 6.4 Porcelain electrical supplies ........................... 3264 10.9 10.0 4.6 3.5 5.4 9.0 4.2 3.3 4.8 Pottery products, n.e.c. .................................. 3269 14.7 11.6 4.6 3.6 7.0 10.1 4.0 3.0 6.2
Concrete, gypsum, and plaster products ......... 327 203.9 12.5 6.0 4.7 6.4 12.0 5.9 4.7 6.2 Concrete block and brick ................................ 3271 17.3 11.8 5.9 4.6 5.8 11.6 5.8 4.6 5.8 Concrete products, n.e.c. ............................... 3272 68.6 15.0 7.3 5.2 7.7 14.4 7.1 5.1 7.3 Ready-mixed concrete ................................... 3273 100.6 11.7 5.7 5.0 6.0 11.5 5.7 5.0 5.9 Gypsum products ........................................... 3275 12.3 7.0 2.0 .9 5.1 5.7 1.9 .9 3.8
Cut stone and stone products ......................... 328 13.5 9.6 3.8 3.6 5.8 8.7 3.8 3.6 4.8
Miscellaneous nonmetallic mineral products ... 329 77.7 9.0 5.0 2.5 4.0 8.1 4.4 2.3 3.6 Abrasive products ........................................... 3291 20.2 9.4 5.8 3.2 3.6 8.0 4.7 2.8 3.3 Minerals, ground or treated ............................ 3295 12.5 7.4 2.9 2.0 4.5 7.1 2.8 1.8 4.3 Mineral wool ................................................... 3296 24.2 7.2 3.8 1.4 3.4 6.5 3.5 1.3 3.0 Nonclay refractories ....................................... 3297 8.4 9.9 5.4 3.2 4.5 9.3 5.0 3.0 4.3 Nonmetallic mineral products, n.e.c. .............. 3299 9.8 10.4 5.7 2.7 4.7 9.1 5.1 2.7 4.0
Primary metal industries ................................... 33 708.1 16.5 7.2 4.2 9.3 14.9 6.7 4.0 8.2
Blast furnace and basic steel products ............ 331 240.1 12.7 5.4 3.3 7.3 11.8 5.2 3.2 6.6 Blast furnaces and steel mills ......................... 3312 171.2 11.9 4.6 2.6 7.3 11.0 4.5 2.5 6.5 Steel wire and related products ...................... 3315 19.2 12.4 7.6 5.5 4.8 11.2 7.3 5.3 3.8 Cold finishing of steel shapes ......................... 3316 16.9 18.3 7.8 6.3 10.6 18.0 7.6 6.2 10.4 Steel pipe and tubes ....................................... 3317 27.2 15.9 8.0 5.6 7.9 15.0 7.7 5.4 7.3
Iron and steel foundries ................................... 332 130.2 26.6 10.9 6.2 15.8 24.3 10.0 5.8 14.2 Gray and ductile iron foundries ...................... 3321 83.3 29.2 10.8 6.6 18.4 26.5 9.9 6.2 16.6 Malleable iron foundries ................................. 3322 4.3 26.0 12.5 4.8 13.5 24.2 11.6 4.6 12.6 Steel investment foundries ............................. 3324 15.5 13.0 7.4 3.3 5.6 11.5 6.6 2.9 4.9 Steel foundries, n.e.c. ..................................... 3325 27.1 26.4 12.7 7.0 13.7 24.5 12.1 6.6 12.4
See footnotes at end of table.
4
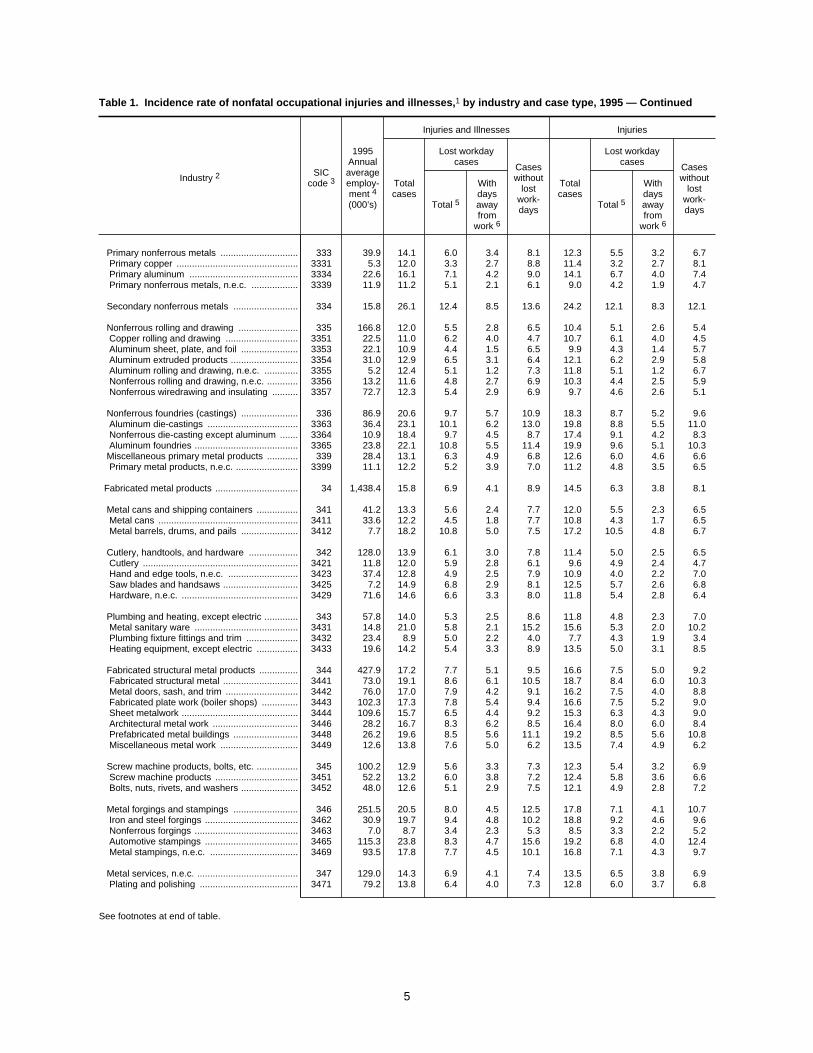
Table 1. Incidence rate of nonfatal occupational injuries and illnesses,1 by industry and case type, 1995 — Continued
Industry 2 SICcode 3
1995Annualaverageemploy-ment 4(000’s)
Injuries and Illnesses Injuries
Totalcases
Lost workdaycases Cases
withoutlost
work-days
Totalcases
Lost workdaycases Cases
withoutlost
work-daysTotal 5
Withdaysawayfrom
work 6
Total 5
Withdaysawayfrom
work 6
Primary nonferrous metals .............................. 333 39.9 14.1 6.0 3.4 8.1 12.3 5.5 3.2 6.7 Primary copper ............................................... 3331 5.3 12.0 3.3 2.7 8.8 11.4 3.2 2.7 8.1 Primary aluminum .......................................... 3334 22.6 16.1 7.1 4.2 9.0 14.1 6.7 4.0 7.4 Primary nonferrous metals, n.e.c. .................. 3339 11.9 11.2 5.1 2.1 6.1 9.0 4.2 1.9 4.7
Secondary nonferrous metals ......................... 334 15.8 26.1 12.4 8.5 13.6 24.2 12.1 8.3 12.1
Nonferrous rolling and drawing ....................... 335 166.8 12.0 5.5 2.8 6.5 10.4 5.1 2.6 5.4 Copper rolling and drawing ............................ 3351 22.5 11.0 6.2 4.0 4.7 10.7 6.1 4.0 4.5 Aluminum sheet, plate, and foil ...................... 3353 22.1 10.9 4.4 1.5 6.5 9.9 4.3 1.4 5.7 Aluminum extruded products .......................... 3354 31.0 12.9 6.5 3.1 6.4 12.1 6.2 2.9 5.8 Aluminum rolling and drawing, n.e.c. ............. 3355 5.2 12.4 5.1 1.2 7.3 11.8 5.1 1.2 6.7 Nonferrous rolling and drawing, n.e.c. ............ 3356 13.2 11.6 4.8 2.7 6.9 10.3 4.4 2.5 5.9 Nonferrous wiredrawing and insulating .......... 3357 72.7 12.3 5.4 2.9 6.9 9.7 4.6 2.6 5.1
Nonferrous foundries (castings) ...................... 336 86.9 20.6 9.7 5.7 10.9 18.3 8.7 5.2 9.6 Aluminum die-castings ................................... 3363 36.4 23.1 10.1 6.2 13.0 19.8 8.8 5.5 11.0 Nonferrous die-casting except aluminum ....... 3364 10.9 18.4 9.7 4.5 8.7 17.4 9.1 4.2 8.3 Aluminum foundries ........................................ 3365 23.8 22.1 10.8 5.5 11.4 19.9 9.6 5.1 10.3 Miscellaneous primary metal products ............ 339 28.4 13.1 6.3 4.9 6.8 12.6 6.0 4.6 6.6 Primary metal products, n.e.c. ........................ 3399 11.1 12.2 5.2 3.9 7.0 11.2 4.8 3.5 6.5
Fabricated metal products ................................ 34 1,438.4 15.8 6.9 4.1 8.9 14.5 6.3 3.8 8.1
Metal cans and shipping containers ................ 341 41.2 13.3 5.6 2.4 7.7 12.0 5.5 2.3 6.5 Metal cans ...................................................... 3411 33.6 12.2 4.5 1.8 7.7 10.8 4.3 1.7 6.5 Metal barrels, drums, and pails ...................... 3412 7.7 18.2 10.8 5.0 7.5 17.2 10.5 4.8 6.7
Cutlery, handtools, and hardware ................... 342 128.0 13.9 6.1 3.0 7.8 11.4 5.0 2.5 6.5 Cutlery ............................................................ 3421 11.8 12.0 5.9 2.8 6.1 9.6 4.9 2.4 4.7 Hand and edge tools, n.e.c. ........................... 3423 37.4 12.8 4.9 2.5 7.9 10.9 4.0 2.2 7.0 Saw blades and handsaws ............................. 3425 7.2 14.9 6.8 2.9 8.1 12.5 5.7 2.6 6.8 Hardware, n.e.c. ............................................. 3429 71.6 14.6 6.6 3.3 8.0 11.8 5.4 2.8 6.4
Plumbing and heating, except electric ............. 343 57.8 14.0 5.3 2.5 8.6 11.8 4.8 2.3 7.0 Metal sanitary ware ........................................ 3431 14.8 21.0 5.8 2.1 15.2 15.6 5.3 2.0 10.2 Plumbing fixture fittings and trim .................... 3432 23.4 8.9 5.0 2.2 4.0 7.7 4.3 1.9 3.4 Heating equipment, except electric ................ 3433 19.6 14.2 5.4 3.3 8.9 13.5 5.0 3.1 8.5
Fabricated structural metal products ............... 344 427.9 17.2 7.7 5.1 9.5 16.6 7.5 5.0 9.2 Fabricated structural metal ............................. 3441 73.0 19.1 8.6 6.1 10.5 18.7 8.4 6.0 10.3 Metal doors, sash, and trim ............................ 3442 76.0 17.0 7.9 4.2 9.1 16.2 7.5 4.0 8.8 Fabricated plate work (boiler shops) .............. 3443 102.3 17.3 7.8 5.4 9.4 16.6 7.5 5.2 9.0 Sheet metalwork ............................................. 3444 109.6 15.7 6.5 4.4 9.2 15.3 6.3 4.3 9.0 Architectural metal work ................................. 3446 28.2 16.7 8.3 6.2 8.5 16.4 8.0 6.0 8.4 Prefabricated metal buildings ......................... 3448 26.2 19.6 8.5 5.6 11.1 19.2 8.5 5.6 10.8 Miscellaneous metal work .............................. 3449 12.6 13.8 7.6 5.0 6.2 13.5 7.4 4.9 6.2
Screw machine products, bolts, etc. ................ 345 100.2 12.9 5.6 3.3 7.3 12.3 5.4 3.2 6.9 Screw machine products ................................ 3451 52.2 13.2 6.0 3.8 7.2 12.4 5.8 3.6 6.6 Bolts, nuts, rivets, and washers ...................... 3452 48.0 12.6 5.1 2.9 7.5 12.1 4.9 2.8 7.2
Metal forgings and stampings ......................... 346 251.5 20.5 8.0 4.5 12.5 17.8 7.1 4.1 10.7 Iron and steel forgings .................................... 3462 30.9 19.7 9.4 4.8 10.2 18.8 9.2 4.6 9.6 Nonferrous forgings ........................................ 3463 7.0 8.7 3.4 2.3 5.3 8.5 3.3 2.2 5.2 Automotive stampings .................................... 3465 115.3 23.8 8.3 4.7 15.6 19.2 6.8 4.0 12.4 Metal stampings, n.e.c. .................................. 3469 93.5 17.8 7.7 4.5 10.1 16.8 7.1 4.3 9.7
Metal services, n.e.c. ....................................... 347 129.0 14.3 6.9 4.1 7.4 13.5 6.5 3.8 6.9 Plating and polishing ...................................... 3471 79.2 13.8 6.4 4.0 7.3 12.8 6.0 3.7 6.8
See footnotes at end of table.
5
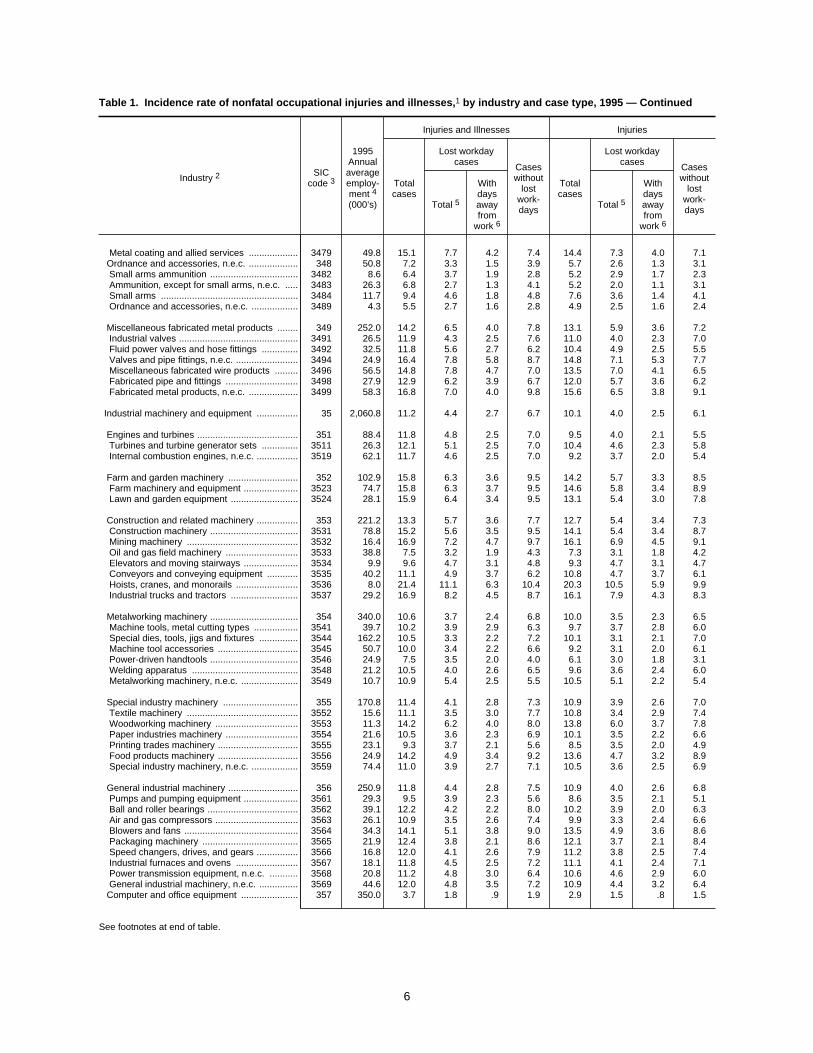
Table 1. Incidence rate of nonfatal occupational injuries and illnesses,1 by industry and case type, 1995 — Continued
Industry 2 SICcode 3
1995Annualaverageemploy-ment 4(000’s)
Injuries and Illnesses Injuries
Totalcases
Lost workdaycases Cases
withoutlost
work-days
Totalcases
Lost workdaycases Cases
withoutlost
work-daysTotal 5
Withdaysawayfrom
work 6
Total 5
Withdaysawayfrom
work 6
Metal coating and allied services ................... 3479 49.8 15.1 7.7 4.2 7.4 14.4 7.3 4.0 7.1 Ordnance and accessories, n.e.c. ................... 348 50.8 7.2 3.3 1.5 3.9 5.7 2.6 1.3 3.1 Small arms ammunition .................................. 3482 8.6 6.4 3.7 1.9 2.8 5.2 2.9 1.7 2.3 Ammunition, except for small arms, n.e.c. ..... 3483 26.3 6.8 2.7 1.3 4.1 5.2 2.0 1.1 3.1 Small arms ..................................................... 3484 11.7 9.4 4.6 1.8 4.8 7.6 3.6 1.4 4.1 Ordnance and accessories, n.e.c. .................. 3489 4.3 5.5 2.7 1.6 2.8 4.9 2.5 1.6 2.4
Miscellaneous fabricated metal products ........ 349 252.0 14.2 6.5 4.0 7.8 13.1 5.9 3.6 7.2 Industrial valves .............................................. 3491 26.5 11.9 4.3 2.5 7.6 11.0 4.0 2.3 7.0 Fluid power valves and hose fittings .............. 3492 32.5 11.8 5.6 2.7 6.2 10.4 4.9 2.5 5.5 Valves and pipe fittings, n.e.c. ........................ 3494 24.9 16.4 7.8 5.8 8.7 14.8 7.1 5.3 7.7 Miscellaneous fabricated wire products ......... 3496 56.5 14.8 7.8 4.7 7.0 13.5 7.0 4.1 6.5 Fabricated pipe and fittings ............................ 3498 27.9 12.9 6.2 3.9 6.7 12.0 5.7 3.6 6.2 Fabricated metal products, n.e.c. ................... 3499 58.3 16.8 7.0 4.0 9.8 15.6 6.5 3.8 9.1
Industrial machinery and equipment ................ 35 2,060.8 11.2 4.4 2.7 6.7 10.1 4.0 2.5 6.1
Engines and turbines ....................................... 351 88.4 11.8 4.8 2.5 7.0 9.5 4.0 2.1 5.5 Turbines and turbine generator sets .............. 3511 26.3 12.1 5.1 2.5 7.0 10.4 4.6 2.3 5.8 Internal combustion engines, n.e.c. ................ 3519 62.1 11.7 4.6 2.5 7.0 9.2 3.7 2.0 5.4
Farm and garden machinery ........................... 352 102.9 15.8 6.3 3.6 9.5 14.2 5.7 3.3 8.5 Farm machinery and equipment ..................... 3523 74.7 15.8 6.3 3.7 9.5 14.6 5.8 3.4 8.9 Lawn and garden equipment .......................... 3524 28.1 15.9 6.4 3.4 9.5 13.1 5.4 3.0 7.8
Construction and related machinery ................ 353 221.2 13.3 5.7 3.6 7.7 12.7 5.4 3.4 7.3 Construction machinery .................................. 3531 78.8 15.2 5.6 3.5 9.5 14.1 5.4 3.4 8.7 Mining machinery ........................................... 3532 16.4 16.9 7.2 4.7 9.7 16.1 6.9 4.5 9.1 Oil and gas field machinery ............................ 3533 38.8 7.5 3.2 1.9 4.3 7.3 3.1 1.8 4.2 Elevators and moving stairways ..................... 3534 9.9 9.6 4.7 3.1 4.8 9.3 4.7 3.1 4.7 Conveyors and conveying equipment ............ 3535 40.2 11.1 4.9 3.7 6.2 10.8 4.7 3.7 6.1 Hoists, cranes, and monorails ........................ 3536 8.0 21.4 11.1 6.3 10.4 20.3 10.5 5.9 9.9 Industrial trucks and tractors .......................... 3537 29.2 16.9 8.2 4.5 8.7 16.1 7.9 4.3 8.3
Metalworking machinery .................................. 354 340.0 10.6 3.7 2.4 6.8 10.0 3.5 2.3 6.5 Machine tools, metal cutting types ................. 3541 39.7 10.2 3.9 2.9 6.3 9.7 3.7 2.8 6.0 Special dies, tools, jigs and fixtures ............... 3544 162.2 10.5 3.3 2.2 7.2 10.1 3.1 2.1 7.0 Machine tool accessories ............................... 3545 50.7 10.0 3.4 2.2 6.6 9.2 3.1 2.0 6.1 Power-driven handtools .................................. 3546 24.9 7.5 3.5 2.0 4.0 6.1 3.0 1.8 3.1 Welding apparatus ......................................... 3548 21.2 10.5 4.0 2.6 6.5 9.6 3.6 2.4 6.0 Metalworking machinery, n.e.c. ...................... 3549 10.7 10.9 5.4 2.5 5.5 10.5 5.1 2.2 5.4
Special industry machinery ............................. 355 170.8 11.4 4.1 2.8 7.3 10.9 3.9 2.6 7.0 Textile machinery ........................................... 3552 15.6 11.1 3.5 3.0 7.7 10.8 3.4 2.9 7.4 Woodworking machinery ................................ 3553 11.3 14.2 6.2 4.0 8.0 13.8 6.0 3.7 7.8 Paper industries machinery ............................ 3554 21.6 10.5 3.6 2.3 6.9 10.1 3.5 2.2 6.6 Printing trades machinery ............................... 3555 23.1 9.3 3.7 2.1 5.6 8.5 3.5 2.0 4.9 Food products machinery ............................... 3556 24.9 14.2 4.9 3.4 9.2 13.6 4.7 3.2 8.9 Special industry machinery, n.e.c. .................. 3559 74.4 11.0 3.9 2.7 7.1 10.5 3.6 2.5 6.9
General industrial machinery ........................... 356 250.9 11.8 4.4 2.8 7.5 10.9 4.0 2.6 6.8 Pumps and pumping equipment ..................... 3561 29.3 9.5 3.9 2.3 5.6 8.6 3.5 2.1 5.1 Ball and roller bearings ................................... 3562 39.1 12.2 4.2 2.2 8.0 10.2 3.9 2.0 6.3 Air and gas compressors ................................ 3563 26.1 10.9 3.5 2.6 7.4 9.9 3.3 2.4 6.6 Blowers and fans ............................................ 3564 34.3 14.1 5.1 3.8 9.0 13.5 4.9 3.6 8.6 Packaging machinery ..................................... 3565 21.9 12.4 3.8 2.1 8.6 12.1 3.7 2.1 8.4 Speed changers, drives, and gears ................ 3566 16.8 12.0 4.1 2.6 7.9 11.2 3.8 2.5 7.4 Industrial furnaces and ovens ........................ 3567 18.1 11.8 4.5 2.5 7.2 11.1 4.1 2.4 7.1 Power transmission equipment, n.e.c. ........... 3568 20.8 11.2 4.8 3.0 6.4 10.6 4.6 2.9 6.0 General industrial machinery, n.e.c. ............... 3569 44.6 12.0 4.8 3.5 7.2 10.9 4.4 3.2 6.4 Computer and office equipment ...................... 357 350.0 3.7 1.8 .9 1.9 2.9 1.5 .8 1.5
See footnotes at end of table.
6

Table 1. Incidence rate of nonfatal occupational injuries and illnesses,1 by industry and case type, 1995 — Continued
Industry 2 SICcode 3
1995Annualaverageemploy-ment 4(000’s)
Injuries and Illnesses Injuries
Totalcases
Lost workdaycases Cases
withoutlost
work-days
Totalcases
Lost workdaycases Cases
withoutlost
work-daysTotal 5
Withdaysawayfrom
work 6
Total 5
Withdaysawayfrom
work 6
Electronic computers ...................................... 3571 192.0 3.0 1.4 0.7 1.6 2.3 1.1 0.6 1.2 Computer storage devices ............................. 3572 40.5 4.0 1.8 1.0 2.2 3.0 1.3 .8 1.6 Computer peripheral equipment, n.e.c. .......... 3577 60.4 4.6 2.4 1.1 2.2 3.8 1.9 .9 1.9 Office machines, n.e.c. ................................... 3579 26.9 6.5 3.4 1.7 3.1 5.3 2.7 1.5 2.6
Refrigeration and service machinery ............... 358 201.6 16.5 7.3 3.5 9.2 13.8 6.2 3.3 7.6 Automatic vending machines ......................... 3581 7.9 14.3 6.0 3.3 8.3 13.1 5.3 3.0 7.8 Refrigeration and heating equipment ............. 3585 139.0 17.3 7.7 3.6 9.5 13.9 6.3 3.3 7.6 Measuring and dispensing pumps .................. 3586 5.5 14.6 5.8 2.4 8.8 10.6 4.1 1.8 6.4 Service industry machinery, n.e.c. ................. 3589 43.1 14.8 6.6 3.6 8.2 13.6 6.2 3.4 7.4
Industrial machinery, n.e.c. ............................. 359 335.0 12.4 4.9 3.4 7.5 11.7 4.6 3.2 7.1 Carburetors, pistons, rings, valves ................. 3592 22.3 13.4 5.4 3.1 8.0 10.7 4.4 2.5 6.2 Fluid power cylinders and actuators ............... 3593 18.8 16.0 6.1 4.2 10.0 14.7 5.5 4.0 9.2 Fluid power pumps and motors ...................... 3594 26.5 10.8 4.9 3.6 5.9 9.7 4.5 3.4 5.2 Scales and balances, except laboratory ......... 3596 6.6 9.3 4.7 2.6 4.7 8.4 4.1 2.4 4.3 Industrial machinery, n.e.c. ............................ 3599 261.0 12.3 4.7 3.3 7.6 11.8 4.5 3.2 7.3
Electronic and other electric equipment ........... 36 1,624.0 7.6 3.3 1.7 4.3 6.0 2.6 1.4 3.4
Electric distribution equipment ........................ 361 83.7 9.2 4.1 2.1 5.1 7.8 3.4 1.7 4.3 Transformers, except electronic ..................... 3612 41.2 10.6 4.6 2.4 6.0 8.9 3.9 1.9 5.0 Switchgear and switchboard apparatus ......... 3613 42.5 7.8 3.6 1.7 4.2 6.7 3.0 1.5 3.7
Electrical industrial apparatus ......................... 362 157.4 8.6 3.7 1.9 5.0 7.0 2.9 1.5 4.1 Motors and generators ................................... 3621 78.9 10.9 4.7 2.3 6.2 8.7 3.6 1.8 5.2 Carbon and graphite products ........................ 3624 10.0 9.5 4.9 2.2 4.5 8.4 4.5 2.0 3.9 Relays and industrial controls ........................ 3625 58.8 6.0 2.2 1.3 3.8 4.8 1.7 1.1 3.1 Electrical industrial apparatus, n.e.c. .............. 3629 9.7 5.0 2.9 1.4 2.1 4.0 2.2 1.2 1.7
Household appliances ..................................... 363 120.4 15.3 6.3 2.6 9.0 11.3 4.6 2.2 6.7 Household cooking equipment ....................... 3631 21.4 15.6 5.6 1.8 10.0 12.5 4.4 1.5 8.1 Household refrigerators and freezers ............. 3632 29.7 15.4 6.6 2.3 8.8 11.2 4.5 1.8 6.7 Household laundry equipment ........................ 3633 16.7 20.0 8.7 3.0 11.3 13.5 5.4 2.1 8.0 Electric housewares and fans ........................ 3634 28.6 13.5 5.5 3.1 8.0 9.1 3.9 2.6 5.2 Household vacuum cleaners .......................... 3635 10.8 7.9 3.5 2.0 4.4 6.8 3.1 1.7 3.7 Household appliances, n.e.c. ......................... 3639 13.1 18.4 8.1 4.1 10.4 14.8 6.7 3.5 8.1
Electric lighting and wiring equipment ............. 364 178.4 9.9 4.2 2.3 5.7 8.7 3.6 2.1 5.1 Electric lamps ................................................. 3641 22.8 7.6 3.2 2.1 4.4 6.9 2.7 1.9 4.2 Current-carrying wiring devices ...................... 3643 62.0 8.9 3.8 2.2 5.1 8.0 3.4 2.1 4.6 Noncurrent-carrying wiring devices ................ 3644 17.9 11.9 5.7 3.1 6.2 10.8 5.1 2.9 5.7 Residential lighting fixtures ............................. 3645 19.7 11.0 3.7 2.5 7.3 10.4 3.4 2.3 7.0 Commercial lighting fixtures ........................... 3646 25.6 9.3 4.7 2.2 4.6 8.3 3.9 2.0 4.3 Vehicular lighting equipment .......................... 3647 18.0 13.4 4.7 2.2 8.7 10.7 3.6 1.7 7.1 Lighting equipment, n.e.c. .............................. 3648 12.5 10.5 5.2 2.3 5.3 7.8 3.9 1.8 3.9
Household audio and video equipment ........... 365 83.0 8.0 3.5 1.7 4.5 6.9 3.0 1.5 3.9 Household audio and video equipment .......... 3651 55.4 9.3 4.1 1.9 5.2 8.0 3.4 1.6 4.5 Prerecorded records and tapes ...................... 3652 27.6 5.4 2.3 1.4 3.1 4.7 2.0 1.3 2.7
Communications equipment ............................ 366 263.6 4.1 2.0 1.0 2.1 3.3 1.6 .8 1.7 Telephone and telegraph apparatus .............. 3661 112.2 3.1 1.4 .8 1.6 2.4 1.1 .6 1.3 Radio and TV communications equipment ..... 3663 123.7 4.6 2.3 1.2 2.3 3.8 1.9 1.0 1.9 Communications equipment, n.e.c. ................ 3669 27.6 5.5 2.6 1.3 2.9 4.8 2.1 1.1 2.7
Electronic components and accessories ......... 367 581.4 5.6 2.4 1.4 3.1 4.4 1.9 1.1 2.5 Electron tubes ................................................ 3671 24.6 10.0 4.6 3.6 5.4 8.3 3.8 3.2 4.5 Printed circuit boards ...................................... 3672 117.6 6.5 2.9 1.7 3.6 5.7 2.5 1.4 3.2 Semiconductors and related devices ............. 3674 235.2 3.8 1.6 .9 2.2 2.7 1.1 .7 1.5 Electronic capacitors ...................................... 3675 21.6 5.6 2.4 1.3 3.2 4.7 2.0 1.1 2.7
See footnotes at end of table.
7

Table 1. Incidence rate of nonfatal occupational injuries and illnesses,1 by industry and case type, 1995 — Continued
Industry 2 SICcode 3
1995Annualaverageemploy-ment 4(000’s)
Injuries and Illnesses Injuries
Totalcases
Lost workdaycases Cases
withoutlost
work-days
Totalcases
Lost workdaycases Cases
withoutlost
work-daysTotal 5
Withdaysawayfrom
work 6
Total 5
Withdaysawayfrom
work 6
Electronic resistors ......................................... 3676 10.7 7.2 2.1 1.6 5.1 5.8 1.7 1.4 4.1 Electronic coils and transformers ................... 3677 18.6 11.2 3.8 2.4 7.4 8.5 2.7 1.8 5.8 Electronic connectors ..................................... 3678 17.2 7.1 3.6 1.7 3.5 6.3 3.1 1.6 3.2 Electronic components, n.e.c. ........................ 3679 135.8 6.1 2.8 1.5 3.3 4.8 2.1 1.2 2.7
Miscellaneous electrical equipment andsupplies ........................................................ 369 156.2 10.4 4.7 2.1 5.8 7.2 3.4 1.6 3.8
Storage batteries ............................................ 3691 27.0 11.8 4.5 1.7 7.3 8.0 3.3 1.3 4.7 Primary batteries, dry and wet ........................ 3692 11.9 9.3 4.7 2.9 4.6 7.6 3.9 2.4 3.7 Engine electrical equipment ........................... 3694 70.6 12.4 5.4 2.5 7.0 7.8 3.7 1.8 4.1 Magnetic and optical recording media ............ 3695 17.0 5.6 3.7 1.5 1.9 4.1 2.6 1.1 1.4 Electrical equipment and supplies, n.e.c. ....... 3699 29.6 7.5 3.4 1.6 4.1 6.8 3.2 1.5 3.6
Transportation equipment ................................ 37 1,783.0 18.6 7.9 3.9 10.6 14.2 6.4 3.2 7.9
Motor vehicles and equipment ........................ 371 967.6 23.2 9.8 4.8 13.4 17.0 7.5 3.9 9.5 Motor vehicles and car bodies ........................ 3711 358.9 31.5 12.6 5.8 18.9 21.1 8.9 4.3 12.2 Truck and bus bodies ..................................... 3713 38.3 22.5 8.0 5.0 14.5 20.5 7.4 4.7 13.1 Motor vehicle parts and accessories .............. 3714 511.9 17.5 8.0 4.1 9.5 13.3 6.4 3.5 6.9 Truck trailers ................................................... 3715 39.3 31.2 12.5 6.7 18.7 28.8 11.1 6.0 17.6 Motor homes .................................................. 3716 19.2 14.3 7.7 2.1 6.6 12.6 6.8 1.9 5.7
Aircraft and parts ............................................. 372 449.0 8.8 3.6 1.7 5.3 7.0 3.0 1.5 4.0 Aircraft ............................................................ 3721 243.8 8.7 3.4 1.9 5.3 6.4 2.8 1.5 3.7 Aircraft engines and engine parts ................... 3724 92.2 8.3 3.4 1.0 4.9 7.1 3.0 .9 4.1 Aircraft parts and equipment, n.e.c. ............... 3728 113.0 9.5 4.1 2.0 5.4 8.1 3.6 1.8 4.5
Ship and boat building and repairing ............... 373 158.3 27.3 12.9 5.9 14.5 24.0 11.5 5.5 12.5 Ship building and repairing ............................. 3731 104.3 32.7 16.0 6.7 16.7 28.3 14.2 6.2 14.1 Boat building and repairing ............................. 3732 53.9 17.3 7.0 4.5 10.3 15.9 6.5 4.2 9.4
Railroad equipment ......................................... 374 36.5 16.4 6.9 3.2 9.4 14.8 6.5 3.0 8.3
Motorcycles, bicycles, and parts ..................... 375 20.8 18.6 6.9 4.7 11.7 13.8 5.1 3.6 8.6
Guided missiles, space vehicles, parts ........... 376 98.0 4.0 1.8 1.0 2.2 3.3 1.5 .8 1.7 Guided missiles and space vehicles .............. 3761 69.1 3.7 1.5 .9 2.1 2.9 1.3 .7 1.6 Space vehicle equipment, n.e.c. .................... 3769 11.9 5.8 3.0 1.6 2.8 5.4 2.9 1.6 2.6
Miscellaneous transportation equipment ......... 379 52.8 16.7 7.4 4.3 9.3 15.2 6.8 4.0 8.4 Travel trailers and campers ............................ 3792 22.2 22.7 9.3 5.3 13.3 20.7 8.6 4.9 12.1 Tanks and tank components .......................... 3795 7.9 4.8 2.0 1.3 2.8 4.1 1.8 1.2 2.3 Transportation equipment, n.e.c. .................... 3799 22.7 15.3 7.5 4.5 7.7 13.9 6.8 4.1 7.1
Instruments and related products ..................... 38 838.0 5.3 2.4 1.2 2.8 4.0 1.8 1.0 2.2
Search and navigation equipment ................... 381 158.7 3.2 1.2 .8 2.0 2.2 .9 .6 1.3
Measuring and controlling devices .................. 382 286.2 5.3 2.5 1.3 2.9 4.2 1.9 1.0 2.3 Laboratory apparatus and furniture ................ 3821 9.6 8.0 3.3 1.8 4.7 7.1 2.9 1.6 4.2 Environmental controls ................................... 3822 43.3 7.0 3.4 1.8 3.6 5.0 2.6 1.4 2.4 Process control instruments ........................... 3823 64.0 5.4 2.5 1.3 2.9 4.6 1.9 1.0 2.6 Fluid meters and counting devices ................. 3824 11.8 7.2 2.8 1.5 4.4 6.3 2.3 1.3 4.0 Instruments to measure electricity .................. 3825 70.8 4.1 1.8 1.0 2.3 3.0 1.3 .7 1.7 Analytical instruments .................................... 3826 27.6 5.3 2.7 1.3 2.6 3.8 1.8 1.1 2.0 Optical instruments and lenses ...................... 3827 18.2 4.5 2.0 1.1 2.5 4.1 1.9 1.0 2.3 Measuring and controlling devices, n.e.c. ...... 3829 40.9 4.5 2.2 1.3 2.2 3.7 1.8 1.1 1.9 Medical instruments and supplies ................... 384 263.8 6.2 2.9 1.4 3.2 4.9 2.2 1.2 2.6 Surgical and medical instruments .................. 3841 100.4 6.5 3.3 1.6 3.2 4.8 2.3 1.3 2.5 Surgical appliances and supplies ................... 3842 94.6 7.0 3.4 1.5 3.6 5.7 2.6 1.2 3.1 Dental equipment and supplies ...................... 3843 13.9 6.5 3.0 1.9 3.5 5.5 2.7 1.7 2.8
See footnotes at end of table.
8
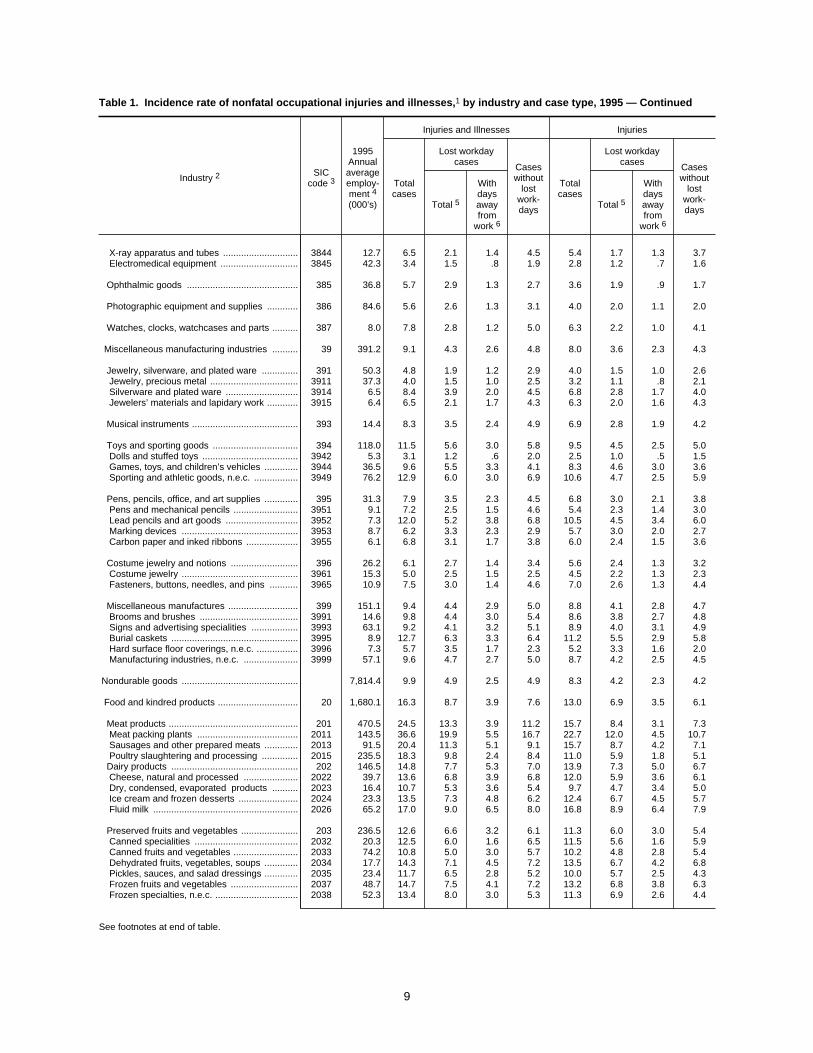
Table 1. Incidence rate of nonfatal occupational injuries and illnesses,1 by industry and case type, 1995 — Continued
Industry 2 SICcode 3
1995Annualaverageemploy-ment 4(000’s)
Injuries and Illnesses Injuries
Totalcases
Lost workdaycases Cases
withoutlost
work-days
Totalcases
Lost workdaycases Cases
withoutlost
work-daysTotal 5
Withdaysawayfrom
work 6
Total 5
Withdaysawayfrom
work 6
X-ray apparatus and tubes ............................. 3844 12.7 6.5 2.1 1.4 4.5 5.4 1.7 1.3 3.7 Electromedical equipment .............................. 3845 42.3 3.4 1.5 .8 1.9 2.8 1.2 .7 1.6
Ophthalmic goods ........................................... 385 36.8 5.7 2.9 1.3 2.7 3.6 1.9 .9 1.7
Photographic equipment and supplies ............ 386 84.6 5.6 2.6 1.3 3.1 4.0 2.0 1.1 2.0
Watches, clocks, watchcases and parts .......... 387 8.0 7.8 2.8 1.2 5.0 6.3 2.2 1.0 4.1
Miscellaneous manufacturing industries .......... 39 391.2 9.1 4.3 2.6 4.8 8.0 3.6 2.3 4.3
Jewelry, silverware, and plated ware .............. 391 50.3 4.8 1.9 1.2 2.9 4.0 1.5 1.0 2.6 Jewelry, precious metal .................................. 3911 37.3 4.0 1.5 1.0 2.5 3.2 1.1 .8 2.1 Silverware and plated ware ............................ 3914 6.5 8.4 3.9 2.0 4.5 6.8 2.8 1.7 4.0 Jewelers’ materials and lapidary work ............ 3915 6.4 6.5 2.1 1.7 4.3 6.3 2.0 1.6 4.3
Musical instruments ......................................... 393 14.4 8.3 3.5 2.4 4.9 6.9 2.8 1.9 4.2
Toys and sporting goods ................................. 394 118.0 11.5 5.6 3.0 5.8 9.5 4.5 2.5 5.0 Dolls and stuffed toys ..................................... 3942 5.3 3.1 1.2 .6 2.0 2.5 1.0 .5 1.5 Games, toys, and children’s vehicles ............. 3944 36.5 9.6 5.5 3.3 4.1 8.3 4.6 3.0 3.6 Sporting and athletic goods, n.e.c. ................. 3949 76.2 12.9 6.0 3.0 6.9 10.6 4.7 2.5 5.9
Pens, pencils, office, and art supplies ............. 395 31.3 7.9 3.5 2.3 4.5 6.8 3.0 2.1 3.8 Pens and mechanical pencils ......................... 3951 9.1 7.2 2.5 1.5 4.6 5.4 2.3 1.4 3.0 Lead pencils and art goods ............................ 3952 7.3 12.0 5.2 3.8 6.8 10.5 4.5 3.4 6.0 Marking devices ............................................. 3953 8.7 6.2 3.3 2.3 2.9 5.7 3.0 2.0 2.7 Carbon paper and inked ribbons .................... 3955 6.1 6.8 3.1 1.7 3.8 6.0 2.4 1.5 3.6
Costume jewelry and notions .......................... 396 26.2 6.1 2.7 1.4 3.4 5.6 2.4 1.3 3.2 Costume jewelry ............................................. 3961 15.3 5.0 2.5 1.5 2.5 4.5 2.2 1.3 2.3 Fasteners, buttons, needles, and pins ........... 3965 10.9 7.5 3.0 1.4 4.6 7.0 2.6 1.3 4.4
Miscellaneous manufactures ........................... 399 151.1 9.4 4.4 2.9 5.0 8.8 4.1 2.8 4.7 Brooms and brushes ...................................... 3991 14.6 9.8 4.4 3.0 5.4 8.6 3.8 2.7 4.8 Signs and advertising specialities .................. 3993 63.1 9.2 4.1 3.2 5.1 8.9 4.0 3.1 4.9 Burial caskets ................................................. 3995 8.9 12.7 6.3 3.3 6.4 11.2 5.5 2.9 5.8 Hard surface floor coverings, n.e.c. ................ 3996 7.3 5.7 3.5 1.7 2.3 5.2 3.3 1.6 2.0 Manufacturing industries, n.e.c. ..................... 3999 57.1 9.6 4.7 2.7 5.0 8.7 4.2 2.5 4.5
Nondurable goods ............................................. 7,814.4 9.9 4.9 2.5 4.9 8.3 4.2 2.3 4.2
Food and kindred products ............................... 20 1,680.1 16.3 8.7 3.9 7.6 13.0 6.9 3.5 6.1
Meat products .................................................. 201 470.5 24.5 13.3 3.9 11.2 15.7 8.4 3.1 7.3 Meat packing plants ....................................... 2011 143.5 36.6 19.9 5.5 16.7 22.7 12.0 4.5 10.7 Sausages and other prepared meats ............. 2013 91.5 20.4 11.3 5.1 9.1 15.7 8.7 4.2 7.1 Poultry slaughtering and processing .............. 2015 235.5 18.3 9.8 2.4 8.4 11.0 5.9 1.8 5.1 Dairy products ................................................. 202 146.5 14.8 7.7 5.3 7.0 13.9 7.3 5.0 6.7 Cheese, natural and processed ..................... 2022 39.7 13.6 6.8 3.9 6.8 12.0 5.9 3.6 6.1 Dry, condensed, evaporated products .......... 2023 16.4 10.7 5.3 3.6 5.4 9.7 4.7 3.4 5.0 Ice cream and frozen desserts ....................... 2024 23.3 13.5 7.3 4.8 6.2 12.4 6.7 4.5 5.7 Fluid milk ........................................................ 2026 65.2 17.0 9.0 6.5 8.0 16.8 8.9 6.4 7.9
Preserved fruits and vegetables ...................... 203 236.5 12.6 6.6 3.2 6.1 11.3 6.0 3.0 5.4 Canned specialities ........................................ 2032 20.3 12.5 6.0 1.6 6.5 11.5 5.6 1.6 5.9 Canned fruits and vegetables ......................... 2033 74.2 10.8 5.0 3.0 5.7 10.2 4.8 2.8 5.4 Dehydrated fruits, vegetables, soups ............. 2034 17.7 14.3 7.1 4.5 7.2 13.5 6.7 4.2 6.8 Pickles, sauces, and salad dressings ............. 2035 23.4 11.7 6.5 2.8 5.2 10.0 5.7 2.5 4.3 Frozen fruits and vegetables .......................... 2037 48.7 14.7 7.5 4.1 7.2 13.2 6.8 3.8 6.3 Frozen specialties, n.e.c. ................................ 2038 52.3 13.4 8.0 3.0 5.3 11.3 6.9 2.6 4.4
See footnotes at end of table.
9

Table 1. Incidence rate of nonfatal occupational injuries and illnesses,1 by industry and case type, 1995 — Continued
Industry 2 SICcode 3
1995Annualaverageemploy-ment 4(000’s)
Injuries and Illnesses Injuries
Totalcases
Lost workdaycases Cases
withoutlost
work-days
Totalcases
Lost workdaycases Cases
withoutlost
work-daysTotal 5
Withdaysawayfrom
work 6
Total 5
Withdaysawayfrom
work 6
Grain mill products .......................................... 204 128.1 10.7 5.4 3.6 5.3 10.1 5.1 3.4 4.9 Flour and other grain mill products ................. 2041 19.6 8.4 4.6 2.6 3.8 7.9 4.3 2.4 3.6 Cereal breakfast foods ................................... 2043 19.7 9.1 4.8 3.2 4.3 7.9 4.4 3.0 3.5 Rice milling ..................................................... 2044 5.1 11.2 7.4 4.9 3.8 11.0 7.4 4.8 3.6 Prepared flour mixes and doughs .................. 2045 13.5 18.2 8.7 6.8 9.5 17.0 8.0 6.4 9.0 Wet corn milling .............................................. 2046 10.0 9.8 4.6 3.5 5.2 9.6 4.5 3.3 5.1 Dog and cat food ............................................ 2047 17.9 11.4 6.3 3.7 5.1 10.8 6.0 3.5 4.8 Prepared feeds, n.e.c. .................................... 2048 42.3 10.0 4.6 3.1 5.4 9.6 4.4 2.9 5.2
Bakery products .............................................. 205 211.4 11.7 5.9 3.2 5.8 10.5 5.3 3.0 5.2 Bread, cake, and related products ................. 2051 148.5 11.1 5.7 3.0 5.4 10.1 5.1 2.8 5.0 Cookies and crackers ..................................... 2052 52.5 13.1 6.6 4.1 6.5 11.3 5.7 3.6 5.6 Frozen bakery products, except bread ........... 2053 10.4 13.9 5.7 2.0 8.2 11.8 4.9 1.9 6.9
Sugar and confectionery products ................... 206 99.9 13.6 6.9 3.5 6.7 12.1 5.9 3.3 6.2 Raw cane sugar ............................................. 2061 5.5 18.2 7.3 6.2 10.9 18.1 7.3 6.2 10.8 Beet sugar ...................................................... 2063 9.2 14.9 7.1 4.3 7.9 14.8 7.0 4.2 7.8 Candy and other confectionery products ........ 2064 53.2 13.8 7.4 2.9 6.4 11.6 5.9 2.6 5.7 Chocolate and cocoa products ....................... 2066 13.2 9.1 4.5 2.1 4.5 8.2 4.0 2.1 4.1
Fats and oils .................................................... 207 31.1 10.7 5.9 3.6 4.8 10.3 5.7 3.5 4.7 Animal and marine fats and oils ..................... 2077 8.2 17.1 9.3 5.3 7.8 16.4 8.8 4.9 7.6 Edible fats and oils, n.e.c. .............................. 2079 9.5 8.9 5.4 3.7 3.5 8.6 5.2 3.6 3.4
Beverages ....................................................... 208 175.8 15.6 8.5 5.3 7.0 15.1 8.4 5.2 6.7 Malt beverages ............................................... 2082 36.7 13.1 5.3 2.5 7.8 12.1 5.1 2.4 7.0 Wines, brandy, and brandy spirits .................. 2084 18.8 11.5 5.5 3.3 6.1 10.7 5.3 3.3 5.3 Distilled and blended liquors .......................... 2085 8.2 13.7 7.2 4.4 6.5 12.8 6.9 4.1 5.9 Bottled and canned soft drinks ....................... 2086 91.7 19.1 11.3 7.4 7.8 18.8 11.1 7.3 7.7 Flavoring extracts and syrups, n.e.c. .............. 2087 19.0 7.0 4.2 2.6 2.8 6.6 4.0 2.4 2.6
Miscellaneous food and kindred products ....... 209 180.4 12.4 6.7 3.9 5.7 10.8 5.9 3.5 5.0 Fresh or frozen prepared fish ......................... 2092 44.9 15.3 7.9 5.9 7.3 12.9 6.7 5.2 6.2 Roasted coffee ............................................... 2095 9.6 9.1 4.6 3.4 4.5 8.9 4.5 3.3 4.5 Potato chips and similar snacks ..................... 2096 35.4 13.9 7.7 3.4 6.2 10.8 6.0 2.9 4.8 Food preparations, n.e.c. ............................... 2099 67.0 10.8 6.0 2.7 4.8 10.1 5.6 2.6 4.5
Tobacco products ............................................. 21 40.8 5.6 2.6 1.8 3.0 5.2 2.5 1.7 2.7
Cigarettes ........................................................ 211 28.4 4.3 1.8 1.3 2.4 3.9 1.7 1.3 2.2
Chewing and smoking tobacco ....................... 213 3.1 8.0 3.7 2.2 4.3 6.4 2.9 1.9 3.5
Textile mill products .......................................... 22 666.5 8.2 4.1 1.5 4.1 7.0 3.6 1.4 3.4
Broadwoven fabric mills, cotton ....................... 221 78.3 5.8 3.2 .5 2.6 5.1 2.9 .5 2.2
Broadwoven fabric mills, manmade ................ 222 70.6 6.1 2.9 .8 3.2 5.7 2.8 .8 2.9
Broadwoven fabric mills, wool ......................... 223 15.4 7.5 4.0 1.5 3.5 6.5 3.4 1.3 3.0
Narrow fabric mills ........................................... 224 23.0 9.5 4.4 2.9 5.1 9.0 4.2 2.8 4.8
Knitting mills .................................................... 225 196.7 8.2 4.1 1.6 4.1 5.8 3.0 1.3 2.8 Women’s hosiery, except socks ..................... 2251 22.2 3.9 1.9 .9 2.0 2.8 1.3 .7 1.5 Hosiery, n.e.c. ................................................ 2252 41.7 10.0 5.8 2.4 4.2 6.3 3.4 1.6 2.8 Knit outerwear mills ........................................ 2253 62.0 5.8 3.3 1.0 2.4 4.5 2.7 .9 1.9 Knit underwear mills ....................................... 2254 22.4 17.2 5.6 2.3 11.6 8.6 3.7 1.8 4.8 Weft knit fabric mills ....................................... 2257 27.4 8.2 4.0 1.4 4.1 7.2 3.7 1.3 3.5 Lace and warp knit fabric mills ....................... 2258 17.8 8.2 3.8 2.1 4.4 7.6 3.7 2.1 3.9 Knitting mills, n.e.c. ........................................ 2259 3.2 4.4 2.5 1.9 1.9 4.0 2.5 1.8 1.5
See footnotes at end of table.
10

Table 1. Incidence rate of nonfatal occupational injuries and illnesses,1 by industry and case type, 1995 — Continued
Industry 2 SICcode 3
1995Annualaverageemploy-ment 4(000’s)
Injuries and Illnesses Injuries
Totalcases
Lost workdaycases Cases
withoutlost
work-days
Totalcases
Lost workdaycases Cases
withoutlost
work-daysTotal 5
Withdaysawayfrom
work 6
Total 5
Withdaysawayfrom
work 6
Textile finishing, except wool ........................... 226 71.9 7.8 4.0 2.0 3.7 7.2 3.8 2.0 3.4 Finishing plants, cotton ................................... 2261 33.8 8.0 4.3 1.5 3.8 7.1 3.9 1.5 3.2 Finishing plants, manmade ............................ 2262 24.2 6.2 3.2 2.2 3.0 5.9 3.1 2.1 2.8 Finishing plants, n.e.c. .................................... 2269 13.9 10.2 5.1 3.1 5.1 10.0 5.0 3.0 5.0
Carpets and rugs ............................................. 227 62.8 10.0 5.5 1.6 4.5 8.9 4.7 1.4 4.2
Yarn and thread mills ...................................... 228 94.7 9.1 3.9 1.2 5.2 7.6 3.5 1.1 4.1 Yarn spinning mills ......................................... 2281 72.1 8.8 4.1 1.2 4.8 7.7 3.6 1.1 4.1 Throwing and winding mills ............................ 2282 15.4 10.5 3.2 1.0 7.3 6.9 2.9 .9 4.0 Thread mills .................................................... 2284 7.2 9.1 3.5 1.3 5.6 8.5 3.3 1.2 5.2
Miscellaneous textile goods ............................ 229 53.1 12.0 5.9 3.3 6.0 11.2 5.6 3.1 5.6 Coated fabrics, not rubberized ....................... 2295 8.9 16.6 7.7 5.9 8.9 16.0 7.6 5.8 8.4 Tire cord and fabrics ....................................... 2296 6.6 11.8 6.3 3.2 5.5 11.1 5.9 2.9 5.1 Nonwoven fabrics ........................................... 2297 12.0 7.9 4.1 1.6 3.8 7.2 3.8 1.5 3.4
Apparel and other textile products .................... 23 933.1 8.2 3.6 2.0 4.6 6.3 2.7 1.6 3.6
Men’s and boys’ suits and coats ..................... 231 36.0 7.7 3.7 2.4 4.0 5.7 2.7 1.7 3.0
Men’s and boys’ furnishings ............................ 232 251.9 10.4 4.5 2.5 5.9 7.1 3.1 1.8 4.0 Men’s and boys’ shirts .................................... 2321 54.2 8.9 4.0 2.1 4.9 6.9 3.1 1.7 3.8 Men’s and boys’ underwear and nightwear .... 2322 24.1 13.3 5.2 1.6 8.1 7.5 3.8 1.3 3.7 Men’s and boys’ neckwear ............................. 2323 6.4 3.6 1.5 1.5 2.1 3.5 1.4 1.4 2.1 Men’s and boys’ trousers and slacks ............. 2325 77.3 11.9 5.3 2.6 6.6 7.4 3.4 1.7 4.0 Men’s and boys’ work clothing ....................... 2326 40.6 13.2 5.7 3.9 7.5 9.1 3.7 2.5 5.4 Men’s and boys’ clothing, n.e.c. ..................... 2329 49.3 7.0 3.1 2.1 3.9 5.7 2.3 1.6 3.4
Women’s and misses’ outerwear .................... 233 276.0 5.6 2.1 1.4 3.5 4.6 1.6 1.1 3.0 Women’s, junior’s, and misses’ dresses ........ 2335 42.9 3.4 1.4 1.0 2.0 3.2 1.3 .8 1.9 Women’s and misses’ suits and coats ........... 2337 28.7 7.2 2.3 1.9 4.9 6.0 1.8 1.5 4.3 Women’s and misses’ outerwear, n.e.c. ......... 2339 175.0 5.4 2.3 1.4 3.1 4.2 1.8 1.1 2.4
Women’s and children’s undergarments ......... 234 48.4 8.0 3.3 1.9 4.7 6.6 2.5 1.5 4.1 Women’s and children’s underwear ............... 2341 36.4 7.1 2.8 1.7 4.3 6.1 2.3 1.5 3.8 Bras, girdles, and allied garments .................. 2342 12.0 10.6 4.6 2.6 6.0 8.1 3.2 1.8 4.9
Girls’ and children’s outerwear ........................ 236 42.1 7.1 3.4 2.2 3.7 5.6 2.5 1.6 3.1 Girls’ and children’s dresses, blouses ............ 2361 16.9 2.8 1.1 .9 1.7 2.7 1.0 .8 1.7 Girls’ and children’s outerwear, n.e.c. ............ 2369 25.2 10.2 5.0 3.1 5.1 7.6 3.6 2.2 4.0
Miscellaneous apparel and accessories .......... 238 36.3 6.9 2.7 1.7 4.2 6.4 2.4 1.5 4.0 Fabric dress and work gloves ......................... 2381 5.0 4.7 2.7 1.8 2.0 4.0 2.2 1.3 1.8 Robes and dressing gowns ............................ 2384 2.8 8.7 4.3 3.3 4.4 7.9 3.8 2.7 4.2 Apparel belts .................................................. 2387 6.1 5.9 1.4 1.2 4.5 5.8 1.4 1.2 4.4 Apparel and accessories, n.e.c. ..................... 2389 15.7 7.8 3.3 1.8 4.5 7.2 3.0 1.7 4.2
Miscellaneous fabricated textile products ........ 239 221.7 9.3 4.4 2.3 4.9 7.7 3.6 1.9 4.1 Curtains and draperies ................................... 2391 20.5 8.9 4.0 2.4 4.9 7.6 3.1 2.0 4.5 Housefurnishings, n.e.c. ................................. 2392 56.4 9.7 4.6 2.2 5.1 8.9 4.2 2.0 4.7 Textile bags .................................................... 2393 11.8 10.1 4.7 3.6 5.4 8.9 4.0 3.1 4.9 Canvas and related products ......................... 2394 20.1 8.8 4.2 3.3 4.6 8.3 3.9 3.1 4.4 Pleating and stitching ..................................... 2395 17.1 5.1 2.4 1.5 2.7 4.8 2.2 1.4 2.7 Automotive and apparel trimmings ................. 2396 60.7 9.9 4.7 1.8 5.2 7.3 3.6 1.5 3.7 Schiffli machine embroideries ........................ 2397 3.7 7.9 3.2 2.0 4.6 6.8 3.2 1.9 3.6 Fabricated textile products, n.e.c. .................. 2399 31.3 10.0 4.7 2.6 5.3 7.4 3.4 1.9 4.1
Paper and allied products ................................. 26 691.8 8.5 4.2 2.3 4.3 7.8 3.9 2.1 3.9
See footnotes at end of table.
11

Table 1. Incidence rate of nonfatal occupational injuries and illnesses,1 by industry and case type, 1995 — Continued
Industry 2 SICcode 3
1995Annualaverageemploy-ment 4(000’s)
Injuries and Illnesses Injuries
Totalcases
Lost workdaycases Cases
withoutlost
work-days
Totalcases
Lost workdaycases Cases
withoutlost
work-daysTotal 5
Withdaysawayfrom
work 6
Total 5
Withdaysawayfrom
work 6
Pulp mills ......................................................... 261 12.6 5.6 2.3 1.1 3.3 4.8 2.2 1.0 2.6 Paper mills ....................................................... 262 163.3 7.5 3.1 1.8 4.3 6.6 3.0 1.7 3.7 Paperboard mills ............................................. 263 51.2 7.9 3.4 1.8 4.4 7.4 3.3 1.7 4.1
Paperboard containers and boxes .................. 265 221.0 9.1 4.6 2.3 4.5 8.7 4.4 2.2 4.3 Setup paperboard boxes ................................ 2652 7.8 7.2 4.1 2.4 3.1 6.6 3.7 2.1 3.0 Corrugated and solid fiber boxes ................... 2653 130.8 9.8 4.9 2.2 4.9 9.5 4.7 2.1 4.8 Fiber cans, drums and similar products ......... 2655 15.0 7.0 3.4 1.9 3.5 6.3 3.2 1.8 3.1 Sanitary food containers ................................. 2656 18.6 8.5 4.8 2.8 3.7 7.8 4.4 2.6 3.4 Folding paperboard boxes .............................. 2657 48.8 8.5 4.2 2.7 4.3 7.8 3.8 2.5 4.0
Miscellaneous converted paper products ........ 267 243.7 9.1 4.9 2.8 4.2 8.2 4.4 2.6 3.8 Paper coated and laminated, packaging ........ 2671 22.5 9.9 5.3 3.2 4.7 9.5 5.1 3.2 4.5 Paper coated and laminated, n.e.c. ................ 2672 48.4 6.7 3.4 2.0 3.2 5.7 3.1 1.9 2.5 Bags: plastics, laminated, and coated ............ 2673 39.0 8.1 4.3 2.2 3.8 7.4 3.9 2.1 3.5 Bags: uncoated paper and multiwall .............. 2674 18.4 10.9 6.2 3.0 4.6 10.2 5.8 2.8 4.4 Die-cut paper and board ................................. 2675 19.9 7.1 3.7 2.3 3.5 6.6 3.3 2.2 3.2 Sanitary paper products ................................. 2676 30.0 8.2 4.4 2.8 3.8 7.2 4.0 2.5 3.2 Envelopes ....................................................... 2677 23.5 10.0 5.8 3.0 4.2 8.8 5.1 2.6 3.7 Stationery products ........................................ 2678 7.7 13.3 6.0 3.3 7.3 11.1 4.9 2.8 6.1 Converted paper products, n.e.c. ................... 2679 34.3 12.3 6.7 4.0 5.7 11.5 6.3 3.9 5.2
Printing and publishing ..................................... 27 1,541.0 6.4 3.0 2.0 3.4 5.8 2.7 1.8 3.1
Newspapers .................................................... 271 445.7 6.5 2.9 2.2 3.6 5.8 2.7 2.1 3.2
Periodicals ....................................................... 272 131.3 2.6 1.3 .8 1.3 2.2 1.1 .7 1.1
Books .............................................................. 273 123.4 6.3 3.1 1.8 3.1 5.6 2.8 1.7 2.8 Book publishing .............................................. 2731 84.4 4.1 2.1 1.1 2.0 3.5 1.8 1.0 1.7 Book printing .................................................. 2732 39.1 10.5 5.0 3.1 5.5 9.7 4.6 2.9 5.1
Miscellaneous publishing ................................ 274 84.1 3.4 1.4 .9 2.1 3.1 1.2 .8 2.0
Commercial printing ........................................ 275 560.4 7.5 3.6 2.4 3.9 6.9 3.3 2.3 3.6 Commercial printing, lithographic ................... 2752 365.7 7.3 3.4 2.4 3.9 6.8 3.1 2.2 3.7 Commercial printing, gravure ......................... 2754 21.0 11.2 6.3 3.2 4.9 9.8 5.5 2.8 4.4 Commercial printing, n.e.c. ............................. 2759 173.7 7.3 3.6 2.4 3.7 6.8 3.4 2.3 3.4
Manifold business forms .................................. 276 45.0 7.5 3.2 2.4 4.3 7.1 3.0 2.2 4.1
Greeting cards ................................................. 277 27.6 7.5 3.9 1.3 3.7 4.9 2.6 .9 2.2
Blankbooks and bookbinding .......................... 278 68.9 7.7 3.7 2.2 3.9 6.7 3.2 1.8 3.6 Blankbooks and looseleaf binders .................. 2782 39.0 7.4 3.3 1.9 4.1 6.1 2.6 1.4 3.5 Bookbinding and related work ........................ 2789 30.0 8.1 4.4 2.6 3.7 7.5 3.9 2.3 3.6
Printing trade services ..................................... 279 54.5 3.5 1.2 .6 2.2 3.3 1.2 .6 2.2
Typesetting ..................................................... 2791 20.8 2.0 .7 .5 1.4 2.0 .7 .5 1.3 Platemaking services ..................................... 2796 33.7 4.3 1.5 .7 2.8 4.1 1.5 .6 2.7
Chemicals and allied products ......................... 28 1,033.6 5.5 2.7 1.3 2.8 4.8 2.4 1.2 2.4
Industrial inorganic chemicals ......................... 281 119.4 3.9 1.9 1.0 2.0 3.5 1.8 .9 1.7 Alkalies and chlorine ...................................... 2812 10.0 3.5 1.6 .8 1.9 3.3 1.5 .7 1.8 Industrial gases .............................................. 2813 23.0 2.4 1.0 .4 1.4 2.1 1.0 .4 1.1 Inorganic pigments ......................................... 2816 11.8 6.6 3.7 2.8 3.0 6.1 3.5 2.7 2.6 Industrial inorganic chemicals, n.e.c. ............. 2819 74.6 4.1 2.0 .9 2.0 3.6 1.8 .9 1.8
See footnotes at end of table.
12
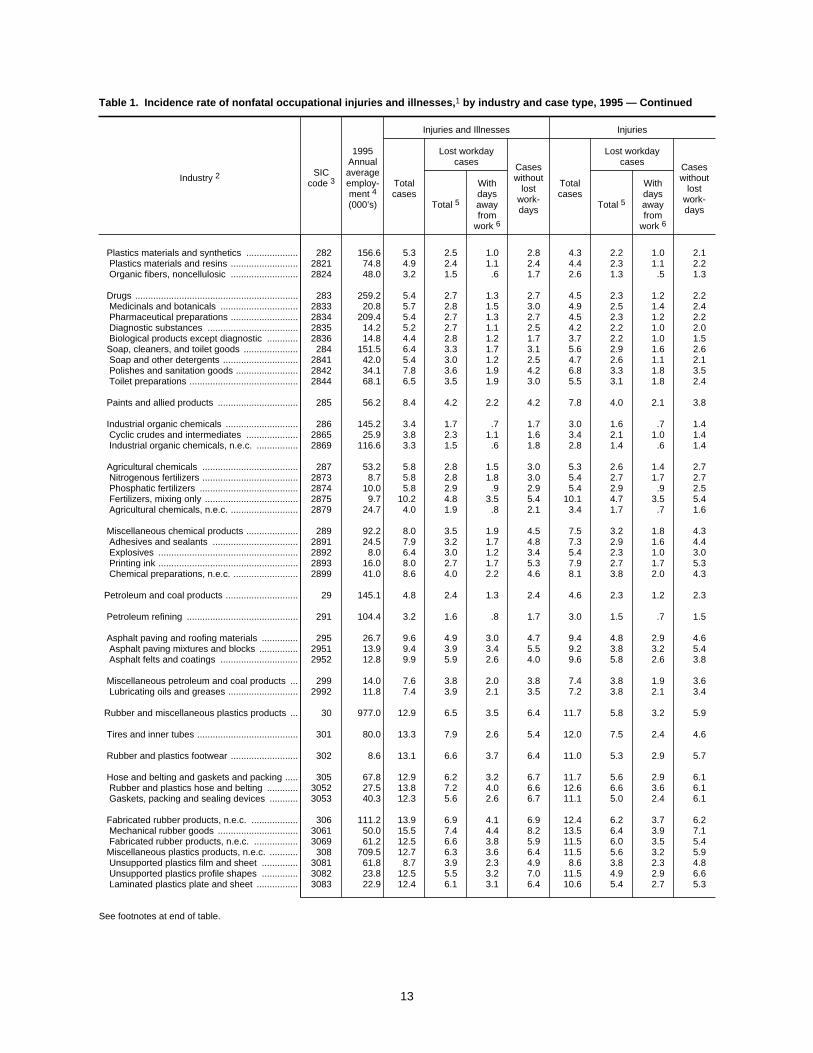
Table 1. Incidence rate of nonfatal occupational injuries and illnesses,1 by industry and case type, 1995 — Continued
Industry 2 SICcode 3
1995Annualaverageemploy-ment 4(000’s)
Injuries and Illnesses Injuries
Totalcases
Lost workdaycases Cases
withoutlost
work-days
Totalcases
Lost workdaycases Cases
withoutlost
work-daysTotal 5
Withdaysawayfrom
work 6
Total 5
Withdaysawayfrom
work 6
Plastics materials and synthetics .................... 282 156.6 5.3 2.5 1.0 2.8 4.3 2.2 1.0 2.1 Plastics materials and resins .......................... 2821 74.8 4.9 2.4 1.1 2.4 4.4 2.3 1.1 2.2 Organic fibers, noncellulosic .......................... 2824 48.0 3.2 1.5 .6 1.7 2.6 1.3 .5 1.3
Drugs ............................................................... 283 259.2 5.4 2.7 1.3 2.7 4.5 2.3 1.2 2.2 Medicinals and botanicals .............................. 2833 20.8 5.7 2.8 1.5 3.0 4.9 2.5 1.4 2.4 Pharmaceutical preparations .......................... 2834 209.4 5.4 2.7 1.3 2.7 4.5 2.3 1.2 2.2 Diagnostic substances ................................... 2835 14.2 5.2 2.7 1.1 2.5 4.2 2.2 1.0 2.0 Biological products except diagnostic ............ 2836 14.8 4.4 2.8 1.2 1.7 3.7 2.2 1.0 1.5 Soap, cleaners, and toilet goods ..................... 284 151.5 6.4 3.3 1.7 3.1 5.6 2.9 1.6 2.6 Soap and other detergents ............................. 2841 42.0 5.4 3.0 1.2 2.5 4.7 2.6 1.1 2.1 Polishes and sanitation goods ........................ 2842 34.1 7.8 3.6 1.9 4.2 6.8 3.3 1.8 3.5 Toilet preparations .......................................... 2844 68.1 6.5 3.5 1.9 3.0 5.5 3.1 1.8 2.4
Paints and allied products ............................... 285 56.2 8.4 4.2 2.2 4.2 7.8 4.0 2.1 3.8
Industrial organic chemicals ............................ 286 145.2 3.4 1.7 .7 1.7 3.0 1.6 .7 1.4 Cyclic crudes and intermediates .................... 2865 25.9 3.8 2.3 1.1 1.6 3.4 2.1 1.0 1.4 Industrial organic chemicals, n.e.c. ................ 2869 116.6 3.3 1.5 .6 1.8 2.8 1.4 .6 1.4
Agricultural chemicals ..................................... 287 53.2 5.8 2.8 1.5 3.0 5.3 2.6 1.4 2.7 Nitrogenous fertilizers ..................................... 2873 8.7 5.8 2.8 1.8 3.0 5.4 2.7 1.7 2.7 Phosphatic fertilizers ...................................... 2874 10.0 5.8 2.9 .9 2.9 5.4 2.9 .9 2.5 Fertilizers, mixing only .................................... 2875 9.7 10.2 4.8 3.5 5.4 10.1 4.7 3.5 5.4 Agricultural chemicals, n.e.c. .......................... 2879 24.7 4.0 1.9 .8 2.1 3.4 1.7 .7 1.6
Miscellaneous chemical products .................... 289 92.2 8.0 3.5 1.9 4.5 7.5 3.2 1.8 4.3 Adhesives and sealants ................................. 2891 24.5 7.9 3.2 1.7 4.8 7.3 2.9 1.6 4.4 Explosives ...................................................... 2892 8.0 6.4 3.0 1.2 3.4 5.4 2.3 1.0 3.0 Printing ink ...................................................... 2893 16.0 8.0 2.7 1.7 5.3 7.9 2.7 1.7 5.3 Chemical preparations, n.e.c. ......................... 2899 41.0 8.6 4.0 2.2 4.6 8.1 3.8 2.0 4.3
Petroleum and coal products ............................ 29 145.1 4.8 2.4 1.3 2.4 4.6 2.3 1.2 2.3
Petroleum refining ........................................... 291 104.4 3.2 1.6 .8 1.7 3.0 1.5 .7 1.5
Asphalt paving and roofing materials .............. 295 26.7 9.6 4.9 3.0 4.7 9.4 4.8 2.9 4.6 Asphalt paving mixtures and blocks ............... 2951 13.9 9.4 3.9 3.4 5.5 9.2 3.8 3.2 5.4 Asphalt felts and coatings .............................. 2952 12.8 9.9 5.9 2.6 4.0 9.6 5.8 2.6 3.8
Miscellaneous petroleum and coal products ... 299 14.0 7.6 3.8 2.0 3.8 7.4 3.8 1.9 3.6 Lubricating oils and greases ........................... 2992 11.8 7.4 3.9 2.1 3.5 7.2 3.8 2.1 3.4
Rubber and miscellaneous plastics products ... 30 977.0 12.9 6.5 3.5 6.4 11.7 5.8 3.2 5.9
Tires and inner tubes ....................................... 301 80.0 13.3 7.9 2.6 5.4 12.0 7.5 2.4 4.6
Rubber and plastics footwear .......................... 302 8.6 13.1 6.6 3.7 6.4 11.0 5.3 2.9 5.7
Hose and belting and gaskets and packing ..... 305 67.8 12.9 6.2 3.2 6.7 11.7 5.6 2.9 6.1 Rubber and plastics hose and belting ............ 3052 27.5 13.8 7.2 4.0 6.6 12.6 6.6 3.6 6.1 Gaskets, packing and sealing devices ........... 3053 40.3 12.3 5.6 2.6 6.7 11.1 5.0 2.4 6.1
Fabricated rubber products, n.e.c. .................. 306 111.2 13.9 6.9 4.1 6.9 12.4 6.2 3.7 6.2 Mechanical rubber goods ............................... 3061 50.0 15.5 7.4 4.4 8.2 13.5 6.4 3.9 7.1 Fabricated rubber products, n.e.c. ................. 3069 61.2 12.5 6.6 3.8 5.9 11.5 6.0 3.5 5.4 Miscellaneous plastics products, n.e.c. ........... 308 709.5 12.7 6.3 3.6 6.4 11.5 5.6 3.2 5.9 Unsupported plastics film and sheet .............. 3081 61.8 8.7 3.9 2.3 4.9 8.6 3.8 2.3 4.8 Unsupported plastics profile shapes .............. 3082 23.8 12.5 5.5 3.2 7.0 11.5 4.9 2.9 6.6 Laminated plastics plate and sheet ................ 3083 22.9 12.4 6.1 3.1 6.4 10.6 5.4 2.7 5.3
See footnotes at end of table.
13

Table 1. Incidence rate of nonfatal occupational injuries and illnesses,1 by industry and case type, 1995 — Continued
Industry 2 SICcode 3
1995Annualaverageemploy-ment 4(000’s)
Injuries and Illnesses Injuries
Totalcases
Lost workdaycases Cases
withoutlost
work-days
Totalcases
Lost workdaycases Cases
withoutlost
work-daysTotal 5
Withdaysawayfrom
work 6
Total 5
Withdaysawayfrom
work 6
Plastics pipe ................................................... 3084 16.5 14.8 7.1 5.1 7.7 14.3 6.7 4.9 7.6 Plastics bottles ............................................... 3085 32.8 12.3 6.1 3.4 6.1 11.9 6.0 3.4 5.9 Plastics foam products ................................... 3086 54.7 12.4 5.5 3.4 6.9 11.2 5.1 3.2 6.1 Custom compound purchased resins ............. 3087 26.0 9.9 5.2 2.9 4.7 9.2 4.8 2.8 4.4 Plastics plumbing fixtures ............................... 3088 17.1 14.7 8.3 4.4 6.4 13.1 7.4 4.0 5.7 Plastics products, n.e.c. ................................. 3089 453.9 13.4 6.8 3.8 6.6 12.0 5.9 3.3 6.1
Leather and leather products ........................... 31 105.5 11.4 4.8 2.7 6.5 9.0 3.7 2.3 5.2
Leather tanning and finishing .......................... 311 13.7 18.5 9.8 4.4 8.7 15.1 7.9 4.0 7.2
Footwear, except rubber ................................. 314 51.9 10.9 4.6 2.7 6.3 7.7 3.2 2.1 4.5 Men’s footwear, except athletic ...................... 3143 25.4 11.2 4.2 2.2 7.0 8.1 3.0 1.8 5.2 Women’s footwear, except athletic ................. 3144 16.9 9.2 4.6 2.7 4.6 6.4 3.2 1.9 3.2
Luggage .......................................................... 316 10.8 11.4 3.8 2.3 7.6 9.3 3.0 1.8 6.3 Handbags and personal leather goods ........... 317 11.6 6.4 3.0 2.0 3.4 5.9 2.7 1.9 3.2 Women’s handbags and purses ..................... 3171 4.5 5.5 1.7 1.5 3.8 5.5 1.7 1.5 3.8 Personal leather goods, n.e.c. ........................ 3172 7.1 6.9 3.8 2.3 3.1 6.1 3.3 2.2 2.7
Leather goods, n.e.c. ....................................... 319 12.2 9.6 3.2 1.8 6.4 9.0 3.0 1.8 6.1
Transportation and public utilities 8 ............... 5,857.8 9.1 5.2 3.9 3.9 8.7 5.0 3.7 3.7
Railroad transportation 8 .................................. 40 – 4.2 3.2 2.8 1.0 4.1 3.2 2.7 1.0
Local and interurban passenger transit ............ 41 397.5 10.3 5.8 4.9 4.6 9.9 5.6 4.8 4.3 Local and suburban transportation .................. 411 181.2 13.0 7.6 6.5 5.4 12.4 7.4 6.3 5.1 Taxicabs .......................................................... 412 30.6 6.1 3.5 3.4 2.6 6.1 3.5 3.4 2.6 Intercity and rural bus transportation ............... 413 24.2 9.9 4.9 4.3 5.0 9.2 4.3 3.7 4.9 Bus charter service .......................................... 414 29.4 6.3 3.1 2.9 3.2 6.2 3.0 2.8 3.2 School buses ................................................... 415 130.3 8.0 4.0 3.2 3.9 7.7 3.9 3.2 3.7
Trucking and warehousing ............................... 42 1,874.7 13.8 8.1 5.9 5.7 13.6 8.0 5.8 5.6 Trucking and courier services, except air ........ 421 1,728.1 14.1 8.3 6.0 5.8 13.9 8.2 5.9 5.7 Public warehousing and storage ..................... 422 142.2 10.6 5.5 4.0 5.1 10.3 5.3 3.9 5.0 Trucking terminal facilities ............................... 423 4.4 14.9 8.8 7.7 6.1 14.7 8.7 7.7 6.0
Water transportation ......................................... 44 177.8 9.0 4.9 4.6 4.1 8.8 4.8 4.5 4.0 Deep sea domestic transportation of freight .... 442 10.1 8.1 4.0 3.7 4.1 7.5 3.7 3.4 3.8 Water transportation of freight, n.e.c. .............. 444 12.9 8.1 4.2 3.6 3.9 7.6 3.8 3.3 3.8 Water transportation of passengers ................ 448 19.7 4.2 1.9 1.9 2.2 4.1 1.9 1.8 2.2 Water transportation services .......................... 449 116.5 11.0 6.1 5.7 4.9 10.9 6.1 5.7 4.9
Transportation by air ........................................ 45 776.0 13.7 8.2 6.6 5.5 13.1 7.9 6.3 5.2 Air transportation, scheduled ........................... 451 626.3 14.5 8.9 7.3 5.6 13.8 8.5 6.9 5.3 Air transportation, nonscheduled ..................... 452 40.7 8.8 3.4 2.0 5.5 8.8 3.3 2.0 5.5 Airports, flying fields, and services .................. 458 109.0 11.3 6.4 4.6 4.9 11.1 6.3 4.5 4.7
Pipelines, except natural gas ........................... 46 15.0 1.6 .8 .8 .8 1.6 .8 .7 .8
Transportation services .................................... 47 407.2 4.5 2.4 1.8 2.1 4.4 2.4 1.7 2.0 Passenger transportation arrangement ........... 472 204.3 .9 .4 .3 .5 .8 .3 .3 .5 Freight transportation arrangement ................. 473 164.2 6.1 3.6 2.8 2.5 6.0 3.5 2.8 2.4 Miscellaneous transportation services ............ 478 36.4 16.3 8.2 5.0 8.1 16.0 8.0 4.9 8.0
Communications ............................................... 48 1,304.3 3.3 1.8 1.4 1.5 2.7 1.5 1.2 1.2 Telephone communications ............................ 481 886.6 2.7 1.6 1.3 1.1 2.0 1.2 1.0 .8 Telegraph and other communications ............. 482 8.0 3.2 1.9 1.2 1.3 2.7 1.7 1.2 1.0 Radio and television broadcasting .................. 483 236.0 1.9 .6 .5 1.3 1.8 .6 .4 1.2 Cable and other pay television services .......... 484 155.5 8.3 4.3 3.3 3.9 7.8 4.2 3.2 3.6
See footnotes at end of table.
14

Table 1. Incidence rate of nonfatal occupational injuries and illnesses,1 by industry and case type, 1995 — Continued
Industry 2 SICcode 3
1995Annualaverageemploy-ment 4(000’s)
Injuries and Illnesses Injuries
Totalcases
Lost workdaycases Cases
withoutlost
work-days
Totalcases
Lost workdaycases Cases
withoutlost
work-daysTotal 5
Withdaysawayfrom
work 6
Total 5
Withdaysawayfrom
work 6
Electric, gas, and sanitary services .................. 49 904.5 7.5 3.7 2.1 3.8 7.0 3.5 2.0 3.5 Electric services .............................................. 491 399.8 5.7 2.7 1.3 3.0 5.3 2.6 1.2 2.7 Gas production and distribution ....................... 492 152.7 6.5 3.0 1.8 3.5 6.1 2.9 1.7 3.3 Combination utility services ............................. 493 167.3 5.8 2.9 1.3 2.8 5.1 2.7 1.2 2.4 Water supply ................................................... 494 27.9 10.5 5.6 4.1 4.9 9.7 5.5 4.0 4.3 Sanitary services ............................................. 495 153.2 14.0 7.1 5.0 6.9 13.5 6.9 4.9 6.6
Wholesale and retail trade ............................... 27,563.7 7.5 3.2 2.4 4.3 7.3 3.1 2.3 4.2
Wholesale trade ................................................ 6,389.8 7.5 3.6 2.6 3.9 7.3 3.5 2.5 3.8
Wholesale trade--durable goods ..................... 50 3,724.7 6.8 3.1 2.3 3.7 6.6 3.0 2.2 3.6 Motor vehicles, parts, and supplies ................. 501 490.1 10.7 5.1 3.7 5.6 10.0 4.8 3.4 5.3 Furniture and homefurnishings ........................ 502 147.5 6.5 3.3 2.5 3.2 6.3 3.2 2.4 3.1 Lumber and construction materials ................. 503 241.3 10.5 5.0 3.6 5.5 10.4 5.0 3.5 5.4 Professional and commercial equipment ........ 504 795.6 3.7 1.5 1.1 2.3 3.6 1.4 1.1 2.2 Metals and minerals, except petroleum ........... 505 142.4 12.5 5.8 3.8 6.7 12.3 5.7 3.8 6.6 Electrical goods ............................................... 506 499.8 3.8 1.8 1.2 2.0 3.6 1.7 1.2 1.9 Hardware, plumbing and heating equipment ... 507 287.2 6.4 3.2 2.3 3.3 6.3 3.1 2.2 3.2 Machinery, equipment, and supplies ............... 508 789.3 7.1 2.8 2.2 4.3 7.0 2.8 2.1 4.2 Miscellaneous durable goods .......................... 509 331.6 8.1 4.1 2.9 4.1 7.9 3.9 2.8 4.0 Wholesale trade--nondurable goods ............... 51 2,665.1 8.5 4.4 3.1 4.1 8.3 4.3 3.1 4.0 Paper and paper products ............................... 511 254.7 4.9 2.4 1.8 2.5 4.8 2.3 1.7 2.5 Drugs, proprietaries, and sundries .................. 512 198.9 5.1 2.6 1.9 2.5 4.9 2.4 1.9 2.4 Apparel, piece goods, and notions .................. 513 221.6 4.6 2.6 1.4 2.1 4.4 2.5 1.4 2.0 Groceries and related products ....................... 514 887.6 11.6 6.4 4.5 5.2 11.3 6.3 4.4 5.1 Farm-product raw materials ............................ 515 111.2 7.1 3.1 2.8 4.0 7.0 3.0 2.7 3.9 Chemicals and allied products ........................ 516 148.1 5.5 2.5 1.5 3.0 5.4 2.4 1.5 2.9 Petroleum and petroleum products ................. 517 160.1 6.1 2.6 2.1 3.5 5.8 2.5 1.9 3.4 Beer, wine, and distilled beverages ................. 518 152.1 13.7 7.0 5.8 6.7 13.5 6.9 5.7 6.6 Miscellaneous nondurable goods .................... 519 530.9 8.1 3.8 2.6 4.2 7.9 3.8 2.6 4.1
Retail trade ........................................................ 21,173.9 7.5 3.0 2.3 4.5 7.2 2.9 2.2 4.3
Building materials and garden supplies ............ 52 860.2 9.4 4.5 3.1 4.9 9.3 4.5 3.1 4.8 Lumber and other building materials ............... 521 506.0 11.7 5.9 3.9 5.8 11.6 5.8 3.8 5.8 Paint, glass, and wallpaper stores ................... 523 66.2 6.2 2.6 2.1 3.5 6.2 2.6 2.1 3.5 Hardware stores .............................................. 525 162.7 5.2 2.1 1.6 3.1 5.1 2.0 1.5 3.1 Retail nurseries and garden stores ................. 526 90.2 6.7 3.0 2.5 3.7 6.5 3.0 2.4 3.5 Mobile home dealers ....................................... 527 35.1 6.6 2.7 2.5 3.8 6.5 2.7 2.5 3.8
General merchandise stores ............................ 53 2,662.6 10.2 5.1 3.2 5.1 10.0 5.0 3.1 5.0 Department stores ........................................... 531 2,327.4 10.5 5.3 3.2 5.2 10.3 5.1 3.1 5.1 Variety stores .................................................. 533 135.9 8.9 4.4 3.3 4.6 8.8 4.3 3.3 4.5 Miscellaneous general merchandise stores .... 539 199.3 7.3 3.2 2.5 4.1 7.2 3.1 2.4 4.1
Food stores ...................................................... 54 3,359.3 9.3 3.9 3.0 5.4 9.0 3.7 2.8 5.2 Grocery stores ................................................. 541 2,983.2 9.9 4.1 3.1 5.8 9.6 4.0 3.0 5.6 Meat and fish markets ..................................... 542 46.9 4.1 1.5 1.4 2.6 4.0 1.5 1.3 2.6 Fruit and vegetable markets ............................ 543 29.2 5.7 2.8 2.0 2.8 5.6 2.8 1.9 2.8 Candy, nut, and confectionery stores .............. 544 30.2 4.7 2.8 2.5 1.8 4.6 2.8 2.5 1.8 Dairy products stores ...................................... 545 15.4 4.7 2.5 1.9 2.2 4.0 2.0 1.5 1.9 Retail bakeries ................................................. 546 185.8 4.2 1.9 1.6 2.2 4.0 1.8 1.5 2.2 Miscellaneous food stores ............................... 549 68.6 3.6 1.6 1.4 2.0 3.5 1.6 1.3 1.9
Automotive dealers and service stations .......... 55 2,187.8 6.9 2.5 2.1 4.3 6.7 2.5 2.1 4.2 New and used car dealers ............................... 551 994.7 7.8 2.5 2.1 5.2 7.7 2.5 2.1 5.1 Used car dealers ............................................. 552 78.7 2.3 1.0 .7 1.4 2.3 1.0 .7 1.3 Auto and home supply stores .......................... 553 370.2 9.2 4.0 3.4 5.2 9.1 3.9 3.3 5.2 Gasoline service stations ................................ 554 646.8 4.4 1.9 1.5 2.5 4.3 1.8 1.4 2.5
See footnotes at end of table.
15

Table 1. Incidence rate of nonfatal occupational injuries and illnesses,1 by industry and case type, 1995 — Continued
Industry 2 SICcode 3
1995Annualaverageemploy-ment 4(000’s)
Injuries and Illnesses Injuries
Totalcases
Lost workdaycases Cases
withoutlost
work-days
Totalcases
Lost workdaycases Cases
withoutlost
work-daysTotal 5
Withdaysawayfrom
work 6
Total 5
Withdaysawayfrom
work 6
Boat dealers .................................................... 555 34.2 5.9 2.4 2.1 3.5 5.9 2.3 2.0 3.5 Recreational vehicle dealers ........................... 556 24.8 9.3 2.7 2.0 6.6 9.3 2.7 2.0 6.6 Motorcycle dealers .......................................... 557 29.6 2.5 1.0 1.0 1.5 2.3 1.0 .9 1.4
Apparel and accessory stores .......................... 56 1,143.9 3.8 1.6 1.1 2.2 3.7 1.5 1.0 2.2 Men’s and boys’ clothing stores ...................... 561 88.9 2.1 1.1 .8 1.0 2.0 1.1 .8 1.0 Women’s clothing stores ................................. 562 330.7 3.3 1.3 1.0 2.0 3.2 1.2 .9 2.0 Children’s and infants’ wear stores ................. 564 39.8 2.9 1.7 .8 1.3 2.9 1.6 .7 1.3 Family clothing stores ...................................... 565 334.0 6.0 2.4 1.5 3.6 5.9 2.3 1.4 3.5 Shoe stores ..................................................... 566 205.3 2.7 1.4 1.0 1.3 2.6 1.3 .9 1.2 Miscellaneous apparel and accessory stores .. 569 88.9 2.9 1.1 .9 1.8 2.8 1.0 .9 1.8
Furniture and homefurnishings stores .............. 57 947.8 5.7 2.7 2.1 3.0 5.6 2.6 2.0 2.9 Furniture and homefurnishings stores ............. 571 489.6 7.2 3.5 2.7 3.6 7.0 3.5 2.7 3.6 Household appliance stores ............................ 572 78.7 7.2 2.9 2.3 4.3 7.2 2.9 2.3 4.3 Radio, television, and computer stores ........... 573 379.5 3.3 1.4 1.1 1.9 3.2 1.4 1.1 1.8
Eating and drinking places ............................... 58 7,351.9 7.6 2.4 2.1 5.2 7.4 2.4 2.0 4.9
Miscellaneous retail .......................................... 59 2,660.3 4.2 1.9 1.4 2.4 4.0 1.8 1.3 2.2 Drug stores and proprietary stores .................. 591 604.0 3.2 1.3 1.1 1.9 3.0 1.2 1.0 1.9 Liquor stores .................................................... 592 111.7 2.5 .9 .7 1.6 2.5 .9 .7 1.5 Used merchandise stores ................................ 593 100.0 4.5 2.6 1.8 1.9 4.4 2.5 1.8 1.9 Miscellaneous shopping goods stores ............ 594 941.1 3.8 1.5 1.2 2.3 3.7 1.5 1.1 2.2 Nonstore retailers ............................................ 596 329.4 7.4 3.8 2.2 3.7 6.3 3.4 2.0 2.9 Fuel dealers ..................................................... 598 98.6 8.0 3.9 3.4 4.1 7.8 3.8 3.3 4.0 Retail stores, n.e.c. .......................................... 599 475.3 3.3 1.3 1.0 1.9 3.1 1.2 .9 1.9
Finance, insurance, and real estate ................ 6,617.6 2.6 1.0 .8 1.6 2.3 .9 .7 1.4
Depository institutions ...................................... 60 2,020.8 2.2 .7 .6 1.5 1.9 .5 .4 1.4 Central reserve depositories ........................... 601 25.9 3.3 1.5 1.1 1.9 2.9 1.3 1.0 1.6 Commercial banks ........................................... 602 1,461.1 2.3 .7 .6 1.6 2.0 .5 .4 1.5 Savings institutions .......................................... 603 275.9 1.8 .6 .6 1.2 1.6 .5 .4 1.1 Credit unions ................................................... 606 156.3 2.2 .7 .6 1.5 1.9 .6 .5 1.3 Functions closely related to banking ............... 609 69.1 1.7 .5 .4 1.2 1.3 .3 .3 1.0
Nondepository institutions ................................ 61 462.5 1.3 .5 .4 .8 1.1 .4 .3 .7 Personal credit institutions .............................. 614 144.3 1.5 .6 .5 .9 1.2 .4 .4 .8 Business credit institutions .............................. 615 92.4 1.6 .6 .4 1.0 1.4 .5 .4 .9 Mortgage bankers and brokers ....................... 616 204.3 1.1 .4 .3 .7 .9 .3 .3 .6
Security and commodity brokers ...................... 62 522.5 .8 .3 .2 .5 .7 .2 .2 .5 Security brokers and dealers ........................... 621 396.9 .7 .3 .2 .5 .6 .2 .2 .4 Security and commodity exchanges ................ 623 8.3 2.0 1.0 1.0 .9 1.9 1.0 1.0 .9 Security and commodity services .................... 628 101.4 1.0 .4 .3 .6 .9 .3 .3 .6
Insurance carriers ............................................. 63 1,372.1 2.3 .8 .7 1.5 1.8 .6 .5 1.2 Life insurance .................................................. 631 410.2 2.2 .7 .6 1.5 1.8 .5 .5 1.2 Medical service and health insurance ............. 632 303.8 2.5 1.0 .7 1.5 1.9 .7 .6 1.1 Fire, marine, and casualty insurance .............. 633 530.8 2.6 .8 .7 1.7 2.0 .6 .5 1.4 Surety insurance ............................................. 635 18.1 1.7 .6 .5 1.1 1.6 .5 .4 1.1 Title insurance ................................................. 636 64.3 .9 .3 .3 .6 .8 .3 .3 .5
Insurance agents, brokers, and service ........... 64 694.6 1.2 .4 .4 .8 1.0 .4 .3 .7
Real estate ....................................................... 65 1,342.8 5.7 2.6 2.0 3.2 5.5 2.5 1.9 3.0 Real estate operators and lessors ................... 651 570.9 7.1 3.6 2.7 3.6 6.8 3.5 2.6 3.3 Real estate agents and managers .................. 653 632.0 4.5 1.7 1.4 2.8 4.3 1.6 1.3 2.7 Title abstract offices ........................................ 654 29.9 .9 .3 .3 .6 .8 .3 .2 .6 Subdividers and developers ............................ 655 109.9 7.7 3.6 2.7 4.1 7.5 3.5 2.6 4.0
See footnotes at end of table.
16
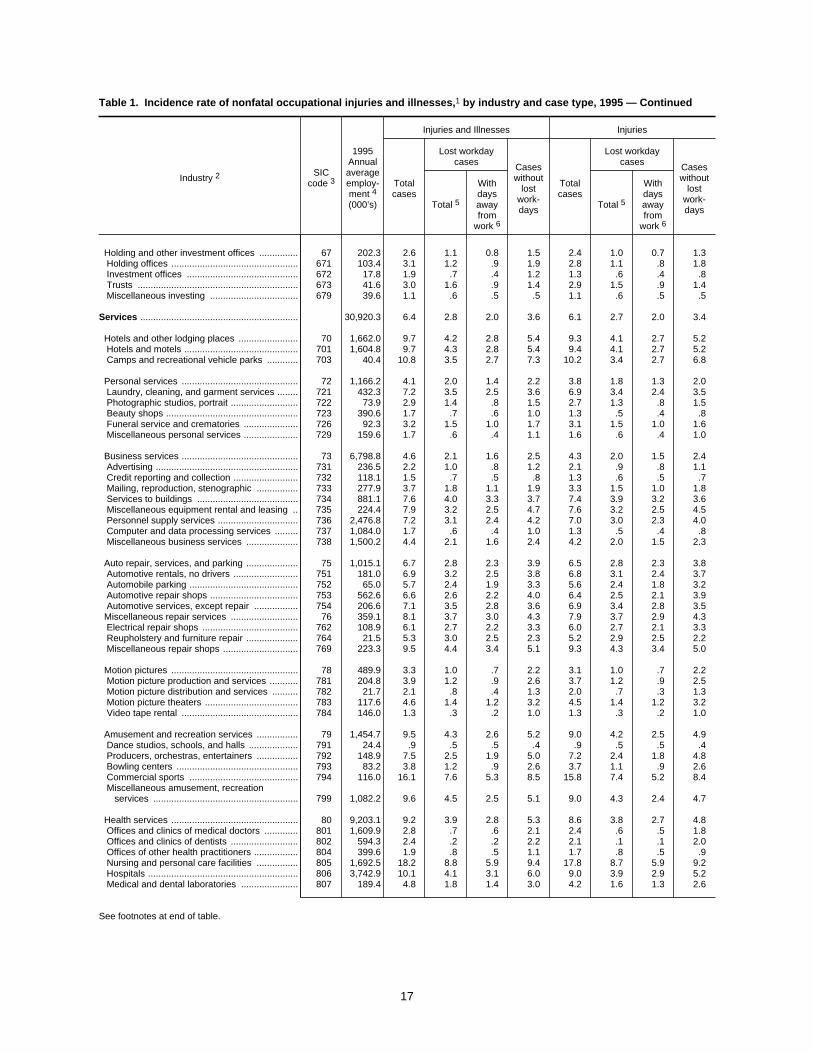
Table 1. Incidence rate of nonfatal occupational injuries and illnesses,1 by industry and case type, 1995 — Continued
Industry 2 SICcode 3
1995Annualaverageemploy-ment 4(000’s)
Injuries and Illnesses Injuries
Totalcases
Lost workdaycases Cases
withoutlost
work-days
Totalcases
Lost workdaycases Cases
withoutlost
work-daysTotal 5
Withdaysawayfrom
work 6
Total 5
Withdaysawayfrom
work 6
Holding and other investment offices ............... 67 202.3 2.6 1.1 0.8 1.5 2.4 1.0 0.7 1.3 Holding offices ................................................. 671 103.4 3.1 1.2 .9 1.9 2.8 1.1 .8 1.8 Investment offices ........................................... 672 17.8 1.9 .7 .4 1.2 1.3 .6 .4 .8 Trusts .............................................................. 673 41.6 3.0 1.6 .9 1.4 2.9 1.5 .9 1.4 Miscellaneous investing .................................. 679 39.6 1.1 .6 .5 .5 1.1 .6 .5 .5
Services ............................................................. 30,920.3 6.4 2.8 2.0 3.6 6.1 2.7 2.0 3.4
Hotels and other lodging places ....................... 70 1,662.0 9.7 4.2 2.8 5.4 9.3 4.1 2.7 5.2 Hotels and motels ............................................ 701 1,604.8 9.7 4.3 2.8 5.4 9.4 4.1 2.7 5.2 Camps and recreational vehicle parks ............ 703 40.4 10.8 3.5 2.7 7.3 10.2 3.4 2.7 6.8
Personal services ............................................. 72 1,166.2 4.1 2.0 1.4 2.2 3.8 1.8 1.3 2.0 Laundry, cleaning, and garment services ........ 721 432.3 7.2 3.5 2.5 3.6 6.9 3.4 2.4 3.5 Photographic studios, portrait .......................... 722 73.9 2.9 1.4 .8 1.5 2.7 1.3 .8 1.5 Beauty shops ................................................... 723 390.6 1.7 .7 .6 1.0 1.3 .5 .4 .8 Funeral service and crematories ..................... 726 92.3 3.2 1.5 1.0 1.7 3.1 1.5 1.0 1.6 Miscellaneous personal services ..................... 729 159.6 1.7 .6 .4 1.1 1.6 .6 .4 1.0
Business services ............................................. 73 6,798.8 4.6 2.1 1.6 2.5 4.3 2.0 1.5 2.4 Advertising ....................................................... 731 236.5 2.2 1.0 .8 1.2 2.1 .9 .8 1.1 Credit reporting and collection ......................... 732 118.1 1.5 .7 .5 .8 1.3 .6 .5 .7 Mailing, reproduction, stenographic ................ 733 277.9 3.7 1.8 1.1 1.9 3.3 1.5 1.0 1.8 Services to buildings ....................................... 734 881.1 7.6 4.0 3.3 3.7 7.4 3.9 3.2 3.6 Miscellaneous equipment rental and leasing .. 735 224.4 7.9 3.2 2.5 4.7 7.6 3.2 2.5 4.5 Personnel supply services ............................... 736 2,476.8 7.2 3.1 2.4 4.2 7.0 3.0 2.3 4.0 Computer and data processing services ......... 737 1,084.0 1.7 .6 .4 1.0 1.3 .5 .4 .8 Miscellaneous business services .................... 738 1,500.2 4.4 2.1 1.6 2.4 4.2 2.0 1.5 2.3
Auto repair, services, and parking .................... 75 1,015.1 6.7 2.8 2.3 3.9 6.5 2.8 2.3 3.8 Automotive rentals, no drivers ......................... 751 181.0 6.9 3.2 2.5 3.8 6.8 3.1 2.4 3.7 Automobile parking .......................................... 752 65.0 5.7 2.4 1.9 3.3 5.6 2.4 1.8 3.2 Automotive repair shops .................................. 753 562.6 6.6 2.6 2.2 4.0 6.4 2.5 2.1 3.9 Automotive services, except repair ................. 754 206.6 7.1 3.5 2.8 3.6 6.9 3.4 2.8 3.5 Miscellaneous repair services .......................... 76 359.1 8.1 3.7 3.0 4.3 7.9 3.7 2.9 4.3 Electrical repair shops ..................................... 762 108.9 6.1 2.7 2.2 3.3 6.0 2.7 2.1 3.3 Reupholstery and furniture repair .................... 764 21.5 5.3 3.0 2.5 2.3 5.2 2.9 2.5 2.2 Miscellaneous repair shops ............................. 769 223.3 9.5 4.4 3.4 5.1 9.3 4.3 3.4 5.0
Motion pictures ................................................. 78 489.9 3.3 1.0 .7 2.2 3.1 1.0 .7 2.2 Motion picture production and services ........... 781 204.8 3.9 1.2 .9 2.6 3.7 1.2 .9 2.5 Motion picture distribution and services .......... 782 21.7 2.1 .8 .4 1.3 2.0 .7 .3 1.3 Motion picture theaters .................................... 783 117.6 4.6 1.4 1.2 3.2 4.5 1.4 1.2 3.2 Video tape rental ............................................. 784 146.0 1.3 .3 .2 1.0 1.3 .3 .2 1.0
Amusement and recreation services ................ 79 1,454.7 9.5 4.3 2.6 5.2 9.0 4.2 2.5 4.9 Dance studios, schools, and halls ................... 791 24.4 .9 .5 .5 .4 .9 .5 .5 .4 Producers, orchestras, entertainers ................ 792 148.9 7.5 2.5 1.9 5.0 7.2 2.4 1.8 4.8 Bowling centers ............................................... 793 83.2 3.8 1.2 .9 2.6 3.7 1.1 .9 2.6 Commercial sports .......................................... 794 116.0 16.1 7.6 5.3 8.5 15.8 7.4 5.2 8.4 Miscellaneous amusement, recreation
services ........................................................ 799 1,082.2 9.6 4.5 2.5 5.1 9.0 4.3 2.4 4.7
Health services ................................................. 80 9,203.1 9.2 3.9 2.8 5.3 8.6 3.8 2.7 4.8 Offices and clinics of medical doctors ............. 801 1,609.9 2.8 .7 .6 2.1 2.4 .6 .5 1.8 Offices and clinics of dentists .......................... 802 594.3 2.4 .2 .2 2.2 2.1 .1 .1 2.0 Offices of other health practitioners ................. 804 399.6 1.9 .8 .5 1.1 1.7 .8 .5 .9 Nursing and personal care facilities ................ 805 1,692.5 18.2 8.8 5.9 9.4 17.8 8.7 5.9 9.2 Hospitals .......................................................... 806 3,742.9 10.1 4.1 3.1 6.0 9.0 3.9 2.9 5.2 Medical and dental laboratories ...................... 807 189.4 4.8 1.8 1.4 3.0 4.2 1.6 1.3 2.6
See footnotes at end of table.
17
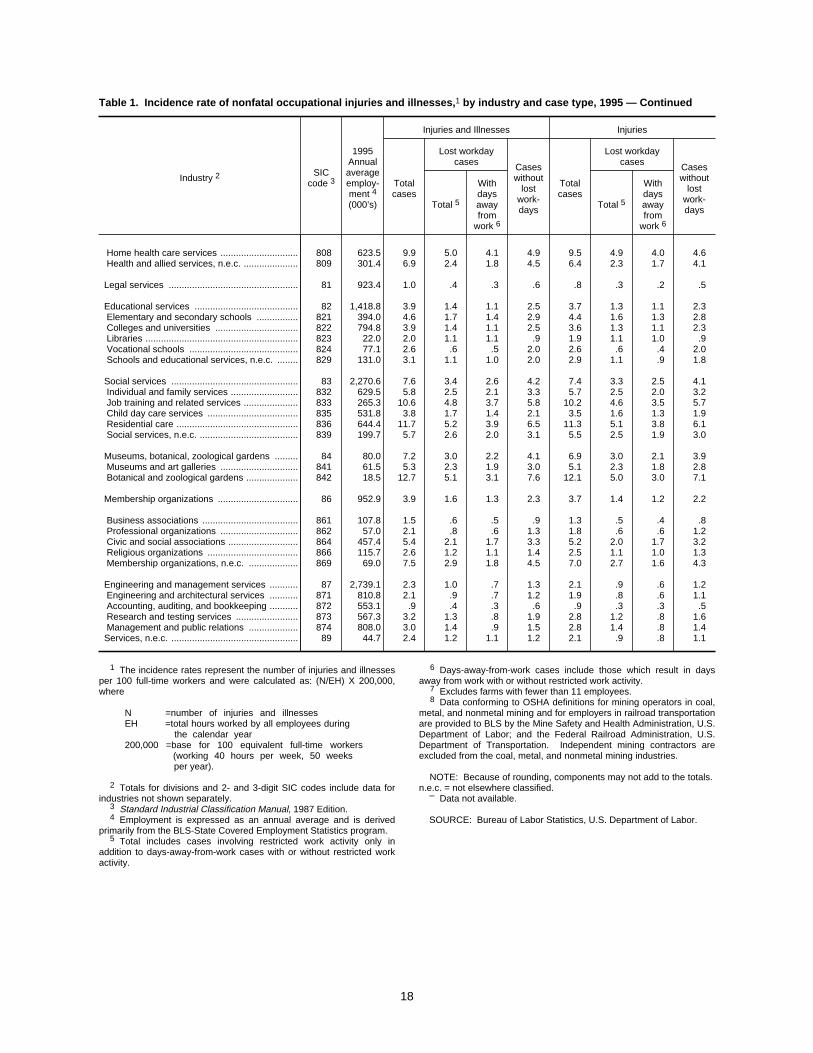
Table 1. Incidence rate of nonfatal occupational injuries and illnesses,1 by industry and case type, 1995 — Continued
Industry 2 SICcode 3
1995Annualaverageemploy-ment 4(000’s)
Injuries and Illnesses Injuries
Totalcases
Lost workdaycases Cases
withoutlost
work-days
Totalcases
Lost workdaycases Cases
withoutlost
work-daysTotal 5
Withdaysawayfrom
work 6
Total 5
Withdaysawayfrom
work 6
Home health care services .............................. 808 623.5 9.9 5.0 4.1 4.9 9.5 4.9 4.0 4.6 Health and allied services, n.e.c. ..................... 809 301.4 6.9 2.4 1.8 4.5 6.4 2.3 1.7 4.1
Legal services .................................................. 81 923.4 1.0 .4 .3 .6 .8 .3 .2 .5
Educational services ........................................ 82 1,418.8 3.9 1.4 1.1 2.5 3.7 1.3 1.1 2.3 Elementary and secondary schools ................ 821 394.0 4.6 1.7 1.4 2.9 4.4 1.6 1.3 2.8 Colleges and universities ................................ 822 794.8 3.9 1.4 1.1 2.5 3.6 1.3 1.1 2.3 Libraries ........................................................... 823 22.0 2.0 1.1 1.1 .9 1.9 1.1 1.0 .9 Vocational schools .......................................... 824 77.1 2.6 .6 .5 2.0 2.6 .6 .4 2.0 Schools and educational services, n.e.c. ........ 829 131.0 3.1 1.1 1.0 2.0 2.9 1.1 .9 1.8
Social services ................................................. 83 2,270.6 7.6 3.4 2.6 4.2 7.4 3.3 2.5 4.1 Individual and family services .......................... 832 629.5 5.8 2.5 2.1 3.3 5.7 2.5 2.0 3.2 Job training and related services ..................... 833 265.3 10.6 4.8 3.7 5.8 10.2 4.6 3.5 5.7 Child day care services ................................... 835 531.8 3.8 1.7 1.4 2.1 3.5 1.6 1.3 1.9 Residential care ............................................... 836 644.4 11.7 5.2 3.9 6.5 11.3 5.1 3.8 6.1 Social services, n.e.c. ...................................... 839 199.7 5.7 2.6 2.0 3.1 5.5 2.5 1.9 3.0
Museums, botanical, zoological gardens ......... 84 80.0 7.2 3.0 2.2 4.1 6.9 3.0 2.1 3.9 Museums and art galleries .............................. 841 61.5 5.3 2.3 1.9 3.0 5.1 2.3 1.8 2.8 Botanical and zoological gardens .................... 842 18.5 12.7 5.1 3.1 7.6 12.1 5.0 3.0 7.1
Membership organizations ............................... 86 952.9 3.9 1.6 1.3 2.3 3.7 1.4 1.2 2.2
Business associations ..................................... 861 107.8 1.5 .6 .5 .9 1.3 .5 .4 .8 Professional organizations .............................. 862 57.0 2.1 .8 .6 1.3 1.8 .6 .6 1.2 Civic and social associations ........................... 864 457.4 5.4 2.1 1.7 3.3 5.2 2.0 1.7 3.2 Religious organizations ................................... 866 115.7 2.6 1.2 1.1 1.4 2.5 1.1 1.0 1.3 Membership organizations, n.e.c. ................... 869 69.0 7.5 2.9 1.8 4.5 7.0 2.7 1.6 4.3
Engineering and management services ........... 87 2,739.1 2.3 1.0 .7 1.3 2.1 .9 .6 1.2 Engineering and architectural services ........... 871 810.8 2.1 .9 .7 1.2 1.9 .8 .6 1.1 Accounting, auditing, and bookkeeping ........... 872 553.1 .9 .4 .3 .6 .9 .3 .3 .5 Research and testing services ........................ 873 567.3 3.2 1.3 .8 1.9 2.8 1.2 .8 1.6 Management and public relations ................... 874 808.0 3.0 1.4 .9 1.5 2.8 1.4 .8 1.4 Services, n.e.c. ................................................. 89 44.7 2.4 1.2 1.1 1.2 2.1 .9 .8 1.1
1 The incidence rates represent the number of injuries and illnessesper 100 full-time workers and were calculated as: (N/EH) X 200,000,where
N =�number of injuries and illnesses EH =�total hours worked by all employees during the calendar year 200,000 =�base for 100 equivalent full-time workers (working 40 hours per week, 50 weeks per year).
2 Totals for divisions and 2- and 3-digit SIC codes include data forindustries not shown separately.
3 Standard Industrial Classification Manual, 1987 Edition. 4 Employment is expressed as an annual average and is derived
primarily from the BLS-State Covered Employment Statistics program. 5 Total includes cases involving restricted work activity only in
addition to days-away-from-work cases with or without restricted workactivity.
6 Days-away-from-work cases include those which result in daysaway from work with or without restricted work activity.
7 Excludes farms with fewer than 11 employees. 8 Data conforming to OSHA definitions for mining operators in coal,
metal, and nonmetal mining and for employers in railroad transportationare provided to BLS by the Mine Safety and Health Administration, U.S.Department of Labor; and the Federal Railroad Administration, U.S.Department of Transportation. Independent mining contractors areexcluded from the coal, metal, and nonmetal mining industries. NOTE: Because of rounding, components may not add to the totals. n.e.c. = not elsewhere classified.
– Data not available.
SOURCE: Bureau of Labor Statistics, U.S. Department of Labor.
18

Table 2. Number of nonfatal occupational injuries and illnesses, by industry and case type, 1995
Industry 1 SICcode 2
1995Annualaverageemploy-ment 3(000’s)
Injuries and Illnesses Injuries
Totalcases(000’s)
Lost workdaycases Cases
withoutlost
work-days
(000’s)
Totalcases(000’s)
Lost workdaycases Cases
withoutlost
work-days
(000’s)
Total 4(000’s)
Withdaysawayfrom
work 5(000’s)
Total 4(000’s)
Withdaysawayfrom
work 5(000’s)
Private industry 6 .......................................... 96,886.0 6,575.4 2,972.1 2,040.9 3,603.2 6,080.6 2,767.6 1,934.3 3,313.0
Agriculture, forestry, and fishing 6 ................. 1,641.3 120.8 53.5 42.1 67.2 115.4 51.7 40.8 63.7
Agricultural production 6 ..................................... 01-02 734.9 51.6 23.4 17.4 28.2 49.0 22.5 16.8 26.5
Agricultural production-crops 6 ......................... 01 566.6 37.5 17.2 12.9 20.3 35.5 16.6 12.5 18.8 Cash grains 6 ................................................... 011 23.7 .5 .3 .2 .2 .5 .3 .2 .2 Field crops, except cash grains 6 .................... 013 71.0 4.6 2.3 1.8 2.3 4.5 2.3 1.8 2.2 Vegetables and melons 6 ................................ 016 87.2 6.6 2.8 2.1 3.8 6.2 2.7 2.0 3.6 Fruits and tree nuts 6 ....................................... 017 169.2 9.2 4.5 3.8 4.7 8.6 4.4 3.7 4.2 Horticultural specialties 6 ................................. 018 155.9 13.5 6.0 4.0 7.5 12.7 5.8 3.9 6.9 General farms, primarily crop 6 ....................... 019 59.5 3.1 1.3 1.0 1.8 3.0 1.3 1.0 1.8
Agricultural production - livestock 6 .................. 02 168.3 14.2 6.2 4.5 7.9 13.5 5.9 4.4 7.6 Livestock, except dairy and poultry 6 ............... 021 56.6 5.0 2.1 1.7 2.9 4.8 2.0 1.6 2.8 Dairy farms 6 ................................................... 024 45.3 2.9 1.3 1.1 1.6 2.9 1.3 1.1 1.6 Poultry and eggs 6 ........................................... 025 46.1 5.2 2.3 1.3 2.9 4.8 2.1 1.2 2.7 Animal specialties 6 ......................................... 027 15.5 .8 .4 .3 .4 .8 .4 .3 .4 General farms, primarily animal 6 .................... 029 4.8 .2 .1 .1 .1 .2 .1 .1 .1
Agricultural services ......................................... 07 869.1 66.4 28.7 23.5 37.7 63.9 27.8 22.8 36.1 Crop services .................................................. 072 108.3 10.4 4.9 3.0 5.5 9.8 4.7 2.9 5.1 Veterinary services .......................................... 074 164.8 9.7 2.9 2.3 6.7 9.5 2.9 2.2 6.6 Animal services, except veterinary .................. 075 46.9 3.4 1.4 1.4 2.0 3.3 1.4 1.3 1.9 Farm labor and management services ............ 076 168.3 9.2 4.6 3.9 4.6 9.0 4.5 3.8 4.5 Landscape and horticultural services .............. 078 377.2 33.3 14.7 12.8 18.7 32.0 14.2 12.5 17.7
Forestry ............................................................ 08 24.4 1.9 .9 .8 1.0 1.8 .9 .8 .9 Timber tracts ................................................... 081 9.7 .9 .5 .4 .4 .8 .4 .4 .4 Forest products ............................................... 083 2.1 .2 .1 .1 .1 .2 .1 .1 .1 Forestry services ............................................. 085 12.5 .8 .4 .4 .4 .8 .4 .3 .4
Fishing, hunting, and trapping .......................... 09 12.9 .9 .5 .4 .4 .8 .5 .4 .3 Commercial fishing .......................................... 91 10.4 .7 .4 .3 .3 .6 .4 .3 .2
Mining 8 ............................................................. 582.4 37.8 23.4 19.8 14.4 36.3 22.8 19.3 13.4
Metal mining 8 .................................................. 10 51.4 2.4 1.3 .9 1.1 2.3 1.3 .8 1.0 Iron ores 8 ........................................................ 101 8.6 .6 .3 .2 .3 .5 .3 .2 .3 Copper ores 8 .................................................. 102 15.5 .5 .3 .2 .2 .5 .3 .2 .2 Lead and zinc ores 8 ....................................... 103 2.4 .1 .1 .1 .1 .1 .1 .1 .1 Gold and silver ores 8 ...................................... 104 18.3 1.0 .6 .3 .4 1.0 .6 .3 .4 Ferroalloy ores, except vanadium 8 ................. 106 .9 .1 7(� ) 7(� ) 7(� ) .1 7(� ) 7(� ) 7(� ) Miscellaneous metal ores 8 ............................. 109 2.2 .1 .1 .1 7(� ) .1 .1 .1 7(� )
Coal mining 8 .................................................... 12 104.5 9.3 6.9 6.4 2.4 8.9 6.8 6.4 2.1 Bituminous coal and lignite mining 8 ............... 122 97.3 9.0 6.7 6.3 2.3 8.7 6.6 6.2 2.0 Anthracite mining 8 .......................................... 123 1.3 .2 .2 .2 .1 .2 .2 .1 7(� )
Oil and gas extraction ....................................... 13 319.5 19.2 11.0 9.2 8.1 18.3 10.7 8.9 7.6 Crude petroleum and natural gas .................... 131 150.5 3.6 1.4 1.2 2.1 3.2 1.3 1.1 1.9 Oil and gas field services ................................ 138 163.6 15.5 9.5 7.9 5.9 14.9 9.3 7.7 5.6
Nonmetallic minerals, except fuels 8 ................ 14 107.0 7.0 4.2 3.3 2.8 6.8 4.1 3.2 2.7 Dimension stone 8 ........................................... 141 4.3 .3 .2 .2 .1 .3 .2 .2 .1 Crushed and broken stone 8 ........................... 142 40.1 3.6 2.1 1.6 1.5 3.6 2.1 1.6 1.5 Sand and gravel 8 ............................................ 144 35.0 1.7 1.0 .9 .6 1.6 1.0 .9 .6 Clay, ceramic, and refractory minerals 8 ......... 145 7.5 .5 .3 .3 .2 .5 .3 .3 .2 Chemical and fertilizer minerals 8 .................... 147 13.8 .5 .3 .2 .2 .5 .3 .2 .2 Miscellaneous nonmetallic minerals 8 ............. 149 5.1 .3 .2 .2 .1 .3 .2 .1 .1
See footnotes at end of table.
19

Table 2. Number of nonfatal occupational injuries and illnesses, by industry and case type, 1995 — Continued
Industry 1 SICcode 2
1995Annualaverageemploy-ment 3(000’s)
Injuries and Illnesses Injuries
Totalcases(000’s)
Lost workdaycases Cases
withoutlost
work-days
(000’s)
Totalcases(000’s)
Lost workdaycases Cases
withoutlost
work-days
(000’s)
Total 4(000’s)
Withdaysawayfrom
work 5(000’s)
Total 4(000’s)
Withdaysawayfrom
work 5(000’s)
Construction ..................................................... 5,088.1 484.9 221.9 190.6 262.9 476.2 217.9 186.8 258.2
General building contractors ............................ 15 1,202.0 104.7 47.1 40.3 57.6 102.7 46.1 39.4 56.6 Residential building construction ..................... 152 608.6 45.0 22.1 20.2 22.9 44.3 21.7 19.8 22.6 Operative builders ........................................... 153 26.9 1.5 .8 .7 .8 1.5 .7 .6 .8 Nonresidential building construction ................ 154 566.6 58.1 24.2 19.5 33.9 56.9 23.7 19.0 33.2 Heavy construction, except building ................. 16 748.9 70.5 34.4 27.9 36.1 68.7 33.7 27.2 35.1 Highway and street construction ..................... 161 222.6 22.3 10.7 8.7 11.6 21.8 10.4 8.4 11.3 Heavy construction, except highway ............... 162 526.2 48.2 23.7 19.2 24.5 47.0 23.3 18.7 23.7
Special trade contractors .................................. 17 3,137.2 309.6 140.5 122.4 169.2 304.7 138.1 120.2 166.6 Plumbing, heating, air-conditioning ................. 171 712.2 86.0 36.1 31.5 49.9 84.9 35.6 31.0 49.3 Painting and paper hanging ............................ 172 178.9 11.2 6.1 5.6 5.1 11.0 6.0 5.5 5.0 Electrical work ................................................. 173 592.4 59.9 23.0 19.1 36.9 59.3 22.8 18.8 36.5 Masonry, stonework, and plastering ................ 174 409.3 37.3 19.1 17.5 18.2 36.9 18.9 17.3 18.0 Carpentry and floor work ................................. 175 219.1 20.1 10.2 9.1 10.0 19.6 9.8 8.8 9.8 Roofing, siding, and sheet metal work ........... 176 208.3 25.6 13.4 11.7 12.2 25.2 13.2 11.5 12.0 Concrete work ................................................. 177 247.4 21.8 10.4 9.2 11.5 21.1 10.0 8.9 11.1 Water well drilling ............................................ 178 21.4 1.9 .9 .8 1.1 1.9 .8 .8 1.1 Miscellaneous special trade contractors ......... 179 548.2 45.7 21.4 18.0 24.3 44.8 21.0 17.6 23.8
Manufacturing ................................................... 18,473.4 2,122.6 970.7 527.5 1,151.9 1,818.3 838.1 475.5 980.2
Durable goods ................................................... 10,658.9 1,370.1 595.2 336.0 774.9 1,181.7 520.4 303.6 661.4
Lumber and wood products .............................. 24 767.0 112.1 52.7 35.4 59.4 106.6 50.7 34.2 55.9
Logging ............................................................ 241 82.0 7.7 4.9 4.5 2.8 7.3 4.8 4.5 2.5
Sawmills and planing mills .............................. 242 187.1 25.3 11.6 8.1 13.7 23.8 11.2 7.9 12.6 Sawmills and planing mills, general ............... 2421 148.2 18.5 8.8 6.1 9.7 17.5 8.5 5.9 9.0 Hardwood dimension and flooring mills .......... 2426 37.2 6.5 2.7 1.9 3.9 6.1 2.5 1.9 3.5
Millwork, plywood and structural members ..... 243 279.0 42.0 19.1 12.0 22.8 39.6 18.0 11.4 21.6 Millwork .......................................................... 2431 110.5 16.5 7.9 4.9 8.6 15.4 7.4 4.6 8.0 Wood kitchen cabinets ................................... 2434 76.0 10.7 4.4 2.8 6.3 9.9 4.0 2.6 5.9 Hardwood veneer and plywood ...................... 2435 28.2 4.5 2.3 1.2 2.2 4.3 2.2 1.2 2.1 Softwood veneer and plywood ....................... 2436 29.5 2.8 1.1 .5 1.8 2.7 1.0 .5 1.7 Structural wood members, n.e.c. .................... 2439 34.9 7.3 3.4 2.6 3.9 7.3 3.4 2.6 3.9
Wood containers ............................................. 244 50.6 8.2 4.0 3.1 4.2 8.1 4.0 3.1 4.1 Wood pallets and skids .................................. 2448 39.6 6.2 3.0 2.4 3.2 6.1 3.0 2.4 3.1
Wood buildings and mobile homes ................. 245 80.6 19.0 8.4 4.4 10.5 18.6 8.3 4.3 10.3 Mobile homes ................................................. 2451 61.5 15.2 6.3 3.1 8.9 15.0 6.2 3.1 8.8 Prefabricated wood buildings ......................... 2452 19.1 3.7 2.1 1.3 1.6 3.6 2.1 1.3 1.6
Miscellaneous wood products ......................... 249 87.7 10.0 4.7 3.2 5.3 9.1 4.3 3.0 4.8 Wood preserving ............................................ 2491 11.4 1.5 .6 .5 .8 1.4 .6 .5 .8 Reconstituted wood products ......................... 2493 20.1 1.7 .7 .4 1.0 1.6 .7 .4 .9 Wood products, n.e.c. .................................... 2499 56.2 6.8 3.3 2.3 3.5 6.1 3.0 2.1 3.1
Furniture and fixtures ....................................... 25 508.9 69.3 32.1 17.0 37.1 62.3 28.5 15.5 33.8
Household furniture ......................................... 251 280.4 35.5 16.6 9.1 18.9 32.2 15.2 8.3 17.0 Wood household furniture .............................. 2511 126.3 15.9 7.0 3.7 8.9 14.2 6.4 3.5 7.8 Upholstered household furniture .................... 2512 88.9 9.4 4.3 2.4 5.1 8.5 3.8 2.1 4.7 Metal household furniture ............................... 2514 22.4 3.2 1.7 .8 1.5 2.8 1.5 .7 1.4 Mattresses and bedsprings ............................ 2515 31.2 5.5 3.0 1.9 2.5 5.2 2.9 1.8 2.4 Wood television and radio cabinets ................ 2517 4.8 .6 .2 .1 .4 .5 .2 .1 .3 Household furniture, n.e.c. ............................. 2519 6.8 .9 .5 .2 .4 .9 .4 .2 .4
See footnotes at end of table.
20
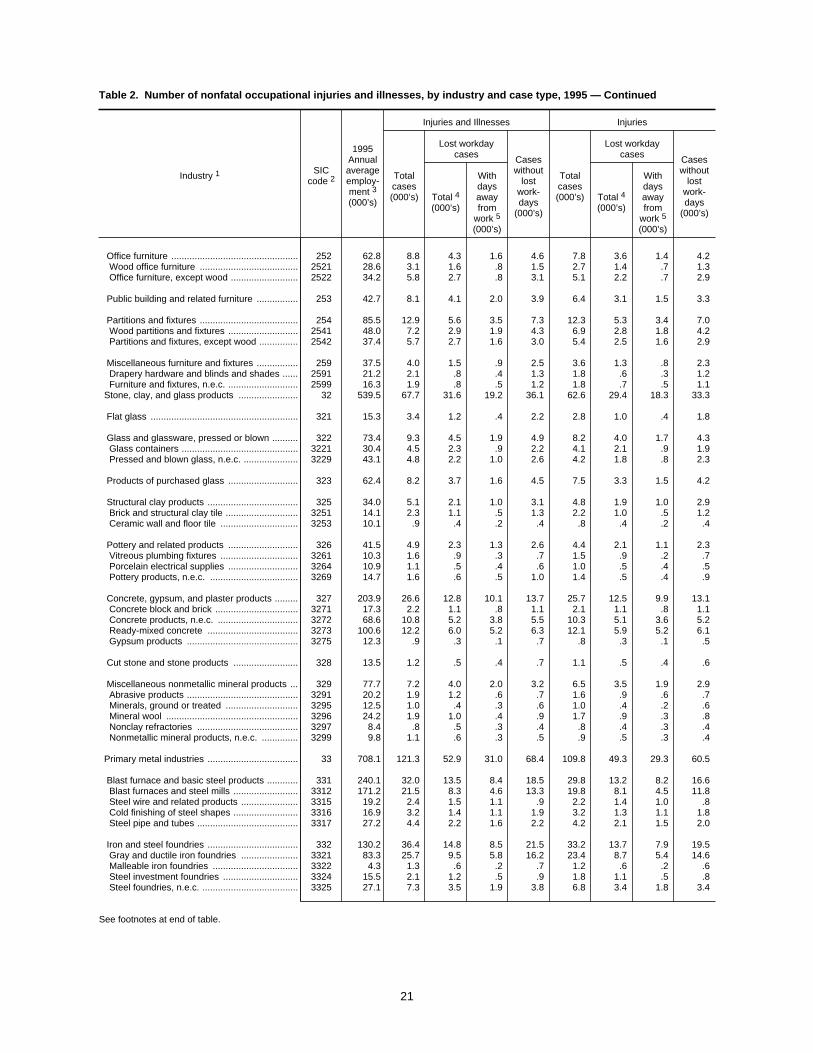
Table 2. Number of nonfatal occupational injuries and illnesses, by industry and case type, 1995 — Continued
Industry 1 SICcode 2
1995Annualaverageemploy-ment 3(000’s)
Injuries and Illnesses Injuries
Totalcases(000’s)
Lost workdaycases Cases
withoutlost
work-days
(000’s)
Totalcases(000’s)
Lost workdaycases Cases
withoutlost
work-days
(000’s)
Total 4(000’s)
Withdaysawayfrom
work 5(000’s)
Total 4(000’s)
Withdaysawayfrom
work 5(000’s)
Office furniture ................................................. 252 62.8 8.8 4.3 1.6 4.6 7.8 3.6 1.4 4.2 Wood office furniture ...................................... 2521 28.6 3.1 1.6 .8 1.5 2.7 1.4 .7 1.3 Office furniture, except wood .......................... 2522 34.2 5.8 2.7 .8 3.1 5.1 2.2 .7 2.9
Public building and related furniture ................ 253 42.7 8.1 4.1 2.0 3.9 6.4 3.1 1.5 3.3
Partitions and fixtures ...................................... 254 85.5 12.9 5.6 3.5 7.3 12.3 5.3 3.4 7.0 Wood partitions and fixtures ........................... 2541 48.0 7.2 2.9 1.9 4.3 6.9 2.8 1.8 4.2 Partitions and fixtures, except wood ............... 2542 37.4 5.7 2.7 1.6 3.0 5.4 2.5 1.6 2.9
Miscellaneous furniture and fixtures ................ 259 37.5 4.0 1.5 .9 2.5 3.6 1.3 .8 2.3 Drapery hardware and blinds and shades ...... 2591 21.2 2.1 .8 .4 1.3 1.8 .6 .3 1.2 Furniture and fixtures, n.e.c. ........................... 2599 16.3 1.9 .8 .5 1.2 1.8 .7 .5 1.1 Stone, clay, and glass products ....................... 32 539.5 67.7 31.6 19.2 36.1 62.6 29.4 18.3 33.3
Flat glass ......................................................... 321 15.3 3.4 1.2 .4 2.2 2.8 1.0 .4 1.8
Glass and glassware, pressed or blown .......... 322 73.4 9.3 4.5 1.9 4.9 8.2 4.0 1.7 4.3 Glass containers ............................................. 3221 30.4 4.5 2.3 .9 2.2 4.1 2.1 .9 1.9 Pressed and blown glass, n.e.c. ..................... 3229 43.1 4.8 2.2 1.0 2.6 4.2 1.8 .8 2.3
Products of purchased glass ........................... 323 62.4 8.2 3.7 1.6 4.5 7.5 3.3 1.5 4.2
Structural clay products ................................... 325 34.0 5.1 2.1 1.0 3.1 4.8 1.9 1.0 2.9 Brick and structural clay tile ............................ 3251 14.1 2.3 1.1 .5 1.3 2.2 1.0 .5 1.2 Ceramic wall and floor tile .............................. 3253 10.1 .9 .4 .2 .4 .8 .4 .2 .4
Pottery and related products ........................... 326 41.5 4.9 2.3 1.3 2.6 4.4 2.1 1.1 2.3 Vitreous plumbing fixtures .............................. 3261 10.3 1.6 .9 .3 .7 1.5 .9 .2 .7 Porcelain electrical supplies ........................... 3264 10.9 1.1 .5 .4 .6 1.0 .5 .4 .5 Pottery products, n.e.c. .................................. 3269 14.7 1.6 .6 .5 1.0 1.4 .5 .4 .9
Concrete, gypsum, and plaster products ......... 327 203.9 26.6 12.8 10.1 13.7 25.7 12.5 9.9 13.1 Concrete block and brick ................................ 3271 17.3 2.2 1.1 .8 1.1 2.1 1.1 .8 1.1 Concrete products, n.e.c. ............................... 3272 68.6 10.8 5.2 3.8 5.5 10.3 5.1 3.6 5.2 Ready-mixed concrete ................................... 3273 100.6 12.2 6.0 5.2 6.3 12.1 5.9 5.2 6.1 Gypsum products ........................................... 3275 12.3 .9 .3 .1 .7 .8 .3 .1 .5
Cut stone and stone products ......................... 328 13.5 1.2 .5 .4 .7 1.1 .5 .4 .6
Miscellaneous nonmetallic mineral products ... 329 77.7 7.2 4.0 2.0 3.2 6.5 3.5 1.9 2.9 Abrasive products ........................................... 3291 20.2 1.9 1.2 .6 .7 1.6 .9 .6 .7 Minerals, ground or treated ............................ 3295 12.5 1.0 .4 .3 .6 1.0 .4 .2 .6 Mineral wool ................................................... 3296 24.2 1.9 1.0 .4 .9 1.7 .9 .3 .8 Nonclay refractories ....................................... 3297 8.4 .8 .5 .3 .4 .8 .4 .3 .4 Nonmetallic mineral products, n.e.c. .............. 3299 9.8 1.1 .6 .3 .5 .9 .5 .3 .4
Primary metal industries ................................... 33 708.1 121.3 52.9 31.0 68.4 109.8 49.3 29.3 60.5
Blast furnace and basic steel products ............ 331 240.1 32.0 13.5 8.4 18.5 29.8 13.2 8.2 16.6 Blast furnaces and steel mills ......................... 3312 171.2 21.5 8.3 4.6 13.3 19.8 8.1 4.5 11.8 Steel wire and related products ...................... 3315 19.2 2.4 1.5 1.1 .9 2.2 1.4 1.0 .8 Cold finishing of steel shapes ......................... 3316 16.9 3.2 1.4 1.1 1.9 3.2 1.3 1.1 1.8 Steel pipe and tubes ....................................... 3317 27.2 4.4 2.2 1.6 2.2 4.2 2.1 1.5 2.0
Iron and steel foundries ................................... 332 130.2 36.4 14.8 8.5 21.5 33.2 13.7 7.9 19.5 Gray and ductile iron foundries ...................... 3321 83.3 25.7 9.5 5.8 16.2 23.4 8.7 5.4 14.6 Malleable iron foundries ................................. 3322 4.3 1.3 .6 .2 .7 1.2 .6 .2 .6 Steel investment foundries ............................. 3324 15.5 2.1 1.2 .5 .9 1.8 1.1 .5 .8 Steel foundries, n.e.c. ..................................... 3325 27.1 7.3 3.5 1.9 3.8 6.8 3.4 1.8 3.4
See footnotes at end of table.
21

Table 2. Number of nonfatal occupational injuries and illnesses, by industry and case type, 1995 — Continued
Industry 1 SICcode 2
1995Annualaverageemploy-ment 3(000’s)
Injuries and Illnesses Injuries
Totalcases(000’s)
Lost workdaycases Cases
withoutlost
work-days
(000’s)
Totalcases(000’s)
Lost workdaycases Cases
withoutlost
work-days
(000’s)
Total 4(000’s)
Withdaysawayfrom
work 5(000’s)
Total 4(000’s)
Withdaysawayfrom
work 5(000’s)
Primary nonferrous metals .............................. 333 39.9 5.8 2.5 1.4 3.3 5.0 2.3 1.3 2.8 Primary copper ............................................... 3331 5.3 .7 .2 .2 .5 .6 .2 .2 .5 Primary aluminum .......................................... 3334 22.6 3.8 1.7 1.0 2.1 3.3 1.6 .9 1.7 Primary nonferrous metals, n.e.c. .................. 3339 11.9 1.3 .6 .3 .7 1.1 .5 .2 .6
Secondary nonferrous metals ......................... 334 15.8 4.2 2.0 1.4 2.2 3.9 2.0 1.4 2.0
Nonferrous rolling and drawing ....................... 335 166.8 20.8 9.6 4.9 11.2 18.1 8.8 4.6 9.3 Copper rolling and drawing ............................ 3351 22.5 2.6 1.5 .9 1.1 2.5 1.5 .9 1.1 Aluminum sheet, plate, and foil ...................... 3353 22.1 2.6 1.1 .4 1.5 2.4 1.0 .3 1.4 Aluminum extruded products .......................... 3354 31.0 4.2 2.1 1.0 2.1 3.9 2.0 1.0 1.9 Aluminum rolling and drawing, n.e.c. ............. 3355 5.2 .7 .3 .1 .4 .7 .3 .1 .4 Nonferrous rolling and drawing, n.e.c. ............ 3356 13.2 1.6 .7 .4 1.0 1.5 .6 .4 .8 Nonferrous wiredrawing and insulating .......... 3357 72.7 9.0 3.9 2.1 5.1 7.1 3.4 1.9 3.8
Nonferrous foundries (castings) ...................... 336 86.9 18.2 8.6 5.1 9.6 16.2 7.7 4.6 8.5 Aluminum die-castings ................................... 3363 36.4 8.9 3.9 2.4 5.0 7.6 3.4 2.1 4.2 Nonferrous die-casting except aluminum ....... 3364 10.9 1.9 1.0 .5 .9 1.8 .9 .4 .9 Aluminum foundries ........................................ 3365 23.8 5.2 2.5 1.3 2.7 4.7 2.3 1.2 2.4 Miscellaneous primary metal products ............ 339 28.4 3.8 1.8 1.4 1.9 3.6 1.7 1.3 1.9 Primary metal products, n.e.c. ........................ 3399 11.1 1.3 .6 .4 .8 1.2 .5 .4 .7
Fabricated metal products ................................ 34 1,438.4 230.0 99.8 59.6 130.2 210.5 92.2 55.7 118.3
Metal cans and shipping containers ................ 341 41.2 5.8 2.5 1.0 3.3 5.2 2.4 1.0 2.8 Metal cans ...................................................... 3411 33.6 4.3 1.6 .6 2.7 3.8 1.5 .6 2.3 Metal barrels, drums, and pails ...................... 3412 7.7 1.5 .9 .4 .6 1.4 .9 .4 .5
Cutlery, handtools, and hardware ................... 342 128.0 17.7 7.8 3.8 10.0 14.6 6.3 3.3 8.3 Cutlery ............................................................ 3421 11.8 1.4 .7 .3 .7 1.1 .6 .3 .5 Hand and edge tools, n.e.c. ........................... 3423 37.4 4.8 1.8 .9 2.9 4.1 1.5 .8 2.6 Saw blades and handsaws ............................. 3425 7.2 1.1 .5 .2 .6 1.0 .4 .2 .5 Hardware, n.e.c. ............................................. 3429 71.6 10.5 4.8 2.3 5.7 8.5 3.9 2.0 4.6
Plumbing and heating, except electric ............. 343 57.8 8.2 3.1 1.5 5.1 6.9 2.8 1.4 4.1 Metal sanitary ware ........................................ 3431 14.8 3.3 .9 .3 2.4 2.5 .8 .3 1.6 Plumbing fixture fittings and trim .................... 3432 23.4 2.1 1.2 .5 .9 1.8 1.0 .4 .8 Heating equipment, except electric ................ 3433 19.6 2.8 1.1 .6 1.7 2.6 1.0 .6 1.7
Fabricated structural metal products ............... 344 427.9 73.9 33.1 22.1 40.8 71.6 32.1 21.4 39.5 Fabricated structural metal ............................. 3441 73.0 14.6 6.5 4.7 8.0 14.3 6.4 4.6 7.8 Metal doors, sash, and trim ............................ 3442 76.0 12.8 6.0 3.2 6.9 12.3 5.6 3.0 6.6 Fabricated plate work (boiler shops) .............. 3443 102.3 18.0 8.2 5.7 9.8 17.3 7.9 5.4 9.4 Sheet metalwork ............................................. 3444 109.6 16.9 7.0 4.7 9.9 16.4 6.8 4.6 9.7 Architectural metal work ................................. 3446 28.2 4.7 2.3 1.7 2.4 4.6 2.2 1.7 2.4 Prefabricated metal buildings ......................... 3448 26.2 5.2 2.3 1.5 3.0 5.1 2.3 1.5 2.9 Miscellaneous metal work .............................. 3449 12.6 1.6 .9 .6 .7 1.6 .9 .6 .7
Screw machine products, bolts, etc. ................ 345 100.2 13.2 5.7 3.4 7.5 12.6 5.5 3.3 7.1 Screw machine products ................................ 3451 52.2 7.0 3.2 2.0 3.8 6.6 3.0 1.9 3.5 Bolts, nuts, rivets, and washers ...................... 3452 48.0 6.2 2.5 1.4 3.7 6.0 2.4 1.4 3.6
Metal forgings and stampings ......................... 346 251.5 52.5 20.5 11.6 32.1 45.7 18.1 10.5 27.6 Iron and steel forgings .................................... 3462 30.9 6.4 3.1 1.6 3.3 6.1 3.0 1.5 3.1 Nonferrous forgings ........................................ 3463 7.0 .6 .3 .2 .4 .6 .2 .2 .4 Automotive stampings .................................... 3465 115.3 28.5 9.9 5.6 18.6 23.0 8.1 4.7 14.9 Metal stampings, n.e.c. .................................. 3469 93.5 16.4 7.1 4.2 9.3 15.4 6.6 4.0 8.9
Metal services, n.e.c. ....................................... 347 129.0 18.4 8.9 5.2 9.5 17.3 8.4 4.9 8.9 Plating and polishing ...................................... 3471 79.2 10.8 5.0 3.1 5.7 10.0 4.7 2.9 5.3
See footnotes at end of table.
22

Table 2. Number of nonfatal occupational injuries and illnesses, by industry and case type, 1995 — Continued
Industry 1 SICcode 2
1995Annualaverageemploy-ment 3(000’s)
Injuries and Illnesses Injuries
Totalcases(000’s)
Lost workdaycases Cases
withoutlost
work-days
(000’s)
Totalcases(000’s)
Lost workdaycases Cases
withoutlost
work-days
(000’s)
Total 4(000’s)
Withdaysawayfrom
work 5(000’s)
Total 4(000’s)
Withdaysawayfrom
work 5(000’s)
Metal coating and allied services ................... 3479 49.8 7.6 3.9 2.1 3.7 7.3 3.7 2.0 3.6 Ordnance and accessories, n.e.c. ................... 348 50.8 3.7 1.7 .8 2.0 2.9 1.3 .7 1.6 Small arms ammunition .................................. 3482 8.6 .6 .3 .2 .2 .4 .2 .1 .2 Ammunition, except for small arms, n.e.c. ..... 3483 26.3 1.8 .7 .3 1.1 1.3 .5 .3 .8 Small arms ..................................................... 3484 11.7 1.1 .5 .2 .6 .9 .4 .2 .5 Ordnance and accessories, n.e.c. .................. 3489 4.3 .2 .1 .1 .1 .2 .1 .1 .1
Miscellaneous fabricated metal products ........ 349 252.0 36.5 16.6 10.2 19.9 33.6 15.2 9.3 18.4 Industrial valves .............................................. 3491 26.5 3.3 1.2 .7 2.1 3.0 1.1 .6 1.9 Fluid power valves and hose fittings .............. 3492 32.5 3.9 1.9 .9 2.1 3.5 1.6 .8 1.8 Valves and pipe fittings, n.e.c. ........................ 3494 24.9 4.2 2.0 1.5 2.2 3.7 1.8 1.3 1.9 Miscellaneous fabricated wire products ......... 3496 56.5 8.3 4.4 2.6 3.9 7.6 3.9 2.3 3.7 Fabricated pipe and fittings ............................ 3498 27.9 3.9 1.9 1.2 2.0 3.6 1.7 1.1 1.9 Fabricated metal products, n.e.c. ................... 3499 58.3 9.8 4.1 2.4 5.7 9.1 3.8 2.2 5.3
Industrial machinery and equipment ................ 35 2,060.8 233.2 92.9 56.4 140.3 211.9 84.3 52.5 127.6
Engines and turbines ....................................... 351 88.4 10.5 4.2 2.2 6.2 8.5 3.5 1.9 4.9 Turbines and turbine generator sets .............. 3511 26.3 3.1 1.3 .7 1.8 2.7 1.2 .6 1.5 Internal combustion engines, n.e.c. ................ 3519 62.1 7.3 2.9 1.6 4.4 5.8 2.4 1.3 3.4
Farm and garden machinery ........................... 352 102.9 16.3 6.5 3.7 9.8 14.6 5.8 3.4 8.8 Farm machinery and equipment ..................... 3523 74.7 11.7 4.6 2.7 7.1 10.8 4.3 2.5 6.5 Lawn and garden equipment .......................... 3524 28.1 4.6 1.8 1.0 2.7 3.8 1.6 .9 2.2
Construction and related machinery ................ 353 221.2 30.4 12.9 8.1 17.5 28.9 12.4 7.8 16.5 Construction machinery .................................. 3531 78.8 12.1 4.5 2.8 7.6 11.3 4.3 2.7 7.0 Mining machinery ........................................... 3532 16.4 2.9 1.2 .8 1.6 2.7 1.2 .8 1.5 Oil and gas field machinery ............................ 3533 38.8 3.1 1.3 .8 1.8 3.0 1.3 .7 1.7 Elevators and moving stairways ..................... 3534 9.9 1.0 .5 .3 .5 1.0 .5 .3 .5 Conveyors and conveying equipment ............ 3535 40.2 4.5 2.0 1.5 2.5 4.5 1.9 1.5 2.5 Hoists, cranes, and monorails ........................ 3536 8.0 1.7 .9 .5 .8 1.7 .9 .5 .8 Industrial trucks and tractors .......................... 3537 29.2 5.1 2.5 1.4 2.6 4.9 2.4 1.3 2.5
Metalworking machinery .................................. 354 340.0 37.4 13.3 8.6 24.2 35.5 12.4 8.0 23.1 Machine tools, metal cutting types ................. 3541 39.7 4.2 1.6 1.2 2.6 4.0 1.5 1.2 2.5 Special dies, tools, jigs and fixtures ............... 3544 162.2 17.8 5.6 3.8 12.2 17.2 5.3 3.6 11.9 Machine tool accessories ............................... 3545 50.7 5.2 1.7 1.1 3.5 4.8 1.6 1.0 3.2 Power-driven handtools .................................. 3546 24.9 1.9 .9 .5 1.0 1.5 .7 .4 .8 Welding apparatus ......................................... 3548 21.2 2.4 .9 .6 1.5 2.2 .8 .5 1.3 Metalworking machinery, n.e.c. ...................... 3549 10.7 1.2 .6 .3 .6 1.2 .6 .2 .6
Special industry machinery ............................. 355 170.8 19.8 7.1 4.8 12.7 18.9 6.7 4.6 12.2 Textile machinery ........................................... 3552 15.6 1.7 .5 .5 1.2 1.7 .5 .5 1.2 Woodworking machinery ................................ 3553 11.3 1.6 .7 .4 .9 1.5 .7 .4 .9 Paper industries machinery ............................ 3554 21.6 2.4 .8 .5 1.5 2.2 .8 .5 1.5 Printing trades machinery ............................... 3555 23.1 2.2 .9 .5 1.3 2.0 .8 .5 1.2 Food products machinery ............................... 3556 24.9 3.6 1.2 .9 2.3 3.4 1.2 .8 2.2 Special industry machinery, n.e.c. .................. 3559 74.4 8.3 2.9 2.0 5.4 8.0 2.7 1.9 5.3
General industrial machinery ........................... 356 250.9 30.3 11.1 7.1 19.1 27.8 10.3 6.7 17.4 Pumps and pumping equipment ..................... 3561 29.3 2.8 1.1 .7 1.7 2.5 1.0 .6 1.5 Ball and roller bearings ................................... 3562 39.1 4.9 1.7 .9 3.2 4.1 1.5 .8 2.5 Air and gas compressors ................................ 3563 26.1 2.9 .9 .7 2.0 2.7 .9 .6 1.8 Blowers and fans ............................................ 3564 34.3 4.7 1.7 1.3 3.0 4.5 1.6 1.2 2.9 Packaging machinery ..................................... 3565 21.9 2.8 .9 .5 1.9 2.7 .8 .5 1.9 Speed changers, drives, and gears ................ 3566 16.8 2.1 .7 .5 1.4 1.9 .7 .4 1.3 Industrial furnaces and ovens ........................ 3567 18.1 2.1 .8 .4 1.3 2.0 .7 .4 1.3 Power transmission equipment, n.e.c. ........... 3568 20.8 2.5 1.1 .7 1.4 2.4 1.0 .6 1.3 General industrial machinery, n.e.c. ............... 3569 44.6 5.5 2.2 1.6 3.3 5.0 2.0 1.5 3.0 Computer and office equipment ...................... 357 350.0 12.8 6.3 3.1 6.5 10.1 5.0 2.6 5.1
See footnotes at end of table.
23

Table 2. Number of nonfatal occupational injuries and illnesses, by industry and case type, 1995 — Continued
Industry 1 SICcode 2
1995Annualaverageemploy-ment 3(000’s)
Injuries and Illnesses Injuries
Totalcases(000’s)
Lost workdaycases Cases
withoutlost
work-days
(000’s)
Totalcases(000’s)
Lost workdaycases Cases
withoutlost
work-days
(000’s)
Total 4(000’s)
Withdaysawayfrom
work 5(000’s)
Total 4(000’s)
Withdaysawayfrom
work 5(000’s)
Electronic computers ...................................... 3571 192.0 5.7 2.7 1.4 3.0 4.4 2.1 1.1 2.3 Computer storage devices ............................. 3572 40.5 1.6 .7 .4 .9 1.2 .5 .3 .6 Computer peripheral equipment, n.e.c. .......... 3577 60.4 2.7 1.4 .6 1.3 2.3 1.1 .5 1.1 Office machines, n.e.c. ................................... 3579 26.9 1.7 .9 .4 .8 1.4 .7 .4 .7
Refrigeration and service machinery ............... 358 201.6 33.5 14.8 7.2 18.7 28.0 12.5 6.6 15.5 Automatic vending machines ......................... 3581 7.9 1.2 .5 .3 .7 1.1 .4 .2 .6 Refrigeration and heating equipment ............. 3585 139.0 24.3 10.8 5.0 13.4 19.6 8.9 4.6 10.7 Measuring and dispensing pumps .................. 3586 5.5 .8 .3 .1 .5 .6 .2 .1 .4 Service industry machinery, n.e.c. ................. 3589 43.1 6.3 2.8 1.5 3.5 5.8 2.6 1.5 3.2
Industrial machinery, n.e.c. ............................. 359 335.0 42.2 16.6 11.4 25.6 39.7 15.5 10.9 24.2 Carburetors, pistons, rings, valves ................. 3592 22.3 3.0 1.2 .7 1.8 2.4 1.0 .6 1.4 Fluid power cylinders and actuators ............... 3593 18.8 3.1 1.2 .8 1.9 2.8 1.1 .8 1.8 Fluid power pumps and motors ...................... 3594 26.5 3.1 1.4 1.0 1.7 2.8 1.3 1.0 1.5 Scales and balances, except laboratory ......... 3596 6.6 .6 .3 .2 .3 .6 .3 .2 .3 Industrial machinery, n.e.c. ............................ 3599 261.0 32.4 12.5 8.7 19.9 31.1 11.9 8.4 19.2
Electronic and other electric equipment ........... 36 1,624.0 123.0 53.7 27.5 69.4 97.8 42.3 22.8 55.5
Electric distribution equipment ........................ 361 83.7 7.7 3.4 1.7 4.3 6.6 2.9 1.4 3.7 Transformers, except electronic ..................... 3612 41.2 4.4 1.9 1.0 2.5 3.7 1.6 .8 2.1 Switchgear and switchboard apparatus ......... 3613 42.5 3.3 1.5 .7 1.8 2.9 1.3 .6 1.6
Electrical industrial apparatus ......................... 362 157.4 13.5 5.7 2.9 7.7 10.9 4.5 2.3 6.4 Motors and generators ................................... 3621 78.9 8.4 3.6 1.8 4.8 6.7 2.8 1.4 4.0 Carbon and graphite products ........................ 3624 10.0 1.0 .5 .2 .5 .9 .5 .2 .4 Relays and industrial controls ........................ 3625 58.8 3.5 1.3 .8 2.2 2.8 1.0 .6 1.8 Electrical industrial apparatus, n.e.c. .............. 3629 9.7 .5 .3 .1 .2 .4 .2 .1 .2
Household appliances ..................................... 363 120.4 18.0 7.4 3.1 10.6 13.3 5.4 2.5 7.9 Household cooking equipment ....................... 3631 21.4 3.4 1.2 .4 2.2 2.7 .9 .3 1.7 Household refrigerators and freezers ............. 3632 29.7 4.5 1.9 .7 2.6 3.3 1.3 .5 1.9 Household laundry equipment ........................ 3633 16.7 3.2 1.4 .5 1.8 2.1 .9 .3 1.3 Electric housewares and fans ........................ 3634 28.6 3.7 1.5 .8 2.2 2.5 1.1 .7 1.4 Household vacuum cleaners .......................... 3635 10.8 .9 .4 .2 .5 .7 .3 .2 .4 Household appliances, n.e.c. ......................... 3639 13.1 2.4 1.1 .5 1.4 1.9 .9 .5 1.1
Electric lighting and wiring equipment ............. 364 178.4 17.9 7.6 4.2 10.3 15.7 6.5 3.8 9.2 Electric lamps ................................................. 3641 22.8 1.7 .7 .5 1.0 1.6 .6 .4 1.0 Current-carrying wiring devices ...................... 3643 62.0 5.7 2.4 1.4 3.3 5.2 2.2 1.3 3.0 Noncurrent-carrying wiring devices ................ 3644 17.9 2.0 1.0 .5 1.1 1.9 .9 .5 1.0 Residential lighting fixtures ............................. 3645 19.7 2.1 .7 .5 1.4 2.0 .6 .4 1.3 Commercial lighting fixtures ........................... 3646 25.6 2.4 1.2 .6 1.2 2.1 1.0 .5 1.1 Vehicular lighting equipment .......................... 3647 18.0 2.5 .9 .4 1.6 2.0 .7 .3 1.3 Lighting equipment, n.e.c. .............................. 3648 12.5 1.4 .7 .3 .7 1.0 .5 .2 .5
Household audio and video equipment ........... 365 83.0 6.5 2.8 1.4 3.6 5.6 2.4 1.2 3.2 Household audio and video equipment .......... 3651 55.4 5.0 2.2 1.0 2.8 4.3 1.8 .9 2.4 Prerecorded records and tapes ...................... 3652 27.6 1.5 .6 .4 .9 1.3 .6 .4 .7
Communications equipment ............................ 366 263.6 10.4 5.0 2.6 5.4 8.5 4.1 2.2 4.4 Telephone and telegraph apparatus .............. 3661 112.2 3.3 1.5 .8 1.7 2.6 1.2 .6 1.3 Radio and TV communications equipment ..... 3663 123.7 5.8 2.9 1.5 2.9 4.7 2.3 1.2 2.4 Communications equipment, n.e.c. ................ 3669 27.6 1.4 .7 .3 .8 1.2 .5 .3 .7
Electronic components and accessories ......... 367 581.4 32.7 14.3 8.2 18.4 26.0 11.1 6.7 14.9 Electron tubes ................................................ 3671 24.6 2.4 1.1 .9 1.3 2.0 .9 .8 1.1 Printed circuit boards ...................................... 3672 117.6 7.8 3.5 2.0 4.3 6.9 3.0 1.7 3.9 Semiconductors and related devices ............. 3674 235.2 9.3 4.0 2.2 5.3 6.5 2.8 1.7 3.7 Electronic capacitors ...................................... 3675 21.6 1.2 .5 .3 .7 1.1 .4 .2 .6
See footnotes at end of table.
24

Table 2. Number of nonfatal occupational injuries and illnesses, by industry and case type, 1995 — Continued
Industry 1 SICcode 2
1995Annualaverageemploy-ment 3(000’s)
Injuries and Illnesses Injuries
Totalcases(000’s)
Lost workdaycases Cases
withoutlost
work-days
(000’s)
Totalcases(000’s)
Lost workdaycases Cases
withoutlost
work-days
(000’s)
Total 4(000’s)
Withdaysawayfrom
work 5(000’s)
Total 4(000’s)
Withdaysawayfrom
work 5(000’s)
Electronic resistors ......................................... 3676 10.7 0.8 0.2 0.2 0.5 0.6 0.2 0.1 0.4 Electronic coils and transformers ................... 3677 18.6 1.8 .6 .4 1.2 1.4 .4 .3 .9 Electronic connectors ..................................... 3678 17.2 1.3 .6 .3 .6 1.1 .6 .3 .6 Electronic components, n.e.c. ........................ 3679 135.8 8.1 3.7 2.0 4.4 6.4 2.8 1.6 3.7
Miscellaneous electrical equipment andsupplies ........................................................ 369 156.2 16.4 7.3 3.3 9.1 11.4 5.4 2.5 6.0
Storage batteries ............................................ 3691 27.0 3.2 1.2 .4 2.0 2.2 .9 .4 1.3 Primary batteries, dry and wet ........................ 3692 11.9 1.1 .6 .4 .6 .9 .5 .3 .4 Engine electrical equipment ........................... 3694 70.6 8.9 3.9 1.8 5.0 5.6 2.6 1.3 3.0 Magnetic and optical recording media ............ 3695 17.0 1.0 .6 .3 .3 .7 .5 .2 .2 Electrical equipment and supplies, n.e.c. ....... 3699 29.6 2.2 1.0 .5 1.2 2.0 .9 .4 1.1
Transportation equipment ................................ 37 1,783.0 336.1 143.6 70.0 192.5 257.4 115.0 58.6 142.3
Motor vehicles and equipment ........................ 371 967.6 231.6 98.1 47.7 133.6 169.4 75.1 38.7 94.3 Motor vehicles and car bodies ........................ 3711 358.9 112.9 45.2 20.6 67.7 75.4 31.8 15.3 43.6 Truck and bus bodies ..................................... 3713 38.3 8.6 3.0 1.9 5.5 7.8 2.8 1.8 5.0 Motor vehicle parts and accessories .............. 3714 511.9 95.1 43.4 22.1 51.7 72.4 34.8 18.9 37.6 Truck trailers ................................................... 3715 39.3 12.5 5.0 2.7 7.5 11.5 4.5 2.4 7.1 Motor homes .................................................. 3716 19.2 2.6 1.4 .4 1.2 2.3 1.2 .3 1.0
Aircraft and parts ............................................. 372 449.0 39.6 16.1 7.8 23.6 31.4 13.6 6.6 17.8 Aircraft ............................................................ 3721 243.8 21.2 8.3 4.5 12.9 15.6 6.8 3.7 8.9 Aircraft engines and engine parts ................... 3724 92.2 7.7 3.1 1.0 4.6 6.6 2.8 .9 3.8 Aircraft parts and equipment, n.e.c. ............... 3728 113.0 10.7 4.6 2.3 6.1 9.2 4.1 2.0 5.1
Ship and boat building and repairing ............... 373 158.3 42.4 19.9 9.2 22.4 37.2 17.8 8.6 19.4 Ship building and repairing ............................. 3731 104.3 33.0 16.1 6.8 16.9 28.6 14.3 6.3 14.3 Boat building and repairing ............................. 3732 53.9 9.4 3.8 2.4 5.6 8.6 3.5 2.3 5.1
Railroad equipment ......................................... 374 36.5 5.9 2.5 1.2 3.4 5.4 2.4 1.1 3.0
Motorcycles, bicycles, and parts ..................... 375 20.8 3.9 1.4 1.0 2.4 2.9 1.1 .7 1.8
Guided missiles, space vehicles, parts ........... 376 98.0 3.9 1.7 .9 2.2 3.2 1.5 .8 1.7 Guided missiles and space vehicles .............. 3761 69.1 2.6 1.1 .6 1.5 2.0 .9 .5 1.1 Space vehicle equipment, n.e.c. .................... 3769 11.9 .6 .3 .2 .3 .6 .3 .2 .3
Miscellaneous transportation equipment ......... 379 52.8 8.7 3.9 2.3 4.9 8.0 3.6 2.1 4.4 Travel trailers and campers ............................ 3792 22.2 4.9 2.0 1.1 2.9 4.4 1.9 1.1 2.6 Tanks and tank components .......................... 3795 7.9 .4 .2 .1 .2 .3 .1 .1 .2 Transportation equipment, n.e.c. .................... 3799 22.7 3.5 1.7 1.0 1.8 3.2 1.6 .9 1.6
Instruments and related products ..................... 38 838.0 43.3 19.9 10.3 23.4 32.9 15.0 8.2 17.9
Search and navigation equipment ................... 381 158.7 4.9 1.9 1.2 3.0 3.4 1.4 .9 2.0
Measuring and controlling devices .................. 382 286.2 15.0 6.9 3.7 8.0 11.7 5.3 3.0 6.4 Laboratory apparatus and furniture ................ 3821 9.6 .7 .3 .2 .4 .7 .3 .1 .4 Environmental controls ................................... 3822 43.3 3.0 1.5 .8 1.5 2.1 1.1 .6 1.0 Process control instruments ........................... 3823 64.0 3.4 1.6 .8 1.8 2.9 1.2 .6 1.6 Fluid meters and counting devices ................. 3824 11.8 .9 .3 .2 .5 .8 .3 .2 .5 Instruments to measure electricity .................. 3825 70.8 2.9 1.3 .7 1.7 2.1 .9 .5 1.2 Analytical instruments .................................... 3826 27.6 1.4 .7 .3 .7 1.0 .5 .3 .5 Optical instruments and lenses ...................... 3827 18.2 .8 .4 .2 .5 .8 .3 .2 .4 Measuring and controlling devices, n.e.c. ...... 3829 40.9 1.8 .9 .5 .9 1.5 .7 .4 .8 Medical instruments and supplies ................... 384 263.8 16.1 7.7 3.7 8.4 12.7 5.9 3.0 6.9 Surgical and medical instruments .................. 3841 100.4 6.3 3.2 1.6 3.2 4.7 2.3 1.2 2.4 Surgical appliances and supplies ................... 3842 94.6 6.6 3.2 1.4 3.4 5.4 2.5 1.1 2.9 Dental equipment and supplies ...................... 3843 13.9 .9 .4 .3 .5 .8 .4 .2 .4
See footnotes at end of table.
25

Table 2. Number of nonfatal occupational injuries and illnesses, by industry and case type, 1995 — Continued
Industry 1 SICcode 2
1995Annualaverageemploy-ment 3(000’s)
Injuries and Illnesses Injuries
Totalcases(000’s)
Lost workdaycases Cases
withoutlost
work-days
(000’s)
Totalcases(000’s)
Lost workdaycases Cases
withoutlost
work-days
(000’s)
Total 4(000’s)
Withdaysawayfrom
work 5(000’s)
Total 4(000’s)
Withdaysawayfrom
work 5(000’s)
X-ray apparatus and tubes ............................. 3844 12.7 0.8 0.3 0.2 0.6 0.7 0.2 0.2 0.5 Electromedical equipment .............................. 3845 42.3 1.4 .6 .4 .8 1.2 .5 .3 .7
Ophthalmic goods ........................................... 385 36.8 2.0 1.0 .5 1.0 1.3 .7 .3 .6
Photographic equipment and supplies ............ 386 84.6 4.6 2.1 1.1 2.5 3.3 1.7 .9 1.6
Watches, clocks, watchcases and parts .......... 387 8.0 .6 .2 .1 .4 .5 .2 .1 .3
Miscellaneous manufacturing industries .......... 39 391.2 34.2 16.0 9.7 18.2 30.0 13.7 8.6 16.3
Jewelry, silverware, and plated ware .............. 391 50.3 2.3 .9 .6 1.4 1.9 .7 .5 1.2 Jewelry, precious metal .................................. 3911 37.3 1.4 .5 .3 .9 1.1 .4 .3 .7 Silverware and plated ware ............................ 3914 6.5 .5 .2 .1 .3 .4 .2 .1 .2 Jewelers’ materials and lapidary work ............ 3915 6.4 .4 .1 .1 .3 .4 .1 .1 .3
Musical instruments ......................................... 393 14.4 1.1 .5 .3 .7 .9 .4 .3 .6
Toys and sporting goods ................................. 394 118.0 12.9 6.3 3.4 6.6 10.7 5.1 2.9 5.6 Dolls and stuffed toys ..................................... 3942 5.3 .1 .1 7(� ) .1 .1 7(� ) 7(� ) .1 Games, toys, and children’s vehicles ............. 3944 36.5 3.4 1.9 1.2 1.5 2.9 1.6 1.1 1.3 Sporting and athletic goods, n.e.c. ................. 3949 76.2 9.4 4.4 2.2 5.0 7.7 3.4 1.8 4.3
Pens, pencils, office, and art supplies ............. 395 31.3 2.4 1.0 .7 1.3 2.0 .9 .6 1.1 Pens and mechanical pencils ......................... 3951 9.1 .6 .2 .1 .4 .5 .2 .1 .3 Lead pencils and art goods ............................ 3952 7.3 .8 .4 .3 .5 .7 .3 .2 .4 Marking devices ............................................. 3953 8.7 .5 .3 .2 .2 .5 .3 .2 .2 Carbon paper and inked ribbons .................... 3955 6.1 .4 .2 .1 .2 .4 .1 .1 .2
Costume jewelry and notions .......................... 396 26.2 1.5 .6 .3 .8 1.3 .6 .3 .8 Costume jewelry ............................................. 3961 15.3 .7 .3 .2 .4 .6 .3 .2 .3 Fasteners, buttons, needles, and pins ........... 3965 10.9 .8 .3 .1 .5 .7 .3 .1 .4
Miscellaneous manufactures ........................... 399 151.1 14.0 6.6 4.3 7.4 13.0 6.1 4.1 7.0 Brooms and brushes ...................................... 3991 14.6 1.4 .6 .4 .8 1.2 .5 .4 .7 Signs and advertising specialities .................. 3993 63.1 5.8 2.6 2.0 3.2 5.7 2.5 2.0 3.1 Burial caskets ................................................. 3995 8.9 1.1 .5 .3 .5 1.0 .5 .2 .5 Hard surface floor coverings, n.e.c. ................ 3996 7.3 .4 .2 .1 .2 .4 .2 .1 .1 Manufacturing industries, n.e.c. ..................... 3999 57.1 5.3 2.6 1.5 2.7 4.8 2.3 1.4 2.5
Nondurable goods ............................................. 7,814.4 752.4 375.5 191.5 376.9 636.6 317.7 171.9 318.8
Food and kindred products ............................... 20 1,680.1 270.3 144.0 65.5 126.3 215.3 114.0 59.0 101.3
Meat products .................................................. 201 470.5 116.8 63.4 18.7 53.3 74.5 39.9 14.9 34.6 Meat packing plants ....................................... 2011 143.5 55.8 30.3 8.4 25.5 34.6 18.3 6.9 16.2 Sausages and other prepared meats ............. 2013 91.5 18.7 10.4 4.7 8.3 14.5 8.0 3.9 6.5 Poultry slaughtering and processing .............. 2015 235.5 42.2 22.7 5.6 19.5 25.5 13.6 4.1 11.8 Dairy products ................................................. 202 146.5 21.6 11.3 7.7 10.3 20.4 10.6 7.4 9.7 Cheese, natural and processed ..................... 2022 39.7 5.1 2.6 1.5 2.6 4.5 2.2 1.4 2.3 Dry, condensed, evaporated products .......... 2023 16.4 1.9 .9 .6 1.0 1.7 .8 .6 .9 Ice cream and frozen desserts ....................... 2024 23.3 3.0 1.6 1.1 1.4 2.8 1.5 1.0 1.3 Fluid milk ........................................................ 2026 65.2 11.4 6.0 4.4 5.3 11.2 5.9 4.3 5.2
Preserved fruits and vegetables ...................... 203 236.5 29.0 15.1 7.3 13.9 26.0 13.7 6.8 12.3 Canned specialities ........................................ 2032 20.3 2.4 1.2 .3 1.2 2.2 1.1 .3 1.1 Canned fruits and vegetables ......................... 2033 74.2 7.9 3.7 2.2 4.2 7.4 3.5 2.1 3.9 Dehydrated fruits, vegetables, soups ............. 2034 17.7 2.3 1.1 .7 1.1 2.1 1.1 .7 1.1 Pickles, sauces, and salad dressings ............. 2035 23.4 2.8 1.5 .7 1.2 2.4 1.4 .6 1.0 Frozen fruits and vegetables .......................... 2037 48.7 7.0 3.5 1.9 3.4 6.2 3.2 1.8 3.0 Frozen specialties, n.e.c. ................................ 2038 52.3 6.8 4.1 1.5 2.7 5.7 3.5 1.3 2.2
See footnotes at end of table.
26
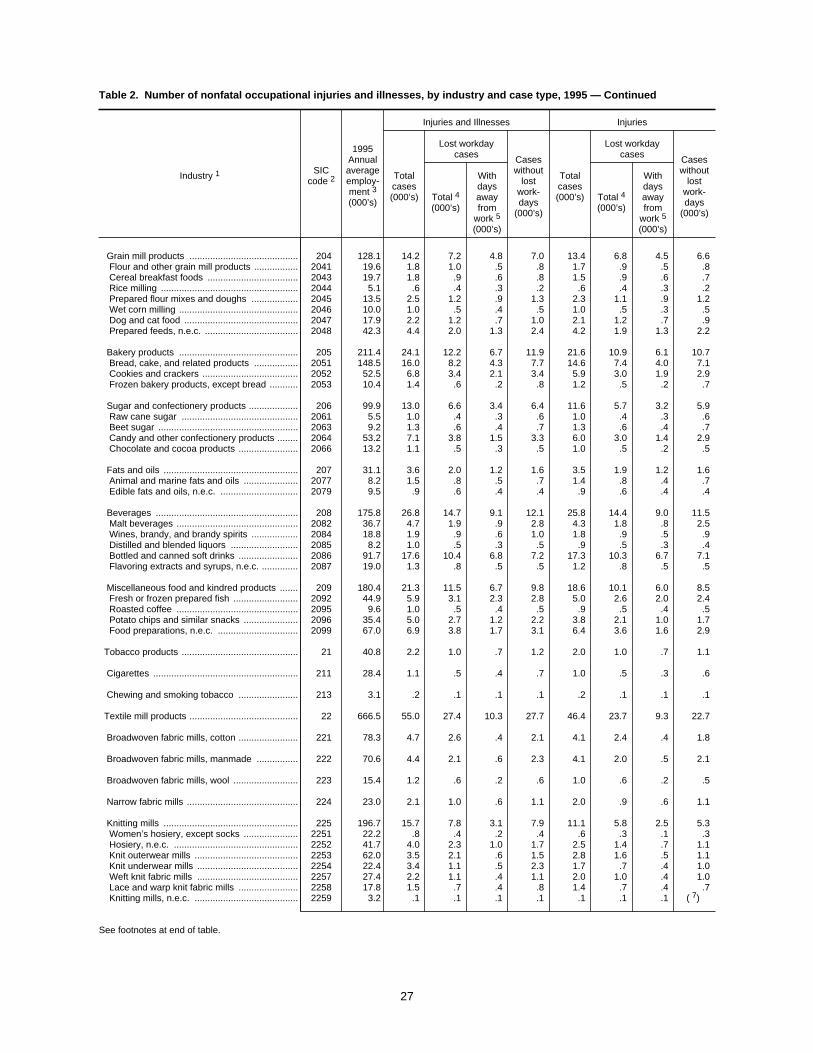
Table 2. Number of nonfatal occupational injuries and illnesses, by industry and case type, 1995 — Continued
Industry 1 SICcode 2
1995Annualaverageemploy-ment 3(000’s)
Injuries and Illnesses Injuries
Totalcases(000’s)
Lost workdaycases Cases
withoutlost
work-days
(000’s)
Totalcases(000’s)
Lost workdaycases Cases
withoutlost
work-days
(000’s)
Total 4(000’s)
Withdaysawayfrom
work 5(000’s)
Total 4(000’s)
Withdaysawayfrom
work 5(000’s)
Grain mill products .......................................... 204 128.1 14.2 7.2 4.8 7.0 13.4 6.8 4.5 6.6 Flour and other grain mill products ................. 2041 19.6 1.8 1.0 .5 .8 1.7 .9 .5 .8 Cereal breakfast foods ................................... 2043 19.7 1.8 .9 .6 .8 1.5 .9 .6 .7 Rice milling ..................................................... 2044 5.1 .6 .4 .3 .2 .6 .4 .3 .2 Prepared flour mixes and doughs .................. 2045 13.5 2.5 1.2 .9 1.3 2.3 1.1 .9 1.2 Wet corn milling .............................................. 2046 10.0 1.0 .5 .4 .5 1.0 .5 .3 .5 Dog and cat food ............................................ 2047 17.9 2.2 1.2 .7 1.0 2.1 1.2 .7 .9 Prepared feeds, n.e.c. .................................... 2048 42.3 4.4 2.0 1.3 2.4 4.2 1.9 1.3 2.2
Bakery products .............................................. 205 211.4 24.1 12.2 6.7 11.9 21.6 10.9 6.1 10.7 Bread, cake, and related products ................. 2051 148.5 16.0 8.2 4.3 7.7 14.6 7.4 4.0 7.1 Cookies and crackers ..................................... 2052 52.5 6.8 3.4 2.1 3.4 5.9 3.0 1.9 2.9 Frozen bakery products, except bread ........... 2053 10.4 1.4 .6 .2 .8 1.2 .5 .2 .7
Sugar and confectionery products ................... 206 99.9 13.0 6.6 3.4 6.4 11.6 5.7 3.2 5.9 Raw cane sugar ............................................. 2061 5.5 1.0 .4 .3 .6 1.0 .4 .3 .6 Beet sugar ...................................................... 2063 9.2 1.3 .6 .4 .7 1.3 .6 .4 .7 Candy and other confectionery products ........ 2064 53.2 7.1 3.8 1.5 3.3 6.0 3.0 1.4 2.9 Chocolate and cocoa products ....................... 2066 13.2 1.1 .5 .3 .5 1.0 .5 .2 .5
Fats and oils .................................................... 207 31.1 3.6 2.0 1.2 1.6 3.5 1.9 1.2 1.6 Animal and marine fats and oils ..................... 2077 8.2 1.5 .8 .5 .7 1.4 .8 .4 .7 Edible fats and oils, n.e.c. .............................. 2079 9.5 .9 .6 .4 .4 .9 .6 .4 .4
Beverages ....................................................... 208 175.8 26.8 14.7 9.1 12.1 25.8 14.4 9.0 11.5 Malt beverages ............................................... 2082 36.7 4.7 1.9 .9 2.8 4.3 1.8 .8 2.5 Wines, brandy, and brandy spirits .................. 2084 18.8 1.9 .9 .6 1.0 1.8 .9 .5 .9 Distilled and blended liquors .......................... 2085 8.2 1.0 .5 .3 .5 .9 .5 .3 .4 Bottled and canned soft drinks ....................... 2086 91.7 17.6 10.4 6.8 7.2 17.3 10.3 6.7 7.1 Flavoring extracts and syrups, n.e.c. .............. 2087 19.0 1.3 .8 .5 .5 1.2 .8 .5 .5
Miscellaneous food and kindred products ....... 209 180.4 21.3 11.5 6.7 9.8 18.6 10.1 6.0 8.5 Fresh or frozen prepared fish ......................... 2092 44.9 5.9 3.1 2.3 2.8 5.0 2.6 2.0 2.4 Roasted coffee ............................................... 2095 9.6 1.0 .5 .4 .5 .9 .5 .4 .5 Potato chips and similar snacks ..................... 2096 35.4 5.0 2.7 1.2 2.2 3.8 2.1 1.0 1.7 Food preparations, n.e.c. ............................... 2099 67.0 6.9 3.8 1.7 3.1 6.4 3.6 1.6 2.9
Tobacco products ............................................. 21 40.8 2.2 1.0 .7 1.2 2.0 1.0 .7 1.1
Cigarettes ........................................................ 211 28.4 1.1 .5 .4 .7 1.0 .5 .3 .6
Chewing and smoking tobacco ....................... 213 3.1 .2 .1 .1 .1 .2 .1 .1 .1
Textile mill products .......................................... 22 666.5 55.0 27.4 10.3 27.7 46.4 23.7 9.3 22.7
Broadwoven fabric mills, cotton ....................... 221 78.3 4.7 2.6 .4 2.1 4.1 2.4 .4 1.8
Broadwoven fabric mills, manmade ................ 222 70.6 4.4 2.1 .6 2.3 4.1 2.0 .5 2.1
Broadwoven fabric mills, wool ......................... 223 15.4 1.2 .6 .2 .6 1.0 .6 .2 .5
Narrow fabric mills ........................................... 224 23.0 2.1 1.0 .6 1.1 2.0 .9 .6 1.1
Knitting mills .................................................... 225 196.7 15.7 7.8 3.1 7.9 11.1 5.8 2.5 5.3 Women’s hosiery, except socks ..................... 2251 22.2 .8 .4 .2 .4 .6 .3 .1 .3 Hosiery, n.e.c. ................................................ 2252 41.7 4.0 2.3 1.0 1.7 2.5 1.4 .7 1.1 Knit outerwear mills ........................................ 2253 62.0 3.5 2.1 .6 1.5 2.8 1.6 .5 1.1 Knit underwear mills ....................................... 2254 22.4 3.4 1.1 .5 2.3 1.7 .7 .4 1.0 Weft knit fabric mills ....................................... 2257 27.4 2.2 1.1 .4 1.1 2.0 1.0 .4 1.0 Lace and warp knit fabric mills ....................... 2258 17.8 1.5 .7 .4 .8 1.4 .7 .4 .7 Knitting mills, n.e.c. ........................................ 2259 3.2 .1 .1 .1 .1 .1 .1 .1 7(� )
See footnotes at end of table.
27

Table 2. Number of nonfatal occupational injuries and illnesses, by industry and case type, 1995 — Continued
Industry 1 SICcode 2
1995Annualaverageemploy-ment 3(000’s)
Injuries and Illnesses Injuries
Totalcases(000’s)
Lost workdaycases Cases
withoutlost
work-days
(000’s)
Totalcases(000’s)
Lost workdaycases Cases
withoutlost
work-days
(000’s)
Total 4(000’s)
Withdaysawayfrom
work 5(000’s)
Total 4(000’s)
Withdaysawayfrom
work 5(000’s)
Textile finishing, except wool ........................... 226 71.9 5.7 3.0 1.5 2.7 5.3 2.8 1.5 2.5 Finishing plants, cotton ................................... 2261 33.8 2.8 1.5 .5 1.3 2.4 1.3 .5 1.1 Finishing plants, manmade ............................ 2262 24.2 1.6 .8 .5 .8 1.5 .8 .5 .7 Finishing plants, n.e.c. .................................... 2269 13.9 1.4 .7 .4 .7 1.3 .7 .4 .7
Carpets and rugs ............................................. 227 62.8 6.3 3.5 1.0 2.8 5.6 3.0 .9 2.6
Yarn and thread mills ...................................... 228 94.7 8.6 3.7 1.1 5.0 7.2 3.3 1.0 3.9 Yarn spinning mills ......................................... 2281 72.1 6.4 2.9 .9 3.5 5.6 2.6 .8 2.9 Throwing and winding mills ............................ 2282 15.4 1.6 .5 .1 1.1 1.0 .4 .1 .6 Thread mills .................................................... 2284 7.2 .7 .3 .1 .4 .6 .2 .1 .4
Miscellaneous textile goods ............................ 229 53.1 6.4 3.2 1.7 3.2 6.0 3.0 1.6 3.0 Coated fabrics, not rubberized ....................... 2295 8.9 1.4 .7 .5 .8 1.4 .7 .5 .7 Tire cord and fabrics ....................................... 2296 6.6 .8 .4 .2 .4 .8 .4 .2 .4 Nonwoven fabrics ........................................... 2297 12.0 1.0 .5 .2 .5 .9 .5 .2 .4
Apparel and other textile products .................... 23 933.1 70.7 30.7 17.4 40.0 54.8 23.4 13.6 31.4
Men’s and boys’ suits and coats ..................... 231 36.0 2.5 1.2 .8 1.3 1.8 .9 .6 .9
Men’s and boys’ furnishings ............................ 232 251.9 23.7 10.3 5.6 13.4 16.2 7.1 4.1 9.0 Men’s and boys’ shirts .................................... 2321 54.2 4.3 1.9 1.0 2.4 3.3 1.5 .8 1.8 Men’s and boys’ underwear and nightwear .... 2322 24.1 2.9 1.1 .3 1.8 1.6 .8 .3 .8 Men’s and boys’ neckwear ............................. 2323 6.4 .2 .1 .1 .1 .2 .1 .1 .1 Men’s and boys’ trousers and slacks ............. 2325 77.3 8.3 3.7 1.8 4.6 5.1 2.4 1.2 2.8 Men’s and boys’ work clothing ....................... 2326 40.6 4.7 2.0 1.4 2.7 3.3 1.3 .9 1.9 Men’s and boys’ clothing, n.e.c. ..................... 2329 49.3 3.3 1.4 1.0 1.8 2.6 1.1 .7 1.6
Women’s and misses’ outerwear .................... 233 276.0 14.3 5.3 3.5 9.0 11.8 4.2 2.8 7.6 Women’s, junior’s, and misses’ dresses ........ 2335 42.9 1.3 .6 .4 .8 1.2 .5 .3 .7 Women’s and misses’ suits and coats ........... 2337 28.7 1.8 .6 .5 1.2 1.5 .4 .4 1.1 Women’s and misses’ outerwear, n.e.c. ......... 2339 175.0 8.8 3.7 2.3 5.1 6.9 2.9 1.8 4.0
Women’s and children’s undergarments ......... 234 48.4 3.6 1.5 .9 2.1 3.0 1.1 .7 1.8 Women’s and children’s underwear ............... 2341 36.4 2.4 1.0 .6 1.5 2.1 .8 .5 1.3 Bras, girdles, and allied garments .................. 2342 12.0 1.2 .5 .3 .7 .9 .4 .2 .6
Girls’ and children’s outerwear ........................ 236 42.1 2.8 1.3 .8 1.4 2.2 1.0 .6 1.2 Girls’ and children’s dresses, blouses ............ 2361 16.9 .5 .2 .1 .3 .4 .2 .1 .3 Girls’ and children’s outerwear, n.e.c. ............ 2369 25.2 2.3 1.1 .7 1.2 1.7 .8 .5 .9
Miscellaneous apparel and accessories .......... 238 36.3 2.3 .9 .6 1.4 2.2 .8 .5 1.3 Fabric dress and work gloves ......................... 2381 5.0 .2 .1 .1 .1 .2 .1 .1 .1 Robes and dressing gowns ............................ 2384 2.8 .2 .1 .1 .1 .2 .1 .1 .1 Apparel belts .................................................. 2387 6.1 .3 .1 .1 .3 .3 .1 .1 .3 Apparel and accessories, n.e.c. ..................... 2389 15.7 1.1 .5 .3 – 1.0 .4 .2 –
Miscellaneous fabricated textile products ........ 239 221.7 19.6 9.2 4.8 10.4 16.3 7.6 4.1 8.7 Curtains and draperies ................................... 2391 20.5 1.8 .8 .5 1.0 1.5 .6 .4 .9 Housefurnishings, n.e.c. ................................. 2392 56.4 5.3 2.5 1.2 2.8 4.8 2.3 1.1 2.6 Textile bags .................................................... 2393 11.8 1.1 .5 .4 .6 1.0 .4 .3 .5 Canvas and related products ......................... 2394 20.1 1.7 .8 .6 .9 1.6 .7 .6 .8 Pleating and stitching ..................................... 2395 17.1 .8 .4 .2 .4 .8 .4 .2 .4 Automotive and apparel trimmings ................. 2396 60.7 5.7 2.7 1.0 3.0 4.2 2.1 .9 2.2 Schiffli machine embroideries ........................ 2397 3.7 .3 .1 .1 .2 .2 .1 .1 .1 Fabricated textile products, n.e.c. .................. 2399 31.3 2.9 1.4 .8 1.6 2.2 1.0 .5 1.2
Paper and allied products ................................. 26 691.8 61.1 30.0 16.3 31.1 56.2 28.1 15.4 28.1
See footnotes at end of table.
28

Table 2. Number of nonfatal occupational injuries and illnesses, by industry and case type, 1995 — Continued
Industry 1 SICcode 2
1995Annualaverageemploy-ment 3(000’s)
Injuries and Illnesses Injuries
Totalcases(000’s)
Lost workdaycases Cases
withoutlost
work-days
(000’s)
Totalcases(000’s)
Lost workdaycases Cases
withoutlost
work-days
(000’s)
Total 4(000’s)
Withdaysawayfrom
work 5(000’s)
Total 4(000’s)
Withdaysawayfrom
work 5(000’s)
Pulp mills ......................................................... 261 12.6 0.8 0.3 0.1 0.5 0.7 0.3 0.1 0.4 Paper mills ....................................................... 262 163.3 13.1 5.5 3.1 7.6 11.6 5.2 2.9 6.4 Paperboard mills ............................................. 263 51.2 4.3 1.9 1.0 2.4 4.0 1.8 .9 2.2
Paperboard containers and boxes .................. 265 221.0 20.8 10.4 5.3 10.4 19.8 9.9 5.0 9.9 Setup paperboard boxes ................................ 2652 7.8 .5 .3 .2 .2 .5 .3 .2 .2 Corrugated and solid fiber boxes ................... 2653 130.8 13.2 6.6 2.9 6.7 12.9 6.4 2.8 6.5 Fiber cans, drums and similar products ......... 2655 15.0 1.1 .5 .3 .5 1.0 .5 .3 .5 Sanitary food containers ................................. 2656 18.6 1.7 .9 .6 .7 1.5 .9 .5 .7 Folding paperboard boxes .............................. 2657 48.8 4.2 2.1 1.3 2.2 3.9 1.9 1.3 2.0
Miscellaneous converted paper products ........ 267 243.7 22.2 11.9 6.8 10.3 20.1 10.9 6.4 9.2 Paper coated and laminated, packaging ........ 2671 22.5 2.3 1.2 .7 1.1 2.2 1.2 .7 1.0 Paper coated and laminated, n.e.c. ................ 2672 48.4 3.2 1.6 1.0 1.5 2.7 1.5 .9 1.2 Bags: plastics, laminated, and coated ............ 2673 39.0 3.2 1.7 .9 1.5 3.0 1.6 .8 1.4 Bags: uncoated paper and multiwall .............. 2674 18.4 2.1 1.2 .6 .9 1.9 1.1 .5 .8 Die-cut paper and board ................................. 2675 19.9 1.4 .7 .5 .7 1.3 .7 .4 .6 Sanitary paper products ................................. 2676 30.0 2.5 1.4 .9 1.2 2.2 1.2 .8 1.0 Envelopes ....................................................... 2677 23.5 2.4 1.4 .7 1.0 2.1 1.2 .6 .9 Stationery products ........................................ 2678 7.7 1.0 .5 .3 .6 .9 .4 .2 .5 Converted paper products, n.e.c. ................... 2679 34.3 4.2 2.3 1.4 1.9 3.9 2.1 1.3 1.8
Printing and publishing ..................................... 27 1,541.0 89.6 41.9 28.2 47.7 81.0 37.7 25.9 43.2
Newspapers .................................................... 271 445.7 23.8 10.7 8.2 13.1 21.3 9.8 7.6 11.5
Periodicals ....................................................... 272 131.3 3.1 1.6 .9 1.6 2.7 1.4 .8 1.3
Books .............................................................. 273 123.4 7.2 3.6 2.1 3.6 6.5 3.2 1.9 3.3 Book publishing .............................................. 2731 84.4 3.1 1.6 .9 1.5 2.7 1.4 .8 1.3 Book printing .................................................. 2732 39.1 4.1 2.0 1.2 2.1 3.8 1.8 1.1 2.0
Miscellaneous publishing ................................ 274 84.1 2.5 1.0 .7 1.5 2.3 .8 .6 1.4
Commercial printing ........................................ 275 560.4 40.7 19.5 13.1 21.2 37.6 17.9 12.3 19.7 Commercial printing, lithographic ................... 2752 365.7 25.8 12.0 8.4 13.9 24.0 11.0 7.8 13.0 Commercial printing, gravure ......................... 2754 21.0 2.5 1.4 .7 1.1 2.2 1.2 .6 1.0 Commercial printing, n.e.c. ............................. 2759 173.7 12.4 6.1 4.1 6.3 11.5 5.7 3.8 5.8
Manifold business forms .................................. 276 45.0 3.4 1.4 1.1 1.9 3.2 1.3 1.0 1.9
Greeting cards ................................................. 277 27.6 1.9 1.0 .3 1.0 1.2 .7 .2 .6
Blankbooks and bookbinding .......................... 278 68.9 5.1 2.5 1.5 2.6 4.4 2.1 1.2 2.3 Blankbooks and looseleaf binders .................. 2782 39.0 2.7 1.2 .7 1.5 2.3 1.0 .5 1.3 Bookbinding and related work ........................ 2789 30.0 2.3 1.3 .7 1.1 2.2 1.1 .7 1.0
Printing trade services ..................................... 279 54.5 1.8 .6 .3 1.2 1.8 .6 .3 1.2
Typesetting ..................................................... 2791 20.8 .4 .1 .1 .3 .4 .1 .1 .3 Platemaking services ..................................... 2796 33.7 1.4 .5 .2 .9 1.4 .5 .2 .9
Chemicals and allied products ......................... 28 1,033.6 56.9 27.7 13.6 29.2 49.4 24.9 12.5 24.5
Industrial inorganic chemicals ......................... 281 119.4 4.8 2.4 1.2 2.4 4.3 2.2 1.1 2.1 Alkalies and chlorine ...................................... 2812 10.0 .4 .2 .1 .2 .3 .2 .1 .2 Industrial gases .............................................. 2813 23.0 .6 .3 .1 .3 .5 .2 .1 .3 Inorganic pigments ......................................... 2816 11.8 .8 .4 .3 .4 .7 .4 .3 .3 Industrial inorganic chemicals, n.e.c. ............. 2819 74.6 3.1 1.5 .7 1.5 2.7 1.4 .7 1.3
See footnotes at end of table.
29

Table 2. Number of nonfatal occupational injuries and illnesses, by industry and case type, 1995 — Continued
Industry 1 SICcode 2
1995Annualaverageemploy-ment 3(000’s)
Injuries and Illnesses Injuries
Totalcases(000’s)
Lost workdaycases Cases
withoutlost
work-days
(000’s)
Totalcases(000’s)
Lost workdaycases Cases
withoutlost
work-days
(000’s)
Total 4(000’s)
Withdaysawayfrom
work 5(000’s)
Total 4(000’s)
Withdaysawayfrom
work 5(000’s)
Plastics materials and synthetics .................... 282 156.6 8.5 4.0 1.7 4.6 7.0 3.6 1.5 3.4 Plastics materials and resins .......................... 2821 74.8 3.8 1.9 .9 1.9 3.4 1.7 .8 1.7 Organic fibers, noncellulosic .......................... 2824 48.0 1.6 .7 .3 .8 1.3 .6 .3 .6
Drugs ............................................................... 283 259.2 13.7 6.8 3.3 6.8 11.3 5.8 3.0 5.5 Medicinals and botanicals .............................. 2833 20.8 1.2 .6 .3 .6 1.0 .5 .3 .5 Pharmaceutical preparations .......................... 2834 209.4 11.1 5.5 2.7 5.6 9.2 4.7 2.4 4.5 Diagnostic substances ................................... 2835 14.2 .7 .4 .2 .4 .6 .3 .1 .3 Biological products except diagnostic ............ 2836 14.8 .6 .4 .2 .2 .5 .3 .1 .2 Soap, cleaners, and toilet goods ..................... 284 151.5 9.5 4.9 2.5 4.6 8.2 4.3 2.3 3.9 Soap and other detergents ............................. 2841 42.0 2.3 1.2 .5 1.0 2.0 1.1 .5 .9 Polishes and sanitation goods ........................ 2842 34.1 2.6 1.2 .7 1.4 2.3 1.1 .6 1.2 Toilet preparations .......................................... 2844 68.1 4.2 2.3 1.2 1.9 3.5 2.0 1.1 1.6
Paints and allied products ............................... 285 56.2 4.7 2.3 1.2 2.3 4.3 2.2 1.2 2.1
Industrial organic chemicals ............................ 286 145.2 5.1 2.5 1.1 2.6 4.4 2.3 1.0 2.1 Cyclic crudes and intermediates .................... 2865 25.9 1.0 .6 .3 .4 .9 .6 .3 .4 Industrial organic chemicals, n.e.c. ................ 2869 116.6 4.0 1.8 .7 2.1 3.4 1.6 .7 1.7
Agricultural chemicals ..................................... 287 53.2 3.2 1.5 .8 1.6 2.9 1.4 .8 1.5 Nitrogenous fertilizers ..................................... 2873 8.7 .5 .3 .2 .3 .5 .2 .2 .2 Phosphatic fertilizers ...................................... 2874 10.0 .6 .3 .1 .3 .6 .3 .1 .3 Fertilizers, mixing only .................................... 2875 9.7 1.0 .5 .3 .5 1.0 .5 .3 .5 Agricultural chemicals, n.e.c. .......................... 2879 24.7 1.0 .5 .2 .5 .8 .4 .2 .4
Miscellaneous chemical products .................... 289 92.2 7.4 3.2 1.8 4.2 6.9 3.0 1.7 4.0 Adhesives and sealants ................................. 2891 24.5 2.0 .8 .4 1.2 1.8 .7 .4 1.1 Explosives ...................................................... 2892 8.0 .5 .2 .1 .3 .4 .2 .1 .3 Printing ink ...................................................... 2893 16.0 1.2 .4 .3 .8 1.2 .4 .3 .8 Chemical preparations, n.e.c. ......................... 2899 41.0 3.5 1.7 .9 1.9 3.3 1.6 .8 1.8
Petroleum and coal products ............................ 29 145.1 7.3 3.6 1.9 3.7 6.9 3.5 1.9 3.4
Petroleum refining ........................................... 291 104.4 3.5 1.7 .8 1.8 3.3 1.6 .8 1.6
Asphalt paving and roofing materials .............. 295 26.7 2.7 1.4 .8 1.3 2.6 1.3 .8 1.3 Asphalt paving mixtures and blocks ............... 2951 13.9 1.3 .6 .5 .8 1.3 .5 .5 .8 Asphalt felts and coatings .............................. 2952 12.8 1.4 .8 .4 .6 1.3 .8 .4 .5
Miscellaneous petroleum and coal products ... 299 14.0 1.1 .5 .3 .5 1.1 .5 .3 .5 Lubricating oils and greases ........................... 2992 11.8 .9 .5 .3 .4 .9 .5 .2 .4
Rubber and miscellaneous plastics products ... 30 977.0 127.9 64.4 34.8 63.5 115.6 57.6 31.5 58.0
Tires and inner tubes ....................................... 301 80.0 11.1 6.6 2.1 4.5 10.0 6.2 2.0 3.8
Rubber and plastics footwear .......................... 302 8.6 1.0 .5 .3 .5 .9 .4 .2 .5
Hose and belting and gaskets and packing ..... 305 67.8 8.9 4.3 2.2 4.6 8.1 3.9 2.0 4.2 Rubber and plastics hose and belting ............ 3052 27.5 3.9 2.0 1.1 1.8 3.6 1.8 1.0 1.7 Gaskets, packing and sealing devices ........... 3053 40.3 5.1 2.3 1.1 2.8 4.6 2.1 1.0 2.5
Fabricated rubber products, n.e.c. .................. 306 111.2 15.4 7.7 4.5 7.7 13.7 6.9 4.1 6.9 Mechanical rubber goods ............................... 3061 50.0 7.6 3.6 2.2 4.0 6.6 3.1 1.9 3.5 Fabricated rubber products, n.e.c. ................. 3069 61.2 7.8 4.1 2.4 3.7 7.1 3.8 2.2 3.4 Miscellaneous plastics products, n.e.c. ........... 308 709.5 91.5 45.3 25.6 46.2 82.9 40.2 23.2 42.7 Unsupported plastics film and sheet .............. 3081 61.8 5.6 2.5 1.5 3.1 5.5 2.4 1.4 3.1 Unsupported plastics profile shapes .............. 3082 23.8 2.9 1.3 .8 1.6 2.7 1.1 .7 1.5 Laminated plastics plate and sheet ................ 3083 22.9 2.9 1.4 .7 1.5 2.5 1.3 .6 1.2
See footnotes at end of table.
30

Table 2. Number of nonfatal occupational injuries and illnesses, by industry and case type, 1995 — Continued
Industry 1 SICcode 2
1995Annualaverageemploy-ment 3(000’s)
Injuries and Illnesses Injuries
Totalcases(000’s)
Lost workdaycases Cases
withoutlost
work-days
(000’s)
Totalcases(000’s)
Lost workdaycases Cases
withoutlost
work-days
(000’s)
Total 4(000’s)
Withdaysawayfrom
work 5(000’s)
Total 4(000’s)
Withdaysawayfrom
work 5(000’s)
Plastics pipe ................................................... 3084 16.5 2.5 1.2 0.9 1.3 2.4 1.1 0.8 1.3 Plastics bottles ............................................... 3085 32.8 4.2 2.1 1.2 2.1 4.0 2.0 1.1 2.0 Plastics foam products ................................... 3086 54.7 6.8 3.0 1.9 3.8 6.1 2.8 1.7 3.4 Custom compound purchased resins ............. 3087 26.0 2.7 1.4 .8 1.3 2.5 1.3 .8 1.2 Plastics plumbing fixtures ............................... 3088 17.1 2.5 1.4 .7 1.1 2.2 1.2 .7 1.0 Plastics products, n.e.c. ................................. 3089 453.9 61.5 31.0 17.2 30.4 55.0 27.0 15.3 28.0
Leather and leather products ........................... 31 105.5 11.3 4.8 2.7 6.5 8.9 3.7 2.3 5.2
Leather tanning and finishing .......................... 311 13.7 2.5 1.3 .6 1.2 2.1 1.1 .5 1.0
Footwear, except rubber ................................. 314 51.9 5.3 2.2 1.3 3.0 3.7 1.5 1.0 2.2 Men’s footwear, except athletic ...................... 3143 25.4 2.7 1.0 .5 1.7 2.0 .7 .4 1.2 Women’s footwear, except athletic ................. 3144 16.9 1.4 .7 .4 .7 1.0 .5 .3 .5
Luggage .......................................................... 316 10.8 1.2 .4 .2 .8 .9 .3 .2 .6 Handbags and personal leather goods ........... 317 11.6 .7 .3 .2 .4 .7 .3 .2 .4 Women’s handbags and purses ..................... 3171 4.5 .3 .1 .1 .2 .3 .1 .1 .2 Personal leather goods, n.e.c. ........................ 3172 7.1 .5 .3 .2 .2 .4 .2 .2 .2
Leather goods, n.e.c. ....................................... 319 12.2 1.1 .4 .2 .7 1.0 .3 .2 .7
Transportation and public utilities 8 ............... 5,857.8 523.6 299.2 222.9 224.3 502.0 289.2 215.1 212.8
Railroad transportation 8 .................................. 40 – 10.8 8.2 7.0 2.6 10.5 8.0 6.9 2.5
Local and interurban passenger transit ............ 41 397.5 31.6 17.6 15.1 14.0 30.3 17.1 14.7 13.2 Local and suburban transportation .................. 411 181.2 20.2 11.8 10.1 8.4 19.3 11.5 9.8 7.8 Taxicabs .......................................................... 412 30.6 1.7 1.0 .9 .7 1.7 1.0 .9 .7 Intercity and rural bus transportation ............... 413 24.2 2.3 1.1 1.0 1.2 2.1 1.0 .8 1.1 Bus charter service .......................................... 414 29.4 1.5 .7 .7 .8 1.5 .7 .7 .8 School buses ................................................... 415 130.3 5.9 3.0 2.4 2.9 5.6 2.9 2.3 2.8
Trucking and warehousing ............................... 42 1,874.7 247.2 144.9 105.1 102.4 243.5 142.4 103.5 101.1 Trucking and courier services, except air ........ 421 1,728.1 232.4 137.2 99.4 95.3 229.0 134.9 98.0 94.1 Public warehousing and storage ..................... 422 142.2 14.3 7.4 5.4 6.9 14.0 7.2 5.2 6.8 Trucking terminal facilities ............................... 423 4.4 .6 .3 .3 .2 .6 .3 .3 .2
Water transportation ......................................... 44 177.8 14.0 7.6 7.1 6.3 13.7 7.5 7.0 6.2 Deep sea domestic transportation of freight .... 442 10.1 .9 .5 .4 .5 .9 .4 .4 .4 Water transportation of freight, n.e.c. .............. 444 12.9 1.1 .5 .5 .5 1.0 .5 .4 .5 Water transportation of passengers ................ 448 19.7 .6 .3 .3 .3 .6 .3 .3 .3 Water transportation services .......................... 449 116.5 10.9 6.0 5.6 4.8 10.8 6.0 5.6 4.8
Transportation by air ........................................ 45 776.0 94.0 56.3 45.3 37.6 89.8 54.2 43.3 35.6 Air transportation, scheduled ........................... 451 626.3 80.0 49.0 40.2 31.0 76.1 46.9 38.2 29.1 Air transportation, nonscheduled ..................... 452 40.7 3.0 1.2 .7 1.9 3.0 1.1 .7 1.9 Airports, flying fields, and services .................. 458 109.0 10.9 6.2 4.4 4.7 10.7 6.1 4.4 4.6
Pipelines, except natural gas ........................... 46 15.0 .2 .1 .1 .1 .2 .1 .1 .1
Transportation services .................................... 47 407.2 17.0 9.2 6.7 7.8 16.5 8.9 6.6 7.6 Passenger transportation arrangement ........... 472 204.3 1.7 .7 .6 1.0 1.5 .6 .5 .9 Freight transportation arrangement ................. 473 164.2 9.3 5.5 4.3 3.8 9.2 5.4 4.2 3.7 Miscellaneous transportation services ............ 478 36.4 5.8 2.9 1.8 2.9 5.6 2.8 1.7 2.8
Communications ............................................... 48 1,304.3 41.0 22.0 17.2 18.9 33.8 18.8 14.7 15.0 Telephone communications ............................ 481 886.6 23.6 13.8 11.0 9.8 17.5 10.9 8.8 6.6 Telegraph and other communications ............. 482 8.0 .2 .1 .1 .1 .2 .1 .1 .1 Radio and television broadcasting .................. 483 236.0 4.0 1.3 1.0 2.7 3.8 1.2 .9 2.5 Cable and other pay television services .......... 484 155.5 12.4 6.5 4.9 5.9 11.6 6.2 4.7 5.4
See footnotes at end of table.
31

Table 2. Number of nonfatal occupational injuries and illnesses, by industry and case type, 1995 — Continued
Industry 1 SICcode 2
1995Annualaverageemploy-ment 3(000’s)
Injuries and Illnesses Injuries
Totalcases(000’s)
Lost workdaycases Cases
withoutlost
work-days
(000’s)
Totalcases(000’s)
Lost workdaycases Cases
withoutlost
work-days
(000’s)
Total 4(000’s)
Withdaysawayfrom
work 5(000’s)
Total 4(000’s)
Withdaysawayfrom
work 5(000’s)
Electric, gas, and sanitary services .................. 49 904.5 67.8 33.3 19.1 34.5 63.6 32.1 18.3 31.4 Electric services .............................................. 491 399.8 23.1 11.0 5.1 12.1 21.4 10.6 4.8 10.8 Gas production and distribution ....................... 492 152.7 10.0 4.6 2.8 5.4 9.5 4.4 2.7 5.0 Combination utility services ............................. 493 167.3 9.5 4.9 2.1 4.7 8.4 4.5 1.9 3.9 Water supply ................................................... 494 27.9 2.6 1.4 1.0 1.2 2.4 1.4 1.0 1.1 Sanitary services ............................................. 495 153.2 22.2 11.2 7.9 11.0 21.4 11.0 7.8 10.5
Wholesale and retail trade ............................... 27,563.7 1,632.1 693.8 515.6 938.3 1,583.9 674.3 501.1 909.6
Wholesale trade ................................................ 6,389.8 458.9 221.6 159.9 237.3 445.8 214.7 155.0 231.1
Wholesale trade--durable goods ..................... 50 3,724.7 246.6 111.9 81.5 134.7 238.6 107.6 78.4 131.0 Motor vehicles, parts, and supplies ................. 501 490.1 48.9 23.4 16.9 25.5 46.0 21.9 15.7 24.1 Furniture and homefurnishings ........................ 502 147.5 9.2 4.6 3.5 4.5 9.0 4.6 3.5 4.4 Lumber and construction materials ................. 503 241.3 24.9 12.0 8.5 13.0 24.7 11.8 8.3 12.8 Professional and commercial equipment ........ 504 795.6 28.6 11.3 8.8 17.3 27.6 10.7 8.4 16.9 Metals and minerals, except petroleum ........... 505 142.4 18.3 8.5 5.6 9.8 18.0 8.3 5.5 9.7 Electrical goods ............................................... 506 499.8 18.6 8.8 6.1 9.8 17.7 8.3 5.7 9.4 Hardware, plumbing and heating equipment ... 507 287.2 17.8 8.8 6.4 9.0 17.3 8.5 6.2 8.8 Machinery, equipment, and supplies ............... 508 789.3 54.8 21.8 16.6 33.0 53.6 21.3 16.2 32.3 Miscellaneous durable goods .......................... 509 331.6 25.6 12.8 9.1 12.9 24.8 12.2 8.9 12.6 Wholesale trade--nondurable goods ............... 51 2,665.1 212.3 109.7 78.4 102.6 207.2 107.1 76.6 100.1 Paper and paper products ............................... 511 254.7 10.8 5.3 4.0 5.6 10.6 5.1 3.9 5.5 Drugs, proprietaries, and sundries .................. 512 198.9 9.6 4.8 3.7 4.7 9.2 4.6 3.5 4.5 Apparel, piece goods, and notions .................. 513 221.6 9.6 5.4 3.0 4.3 9.3 5.1 2.9 4.1 Groceries and related products ....................... 514 887.6 98.2 54.3 38.2 43.8 96.2 53.3 37.6 42.8 Farm-product raw materials ............................ 515 111.2 6.7 2.9 2.6 3.8 6.5 2.8 2.5 3.7 Chemicals and allied products ........................ 516 148.1 8.1 3.7 2.2 4.4 7.8 3.5 2.2 4.3 Petroleum and petroleum products ................. 517 160.1 9.3 4.0 3.2 5.4 8.9 3.8 3.0 5.1 Beer, wine, and distilled beverages ................. 518 152.1 20.4 10.5 8.6 9.9 20.1 10.3 8.5 9.8 Miscellaneous nondurable goods .................... 519 530.9 39.6 18.8 12.9 20.8 38.6 18.5 12.7 20.2
Retail trade ........................................................ 21,173.9 1,173.2 472.2 355.7 701.0 1,138.1 459.6 346.2 678.5
Building materials and garden supplies ............ 52 860.2 73.1 35.3 24.4 37.8 72.3 34.7 24.0 37.5 Lumber and other building materials ............... 521 506.0 55.2 27.7 18.4 27.5 54.8 27.4 18.1 27.4 Paint, glass, and wallpaper stores ................... 523 66.2 3.6 1.6 1.2 2.1 3.6 1.6 1.2 2.1 Hardware stores .............................................. 525 162.7 7.1 2.8 2.1 4.2 6.9 2.7 2.0 4.2 Retail nurseries and garden stores ................. 526 90.2 5.0 2.2 1.8 2.7 4.7 2.2 1.8 2.6 Mobile home dealers ....................................... 527 35.1 2.2 .9 .9 1.3 2.2 .9 .8 1.3
General merchandise stores ............................ 53 2,662.6 196.8 98.2 61.3 98.6 192.3 95.4 59.7 96.9 Department stores ........................................... 531 2,327.4 177.5 89.2 54.4 88.2 173.2 86.7 52.9 86.6 Variety stores .................................................. 533 135.9 9.0 4.4 3.3 4.6 8.9 4.3 3.3 4.5 Miscellaneous general merchandise stores .... 539 199.3 10.4 4.5 3.5 5.8 10.2 4.5 3.5 5.8
Food stores ...................................................... 54 3,359.3 221.2 92.7 70.4 128.6 214.1 89.2 67.4 125.0 Grocery stores ................................................. 541 2,983.2 209.7 87.3 65.8 122.4 203.1 84.1 63.2 119.0 Meat and fish markets ..................................... 542 46.9 1.6 .6 .5 1.0 1.6 .6 .5 1.0 Fruit and vegetable markets ............................ 543 29.2 1.2 .6 .4 .6 1.2 .6 .4 .6 Candy, nut, and confectionery stores .............. 544 30.2 .9 .6 .5 .4 .9 .5 .5 .3 Dairy products stores ...................................... 545 15.4 .5 .3 .2 .2 .4 .2 .1 .2 Retail bakeries ................................................. 546 185.8 5.5 2.6 2.2 3.0 5.3 2.4 2.0 2.9 Miscellaneous food stores ............................... 549 68.6 1.8 .8 .7 1.0 1.8 .8 .7 1.0
Automotive dealers and service stations .......... 55 2,187.8 141.5 52.4 43.7 89.0 139.1 51.3 42.7 87.8 New and used car dealers ............................... 551 994.7 77.4 25.4 21.3 52.0 76.3 25.0 20.9 51.2 Used car dealers ............................................. 552 78.7 1.7 .7 .5 1.0 1.7 .7 .5 1.0 Auto and home supply stores .......................... 553 370.2 33.3 14.3 12.2 19.0 32.8 14.0 12.0 18.8 Gasoline service stations ................................ 554 646.8 23.7 10.1 8.2 13.6 23.1 9.7 7.8 13.4
See footnotes at end of table.
32

Table 2. Number of nonfatal occupational injuries and illnesses, by industry and case type, 1995 — Continued
Industry 1 SICcode 2
1995Annualaverageemploy-ment 3(000’s)
Injuries and Illnesses Injuries
Totalcases(000’s)
Lost workdaycases Cases
withoutlost
work-days
(000’s)
Totalcases(000’s)
Lost workdaycases Cases
withoutlost
work-days
(000’s)
Total 4(000’s)
Withdaysawayfrom
work 5(000’s)
Total 4(000’s)
Withdaysawayfrom
work 5(000’s)
Boat dealers .................................................... 555 34.2 1.8 0.7 0.6 1.1 1.8 0.7 0.6 1.1 Recreational vehicle dealers ........................... 556 24.8 2.2 .6 .5 1.6 2.2 .6 .5 1.6 Motorcycle dealers .......................................... 557 29.6 .7 .3 .3 .4 .7 .3 .3 .4
Apparel and accessory stores .......................... 56 1,143.9 29.8 12.4 8.4 17.4 28.9 11.9 8.1 17.0 Men’s and boys’ clothing stores ...................... 561 88.9 1.4 .8 .6 .6 1.3 .7 .5 .6 Women’s clothing stores ................................. 562 330.7 6.9 2.7 2.0 4.2 6.7 2.5 1.9 4.1 Children’s and infants’ wear stores ................. 564 39.8 .7 .4 .2 .3 .7 .4 .2 .3 Family clothing stores ...................................... 565 334.0 13.8 5.6 3.4 8.2 13.4 5.4 3.3 8.0 Shoe stores ..................................................... 566 205.3 4.0 2.1 1.5 1.9 3.8 1.9 1.4 1.8 Miscellaneous apparel and accessory stores .. 569 88.9 1.8 .7 .6 1.1 1.7 .6 .5 1.1
Furniture and homefurnishings stores .............. 57 947.8 46.6 22.0 16.9 24.6 45.9 21.7 16.6 24.2 Furniture and homefurnishings stores ............. 571 489.6 30.9 15.3 11.7 15.7 30.5 15.0 11.5 15.4 Household appliance stores ............................ 572 78.7 5.2 2.1 1.6 3.1 5.1 2.1 1.6 3.1 Radio, television, and computer stores ........... 573 379.5 10.5 4.6 3.6 5.9 10.3 4.5 3.5 5.7
Eating and drinking places ............................... 58 7,351.9 379.2 121.7 103.2 257.5 365.6 120.1 101.7 245.5
Miscellaneous retail .......................................... 59 2,660.3 85.0 37.5 27.5 47.5 79.8 35.3 26.0 44.6 Drug stores and proprietary stores .................. 591 604.0 13.3 5.3 4.7 8.0 12.8 5.0 4.4 7.8 Liquor stores .................................................... 592 111.7 2.0 .7 .6 1.3 2.0 .7 .6 1.2 Used merchandise stores ................................ 593 100.0 3.6 2.1 1.4 1.5 3.5 2.0 1.4 1.5 Miscellaneous shopping goods stores ............ 594 941.1 26.2 10.5 8.0 15.6 25.4 10.2 7.7 15.3 Nonstore retailers ............................................ 596 329.4 20.5 10.4 6.0 10.1 17.5 9.3 5.5 8.2 Fuel dealers ..................................................... 598 98.6 7.4 3.6 3.1 3.8 7.2 3.5 3.0 3.7 Retail stores, n.e.c. .......................................... 599 475.3 12.0 4.9 3.8 7.1 11.4 4.5 3.5 6.9
Finance, insurance, and real estate ................ 6,617.6 155.5 59.3 47.2 96.2 138.3 52.2 41.6 86.1
Depository institutions ...................................... 60 2,020.8 40.2 12.3 10.3 27.9 35.2 9.8 8.2 25.4 Central reserve depositories ........................... 601 25.9 .8 .4 .3 .4 .7 .3 .2 .4 Commercial banks ........................................... 602 1,461.1 30.6 9.0 7.5 21.6 26.8 7.2 5.9 19.6 Savings institutions .......................................... 603 275.9 4.6 1.6 1.4 3.0 4.0 1.2 1.0 2.8 Credit unions ................................................... 606 156.3 3.0 1.0 .9 2.0 2.7 .8 .7 1.8 Functions closely related to banking ............... 609 69.1 1.1 .3 .3 .8 .9 .2 .2 .6
Nondepository institutions ................................ 61 462.5 5.6 2.1 1.8 3.5 4.8 1.6 1.4 3.1 Personal credit institutions .............................. 614 144.3 2.0 .8 .7 1.2 1.7 .6 .5 1.1 Business credit institutions .............................. 615 92.4 1.4 .5 .4 .9 1.1 .4 .3 .7 Mortgage bankers and brokers ....................... 616 204.3 2.1 .8 .7 1.3 1.8 .6 .6 1.2
Security and commodity brokers ...................... 62 522.5 4.0 1.4 1.1 2.6 3.5 1.2 1.0 2.3 Security brokers and dealers ........................... 621 396.9 2.8 1.0 .7 1.8 2.4 .8 .6 1.6 Security and commodity exchanges ................ 623 8.3 .2 .1 .1 .1 .2 .1 .1 .1 Security and commodity services .................... 628 101.4 .9 .3 .3 .6 .9 .3 .3 .5
Insurance carriers ............................................. 63 1,372.1 29.9 10.3 8.3 19.6 23.5 7.9 6.5 15.6 Life insurance .................................................. 631 410.2 8.4 2.7 2.2 5.7 6.7 2.1 1.8 4.6 Medical service and health insurance ............. 632 303.8 7.1 2.8 2.1 4.3 5.3 2.1 1.6 3.2 Fire, marine, and casualty insurance .............. 633 530.8 12.7 4.1 3.4 8.6 10.0 3.1 2.6 6.9 Surety insurance ............................................. 635 18.1 .3 .1 .1 .2 .3 .1 .1 .2 Title insurance ................................................. 636 64.3 .5 .2 .2 .4 .5 .2 .2 .3
Insurance agents, brokers, and service ........... 64 694.6 7.6 2.7 2.3 4.9 6.4 2.2 1.8 4.2
Real estate ....................................................... 65 1,342.8 63.4 28.4 22.0 35.0 60.7 27.6 21.3 33.0 Real estate operators and lessors ................... 651 570.9 32.1 16.1 12.1 16.1 30.6 15.7 11.8 14.9 Real estate agents and managers .................. 653 632.0 23.8 8.9 7.3 14.9 22.8 8.6 7.0 14.3 Title abstract offices ........................................ 654 29.9 .2 .1 .1 .2 .2 .1 .1 .2 Subdividers and developers ............................ 655 109.9 7.3 3.4 2.6 3.9 7.0 3.3 2.5 3.7
See footnotes at end of table.
33

Table 2. Number of nonfatal occupational injuries and illnesses, by industry and case type, 1995 — Continued
Industry 1 SICcode 2
1995Annualaverageemploy-ment 3(000’s)
Injuries and Illnesses Injuries
Totalcases(000’s)
Lost workdaycases Cases
withoutlost
work-days
(000’s)
Totalcases(000’s)
Lost workdaycases Cases
withoutlost
work-days
(000’s)
Total 4(000’s)
Withdaysawayfrom
work 5(000’s)
Total 4(000’s)
Withdaysawayfrom
work 5(000’s)
Holding and other investment offices ............... 67 202.3 4.7 2.0 1.4 2.7 4.3 1.8 1.3 2.4 Holding offices ................................................. 671 103.4 2.9 1.1 .8 1.8 2.7 1.0 .8 1.7 Investment offices ........................................... 672 17.8 .3 .1 .1 .2 .2 .1 .1 .1 Trusts .............................................................. 673 41.6 1.0 .5 .3 .5 1.0 .5 .3 .5 Miscellaneous investing .................................. 679 39.6 .4 .2 .2 .2 .4 .2 .2 .2
Services ............................................................. 30,920.3 1,498.1 650.2 475.3 847.9 1,410.2 621.4 454.0 788.9
Hotels and other lodging places ....................... 70 1,662.0 127.2 55.9 37.0 71.3 122.9 54.1 35.9 68.8 Hotels and motels ............................................ 701 1,604.8 123.5 54.6 35.9 68.9 119.4 52.8 34.9 66.6 Camps and recreational vehicle parks ............ 703 40.4 3.1 1.0 .8 2.1 2.9 1.0 .8 2.0
Personal services ............................................. 72 1,166.2 37.0 17.6 12.7 19.5 34.5 16.3 11.6 18.2 Laundry, cleaning, and garment services ........ 721 432.3 26.4 13.0 9.1 13.4 25.3 12.5 8.7 12.8 Photographic studios, portrait .......................... 722 73.9 1.6 .8 .4 .8 1.5 .7 .4 .8 Beauty shops ................................................... 723 390.6 5.0 1.9 1.8 3.0 3.7 1.4 1.2 2.4 Funeral service and crematories ..................... 726 92.3 2.4 1.1 .8 1.3 2.3 1.1 .7 1.2 Miscellaneous personal services ..................... 729 159.6 1.5 .6 .4 1.0 1.4 .5 .4 .9
Business services ............................................. 73 6,798.8 200.0 91.6 70.7 108.4 189.0 86.7 67.3 102.2 Advertising ....................................................... 731 236.5 4.7 2.1 1.7 2.6 4.4 2.0 1.6 2.4 Credit reporting and collection ......................... 732 118.1 1.6 .7 .6 .8 1.4 .6 .5 .7 Mailing, reproduction, stenographic ................ 733 277.9 9.3 4.5 2.7 4.9 8.4 3.9 2.4 4.5 Services to buildings ....................................... 734 881.1 49.0 25.4 21.0 23.5 47.6 24.9 20.4 22.8 Miscellaneous equipment rental and leasing .. 735 224.4 16.1 6.5 5.1 9.6 15.6 6.5 5.0 9.1 Personnel supply services ............................... 736 2,476.8 46.4 19.6 15.6 26.7 44.5 18.9 15.0 25.5 Computer and data processing services ......... 737 1,084.0 17.2 6.6 4.6 10.6 14.0 5.2 3.7 8.8 Miscellaneous business services .................... 738 1,500.2 55.9 26.1 19.5 29.8 53.2 24.8 18.6 28.4
Auto repair, services, and parking .................... 75 1,015.1 61.9 26.3 21.7 35.6 60.2 25.4 20.9 34.8 Automotive rentals, no drivers ......................... 751 181.0 11.5 5.3 4.2 6.2 11.2 5.1 4.0 6.1 Automobile parking .......................................... 752 65.0 2.9 1.2 1.0 1.7 2.8 1.2 .9 1.6 Automotive repair shops .................................. 753 562.6 35.4 13.9 11.8 21.6 34.4 13.3 11.2 21.1 Automotive services, except repair ................. 754 206.6 12.0 5.9 4.8 6.1 11.7 5.8 4.7 5.9 Miscellaneous repair services .......................... 76 359.1 26.8 12.4 9.8 14.4 26.3 12.1 9.6 14.1 Electrical repair shops ..................................... 762 108.9 6.1 2.7 2.2 3.3 6.0 2.7 2.1 3.3 Reupholstery and furniture repair .................... 764 21.5 1.0 .6 .5 .4 1.0 .6 .5 .4 Miscellaneous repair shops ............................. 769 223.3 19.7 9.1 7.2 10.6 19.3 8.9 7.0 10.4
Motion pictures ................................................. 78 489.9 10.8 3.4 2.5 7.5 10.5 3.3 2.4 7.2 Motion picture production and services ........... 781 204.8 6.4 2.1 1.5 4.4 6.1 2.0 1.4 4.1 Motion picture distribution and services .......... 782 21.7 .4 .1 .1 .3 .4 .1 .1 .3 Motion picture theaters .................................... 783 117.6 2.9 .9 .8 2.0 2.8 .9 .7 2.0 Video tape rental ............................................. 784 146.0 1.1 .3 .2 .9 1.1 .3 .2 .9
Amusement and recreation services ................ 79 1,454.7 89.9 41.0 24.2 48.9 85.1 39.2 23.4 45.8 Dance studios, schools, and halls ................... 791 24.4 .1 7(� ) 7(� ) 7(� ) .1 7(� ) 7(� ) 7(� ) Producers, orchestras, entertainers ................ 792 148.9 6.8 2.3 1.7 4.6 6.6 2.2 1.7 4.4 Bowling centers ............................................... 793 83.2 2.0 .6 .5 1.4 1.9 .6 .5 1.3 Commercial sports .......................................... 794 116.0 13.2 6.2 4.4 7.0 13.0 6.1 4.3 6.9 Miscellaneous amusement, recreation
services ........................................................ 799 1,082.2 67.8 31.9 17.5 35.9 63.4 30.3 16.9 33.1
Health services ................................................. 80 9,203.1 674.3 287.2 209.0 387.1 627.6 275.8 200.6 351.8 Offices and clinics of medical doctors ............. 801 1,609.9 37.9 9.8 7.9 28.0 32.7 7.9 6.4 24.8 Offices and clinics of dentists .......................... 802 594.3 10.1 .7 .6 9.4 9.0 .6 .5 8.4 Offices of other health practitioners ................. 804 399.6 6.0 2.7 1.7 3.3 5.4 2.5 1.6 2.9 Nursing and personal care facilities ................ 805 1,692.5 252.1 121.4 82.4 130.8 246.9 120.0 81.5 126.9 Hospitals .......................................................... 806 3,742.9 299.6 122.1 91.9 177.5 268.9 115.2 86.7 153.7 Medical and dental laboratories ...................... 807 189.4 7.8 2.9 2.2 4.9 6.8 2.6 2.1 4.3
See footnotes at end of table.
34

Table 2. Number of nonfatal occupational injuries and illnesses, by industry and case type, 1995 — Continued
Industry 1 SICcode 2
1995Annualaverageemploy-ment 3(000’s)
Injuries and Illnesses Injuries
Totalcases(000’s)
Lost workdaycases Cases
withoutlost
work-days
(000’s)
Totalcases(000’s)
Lost workdaycases Cases
withoutlost
work-days
(000’s)
Total 4(000’s)
Withdaysawayfrom
work 5(000’s)
Total 4(000’s)
Withdaysawayfrom
work 5(000’s)
Home health care services .............................. 808 623.5 43.2 21.7 17.7 21.4 41.4 21.4 17.4 20.0 Health and allied services, n.e.c. ..................... 809 301.4 17.1 6.0 4.5 11.1 16.0 5.7 4.3 10.3
Legal services .................................................. 81 923.4 8.0 3.0 2.5 5.1 6.5 2.1 1.7 4.4
Educational services ........................................ 82 1,418.8 39.9 14.4 11.6 25.5 37.4 13.6 11.0 23.8 Elementary and secondary schools ................ 821 394.0 13.2 4.8 4.0 8.4 12.6 4.6 3.8 8.0 Colleges and universities ................................ 822 794.8 22.2 8.1 6.4 14.1 20.4 7.6 6.0 12.8 Libraries ........................................................... 823 22.0 .3 .1 .1 .1 .3 .1 .1 .1 Vocational schools .......................................... 824 77.1 1.5 .3 .3 1.2 1.5 .3 .3 1.2 Schools and educational services, n.e.c. ........ 829 131.0 2.8 1.0 .9 1.8 2.6 1.0 .8 1.6
Social services ................................................. 83 2,270.6 133.5 59.5 46.0 74.0 128.4 57.6 44.3 70.8 Individual and family services .......................... 832 629.5 27.6 12.0 10.0 15.7 26.9 11.7 9.7 15.3 Job training and related services ..................... 833 265.3 21.7 9.8 7.5 11.9 20.8 9.3 7.1 11.6 Child day care services ................................... 835 531.8 14.8 6.7 5.5 8.1 13.8 6.2 5.1 7.6 Residential care ............................................... 836 644.4 60.3 27.0 19.9 33.3 58.1 26.5 19.5 31.6 Social services, n.e.c. ...................................... 839 199.7 9.1 4.1 3.1 5.0 8.7 3.9 3.0 4.8
Museums, botanical, zoological gardens ......... 84 80.0 4.0 1.7 1.2 2.3 3.8 1.7 1.2 2.2 Museums and art galleries .............................. 841 61.5 2.2 1.0 .8 1.2 2.1 .9 .8 1.2 Botanical and zoological gardens .................... 842 18.5 1.8 .7 .4 1.1 1.7 .7 .4 1.0
Membership organizations ............................... 86 952.9 25.2 10.1 8.2 15.1 23.7 9.3 7.5 14.4
Business associations ..................................... 861 107.8 1.5 .6 .5 .8 1.2 .5 .3 .8 Professional organizations .............................. 862 57.0 1.0 .4 .3 .6 .9 .3 .3 .6 Civic and social associations ........................... 864 457.4 15.1 5.8 4.9 9.4 14.6 5.6 4.8 9.0 Religious organizations ................................... 866 115.7 2.0 .9 .8 1.1 1.9 .9 .8 1.0 Membership organizations, n.e.c. ................... 869 69.0 4.2 1.7 1.0 2.6 4.0 1.5 .9 2.4
Engineering and management services ........... 87 2,739.1 58.7 25.8 17.8 32.9 53.7 23.8 16.3 29.9 Engineering and architectural services ........... 871 810.8 16.0 6.9 5.7 9.1 14.5 6.0 4.9 8.4 Accounting, auditing, and bookkeeping ........... 872 553.1 4.7 1.8 1.6 2.9 4.4 1.7 1.5 2.7 Research and testing services ........................ 873 567.3 16.0 6.5 4.2 9.5 14.0 5.8 3.8 8.2 Management and public relations ................... 874 808.0 22.0 10.6 6.4 11.4 20.8 10.3 6.1 10.6 Services, n.e.c. ................................................. 89 44.7 .9 .5 .4 .5 .8 .4 .3 .5
1 Totals for divisions and 2- and 3-digit SIC codes include data forindustries not shown separately.
2 Standard Industrial Classification Manual, 1987 Edition. 3 Employment is expressed as an annual average and is derived
primarily from the BLS-State Covered Employment Statistics program. 4 Total includes cases involving restricted work activity only in
addition to days-away-from-work cases with or without restricted workactivity.
5 Days-away-from-work cases include those which result in daysaway from work with or without restricted work activity.
6 Excludes farms with fewer than 11 employees. 7 Fewer than 50 cases.
8 Data conforming to OSHA definitions for mining operators in coal,metal, and nonmetal mining and for employers in railroad transportationare provided to BLS by the Mine Safety and Health Administration, U.S.Department of Labor; and the Federal Railroad Administration, U.S.Department of Transportation. Independent mining contractors areexcluded from the coal, metal, and nonmetal mining industries. NOTE: Because of rounding, components may not add to the totals. n.e.c. = not elsewhere classified.
– Data not available.
SOURCE: Bureau of Labor Statistics, U.S. Department of Labor.
35

Technical Notes
Data sourcesInformation in this report is from the Survey of Occupational Injuries and Illnesses,
a Federal/State cooperative program in which employer reports are collected andprocessed by State agencies cooperating with the Bureau of Labor Statistics. A sample of250,000 establishments representing the total private economy (except for mines andrailroads) was surveyed for 1995.
The survey is limited to private industry. It excludes the self-employed, farms withfewer than 11 employees, private households, and employees in Federal, State, and localgovernment agencies. Under a separate system, agencies of the Federal Government filework injury and illness reports with the Secretary of Labor.
Nonfatal occupational injuries and illnesses for coal, metal and nonmetal mining,and railroad activities were reported, respectively, to the Bureau of Labor Statistics by theMine Safety and Health Administration of the U.S. Department of Labor and by theFederal Railroad Administration of the U.S. Department of Transportation.
Scope and method of survey
Industries included in the survey. The survey includes the following private industries:Agriculture, forestry, and fishing, SIC 01-09; oil and gas extraction, SIC 13; sulfur mining,part of SIC 14; construction, SIC 15-17; manufacturing, SIC 20-39; transportation andpublic utilities, SIC 41-42 and 44-49; wholesale and retail trade, SIC 50-59; finance,insurance, and real estate, SIC 60-67; and services, SIC 70-87 and 89.
Survey exclusions. Excluded from the survey are self-employed individuals; farms withfewer than 11 employees; employees regulated by other Federal safety and health laws;and Federal, State, and local government agencies.
Industrial Classification. Reporting units are classified into industries by their principalproduct or activity. The data are tabulated according to the 1987 edition of the StandardIndustrial Classification Manual.
DefinitionsThe definitions of occupational injuries and illnesses are from Recordkeeping
Guidelines for Occupational Injuries and Illnesses (U.S. Department of Labor, Bureau ofLabor Statistics, September 1986). Nonfatal recordable injuries and illnesses are either:
1. Nonfatal occupational illnesses; or2. Nonfatal occupational injuries which involve one or more of the
following: loss of consciousness, restriction of work or motion, transfer to another job, ormedical treatment (other than first aid).
Occupational injury is any injury such as a cut, fracture, sprain, strain, amputation,etc., which results from a work event or from a single instantaneous exposure in the workenvironment.
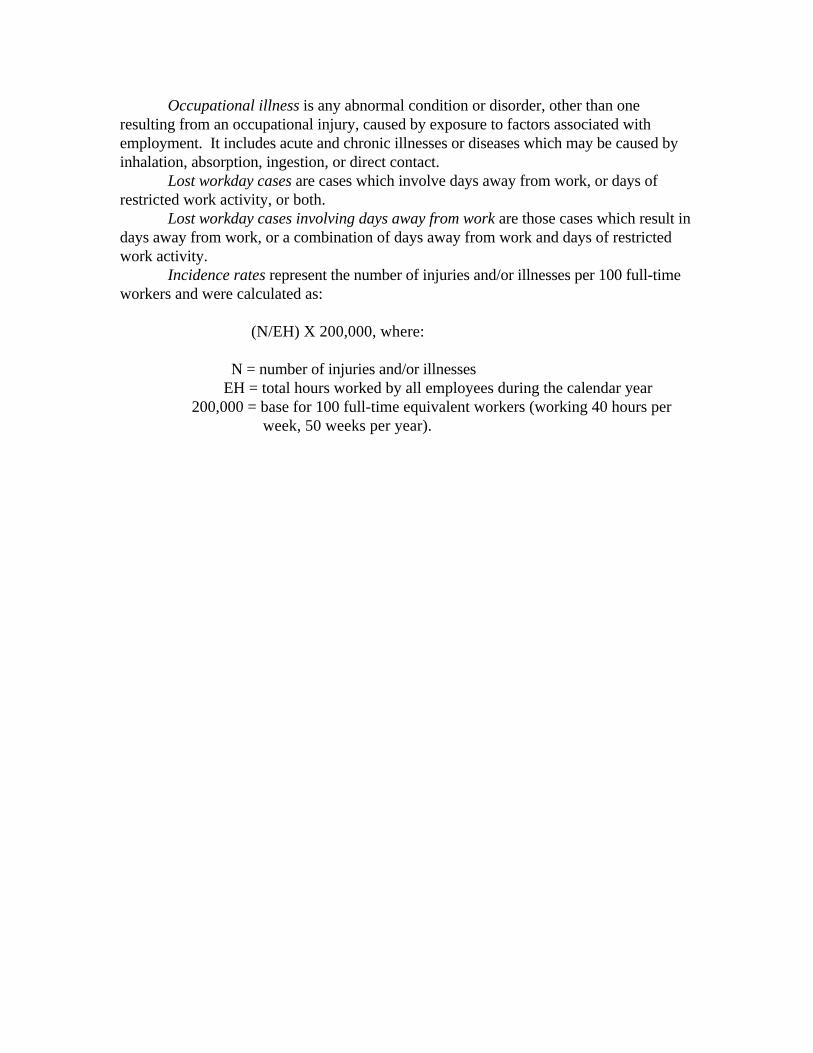
Occupational illness is any abnormal condition or disorder, other than oneresulting from an occupational injury, caused by exposure to factors associated withemployment. It includes acute and chronic illnesses or diseases which may be caused byinhalation, absorption, ingestion, or direct contact.
Lost workday cases are cases which involve days away from work, or days ofrestricted work activity, or both.
Lost workday cases involving days away from work are those cases which result indays away from work, or a combination of days away from work and days of restrictedwork activity.
Incidence rates represent the number of injuries and/or illnesses per 100 full-timeworkers and were calculated as:
(N/EH) X 200,000, where:
N = number of injuries and/or illnesses EH = total hours worked by all employees during the calendar year 200,000 = base for 100 full-time equivalent workers (working 40 hours per week, 50 weeks per year).