Embed Size (px)
Citation preview
Survey of Portland Cement Consumption: 2nd Quarter 2012 | PCA Market Intelligence
SURVEY OF PORTLAND CEMENT CONSUMPTION BY USER GROUP
SECOND QUARTER 2012
Market Intelligence Group
Ed Sullivan Vice President & Chief Economist
847.972.9006
Brian Schmidt Market Intelligence Analyst
847.972.9042

Survey of Portland Cement Consumption: 2nd Quarter 2012 | PCA Market Intelligence
Survey of Portland Cement Consumption: 2nd Quarter 2012 | PCA Market Intelligence
2
Table of Contents
Survey Overview ...................................................................................................................... 4
Survey Response Rate ............................................................................................................ 5
Portland Cement Consumption ............................................................................................... 6
Data ........................................................................................................................................ 7
Analysis .............................................................................................................................. 8-9
Forecast ............................................................................................................................... 10
User Groups ........................................................................................................................... 12
Ready-Mixed Concrete .................................................................................................... 14-15
Streets & Highways Contractors ......................................................................................16-17
Concrete Brick & Block Manufacturers .............................................................................18-19
Oil & Gas Well Drilling .....................................................................................................20-21
Precast Concrete .............................................................................................................22-23
Packaged Product Producers .......................................................................................... 24-25
SC/RCC/FDR Paving .......................................................................................................26-27
Building Materials Dealers ...............................................................................................28-29
Concrete Pipe .................................................................................................................. 30-31
Prestressed Concrete ...................................................................................................... 32-33
Interlocking Pavers ..........................................................................................................34-35
Waste S/S. ...................................................................................................................... 36-37
Fiber Cement Siding Manufacturers ................................................................................ 38-39
Concrete Roof Tile Manufacturers ................................................................................... 40-41
SC/RCC for Water Resources ......................................................................................... 42-43
All Other Manufacturers and Contractors .............................................................................. 44

Survey of Portland Cement Consumption: 2nd Quarter 2012 | PCA Market Intelligence
Survey of Portland Cement Consumption: 2nd Quarter 2012 | PCA Market Intelligence
4
The Portland Cement Association’s (PCA’s) Market Intelligence Group conducts a quarterly survey of portland cement consumption by user segment. The intent of this report is to help member companies, PCA/ CAC staff, and promotional allies better evaluate market conditions surrounding the use of con-crete and other cement based products. Data for eighteen user segments is collected:
• Building Materials Dealers • Concrete Brick & Block Manufacturers • Fiber-Cement Siding • Concrete Pipe • Concrete Roof Tile • Interlocking Pavers • Oil & Gas Well Drilling • Packaged Product Producers • Precast Concrete • Prestressed Concrete • Ready-Mixed Concrete • Full- Depth Reclamation (FDR) Paving • Soil-Cement (SC) Paving • Roller Compacted Concrete (RCC) Paving • Soil-Cement/ Roller Compacted Concrete (SC/RCC)-Water Resources • Streets & Highways Contractors • Waste Solidification & Stabilization (S/S) • All Other Manufacturers and Contractors
Survey forms are sent to all PCA member cement companies in North America. Totals include U.S. and Canadian data and excludes masonry and white cement. Cement tonnage is reported in metric tons. Survey results are adjusted to correspond to the U.S.G.S. (U.S.) and Statistics Canada (Canada) ce-ment consumption volumes as reported by cement companies in their respective monthly surveys to those agencies. Although this survey excludes white cement, white cement consumption cannot be ex-cluded from the U.S.G.S. nor Statistics Canada surveys and may account for up to 1.5% of quarterly volume. Cement segment graphs are a reflection of North American (U.S. & Canada) data. Regional graphs reflect U.S. volumes only.
Survey Overview
The Portland Cement Association (PCA) and its members make no express or implied warranty with respect to this publication or any information contained herein. In particular, no warranty is made of merchantability or fitness for a particular purpose. PCA and its members disclaim any product liability (including without limitation any strict liability in tort) in connection with this publication or any information contained herein. This report may not be elec-tronically redistributed or produced in whole or in part without authorization of the Portland Cement Association.
© 2012 Portland Cement Association. All rights reserved.

Survey of Portland Cement Consumption: 2nd Quarter 2012 | PCA Market Intelligence
5
The following companies/plants reported for the Second Quarter of 2012:
Alamo Cement Company American Cement Company
Argos USA Corporation Ash Grove Cement Company
Ash Grove Texas, L.P. Buzzi Unicem USA
CalPortland CEMEX
Ciment Quebec, Inc. Continental Cement Drake Cement LLC Essroc Canada Inc.
Essroc Cement Corp. Giant Cement Holdings
GCC of America Inc. Holcim Canada Inc. Holcim (U.S.) Inc.
Lafarge Canada, Inc. Lafarge North America Inc. Lehigh Cement Company
Mitsubishi Cement Corporation The Monarch Cement Company
National Cement Company of Alabama National Cement Company of California
Phoenix Cement Company St. Mary’s Cement Inc. (Canada)/VCNA
St. Mary’s Cement Inc. (U.S.)/VCNA Suwannee American Cement/ VCNA
Texas Industries Inc. Titan America LLC
Survey Response Rate
INDUSTRY RESPONSE RATE: 94%
Survey of Portland Cement Consumption: 2nd Quarter 2012 | PCA Market Intelligence
6
Portland Cement Consumption
Second Quarter 2012 Cement consumption for the second quarter of 2012 was 23,680,436 metric tons (mt), up 11.6% from the second quarter of 2011. In second quarter 2012, Ready-Mixed Concrete captured nearly 70% of total consumption, followed by All Other (4.9%), Streets & Highways Contractors (4.8%), Brick & Block (3.6%), and the Oil & Gas Well Drilling (2.9%) segments. NOTE: Portland cement consumed by the ready-mixed market and used in street and highway construction may be reported under Ready-Mixed Concrete and not under Streets & Highways Contractors.
Ready-Mix70%
Streets & HighwaysContractors
5%
Brick & Block/ Manufactured Stone 4%
Oil & Gas Well Drilling 3%
Precast3%
Packaged Product Producers
3%
SC/RCC/FDR Paving3%
Building Material Dealers2%
Concrete Pipe2%
Prestresed 1%
Interlocking Pavers 1%
Other *1%
All Other 5%
Portland Cement ConsumptionTotal North American User Groups
* Waste S/S, Fiber‐Cement Siding, Concrete Roof Tile, SC/RCC Water Resources
Survey of Portland Cement Consumption: 2nd Quarter 2012 | PCA Market Intelligence
7
Portland Cement Consumption, Second Quarter 2012: Data
-
20,000
40,000
60,000
80,000
100,000
120,000
140,000
2007 2008 2009 2010 2011 2012
Portland Cement Consumption(Thousands of Metric Tons)
1st Quarter 2nd Quarter 3rd Quarter 4th Quarter
Total North America (000 Metric Tons) 2012 2011 Change 2012 2011 Change
Ready-Mix 16,489,129 14,628,293 12.7% 27,459,894 23,316,341 17.8%Streets & Highways Contractors 1,128,804 824,775 36.9% 1,538,966 1,133,771 35.7%Brick & Block/ Manufactured Stone 841,640 816,005 3.1% 1,417,995 1,388,395 2.1%Oil & Gas Well Drilling 689,240 828,498 -16.8% 1,375,165 1,363,230 0.9%Precast 674,405 596,494 13.1% 1,250,135 1,035,582 20.7%Packaged Product Producers 559,853 441,440 26.8% 1,011,044 797,412 26.8%SC/RCC/FDR Paving 534,381 363,538 47.0% 891,148 661,163 34.8%Building Materials Dealers 475,599 466,167 2.0% 854,092 772,977 10.5%Concrete Pipe 368,974 352,911 4.6% 634,336 613,893 3.3%Prestressed Concrete 260,805 215,349 21.1% 495,832 431,567 14.9%Interlocking Pavers 156,504 209,381 -25.3% 243,476 330,979 -26.4%Waste S/S 116,482 120,304 -3.2% 204,901 253,884 -19.3%Fiber Cement Siding Manufacturers 105,546 113,879 -7.3% 166,781 233,967 -28.7%Concrete Roof Tile Manufacturers 89,238 77,506 15.1% 168,222 143,639 17.1%SC/RCC Water Resources 23,121 31,171 -25.8% 33,096 42,961 -23.0%All Other 1,166,712 1,131,889 3.1% 2,186,137 2,245,923 -2.7%Total 23,680,436 21,217,599 11.6% 39,931,219 34,765,684 14.9%
2nd Quarter YTD
Survey of Portland Cement Consumption: 2nd Quarter 2012 | PCA Market Intelligence
8
Portland Cement Consumption, Second Quarter YTD 2012: Analysis
-40%
-30%
-20%
-10%
0%
10%
20%
30%
40%
Market Dynamics: Leaders & LaggardsYTD Change (%)
2011-2012
YTD = 14.9%
-500,000
0
500,000
1,000,000
1,500,000
2,000,000
2,500,000
3,000,000
3,500,000
4,000,000
4,500,000
Market Dynamics: Leaders & LaggardsYTD Volume Change (000 mt)
2011-2012
YTD = +5,166
Survey of Portland Cement Consumption: 2nd Quarter 2012 | PCA Market Intelligence
9
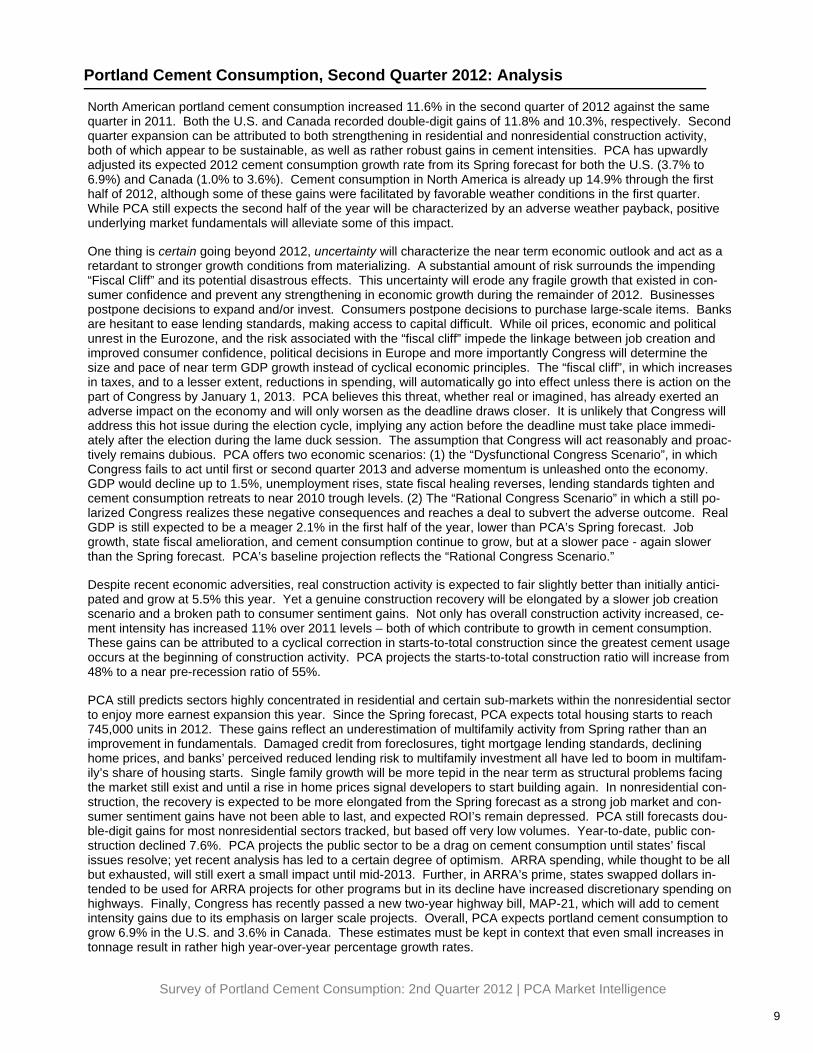
Portland Cement Consumption, Second Quarter 2012: Analysis
North American portland cement consumption increased 11.6% in the second quarter of 2012 against the same quarter in 2011. Both the U.S. and Canada recorded double-digit gains of 11.8% and 10.3%, respectively. Second quarter expansion can be attributed to both strengthening in residential and nonresidential construction activity, both of which appear to be sustainable, as well as rather robust gains in cement intensities. PCA has upwardly adjusted its expected 2012 cement consumption growth rate from its Spring forecast for both the U.S. (3.7% to 6.9%) and Canada (1.0% to 3.6%). Cement consumption in North America is already up 14.9% through the first half of 2012, although some of these gains were facilitated by favorable weather conditions in the first quarter. While PCA still expects the second half of the year will be characterized by an adverse weather payback, positive underlying market fundamentals will alleviate some of this impact. One thing is certain going beyond 2012, uncertainty will characterize the near term economic outlook and act as a retardant to stronger growth conditions from materializing. A substantial amount of risk surrounds the impending “Fiscal Cliff” and its potential disastrous effects. This uncertainty will erode any fragile growth that existed in con-sumer confidence and prevent any strengthening in economic growth during the remainder of 2012. Businesses postpone decisions to expand and/or invest. Consumers postpone decisions to purchase large-scale items. Banks are hesitant to ease lending standards, making access to capital difficult. While oil prices, economic and political unrest in the Eurozone, and the risk associated with the “fiscal cliff” impede the linkage between job creation and improved consumer confidence, political decisions in Europe and more importantly Congress will determine the size and pace of near term GDP growth instead of cyclical economic principles. The “fiscal cliff”, in which increases in taxes, and to a lesser extent, reductions in spending, will automatically go into effect unless there is action on the part of Congress by January 1, 2013. PCA believes this threat, whether real or imagined, has already exerted an adverse impact on the economy and will only worsen as the deadline draws closer. It is unlikely that Congress will address this hot issue during the election cycle, implying any action before the deadline must take place immedi-ately after the election during the lame duck session. The assumption that Congress will act reasonably and proac-tively remains dubious. PCA offers two economic scenarios: (1) the “Dysfunctional Congress Scenario”, in which Congress fails to act until first or second quarter 2013 and adverse momentum is unleashed onto the economy. GDP would decline up to 1.5%, unemployment rises, state fiscal healing reverses, lending standards tighten and cement consumption retreats to near 2010 trough levels. (2) The “Rational Congress Scenario” in which a still po-larized Congress realizes these negative consequences and reaches a deal to subvert the adverse outcome. Real GDP is still expected to be a meager 2.1% in the first half of the year, lower than PCA’s Spring forecast. Job growth, state fiscal amelioration, and cement consumption continue to grow, but at a slower pace - again slower than the Spring forecast. PCA’s baseline projection reflects the “Rational Congress Scenario.” Despite recent economic adversities, real construction activity is expected to fair slightly better than initially antici-pated and grow at 5.5% this year. Yet a genuine construction recovery will be elongated by a slower job creation scenario and a broken path to consumer sentiment gains. Not only has overall construction activity increased, ce-ment intensity has increased 11% over 2011 levels – both of which contribute to growth in cement consumption. These gains can be attributed to a cyclical correction in starts-to-total construction since the greatest cement usage occurs at the beginning of construction activity. PCA projects the starts-to-total construction ratio will increase from 48% to a near pre-recession ratio of 55%. PCA still predicts sectors highly concentrated in residential and certain sub-markets within the nonresidential sector to enjoy more earnest expansion this year. Since the Spring forecast, PCA expects total housing starts to reach 745,000 units in 2012. These gains reflect an underestimation of multifamily activity from Spring rather than an improvement in fundamentals. Damaged credit from foreclosures, tight mortgage lending standards, declining home prices, and banks’ perceived reduced lending risk to multifamily investment all have led to boom in multifam-ily’s share of housing starts. Single family growth will be more tepid in the near term as structural problems facing the market still exist and until a rise in home prices signal developers to start building again. In nonresidential con-struction, the recovery is expected to be more elongated from the Spring forecast as a strong job market and con-sumer sentiment gains have not been able to last, and expected ROI’s remain depressed. PCA still forecasts dou-ble-digit gains for most nonresidential sectors tracked, but based off very low volumes. Year-to-date, public con-struction declined 7.6%. PCA projects the public sector to be a drag on cement consumption until states’ fiscal issues resolve; yet recent analysis has led to a certain degree of optimism. ARRA spending, while thought to be all but exhausted, will still exert a small impact until mid-2013. Further, in ARRA’s prime, states swapped dollars in-tended to be used for ARRA projects for other programs but in its decline have increased discretionary spending on highways. Finally, Congress has recently passed a new two-year highway bill, MAP-21, which will add to cement intensity gains due to its emphasis on larger scale projects. Overall, PCA expects portland cement consumption to grow 6.9% in the U.S. and 3.6% in Canada. These estimates must be kept in context that even small increases in tonnage result in rather high year-over-year percentage growth rates.
Survey of Portland Cement Consumption: 2nd Quarter 2012 | PCA Market Intelligence
10
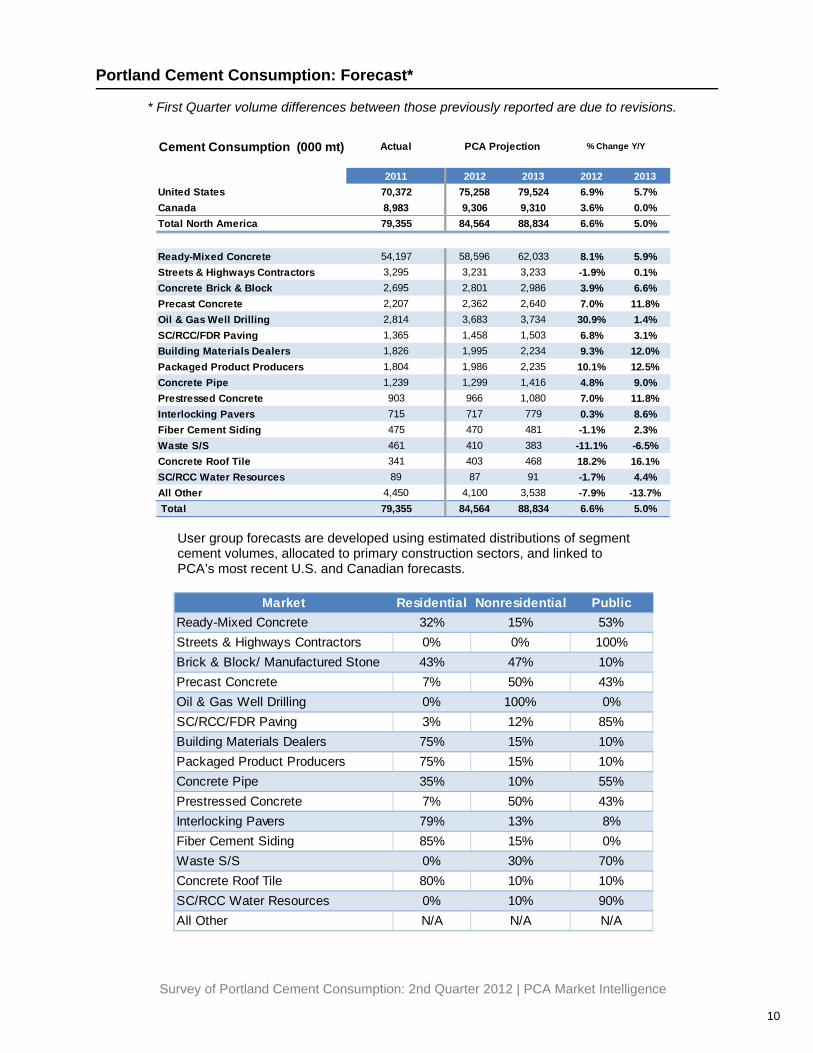
Portland Cement Consumption: Forecast*
User group forecasts are developed using estimated distributions of segment cement volumes, allocated to primary construction sectors, and linked to PCA’s most recent U.S. and Canadian forecasts.
Cement Consumption (000 mt) Actual
2011 2012 2013 2012 2013United States 70,372 75,258 79,524 6.9% 5.7%Canada 8,983 9,306 9,310 3.6% 0.0%Total North America 79,355 84,564 88,834 6.6% 5.0%
Ready-Mixed Concrete 54,197 58,596 62,033 8.1% 5.9%Streets & Highways Contractors 3,295 3,231 3,233 -1.9% 0.1%Concrete Brick & Block 2,695 2,801 2,986 3.9% 6.6%Precast Concrete 2,207 2,362 2,640 7.0% 11.8%Oil & Gas Well Drilling 2,814 3,683 3,734 30.9% 1.4%SC/RCC/FDR Paving 1,365 1,458 1,503 6.8% 3.1%Building Materials Dealers 1,826 1,995 2,234 9.3% 12.0%Packaged Product Producers 1,804 1,986 2,235 10.1% 12.5%Concrete Pipe 1,239 1,299 1,416 4.8% 9.0%Prestressed Concrete 903 966 1,080 7.0% 11.8%Interlocking Pavers 715 717 779 0.3% 8.6%Fiber Cement Siding 475 470 481 -1.1% 2.3%Waste S/S 461 410 383 -11.1% -6.5%Concrete Roof Tile 341 403 468 18.2% 16.1%SC/RCC Water Resources 89 87 91 -1.7% 4.4%All Other 4,450 4,100 3,538 -7.9% -13.7% Total 79,355 84,564 88,834 6.6% 5.0%
PCA Projection % Change Y/Y
Market Residential Nonresidential PublicReady-Mixed Concrete 32% 15% 53%Streets & Highways Contractors 0% 0% 100%Brick & Block/ Manufactured Stone 43% 47% 10%Precast Concrete 7% 50% 43%Oil & Gas Well Drilling 0% 100% 0%SC/RCC/FDR Paving 3% 12% 85%Building Materials Dealers 75% 15% 10%Packaged Product Producers 75% 15% 10%Concrete Pipe 35% 10% 55%Prestressed Concrete 7% 50% 43%Interlocking Pavers 79% 13% 8%Fiber Cement Siding 85% 15% 0%Waste S/S 0% 30% 70%Concrete Roof Tile 80% 10% 10%SC/RCC Water Resources 0% 10% 90%All Other N/A N/A N/A
* First Quarter volume differences between those previously reported are due to revisions.

Survey of Portland Cement Consumption: 2nd Quarter 2012 | PCA Market Intelligence
11

Survey of Portland Cement Consumption: 2nd Quarter 2012 | PCA Market Intelligence
12
USER GROUPS

Survey of Portland Cement Consumption: 2nd Quarter 2012 | PCA Market Intelligence
Survey of Portland Cement Consumption: 2nd Quarter 2012 | PCA Market Intelligence
14
Ready-Mixed Concrete: Data
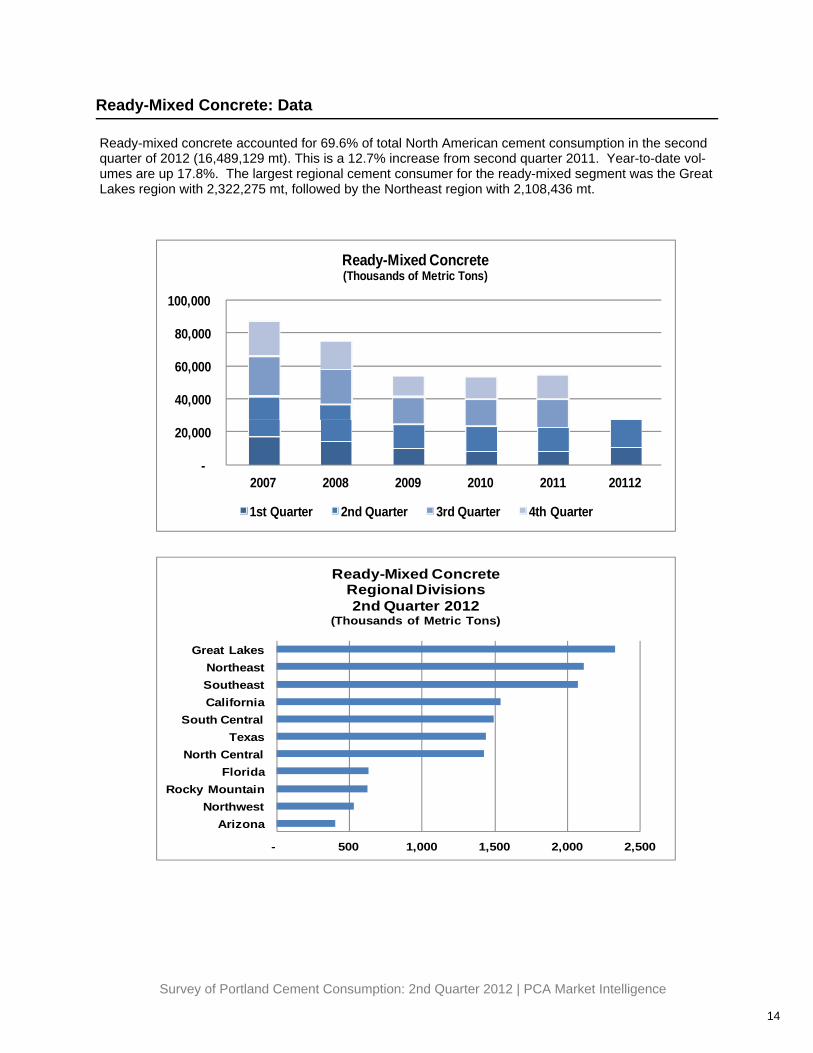
Ready-mixed concrete accounted for 69.6% of total North American cement consumption in the second quarter of 2012 (16,489,129 mt). This is a 12.7% increase from second quarter 2011. Year-to-date vol-umes are up 17.8%. The largest regional cement consumer for the ready-mixed segment was the Great Lakes region with 2,322,275 mt, followed by the Northeast region with 2,108,436 mt.
- 500 1,000 1,500 2,000 2,500
ArizonaNorthwest
Rocky MountainFlorida
North CentralTexas
South CentralCaliforniaSoutheastNortheast
Great Lakes
Ready-Mixed ConcreteRegional Divisions2nd Quarter 2012
(Thousands of Metric Tons)
-
20,000
40,000
60,000
80,000
100,000
2007 2008 2009 2010 2011 20112
Ready-Mixed Concrete(Thousands of Metric Tons)
1st Quarter 2nd Quarter 3rd Quarter 4th Quarter
Survey of Portland Cement Consumption: 2nd Quarter 2012 | PCA Market Intelligence
15
Ready-Mixed Concrete: Analysis
Ready-mixed is concrete manufactured for delivery to a location in a fresh state. Ready-mixed refers to concrete that is batched for delivery from a central plant instead of mixed on the job site. Ready-mixed concrete is shipped to every market segment in North America. As a result, the market drivers for ready mix users generally mirror total cement demand. The principal exception is large high-way construction projects which tend to rely on contractors, thereby diminishing ready-mixed intensity to this segment.
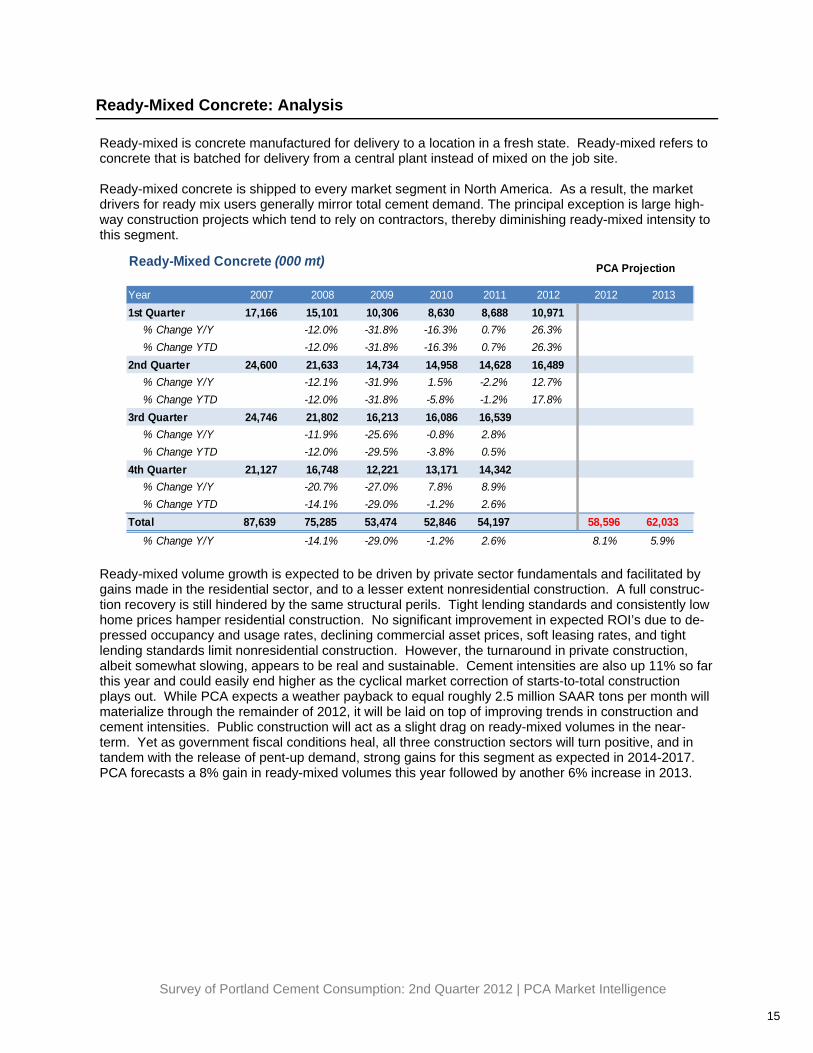
Ready-mixed volume growth is expected to be driven by private sector fundamentals and facilitated by gains made in the residential sector, and to a lesser extent nonresidential construction. A full construc-tion recovery is still hindered by the same structural perils. Tight lending standards and consistently low home prices hamper residential construction. No significant improvement in expected ROI’s due to de-pressed occupancy and usage rates, declining commercial asset prices, soft leasing rates, and tight lending standards limit nonresidential construction. However, the turnaround in private construction, albeit somewhat slowing, appears to be real and sustainable. Cement intensities are also up 11% so far this year and could easily end higher as the cyclical market correction of starts-to-total construction plays out. While PCA expects a weather payback to equal roughly 2.5 million SAAR tons per month will materialize through the remainder of 2012, it will be laid on top of improving trends in construction and cement intensities. Public construction will act as a slight drag on ready-mixed volumes in the near-term. Yet as government fiscal conditions heal, all three construction sectors will turn positive, and in tandem with the release of pent-up demand, strong gains for this segment as expected in 2014-2017. PCA forecasts a 8% gain in ready-mixed volumes this year followed by another 6% increase in 2013.
Ready-Mixed Concrete (000 mt)
Year 2007 2008 2009 2010 2011 2012 2012 20131st Quarter 17,166 15,101 10,306 8,630 8,688 10,971
% Change Y/Y -12.0% -31.8% -16.3% 0.7% 26.3%% Change YTD -12.0% -31.8% -16.3% 0.7% 26.3%
2nd Quarter 24,600 21,633 14,734 14,958 14,628 16,489% Change Y/Y -12.1% -31.9% 1.5% -2.2% 12.7%% Change YTD -12.0% -31.8% -5.8% -1.2% 17.8%
3rd Quarter 24,746 21,802 16,213 16,086 16,539% Change Y/Y -11.9% -25.6% -0.8% 2.8%% Change YTD -12.0% -29.5% -3.8% 0.5%
4th Quarter 21,127 16,748 12,221 13,171 14,342% Change Y/Y -20.7% -27.0% 7.8% 8.9%% Change YTD -14.1% -29.0% -1.2% 2.6%
Total 87,639 75,285 53,474 52,846 54,197 58,596 62,033% Change Y/Y -14.1% -29.0% -1.2% 2.6% 8.1% 5.9%
PCA Projection
Survey of Portland Cement Consumption: 2nd Quarter 2012 | PCA Market Intelligence
16
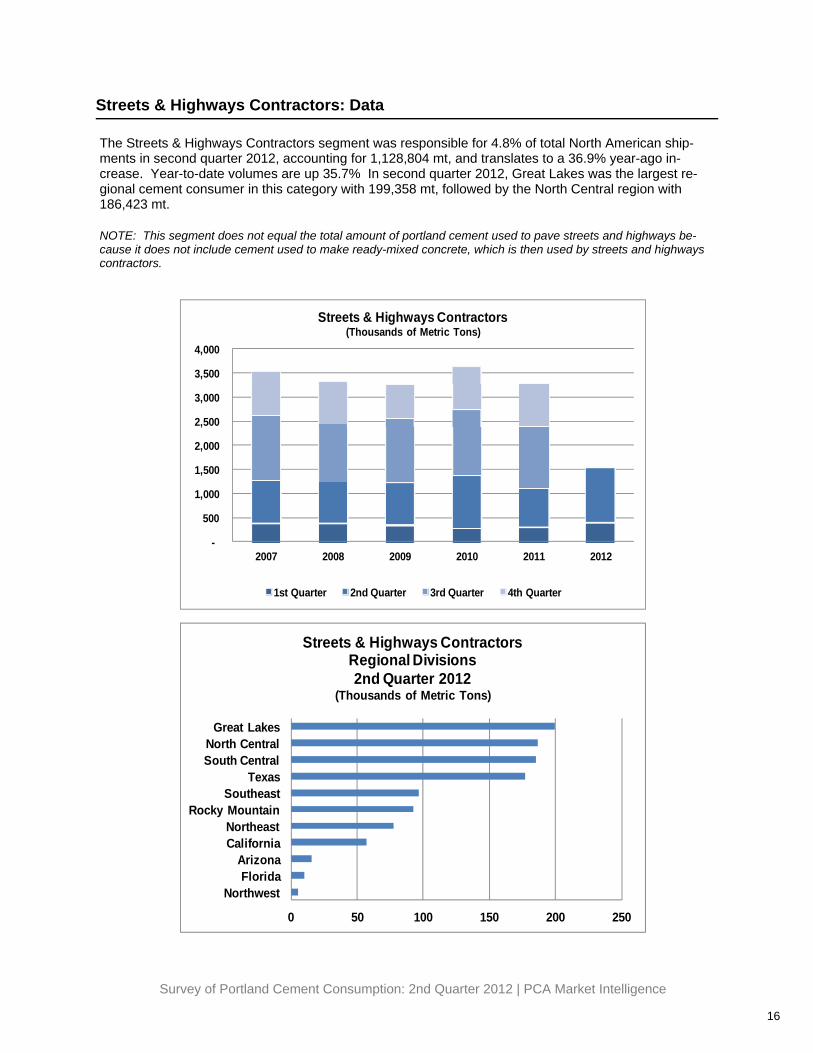
Streets & Highways Contractors: Data
The Streets & Highways Contractors segment was responsible for 4.8% of total North American ship-ments in second quarter 2012, accounting for 1,128,804 mt, and translates to a 36.9% year-ago in-crease. Year-to-date volumes are up 35.7% In second quarter 2012, Great Lakes was the largest re-gional cement consumer in this category with 199,358 mt, followed by the North Central region with 186,423 mt. NOTE: This segment does not equal the total amount of portland cement used to pave streets and highways be-cause it does not include cement used to make ready-mixed concrete, which is then used by streets and highways contractors.
0 50 100 150 200 250
NorthwestFlorida
ArizonaCaliforniaNortheast
Rocky MountainSoutheast
TexasSouth CentralNorth Central
Great Lakes
Streets & Highways ContractorsRegional Divisions2nd Quarter 2012
(Thousands of Metric Tons)
-
500
1,000
1,500
2,000
2,500
3,000
3,500
4,000
2007 2008 2009 2010 2011 2012
Streets & Highways Contractors(Thousands of Metric Tons)
1st Quarter 2nd Quarter 3rd Quarter 4th Quarter
Survey of Portland Cement Consumption: 2nd Quarter 2012 | PCA Market Intelligence
17
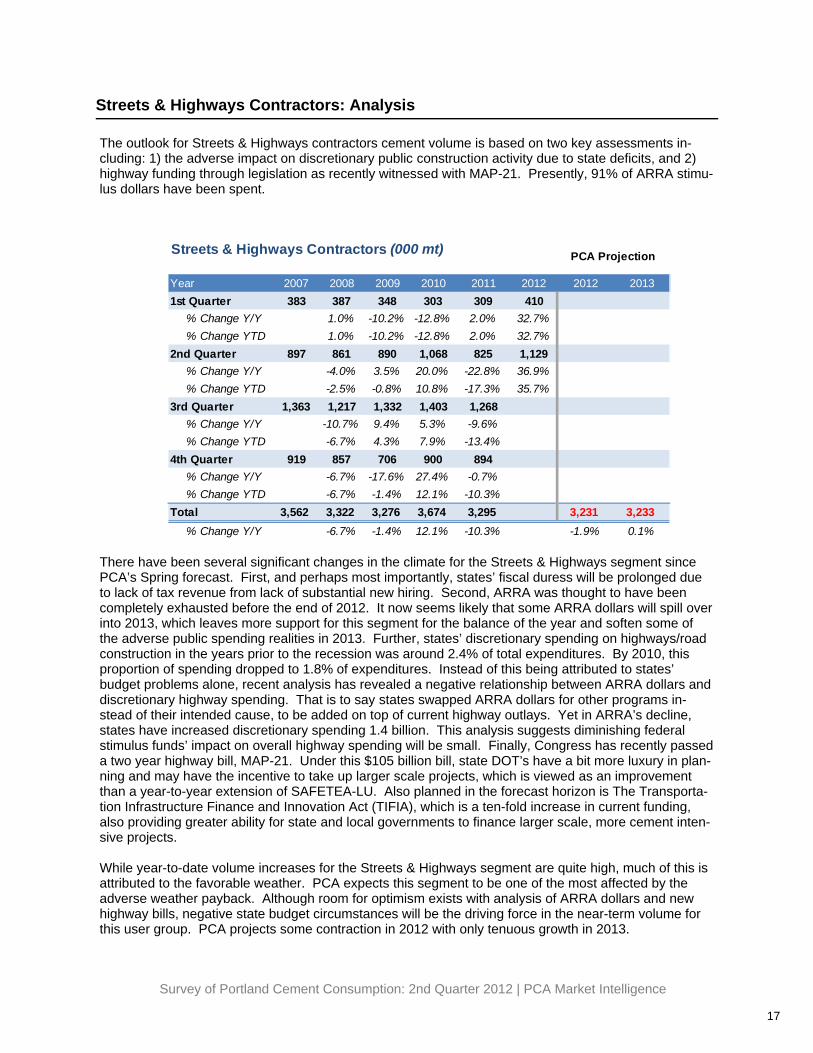
Streets & Highways Contractors: Analysis
The outlook for Streets & Highways contractors cement volume is based on two key assessments in-cluding: 1) the adverse impact on discretionary public construction activity due to state deficits, and 2) highway funding through legislation as recently witnessed with MAP-21. Presently, 91% of ARRA stimu-lus dollars have been spent.
There have been several significant changes in the climate for the Streets & Highways segment since PCA’s Spring forecast. First, and perhaps most importantly, states’ fiscal duress will be prolonged due to lack of tax revenue from lack of substantial new hiring. Second, ARRA was thought to have been completely exhausted before the end of 2012. It now seems likely that some ARRA dollars will spill over into 2013, which leaves more support for this segment for the balance of the year and soften some of the adverse public spending realities in 2013. Further, states’ discretionary spending on highways/road construction in the years prior to the recession was around 2.4% of total expenditures. By 2010, this proportion of spending dropped to 1.8% of expenditures. Instead of this being attributed to states’ budget problems alone, recent analysis has revealed a negative relationship between ARRA dollars and discretionary highway spending. That is to say states swapped ARRA dollars for other programs in-stead of their intended cause, to be added on top of current highway outlays. Yet in ARRA’s decline, states have increased discretionary spending 1.4 billion. This analysis suggests diminishing federal stimulus funds’ impact on overall highway spending will be small. Finally, Congress has recently passed a two year highway bill, MAP-21. Under this $105 billion bill, state DOT’s have a bit more luxury in plan-ning and may have the incentive to take up larger scale projects, which is viewed as an improvement than a year-to-year extension of SAFETEA-LU. Also planned in the forecast horizon is The Transporta-tion Infrastructure Finance and Innovation Act (TIFIA), which is a ten-fold increase in current funding, also providing greater ability for state and local governments to finance larger scale, more cement inten-sive projects. While year-to-date volume increases for the Streets & Highways segment are quite high, much of this is attributed to the favorable weather. PCA expects this segment to be one of the most affected by the adverse weather payback. Although room for optimism exists with analysis of ARRA dollars and new highway bills, negative state budget circumstances will be the driving force in the near-term volume for this user group. PCA projects some contraction in 2012 with only tenuous growth in 2013.
Year 2007 2008 2009 2010 2011 2012 2012 20131st Quarter 383 387 348 303 309 410
% Change Y/Y 1.0% -10.2% -12.8% 2.0% 32.7%% Change YTD 1.0% -10.2% -12.8% 2.0% 32.7%
2nd Quarter 897 861 890 1,068 825 1,129% Change Y/Y -4.0% 3.5% 20.0% -22.8% 36.9%% Change YTD -2.5% -0.8% 10.8% -17.3% 35.7%
3rd Quarter 1,363 1,217 1,332 1,403 1,268% Change Y/Y -10.7% 9.4% 5.3% -9.6%% Change YTD -6.7% 4.3% 7.9% -13.4%
4th Quarter 919 857 706 900 894% Change Y/Y -6.7% -17.6% 27.4% -0.7%% Change YTD -6.7% -1.4% 12.1% -10.3%
Total 3,562 3,322 3,276 3,674 3,295 3,231 3,233% Change Y/Y -6.7% -1.4% 12.1% -10.3% -1.9% 0.1%
Streets & Highways Contractors (000 mt) PCA Projection
Survey of Portland Cement Consumption: 2nd Quarter 2012 | PCA Market Intelligence
18
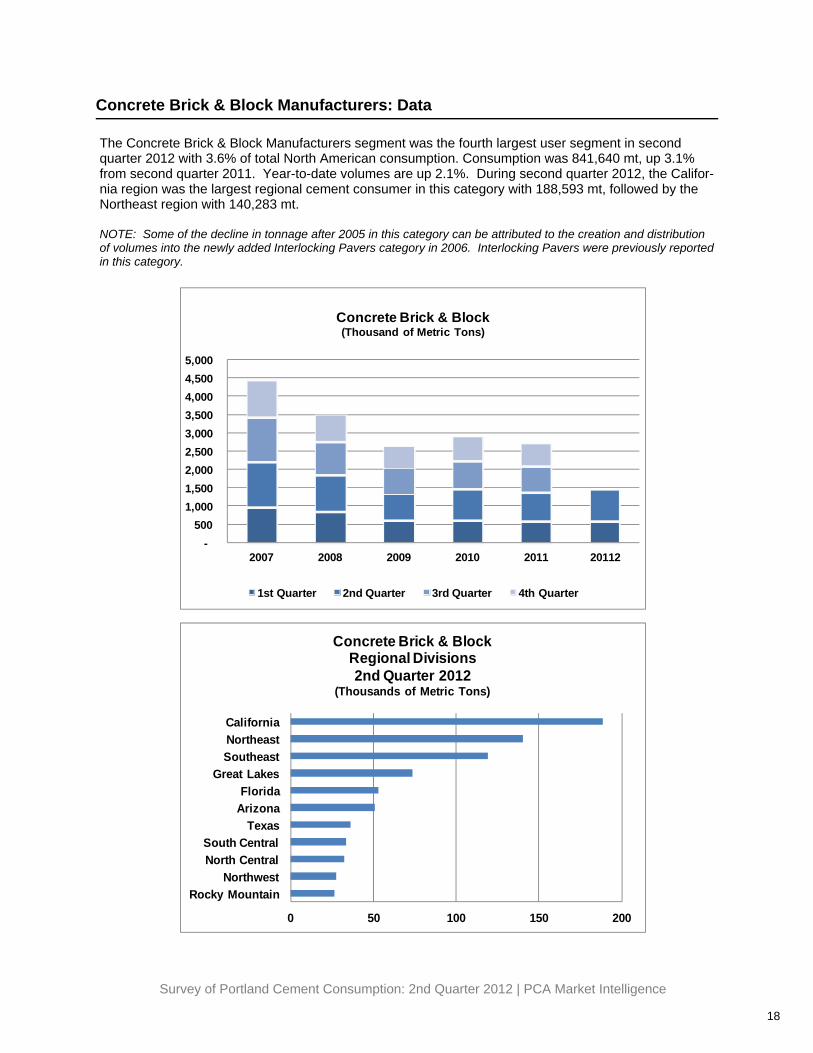
Concrete Brick & Block Manufacturers: Data
The Concrete Brick & Block Manufacturers segment was the fourth largest user segment in second quarter 2012 with 3.6% of total North American consumption. Consumption was 841,640 mt, up 3.1% from second quarter 2011. Year-to-date volumes are up 2.1%. During second quarter 2012, the Califor-nia region was the largest regional cement consumer in this category with 188,593 mt, followed by the Northeast region with 140,283 mt. NOTE: Some of the decline in tonnage after 2005 in this category can be attributed to the creation and distribution of volumes into the newly added Interlocking Pavers category in 2006. Interlocking Pavers were previously reported in this category.
0 50 100 150 200
Rocky MountainNorthwest
North CentralSouth Central
TexasArizonaFlorida
Great LakesSoutheastNortheastCalifornia
Concrete Brick & BlockRegional Divisions2nd Quarter 2012
(Thousands of Metric Tons)
-500
1,000 1,500 2,000 2,500 3,000 3,500 4,000 4,500 5,000
2007 2008 2009 2010 2011 20112
Concrete Brick & Block(Thousand of Metric Tons)
1st Quarter 2nd Quarter 3rd Quarter 4th Quarter
Survey of Portland Cement Consumption: 2nd Quarter 2012 | PCA Market Intelligence
19
Concrete Brick & Block Manufacturers: Analysis
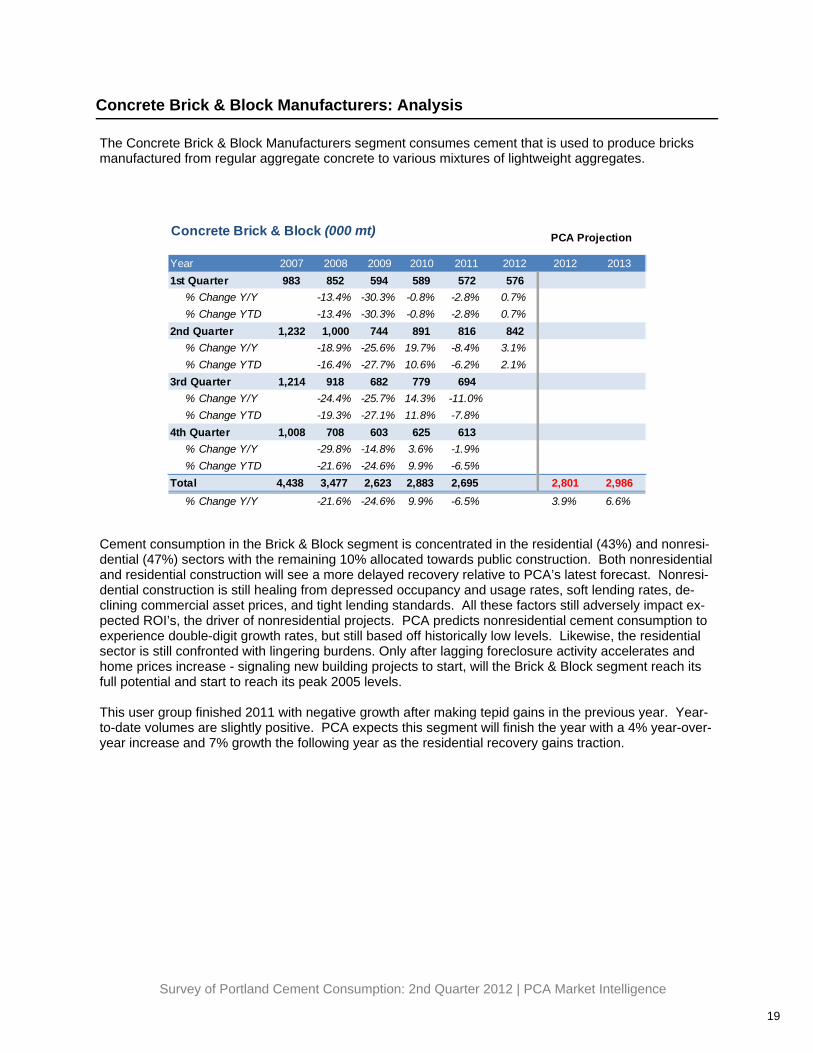
The Concrete Brick & Block Manufacturers segment consumes cement that is used to produce bricks manufactured from regular aggregate concrete to various mixtures of lightweight aggregates.
Cement consumption in the Brick & Block segment is concentrated in the residential (43%) and nonresi-dential (47%) sectors with the remaining 10% allocated towards public construction. Both nonresidential and residential construction will see a more delayed recovery relative to PCA’s latest forecast. Nonresi-dential construction is still healing from depressed occupancy and usage rates, soft lending rates, de-clining commercial asset prices, and tight lending standards. All these factors still adversely impact ex-pected ROI’s, the driver of nonresidential projects. PCA predicts nonresidential cement consumption to experience double-digit growth rates, but still based off historically low levels. Likewise, the residential sector is still confronted with lingering burdens. Only after lagging foreclosure activity accelerates and home prices increase - signaling new building projects to start, will the Brick & Block segment reach its full potential and start to reach its peak 2005 levels. This user group finished 2011 with negative growth after making tepid gains in the previous year. Year-to-date volumes are slightly positive. PCA expects this segment will finish the year with a 4% year-over-year increase and 7% growth the following year as the residential recovery gains traction.
Year 2007 2008 2009 2010 2011 2012 2012 20131st Quarter 983 852 594 589 572 576
% Change Y/Y -13.4% -30.3% -0.8% -2.8% 0.7%% Change YTD -13.4% -30.3% -0.8% -2.8% 0.7%
2nd Quarter 1,232 1,000 744 891 816 842% Change Y/Y -18.9% -25.6% 19.7% -8.4% 3.1%% Change YTD -16.4% -27.7% 10.6% -6.2% 2.1%
3rd Quarter 1,214 918 682 779 694% Change Y/Y -24.4% -25.7% 14.3% -11.0%% Change YTD -19.3% -27.1% 11.8% -7.8%
4th Quarter 1,008 708 603 625 613% Change Y/Y -29.8% -14.8% 3.6% -1.9%% Change YTD -21.6% -24.6% 9.9% -6.5%
Total 4,438 3,477 2,623 2,883 2,695 2,801 2,986% Change Y/Y -21.6% -24.6% 9.9% -6.5% 3.9% 6.6%
Concrete Brick & Block (000 mt) PCA Projection
Survey of Portland Cement Consumption: 2nd Quarter 2012 | PCA Market Intelligence
20
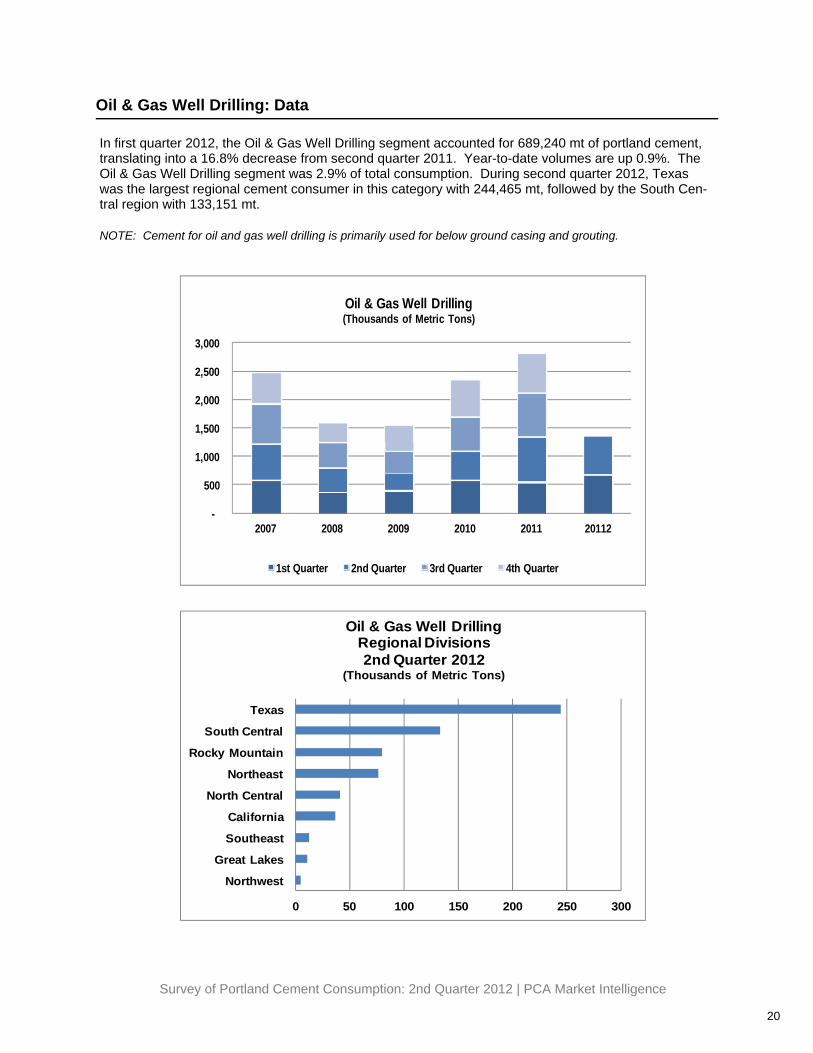
Oil & Gas Well Drilling: Data
In first quarter 2012, the Oil & Gas Well Drilling segment accounted for 689,240 mt of portland cement, translating into a 16.8% decrease from second quarter 2011. Year-to-date volumes are up 0.9%. The Oil & Gas Well Drilling segment was 2.9% of total consumption. During second quarter 2012, Texas was the largest regional cement consumer in this category with 244,465 mt, followed by the South Cen-tral region with 133,151 mt. NOTE: Cement for oil and gas well drilling is primarily used for below ground casing and grouting.
0 50 100 150 200 250 300
Northwest
Great Lakes
Southeast
California
North Central
Northeast
Rocky Mountain
South Central
Texas
Oil & Gas Well DrillingRegional Divisions2nd Quarter 2012
(Thousands of Metric Tons)
-
500
1,000
1,500
2,000
2,500
3,000
2007 2008 2009 2010 2011 20112
Oil & Gas Well Drilling(Thousands of Metric Tons)
1st Quarter 2nd Quarter 3rd Quarter 4th Quarter
Survey of Portland Cement Consumption: 2nd Quarter 2012 | PCA Market Intelligence
21
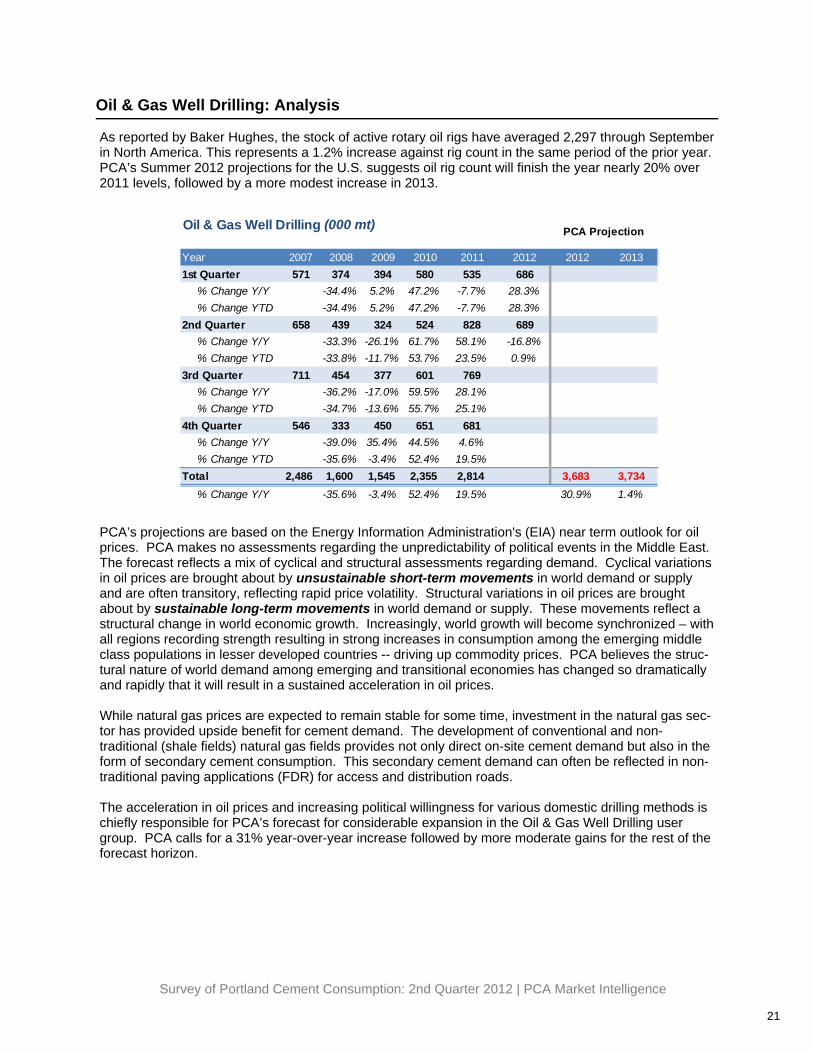
Oil & Gas Well Drilling: Analysis
PCA’s projections are based on the Energy Information Administration's (EIA) near term outlook for oil prices. PCA makes no assessments regarding the unpredictability of political events in the Middle East. The forecast reflects a mix of cyclical and structural assessments regarding demand. Cyclical variations in oil prices are brought about by unsustainable short-term movements in world demand or supply and are often transitory, reflecting rapid price volatility. Structural variations in oil prices are brought about by sustainable long-term movements in world demand or supply. These movements reflect a structural change in world economic growth. Increasingly, world growth will become synchronized – with all regions recording strength resulting in strong increases in consumption among the emerging middle class populations in lesser developed countries -- driving up commodity prices. PCA believes the struc-tural nature of world demand among emerging and transitional economies has changed so dramatically and rapidly that it will result in a sustained acceleration in oil prices. While natural gas prices are expected to remain stable for some time, investment in the natural gas sec-tor has provided upside benefit for cement demand. The development of conventional and non-traditional (shale fields) natural gas fields provides not only direct on-site cement demand but also in the form of secondary cement consumption. This secondary cement demand can often be reflected in non-traditional paving applications (FDR) for access and distribution roads. The acceleration in oil prices and increasing political willingness for various domestic drilling methods is chiefly responsible for PCA’s forecast for considerable expansion in the Oil & Gas Well Drilling user group. PCA calls for a 31% year-over-year increase followed by more moderate gains for the rest of the forecast horizon.
As reported by Baker Hughes, the stock of active rotary oil rigs have averaged 2,297 through September in North America. This represents a 1.2% increase against rig count in the same period of the prior year. PCA’s Summer 2012 projections for the U.S. suggests oil rig count will finish the year nearly 20% over 2011 levels, followed by a more modest increase in 2013.
Year 2007 2008 2009 2010 2011 2012 2012 20131st Quarter 571 374 394 580 535 686
% Change Y/Y -34.4% 5.2% 47.2% -7.7% 28.3%% Change YTD -34.4% 5.2% 47.2% -7.7% 28.3%
2nd Quarter 658 439 324 524 828 689% Change Y/Y -33.3% -26.1% 61.7% 58.1% -16.8%% Change YTD -33.8% -11.7% 53.7% 23.5% 0.9%
3rd Quarter 711 454 377 601 769% Change Y/Y -36.2% -17.0% 59.5% 28.1%% Change YTD -34.7% -13.6% 55.7% 25.1%
4th Quarter 546 333 450 651 681% Change Y/Y -39.0% 35.4% 44.5% 4.6%% Change YTD -35.6% -3.4% 52.4% 19.5%
Total 2,486 1,600 1,545 2,355 2,814 3,683 3,734% Change Y/Y -35.6% -3.4% 52.4% 19.5% 30.9% 1.4%
Oil & Gas Well Drilling (000 mt) PCA Projection
Survey of Portland Cement Consumption: 2nd Quarter 2012 | PCA Market Intelligence
22
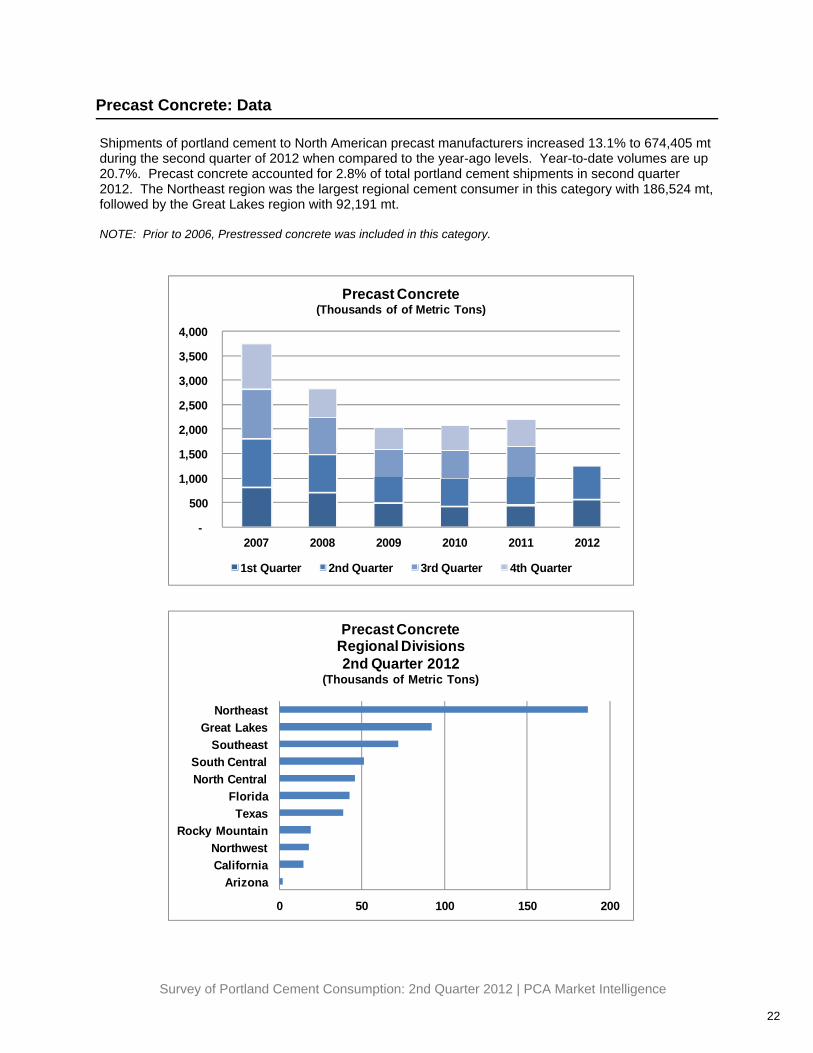
Precast Concrete: Data
Shipments of portland cement to North American precast manufacturers increased 13.1% to 674,405 mt during the second quarter of 2012 when compared to the year-ago levels. Year-to-date volumes are up 20.7%. Precast concrete accounted for 2.8% of total portland cement shipments in second quarter 2012. The Northeast region was the largest regional cement consumer in this category with 186,524 mt, followed by the Great Lakes region with 92,191 mt. NOTE: Prior to 2006, Prestressed concrete was included in this category.
0 50 100 150 200
ArizonaCaliforniaNorthwest
Rocky MountainTexas
FloridaNorth CentralSouth Central
SoutheastGreat Lakes
Northeast
Precast ConcreteRegional Divisions2nd Quarter 2012
(Thousands of Metric Tons)
-
500
1,000
1,500
2,000
2,500
3,000
3,500
4,000
2007 2008 2009 2010 2011 2012
Precast Concrete(Thousands of of Metric Tons)
1st Quarter 2nd Quarter 3rd Quarter 4th Quarter
Survey of Portland Cement Consumption: 2nd Quarter 2012 | PCA Market Intelligence
23
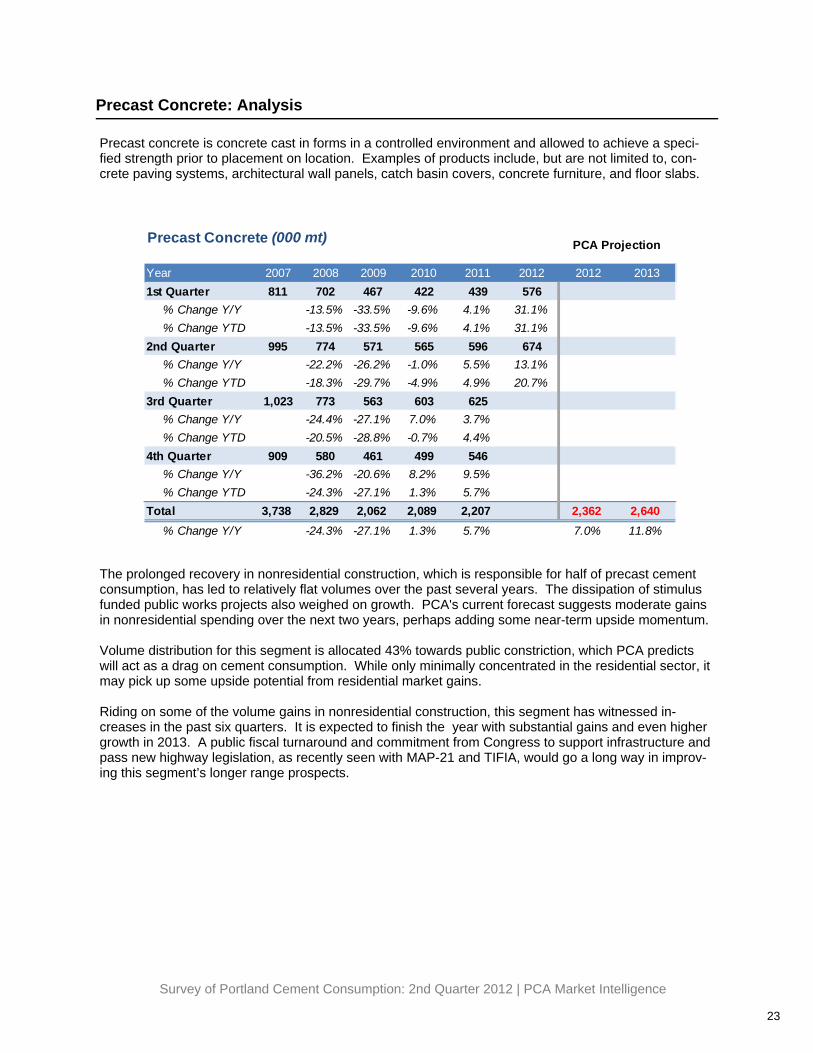
Precast Concrete: Analysis
Precast concrete is concrete cast in forms in a controlled environment and allowed to achieve a speci-fied strength prior to placement on location. Examples of products include, but are not limited to, con-crete paving systems, architectural wall panels, catch basin covers, concrete furniture, and floor slabs.
The prolonged recovery in nonresidential construction, which is responsible for half of precast cement consumption, has led to relatively flat volumes over the past several years. The dissipation of stimulus funded public works projects also weighed on growth. PCA's current forecast suggests moderate gains in nonresidential spending over the next two years, perhaps adding some near-term upside momentum. Volume distribution for this segment is allocated 43% towards public constriction, which PCA predicts will act as a drag on cement consumption. While only minimally concentrated in the residential sector, it may pick up some upside potential from residential market gains. Riding on some of the volume gains in nonresidential construction, this segment has witnessed in-creases in the past six quarters. It is expected to finish the year with substantial gains and even higher growth in 2013. A public fiscal turnaround and commitment from Congress to support infrastructure and pass new highway legislation, as recently seen with MAP-21 and TIFIA, would go a long way in improv-ing this segment’s longer range prospects.
Year 2007 2008 2009 2010 2011 2012 2012 20131st Quarter 811 702 467 422 439 576
% Change Y/Y -13.5% -33.5% -9.6% 4.1% 31.1%% Change YTD -13.5% -33.5% -9.6% 4.1% 31.1%
2nd Quarter 995 774 571 565 596 674% Change Y/Y -22.2% -26.2% -1.0% 5.5% 13.1%% Change YTD -18.3% -29.7% -4.9% 4.9% 20.7%
3rd Quarter 1,023 773 563 603 625% Change Y/Y -24.4% -27.1% 7.0% 3.7%% Change YTD -20.5% -28.8% -0.7% 4.4%
4th Quarter 909 580 461 499 546% Change Y/Y -36.2% -20.6% 8.2% 9.5%% Change YTD -24.3% -27.1% 1.3% 5.7%
Total 3,738 2,829 2,062 2,089 2,207 2,362 2,640% Change Y/Y -24.3% -27.1% 1.3% 5.7% 7.0% 11.8%
Precast Concrete (000 mt) PCA Projection
Survey of Portland Cement Consumption: 2nd Quarter 2012 | PCA Market Intelligence
24
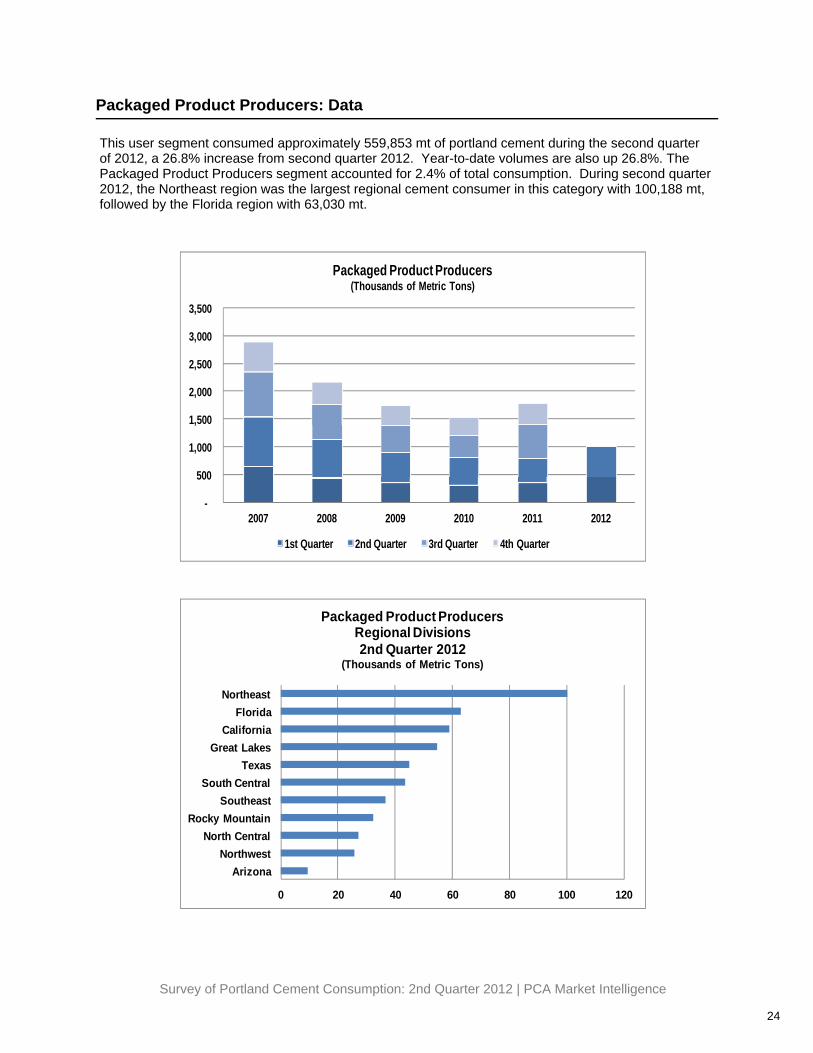
Packaged Product Producers: Data
This user segment consumed approximately 559,853 mt of portland cement during the second quarter of 2012, a 26.8% increase from second quarter 2012. Year-to-date volumes are also up 26.8%. The Packaged Product Producers segment accounted for 2.4% of total consumption. During second quarter 2012, the Northeast region was the largest regional cement consumer in this category with 100,188 mt, followed by the Florida region with 63,030 mt.
0 20 40 60 80 100 120
ArizonaNorthwest
North CentralRocky Mountain
SoutheastSouth Central
TexasGreat Lakes
CaliforniaFlorida
Northeast
Packaged Product ProducersRegional Divisions2nd Quarter 2012
(Thousands of Metric Tons)
-
500
1,000
1,500
2,000
2,500
3,000
3,500
2007 2008 2009 2010 2011 2012
Packaged Product Producers(Thousands of Metric Tons)
1st Quarter 2nd Quarter 3rd Quarter 4th Quarter
Survey of Portland Cement Consumption: 2nd Quarter 2012 | PCA Market Intelligence
25
Packaged Product Producers: Analysis
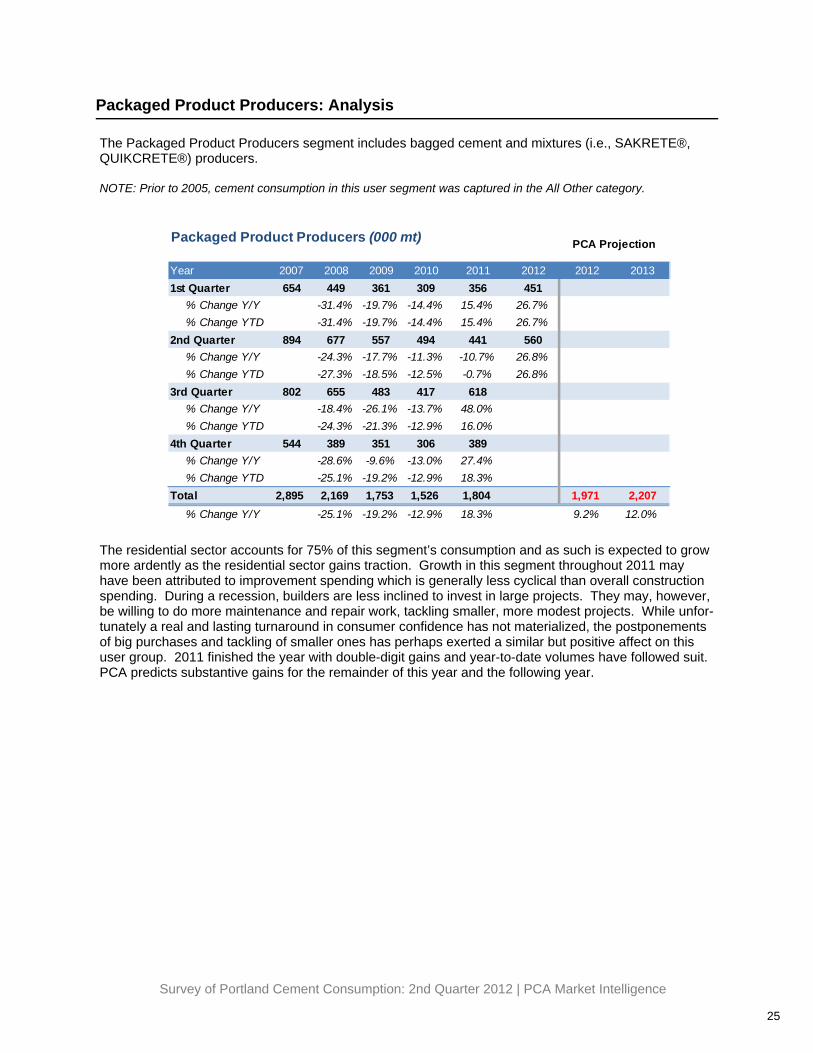
The Packaged Product Producers segment includes bagged cement and mixtures (i.e., SAKRETE®, QUIKCRETE®) producers. NOTE: Prior to 2005, cement consumption in this user segment was captured in the All Other category.
The residential sector accounts for 75% of this segment’s consumption and as such is expected to grow more ardently as the residential sector gains traction. Growth in this segment throughout 2011 may have been attributed to improvement spending which is generally less cyclical than overall construction spending. During a recession, builders are less inclined to invest in large projects. They may, however, be willing to do more maintenance and repair work, tackling smaller, more modest projects. While unfor-tunately a real and lasting turnaround in consumer confidence has not materialized, the postponements of big purchases and tackling of smaller ones has perhaps exerted a similar but positive affect on this user group. 2011 finished the year with double-digit gains and year-to-date volumes have followed suit. PCA predicts substantive gains for the remainder of this year and the following year.
Year 2007 2008 2009 2010 2011 2012 2012 20131st Quarter 654 449 361 309 356 451
% Change Y/Y -31.4% -19.7% -14.4% 15.4% 26.7%% Change YTD -31.4% -19.7% -14.4% 15.4% 26.7%
2nd Quarter 894 677 557 494 441 560% Change Y/Y -24.3% -17.7% -11.3% -10.7% 26.8%% Change YTD -27.3% -18.5% -12.5% -0.7% 26.8%
3rd Quarter 802 655 483 417 618% Change Y/Y -18.4% -26.1% -13.7% 48.0%% Change YTD -24.3% -21.3% -12.9% 16.0%
4th Quarter 544 389 351 306 389% Change Y/Y -28.6% -9.6% -13.0% 27.4%% Change YTD -25.1% -19.2% -12.9% 18.3%
Total 2,895 2,169 1,753 1,526 1,804 1,971 2,207% Change Y/Y -25.1% -19.2% -12.9% 18.3% 9.2% 12.0%
Packaged Product Producers (000 mt) PCA Projection
Survey of Portland Cement Consumption: 2nd Quarter 2012 | PCA Market Intelligence
26
Soil-Cement/ Roller Compacted Concrete/ Full-Depth Reclamation for Paving: Data
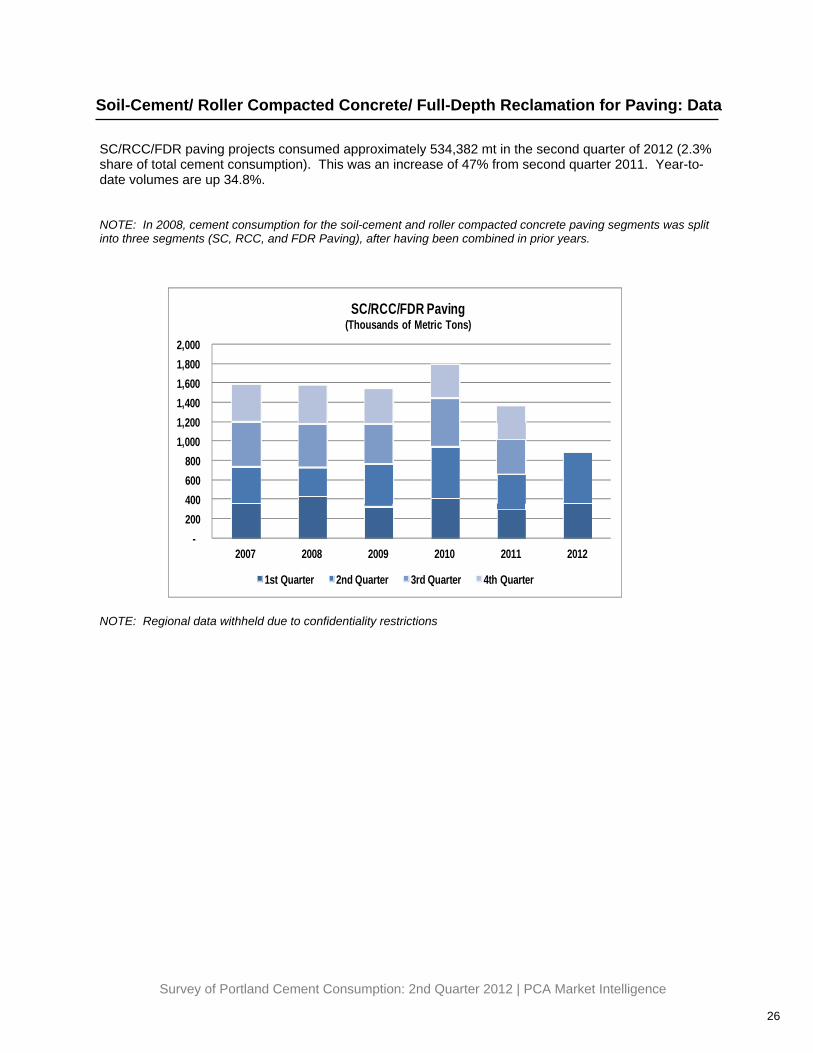
SC/RCC/FDR paving projects consumed approximately 534,382 mt in the second quarter of 2012 (2.3% share of total cement consumption). This was an increase of 47% from second quarter 2011. Year-to-date volumes are up 34.8%. NOTE: In 2008, cement consumption for the soil-cement and roller compacted concrete paving segments was split into three segments (SC, RCC, and FDR Paving), after having been combined in prior years.
NOTE: Regional data withheld due to confidentiality restrictions
-200 400 600 800
1,000 1,200 1,400 1,600 1,800 2,000
2007 2008 2009 2010 2011 2012
SC/RCC/FDR Paving(Thousands of Metric Tons)
1st Quarter 2nd Quarter 3rd Quarter 4th Quarter
Survey of Portland Cement Consumption: 2nd Quarter 2012 | PCA Market Intelligence
27
Soil-Cement/ Roller Compacted Concrete/ Full-Depth Reclamation for Paving: Analysis
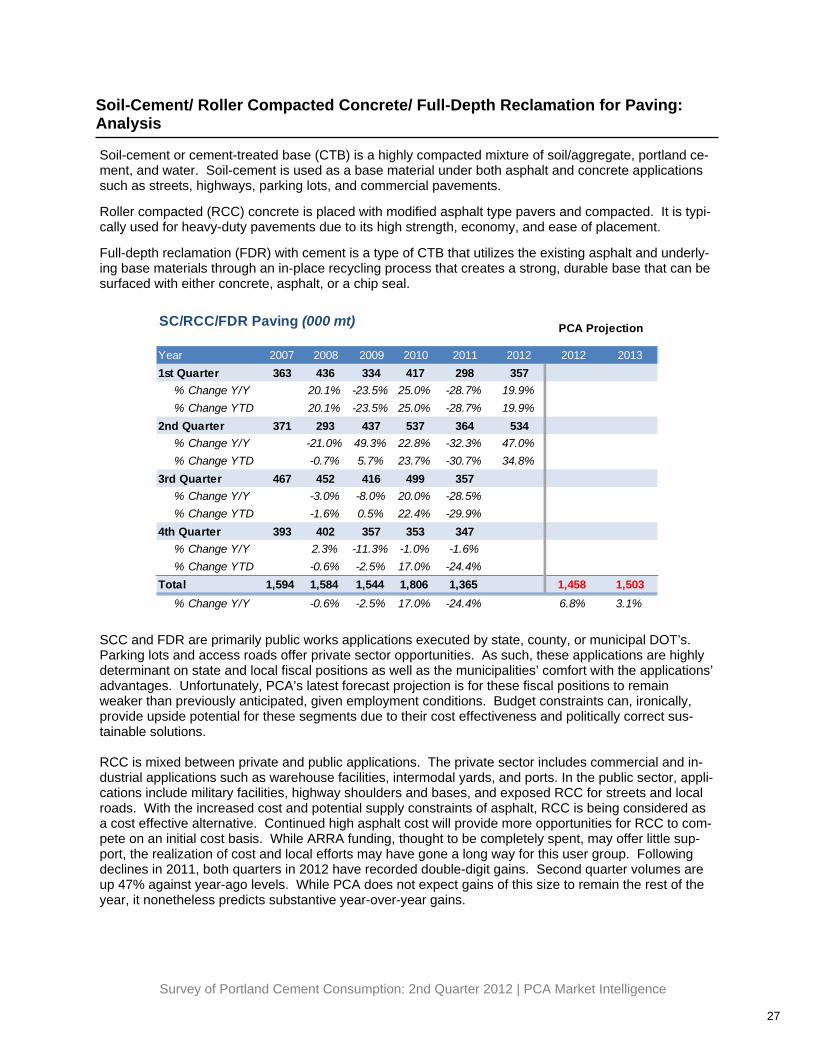
Soil-cement or cement-treated base (CTB) is a highly compacted mixture of soil/aggregate, portland ce-ment, and water. Soil-cement is used as a base material under both asphalt and concrete applications such as streets, highways, parking lots, and commercial pavements. Roller compacted (RCC) concrete is placed with modified asphalt type pavers and compacted. It is typi-cally used for heavy-duty pavements due to its high strength, economy, and ease of placement. Full-depth reclamation (FDR) with cement is a type of CTB that utilizes the existing asphalt and underly-ing base materials through an in-place recycling process that creates a strong, durable base that can be surfaced with either concrete, asphalt, or a chip seal.
SCC and FDR are primarily public works applications executed by state, county, or municipal DOT’s. Parking lots and access roads offer private sector opportunities. As such, these applications are highly determinant on state and local fiscal positions as well as the municipalities’ comfort with the applications’ advantages. Unfortunately, PCA’s latest forecast projection is for these fiscal positions to remain weaker than previously anticipated, given employment conditions. Budget constraints can, ironically, provide upside potential for these segments due to their cost effectiveness and politically correct sus-tainable solutions. RCC is mixed between private and public applications. The private sector includes commercial and in-dustrial applications such as warehouse facilities, intermodal yards, and ports. In the public sector, appli-cations include military facilities, highway shoulders and bases, and exposed RCC for streets and local roads. With the increased cost and potential supply constraints of asphalt, RCC is being considered as a cost effective alternative. Continued high asphalt cost will provide more opportunities for RCC to com-pete on an initial cost basis. While ARRA funding, thought to be completely spent, may offer little sup-port, the realization of cost and local efforts may have gone a long way for this user group. Following declines in 2011, both quarters in 2012 have recorded double-digit gains. Second quarter volumes are up 47% against year-ago levels. While PCA does not expect gains of this size to remain the rest of the year, it nonetheless predicts substantive year-over-year gains.
Year 2007 2008 2009 2010 2011 2012 2012 20131st Quarter 363 436 334 417 298 357
% Change Y/Y 20.1% -23.5% 25.0% -28.7% 19.9%% Change YTD 20.1% -23.5% 25.0% -28.7% 19.9%
2nd Quarter 371 293 437 537 364 534% Change Y/Y -21.0% 49.3% 22.8% -32.3% 47.0%% Change YTD -0.7% 5.7% 23.7% -30.7% 34.8%
3rd Quarter 467 452 416 499 357% Change Y/Y -3.0% -8.0% 20.0% -28.5%% Change YTD -1.6% 0.5% 22.4% -29.9%
4th Quarter 393 402 357 353 347% Change Y/Y 2.3% -11.3% -1.0% -1.6%% Change YTD -0.6% -2.5% 17.0% -24.4%
Total 1,594 1,584 1,544 1,806 1,365 1,458 1,503% Change Y/Y -0.6% -2.5% 17.0% -24.4% 6.8% 3.1%
SC/RCC/FDR Paving (000 mt) PCA Projection
Survey of Portland Cement Consumption: 2nd Quarter 2012 | PCA Market Intelligence
28
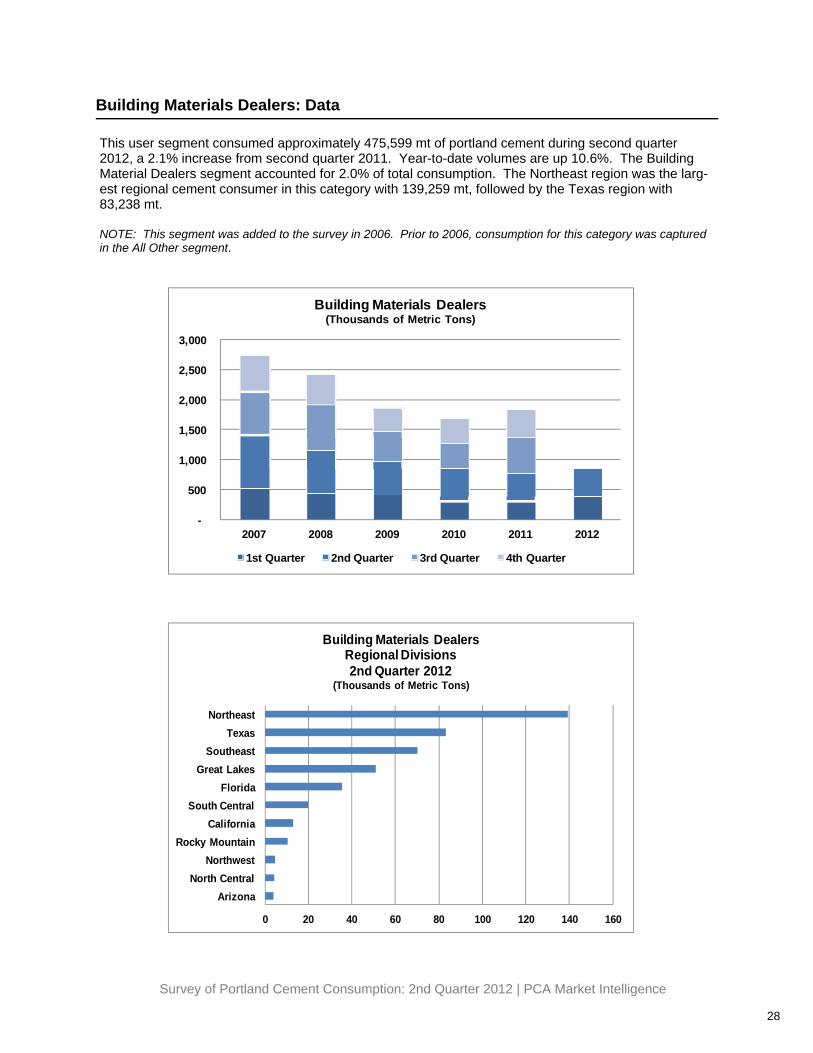
Building Materials Dealers: Data
This user segment consumed approximately 475,599 mt of portland cement during second quarter 2012, a 2.1% increase from second quarter 2011. Year-to-date volumes are up 10.6%. The Building Material Dealers segment accounted for 2.0% of total consumption. The Northeast region was the larg-est regional cement consumer in this category with 139,259 mt, followed by the Texas region with 83,238 mt. NOTE: This segment was added to the survey in 2006. Prior to 2006, consumption for this category was captured in the All Other segment.
0 20 40 60 80 100 120 140 160
ArizonaNorth Central
NorthwestRocky Mountain
CaliforniaSouth Central
FloridaGreat Lakes
SoutheastTexas
Northeast
Building Materials DealersRegional Divisions2nd Quarter 2012
(Thousands of Metric Tons)
-
500
1,000
1,500
2,000
2,500
3,000
2007 2008 2009 2010 2011 2012
Building Materials Dealers(Thousands of Metric Tons)
1st Quarter 2nd Quarter 3rd Quarter 4th Quarter
Survey of Portland Cement Consumption: 2nd Quarter 2012 | PCA Market Intelligence
29
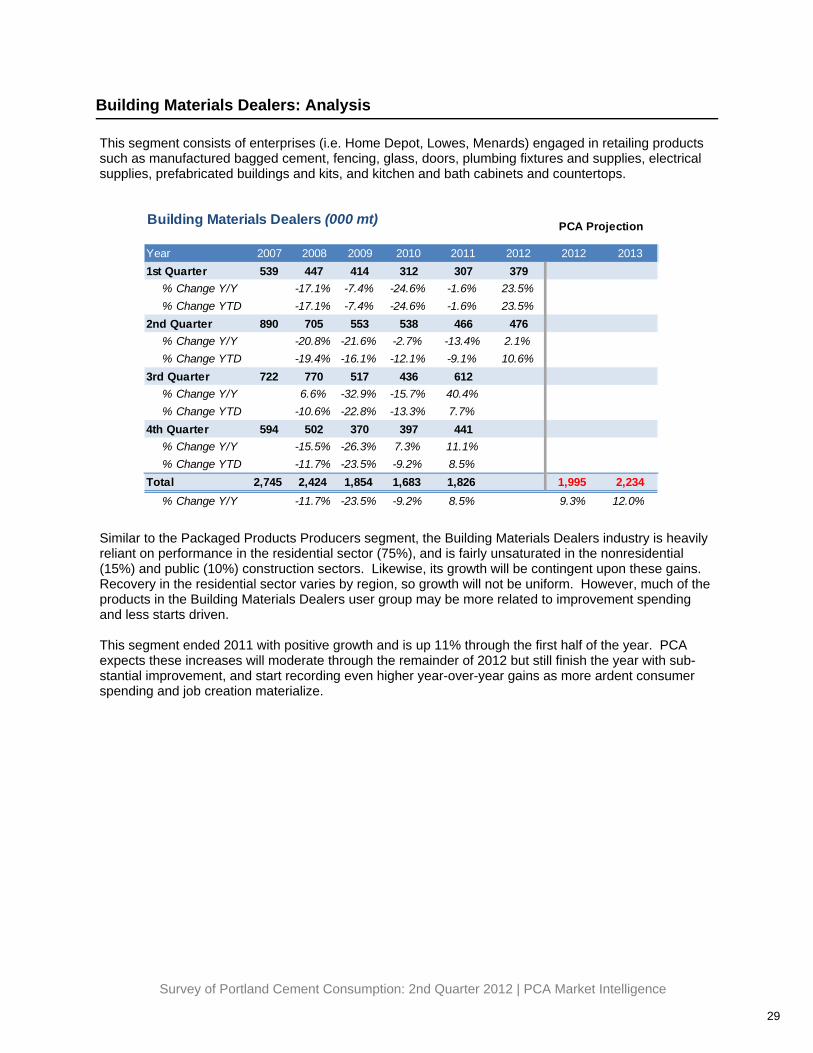
Building Materials Dealers: Analysis
This segment consists of enterprises (i.e. Home Depot, Lowes, Menards) engaged in retailing products such as manufactured bagged cement, fencing, glass, doors, plumbing fixtures and supplies, electrical supplies, prefabricated buildings and kits, and kitchen and bath cabinets and countertops.
Similar to the Packaged Products Producers segment, the Building Materials Dealers industry is heavily reliant on performance in the residential sector (75%), and is fairly unsaturated in the nonresidential (15%) and public (10%) construction sectors. Likewise, its growth will be contingent upon these gains. Recovery in the residential sector varies by region, so growth will not be uniform. However, much of the products in the Building Materials Dealers user group may be more related to improvement spending and less starts driven. This segment ended 2011 with positive growth and is up 11% through the first half of the year. PCA expects these increases will moderate through the remainder of 2012 but still finish the year with sub-stantial improvement, and start recording even higher year-over-year gains as more ardent consumer spending and job creation materialize.
Year 2007 2008 2009 2010 2011 2012 2012 20131st Quarter 539 447 414 312 307 379
% Change Y/Y -17.1% -7.4% -24.6% -1.6% 23.5%% Change YTD -17.1% -7.4% -24.6% -1.6% 23.5%
2nd Quarter 890 705 553 538 466 476% Change Y/Y -20.8% -21.6% -2.7% -13.4% 2.1%% Change YTD -19.4% -16.1% -12.1% -9.1% 10.6%
3rd Quarter 722 770 517 436 612% Change Y/Y 6.6% -32.9% -15.7% 40.4%% Change YTD -10.6% -22.8% -13.3% 7.7%
4th Quarter 594 502 370 397 441% Change Y/Y -15.5% -26.3% 7.3% 11.1%% Change YTD -11.7% -23.5% -9.2% 8.5%
Total 2,745 2,424 1,854 1,683 1,826 1,995 2,234% Change Y/Y -11.7% -23.5% -9.2% 8.5% 9.3% 12.0%
Building Materials Dealers (000 mt) PCA Projection
Survey of Portland Cement Consumption: 2nd Quarter 2012 | PCA Market Intelligence
30
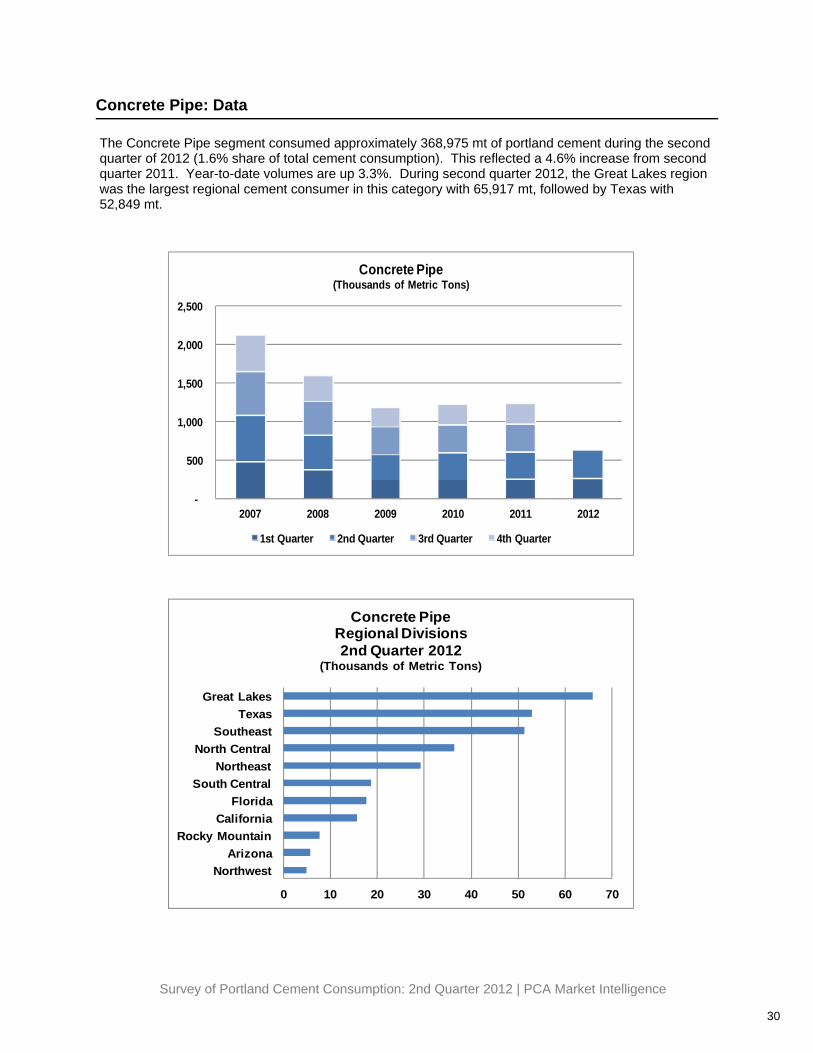
Concrete Pipe: Data
The Concrete Pipe segment consumed approximately 368,975 mt of portland cement during the second quarter of 2012 (1.6% share of total cement consumption). This reflected a 4.6% increase from second quarter 2011. Year-to-date volumes are up 3.3%. During second quarter 2012, the Great Lakes region was the largest regional cement consumer in this category with 65,917 mt, followed by Texas with 52,849 mt.
0 10 20 30 40 50 60 70
NorthwestArizona
Rocky MountainCalifornia
FloridaSouth Central
NortheastNorth Central
SoutheastTexas
Great Lakes
Concrete PipeRegional Divisions2nd Quarter 2012
(Thousands of Metric Tons)
-
500
1,000
1,500
2,000
2,500
2007 2008 2009 2010 2011 2012
Concrete Pipe(Thousands of Metric Tons)
1st Quarter 2nd Quarter 3rd Quarter 4th Quarter
Survey of Portland Cement Consumption: 2nd Quarter 2012 | PCA Market Intelligence
31
Concrete Pipe: Analysis
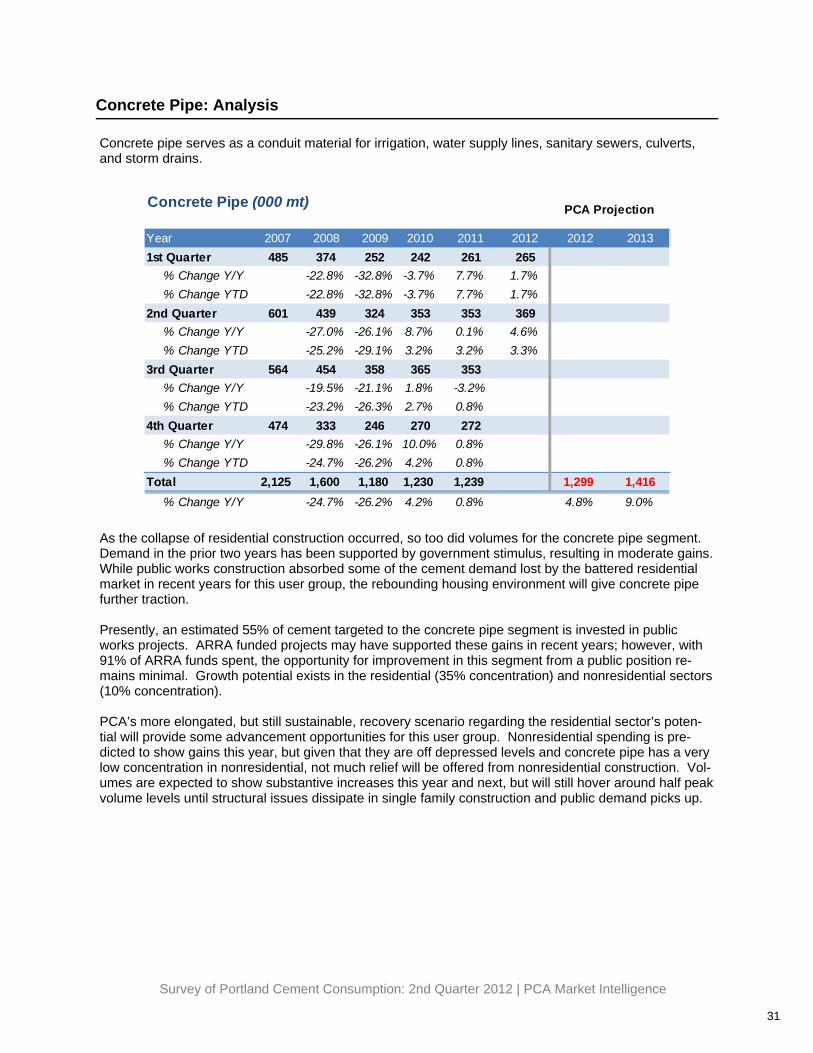
Concrete pipe serves as a conduit material for irrigation, water supply lines, sanitary sewers, culverts, and storm drains.
As the collapse of residential construction occurred, so too did volumes for the concrete pipe segment. Demand in the prior two years has been supported by government stimulus, resulting in moderate gains. While public works construction absorbed some of the cement demand lost by the battered residential market in recent years for this user group, the rebounding housing environment will give concrete pipe further traction. Presently, an estimated 55% of cement targeted to the concrete pipe segment is invested in public works projects. ARRA funded projects may have supported these gains in recent years; however, with 91% of ARRA funds spent, the opportunity for improvement in this segment from a public position re-mains minimal. Growth potential exists in the residential (35% concentration) and nonresidential sectors (10% concentration). PCA’s more elongated, but still sustainable, recovery scenario regarding the residential sector’s poten-tial will provide some advancement opportunities for this user group. Nonresidential spending is pre-dicted to show gains this year, but given that they are off depressed levels and concrete pipe has a very low concentration in nonresidential, not much relief will be offered from nonresidential construction. Vol-umes are expected to show substantive increases this year and next, but will still hover around half peak volume levels until structural issues dissipate in single family construction and public demand picks up.
Year 2007 2008 2009 2010 2011 2012 2012 20131st Quarter 485 374 252 242 261 265
% Change Y/Y -22.8% -32.8% -3.7% 7.7% 1.7%% Change YTD -22.8% -32.8% -3.7% 7.7% 1.7%
2nd Quarter 601 439 324 353 353 369% Change Y/Y -27.0% -26.1% 8.7% 0.1% 4.6%% Change YTD -25.2% -29.1% 3.2% 3.2% 3.3%
3rd Quarter 564 454 358 365 353% Change Y/Y -19.5% -21.1% 1.8% -3.2%% Change YTD -23.2% -26.3% 2.7% 0.8%
4th Quarter 474 333 246 270 272% Change Y/Y -29.8% -26.1% 10.0% 0.8%% Change YTD -24.7% -26.2% 4.2% 0.8%
Total 2,125 1,600 1,180 1,230 1,239 1,299 1,416% Change Y/Y -24.7% -26.2% 4.2% 0.8% 4.8% 9.0%
Concrete Pipe (000 mt) PCA Projection
Survey of Portland Cement Consumption: 2nd Quarter 2012 | PCA Market Intelligence
32
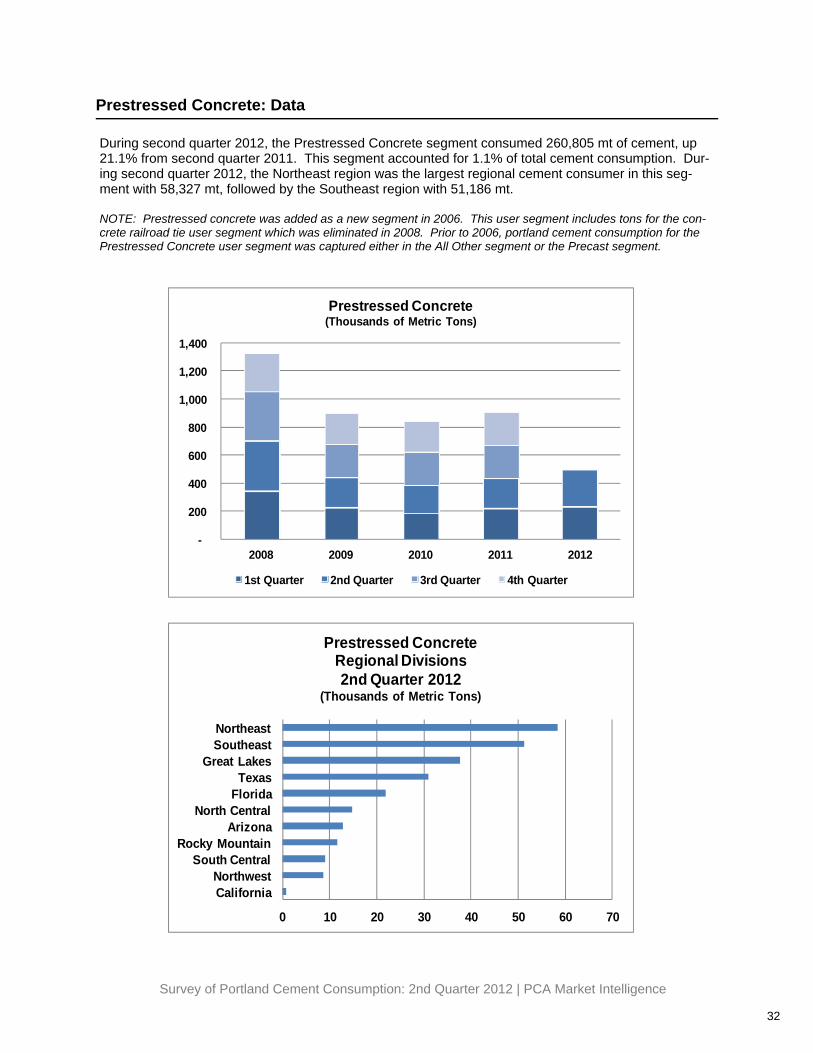
Prestressed Concrete: Data
During second quarter 2012, the Prestressed Concrete segment consumed 260,805 mt of cement, up 21.1% from second quarter 2011. This segment accounted for 1.1% of total cement consumption. Dur-ing second quarter 2012, the Northeast region was the largest regional cement consumer in this seg-ment with 58,327 mt, followed by the Southeast region with 51,186 mt. NOTE: Prestressed concrete was added as a new segment in 2006. This user segment includes tons for the con-crete railroad tie user segment which was eliminated in 2008. Prior to 2006, portland cement consumption for the Prestressed Concrete user segment was captured either in the All Other segment or the Precast segment.
0 10 20 30 40 50 60 70
CaliforniaNorthwest
South CentralRocky Mountain
ArizonaNorth Central
FloridaTexas
Great LakesSoutheastNortheast
Prestressed ConcreteRegional Divisions2nd Quarter 2012
(Thousands of Metric Tons)
-
200
400
600
800
1,000
1,200
1,400
2008 2009 2010 2011 2012
Prestressed Concrete(Thousands of Metric Tons)
1st Quarter 2nd Quarter 3rd Quarter 4th Quarter
Survey of Portland Cement Consumption: 2nd Quarter 2012 | PCA Market Intelligence
33
Prestressed Concrete: Analysis
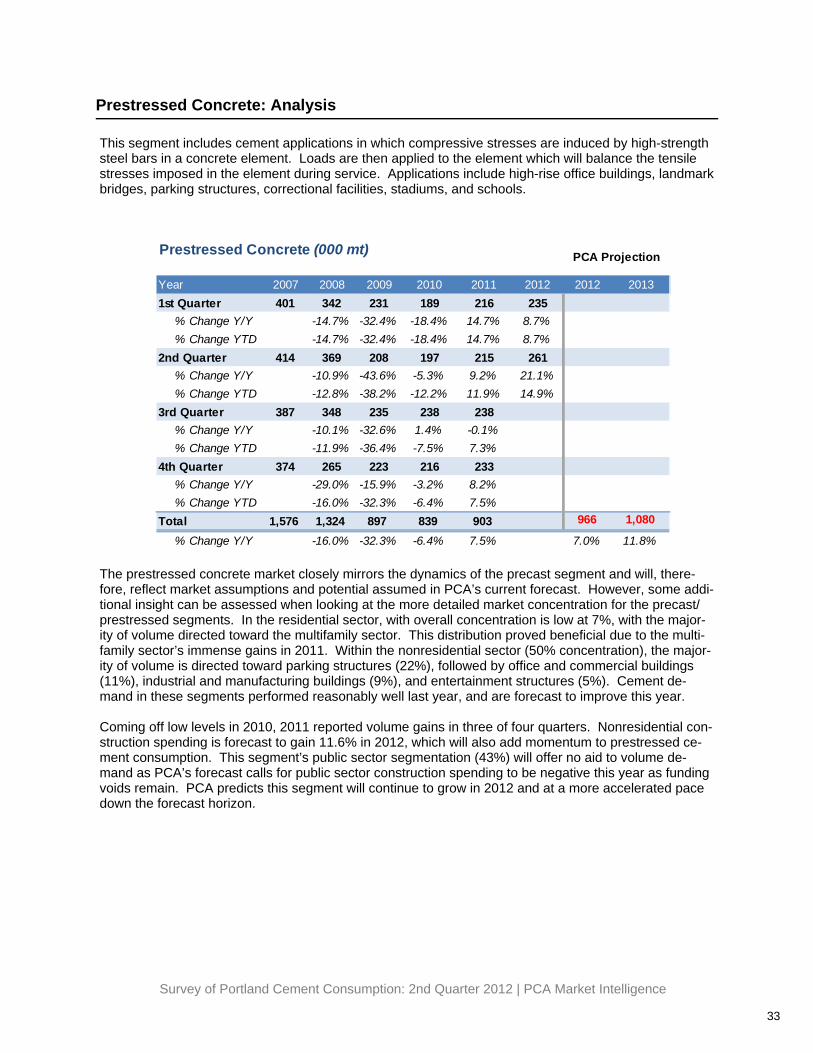
This segment includes cement applications in which compressive stresses are induced by high-strength steel bars in a concrete element. Loads are then applied to the element which will balance the tensile stresses imposed in the element during service. Applications include high-rise office buildings, landmark bridges, parking structures, correctional facilities, stadiums, and schools.
The prestressed concrete market closely mirrors the dynamics of the precast segment and will, there-fore, reflect market assumptions and potential assumed in PCA’s current forecast. However, some addi-tional insight can be assessed when looking at the more detailed market concentration for the precast/prestressed segments. In the residential sector, with overall concentration is low at 7%, with the major-ity of volume directed toward the multifamily sector. This distribution proved beneficial due to the multi-family sector’s immense gains in 2011. Within the nonresidential sector (50% concentration), the major-ity of volume is directed toward parking structures (22%), followed by office and commercial buildings (11%), industrial and manufacturing buildings (9%), and entertainment structures (5%). Cement de-mand in these segments performed reasonably well last year, and are forecast to improve this year. Coming off low levels in 2010, 2011 reported volume gains in three of four quarters. Nonresidential con-struction spending is forecast to gain 11.6% in 2012, which will also add momentum to prestressed ce-ment consumption. This segment’s public sector segmentation (43%) will offer no aid to volume de-mand as PCA’s forecast calls for public sector construction spending to be negative this year as funding voids remain. PCA predicts this segment will continue to grow in 2012 and at a more accelerated pace down the forecast horizon.
Year 2007 2008 2009 2010 2011 2012 2012 20131st Quarter 401 342 231 189 216 235
% Change Y/Y -14.7% -32.4% -18.4% 14.7% 8.7%% Change YTD -14.7% -32.4% -18.4% 14.7% 8.7%
2nd Quarter 414 369 208 197 215 261% Change Y/Y -10.9% -43.6% -5.3% 9.2% 21.1%% Change YTD -12.8% -38.2% -12.2% 11.9% 14.9%
3rd Quarter 387 348 235 238 238% Change Y/Y -10.1% -32.6% 1.4% -0.1%% Change YTD -11.9% -36.4% -7.5% 7.3%
4th Quarter 374 265 223 216 233% Change Y/Y -29.0% -15.9% -3.2% 8.2%% Change YTD -16.0% -32.3% -6.4% 7.5%
Total 1,576 1,324 897 839 903 966 1,080
% Change Y/Y -16.0% -32.3% -6.4% 7.5% 7.0% 11.8%
Prestressed Concrete (000 mt) PCA Projection
Survey of Portland Cement Consumption: 2nd Quarter 2012 | PCA Market Intelligence
34
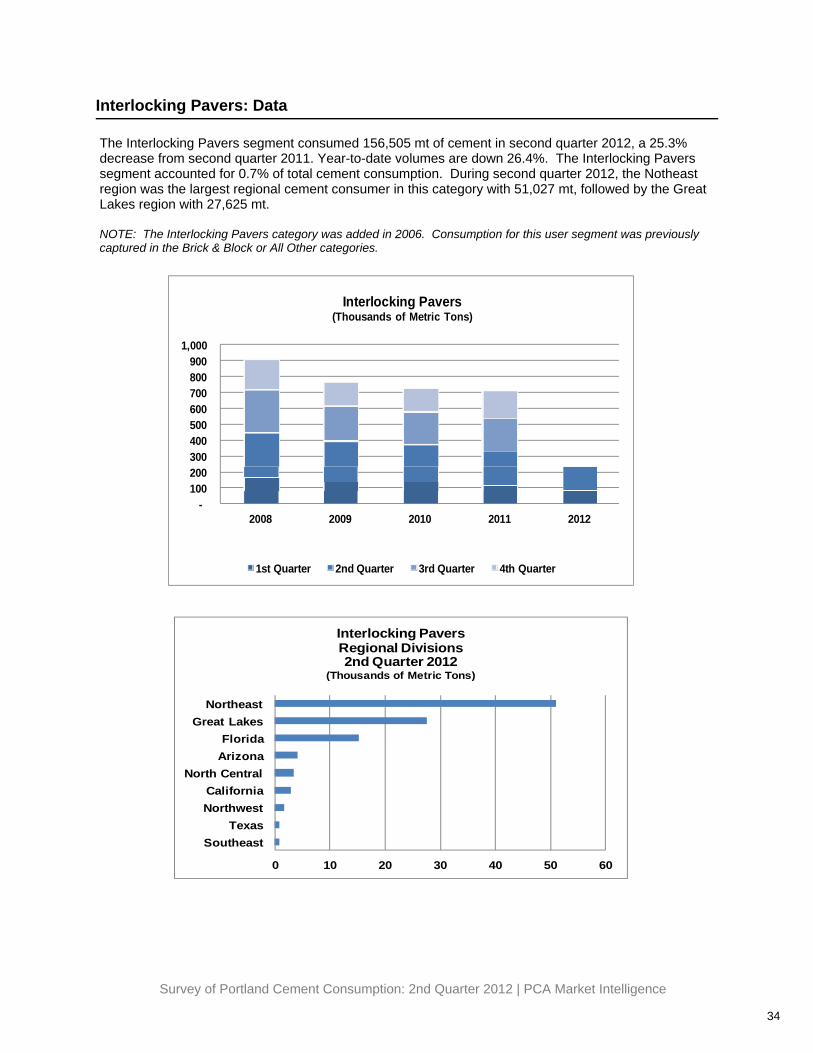
Interlocking Pavers: Data
The Interlocking Pavers segment consumed 156,505 mt of cement in second quarter 2012, a 25.3% decrease from second quarter 2011. Year-to-date volumes are down 26.4%. The Interlocking Pavers segment accounted for 0.7% of total cement consumption. During second quarter 2012, the Notheast region was the largest regional cement consumer in this category with 51,027 mt, followed by the Great Lakes region with 27,625 mt. NOTE: The Interlocking Pavers category was added in 2006. Consumption for this user segment was previously captured in the Brick & Block or All Other categories.
0 10 20 30 40 50 60
SoutheastTexas
NorthwestCalifornia
North CentralArizonaFlorida
Great LakesNortheast
Interlocking PaversRegional Divisions2nd Quarter 2012
(Thousands of Metric Tons)
-100 200 300 400 500 600 700 800 900
1,000
2008 2009 2010 2011 2012
Interlocking Pavers(Thousands of Metric Tons)
1st Quarter 2nd Quarter 3rd Quarter 4th Quarter
Survey of Portland Cement Consumption: 2nd Quarter 2012 | PCA Market Intelligence
35
Interlocking Pavers: Analysis
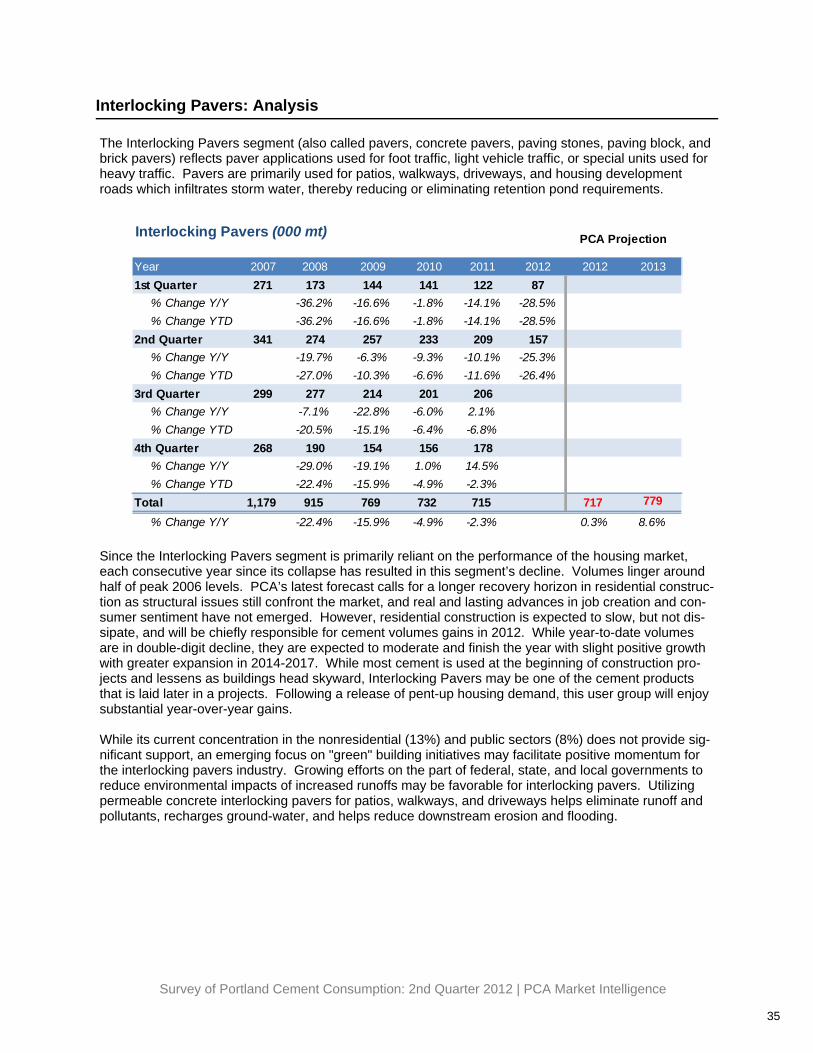
The Interlocking Pavers segment (also called pavers, concrete pavers, paving stones, paving block, and brick pavers) reflects paver applications used for foot traffic, light vehicle traffic, or special units used for heavy traffic. Pavers are primarily used for patios, walkways, driveways, and housing development roads which infiltrates storm water, thereby reducing or eliminating retention pond requirements.
Since the Interlocking Pavers segment is primarily reliant on the performance of the housing market, each consecutive year since its collapse has resulted in this segment’s decline. Volumes linger around half of peak 2006 levels. PCA’s latest forecast calls for a longer recovery horizon in residential construc-tion as structural issues still confront the market, and real and lasting advances in job creation and con-sumer sentiment have not emerged. However, residential construction is expected to slow, but not dis-sipate, and will be chiefly responsible for cement volumes gains in 2012. While year-to-date volumes are in double-digit decline, they are expected to moderate and finish the year with slight positive growth with greater expansion in 2014-2017. While most cement is used at the beginning of construction pro-jects and lessens as buildings head skyward, Interlocking Pavers may be one of the cement products that is laid later in a projects. Following a release of pent-up housing demand, this user group will enjoy substantial year-over-year gains. While its current concentration in the nonresidential (13%) and public sectors (8%) does not provide sig-nificant support, an emerging focus on "green" building initiatives may facilitate positive momentum for the interlocking pavers industry. Growing efforts on the part of federal, state, and local governments to reduce environmental impacts of increased runoffs may be favorable for interlocking pavers. Utilizing permeable concrete interlocking pavers for patios, walkways, and driveways helps eliminate runoff and pollutants, recharges ground-water, and helps reduce downstream erosion and flooding.
Year 2007 2008 2009 2010 2011 2012 2012 20131st Quarter 271 173 144 141 122 87
% Change Y/Y -36.2% -16.6% -1.8% -14.1% -28.5%% Change YTD -36.2% -16.6% -1.8% -14.1% -28.5%
2nd Quarter 341 274 257 233 209 157% Change Y/Y -19.7% -6.3% -9.3% -10.1% -25.3%% Change YTD -27.0% -10.3% -6.6% -11.6% -26.4%
3rd Quarter 299 277 214 201 206% Change Y/Y -7.1% -22.8% -6.0% 2.1%% Change YTD -20.5% -15.1% -6.4% -6.8%
4th Quarter 268 190 154 156 178% Change Y/Y -29.0% -19.1% 1.0% 14.5%% Change YTD -22.4% -15.9% -4.9% -2.3%
Total 1,179 915 769 732 715 717 779
% Change Y/Y -22.4% -15.9% -4.9% -2.3% 0.3% 8.6%
Interlocking Pavers (000 mt) PCA Projection
Survey of Portland Cement Consumption: 2nd Quarter 2012 | PCA Market Intelligence
36
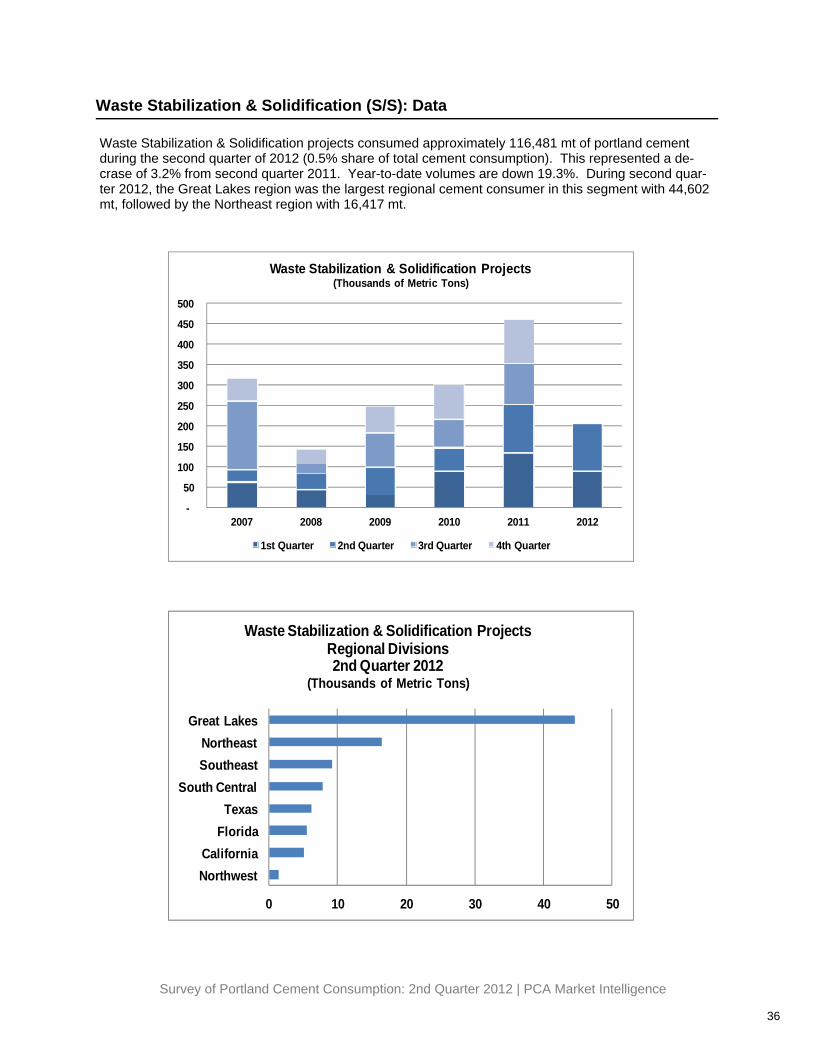
Waste Stabilization & Solidification (S/S): Data
Waste Stabilization & Solidification projects consumed approximately 116,481 mt of portland cement during the second quarter of 2012 (0.5% share of total cement consumption). This represented a de-crase of 3.2% from second quarter 2011. Year-to-date volumes are down 19.3%. During second quar-ter 2012, the Great Lakes region was the largest regional cement consumer in this segment with 44,602 mt, followed by the Northeast region with 16,417 mt.
0 10 20 30 40 50
NorthwestCalifornia
FloridaTexas
South CentralSoutheastNortheast
Great Lakes
Waste Stabilization & Solidification ProjectsRegional Divisions2nd Quarter 2012
(Thousands of Metric Tons)
-
50
100
150
200
250
300
350
400
450
500
2007 2008 2009 2010 2011 2012
Waste Stabilization & Solidification Projects(Thousands of Metric Tons)
1st Quarter 2nd Quarter 3rd Quarter 4th Quarter
Survey of Portland Cement Consumption: 2nd Quarter 2012 | PCA Market Intelligence
37
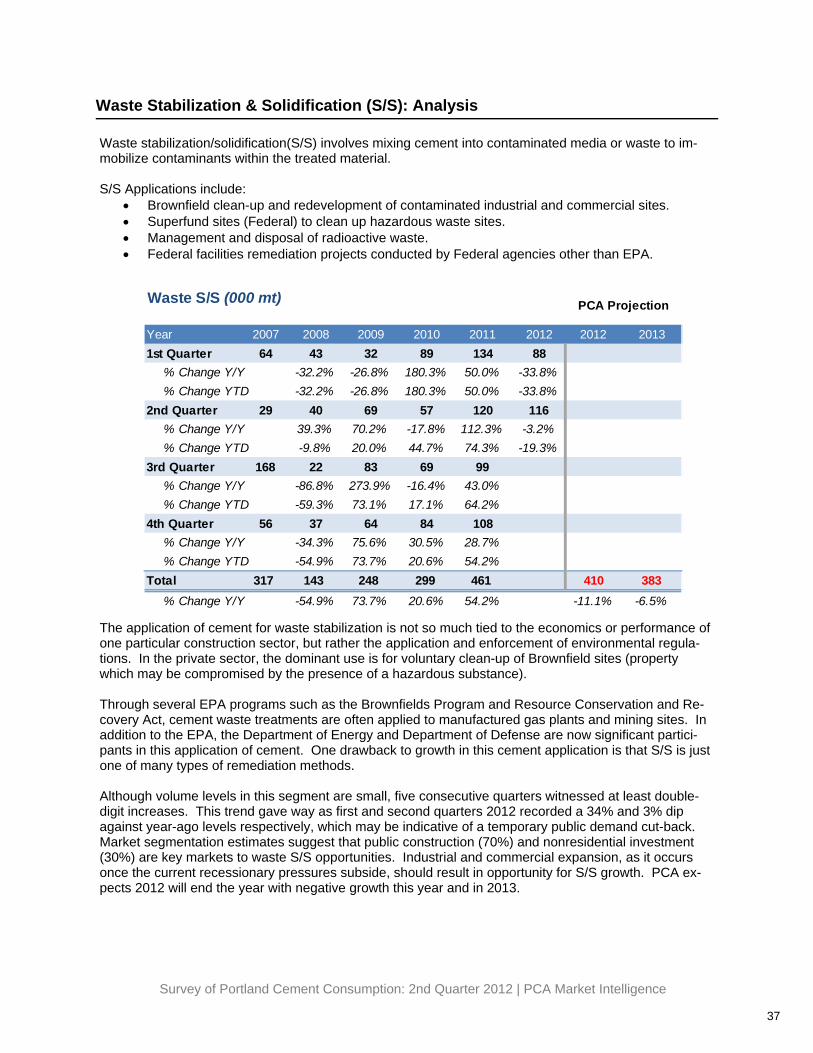
Waste Stabilization & Solidification (S/S): Analysis
Waste stabilization/solidification(S/S) involves mixing cement into contaminated media or waste to im-mobilize contaminants within the treated material. S/S Applications include:
• Brownfield clean-up and redevelopment of contaminated industrial and commercial sites. • Superfund sites (Federal) to clean up hazardous waste sites. • Management and disposal of radioactive waste. • Federal facilities remediation projects conducted by Federal agencies other than EPA.
The application of cement for waste stabilization is not so much tied to the economics or performance of one particular construction sector, but rather the application and enforcement of environmental regula-tions. In the private sector, the dominant use is for voluntary clean-up of Brownfield sites (property which may be compromised by the presence of a hazardous substance). Through several EPA programs such as the Brownfields Program and Resource Conservation and Re-covery Act, cement waste treatments are often applied to manufactured gas plants and mining sites. In addition to the EPA, the Department of Energy and Department of Defense are now significant partici-pants in this application of cement. One drawback to growth in this cement application is that S/S is just one of many types of remediation methods. Although volume levels in this segment are small, five consecutive quarters witnessed at least double-digit increases. This trend gave way as first and second quarters 2012 recorded a 34% and 3% dip against year-ago levels respectively, which may be indicative of a temporary public demand cut-back. Market segmentation estimates suggest that public construction (70%) and nonresidential investment (30%) are key markets to waste S/S opportunities. Industrial and commercial expansion, as it occurs once the current recessionary pressures subside, should result in opportunity for S/S growth. PCA ex-pects 2012 will end the year with negative growth this year and in 2013.
Year 2007 2008 2009 2010 2011 2012 2012 20131st Quarter 64 43 32 89 134 88
% Change Y/Y -32.2% -26.8% 180.3% 50.0% -33.8%% Change YTD -32.2% -26.8% 180.3% 50.0% -33.8%
2nd Quarter 29 40 69 57 120 116% Change Y/Y 39.3% 70.2% -17.8% 112.3% -3.2%% Change YTD -9.8% 20.0% 44.7% 74.3% -19.3%
3rd Quarter 168 22 83 69 99% Change Y/Y -86.8% 273.9% -16.4% 43.0%% Change YTD -59.3% 73.1% 17.1% 64.2%
4th Quarter 56 37 64 84 108% Change Y/Y -34.3% 75.6% 30.5% 28.7%% Change YTD -54.9% 73.7% 20.6% 54.2%
Total 317 143 248 299 461 410 383% Change Y/Y -54.9% 73.7% 20.6% 54.2% -11.1% -6.5%
Waste S/S (000 mt) PCA Projection
Survey of Portland Cement Consumption: 2nd Quarter 2012 | PCA Market Intelligence
38
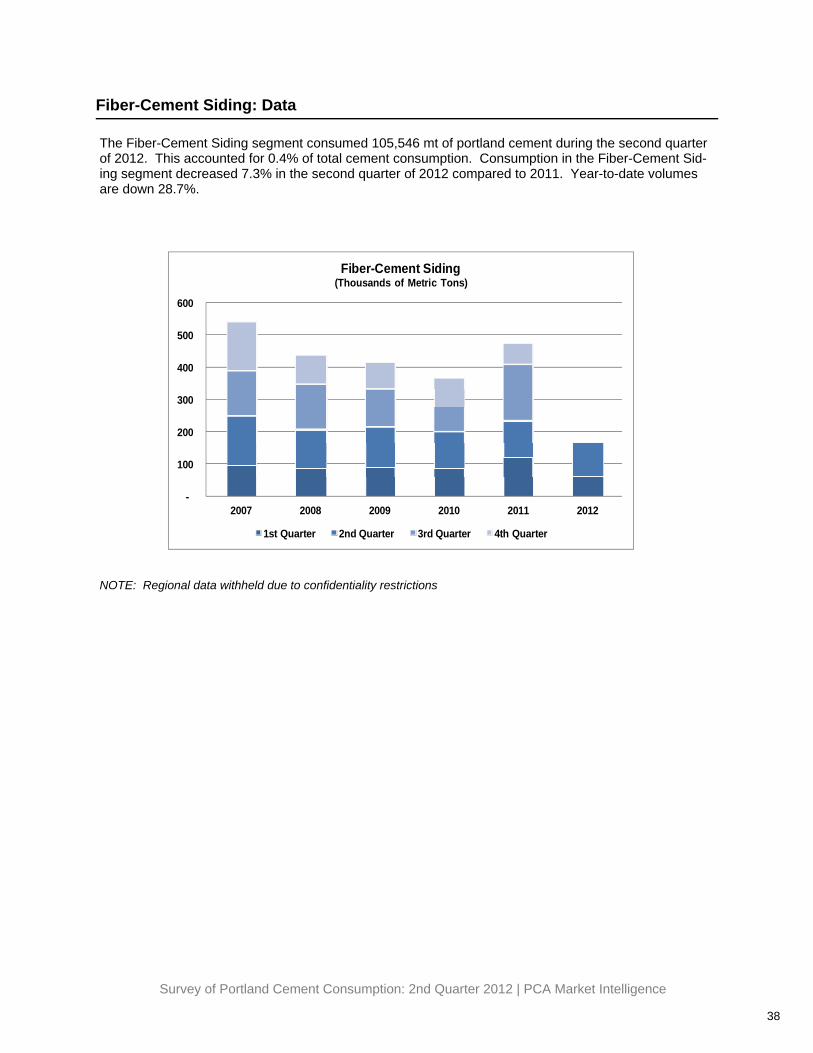
Fiber-Cement Siding: Data
The Fiber-Cement Siding segment consumed 105,546 mt of portland cement during the second quarter of 2012. This accounted for 0.4% of total cement consumption. Consumption in the Fiber-Cement Sid-ing segment decreased 7.3% in the second quarter of 2012 compared to 2011. Year-to-date volumes are down 28.7%.
NOTE: Regional data withheld due to confidentiality restrictions
-
100
200
300
400
500
600
2007 2008 2009 2010 2011 2012
Fiber-Cement Siding(Thousands of Metric Tons)
1st Quarter 2nd Quarter 3rd Quarter 4th Quarter
Survey of Portland Cement Consumption: 2nd Quarter 2012 | PCA Market Intelligence
39
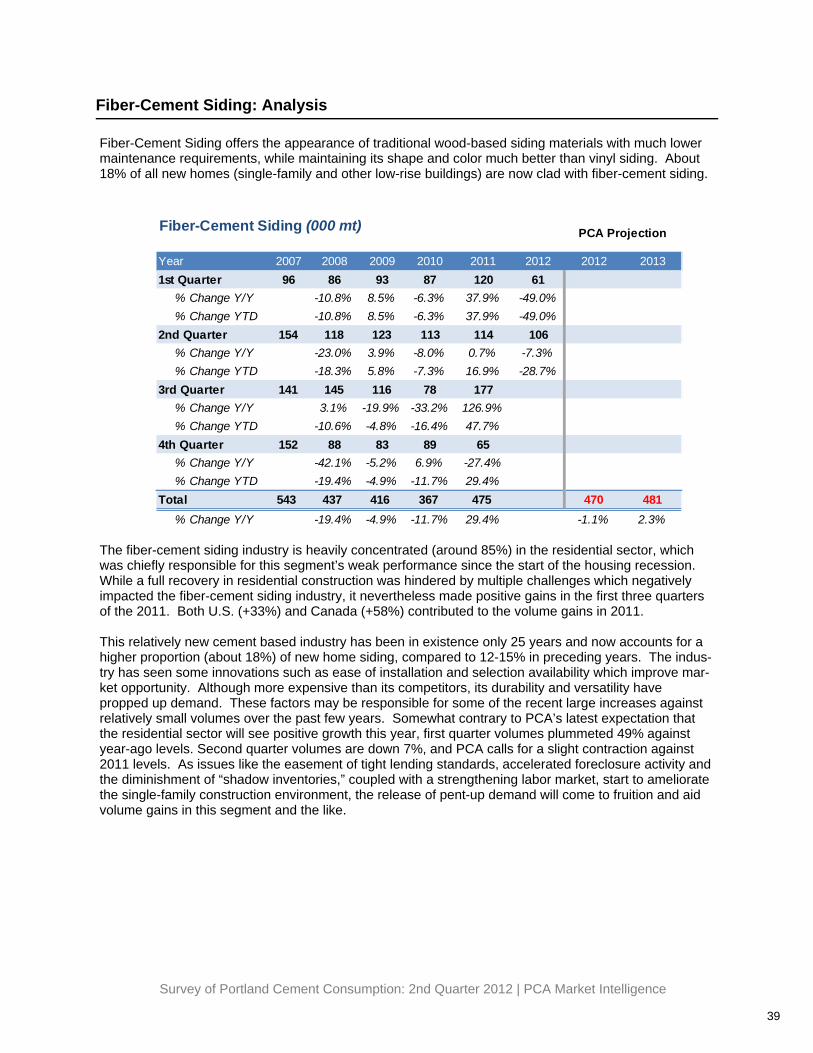
Fiber-Cement Siding: Analysis
Fiber-Cement Siding offers the appearance of traditional wood-based siding materials with much lower maintenance requirements, while maintaining its shape and color much better than vinyl siding. About 18% of all new homes (single-family and other low-rise buildings) are now clad with fiber-cement siding.
The fiber-cement siding industry is heavily concentrated (around 85%) in the residential sector, which was chiefly responsible for this segment’s weak performance since the start of the housing recession. While a full recovery in residential construction was hindered by multiple challenges which negatively impacted the fiber-cement siding industry, it nevertheless made positive gains in the first three quarters of the 2011. Both U.S. (+33%) and Canada (+58%) contributed to the volume gains in 2011. This relatively new cement based industry has been in existence only 25 years and now accounts for a higher proportion (about 18%) of new home siding, compared to 12-15% in preceding years. The indus-try has seen some innovations such as ease of installation and selection availability which improve mar-ket opportunity. Although more expensive than its competitors, its durability and versatility have propped up demand. These factors may be responsible for some of the recent large increases against relatively small volumes over the past few years. Somewhat contrary to PCA’s latest expectation that the residential sector will see positive growth this year, first quarter volumes plummeted 49% against year-ago levels. Second quarter volumes are down 7%, and PCA calls for a slight contraction against 2011 levels. As issues like the easement of tight lending standards, accelerated foreclosure activity and the diminishment of “shadow inventories,” coupled with a strengthening labor market, start to ameliorate the single-family construction environment, the release of pent-up demand will come to fruition and aid volume gains in this segment and the like.
Year 2007 2008 2009 2010 2011 2012 2012 20131st Quarter 96 86 93 87 120 61
% Change Y/Y -10.8% 8.5% -6.3% 37.9% -49.0%% Change YTD -10.8% 8.5% -6.3% 37.9% -49.0%
2nd Quarter 154 118 123 113 114 106% Change Y/Y -23.0% 3.9% -8.0% 0.7% -7.3%% Change YTD -18.3% 5.8% -7.3% 16.9% -28.7%
3rd Quarter 141 145 116 78 177% Change Y/Y 3.1% -19.9% -33.2% 126.9%% Change YTD -10.6% -4.8% -16.4% 47.7%
4th Quarter 152 88 83 89 65% Change Y/Y -42.1% -5.2% 6.9% -27.4%% Change YTD -19.4% -4.9% -11.7% 29.4%
Total 543 437 416 367 475 470 481% Change Y/Y -19.4% -4.9% -11.7% 29.4% -1.1% 2.3%
Fiber-Cement Siding (000 mt) PCA Projection
Survey of Portland Cement Consumption: 2nd Quarter 2012 | PCA Market Intelligence
40
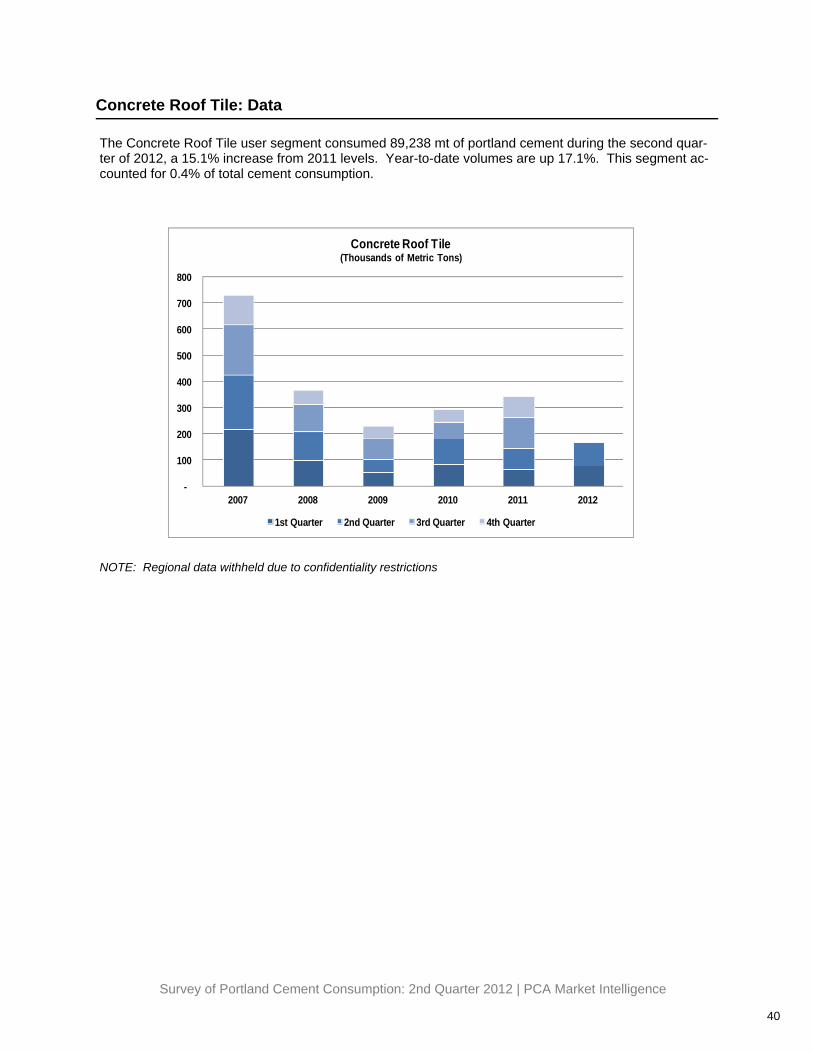
Concrete Roof Tile: Data
The Concrete Roof Tile user segment consumed 89,238 mt of portland cement during the second quar-ter of 2012, a 15.1% increase from 2011 levels. Year-to-date volumes are up 17.1%. This segment ac-counted for 0.4% of total cement consumption.
NOTE: Regional data withheld due to confidentiality restrictions
-
100
200
300
400
500
600
700
800
2007 2008 2009 2010 2011 2012
Concrete Roof Tile(Thousands of Metric Tons)
1st Quarter 2nd Quarter 3rd Quarter 4th Quarter
Survey of Portland Cement Consumption: 2nd Quarter 2012 | PCA Market Intelligence
41
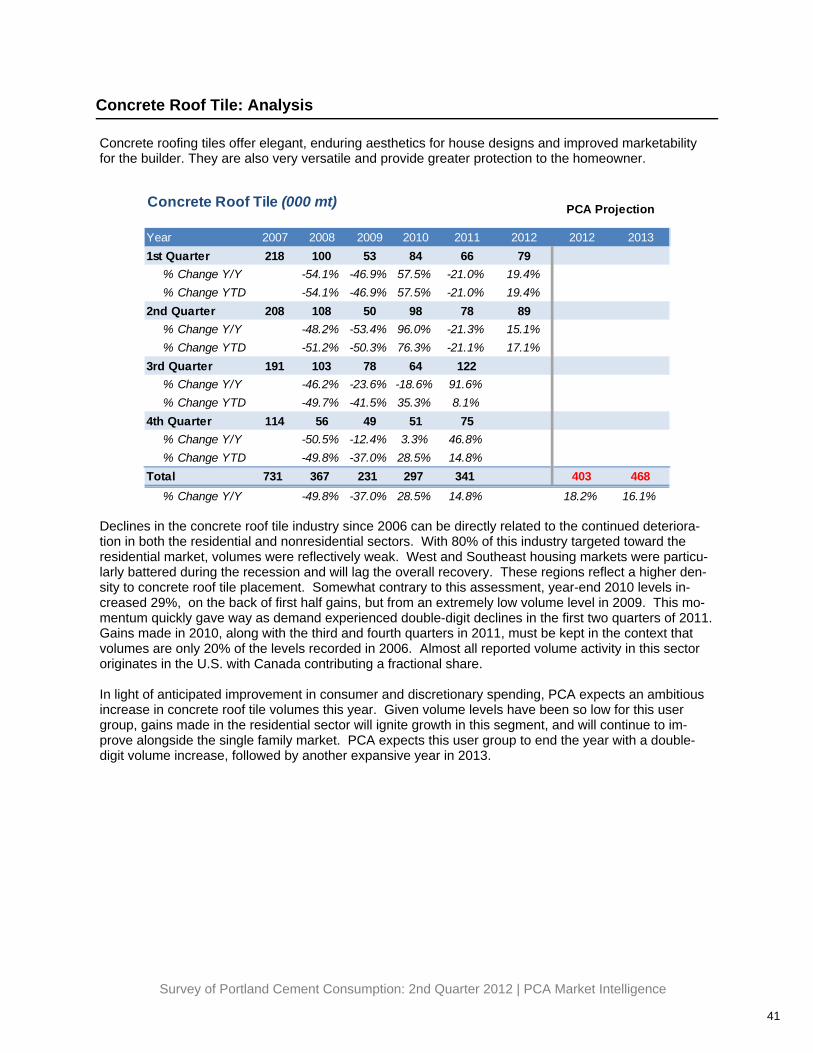
Concrete Roof Tile: Analysis
Concrete roofing tiles offer elegant, enduring aesthetics for house designs and improved marketability for the builder. They are also very versatile and provide greater protection to the homeowner.
Declines in the concrete roof tile industry since 2006 can be directly related to the continued deteriora-tion in both the residential and nonresidential sectors. With 80% of this industry targeted toward the residential market, volumes were reflectively weak. West and Southeast housing markets were particu-larly battered during the recession and will lag the overall recovery. These regions reflect a higher den-sity to concrete roof tile placement. Somewhat contrary to this assessment, year-end 2010 levels in-creased 29%, on the back of first half gains, but from an extremely low volume level in 2009. This mo-mentum quickly gave way as demand experienced double-digit declines in the first two quarters of 2011. Gains made in 2010, along with the third and fourth quarters in 2011, must be kept in the context that volumes are only 20% of the levels recorded in 2006. Almost all reported volume activity in this sector originates in the U.S. with Canada contributing a fractional share. In light of anticipated improvement in consumer and discretionary spending, PCA expects an ambitious increase in concrete roof tile volumes this year. Given volume levels have been so low for this user group, gains made in the residential sector will ignite growth in this segment, and will continue to im-prove alongside the single family market. PCA expects this user group to end the year with a double-digit volume increase, followed by another expansive year in 2013.
Year 2007 2008 2009 2010 2011 2012 2012 20131st Quarter 218 100 53 84 66 79
% Change Y/Y -54.1% -46.9% 57.5% -21.0% 19.4%% Change YTD -54.1% -46.9% 57.5% -21.0% 19.4%
2nd Quarter 208 108 50 98 78 89% Change Y/Y -48.2% -53.4% 96.0% -21.3% 15.1%% Change YTD -51.2% -50.3% 76.3% -21.1% 17.1%
3rd Quarter 191 103 78 64 122% Change Y/Y -46.2% -23.6% -18.6% 91.6%% Change YTD -49.7% -41.5% 35.3% 8.1%
4th Quarter 114 56 49 51 75% Change Y/Y -50.5% -12.4% 3.3% 46.8%% Change YTD -49.8% -37.0% 28.5% 14.8%
Total 731 367 231 297 341 403 468% Change Y/Y -49.8% -37.0% 28.5% 14.8% 18.2% 16.1%
Concrete Roof Tile (000 mt) PCA Projection
Survey of Portland Cement Consumption: 2nd Quarter 2012 | PCA Market Intelligence
42
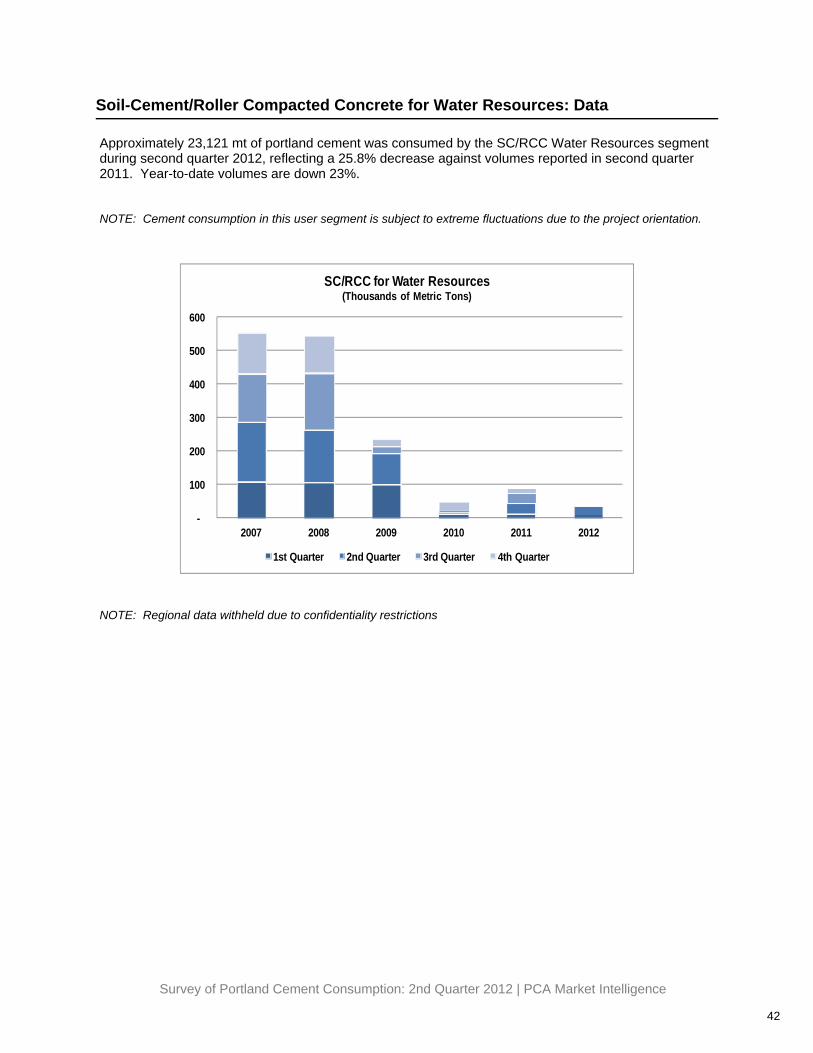
Soil-Cement/Roller Compacted Concrete for Water Resources: Data
Approximately 23,121 mt of portland cement was consumed by the SC/RCC Water Resources segment during second quarter 2012, reflecting a 25.8% decrease against volumes reported in second quarter 2011. Year-to-date volumes are down 23%. NOTE: Cement consumption in this user segment is subject to extreme fluctuations due to the project orientation.
NOTE: Regional data withheld due to confidentiality restrictions
-
100
200
300
400
500
600
2007 2008 2009 2010 2011 2012
SC/RCC for Water Resources(Thousands of Metric Tons)
1st Quarter 2nd Quarter 3rd Quarter 4th Quarter
Survey of Portland Cement Consumption: 2nd Quarter 2012 | PCA Market Intelligence
43
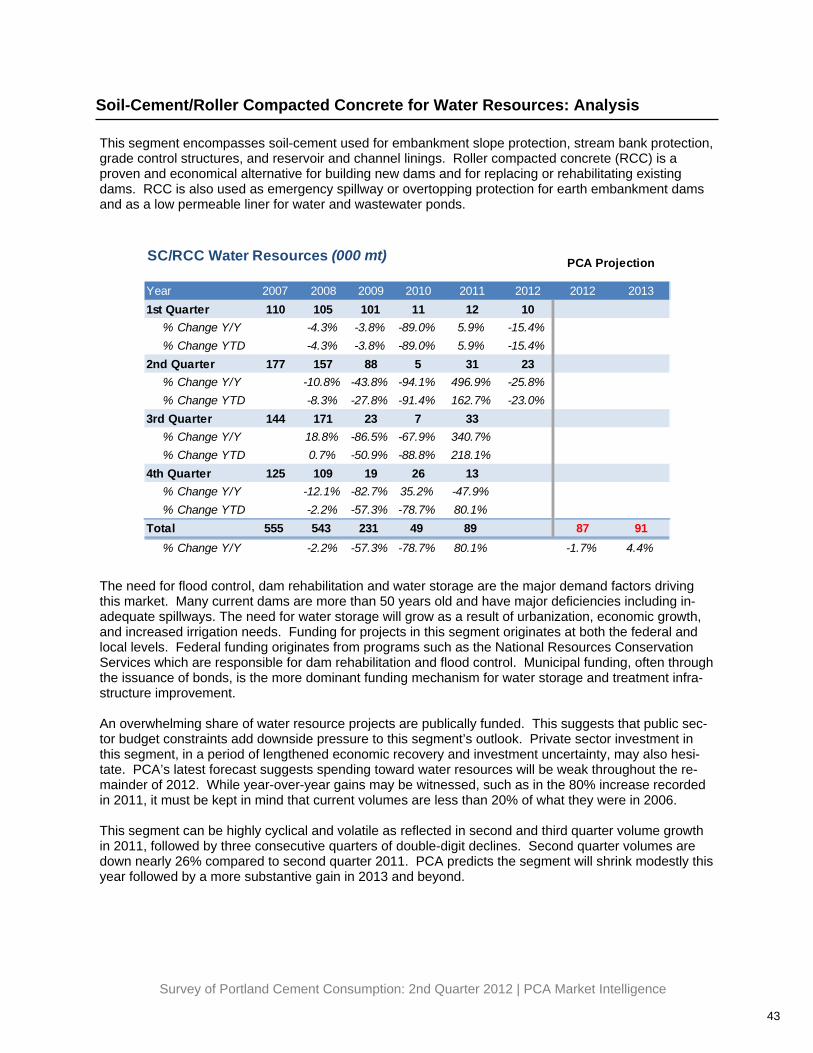
Soil-Cement/Roller Compacted Concrete for Water Resources: Analysis
This segment encompasses soil-cement used for embankment slope protection, stream bank protection, grade control structures, and reservoir and channel linings. Roller compacted concrete (RCC) is a proven and economical alternative for building new dams and for replacing or rehabilitating existing dams. RCC is also used as emergency spillway or overtopping protection for earth embankment dams and as a low permeable liner for water and wastewater ponds.
The need for flood control, dam rehabilitation and water storage are the major demand factors driving this market. Many current dams are more than 50 years old and have major deficiencies including in-adequate spillways. The need for water storage will grow as a result of urbanization, economic growth, and increased irrigation needs. Funding for projects in this segment originates at both the federal and local levels. Federal funding originates from programs such as the National Resources Conservation Services which are responsible for dam rehabilitation and flood control. Municipal funding, often through the issuance of bonds, is the more dominant funding mechanism for water storage and treatment infra-structure improvement. An overwhelming share of water resource projects are publically funded. This suggests that public sec-tor budget constraints add downside pressure to this segment’s outlook. Private sector investment in this segment, in a period of lengthened economic recovery and investment uncertainty, may also hesi-tate. PCA’s latest forecast suggests spending toward water resources will be weak throughout the re-mainder of 2012. While year-over-year gains may be witnessed, such as in the 80% increase recorded in 2011, it must be kept in mind that current volumes are less than 20% of what they were in 2006. This segment can be highly cyclical and volatile as reflected in second and third quarter volume growth in 2011, followed by three consecutive quarters of double-digit declines. Second quarter volumes are down nearly 26% compared to second quarter 2011. PCA predicts the segment will shrink modestly this year followed by a more substantive gain in 2013 and beyond.
Year 2007 2008 2009 2010 2011 2012 2012 20131st Quarter 110 105 101 11 12 10
% Change Y/Y -4.3% -3.8% -89.0% 5.9% -15.4%% Change YTD -4.3% -3.8% -89.0% 5.9% -15.4%
2nd Quarter 177 157 88 5 31 23% Change Y/Y -10.8% -43.8% -94.1% 496.9% -25.8%% Change YTD -8.3% -27.8% -91.4% 162.7% -23.0%
3rd Quarter 144 171 23 7 33% Change Y/Y 18.8% -86.5% -67.9% 340.7%% Change YTD 0.7% -50.9% -88.8% 218.1%
4th Quarter 125 109 19 26 13% Change Y/Y -12.1% -82.7% 35.2% -47.9%% Change YTD -2.2% -57.3% -78.7% 80.1%
Total 555 543 231 49 89 87 91% Change Y/Y -2.2% -57.3% -78.7% 80.1% -1.7% 4.4%
SC/RCC Water Resources (000 mt) PCA Projection
Survey of Portland Cement Consumption: 2nd Quarter 2012 | PCA Market Intelligence
44
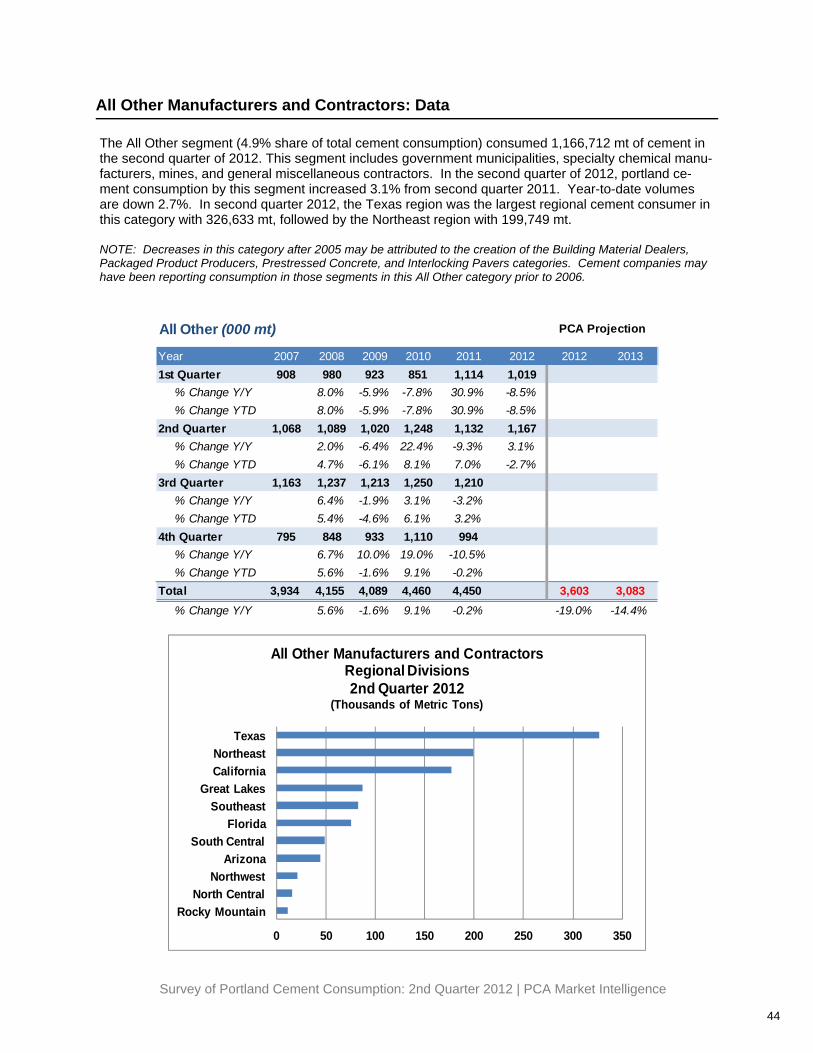
All Other Manufacturers and Contractors: Data
The All Other segment (4.9% share of total cement consumption) consumed 1,166,712 mt of cement in the second quarter of 2012. This segment includes government municipalities, specialty chemical manu-facturers, mines, and general miscellaneous contractors. In the second quarter of 2012, portland ce-ment consumption by this segment increased 3.1% from second quarter 2011. Year-to-date volumes are down 2.7%. In second quarter 2012, the Texas region was the largest regional cement consumer in this category with 326,633 mt, followed by the Northeast region with 199,749 mt. NOTE: Decreases in this category after 2005 may be attributed to the creation of the Building Material Dealers, Packaged Product Producers, Prestressed Concrete, and Interlocking Pavers categories. Cement companies may have been reporting consumption in those segments in this All Other category prior to 2006.
0 50 100 150 200 250 300 350
Rocky MountainNorth Central
NorthwestArizona
South CentralFlorida
SoutheastGreat Lakes
CaliforniaNortheast
Texas
All Other Manufacturers and ContractorsRegional Divisions2nd Quarter 2012
(Thousands of Metric Tons)
Year 2007 2008 2009 2010 2011 2012 2012 20131st Quarter 908 980 923 851 1,114 1,019
% Change Y/Y 8.0% -5.9% -7.8% 30.9% -8.5%% Change YTD 8.0% -5.9% -7.8% 30.9% -8.5%
2nd Quarter 1,068 1,089 1,020 1,248 1,132 1,167% Change Y/Y 2.0% -6.4% 22.4% -9.3% 3.1%% Change YTD 4.7% -6.1% 8.1% 7.0% -2.7%
3rd Quarter 1,163 1,237 1,213 1,250 1,210% Change Y/Y 6.4% -1.9% 3.1% -3.2%% Change YTD 5.4% -4.6% 6.1% 3.2%
4th Quarter 795 848 933 1,110 994% Change Y/Y 6.7% 10.0% 19.0% -10.5%% Change YTD 5.6% -1.6% 9.1% -0.2%
Total 3,934 4,155 4,089 4,460 4,450 3,603 3,083% Change Y/Y 5.6% -1.6% 9.1% -0.2% -19.0% -14.4%
All Other (000 mt) PCA Projection