Embed Size (px)
Citation preview

Survey of SCADA System Technology and Reliability in the Offshore Oil and Gas Industry
A Final Report to Dept of the Interior MMS TAampR Program Program SOL 1435-01-99-RP-3995
by
Kelvin T Erickson Ann Miller and E Keith Stanek Dept of Electrical amp Computer Engineering
Shari Dunn-Norman Dept of Geological amp Petroleum Engineering
University of Missouri-Rolla Rolla MO 65409
November 15 2000
Abstract
This report concerns the use of commercial Supervisory Control and Data Acquisition (SCADA) systems in the offshore oil and natural gas production industry This report consists of three major parts bull Current state of SCADA technology bull Reliability assessment of current SCADA technology bull Recommended MMS policy changes for operators that use SCADA systems
The major types of offshore facilities considered in this report are bull Conventional and deepwater platforms bull Subsea systems bull Pipelines
The architecture and SCADA vendors are surveyed for these types of facilities The reliability of platform subsea and pipeline SCADA systems is assessed The effects of errors induced by humans and software is also considered
Software development and quality assurance processes of several SCADA vendors were examined and a list of recommended best practices are included
Table of Contents
Abstract i Executive Summary 1 Survey of Current Offshore Systems which Employ SCADA 2
Typical Offshore Systems which Employ SCADA 4 Conventional and Deepwater Platforms 4 Subsea Systems 5 Pipelines 9 Mobile Drilling Units 11
Vendor Suitability for Offshore Systems 12 Offshore SCADA System Features 14
Hardware Features 15 Communication Features 15 Software Features 15
Technology Trends 16 Reliability of Offshore SCADA Systems 17
Fault Tree and Reliability Analysis 17 Failure Probability for Hardware Components 22 Development of the SurfaceSubsea Fault Tree 22 Calculating the Availability of the Top Event 35 Non-Independent Basic Events 36 Failure of the SCADA System 38
Pipelines 40 Human Error 41 Software Reliability 42 Operator Reliability Experience 43 Summary of Reliability Analysis Results 44 Software Quality 44
Software Survey Results 45 Recommendations 47 References 48 Appendix A 51
ii
List of Figures
1 Typical SCADA System Components 3 2 Distributed PLC Platform SCADA Systems 6 3 Centralized PLC Platform SCADA System 7 4 Deepwater Subsea SCADA System 9 5 Offshore Pipeline SCADA System 10 6 Mobile Drilling Unit SCADA System 11 7 Simple SCADA System 19 8 Fault Tree for Simple SCADA System 20 9 Reduced Fault for Simple SCADA System 21 10 Safety Flow Chart for Offshore Production Facility (from API RP 14C) 23 11 Fault Tree for Surface System 26 12 Subsea Control Subsystems 34 13 Fault Tree for Subsea SCADA 35 14 Fault Tree for Distributed Platform SCADA System 39 15 Pipeline Fault Tree 41 16 Human-induced SCADA Failure Fault Tree 42
List of Tables
1 Summary of Vendor Suitability for Each Type of Offshore Facility 13 2 Failure Data for Basic Events in Surface System Fault Tree 24 3 Failure Data for Basic Events in Subsea Fault Tree 40 4 Failure Data for Pipeline Fault Tree 40 5 Software-induced Failure Data for Basic Events in SCADA Fault Tree 43
iii
Executive Summary
A comprehensive survey of SCADA systems in the oil and gas industry was prepared in order to assess the current state of SCADA technology and to focus the efforts of the reliability assessment This survey included the three main categories of SCADA components hardware software and communications There are three major outcomes from this survey 1 Generalized system architectures for each of the three major offshore oil and gas
industry applications 2 Summary chart of vendor suitability for each of the three applications 3 Technology trends in offshore SCADA systems
Using a generalized system architecture from the survey the reliability of the system is estimated The outcome of this reliability assessment is an estimate of
bull Mean time between failures (MTBF) bull System availability bull Probability of facility damage or pollution release
The reliability was estimated using probabilistic risk assessment (PRA) A fault tree was constructed to show the effect of contributing events on system-level reliability Probabilistic methods provide a unifying method to assess physical faults contributing effects human actions and other events having a high degree of uncertainty The probability of various end events both acceptable and unacceptable is calculated from the probabilities of the basic initiating failure events
The probability of basic failure events (eg sensor failure communication link failure) was determined mainly from OREDA (SINTEF 1997) Some reliability data was obtained from current users
Due to the minimal amount of software defect data and failure rates the survey also includes a fact-finding study concerning software development process and software quality assurance (QA) procedures
Based on the reliability assessment of current SCADA technology and interviews guidelines for those operators that use SCADA systems are proposed The specific recommendations include recommended software development and quality assurance best practices Also recommendations for further study are given
1
Survey of Current Offshore Systems which Employ SCADA
According to ARC Advisory Group (1999) a system is classified as a supervisory control and data acquisition (SCADA) system when
ldquohellipthe system must monitor and control field devices using remote terminal units (RTUs) at geographically remote sites The SCADA system typically includes the master stations application software remote terminal units and all associated communications equipment to interface the devices The system must also include the controllers and IO for the master stations and RTUs and also the system HMI and application software programs It does not include field devices such as flow temperature or pressure transmitters that may be wired to the RTUrdquo
A generalized SCADA system for offshore oil and gas industry is shown in Figure 1 More specific system architectures are presented for four different types of facilities that employ SCADA systems offshore in waters under MMS jurisdiction These facilities can be described as conventional and deepwater platforms subsea systems pipelines and mobile drilling vessels
The information for the survey part of this report was gathered primarily from a representative set of offshore operators BP-Amoco Bridgeport Gas Distribution (Texaco) Chevron Conoco Exxon-Mobil High Island Pipeline System Marathon Shell Texaco and Vastar Dr Dunn-Norman and Dr Erickson gathered information through drawings meetings and telephone conversations
The next section of this report presents the system architectures for the four types of facilities that employ SCADA systems offshore The SCADA architecture of mobile drilling vessels is presented but excluded from further consideration since it is used strictly for monitoring and there is no remote control of actual drilling operations
Next the suitability of various SCADA hardware software and communication component vendors is assessed for platform subsea and pipeline facilities In addition the features of these components needed for an offshore facility are listed
Technology trends in offshore SCADA systems are identified in the last part of this section
2
RTU
Database Alarm Management
Data Historian Human-Machine Interface (HMI)
OPC ClientServer Communication Drivers
SCADA Server
Company Network
SCADA Workstation
HMI
SCADA Workstation
HMI
Printer
Communication Server
MW Modem
Sat Modem
Satellite
PLC
DCS
Modem
Modem
MW Modem
Sat Modem
PLC
PLC
PLCPlatform
Platform
Microwave
Modem
Modem
Platform Network
(eg Ethernet
DH+)
Figure 1 Typical SCADA System Components
3
Typical Offshore Systems which Employ SCADA
In the offshore oil and gas industry SCADA systems are used in the following applications
bull Production monitoring and control bull Well monitoring and control bull Process monitoring and control bull Unmanned platform monitoring and control bull Pipeline systems bull Drilling
Each of these applications is addressed herein and provides an understanding of the range of functions the SCADA system performs
This study identified four different types of facilities that employ SCADA systems offshore in waters under MMS jurisdiction These facilities can be described as conventional platforms subsea systems pipelines and mobile drilling vessels
Conventional and Deepwater Platforms
A conventional platform is defined as a steel structure that consists of topsides and a jacket The jacket is piled into the seabed and does not require any additional tethers or a mooring system for structural integrity This type of structure has been used extensively to develop both oil and gas fields in the Gulf of Mexico (GOM) and offshore California Conventional platforms may be small (tripods or four pile jackets) but many of these platforms are large (jackets with 8 piles or more) and include significant topsides and many wells
Recent exploration successes in deepwater and technological advances have fueled trends toward deepwater developments For deepwater tension leg platforms or guyed towers are used with subsea production elements such as subsea wells templates and manifolds In these systems the topside part of the structure is similar to that of conventional platforms The subsea production elements are considered in the next section
Wells drilled and completed from conventional or deepwater platforms are tied back directly to the platform and the produced oil and gas flow directly from the production tubing into process facilities located on the platform
Two major architectures of SCADA systems on offshore platforms have been identified bull Distributed PLC bull Centralized PLC
4
The distributed PLC architecture is shown in Figure 2 and is typical of larger platforms In this type of system each major unit of the platform is controlled by a separate PLC There is a platform communication network that connects the PLCs and the computers used for the Human-Machine Interface (HMI) The communication network is primarily used by the HMISCADA software to send commands to the PLCs and to receive information from the PLCs There is generally limited information passing between the PLCs Each major unit normally has a local operator panel to allow personnel to interact with that unit only In this type of architecture the safety system is generally handled by one of the PLCs Typically the platform communication network is redundant If the primary network fails communication is automatically switched to a redundant communication network The platform is monitored from an onshore office by a microwaveradiosatellite link The onshore office may perform some limited control functions especially when the platform is evacuated due to bad weather
Each PLC generally works autonomously from the other PLCs and will continue to control even if on-shore communication to the PLC is temporarily lost However if communication is lost for some significant time the PLC will shut down the unit
A deepwater platform has the same basic architecture as shown in Figure 2 The only difference is that the well SSV PLC and the equipment it controls is replaced by a subsea SCADA system described in the next section
The centralized PLC platform architecture is shown in Figure 3 and is more representative of smaller platforms and unmanned platforms One PLC controls the platform equipment In this case the inputoutput (IO) modules connected directly to the equipment communicate with the platform PLC over a specialized network generally called a remote IO network Some larger units e g a turbine generator may have a separate PLC as in the distributed platform architecture In this architecture the safety system is generally only monitored by the PLC
Subsea Systems
Subsea technology has evolved rapidly since the 1980s and many subsea wells now exist offshore in the GOM The term subsea systems refers to clusters of subsea wells or the combination of subsea wells tied to another host facility
A subsea well is a well completed with the wellhead and tree on the seafloor Oil and gas produced from each subsea well flows through an individual flowline (on the seafloor) to a production manifold (also located on the seafloor) The production is combined at the manifold and produced back to a host facility normally through a flowline and riser
5
VRU
Operator Panel
Air Compressor
LACT Unit
Operator Panel
IO M
od
VRU PLC
Primary PC Onshore Office (HMISCADA Air
IO M
od
software) Compressor Remote PC
Secondary PC (HMISCADA
software)
Router
PLC (HMISCADA
software)
Microwave Link Router
LACT Shipping
Pump PLC
Prim
ary
Net
wor
k
Red
unda
nt N
etw
ork
Waste Heat Unit
Turbine Generator
Operator Panel
Operator Panel
Gas Detect Facilities Module
Alarm Stations
Voice Annunciator
Gas Detect Module
IO M
od
Water Filter PLC
PLC IO Filter MCC
IO M
od
IO M
od
IO M
od
IO M
od Waste
Heat PLC
Operator Panel
Turbine Generator
PLC Turbine IO M
od Turbine
Generator
Generator
PLC Emergency
PLC
IO M
od Safety Sensors
SSVs System
Waterflood PLC
Well SSV PLC
IO M
od
IO M
od
Gas Detect PLC
Waterflood Injection Pumps
Well SCSSV Hydraulic
Panel
Gas Lift
Alarm PLC
Pneumatic Panel
Figure 2 Distributed PLC Platform SCADA System
6
VRU IO Modules VRU
Air Air Compressor Compressor
IO Modules
LACT Unit
Router Microwave Link
Onshore Office or Supervisory
Platform
Remote PC (HMISCADA
software)
Primary PC (HMISCADA
software)
Secondary PC (HMISCADA
software)
Router PL
C Re
mot
e IO
Net
wor
k
HM
ISCA
DA
Net
wor
k
Waste Heat
IO Modules Turbine
Platform PLC
Waste Heat Unit
IO M
od
Turbine Generator Generator
IO M
od PLC Turbine
Turbine Generator Generator
PLC
Safety System Monitor IO Rack
Safety System
Emergency Gas Detect Gas Detect
Module
Gas Detect Facilities
IO Modules Waterflood
IO Modules Waterflood
PLC
IO
PL
C I
O
Injection Pumps
Module
Well SCSSV Well SSV Alarm Alarm Hydraulic IO Rack PLC Stations
Voice
Panel
Gas Lift Pneumatic
Annunciator Panel
Figure 3 Centralized PLC Platform SCADA System
7
The host facility can be a conventional steel platform a tension leg platform (TLP) a floating production storage and offloading facility (FPSO) a caisson spar or guyed tower Regardless of the type of host facility the host acts as the point where produced oil and gas is separated treated metered and sold
In subsea systems one operator may have developed a field many miles from the nearest host facility Additionally another company may operate the host facility Sharing production facilities in this manner is common practice as this reduces development costs for more marginal outlying fields
Currently in the Gulf of Mexico there is significant emphasis on developing oil and gas reserves in deepwater (gt 2000 ft) and this trend will fuel additional growth in the use of subsea facilities tied to a host facility
Figure 4 depicts a typical arrangement between subsea wells producing to a host facility The main control for a group of wells sharing a subsea manifold is generally connected to the host facility communication network The control is handled by a redundant PLC on the host facility which is connected to a redundant serial communication network to the subsea facilities An electrical umbilical provides the communication to subsea facilities Flying leads connect each subsea well to the manifold
A multiplex electrohydraulic control system is used to perform the functions specified No RTUs or PLCs are located subsea
The multiplex electrohydraulic controls are piloted hydraulic controls with the pilot function replaced by an electrical signal Individual tree and manifold control is provided by subsea control pods These modules contain the valving and associated electronicelectric circuits required for routing the hydraulic fluid to the various valve and choke actuators All monitoring of subsea system status is accomplished in the subsea modules Individual well control pods also monitor pressure and temperature data control subsurface safety valves chemical injection valves and annulus valves Most subsea systems include redundant control modules
During workover operations the workover vessel assumes control of the subsea well and provides the same valve control operations provided by the host facility The vessel provides monitoring and shut-in control for the tree (if it is in place) or for the blowout preventer stack if the tree has been removed
Older subsea control systems may include a subsea junction box on the template for distribution of electric power signals to the subsea control modules None of the newer deepwater systems investigated in this study included subsea junction boxes
8
Host Facility Platform
Comm Network
Group A Subsea
Manifold
Um
bilic
al(E
lect
rich
ydra
ulic
che
mic
al)
Red
unda
nt P
LC
PLC
Comm Interface
Comm Interface
Red
unda
nt P
LC
PLC
Comm
Interface Comm
Interface
Umbilical Connection
Group BControl
Group AControl
Comms for other groups HydrChem
Redundant Control Module
P T Sensors
Control Module
Redundant Control Module
Pres Temp Sensors
Control Module
Electrical Flying Lead
HydChem Flying Lead
Well
Well
Well Flowlines
Flowline to Platform
Umbilical to other manifold(s)
Chem Inj
SCSSV1
SCSSV2
Figure 4 Deepwater Subsea SCADA System
Pipelines
On the topsides of a conventional platform or any host facility the oil and gas is separated treated metered and sold In most cases after metering the oil and gas are transported to shore through a large diameter (24-36 inch) steel pipeline These pipelines are operated single phase (oil only gas only) to minimize pressure losses from multi-phase flow effects
9
Onshore Office
Comm Remote PC Interface (HMISCADA
software)
Comm Comm Interface Interface
Comm Interface
RTU Flow Computer RTU Flow
Computer RTU Flow
Computer Meter Meter
Platform Production
Skid Platform Production
Skid Meter Skid Distribution
to refineries etc
From upstream platforms
The company that operates the host facility does not necessarily own the pipeline that transports the oil and gas from a particular host facility Most frequently another company owns the pipeline or a network of pipelines from the platforms For that reason both parties meter the product so that produced volumes can be compared with those purchased and transported to shore Inlet pressure and delivery pressures are recorded continuously and are compared to assist in determining leaks
Most pipelines in the GOM are in less than 300rsquoof water No subsea booster pumps are included in the lines and the lines are serviced with conventional or saturation diving
Figure 5 depicts a typical architecture of a pipeline SCADA system The pipeline SCADA system is separate from the other platform systems though it is attached to the platform There is an RTU (which often is a PLC) that monitors the production from the platform as well as the total flow through the pipeline The SCADA system may command a valve to close the flow from a platform but this is generally used only for emergencies (eg upstream pipeline break) Communications with the onshore office is by a satellite or microwave communication network
Figure 5 Offshore Pipeline SCADA System
10
Onshore Office
Comm Data Historian Interface Archival
Mobile Drilling Units
Offshore drilling vessels include jackup rigs semi-submersibles and drillships Jackups rest on the seafloor and are restricted for the most part to waters less than 400 ft Semi-submersibles and drillships are floating rigs and they are the main units for drilling in deeper waters
The floating drilling units must maintain their position over the drilling location Typically the units use a combination of dynamic positioning and spread mooring In deepwater only dynamic positioning is used
Dynamic positioning requires a constant monitoring of sea and wind conditions to coordinate and control the thrusters used to keep the drilling vessel on location Dynamic positioning is a critical function necessary to keep the vessel on station
During the drilling operation measurement while drilling (MWD) data mud logging data drill steam test data and mud properties are measured at regular intervals
In this study it was determined that SCADA systems are only being used on the most advanced mobile drilling vessels and that these systems are used to report drilling data back to an onshore office location as shown in Figure 6 No drilling vessels allowed or provided for remote control of actual drilling operations or positioning of the rig
Figure 6 Mobile Drilling Unit SCADA System
11
Vendor Suitability for Offshore Systems
In this section the vendors of components used in offshore oil and gas SCADA systems are listed along with the type of component used in the three applications The types of products are listed for each vendor and then the product features that are needed in offshore applications are listed
The three main categories of components that comprise a SCADA system are hardware software and communications Among the vendors no one seems to support both short-distance (local-area networks) and long-distance (eg satellite microwave) communications Therefore communication components are divided into two categories leading to the following four categories of SCADA system components
bull Hardware ndash programmable logic controllers (PLCs) remote terminal units (RTUs) and distributed control systems (DCSs)
bull Software ndash SCADA software package consisting of the database human-machine interface (HMI) alarm management and data historian communication drivers object linking and embedding for process control (OPC) modules and the operating system
bull Short-distance communication networks ndash local-area networks (eg Ethernet Modbus) remote IO networks and control networks at the remote units
bull Long-distance communication networks ndash satellite microwave telephone and radio communication including modems if distinct from other hardware components (eg PLC)
Vendors for the computers that execute the software are numerous and so are not considered in this report
According to existing SCADA system surveys (ARC Advisory Group 1999 ISA 1998) there are currently about 30 vendors of SCADA hardware and software and another 10 vendors of just SCADA software These lists were narrowed to only include vendors involved in offshore oil and gas operations In addition after visiting offshore operators some vendors were added to the list Information was acquired from the following operators BP-Amoco Bridgeport Chevron Exxon-Mobil High Island Pipeline Marathon Shell Texaco and Vastar
Vendor suitability for each of the three types of facilities is summarized in Table 1 For each vendor the types of components supported for each of the three types of facilities is shown by a letter as follows
H ndash hardware S ndash software L ndash local-area network D ndash distant network (eg satellite microwave)
For example a vendor that only supplies RTU hardware is shown as ldquoHrdquo where a vendor that sells hardware software and local-area networks is shown as ldquoHSLrdquo In addition
12
some vendors marked with () have products suitable in offshore oil and gas SCADA systems but were not indicated by the surveyed operators
Table 1 Summary of Vendor Suitability for Each Type of Offshore Facility
Vendor Platform Subsea Pipeline ATampT Clearlink D D Bailey H Chevron WinSCADA S Cisco D CI Technologies () S S Daniel Industries H H Datacom D D Data-Linc Group D Elliott H H Flow Automation H H GEFanuc HLS HS Halliburton H Hewlett-Packard S Iconics () S S Intellution () S S Kongsberg Offshore as HL Moore Products HS New Bridge D D Oilfield Systems Inc S S RealFlex Systems S Rockwell Automation HSL HL H Schneider Automation (Modicon Square D) HL H
ShellBPAmoco D D Siemens HL Stratacom D D Teledyne Brown () H H Texaco RTU H Tokheim Corp H H VSAT D D Wonderware S S S
The products and services from each of the vendors listed in Table 1 are ATampT Clearlink ndash satellite dish transponder Baileyndash Net 90 distributed control system Chevron WinSCADA ndash In-house SCADA software Cisco ndash Communication network routers long-distance network switch
13
CI Technologies ndash Citect HMI package drivers for many PLC and RTU vendors Daniel Industries ndash remote terminal unit Datacom ndash digital microwave network provider loop topology provides 2 paths to
onshore Data-Linc Group ndash Ethernet radio modems Elliott ndash remote terminal unit Flow Automation ndash remote terminal unit GEFanuc ndash H Series 90-30 and 90-70 PLCs the 90-30 often used in place of
traditional RTUs L Ethernet Series Ninety Protocol (SNP) S ndash Cimplicity HMI package
Halliburton ndash GFC-332 flow computer (RTU) Hewlett-Packard ndash RTAP HMI software Iconics ndash Genesis32 HMI package drivers for many PLC and RTU vendors Intellution ndash Fix Dynamics HMI package drivers for many PLC and RTU
vendors Kongsberg Offshore as ndash subsea control equipment packages Moore Products ndash APACS distributed control system New Bridge ndash digital multiplexer to microwave Oilfield Systems Inc ndash Plant Information (PI) data archival software RealFlex Systems ndash SCADA software Rockwell Automation ndash H PLC-5 and SLC-500 PLCs the SLC-500 often used in
place of traditional RTUs L Ethernet ControlNet Data Highway+ Remote IO S RSView HMI package drivers for non-RA equipment though not as many as Wonderware
Schneider Automation ndash H Modicon and Square D PLCs often used in place of traditional RTUs L Modbus Modbus+ SyMax networks
ShellBPAmoco ndash digital microwave network Siemens ndash H 505-series (ex-Texas Instruments) PLCs L Ethernet TIWAY
Profibus-DP Stratacom ndash long-distance network switch Teledyne Brown ndash remote terminal unit Texaco RTU ndash In-house RTU Tokheim Corp ndash remote terminal unit VSAT ndash satellite communications provider Wonderware ndash InTouch HMI package drivers for most PLC and RTU vendors
special drivers are often developed by users and third parties
Offshore SCADA System Features
The hardware software and communication features needed for offshore facilities were determined from prior knowledge and refined based on information from the surveyed operators Note that the lists are representative and many operators do not consider all of the features in any given list In addition most companies standardize the hardwaresoftwarecommunication vendor selection The most common choices are
14
Hardware ndash Rockwell Automation (Allen-Bradley) PLC-5 and SLC-500 Software ndash Wonderware InTouch Communication ndash DataCom or ShellBPAmoco digital microwave system
Hardware Features
According to the surveyed operators hardware products are selected for offshore platform and pipeline systems based on many of the following features
bull Proven reliability bull Ease of maintenance bull Ease of modification bull Discrete and analog IO bull Ruggedized bull Division 2 environment bull Intrinsically safe bull Redundancy (though a minority of operators use this feature)
The desired features of subsea systems are considered separately since the environment for these systems is very different from platform and pipeline systems
bull Proven reliability bull Ruggedized bull Redundancy
Communication Features
According to the surveyed operators communication products are selected for offshore systems based on the following features
bull Redundancy bull Ease of modification bull Supported protocols (most popular Ethernet Data Highway+)
Software Features
According to the surveyed operators software products are selected for offshore platform and pipeline systems based on many of the following features
bull Operating system supported (Windows NT or UNIX) bull Range of supported PLCDCSRTU vendors and communication protocols bull Ease of modification bull Intranet Web (firewall to outside of company) bull Alarming bull Historical trending bull Built-in diagnostics bull Reliability
15
Many of the offshore operators seem to use Wonderware InTouch because it is easy to learn and modify and it supports a large number of PLC and RTU vendors In addition users and third parties often develop interfaces for special or obscure equipment
Technology Trends
As a result of gathering the information for this report from offshore operators the following technology trends in SCADA systems for offshore oil and gas facilities were identified
bull Replacement of pneumatic safety systems with electronic safety systems According to the operators that have been using electronic safety systems electronic systems are much more reliable and require less maintenance
bull Remote terminal units (RTUs) replaced by programmable logic controllers (PLCs) The PLC hardware and software is easier to modify
bull Remote operation of platforms One operator (Chevron) operates many of the platforms from onshore Another operator (Texaco) only operates the platforms from onshore when the platforms have been evacuated due to storm conditions Many operators are reluctant to operate platforms from onshore but with increasing demands to cut costs removing personnel and remotely operating platforms is one means to that end Preliminary guidelines for remote startups and remote operations are currently being formulated as a result of this trend
bull Use of Windows NT operating system This seems to be nearly universal
bull Use of commercial off-the-shelf (COTS) hardwaresoftware Most operators do not have the resources to support in-house product development Most of them are phasing out the systems developed in-house
bull Use of integrated software architectures One of the best practices cited in the software reliability (below) is the development of a common software framework that will support multiple software components in a seamless manner
16
Reliability of Offshore SCADA Systems
The reliability of the complete SCADA system (hardware software and communication network) was estimated The outcome of this reliability assessment provides
bull Mean time between failures (MTBF) bull System availability bull Probability of facility damage or pollution release
The above was estimated for the platform subsea and pipeline systems
As the study progressed we found that vendors would not divulge reliability information about their products Therefore reliability information from SINTEF (1997) was used to assess the reliability of the offshore systems Since SINTEF (1997) does not cover software or human-induced failures other data sources were used to estimate the reliability for these failures Redundancy for subsea systems was considered
The types of failures included bull Hardware failures bull Software failures bull Human-induced failures bull Communication link failures bull Fireexplosion
Fault Tree and Reliability Analysis
The reliability assessment of current SCADA technology has two major directions
1 Calculation of a reliability index for the SCADA system as a whole including sensors modems communications channels servers and the SCADA workstation The form of this index is the system unavailability
2 Calculation of the probability of a top event during a given year This top event is facility damage or a significant oil spill
The calculations are relatively simple if the system is a series system in a reliability sense This is true of many electronic or mechanical systems Once the reliability performance of each component in the chain is found the overall system performance is easily calculated For instance if the availability of each component of the system can be found the overall system availability is just the product of the component availabilities Similar relatively simple calculations can be done to find the probability of system
17
failure or the mean time between system failures For instance if λi i = 1 n are the n component failure rates then the system failure rate is
λ = sum n
λisystem i=1
The system reliability assuming constant failure rates and no repair is
systemtR(t) = e minusλ
The system mean-time-to-failure is
1MTTF = system λsystem
The component availabilities can be found if the constant repair rates for the n components are known to be micro i i = 1 n In that case the availability of the ith component is
micro i MTTFAi = = λi + micro i MTTF + MTTR
and the system availability is
n
Asystem = prod Ai i=1
The latter calculation is more challenging but it contains the most pertinent information
Most systems however are not simple series systems and therefore more powerful techniques such as fault tree analysis must be used
Probabilistic risk assessment (PRA) was used to assess the effect of contributing events on system-level reliability tree (Billinton and Allan 1992 Henley and Kumamoto 1992) Probabilistic methods provide a unifying method to assess physical faults contributing effects human actions and other events having a high degree of uncertainty The PRA was performed using fault tree analysis The probability of various end events both acceptable and unacceptable is calculated from the probabilities of the basic initiating failure events
The fault tree model serves several important purposes First the fault tree provides a logical framework for the failure analysis and precisely documents which failure scenarios have been considered and those that have not Second the fault tree is based on well-defined Boolean algebra and probability theory The fault tree shows how events combine to cause the end (or top) event and at the same time defines how the probability of the end event is calculated as a function of the probabilities of the basic events Thus
18
the fault tree model can be easily changed to accommodate systems consisting of components from one vendor as well as components from mixed vendors (eg software vendors and hardware vendors) The fault tree analysis also illuminates the ldquoweak pointsrdquo in the design which will be used to assess trade-offs and to generate recommendations to oil and gas operators
In order to illustrate the concept it will be assumed that a simple SCADA system can be represented as shown in Figure 7
9
Actuator
11
10 SCADA
Comm Link 2 Server
Comm Link 1
System Leak
Sensor
Sensor
Safety Valve 1RTU
2RTU
2 3 41
5 6 7
8
Figure 7 Simple SCADA System
Suppose now we postulate the top event to be a system leak that is not mitigated by action of the safety shut off valve The fault tree diagram for this system would look like Figure 8
19
G1
+
7
1 32 4 5 6 10 91 112 3 4 1 2 3 4 11 8
+ ++
G2 G3 G4
Figure 8 Fault Tree for Simple SCADA System
G1 ndash Failure to close safety valve in the presence of an oil leak G2 ndash Failure to sense an oil leak G3 ndash Failure to sense state of an open safety valve G4 ndash Failure to close the safety valve
Basic events ndash q1 ndash Failure of the SCADA system q2 ndash Failure of the communications link 2 q3 ndash Failure of the server q4 ndash Failure of communications link 1 q5 ndash Failure of RTU2 q6 ndash Failure of the leak sensor q7 ndash Failure of the system an oil leak q8 ndash Failure of the safety valve to close q9 ndash Failure of the actuator to close the safety valve q10 ndash Failure of the safety valve position sensor q11 ndash Failure of RTU1
20
G1
1 32 4 5 6 10 9 11 8
+
G5
7
This is an example fault tree diagram If the safety valve is a fail-safe type valve the state G4 is not a factor If the SCADA system is designed to close the safety valve regardless of how its state is sensed then state G3 is not a factor either
The simplest approach to solving for the availability of the top event is to draw a reduced fault tree Since the intermediate states G2 G3 and G4 are all the outputs of OR gates and they all feed into an OR gate the four OR gates can be replaced by a single OR gate with all the basic events except number 7 as inputs The new reduced fault tree is as shown in Figure 9
Figure 9 Reduced Fault Tree for Simple SCADA System
G5 - Failure of SCADA system or safety value
The availability of state G5 is A(top event ) = q A topevent q occurs )+ (1minus q ) A(top event q1 doesnt occur )1 ( 1 2
The availability of this top event is
21
11 A G1 = q7 1minusprod 1minus qi( ) ( ) i=1 ine7
Failure Probability for Hardware Components
The key source of offshore failure data for this study is SINTEF 1997 Several databases and handbooks exist to help with the estimation of failure probabilities for basic events (Bellcore 1992 DOD 1991 Gertman and Blackman 1994 RAC 1995) Within the nuclear engineering community failure data for nuclear-specific systems and components are available from several sources including summaries of licensee event reports (USNRC 1980 1982a 1982b) and other handbooks (IEEE 1983 USNRC 1975)
Development of the SurfaceSubsea Fault Tree
The development of the surface system fault tree was built on the Safety Flow Chart-Offshore Production Facility which appears in Figure 10 (Figure 3-1 of the API Recommended Practice 14C sixth edition March 1998) The subsea portion of the fault tree was developed using the generalized subsea architecture shown in Figure 4
The failure rates repair times and calculated availabilities for the surface system are shown in Table 2 The overall surface fault tree is shown in Figure 11 It should be noted that the failure rates in Table 2 are derived from more detailed drawings of the process equipment and may represent overall subsystems including controls Most of the failure rates in Table 2 is derived from SINTEF (1997)
The first column in Table 2 contains the event numbers (in the circles) that appear in the fault tree of Figure 11 A short description of the system component that fails occurs in the second column The third column has the failure rate in failures per year This column is derived from the SINTEF (1997) tables which have the failure rate in failures per million hours The fourth column contains the time to repair in repairs per year and is calculated by dividing the number of hoursyear (8760) by the hoursrepair from SINTEF (1997) The availability the last column is obtained by dividing the third column by the sum of the third and fourth columns
22
Paste figure here
Figure 10 Safety Flow Chart for Offshore Production Facility (from API RP 14C)
23
Table 2 Failure Data for Basic Events in Surface System Fault Tree
No Basic
Failure Events
Failure Rates of Basic Events
(Failures per Year)
Repair Times for Basic Events
(Repairs per Year) Availability of
Failure 1TSE (Temp Safety Element) 0068 43800 00000016 2ESD (Emerg Shut Down) 0092 2623 000035 3Air 1 4ASH (Gas Detector) 0042 151034 0000028 5Vent 018 730 000025 6Containment 00004 5214 00000077 7Containment 00004 5214 00000077 8ESD (Emerg Shut Down) 0092 2623 000035 9PSL (Pressure Safety Low) 02 7552 000026
10FSV (Flow Safety Valve) 28 58013 00048 11LSL (Level Safety Low) 101 11089 000091 12LSH (Level Safety High) 101 11089 000091 13Pressure Vessel 02 10318 000019 14Accident 00004 2 000005 15Compressor 47 15587 0029 16Pump 26 2163 0012 17Heat Exchanger 00034 11188 000003 18Vessel 047 84231 000056 19Valves 283 34488 00081 20Pressure Vessel 02 10318 000019 21PSH (Pressure Safety High) 02 7552 000026 22PSV (Pressure Safety Valve) 195 3449 00056 23Pump 141 2177 00064 24Flowline 00045 6126 00000073 25Compressor 998 13508 0069 26Heat Exchanger 0018 656 000027 27Ventilation 018 730 000025 28PSV (Pressure Safety Valve) 195 3449 00056 29Atmospheric Vessel 0009 8423 0000011 30LSL (Level Safety Low) 101 11089 000091 31Pressure Vessel 02 10318 000019 32Atmospheric Vessel 0009 8423 0000011 33Pressure Vessel 02 10318 000019 34PSL (Pressure Safety Low) 02 75517 000026 35Ventilation 018 730 000025 36PSV (Pressure Safety Valve) 195 3449 00035 37Atmospheric Vessel 0009 8423 0000011 38Reboiler 0009 8423 0000011 39FSL (Flow Safety Low) 0024 14600 00000016 40TSH (Temp Safety High) 0068 43800 00000016 41Reboiler 0009 8423 0000011 42LSL (Level Safety Low) 0053 11089 0000048
24
43TSH (Temp Safety High) 0068 43800 00000016 44TSH (Temp Safety High) 0068 43800 00000016 45Pressure Vessel 02 10318 000019 46Compressor 61 2218 0027 47Fuel Control 007 8505 0000082 48TSH (Temp Safety High) 0068 43800 00000016 49TSH (Temp Safety High) 0068 43800 00000016 50IPM (Ignition Prev Measures) 0042 151034 0000028 51Flame Emission 0083 2163 000038 52PSL (Pressure Safety Low) 0011 75517 0000015 53Motor Starter Interlock 013 2163 00006 54Spark Emission 876 8760 0001 55Arrestor 00088 365 0000024 56BSL (Burner Safety Low) 0069 13477 0000051 57Fuel Gas Supply 007 8505 0000082 58PSL (Pressure Safety Low) 0011 75517 0000015 59Air Supply Control 0083 2163 000038 60PSL (Pressure Safety Low) 0011 75517 0000015 61Motor Starter Interlock 013 2163 00006
25
Facility Damage Or Leak
Air (3) A
Excess Fuel
B
Fire or Explosion TSE
(1) ESD (2)
Ignition
I Pollution
Intermediate State
I ASH (4)
Vent (5)
Cont (6) Cont
(7) ESD (8)
Intermediate State
Figure 11a Top Fault Tree for Damage or Leak
26
I
Intermediate State
Release of Hydrocarbons
PSL (9)
FSV (10)
LSL (11)
Overflow Process EquipmentFailure
LSH (12)
P Ves (13)
Accidnt (14) C
Excess Temperature
at Component
Mechanical Deterioration O
Overpressure
D
Underpressure
Comp Pump (16)
Valves (15)
Ht Ex (17) (19)
Vessel (18)
Figure 11b Intermediate State Fault Tree
27
Pump (23)
Overpressure
O
Comp (25)
Flwlin (24)
Ht Ex (26)
PSH (21)
G P Ves (20) PSV
(28) G
A Ves (29) PSV
(22) Vent (27)
Gas Blow by Gas Blow by
LSL (30)
P Ves (31)
A Ves (32)
Figure 11c Overpressure Fault Tree
28
D
Underpressure
P Ves (33)
PSL (34)
Vent (35
PSV (36)
A Ves (37)
Figure 11d Underpressure Fault Tree
29
Excess Temperatureat Component
C
Low Flow Limited Heat Low Level Excess Fuel Transfer
(38) (39) (40) Reblr FSL TSH TSH
(44) P Ves
(45) Comp
(46)
Reblr (41)
LSL (42)
TSH (43)
Fuel C (47)
TSH (48)
TSH (49)
Figure 11e Excess Temperature at Component Fault Tree
30
A
Ignition
IPM (50)
Flame (51)
PSL (52)
M Str (53)
Spark (54)
Arstr (55)
Figure 11f Ignition Fault Tree
31
B
Excess Fuel
BSL (56)
BSL (58)
Fuel (57)
Air Ctl (59)
M Str (61)
PSL (60)
Figure 11g Excess Fuel Fault Tree
32
The subsea portion of the fault tree was developed using the generalized subsea architecture shown in Figure 4 The control systems controlling single satellite wells and more complex subsea production facilities such as multi-well manifold template systems can be broken into subsystems as shown in Figure 12
Failure modes for the subsystems shown in Figure 12 include Electrical Power Failure - Pod (EFP) Hydraulic Power Failure - Connector (HFC) Hydraulic Power Failure - Line (HFL) Hydraulic Power Failure - Pod (HFP) Signal Transmission Failure - Connector (SFC) Signal Transmission Failure - Line (SFL) Signal Transmission Failure - Pod (SFP) Signal Transmission Failure - Surface (SFS)
These failure modes are independent events represented as ldquoORrdquo gates on a fault tree Ultimately however these ldquoORrdquo gates are combined because any one fault causes complete system failure
The block diagram of the subsea control subsystems shown in Figure 12 illustrates the flow of electrical power hydraulic and communications signals that could lead to a critical failure It should be noted that this is essentially a series system from a reliability point of view (any failure leads to system failure) There are two areas where redundancy occurs (1) the redundant subsea control modules at either the well or the subsea manifold and (2) the redundant PLCs at the host facility In both cases the failure of the redundant set is considered the basic event and the failure rate is selected accordingly With these assumptions the fault tree will consist of only basic events ldquoORrdquo gates and derived states including the top event
It should also be noted that three basic events are actually combinations of two or more fundamental events (1) the electrical power failure of the pod (EFP) could be either a short circuit at the pod connector or a general electric failure in the subsea control unit (2) the signal transmission failure in the line (SFL) could be either a blocked or plugged sensor or a faulty signal line (3) the signal transmission failure at the pod (SFP) could be either a pilot valve control failure or a subsystem faulty signal
Using the block diagram in Figure 12 the fault tree diagram in Figure 13 can be drawn In this fault tree diagram hydraulic failures (HFC HFL or HFOP) and signal failures (SFP SFC or SFL) can occur for any of the n satellite wells In addition signal failures on the surface (SFS) can occur for any of the m group controls Once again the failure rates used account for this fact (Effective failure rate equals n or m times component failure rate)
33
Topside
Hydraulic power unit
Hydraulic Lines surface
termination
Electric power unit
Electric Lines surface
termination
Electric Lines
Electric Lines subsea
termination
Electric template
trunk lines
Surface control unit
Signal Lines surface
termination
Signal Lines
Signal Lines subsea
termination
Signal template
trunk lines
Control pod electronics
Um
bilic
al
Hydraulic Lines
Hydraulic Lines subsea
termination
Hydraulic template
trunk lines
Control pod hydraulics
Baseplate
Control Pod
Figure 12 Subsea Control Subsystems
34
Critical Failure
HFLEFP HFP SFCHFC SFP SFSSFL
OR
Figure 13 Fault Tree for Subsea SCADA
Based on the data from SINTEF (1997) the following fault rates are used for the basic events in the fault tree
EFP = 428 HFC = 381 SFP = 381 SFS = 1369 HFL = 762 SFC = 190 HFP = 190 SFL = 574
where all fault rates are in failures per million hours It is easily seen that the electric power failure at the pod (EFP) and the signal transmission failure - line (SFL) are the dominant failure modes The overall failure rate for critical failures is 13293 failures per million hours or about 116 failures per year This corresponds to a mean time to failure of about 086 years
This failure rate may seem high but in this context a ldquocritical failurerdquo means loss of automatic control Oil spills will also require a simultaneous leak in a critical valve component This aspect of the reliability study has not been addressed
Calculating the Availability of the Top Event
Processing the availabilities of component failures through a series of ANDOR gates in a fault tree is a well established process In general an AND gate with n inputs each with availability of failure of qi results in a new state with availability
35
A(output of AND gate ) = q q Lqi 2 n
n
= prodq i i=1
In the case of an OR gate the availability of the new state when there are n inputs each with availability of failure of qi is
( ( L 1 qA(output of OR gate ) = minus minus 1 1 q ) 1minus q ) ( minus )i 2 n
1 q= minusprodn
(1minus i ) i=1
A program capable of performing these operations for a general fault tree without dependent basic events was available and was used to calculate the availability of the top event in these fault trees
Remember availability of the top event is the fraction of time a system of components with repair will be in an unsuccessful or failed state
Non-Independent Basic Events
The above calculation would be rather routine if it were not for the problem of non-independent basic events The fault tree for the surface system has nine basic events that are repeated They are failure of bull Pressure safety valve (PSV) bull Pressure vessel bull Level safety low (LSL) bull Atmospheric vessel bull Ventilation bull Pressure safety low (PSL) bull Temperature safety high (PSH) bull Motor Starter Interlock bull Containment
These particular basic events occur at more than one point in the fault tree This complicates the calculation because if the basic event occurs at one input with availability of failure qi then it must occur at all other locations with availability of 1 Similarly if it does not occur at one input with availability 1 - qi then it does not occur at all other locations with availability of 0
Consider a fault tree with one basic event q1 that is repeated The availability of the top event can be found using Bayes Theorem as
36
A(top event ) = q A (topevent q occurs )+ (1minus q ) A(top event q doesnt occur )1 1 2 1
q1 occurs ) can be found by forcing q1 = 1 and calculating the The term A(top event unavailability of the top event using the fault tree program In a similar fashion A(top event q1 doesnt occur ) can be found by forcing q1 = 0 and using the fault tree program
When nine repeated basic events occur the situation is somewhat more complicated Now one must consider all combinations of these nine events Since each event can occur or not occur there are 29 = 512 combinations In theory the program should be run 512 times In reality one can get a very good approximation by considering only ten of the 512 states These ten states are the following
State 1 No basic event failures exist or qi = 0 i = 1 9 State 2 rarr 10 One and only one basic event failure exists or
q1 = 1 qi = 0 i = 1 9 and i ne 1 q2 = 1 qi = 0 i = 1 9 and i ne 2 etc
Then the availability of the top event will be
9
all q = 0)A(top event ) = prod(1 = qi ) A(top event i i=1
9 9 +sumqi prod(1minus q j )A(top event all q = 0 except q = 1)j i
i=1 j=1 j ine
The terms that are neglected all have more than one factor of qi Since these terms are small the product of two or more of these terms is negligibly small
When the preceding calculation was done for the surface system a very small availability of the top event resulted (76times10-13) This is logical since any path through the fault tree from basic events to top event involves at least four or five failures with availabilities in the 10-3 or 10-4 range When these are processed through AND gates one winds up with (10-3 or 10-4)-m where m is 3 or 4
The subsea portion of the fault tree is somewhat simpler and represents more of a ldquoseriesrdquo type system where one or two failures can lead to the top event Even though individual availabilities of failure are relatively small because of the nature of the system and its fault tree the availability of the top event is 000618 This corresponds to about 50 hours
37
of outage per year In terms of events per year the top event would have a frequency of 116 failuresyear
It should be noted that compressors and pumps have high failure rates and contribute the most to the occurrence of the top event Containment is also a key since it strongly influences the occurrence of the top event
Failure of the SCADA System
Figure 14 shows the fault tree for a typical SCADA system as shown in Figure 2 Using failure rates and repair rates availabilities and unavailabilities can be found for each subsystem The communication network failure availability is from one operator The other availabilities are from SINTEF (1997) The availability of the top event (failure of the SCADA system) can be found by analyzing the fault tree diagram with the basic event data of Table 3 Calculating this value results in the availability of the top event (SCADA system failed) equal to 12times10-2 Note that the failure rate is dominated by the communication network
The low availability values for the SCADA system failure and the surfacesubsea failure makes it unlikely that these two events could occur simultaneously The overall availability of a surfacesubsea failure and a SCADA failure is about 83times10-4 If such an event took an average of one hour to repair this would lead to a failure rate of about 8300 failures106 hours or about one failure in 14 years
38
Failure of SCADA
Remote Comm PC Network (1) (2)
Scndry PrmryPC PC (3) (4)
A CompPLC (6)
Wst Ht PLC (8)
Alarm Turbine PLC PLC (10) (11)
Wtrfld PLC (13)
Turbine PLC (15)
VRU EmergPLC
LACT PLC
(9) (7) Filter PLC PLC(5) (16)
Well PLC (12)
Sfty SysPLC (14)
Figure 14 Fault Tree for Distributed Platform SCADA System
39
Table 3 Failure Data for Basic Events in SCADA Fault Tree
No Basic Events
Failure Rates of Basic Events (Failures per Year)
Repair Times for Basic Events (Repairs per Year)
Availability of Failure
1Remote PC 1075 21366 00005 2Comm System 1091 8760 001
3 4PC 1075 21366 00005 5-16PLC 118 79636 000015
Pipelines
Figure 15 shows the fault tree for a typical offshore pipeline as shown in Figure 5 The corresponding failure rate information is in Table 4
The pipeline failure rate is from the US Dept of Transportation (DOT 2000) In 14 years 2827 failures have occurred Average pipeline mileage is 154265 miles So one can conclude that 142827=202 failures per year By dividing 202 failuresper year by the average mileage we have 1310-3 failures per year per mile This number includes both offshore and onshore pipelines It also includes all types of failures The failure rate in Table 4 assumes a 30 mile pipeline The other numbers are from SINTEF 1997
For this failure data the probability of the top event (MTBF) is 67910-3 (failures per year) For the same data the unavailability of the system is 26710-2 Therefore the availability of the system is 09733
The SCADA system for a pipeline is generally less complicated than the distributed platform Nevertheless we can assume the reliability is probably about the same since the reliability of the platform system is dominated by the communication system
Table 4 Failure Data for Pipeline Fault Tree
No Basic Events
Failure Rates of Basic Events (Failures per Year)
Repair Times for Basic Events (Repairs per Year)
Availability of Failure
1Press Sensor 001 755 0117 2Shut-off Valve 003 10950 01169 3Pipeline 0039 183 012 4Valve 011 345 0026 5Pump 003 322 0094
40
Release of hydrocarbon
Failure of safety system
Pressure Sensor
(1)
Shut-off Valve
(2)
Failure of pipeline system
Pipeline (3)
Pump (5)
Valve (4)
Figure 15 Pipeline Fault Tree
Human Error
One of the most difficult tasks in a reliability study is to assess the relative importance of human error versus component failures One of the investigators on this project spent several years applying reliability techniques to electrical safety in underground coal mines In the course of analyzing historical data on safety it became clear that the majority of fatalities and lost-time injuries resulted from human error In fact human error was the source of two thirds of the fatalities and lost-time injuries
Data exist on the frequency of human error in common tasks found in an industrial environment (Henley and Kumamoto 1992 Shooman 1968) The fact that there is a high degree of automation in the operation should minimize the chance of human error
For the SCADA systems used in offshore platforms there is not much need for human actions The SCADA system can fail because of incorrect human action at the remote PC and one of the PLCrsquos shown as the fault tree in Figure 16 For each PLC the probability of checking the wrong indicator lamp on the local operator panel is 0003 (Henley and Kumamoto 1985) For the PC the probability of wrongly reading an indicator is 0001 (Henley and Kumamoto 1985) Using these numbers the human reliability in the SCADA system is 0999964 The human error probability is 1-0999964=35410-5
Since the system is highly automated the reliability number is considerably relevant
41
Human-induced Failure
of SCADA
Remote PC (1)
A CompPLC (3)
Wst Ht PLC (5)
Alarm Turbine PLC PLC (7) (8)
Wtrfld PLC (10)
Turbine PLC (12)
VRU LACT PLC (4)
EmergPLC (6)
Filter PLC Well PLC (9) PLC(2)
Sfty SysPLC (11) (13)
An area of future study should be to analyze significant failures to determine the relative influence of hardware failuressoftware failureshuman error
Figure 16 Human-induced SCADA Failure Fault Tree
Software Reliability
The software reliability was approached in a manner similar to that of the overall SCADA system The fault tree is the same as for the SCADA system (Figure 14) but with the failure information shown in Table 5
For each PC in the SCADA system there are 12266 failures per 106 hours According to OREDA (SINTEF 1997) 561 of these failures are due to software failures Thus one
42
can calculate 688 (12266561 =688) failures per 106 hours The MTTR for PCrsquos is 41 hours From this information the software availability is calculated as 099997
The failure rate compares in a similar way to digital controllers used in the nuclear industry which have a failure rate of 10-7 ndash 10-9
For each PLC there are 13483 failures per 106 hours Assuming 561 of these failures are due to software failures there are 756 (13483561=756) failures per million hours The MTTR for a PLC is 11 hours From this information the calculated software availability is 099999
For the routers the assumption is that 561 of the failures are software failures Communication link availability is assumed to be the same as for the analysis of the entire SCADA system
The overall availability of the software for the system is 09906 As with the previous SCADA system analysis communication links dominate the calculations
Table 5 Software-induced Failure Data for Basic Events in SCADA Fault Tree
No Basic Events
Failure Rates of Basic Events (Failures per Year)
Repair Times for Basic Events (Repairs per Year)
Availability of Failure
1Remote PC 0060 21366 000003 2Comm System 1091 8760 001
34PC 0060 21366 000003 5-16PLC 0066 79636 000001
Operator Reliability Experience
All of the operators indicated that distant network communications is the weak link in all of their systems The conversion of analog microwave to a digital microwave network that has a loop architecture has helped in this regard Nevertheless the operators program their systems to reliably function even when communications are disrupted
In the electronic control system the end devices (sensors actuators) are the most unreliable parts The PLC rarely fails For example one operator with 200 PLCs had one PLC processor failure in 10 years
In general operators were reluctant to share their operational reliability information
43
Summary of Reliability Analysis Results
System Surface Subsea SurfaceSubsea SCADA (Platform Pipeline) SurfaceSubseaSCADA Pipeline Human Error Software
MTBF (years) Failure Availability 25times108
086 086 009 14
00068 NA
0095
76times10-13
000618 000618 0012
000083 0027
0000035
00094
human error probability
Software Quality
According to the surveyed operators software products are selected for offshore platform and pipeline systems based on many of the following features bull Operating system supported (Windows NT or UNIX) bull Range of supported PLCDCSRTU vendors and communication protocols bull Ease of modification bull Intranet Web bull DDE interface bull Alarming bull Historical trending bull Built-in diagnostics
Many of the offshore operators use Wonderware InTouch because it is easy to learn and modify it also supports a large number of PLC and RTU vendors Rockwell Software is another leading vendor Others include Intellution Siemens GE Fanuc and CiTech In addition users and third parties often develop interfaces for special or obscure equipment
Vendors and operators are always reluctant to share defect data software companies are no different Thus in order to gain an alternate appreciation of software quality and reliability we also chose a qualitative and more subjective approach We requested an interview of the major software vendors to discuss their software development and maintenance processes including quality assurance (QA) We assured them that no comments would be attributed to a specific source but that we whould share summary information and highlight best practices again in a non-attributional fashion A questionnaire was developed based on the Software Engineering Institutes Software Capability Maturity Model (Humphrey and Sweet 1987) and on industrial software supplier evaluation processes (Nielsen and Miller 1996) The questionnaire was provided
44
to the vendors prior to the interview The complete questionnaire is included in Appendix A
Software Survey Results
Software products included control software and human-machine interface software Typically development teams are small in size and focus on a particular aspect of the total software package The total software products are large (15 ndash 2 Million Lines of Code)
The following contains a list of best practices and a list of deficiencies which were found No single company performed all of the best practices no single vendor had all of the noted deficiencies Those software development teams with established engineering roots in the company seem to have the best processes Smaller software-only companies tend to have less well-defined processes and operate more on an ad hoc basis However as those companies addressed the issue of multiple releases and long-term maintenance they have instituted additional processes and some have utilized third-party vendors for maintenance and configuration management
Best practices noted among the interviewees were
bull A defined software process that is utilized throughout the organization The process does not need to be cumbersome or labor-intensive in fact some of the best were quite streamlined the important aspect is that the process was consistently applied Training in the process for new hires was also noted as a best practice
bull Migration to a common software infrastructure Several of the vendors are developing a framework into which existing components (either in-house or from other vendors) can be ldquopluggedrdquo This allows for shared components reducing development time and redundancy of information
bull Frequent solicitation of customer input requirements and satisfaction through well-defined channels The best vendors had a formal mechanism by which they could learn of new customer expectations as well as problems and issues
bull On-line sites for customer access of updates issues and information Many have websites for customers One vendor moderates a website in which customers provide feedback and carry discussion threads on various topics of interest
bull Software teams which included staff with industrial experience using SCADA equipment (the highest percentage found was 15) These individuals tended to serve as application engineers and product architects rather than as programmers or testers
bull Reviews at various phases of development that include participants from other development teams as well as test and QA
bull Previews or ldquolook-aheadrdquo meetings that bring together software architects and application engineers to determine risks and potential pitfalls of next phase of development
bull Concern for documentation ease of use by customeroperator bull Independent test teams with separate reporting relationship from development team
45
Deficiencies noted include
bull Ill-defined software development processes or multiple processes that vary from team to team
bull Conducting reviews in which not all parties have examined the material in advance or in which not all perspectives are present
bull Lack of formal regression testing procedures and test suites bull Lack of emphasis on failure scenario tests bull Lack of concern for intrusion detection capability
Lastly while vendors stated that they had requirements for safety reliability quality and real-time operation no one shared specific quantifiable requirements This is an area for further exploration
46
Recommendations
Based on the reliability assessment of current SCADA technology we propose the following additional guidelines for those operators that use SCADA systems These are in addition to the guidelines in NTL N00G06 (effective February 4 2000) bull All developed software for SCADA systems should follow a defined software
process that process does not necessarily need to be an SEI or ISO or IEEE standard although those may be applicable This recommendation applies both to software developed by the vendors and application-specific software developed by the operatorsvendorscontractors
bull Software should also be tested for survivability under typical intrusion mechanisms such as buffer overrun If the software contains embedded third-party components those components should be thoroughly tested within the total system This includes testing of ldquonegative requirementsrdquo that is testing of features of the embedded component that should not be activated in the larger framework
bull Critical parts of the system such as the emergency shutdown system should be redundant For subsea systems the communication channels should be redundant
Other recommendations bull MMS should organize a project to collect failure data that is not covered by current
SINTEF projects Specifically operators in the OCS of North America should be surveyed to collect data on pneumatic safety systems pipeline system components and human operators This project should be organized like the SINTEF projects
bull MMS should survey offshore platform operators concerning their long-term plans about remotely operating offshore platforms from the shore
bull MMS should require a reliability assessment of complete subsea processing systems
47
References
API 1998 Recommended Practice 14C sixth edition March 1998 Recommended Practice for Analysis Design Installation and Testing of Basic Surface Safety Systems for Offshore Production Platforms
ARC Advisory Group 1999 Oil amp Gas Water SCADA Systems Global Outlook ARC Advisory Group Dedham MA 399
Bellcore 1992 Reliability Prediction for Electronic Equipment Report TR-NWT-000332 Issue 4 September
Billinton R and RN Allan 1992 Reliability Evaluation of Engineering Systems Concepts and Techniques 2nd Ed New York Plenum Press
DOD (US Department of Defense) 1991 Reliability Prediction of Electronic Equipment Mil-Handbook-217F New York Griffiss Air Force Base December
DOT ( US Department of Transporation) Office of Pipeline Safety 2000 Pipeline Statistics Web page address httpopsdotgovstatshtm
Gertman and Blackman 1994 Human Reliability and Safety Analysis Handbook New York Wiley
Henley EJ and H Kumamoto 1985 Designing for Reliability and Safety Control New Jersey Prentice-Hall Inc
Henley EJ and H Kumamoto 1992 Probabilistic Risk Assessment New York IEEE Press
Humphrey W and W Sweet 1987 A Method for Assessing the Software Engineering Capability of Contractors Tech Report CMUSEI-87-TR23 Pittsburgh Software Eng Inst
IEEE (Institute of Electrical and Electronics Engineers) 1983 IEEE Guide to Collection and Presentation of Electrical Electronic and Sensing Component and Mechanical Equipment Reliability Data for Nuclear Power Generating Stations Std 500-1984 New York IEEE
ISA (Instrument Society of America) 1998 ldquoSCADA Software Rounduprdquo Industrial Computing 17 18-37 October
Mitchell CM and K Williams 1993 ldquoFailure Experience of Programmable Logic Controllers Used in Emergency Shutdown Systemsrdquo Reliability Engineering and System Safety 39329-331
48
Musa JD A Iannino and K Okumoto Software Reliability Measurement Prediction Application McGraw-Hill 1987
Neilsen J and A Miller 1996 ldquoSelecting Software Subcontractorsrdquo IEEE Software 104-109 July
Paula HM 1993 ldquoFailure Rates for Programmable Logic Controllersrdquo Reliability Engineering and System Safety 39325-328
Paula HM MW Roberts and RE Battle 1993 ldquoOperational Failure Experience of Fault-tolerant Digital Control Systemsrdquo Reliability Engineering and System Safety 39273-289
Paulk M B Curtis M Chrissis C Weber 1993 Capability Maturity Model for Software Version 11 Tech Report CMUSEI-93-TR-24 Pittsburgh Software Eng Inst
RAC (Reliability Analysis Center) 1995 Nonelectronic Parts Reliability Data 1995 Rome N Y Reliability Analysis Center
Shooman Martin L Probabilistic Reliability An Engineering Approach McGraw-Hill New York 1968
SINTEF 1997 OREDA - Offshore Reliability Data 3rd Edition SINTEF Industrial Management Trondheim Norway
USNRC (U S Nuclear Regulatory Commission) 1975 Reactor Safety Study An Assessment of Accident Risks in US Commercial Nuclear Plants NUREG-75014 USNRC Report WASH-1400 Washington DC USNRC October
USNRC 1980 Data Summaries of Licensee Event Reports of Diesel Generators at US Commercial Nuclear Plants NUREGCR-1362 Washington DC USNRC March
USNRC 1982a Data Summaries of Licensee Event Reports of Pumps at US Commercial Nuclear Plants NUREGCR-1205 Washington DC USNRC January
USNRC 1982b Data Summaries of Licensee Event Reports of Valves at US Commercial Nuclear Plants NUREGCR-1363 Washington DC USNRC October
USNRC 1993 Software Reliability and Safety in Nuclear Protection Systems NUREGCR-6101 Washington DC USNRC
Wheeler DA B Brykczynski and RN Meeson (eds) 1996 Software Inspection An Industry Best Practice New York IEEE Press
49
50
Appendix A
SCADA SOFTWARE QUESTIONNAIRE
University of Missouri ndash Rolla for
Department of the Interior MMS Technology Assessment and Research Program SOL 14335-01-99-RP-3995
Survey Participants
Senior Executive (30 minutes) SCADA product development manager (60 minutes) SCADA product marketing manager (60 minutes) QA manager or a QA engineer (60 minutes) Team meeting with a developer a tester and a configuration manager (60 minutes)
Questions
General Management
What is the vision of the company How do the communications control and SCADA products fit within the companys product line With regard to communications control and SCADA applications does the company produce software only or systems of software and hardware What levels of the organization have direct customer contact If individuals do not have direct customer contact who internally serves as their customer interface Who internally serves as customer advocate How is customer satisfaction measured (all measures that apply)
SCADA Software Process Information Personnel
What is the size of the software team What percentage are developers Testers Other team members How many have had industrial experience using SCADA equipment (Numbers or percent of total) What training is provided to new hires (General andor SCADA-specific) Is there an annual training goal Is it a mandate an opportunity or something in between Is there a training course or program for new managers If so what topics
51
SCADA Software Process Information Requirements and Configuration Management
How are customer requirements determined How are product requirements determined What quantifiable requirements exist for Safety Reliability Quality Real-time Operation How are requirements tracked throughout the product development life cycle How are releases determined and how is functionality assigned to releases How are releases managed How are customer-reported defects fixed (Work-around patches andor new releases)
SCADA Software Process Information Development
What automated tool support is used Is any of the communicationscontrolSCADA software externally supplied If so subcontract development or COTS product
SCADA Software Process Information Test and Quality Assurance
What internal reviews and audits are regular activities (SEI CMM ISO etc) What standard reviews and audits are regular activities (SEI CMM ISO etc) For each of these what is the periodicity of reviewaudit How are defects identified fixed tracked and verified Is the test team independent of the development team What is the reporting relationship of the test team relative to the development team What levels and types of testing are performed How are fail-safe requirements if any tested How are real-time requirements if any tested Who approves product releaseshipment On what basis If a customer purchases your software product what if any are the stated liabilities
52
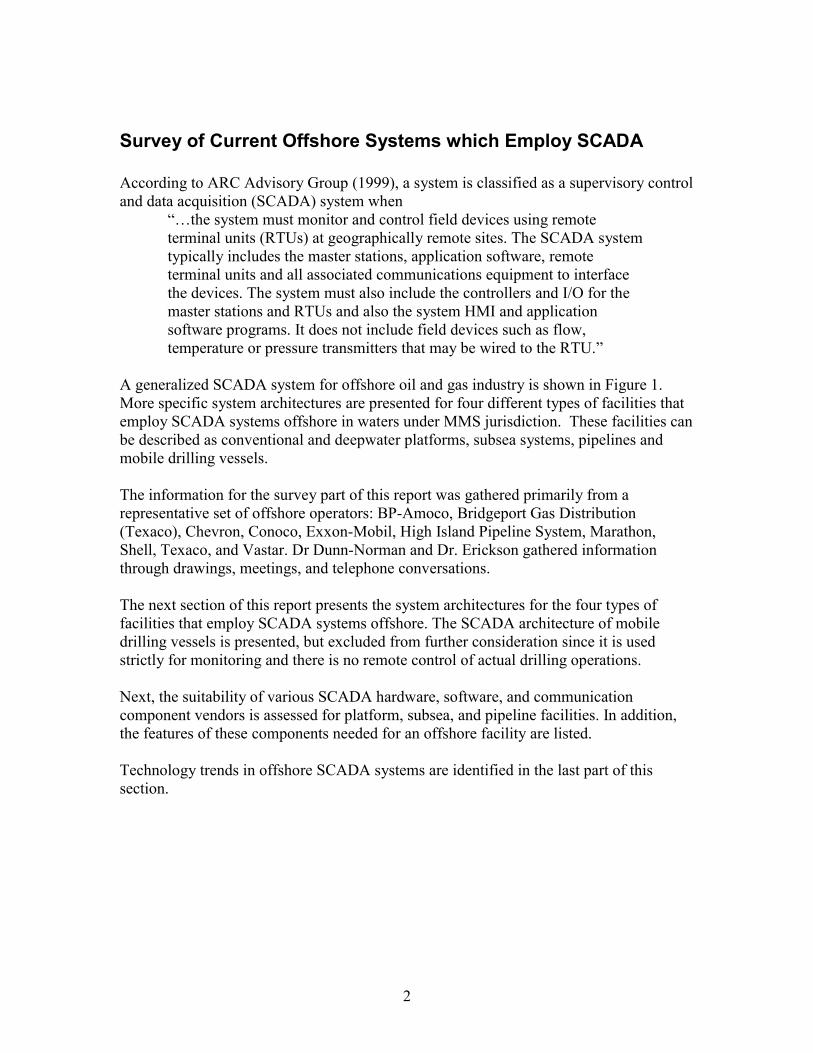
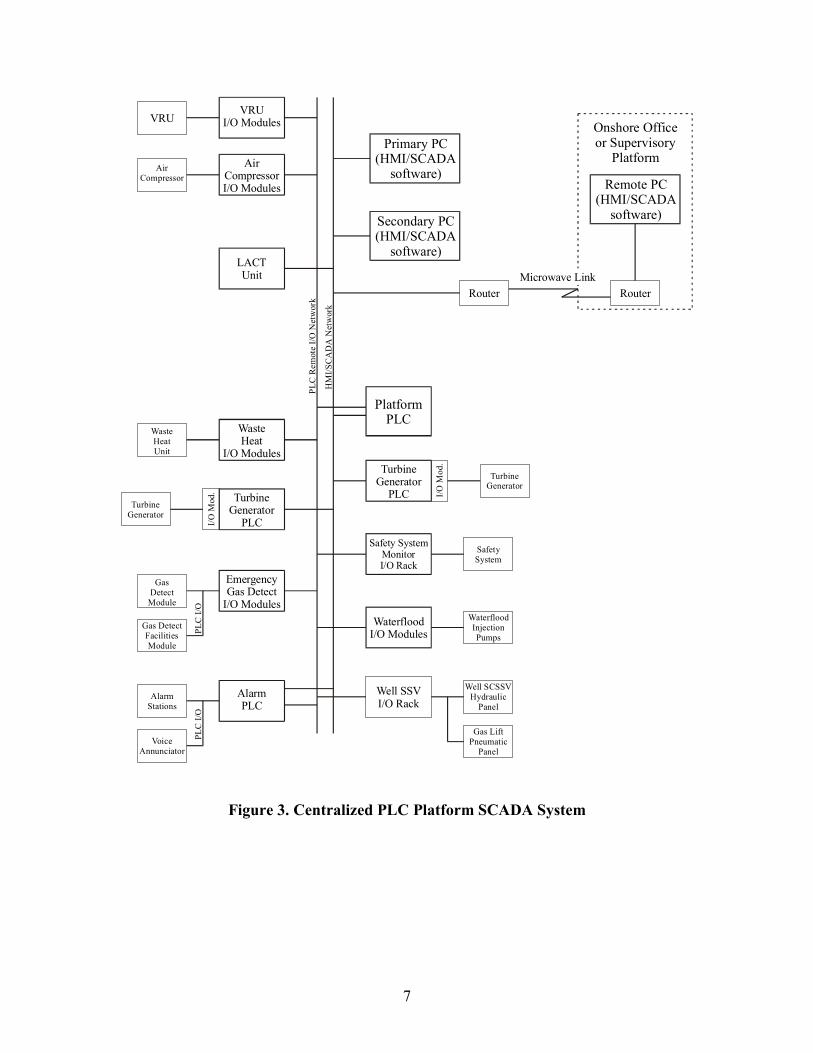

Onshore Office
Comm Data Historian Interface Archival
Mobile Drilling Units
Offshore drilling vessels include jackup rigs semi-submersibles and drillships Jackups rest on the seafloor and are restricted for the most part to waters less than 400 ft Semi-submersibles and drillships are floating rigs and they are the main units for drilling in deeper waters
The floating drilling units must maintain their position over the drilling location Typically the units use a combination of dynamic positioning and spread mooring In deepwater only dynamic positioning is used
Dynamic positioning requires a constant monitoring of sea and wind conditions to coordinate and control the thrusters used to keep the drilling vessel on location Dynamic positioning is a critical function necessary to keep the vessel on station
During the drilling operation measurement while drilling (MWD) data mud logging data drill steam test data and mud properties are measured at regular intervals
In this study it was determined that SCADA systems are only being used on the most advanced mobile drilling vessels and that these systems are used to report drilling data back to an onshore office location as shown in Figure 6 No drilling vessels allowed or provided for remote control of actual drilling operations or positioning of the rig
Figure 6 Mobile Drilling Unit SCADA System
11
Vendor Suitability for Offshore Systems
In this section the vendors of components used in offshore oil and gas SCADA systems are listed along with the type of component used in the three applications The types of products are listed for each vendor and then the product features that are needed in offshore applications are listed
The three main categories of components that comprise a SCADA system are hardware software and communications Among the vendors no one seems to support both short-distance (local-area networks) and long-distance (eg satellite microwave) communications Therefore communication components are divided into two categories leading to the following four categories of SCADA system components
bull Hardware ndash programmable logic controllers (PLCs) remote terminal units (RTUs) and distributed control systems (DCSs)
bull Software ndash SCADA software package consisting of the database human-machine interface (HMI) alarm management and data historian communication drivers object linking and embedding for process control (OPC) modules and the operating system
bull Short-distance communication networks ndash local-area networks (eg Ethernet Modbus) remote IO networks and control networks at the remote units
bull Long-distance communication networks ndash satellite microwave telephone and radio communication including modems if distinct from other hardware components (eg PLC)
Vendors for the computers that execute the software are numerous and so are not considered in this report
According to existing SCADA system surveys (ARC Advisory Group 1999 ISA 1998) there are currently about 30 vendors of SCADA hardware and software and another 10 vendors of just SCADA software These lists were narrowed to only include vendors involved in offshore oil and gas operations In addition after visiting offshore operators some vendors were added to the list Information was acquired from the following operators BP-Amoco Bridgeport Chevron Exxon-Mobil High Island Pipeline Marathon Shell Texaco and Vastar
Vendor suitability for each of the three types of facilities is summarized in Table 1 For each vendor the types of components supported for each of the three types of facilities is shown by a letter as follows
H ndash hardware S ndash software L ndash local-area network D ndash distant network (eg satellite microwave)
For example a vendor that only supplies RTU hardware is shown as ldquoHrdquo where a vendor that sells hardware software and local-area networks is shown as ldquoHSLrdquo In addition
12
some vendors marked with () have products suitable in offshore oil and gas SCADA systems but were not indicated by the surveyed operators
Table 1 Summary of Vendor Suitability for Each Type of Offshore Facility
Vendor Platform Subsea Pipeline ATampT Clearlink D D Bailey H Chevron WinSCADA S Cisco D CI Technologies () S S Daniel Industries H H Datacom D D Data-Linc Group D Elliott H H Flow Automation H H GEFanuc HLS HS Halliburton H Hewlett-Packard S Iconics () S S Intellution () S S Kongsberg Offshore as HL Moore Products HS New Bridge D D Oilfield Systems Inc S S RealFlex Systems S Rockwell Automation HSL HL H Schneider Automation (Modicon Square D) HL H
ShellBPAmoco D D Siemens HL Stratacom D D Teledyne Brown () H H Texaco RTU H Tokheim Corp H H VSAT D D Wonderware S S S
The products and services from each of the vendors listed in Table 1 are ATampT Clearlink ndash satellite dish transponder Baileyndash Net 90 distributed control system Chevron WinSCADA ndash In-house SCADA software Cisco ndash Communication network routers long-distance network switch
13
CI Technologies ndash Citect HMI package drivers for many PLC and RTU vendors Daniel Industries ndash remote terminal unit Datacom ndash digital microwave network provider loop topology provides 2 paths to
onshore Data-Linc Group ndash Ethernet radio modems Elliott ndash remote terminal unit Flow Automation ndash remote terminal unit GEFanuc ndash H Series 90-30 and 90-70 PLCs the 90-30 often used in place of
traditional RTUs L Ethernet Series Ninety Protocol (SNP) S ndash Cimplicity HMI package
Halliburton ndash GFC-332 flow computer (RTU) Hewlett-Packard ndash RTAP HMI software Iconics ndash Genesis32 HMI package drivers for many PLC and RTU vendors Intellution ndash Fix Dynamics HMI package drivers for many PLC and RTU
vendors Kongsberg Offshore as ndash subsea control equipment packages Moore Products ndash APACS distributed control system New Bridge ndash digital multiplexer to microwave Oilfield Systems Inc ndash Plant Information (PI) data archival software RealFlex Systems ndash SCADA software Rockwell Automation ndash H PLC-5 and SLC-500 PLCs the SLC-500 often used in
place of traditional RTUs L Ethernet ControlNet Data Highway+ Remote IO S RSView HMI package drivers for non-RA equipment though not as many as Wonderware
Schneider Automation ndash H Modicon and Square D PLCs often used in place of traditional RTUs L Modbus Modbus+ SyMax networks
ShellBPAmoco ndash digital microwave network Siemens ndash H 505-series (ex-Texas Instruments) PLCs L Ethernet TIWAY
Profibus-DP Stratacom ndash long-distance network switch Teledyne Brown ndash remote terminal unit Texaco RTU ndash In-house RTU Tokheim Corp ndash remote terminal unit VSAT ndash satellite communications provider Wonderware ndash InTouch HMI package drivers for most PLC and RTU vendors
special drivers are often developed by users and third parties
Offshore SCADA System Features
The hardware software and communication features needed for offshore facilities were determined from prior knowledge and refined based on information from the surveyed operators Note that the lists are representative and many operators do not consider all of the features in any given list In addition most companies standardize the hardwaresoftwarecommunication vendor selection The most common choices are
14
Hardware ndash Rockwell Automation (Allen-Bradley) PLC-5 and SLC-500 Software ndash Wonderware InTouch Communication ndash DataCom or ShellBPAmoco digital microwave system
Hardware Features
According to the surveyed operators hardware products are selected for offshore platform and pipeline systems based on many of the following features
bull Proven reliability bull Ease of maintenance bull Ease of modification bull Discrete and analog IO bull Ruggedized bull Division 2 environment bull Intrinsically safe bull Redundancy (though a minority of operators use this feature)
The desired features of subsea systems are considered separately since the environment for these systems is very different from platform and pipeline systems
bull Proven reliability bull Ruggedized bull Redundancy
Communication Features
According to the surveyed operators communication products are selected for offshore systems based on the following features
bull Redundancy bull Ease of modification bull Supported protocols (most popular Ethernet Data Highway+)
Software Features
According to the surveyed operators software products are selected for offshore platform and pipeline systems based on many of the following features
bull Operating system supported (Windows NT or UNIX) bull Range of supported PLCDCSRTU vendors and communication protocols bull Ease of modification bull Intranet Web (firewall to outside of company) bull Alarming bull Historical trending bull Built-in diagnostics bull Reliability
15
Many of the offshore operators seem to use Wonderware InTouch because it is easy to learn and modify and it supports a large number of PLC and RTU vendors In addition users and third parties often develop interfaces for special or obscure equipment
Technology Trends
As a result of gathering the information for this report from offshore operators the following technology trends in SCADA systems for offshore oil and gas facilities were identified
bull Replacement of pneumatic safety systems with electronic safety systems According to the operators that have been using electronic safety systems electronic systems are much more reliable and require less maintenance
bull Remote terminal units (RTUs) replaced by programmable logic controllers (PLCs) The PLC hardware and software is easier to modify
bull Remote operation of platforms One operator (Chevron) operates many of the platforms from onshore Another operator (Texaco) only operates the platforms from onshore when the platforms have been evacuated due to storm conditions Many operators are reluctant to operate platforms from onshore but with increasing demands to cut costs removing personnel and remotely operating platforms is one means to that end Preliminary guidelines for remote startups and remote operations are currently being formulated as a result of this trend
bull Use of Windows NT operating system This seems to be nearly universal
bull Use of commercial off-the-shelf (COTS) hardwaresoftware Most operators do not have the resources to support in-house product development Most of them are phasing out the systems developed in-house
bull Use of integrated software architectures One of the best practices cited in the software reliability (below) is the development of a common software framework that will support multiple software components in a seamless manner
16
Reliability of Offshore SCADA Systems
The reliability of the complete SCADA system (hardware software and communication network) was estimated The outcome of this reliability assessment provides
bull Mean time between failures (MTBF) bull System availability bull Probability of facility damage or pollution release
The above was estimated for the platform subsea and pipeline systems
As the study progressed we found that vendors would not divulge reliability information about their products Therefore reliability information from SINTEF (1997) was used to assess the reliability of the offshore systems Since SINTEF (1997) does not cover software or human-induced failures other data sources were used to estimate the reliability for these failures Redundancy for subsea systems was considered
The types of failures included bull Hardware failures bull Software failures bull Human-induced failures bull Communication link failures bull Fireexplosion
Fault Tree and Reliability Analysis
The reliability assessment of current SCADA technology has two major directions
1 Calculation of a reliability index for the SCADA system as a whole including sensors modems communications channels servers and the SCADA workstation The form of this index is the system unavailability
2 Calculation of the probability of a top event during a given year This top event is facility damage or a significant oil spill
The calculations are relatively simple if the system is a series system in a reliability sense This is true of many electronic or mechanical systems Once the reliability performance of each component in the chain is found the overall system performance is easily calculated For instance if the availability of each component of the system can be found the overall system availability is just the product of the component availabilities Similar relatively simple calculations can be done to find the probability of system
17
failure or the mean time between system failures For instance if λi i = 1 n are the n component failure rates then the system failure rate is
λ = sum n
λisystem i=1
The system reliability assuming constant failure rates and no repair is
systemtR(t) = e minusλ
The system mean-time-to-failure is
1MTTF = system λsystem
The component availabilities can be found if the constant repair rates for the n components are known to be micro i i = 1 n In that case the availability of the ith component is
micro i MTTFAi = = λi + micro i MTTF + MTTR
and the system availability is
n
Asystem = prod Ai i=1
The latter calculation is more challenging but it contains the most pertinent information
Most systems however are not simple series systems and therefore more powerful techniques such as fault tree analysis must be used
Probabilistic risk assessment (PRA) was used to assess the effect of contributing events on system-level reliability tree (Billinton and Allan 1992 Henley and Kumamoto 1992) Probabilistic methods provide a unifying method to assess physical faults contributing effects human actions and other events having a high degree of uncertainty The PRA was performed using fault tree analysis The probability of various end events both acceptable and unacceptable is calculated from the probabilities of the basic initiating failure events
The fault tree model serves several important purposes First the fault tree provides a logical framework for the failure analysis and precisely documents which failure scenarios have been considered and those that have not Second the fault tree is based on well-defined Boolean algebra and probability theory The fault tree shows how events combine to cause the end (or top) event and at the same time defines how the probability of the end event is calculated as a function of the probabilities of the basic events Thus
18
the fault tree model can be easily changed to accommodate systems consisting of components from one vendor as well as components from mixed vendors (eg software vendors and hardware vendors) The fault tree analysis also illuminates the ldquoweak pointsrdquo in the design which will be used to assess trade-offs and to generate recommendations to oil and gas operators
In order to illustrate the concept it will be assumed that a simple SCADA system can be represented as shown in Figure 7
9
Actuator
11
10 SCADA
Comm Link 2 Server
Comm Link 1
System Leak
Sensor
Sensor
Safety Valve 1RTU
2RTU
2 3 41
5 6 7
8
Figure 7 Simple SCADA System
Suppose now we postulate the top event to be a system leak that is not mitigated by action of the safety shut off valve The fault tree diagram for this system would look like Figure 8
19
G1
+
7
1 32 4 5 6 10 91 112 3 4 1 2 3 4 11 8
+ ++
G2 G3 G4
Figure 8 Fault Tree for Simple SCADA System
G1 ndash Failure to close safety valve in the presence of an oil leak G2 ndash Failure to sense an oil leak G3 ndash Failure to sense state of an open safety valve G4 ndash Failure to close the safety valve
Basic events ndash q1 ndash Failure of the SCADA system q2 ndash Failure of the communications link 2 q3 ndash Failure of the server q4 ndash Failure of communications link 1 q5 ndash Failure of RTU2 q6 ndash Failure of the leak sensor q7 ndash Failure of the system an oil leak q8 ndash Failure of the safety valve to close q9 ndash Failure of the actuator to close the safety valve q10 ndash Failure of the safety valve position sensor q11 ndash Failure of RTU1
20
G1
1 32 4 5 6 10 9 11 8
+
G5
7
This is an example fault tree diagram If the safety valve is a fail-safe type valve the state G4 is not a factor If the SCADA system is designed to close the safety valve regardless of how its state is sensed then state G3 is not a factor either
The simplest approach to solving for the availability of the top event is to draw a reduced fault tree Since the intermediate states G2 G3 and G4 are all the outputs of OR gates and they all feed into an OR gate the four OR gates can be replaced by a single OR gate with all the basic events except number 7 as inputs The new reduced fault tree is as shown in Figure 9
Figure 9 Reduced Fault Tree for Simple SCADA System
G5 - Failure of SCADA system or safety value
The availability of state G5 is A(top event ) = q A topevent q occurs )+ (1minus q ) A(top event q1 doesnt occur )1 ( 1 2
The availability of this top event is
21
11 A G1 = q7 1minusprod 1minus qi( ) ( ) i=1 ine7
Failure Probability for Hardware Components
The key source of offshore failure data for this study is SINTEF 1997 Several databases and handbooks exist to help with the estimation of failure probabilities for basic events (Bellcore 1992 DOD 1991 Gertman and Blackman 1994 RAC 1995) Within the nuclear engineering community failure data for nuclear-specific systems and components are available from several sources including summaries of licensee event reports (USNRC 1980 1982a 1982b) and other handbooks (IEEE 1983 USNRC 1975)
Development of the SurfaceSubsea Fault Tree
The development of the surface system fault tree was built on the Safety Flow Chart-Offshore Production Facility which appears in Figure 10 (Figure 3-1 of the API Recommended Practice 14C sixth edition March 1998) The subsea portion of the fault tree was developed using the generalized subsea architecture shown in Figure 4
The failure rates repair times and calculated availabilities for the surface system are shown in Table 2 The overall surface fault tree is shown in Figure 11 It should be noted that the failure rates in Table 2 are derived from more detailed drawings of the process equipment and may represent overall subsystems including controls Most of the failure rates in Table 2 is derived from SINTEF (1997)
The first column in Table 2 contains the event numbers (in the circles) that appear in the fault tree of Figure 11 A short description of the system component that fails occurs in the second column The third column has the failure rate in failures per year This column is derived from the SINTEF (1997) tables which have the failure rate in failures per million hours The fourth column contains the time to repair in repairs per year and is calculated by dividing the number of hoursyear (8760) by the hoursrepair from SINTEF (1997) The availability the last column is obtained by dividing the third column by the sum of the third and fourth columns
22
Paste figure here
Figure 10 Safety Flow Chart for Offshore Production Facility (from API RP 14C)
23
Table 2 Failure Data for Basic Events in Surface System Fault Tree
No Basic
Failure Events
Failure Rates of Basic Events
(Failures per Year)
Repair Times for Basic Events
(Repairs per Year) Availability of
Failure 1TSE (Temp Safety Element) 0068 43800 00000016 2ESD (Emerg Shut Down) 0092 2623 000035 3Air 1 4ASH (Gas Detector) 0042 151034 0000028 5Vent 018 730 000025 6Containment 00004 5214 00000077 7Containment 00004 5214 00000077 8ESD (Emerg Shut Down) 0092 2623 000035 9PSL (Pressure Safety Low) 02 7552 000026
10FSV (Flow Safety Valve) 28 58013 00048 11LSL (Level Safety Low) 101 11089 000091 12LSH (Level Safety High) 101 11089 000091 13Pressure Vessel 02 10318 000019 14Accident 00004 2 000005 15Compressor 47 15587 0029 16Pump 26 2163 0012 17Heat Exchanger 00034 11188 000003 18Vessel 047 84231 000056 19Valves 283 34488 00081 20Pressure Vessel 02 10318 000019 21PSH (Pressure Safety High) 02 7552 000026 22PSV (Pressure Safety Valve) 195 3449 00056 23Pump 141 2177 00064 24Flowline 00045 6126 00000073 25Compressor 998 13508 0069 26Heat Exchanger 0018 656 000027 27Ventilation 018 730 000025 28PSV (Pressure Safety Valve) 195 3449 00056 29Atmospheric Vessel 0009 8423 0000011 30LSL (Level Safety Low) 101 11089 000091 31Pressure Vessel 02 10318 000019 32Atmospheric Vessel 0009 8423 0000011 33Pressure Vessel 02 10318 000019 34PSL (Pressure Safety Low) 02 75517 000026 35Ventilation 018 730 000025 36PSV (Pressure Safety Valve) 195 3449 00035 37Atmospheric Vessel 0009 8423 0000011 38Reboiler 0009 8423 0000011 39FSL (Flow Safety Low) 0024 14600 00000016 40TSH (Temp Safety High) 0068 43800 00000016 41Reboiler 0009 8423 0000011 42LSL (Level Safety Low) 0053 11089 0000048
24
43TSH (Temp Safety High) 0068 43800 00000016 44TSH (Temp Safety High) 0068 43800 00000016 45Pressure Vessel 02 10318 000019 46Compressor 61 2218 0027 47Fuel Control 007 8505 0000082 48TSH (Temp Safety High) 0068 43800 00000016 49TSH (Temp Safety High) 0068 43800 00000016 50IPM (Ignition Prev Measures) 0042 151034 0000028 51Flame Emission 0083 2163 000038 52PSL (Pressure Safety Low) 0011 75517 0000015 53Motor Starter Interlock 013 2163 00006 54Spark Emission 876 8760 0001 55Arrestor 00088 365 0000024 56BSL (Burner Safety Low) 0069 13477 0000051 57Fuel Gas Supply 007 8505 0000082 58PSL (Pressure Safety Low) 0011 75517 0000015 59Air Supply Control 0083 2163 000038 60PSL (Pressure Safety Low) 0011 75517 0000015 61Motor Starter Interlock 013 2163 00006
25
Facility Damage Or Leak
Air (3) A
Excess Fuel
B
Fire or Explosion TSE
(1) ESD (2)
Ignition
I Pollution
Intermediate State
I ASH (4)
Vent (5)
Cont (6) Cont
(7) ESD (8)
Intermediate State
Figure 11a Top Fault Tree for Damage or Leak
26
I
Intermediate State
Release of Hydrocarbons
PSL (9)
FSV (10)
LSL (11)
Overflow Process EquipmentFailure
LSH (12)
P Ves (13)
Accidnt (14) C
Excess Temperature
at Component
Mechanical Deterioration O
Overpressure
D
Underpressure
Comp Pump (16)
Valves (15)
Ht Ex (17) (19)
Vessel (18)
Figure 11b Intermediate State Fault Tree
27
Pump (23)
Overpressure
O
Comp (25)
Flwlin (24)
Ht Ex (26)
PSH (21)
G P Ves (20) PSV
(28) G
A Ves (29) PSV
(22) Vent (27)
Gas Blow by Gas Blow by
LSL (30)
P Ves (31)
A Ves (32)
Figure 11c Overpressure Fault Tree
28
D
Underpressure
P Ves (33)
PSL (34)
Vent (35
PSV (36)
A Ves (37)
Figure 11d Underpressure Fault Tree
29
Excess Temperatureat Component
C
Low Flow Limited Heat Low Level Excess Fuel Transfer
(38) (39) (40) Reblr FSL TSH TSH
(44) P Ves
(45) Comp
(46)
Reblr (41)
LSL (42)
TSH (43)
Fuel C (47)
TSH (48)
TSH (49)
Figure 11e Excess Temperature at Component Fault Tree
30
A
Ignition
IPM (50)
Flame (51)
PSL (52)
M Str (53)
Spark (54)
Arstr (55)
Figure 11f Ignition Fault Tree
31
B
Excess Fuel
BSL (56)
BSL (58)
Fuel (57)
Air Ctl (59)
M Str (61)
PSL (60)
Figure 11g Excess Fuel Fault Tree
32
The subsea portion of the fault tree was developed using the generalized subsea architecture shown in Figure 4 The control systems controlling single satellite wells and more complex subsea production facilities such as multi-well manifold template systems can be broken into subsystems as shown in Figure 12
Failure modes for the subsystems shown in Figure 12 include Electrical Power Failure - Pod (EFP) Hydraulic Power Failure - Connector (HFC) Hydraulic Power Failure - Line (HFL) Hydraulic Power Failure - Pod (HFP) Signal Transmission Failure - Connector (SFC) Signal Transmission Failure - Line (SFL) Signal Transmission Failure - Pod (SFP) Signal Transmission Failure - Surface (SFS)
These failure modes are independent events represented as ldquoORrdquo gates on a fault tree Ultimately however these ldquoORrdquo gates are combined because any one fault causes complete system failure
The block diagram of the subsea control subsystems shown in Figure 12 illustrates the flow of electrical power hydraulic and communications signals that could lead to a critical failure It should be noted that this is essentially a series system from a reliability point of view (any failure leads to system failure) There are two areas where redundancy occurs (1) the redundant subsea control modules at either the well or the subsea manifold and (2) the redundant PLCs at the host facility In both cases the failure of the redundant set is considered the basic event and the failure rate is selected accordingly With these assumptions the fault tree will consist of only basic events ldquoORrdquo gates and derived states including the top event
It should also be noted that three basic events are actually combinations of two or more fundamental events (1) the electrical power failure of the pod (EFP) could be either a short circuit at the pod connector or a general electric failure in the subsea control unit (2) the signal transmission failure in the line (SFL) could be either a blocked or plugged sensor or a faulty signal line (3) the signal transmission failure at the pod (SFP) could be either a pilot valve control failure or a subsystem faulty signal
Using the block diagram in Figure 12 the fault tree diagram in Figure 13 can be drawn In this fault tree diagram hydraulic failures (HFC HFL or HFOP) and signal failures (SFP SFC or SFL) can occur for any of the n satellite wells In addition signal failures on the surface (SFS) can occur for any of the m group controls Once again the failure rates used account for this fact (Effective failure rate equals n or m times component failure rate)
33
Topside
Hydraulic power unit
Hydraulic Lines surface
termination
Electric power unit
Electric Lines surface
termination
Electric Lines
Electric Lines subsea
termination
Electric template
trunk lines
Surface control unit
Signal Lines surface
termination
Signal Lines
Signal Lines subsea
termination
Signal template
trunk lines
Control pod electronics
Um
bilic
al
Hydraulic Lines
Hydraulic Lines subsea
termination
Hydraulic template
trunk lines
Control pod hydraulics
Baseplate
Control Pod
Figure 12 Subsea Control Subsystems
34
Critical Failure
HFLEFP HFP SFCHFC SFP SFSSFL
OR
Figure 13 Fault Tree for Subsea SCADA
Based on the data from SINTEF (1997) the following fault rates are used for the basic events in the fault tree
EFP = 428 HFC = 381 SFP = 381 SFS = 1369 HFL = 762 SFC = 190 HFP = 190 SFL = 574
where all fault rates are in failures per million hours It is easily seen that the electric power failure at the pod (EFP) and the signal transmission failure - line (SFL) are the dominant failure modes The overall failure rate for critical failures is 13293 failures per million hours or about 116 failures per year This corresponds to a mean time to failure of about 086 years
This failure rate may seem high but in this context a ldquocritical failurerdquo means loss of automatic control Oil spills will also require a simultaneous leak in a critical valve component This aspect of the reliability study has not been addressed
Calculating the Availability of the Top Event
Processing the availabilities of component failures through a series of ANDOR gates in a fault tree is a well established process In general an AND gate with n inputs each with availability of failure of qi results in a new state with availability
35
A(output of AND gate ) = q q Lqi 2 n
n
= prodq i i=1
In the case of an OR gate the availability of the new state when there are n inputs each with availability of failure of qi is
( ( L 1 qA(output of OR gate ) = minus minus 1 1 q ) 1minus q ) ( minus )i 2 n
1 q= minusprodn
(1minus i ) i=1
A program capable of performing these operations for a general fault tree without dependent basic events was available and was used to calculate the availability of the top event in these fault trees
Remember availability of the top event is the fraction of time a system of components with repair will be in an unsuccessful or failed state
Non-Independent Basic Events
The above calculation would be rather routine if it were not for the problem of non-independent basic events The fault tree for the surface system has nine basic events that are repeated They are failure of bull Pressure safety valve (PSV) bull Pressure vessel bull Level safety low (LSL) bull Atmospheric vessel bull Ventilation bull Pressure safety low (PSL) bull Temperature safety high (PSH) bull Motor Starter Interlock bull Containment
These particular basic events occur at more than one point in the fault tree This complicates the calculation because if the basic event occurs at one input with availability of failure qi then it must occur at all other locations with availability of 1 Similarly if it does not occur at one input with availability 1 - qi then it does not occur at all other locations with availability of 0
Consider a fault tree with one basic event q1 that is repeated The availability of the top event can be found using Bayes Theorem as
36
A(top event ) = q A (topevent q occurs )+ (1minus q ) A(top event q doesnt occur )1 1 2 1
q1 occurs ) can be found by forcing q1 = 1 and calculating the The term A(top event unavailability of the top event using the fault tree program In a similar fashion A(top event q1 doesnt occur ) can be found by forcing q1 = 0 and using the fault tree program
When nine repeated basic events occur the situation is somewhat more complicated Now one must consider all combinations of these nine events Since each event can occur or not occur there are 29 = 512 combinations In theory the program should be run 512 times In reality one can get a very good approximation by considering only ten of the 512 states These ten states are the following
State 1 No basic event failures exist or qi = 0 i = 1 9 State 2 rarr 10 One and only one basic event failure exists or
q1 = 1 qi = 0 i = 1 9 and i ne 1 q2 = 1 qi = 0 i = 1 9 and i ne 2 etc
Then the availability of the top event will be
9
all q = 0)A(top event ) = prod(1 = qi ) A(top event i i=1
9 9 +sumqi prod(1minus q j )A(top event all q = 0 except q = 1)j i
i=1 j=1 j ine
The terms that are neglected all have more than one factor of qi Since these terms are small the product of two or more of these terms is negligibly small
When the preceding calculation was done for the surface system a very small availability of the top event resulted (76times10-13) This is logical since any path through the fault tree from basic events to top event involves at least four or five failures with availabilities in the 10-3 or 10-4 range When these are processed through AND gates one winds up with (10-3 or 10-4)-m where m is 3 or 4
The subsea portion of the fault tree is somewhat simpler and represents more of a ldquoseriesrdquo type system where one or two failures can lead to the top event Even though individual availabilities of failure are relatively small because of the nature of the system and its fault tree the availability of the top event is 000618 This corresponds to about 50 hours
37
of outage per year In terms of events per year the top event would have a frequency of 116 failuresyear
It should be noted that compressors and pumps have high failure rates and contribute the most to the occurrence of the top event Containment is also a key since it strongly influences the occurrence of the top event
Failure of the SCADA System
Figure 14 shows the fault tree for a typical SCADA system as shown in Figure 2 Using failure rates and repair rates availabilities and unavailabilities can be found for each subsystem The communication network failure availability is from one operator The other availabilities are from SINTEF (1997) The availability of the top event (failure of the SCADA system) can be found by analyzing the fault tree diagram with the basic event data of Table 3 Calculating this value results in the availability of the top event (SCADA system failed) equal to 12times10-2 Note that the failure rate is dominated by the communication network
The low availability values for the SCADA system failure and the surfacesubsea failure makes it unlikely that these two events could occur simultaneously The overall availability of a surfacesubsea failure and a SCADA failure is about 83times10-4 If such an event took an average of one hour to repair this would lead to a failure rate of about 8300 failures106 hours or about one failure in 14 years
38
Failure of SCADA
Remote Comm PC Network (1) (2)
Scndry PrmryPC PC (3) (4)
A CompPLC (6)
Wst Ht PLC (8)
Alarm Turbine PLC PLC (10) (11)
Wtrfld PLC (13)
Turbine PLC (15)
VRU EmergPLC
LACT PLC
(9) (7) Filter PLC PLC(5) (16)
Well PLC (12)
Sfty SysPLC (14)
Figure 14 Fault Tree for Distributed Platform SCADA System
39
Table 3 Failure Data for Basic Events in SCADA Fault Tree
No Basic Events
Failure Rates of Basic Events (Failures per Year)
Repair Times for Basic Events (Repairs per Year)
Availability of Failure
1Remote PC 1075 21366 00005 2Comm System 1091 8760 001
3 4PC 1075 21366 00005 5-16PLC 118 79636 000015
Pipelines
Figure 15 shows the fault tree for a typical offshore pipeline as shown in Figure 5 The corresponding failure rate information is in Table 4
The pipeline failure rate is from the US Dept of Transportation (DOT 2000) In 14 years 2827 failures have occurred Average pipeline mileage is 154265 miles So one can conclude that 142827=202 failures per year By dividing 202 failuresper year by the average mileage we have 1310-3 failures per year per mile This number includes both offshore and onshore pipelines It also includes all types of failures The failure rate in Table 4 assumes a 30 mile pipeline The other numbers are from SINTEF 1997
For this failure data the probability of the top event (MTBF) is 67910-3 (failures per year) For the same data the unavailability of the system is 26710-2 Therefore the availability of the system is 09733
The SCADA system for a pipeline is generally less complicated than the distributed platform Nevertheless we can assume the reliability is probably about the same since the reliability of the platform system is dominated by the communication system
Table 4 Failure Data for Pipeline Fault Tree
No Basic Events
Failure Rates of Basic Events (Failures per Year)
Repair Times for Basic Events (Repairs per Year)
Availability of Failure
1Press Sensor 001 755 0117 2Shut-off Valve 003 10950 01169 3Pipeline 0039 183 012 4Valve 011 345 0026 5Pump 003 322 0094
40
Release of hydrocarbon
Failure of safety system
Pressure Sensor
(1)
Shut-off Valve
(2)
Failure of pipeline system
Pipeline (3)
Pump (5)
Valve (4)
Figure 15 Pipeline Fault Tree
Human Error
One of the most difficult tasks in a reliability study is to assess the relative importance of human error versus component failures One of the investigators on this project spent several years applying reliability techniques to electrical safety in underground coal mines In the course of analyzing historical data on safety it became clear that the majority of fatalities and lost-time injuries resulted from human error In fact human error was the source of two thirds of the fatalities and lost-time injuries
Data exist on the frequency of human error in common tasks found in an industrial environment (Henley and Kumamoto 1992 Shooman 1968) The fact that there is a high degree of automation in the operation should minimize the chance of human error
For the SCADA systems used in offshore platforms there is not much need for human actions The SCADA system can fail because of incorrect human action at the remote PC and one of the PLCrsquos shown as the fault tree in Figure 16 For each PLC the probability of checking the wrong indicator lamp on the local operator panel is 0003 (Henley and Kumamoto 1985) For the PC the probability of wrongly reading an indicator is 0001 (Henley and Kumamoto 1985) Using these numbers the human reliability in the SCADA system is 0999964 The human error probability is 1-0999964=35410-5
Since the system is highly automated the reliability number is considerably relevant
41
Human-induced Failure
of SCADA
Remote PC (1)
A CompPLC (3)
Wst Ht PLC (5)
Alarm Turbine PLC PLC (7) (8)
Wtrfld PLC (10)
Turbine PLC (12)
VRU LACT PLC (4)
EmergPLC (6)
Filter PLC Well PLC (9) PLC(2)
Sfty SysPLC (11) (13)
An area of future study should be to analyze significant failures to determine the relative influence of hardware failuressoftware failureshuman error
Figure 16 Human-induced SCADA Failure Fault Tree
Software Reliability
The software reliability was approached in a manner similar to that of the overall SCADA system The fault tree is the same as for the SCADA system (Figure 14) but with the failure information shown in Table 5
For each PC in the SCADA system there are 12266 failures per 106 hours According to OREDA (SINTEF 1997) 561 of these failures are due to software failures Thus one
42
can calculate 688 (12266561 =688) failures per 106 hours The MTTR for PCrsquos is 41 hours From this information the software availability is calculated as 099997
The failure rate compares in a similar way to digital controllers used in the nuclear industry which have a failure rate of 10-7 ndash 10-9
For each PLC there are 13483 failures per 106 hours Assuming 561 of these failures are due to software failures there are 756 (13483561=756) failures per million hours The MTTR for a PLC is 11 hours From this information the calculated software availability is 099999
For the routers the assumption is that 561 of the failures are software failures Communication link availability is assumed to be the same as for the analysis of the entire SCADA system
The overall availability of the software for the system is 09906 As with the previous SCADA system analysis communication links dominate the calculations
Table 5 Software-induced Failure Data for Basic Events in SCADA Fault Tree
No Basic Events
Failure Rates of Basic Events (Failures per Year)
Repair Times for Basic Events (Repairs per Year)
Availability of Failure
1Remote PC 0060 21366 000003 2Comm System 1091 8760 001
34PC 0060 21366 000003 5-16PLC 0066 79636 000001
Operator Reliability Experience
All of the operators indicated that distant network communications is the weak link in all of their systems The conversion of analog microwave to a digital microwave network that has a loop architecture has helped in this regard Nevertheless the operators program their systems to reliably function even when communications are disrupted
In the electronic control system the end devices (sensors actuators) are the most unreliable parts The PLC rarely fails For example one operator with 200 PLCs had one PLC processor failure in 10 years
In general operators were reluctant to share their operational reliability information
43
Summary of Reliability Analysis Results
System Surface Subsea SurfaceSubsea SCADA (Platform Pipeline) SurfaceSubseaSCADA Pipeline Human Error Software
MTBF (years) Failure Availability 25times108
086 086 009 14
00068 NA
0095
76times10-13
000618 000618 0012
000083 0027
0000035
00094
human error probability
Software Quality
According to the surveyed operators software products are selected for offshore platform and pipeline systems based on many of the following features bull Operating system supported (Windows NT or UNIX) bull Range of supported PLCDCSRTU vendors and communication protocols bull Ease of modification bull Intranet Web bull DDE interface bull Alarming bull Historical trending bull Built-in diagnostics
Many of the offshore operators use Wonderware InTouch because it is easy to learn and modify it also supports a large number of PLC and RTU vendors Rockwell Software is another leading vendor Others include Intellution Siemens GE Fanuc and CiTech In addition users and third parties often develop interfaces for special or obscure equipment
Vendors and operators are always reluctant to share defect data software companies are no different Thus in order to gain an alternate appreciation of software quality and reliability we also chose a qualitative and more subjective approach We requested an interview of the major software vendors to discuss their software development and maintenance processes including quality assurance (QA) We assured them that no comments would be attributed to a specific source but that we whould share summary information and highlight best practices again in a non-attributional fashion A questionnaire was developed based on the Software Engineering Institutes Software Capability Maturity Model (Humphrey and Sweet 1987) and on industrial software supplier evaluation processes (Nielsen and Miller 1996) The questionnaire was provided
44
to the vendors prior to the interview The complete questionnaire is included in Appendix A
Software Survey Results
Software products included control software and human-machine interface software Typically development teams are small in size and focus on a particular aspect of the total software package The total software products are large (15 ndash 2 Million Lines of Code)
The following contains a list of best practices and a list of deficiencies which were found No single company performed all of the best practices no single vendor had all of the noted deficiencies Those software development teams with established engineering roots in the company seem to have the best processes Smaller software-only companies tend to have less well-defined processes and operate more on an ad hoc basis However as those companies addressed the issue of multiple releases and long-term maintenance they have instituted additional processes and some have utilized third-party vendors for maintenance and configuration management
Best practices noted among the interviewees were
bull A defined software process that is utilized throughout the organization The process does not need to be cumbersome or labor-intensive in fact some of the best were quite streamlined the important aspect is that the process was consistently applied Training in the process for new hires was also noted as a best practice
bull Migration to a common software infrastructure Several of the vendors are developing a framework into which existing components (either in-house or from other vendors) can be ldquopluggedrdquo This allows for shared components reducing development time and redundancy of information
bull Frequent solicitation of customer input requirements and satisfaction through well-defined channels The best vendors had a formal mechanism by which they could learn of new customer expectations as well as problems and issues
bull On-line sites for customer access of updates issues and information Many have websites for customers One vendor moderates a website in which customers provide feedback and carry discussion threads on various topics of interest
bull Software teams which included staff with industrial experience using SCADA equipment (the highest percentage found was 15) These individuals tended to serve as application engineers and product architects rather than as programmers or testers
bull Reviews at various phases of development that include participants from other development teams as well as test and QA
bull Previews or ldquolook-aheadrdquo meetings that bring together software architects and application engineers to determine risks and potential pitfalls of next phase of development
bull Concern for documentation ease of use by customeroperator bull Independent test teams with separate reporting relationship from development team
45
Deficiencies noted include
bull Ill-defined software development processes or multiple processes that vary from team to team
bull Conducting reviews in which not all parties have examined the material in advance or in which not all perspectives are present
bull Lack of formal regression testing procedures and test suites bull Lack of emphasis on failure scenario tests bull Lack of concern for intrusion detection capability
Lastly while vendors stated that they had requirements for safety reliability quality and real-time operation no one shared specific quantifiable requirements This is an area for further exploration
46
Recommendations
Based on the reliability assessment of current SCADA technology we propose the following additional guidelines for those operators that use SCADA systems These are in addition to the guidelines in NTL N00G06 (effective February 4 2000) bull All developed software for SCADA systems should follow a defined software
process that process does not necessarily need to be an SEI or ISO or IEEE standard although those may be applicable This recommendation applies both to software developed by the vendors and application-specific software developed by the operatorsvendorscontractors
bull Software should also be tested for survivability under typical intrusion mechanisms such as buffer overrun If the software contains embedded third-party components those components should be thoroughly tested within the total system This includes testing of ldquonegative requirementsrdquo that is testing of features of the embedded component that should not be activated in the larger framework
bull Critical parts of the system such as the emergency shutdown system should be redundant For subsea systems the communication channels should be redundant
Other recommendations bull MMS should organize a project to collect failure data that is not covered by current
SINTEF projects Specifically operators in the OCS of North America should be surveyed to collect data on pneumatic safety systems pipeline system components and human operators This project should be organized like the SINTEF projects
bull MMS should survey offshore platform operators concerning their long-term plans about remotely operating offshore platforms from the shore
bull MMS should require a reliability assessment of complete subsea processing systems
47
References
API 1998 Recommended Practice 14C sixth edition March 1998 Recommended Practice for Analysis Design Installation and Testing of Basic Surface Safety Systems for Offshore Production Platforms
ARC Advisory Group 1999 Oil amp Gas Water SCADA Systems Global Outlook ARC Advisory Group Dedham MA 399
Bellcore 1992 Reliability Prediction for Electronic Equipment Report TR-NWT-000332 Issue 4 September
Billinton R and RN Allan 1992 Reliability Evaluation of Engineering Systems Concepts and Techniques 2nd Ed New York Plenum Press
DOD (US Department of Defense) 1991 Reliability Prediction of Electronic Equipment Mil-Handbook-217F New York Griffiss Air Force Base December
DOT ( US Department of Transporation) Office of Pipeline Safety 2000 Pipeline Statistics Web page address httpopsdotgovstatshtm
Gertman and Blackman 1994 Human Reliability and Safety Analysis Handbook New York Wiley
Henley EJ and H Kumamoto 1985 Designing for Reliability and Safety Control New Jersey Prentice-Hall Inc
Henley EJ and H Kumamoto 1992 Probabilistic Risk Assessment New York IEEE Press
Humphrey W and W Sweet 1987 A Method for Assessing the Software Engineering Capability of Contractors Tech Report CMUSEI-87-TR23 Pittsburgh Software Eng Inst
IEEE (Institute of Electrical and Electronics Engineers) 1983 IEEE Guide to Collection and Presentation of Electrical Electronic and Sensing Component and Mechanical Equipment Reliability Data for Nuclear Power Generating Stations Std 500-1984 New York IEEE
ISA (Instrument Society of America) 1998 ldquoSCADA Software Rounduprdquo Industrial Computing 17 18-37 October
Mitchell CM and K Williams 1993 ldquoFailure Experience of Programmable Logic Controllers Used in Emergency Shutdown Systemsrdquo Reliability Engineering and System Safety 39329-331
48
Musa JD A Iannino and K Okumoto Software Reliability Measurement Prediction Application McGraw-Hill 1987
Neilsen J and A Miller 1996 ldquoSelecting Software Subcontractorsrdquo IEEE Software 104-109 July
Paula HM 1993 ldquoFailure Rates for Programmable Logic Controllersrdquo Reliability Engineering and System Safety 39325-328
Paula HM MW Roberts and RE Battle 1993 ldquoOperational Failure Experience of Fault-tolerant Digital Control Systemsrdquo Reliability Engineering and System Safety 39273-289
Paulk M B Curtis M Chrissis C Weber 1993 Capability Maturity Model for Software Version 11 Tech Report CMUSEI-93-TR-24 Pittsburgh Software Eng Inst
RAC (Reliability Analysis Center) 1995 Nonelectronic Parts Reliability Data 1995 Rome N Y Reliability Analysis Center
Shooman Martin L Probabilistic Reliability An Engineering Approach McGraw-Hill New York 1968
SINTEF 1997 OREDA - Offshore Reliability Data 3rd Edition SINTEF Industrial Management Trondheim Norway
USNRC (U S Nuclear Regulatory Commission) 1975 Reactor Safety Study An Assessment of Accident Risks in US Commercial Nuclear Plants NUREG-75014 USNRC Report WASH-1400 Washington DC USNRC October
USNRC 1980 Data Summaries of Licensee Event Reports of Diesel Generators at US Commercial Nuclear Plants NUREGCR-1362 Washington DC USNRC March
USNRC 1982a Data Summaries of Licensee Event Reports of Pumps at US Commercial Nuclear Plants NUREGCR-1205 Washington DC USNRC January
USNRC 1982b Data Summaries of Licensee Event Reports of Valves at US Commercial Nuclear Plants NUREGCR-1363 Washington DC USNRC October
USNRC 1993 Software Reliability and Safety in Nuclear Protection Systems NUREGCR-6101 Washington DC USNRC
Wheeler DA B Brykczynski and RN Meeson (eds) 1996 Software Inspection An Industry Best Practice New York IEEE Press
49
50
Appendix A
SCADA SOFTWARE QUESTIONNAIRE
University of Missouri ndash Rolla for
Department of the Interior MMS Technology Assessment and Research Program SOL 14335-01-99-RP-3995
Survey Participants
Senior Executive (30 minutes) SCADA product development manager (60 minutes) SCADA product marketing manager (60 minutes) QA manager or a QA engineer (60 minutes) Team meeting with a developer a tester and a configuration manager (60 minutes)
Questions
General Management
What is the vision of the company How do the communications control and SCADA products fit within the companys product line With regard to communications control and SCADA applications does the company produce software only or systems of software and hardware What levels of the organization have direct customer contact If individuals do not have direct customer contact who internally serves as their customer interface Who internally serves as customer advocate How is customer satisfaction measured (all measures that apply)
SCADA Software Process Information Personnel
What is the size of the software team What percentage are developers Testers Other team members How many have had industrial experience using SCADA equipment (Numbers or percent of total) What training is provided to new hires (General andor SCADA-specific) Is there an annual training goal Is it a mandate an opportunity or something in between Is there a training course or program for new managers If so what topics
51
SCADA Software Process Information Requirements and Configuration Management
How are customer requirements determined How are product requirements determined What quantifiable requirements exist for Safety Reliability Quality Real-time Operation How are requirements tracked throughout the product development life cycle How are releases determined and how is functionality assigned to releases How are releases managed How are customer-reported defects fixed (Work-around patches andor new releases)
SCADA Software Process Information Development
What automated tool support is used Is any of the communicationscontrolSCADA software externally supplied If so subcontract development or COTS product
SCADA Software Process Information Test and Quality Assurance
What internal reviews and audits are regular activities (SEI CMM ISO etc) What standard reviews and audits are regular activities (SEI CMM ISO etc) For each of these what is the periodicity of reviewaudit How are defects identified fixed tracked and verified Is the test team independent of the development team What is the reporting relationship of the test team relative to the development team What levels and types of testing are performed How are fail-safe requirements if any tested How are real-time requirements if any tested Who approves product releaseshipment On what basis If a customer purchases your software product what if any are the stated liabilities
52
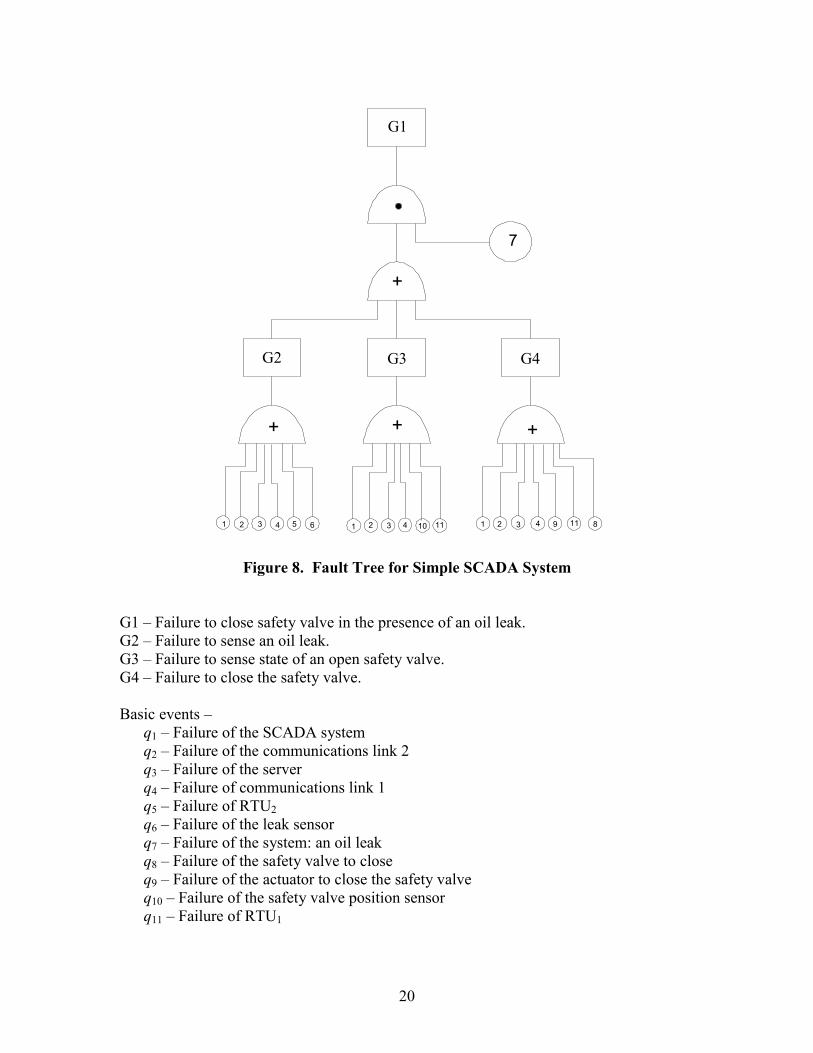
G1
+
7
1 32 4 5 6 10 91 112 3 4 1 2 3 4 11 8
+ ++
G2 G3 G4
Figure 8 Fault Tree for Simple SCADA System
G1 ndash Failure to close safety valve in the presence of an oil leak G2 ndash Failure to sense an oil leak G3 ndash Failure to sense state of an open safety valve G4 ndash Failure to close the safety valve
Basic events ndash q1 ndash Failure of the SCADA system q2 ndash Failure of the communications link 2 q3 ndash Failure of the server q4 ndash Failure of communications link 1 q5 ndash Failure of RTU2 q6 ndash Failure of the leak sensor q7 ndash Failure of the system an oil leak q8 ndash Failure of the safety valve to close q9 ndash Failure of the actuator to close the safety valve q10 ndash Failure of the safety valve position sensor q11 ndash Failure of RTU1
20
G1
1 32 4 5 6 10 9 11 8
+
G5
7
This is an example fault tree diagram If the safety valve is a fail-safe type valve the state G4 is not a factor If the SCADA system is designed to close the safety valve regardless of how its state is sensed then state G3 is not a factor either
The simplest approach to solving for the availability of the top event is to draw a reduced fault tree Since the intermediate states G2 G3 and G4 are all the outputs of OR gates and they all feed into an OR gate the four OR gates can be replaced by a single OR gate with all the basic events except number 7 as inputs The new reduced fault tree is as shown in Figure 9
Figure 9 Reduced Fault Tree for Simple SCADA System
G5 - Failure of SCADA system or safety value
The availability of state G5 is A(top event ) = q A topevent q occurs )+ (1minus q ) A(top event q1 doesnt occur )1 ( 1 2
The availability of this top event is
21
11 A G1 = q7 1minusprod 1minus qi( ) ( ) i=1 ine7
Failure Probability for Hardware Components
The key source of offshore failure data for this study is SINTEF 1997 Several databases and handbooks exist to help with the estimation of failure probabilities for basic events (Bellcore 1992 DOD 1991 Gertman and Blackman 1994 RAC 1995) Within the nuclear engineering community failure data for nuclear-specific systems and components are available from several sources including summaries of licensee event reports (USNRC 1980 1982a 1982b) and other handbooks (IEEE 1983 USNRC 1975)
Development of the SurfaceSubsea Fault Tree
The development of the surface system fault tree was built on the Safety Flow Chart-Offshore Production Facility which appears in Figure 10 (Figure 3-1 of the API Recommended Practice 14C sixth edition March 1998) The subsea portion of the fault tree was developed using the generalized subsea architecture shown in Figure 4
The failure rates repair times and calculated availabilities for the surface system are shown in Table 2 The overall surface fault tree is shown in Figure 11 It should be noted that the failure rates in Table 2 are derived from more detailed drawings of the process equipment and may represent overall subsystems including controls Most of the failure rates in Table 2 is derived from SINTEF (1997)
The first column in Table 2 contains the event numbers (in the circles) that appear in the fault tree of Figure 11 A short description of the system component that fails occurs in the second column The third column has the failure rate in failures per year This column is derived from the SINTEF (1997) tables which have the failure rate in failures per million hours The fourth column contains the time to repair in repairs per year and is calculated by dividing the number of hoursyear (8760) by the hoursrepair from SINTEF (1997) The availability the last column is obtained by dividing the third column by the sum of the third and fourth columns
22
Paste figure here
Figure 10 Safety Flow Chart for Offshore Production Facility (from API RP 14C)
23
Table 2 Failure Data for Basic Events in Surface System Fault Tree
No Basic
Failure Events
Failure Rates of Basic Events
(Failures per Year)
Repair Times for Basic Events
(Repairs per Year) Availability of
Failure 1TSE (Temp Safety Element) 0068 43800 00000016 2ESD (Emerg Shut Down) 0092 2623 000035 3Air 1 4ASH (Gas Detector) 0042 151034 0000028 5Vent 018 730 000025 6Containment 00004 5214 00000077 7Containment 00004 5214 00000077 8ESD (Emerg Shut Down) 0092 2623 000035 9PSL (Pressure Safety Low) 02 7552 000026
10FSV (Flow Safety Valve) 28 58013 00048 11LSL (Level Safety Low) 101 11089 000091 12LSH (Level Safety High) 101 11089 000091 13Pressure Vessel 02 10318 000019 14Accident 00004 2 000005 15Compressor 47 15587 0029 16Pump 26 2163 0012 17Heat Exchanger 00034 11188 000003 18Vessel 047 84231 000056 19Valves 283 34488 00081 20Pressure Vessel 02 10318 000019 21PSH (Pressure Safety High) 02 7552 000026 22PSV (Pressure Safety Valve) 195 3449 00056 23Pump 141 2177 00064 24Flowline 00045 6126 00000073 25Compressor 998 13508 0069 26Heat Exchanger 0018 656 000027 27Ventilation 018 730 000025 28PSV (Pressure Safety Valve) 195 3449 00056 29Atmospheric Vessel 0009 8423 0000011 30LSL (Level Safety Low) 101 11089 000091 31Pressure Vessel 02 10318 000019 32Atmospheric Vessel 0009 8423 0000011 33Pressure Vessel 02 10318 000019 34PSL (Pressure Safety Low) 02 75517 000026 35Ventilation 018 730 000025 36PSV (Pressure Safety Valve) 195 3449 00035 37Atmospheric Vessel 0009 8423 0000011 38Reboiler 0009 8423 0000011 39FSL (Flow Safety Low) 0024 14600 00000016 40TSH (Temp Safety High) 0068 43800 00000016 41Reboiler 0009 8423 0000011 42LSL (Level Safety Low) 0053 11089 0000048
24
43TSH (Temp Safety High) 0068 43800 00000016 44TSH (Temp Safety High) 0068 43800 00000016 45Pressure Vessel 02 10318 000019 46Compressor 61 2218 0027 47Fuel Control 007 8505 0000082 48TSH (Temp Safety High) 0068 43800 00000016 49TSH (Temp Safety High) 0068 43800 00000016 50IPM (Ignition Prev Measures) 0042 151034 0000028 51Flame Emission 0083 2163 000038 52PSL (Pressure Safety Low) 0011 75517 0000015 53Motor Starter Interlock 013 2163 00006 54Spark Emission 876 8760 0001 55Arrestor 00088 365 0000024 56BSL (Burner Safety Low) 0069 13477 0000051 57Fuel Gas Supply 007 8505 0000082 58PSL (Pressure Safety Low) 0011 75517 0000015 59Air Supply Control 0083 2163 000038 60PSL (Pressure Safety Low) 0011 75517 0000015 61Motor Starter Interlock 013 2163 00006
25
Facility Damage Or Leak
Air (3) A
Excess Fuel
B
Fire or Explosion TSE
(1) ESD (2)
Ignition
I Pollution
Intermediate State
I ASH (4)
Vent (5)
Cont (6) Cont
(7) ESD (8)
Intermediate State
Figure 11a Top Fault Tree for Damage or Leak
26
I
Intermediate State
Release of Hydrocarbons
PSL (9)
FSV (10)
LSL (11)
Overflow Process EquipmentFailure
LSH (12)
P Ves (13)
Accidnt (14) C
Excess Temperature
at Component
Mechanical Deterioration O
Overpressure
D
Underpressure
Comp Pump (16)
Valves (15)
Ht Ex (17) (19)
Vessel (18)
Figure 11b Intermediate State Fault Tree
27
Pump (23)
Overpressure
O
Comp (25)
Flwlin (24)
Ht Ex (26)
PSH (21)
G P Ves (20) PSV
(28) G
A Ves (29) PSV
(22) Vent (27)
Gas Blow by Gas Blow by
LSL (30)
P Ves (31)
A Ves (32)
Figure 11c Overpressure Fault Tree
28
D
Underpressure
P Ves (33)
PSL (34)
Vent (35
PSV (36)
A Ves (37)
Figure 11d Underpressure Fault Tree
29
Excess Temperatureat Component
C
Low Flow Limited Heat Low Level Excess Fuel Transfer
(38) (39) (40) Reblr FSL TSH TSH
(44) P Ves
(45) Comp
(46)
Reblr (41)
LSL (42)
TSH (43)
Fuel C (47)
TSH (48)
TSH (49)
Figure 11e Excess Temperature at Component Fault Tree
30
A
Ignition
IPM (50)
Flame (51)
PSL (52)
M Str (53)
Spark (54)
Arstr (55)
Figure 11f Ignition Fault Tree
31
B
Excess Fuel
BSL (56)
BSL (58)
Fuel (57)
Air Ctl (59)
M Str (61)
PSL (60)
Figure 11g Excess Fuel Fault Tree
32
The subsea portion of the fault tree was developed using the generalized subsea architecture shown in Figure 4 The control systems controlling single satellite wells and more complex subsea production facilities such as multi-well manifold template systems can be broken into subsystems as shown in Figure 12
Failure modes for the subsystems shown in Figure 12 include Electrical Power Failure - Pod (EFP) Hydraulic Power Failure - Connector (HFC) Hydraulic Power Failure - Line (HFL) Hydraulic Power Failure - Pod (HFP) Signal Transmission Failure - Connector (SFC) Signal Transmission Failure - Line (SFL) Signal Transmission Failure - Pod (SFP) Signal Transmission Failure - Surface (SFS)
These failure modes are independent events represented as ldquoORrdquo gates on a fault tree Ultimately however these ldquoORrdquo gates are combined because any one fault causes complete system failure
The block diagram of the subsea control subsystems shown in Figure 12 illustrates the flow of electrical power hydraulic and communications signals that could lead to a critical failure It should be noted that this is essentially a series system from a reliability point of view (any failure leads to system failure) There are two areas where redundancy occurs (1) the redundant subsea control modules at either the well or the subsea manifold and (2) the redundant PLCs at the host facility In both cases the failure of the redundant set is considered the basic event and the failure rate is selected accordingly With these assumptions the fault tree will consist of only basic events ldquoORrdquo gates and derived states including the top event
It should also be noted that three basic events are actually combinations of two or more fundamental events (1) the electrical power failure of the pod (EFP) could be either a short circuit at the pod connector or a general electric failure in the subsea control unit (2) the signal transmission failure in the line (SFL) could be either a blocked or plugged sensor or a faulty signal line (3) the signal transmission failure at the pod (SFP) could be either a pilot valve control failure or a subsystem faulty signal
Using the block diagram in Figure 12 the fault tree diagram in Figure 13 can be drawn In this fault tree diagram hydraulic failures (HFC HFL or HFOP) and signal failures (SFP SFC or SFL) can occur for any of the n satellite wells In addition signal failures on the surface (SFS) can occur for any of the m group controls Once again the failure rates used account for this fact (Effective failure rate equals n or m times component failure rate)
33
Topside
Hydraulic power unit
Hydraulic Lines surface
termination
Electric power unit
Electric Lines surface
termination
Electric Lines
Electric Lines subsea
termination
Electric template
trunk lines
Surface control unit
Signal Lines surface
termination
Signal Lines
Signal Lines subsea
termination
Signal template
trunk lines
Control pod electronics
Um
bilic
al
Hydraulic Lines
Hydraulic Lines subsea
termination
Hydraulic template
trunk lines
Control pod hydraulics
Baseplate
Control Pod
Figure 12 Subsea Control Subsystems
34
Critical Failure
HFLEFP HFP SFCHFC SFP SFSSFL
OR
Figure 13 Fault Tree for Subsea SCADA
Based on the data from SINTEF (1997) the following fault rates are used for the basic events in the fault tree
EFP = 428 HFC = 381 SFP = 381 SFS = 1369 HFL = 762 SFC = 190 HFP = 190 SFL = 574
where all fault rates are in failures per million hours It is easily seen that the electric power failure at the pod (EFP) and the signal transmission failure - line (SFL) are the dominant failure modes The overall failure rate for critical failures is 13293 failures per million hours or about 116 failures per year This corresponds to a mean time to failure of about 086 years
This failure rate may seem high but in this context a ldquocritical failurerdquo means loss of automatic control Oil spills will also require a simultaneous leak in a critical valve component This aspect of the reliability study has not been addressed
Calculating the Availability of the Top Event
Processing the availabilities of component failures through a series of ANDOR gates in a fault tree is a well established process In general an AND gate with n inputs each with availability of failure of qi results in a new state with availability
35
A(output of AND gate ) = q q Lqi 2 n
n
= prodq i i=1
In the case of an OR gate the availability of the new state when there are n inputs each with availability of failure of qi is
( ( L 1 qA(output of OR gate ) = minus minus 1 1 q ) 1minus q ) ( minus )i 2 n
1 q= minusprodn
(1minus i ) i=1
A program capable of performing these operations for a general fault tree without dependent basic events was available and was used to calculate the availability of the top event in these fault trees
Remember availability of the top event is the fraction of time a system of components with repair will be in an unsuccessful or failed state
Non-Independent Basic Events
The above calculation would be rather routine if it were not for the problem of non-independent basic events The fault tree for the surface system has nine basic events that are repeated They are failure of bull Pressure safety valve (PSV) bull Pressure vessel bull Level safety low (LSL) bull Atmospheric vessel bull Ventilation bull Pressure safety low (PSL) bull Temperature safety high (PSH) bull Motor Starter Interlock bull Containment
These particular basic events occur at more than one point in the fault tree This complicates the calculation because if the basic event occurs at one input with availability of failure qi then it must occur at all other locations with availability of 1 Similarly if it does not occur at one input with availability 1 - qi then it does not occur at all other locations with availability of 0
Consider a fault tree with one basic event q1 that is repeated The availability of the top event can be found using Bayes Theorem as
36
A(top event ) = q A (topevent q occurs )+ (1minus q ) A(top event q doesnt occur )1 1 2 1
q1 occurs ) can be found by forcing q1 = 1 and calculating the The term A(top event unavailability of the top event using the fault tree program In a similar fashion A(top event q1 doesnt occur ) can be found by forcing q1 = 0 and using the fault tree program
When nine repeated basic events occur the situation is somewhat more complicated Now one must consider all combinations of these nine events Since each event can occur or not occur there are 29 = 512 combinations In theory the program should be run 512 times In reality one can get a very good approximation by considering only ten of the 512 states These ten states are the following
State 1 No basic event failures exist or qi = 0 i = 1 9 State 2 rarr 10 One and only one basic event failure exists or
q1 = 1 qi = 0 i = 1 9 and i ne 1 q2 = 1 qi = 0 i = 1 9 and i ne 2 etc
Then the availability of the top event will be
9
all q = 0)A(top event ) = prod(1 = qi ) A(top event i i=1
9 9 +sumqi prod(1minus q j )A(top event all q = 0 except q = 1)j i
i=1 j=1 j ine
The terms that are neglected all have more than one factor of qi Since these terms are small the product of two or more of these terms is negligibly small
When the preceding calculation was done for the surface system a very small availability of the top event resulted (76times10-13) This is logical since any path through the fault tree from basic events to top event involves at least four or five failures with availabilities in the 10-3 or 10-4 range When these are processed through AND gates one winds up with (10-3 or 10-4)-m where m is 3 or 4
The subsea portion of the fault tree is somewhat simpler and represents more of a ldquoseriesrdquo type system where one or two failures can lead to the top event Even though individual availabilities of failure are relatively small because of the nature of the system and its fault tree the availability of the top event is 000618 This corresponds to about 50 hours
37
of outage per year In terms of events per year the top event would have a frequency of 116 failuresyear
It should be noted that compressors and pumps have high failure rates and contribute the most to the occurrence of the top event Containment is also a key since it strongly influences the occurrence of the top event
Failure of the SCADA System
Figure 14 shows the fault tree for a typical SCADA system as shown in Figure 2 Using failure rates and repair rates availabilities and unavailabilities can be found for each subsystem The communication network failure availability is from one operator The other availabilities are from SINTEF (1997) The availability of the top event (failure of the SCADA system) can be found by analyzing the fault tree diagram with the basic event data of Table 3 Calculating this value results in the availability of the top event (SCADA system failed) equal to 12times10-2 Note that the failure rate is dominated by the communication network
The low availability values for the SCADA system failure and the surfacesubsea failure makes it unlikely that these two events could occur simultaneously The overall availability of a surfacesubsea failure and a SCADA failure is about 83times10-4 If such an event took an average of one hour to repair this would lead to a failure rate of about 8300 failures106 hours or about one failure in 14 years
38
Failure of SCADA
Remote Comm PC Network (1) (2)
Scndry PrmryPC PC (3) (4)
A CompPLC (6)
Wst Ht PLC (8)
Alarm Turbine PLC PLC (10) (11)
Wtrfld PLC (13)
Turbine PLC (15)
VRU EmergPLC
LACT PLC
(9) (7) Filter PLC PLC(5) (16)
Well PLC (12)
Sfty SysPLC (14)
Figure 14 Fault Tree for Distributed Platform SCADA System
39
Table 3 Failure Data for Basic Events in SCADA Fault Tree
No Basic Events
Failure Rates of Basic Events (Failures per Year)
Repair Times for Basic Events (Repairs per Year)
Availability of Failure
1Remote PC 1075 21366 00005 2Comm System 1091 8760 001
3 4PC 1075 21366 00005 5-16PLC 118 79636 000015
Pipelines
Figure 15 shows the fault tree for a typical offshore pipeline as shown in Figure 5 The corresponding failure rate information is in Table 4
The pipeline failure rate is from the US Dept of Transportation (DOT 2000) In 14 years 2827 failures have occurred Average pipeline mileage is 154265 miles So one can conclude that 142827=202 failures per year By dividing 202 failuresper year by the average mileage we have 1310-3 failures per year per mile This number includes both offshore and onshore pipelines It also includes all types of failures The failure rate in Table 4 assumes a 30 mile pipeline The other numbers are from SINTEF 1997
For this failure data the probability of the top event (MTBF) is 67910-3 (failures per year) For the same data the unavailability of the system is 26710-2 Therefore the availability of the system is 09733
The SCADA system for a pipeline is generally less complicated than the distributed platform Nevertheless we can assume the reliability is probably about the same since the reliability of the platform system is dominated by the communication system
Table 4 Failure Data for Pipeline Fault Tree
No Basic Events
Failure Rates of Basic Events (Failures per Year)
Repair Times for Basic Events (Repairs per Year)
Availability of Failure
1Press Sensor 001 755 0117 2Shut-off Valve 003 10950 01169 3Pipeline 0039 183 012 4Valve 011 345 0026 5Pump 003 322 0094
40
Release of hydrocarbon
Failure of safety system
Pressure Sensor
(1)
Shut-off Valve
(2)
Failure of pipeline system
Pipeline (3)
Pump (5)
Valve (4)
Figure 15 Pipeline Fault Tree
Human Error
One of the most difficult tasks in a reliability study is to assess the relative importance of human error versus component failures One of the investigators on this project spent several years applying reliability techniques to electrical safety in underground coal mines In the course of analyzing historical data on safety it became clear that the majority of fatalities and lost-time injuries resulted from human error In fact human error was the source of two thirds of the fatalities and lost-time injuries
Data exist on the frequency of human error in common tasks found in an industrial environment (Henley and Kumamoto 1992 Shooman 1968) The fact that there is a high degree of automation in the operation should minimize the chance of human error
For the SCADA systems used in offshore platforms there is not much need for human actions The SCADA system can fail because of incorrect human action at the remote PC and one of the PLCrsquos shown as the fault tree in Figure 16 For each PLC the probability of checking the wrong indicator lamp on the local operator panel is 0003 (Henley and Kumamoto 1985) For the PC the probability of wrongly reading an indicator is 0001 (Henley and Kumamoto 1985) Using these numbers the human reliability in the SCADA system is 0999964 The human error probability is 1-0999964=35410-5
Since the system is highly automated the reliability number is considerably relevant
41
Human-induced Failure
of SCADA
Remote PC (1)
A CompPLC (3)
Wst Ht PLC (5)
Alarm Turbine PLC PLC (7) (8)
Wtrfld PLC (10)
Turbine PLC (12)
VRU LACT PLC (4)
EmergPLC (6)
Filter PLC Well PLC (9) PLC(2)
Sfty SysPLC (11) (13)
An area of future study should be to analyze significant failures to determine the relative influence of hardware failuressoftware failureshuman error
Figure 16 Human-induced SCADA Failure Fault Tree
Software Reliability
The software reliability was approached in a manner similar to that of the overall SCADA system The fault tree is the same as for the SCADA system (Figure 14) but with the failure information shown in Table 5
For each PC in the SCADA system there are 12266 failures per 106 hours According to OREDA (SINTEF 1997) 561 of these failures are due to software failures Thus one
42
can calculate 688 (12266561 =688) failures per 106 hours The MTTR for PCrsquos is 41 hours From this information the software availability is calculated as 099997
The failure rate compares in a similar way to digital controllers used in the nuclear industry which have a failure rate of 10-7 ndash 10-9
For each PLC there are 13483 failures per 106 hours Assuming 561 of these failures are due to software failures there are 756 (13483561=756) failures per million hours The MTTR for a PLC is 11 hours From this information the calculated software availability is 099999
For the routers the assumption is that 561 of the failures are software failures Communication link availability is assumed to be the same as for the analysis of the entire SCADA system
The overall availability of the software for the system is 09906 As with the previous SCADA system analysis communication links dominate the calculations
Table 5 Software-induced Failure Data for Basic Events in SCADA Fault Tree
No Basic Events
Failure Rates of Basic Events (Failures per Year)
Repair Times for Basic Events (Repairs per Year)
Availability of Failure
1Remote PC 0060 21366 000003 2Comm System 1091 8760 001
34PC 0060 21366 000003 5-16PLC 0066 79636 000001
Operator Reliability Experience
All of the operators indicated that distant network communications is the weak link in all of their systems The conversion of analog microwave to a digital microwave network that has a loop architecture has helped in this regard Nevertheless the operators program their systems to reliably function even when communications are disrupted
In the electronic control system the end devices (sensors actuators) are the most unreliable parts The PLC rarely fails For example one operator with 200 PLCs had one PLC processor failure in 10 years
In general operators were reluctant to share their operational reliability information
43
Summary of Reliability Analysis Results
System Surface Subsea SurfaceSubsea SCADA (Platform Pipeline) SurfaceSubseaSCADA Pipeline Human Error Software
MTBF (years) Failure Availability 25times108
086 086 009 14
00068 NA
0095
76times10-13
000618 000618 0012
000083 0027
0000035
00094
human error probability
Software Quality
According to the surveyed operators software products are selected for offshore platform and pipeline systems based on many of the following features bull Operating system supported (Windows NT or UNIX) bull Range of supported PLCDCSRTU vendors and communication protocols bull Ease of modification bull Intranet Web bull DDE interface bull Alarming bull Historical trending bull Built-in diagnostics
Many of the offshore operators use Wonderware InTouch because it is easy to learn and modify it also supports a large number of PLC and RTU vendors Rockwell Software is another leading vendor Others include Intellution Siemens GE Fanuc and CiTech In addition users and third parties often develop interfaces for special or obscure equipment
Vendors and operators are always reluctant to share defect data software companies are no different Thus in order to gain an alternate appreciation of software quality and reliability we also chose a qualitative and more subjective approach We requested an interview of the major software vendors to discuss their software development and maintenance processes including quality assurance (QA) We assured them that no comments would be attributed to a specific source but that we whould share summary information and highlight best practices again in a non-attributional fashion A questionnaire was developed based on the Software Engineering Institutes Software Capability Maturity Model (Humphrey and Sweet 1987) and on industrial software supplier evaluation processes (Nielsen and Miller 1996) The questionnaire was provided
44
to the vendors prior to the interview The complete questionnaire is included in Appendix A
Software Survey Results
Software products included control software and human-machine interface software Typically development teams are small in size and focus on a particular aspect of the total software package The total software products are large (15 ndash 2 Million Lines of Code)
The following contains a list of best practices and a list of deficiencies which were found No single company performed all of the best practices no single vendor had all of the noted deficiencies Those software development teams with established engineering roots in the company seem to have the best processes Smaller software-only companies tend to have less well-defined processes and operate more on an ad hoc basis However as those companies addressed the issue of multiple releases and long-term maintenance they have instituted additional processes and some have utilized third-party vendors for maintenance and configuration management
Best practices noted among the interviewees were
bull A defined software process that is utilized throughout the organization The process does not need to be cumbersome or labor-intensive in fact some of the best were quite streamlined the important aspect is that the process was consistently applied Training in the process for new hires was also noted as a best practice
bull Migration to a common software infrastructure Several of the vendors are developing a framework into which existing components (either in-house or from other vendors) can be ldquopluggedrdquo This allows for shared components reducing development time and redundancy of information
bull Frequent solicitation of customer input requirements and satisfaction through well-defined channels The best vendors had a formal mechanism by which they could learn of new customer expectations as well as problems and issues
bull On-line sites for customer access of updates issues and information Many have websites for customers One vendor moderates a website in which customers provide feedback and carry discussion threads on various topics of interest
bull Software teams which included staff with industrial experience using SCADA equipment (the highest percentage found was 15) These individuals tended to serve as application engineers and product architects rather than as programmers or testers
bull Reviews at various phases of development that include participants from other development teams as well as test and QA
bull Previews or ldquolook-aheadrdquo meetings that bring together software architects and application engineers to determine risks and potential pitfalls of next phase of development
bull Concern for documentation ease of use by customeroperator bull Independent test teams with separate reporting relationship from development team
45
Deficiencies noted include
bull Ill-defined software development processes or multiple processes that vary from team to team
bull Conducting reviews in which not all parties have examined the material in advance or in which not all perspectives are present
bull Lack of formal regression testing procedures and test suites bull Lack of emphasis on failure scenario tests bull Lack of concern for intrusion detection capability
Lastly while vendors stated that they had requirements for safety reliability quality and real-time operation no one shared specific quantifiable requirements This is an area for further exploration
46
Recommendations
Based on the reliability assessment of current SCADA technology we propose the following additional guidelines for those operators that use SCADA systems These are in addition to the guidelines in NTL N00G06 (effective February 4 2000) bull All developed software for SCADA systems should follow a defined software
process that process does not necessarily need to be an SEI or ISO or IEEE standard although those may be applicable This recommendation applies both to software developed by the vendors and application-specific software developed by the operatorsvendorscontractors
bull Software should also be tested for survivability under typical intrusion mechanisms such as buffer overrun If the software contains embedded third-party components those components should be thoroughly tested within the total system This includes testing of ldquonegative requirementsrdquo that is testing of features of the embedded component that should not be activated in the larger framework
bull Critical parts of the system such as the emergency shutdown system should be redundant For subsea systems the communication channels should be redundant
Other recommendations bull MMS should organize a project to collect failure data that is not covered by current
SINTEF projects Specifically operators in the OCS of North America should be surveyed to collect data on pneumatic safety systems pipeline system components and human operators This project should be organized like the SINTEF projects
bull MMS should survey offshore platform operators concerning their long-term plans about remotely operating offshore platforms from the shore
bull MMS should require a reliability assessment of complete subsea processing systems
47
References
API 1998 Recommended Practice 14C sixth edition March 1998 Recommended Practice for Analysis Design Installation and Testing of Basic Surface Safety Systems for Offshore Production Platforms
ARC Advisory Group 1999 Oil amp Gas Water SCADA Systems Global Outlook ARC Advisory Group Dedham MA 399
Bellcore 1992 Reliability Prediction for Electronic Equipment Report TR-NWT-000332 Issue 4 September
Billinton R and RN Allan 1992 Reliability Evaluation of Engineering Systems Concepts and Techniques 2nd Ed New York Plenum Press
DOD (US Department of Defense) 1991 Reliability Prediction of Electronic Equipment Mil-Handbook-217F New York Griffiss Air Force Base December
DOT ( US Department of Transporation) Office of Pipeline Safety 2000 Pipeline Statistics Web page address httpopsdotgovstatshtm
Gertman and Blackman 1994 Human Reliability and Safety Analysis Handbook New York Wiley
Henley EJ and H Kumamoto 1985 Designing for Reliability and Safety Control New Jersey Prentice-Hall Inc
Henley EJ and H Kumamoto 1992 Probabilistic Risk Assessment New York IEEE Press
Humphrey W and W Sweet 1987 A Method for Assessing the Software Engineering Capability of Contractors Tech Report CMUSEI-87-TR23 Pittsburgh Software Eng Inst
IEEE (Institute of Electrical and Electronics Engineers) 1983 IEEE Guide to Collection and Presentation of Electrical Electronic and Sensing Component and Mechanical Equipment Reliability Data for Nuclear Power Generating Stations Std 500-1984 New York IEEE
ISA (Instrument Society of America) 1998 ldquoSCADA Software Rounduprdquo Industrial Computing 17 18-37 October
Mitchell CM and K Williams 1993 ldquoFailure Experience of Programmable Logic Controllers Used in Emergency Shutdown Systemsrdquo Reliability Engineering and System Safety 39329-331
48
Musa JD A Iannino and K Okumoto Software Reliability Measurement Prediction Application McGraw-Hill 1987
Neilsen J and A Miller 1996 ldquoSelecting Software Subcontractorsrdquo IEEE Software 104-109 July
Paula HM 1993 ldquoFailure Rates for Programmable Logic Controllersrdquo Reliability Engineering and System Safety 39325-328
Paula HM MW Roberts and RE Battle 1993 ldquoOperational Failure Experience of Fault-tolerant Digital Control Systemsrdquo Reliability Engineering and System Safety 39273-289
Paulk M B Curtis M Chrissis C Weber 1993 Capability Maturity Model for Software Version 11 Tech Report CMUSEI-93-TR-24 Pittsburgh Software Eng Inst
RAC (Reliability Analysis Center) 1995 Nonelectronic Parts Reliability Data 1995 Rome N Y Reliability Analysis Center
Shooman Martin L Probabilistic Reliability An Engineering Approach McGraw-Hill New York 1968
SINTEF 1997 OREDA - Offshore Reliability Data 3rd Edition SINTEF Industrial Management Trondheim Norway
USNRC (U S Nuclear Regulatory Commission) 1975 Reactor Safety Study An Assessment of Accident Risks in US Commercial Nuclear Plants NUREG-75014 USNRC Report WASH-1400 Washington DC USNRC October
USNRC 1980 Data Summaries of Licensee Event Reports of Diesel Generators at US Commercial Nuclear Plants NUREGCR-1362 Washington DC USNRC March
USNRC 1982a Data Summaries of Licensee Event Reports of Pumps at US Commercial Nuclear Plants NUREGCR-1205 Washington DC USNRC January
USNRC 1982b Data Summaries of Licensee Event Reports of Valves at US Commercial Nuclear Plants NUREGCR-1363 Washington DC USNRC October
USNRC 1993 Software Reliability and Safety in Nuclear Protection Systems NUREGCR-6101 Washington DC USNRC
Wheeler DA B Brykczynski and RN Meeson (eds) 1996 Software Inspection An Industry Best Practice New York IEEE Press
49
50
Appendix A
SCADA SOFTWARE QUESTIONNAIRE
University of Missouri ndash Rolla for
Department of the Interior MMS Technology Assessment and Research Program SOL 14335-01-99-RP-3995
Survey Participants
Senior Executive (30 minutes) SCADA product development manager (60 minutes) SCADA product marketing manager (60 minutes) QA manager or a QA engineer (60 minutes) Team meeting with a developer a tester and a configuration manager (60 minutes)
Questions
General Management
What is the vision of the company How do the communications control and SCADA products fit within the companys product line With regard to communications control and SCADA applications does the company produce software only or systems of software and hardware What levels of the organization have direct customer contact If individuals do not have direct customer contact who internally serves as their customer interface Who internally serves as customer advocate How is customer satisfaction measured (all measures that apply)
SCADA Software Process Information Personnel
What is the size of the software team What percentage are developers Testers Other team members How many have had industrial experience using SCADA equipment (Numbers or percent of total) What training is provided to new hires (General andor SCADA-specific) Is there an annual training goal Is it a mandate an opportunity or something in between Is there a training course or program for new managers If so what topics
51
SCADA Software Process Information Requirements and Configuration Management
How are customer requirements determined How are product requirements determined What quantifiable requirements exist for Safety Reliability Quality Real-time Operation How are requirements tracked throughout the product development life cycle How are releases determined and how is functionality assigned to releases How are releases managed How are customer-reported defects fixed (Work-around patches andor new releases)
SCADA Software Process Information Development
What automated tool support is used Is any of the communicationscontrolSCADA software externally supplied If so subcontract development or COTS product
SCADA Software Process Information Test and Quality Assurance
What internal reviews and audits are regular activities (SEI CMM ISO etc) What standard reviews and audits are regular activities (SEI CMM ISO etc) For each of these what is the periodicity of reviewaudit How are defects identified fixed tracked and verified Is the test team independent of the development team What is the reporting relationship of the test team relative to the development team What levels and types of testing are performed How are fail-safe requirements if any tested How are real-time requirements if any tested Who approves product releaseshipment On what basis If a customer purchases your software product what if any are the stated liabilities
52

G1
1 32 4 5 6 10 9 11 8
+
G5
7
This is an example fault tree diagram If the safety valve is a fail-safe type valve the state G4 is not a factor If the SCADA system is designed to close the safety valve regardless of how its state is sensed then state G3 is not a factor either
The simplest approach to solving for the availability of the top event is to draw a reduced fault tree Since the intermediate states G2 G3 and G4 are all the outputs of OR gates and they all feed into an OR gate the four OR gates can be replaced by a single OR gate with all the basic events except number 7 as inputs The new reduced fault tree is as shown in Figure 9
Figure 9 Reduced Fault Tree for Simple SCADA System
G5 - Failure of SCADA system or safety value
The availability of state G5 is A(top event ) = q A topevent q occurs )+ (1minus q ) A(top event q1 doesnt occur )1 ( 1 2
The availability of this top event is
21
11 A G1 = q7 1minusprod 1minus qi( ) ( ) i=1 ine7
Failure Probability for Hardware Components
The key source of offshore failure data for this study is SINTEF 1997 Several databases and handbooks exist to help with the estimation of failure probabilities for basic events (Bellcore 1992 DOD 1991 Gertman and Blackman 1994 RAC 1995) Within the nuclear engineering community failure data for nuclear-specific systems and components are available from several sources including summaries of licensee event reports (USNRC 1980 1982a 1982b) and other handbooks (IEEE 1983 USNRC 1975)
Development of the SurfaceSubsea Fault Tree
The development of the surface system fault tree was built on the Safety Flow Chart-Offshore Production Facility which appears in Figure 10 (Figure 3-1 of the API Recommended Practice 14C sixth edition March 1998) The subsea portion of the fault tree was developed using the generalized subsea architecture shown in Figure 4
The failure rates repair times and calculated availabilities for the surface system are shown in Table 2 The overall surface fault tree is shown in Figure 11 It should be noted that the failure rates in Table 2 are derived from more detailed drawings of the process equipment and may represent overall subsystems including controls Most of the failure rates in Table 2 is derived from SINTEF (1997)
The first column in Table 2 contains the event numbers (in the circles) that appear in the fault tree of Figure 11 A short description of the system component that fails occurs in the second column The third column has the failure rate in failures per year This column is derived from the SINTEF (1997) tables which have the failure rate in failures per million hours The fourth column contains the time to repair in repairs per year and is calculated by dividing the number of hoursyear (8760) by the hoursrepair from SINTEF (1997) The availability the last column is obtained by dividing the third column by the sum of the third and fourth columns
22
Paste figure here
Figure 10 Safety Flow Chart for Offshore Production Facility (from API RP 14C)
23
Table 2 Failure Data for Basic Events in Surface System Fault Tree
No Basic
Failure Events
Failure Rates of Basic Events
(Failures per Year)
Repair Times for Basic Events
(Repairs per Year) Availability of
Failure 1TSE (Temp Safety Element) 0068 43800 00000016 2ESD (Emerg Shut Down) 0092 2623 000035 3Air 1 4ASH (Gas Detector) 0042 151034 0000028 5Vent 018 730 000025 6Containment 00004 5214 00000077 7Containment 00004 5214 00000077 8ESD (Emerg Shut Down) 0092 2623 000035 9PSL (Pressure Safety Low) 02 7552 000026
10FSV (Flow Safety Valve) 28 58013 00048 11LSL (Level Safety Low) 101 11089 000091 12LSH (Level Safety High) 101 11089 000091 13Pressure Vessel 02 10318 000019 14Accident 00004 2 000005 15Compressor 47 15587 0029 16Pump 26 2163 0012 17Heat Exchanger 00034 11188 000003 18Vessel 047 84231 000056 19Valves 283 34488 00081 20Pressure Vessel 02 10318 000019 21PSH (Pressure Safety High) 02 7552 000026 22PSV (Pressure Safety Valve) 195 3449 00056 23Pump 141 2177 00064 24Flowline 00045 6126 00000073 25Compressor 998 13508 0069 26Heat Exchanger 0018 656 000027 27Ventilation 018 730 000025 28PSV (Pressure Safety Valve) 195 3449 00056 29Atmospheric Vessel 0009 8423 0000011 30LSL (Level Safety Low) 101 11089 000091 31Pressure Vessel 02 10318 000019 32Atmospheric Vessel 0009 8423 0000011 33Pressure Vessel 02 10318 000019 34PSL (Pressure Safety Low) 02 75517 000026 35Ventilation 018 730 000025 36PSV (Pressure Safety Valve) 195 3449 00035 37Atmospheric Vessel 0009 8423 0000011 38Reboiler 0009 8423 0000011 39FSL (Flow Safety Low) 0024 14600 00000016 40TSH (Temp Safety High) 0068 43800 00000016 41Reboiler 0009 8423 0000011 42LSL (Level Safety Low) 0053 11089 0000048
24
43TSH (Temp Safety High) 0068 43800 00000016 44TSH (Temp Safety High) 0068 43800 00000016 45Pressure Vessel 02 10318 000019 46Compressor 61 2218 0027 47Fuel Control 007 8505 0000082 48TSH (Temp Safety High) 0068 43800 00000016 49TSH (Temp Safety High) 0068 43800 00000016 50IPM (Ignition Prev Measures) 0042 151034 0000028 51Flame Emission 0083 2163 000038 52PSL (Pressure Safety Low) 0011 75517 0000015 53Motor Starter Interlock 013 2163 00006 54Spark Emission 876 8760 0001 55Arrestor 00088 365 0000024 56BSL (Burner Safety Low) 0069 13477 0000051 57Fuel Gas Supply 007 8505 0000082 58PSL (Pressure Safety Low) 0011 75517 0000015 59Air Supply Control 0083 2163 000038 60PSL (Pressure Safety Low) 0011 75517 0000015 61Motor Starter Interlock 013 2163 00006
25
Facility Damage Or Leak
Air (3) A
Excess Fuel
B
Fire or Explosion TSE
(1) ESD (2)
Ignition
I Pollution
Intermediate State
I ASH (4)
Vent (5)
Cont (6) Cont
(7) ESD (8)
Intermediate State
Figure 11a Top Fault Tree for Damage or Leak
26
I
Intermediate State
Release of Hydrocarbons
PSL (9)
FSV (10)
LSL (11)
Overflow Process EquipmentFailure
LSH (12)
P Ves (13)
Accidnt (14) C
Excess Temperature
at Component
Mechanical Deterioration O
Overpressure
D
Underpressure
Comp Pump (16)
Valves (15)
Ht Ex (17) (19)
Vessel (18)
Figure 11b Intermediate State Fault Tree
27
Pump (23)
Overpressure
O
Comp (25)
Flwlin (24)
Ht Ex (26)
PSH (21)
G P Ves (20) PSV
(28) G
A Ves (29) PSV
(22) Vent (27)
Gas Blow by Gas Blow by
LSL (30)
P Ves (31)
A Ves (32)
Figure 11c Overpressure Fault Tree
28
D
Underpressure
P Ves (33)
PSL (34)
Vent (35
PSV (36)
A Ves (37)
Figure 11d Underpressure Fault Tree
29
Excess Temperatureat Component
C
Low Flow Limited Heat Low Level Excess Fuel Transfer
(38) (39) (40) Reblr FSL TSH TSH
(44) P Ves
(45) Comp
(46)
Reblr (41)
LSL (42)
TSH (43)
Fuel C (47)
TSH (48)
TSH (49)
Figure 11e Excess Temperature at Component Fault Tree
30
A
Ignition
IPM (50)
Flame (51)
PSL (52)
M Str (53)
Spark (54)
Arstr (55)
Figure 11f Ignition Fault Tree
31
B
Excess Fuel
BSL (56)
BSL (58)
Fuel (57)
Air Ctl (59)
M Str (61)
PSL (60)
Figure 11g Excess Fuel Fault Tree
32
The subsea portion of the fault tree was developed using the generalized subsea architecture shown in Figure 4 The control systems controlling single satellite wells and more complex subsea production facilities such as multi-well manifold template systems can be broken into subsystems as shown in Figure 12
Failure modes for the subsystems shown in Figure 12 include Electrical Power Failure - Pod (EFP) Hydraulic Power Failure - Connector (HFC) Hydraulic Power Failure - Line (HFL) Hydraulic Power Failure - Pod (HFP) Signal Transmission Failure - Connector (SFC) Signal Transmission Failure - Line (SFL) Signal Transmission Failure - Pod (SFP) Signal Transmission Failure - Surface (SFS)
These failure modes are independent events represented as ldquoORrdquo gates on a fault tree Ultimately however these ldquoORrdquo gates are combined because any one fault causes complete system failure
The block diagram of the subsea control subsystems shown in Figure 12 illustrates the flow of electrical power hydraulic and communications signals that could lead to a critical failure It should be noted that this is essentially a series system from a reliability point of view (any failure leads to system failure) There are two areas where redundancy occurs (1) the redundant subsea control modules at either the well or the subsea manifold and (2) the redundant PLCs at the host facility In both cases the failure of the redundant set is considered the basic event and the failure rate is selected accordingly With these assumptions the fault tree will consist of only basic events ldquoORrdquo gates and derived states including the top event
It should also be noted that three basic events are actually combinations of two or more fundamental events (1) the electrical power failure of the pod (EFP) could be either a short circuit at the pod connector or a general electric failure in the subsea control unit (2) the signal transmission failure in the line (SFL) could be either a blocked or plugged sensor or a faulty signal line (3) the signal transmission failure at the pod (SFP) could be either a pilot valve control failure or a subsystem faulty signal
Using the block diagram in Figure 12 the fault tree diagram in Figure 13 can be drawn In this fault tree diagram hydraulic failures (HFC HFL or HFOP) and signal failures (SFP SFC or SFL) can occur for any of the n satellite wells In addition signal failures on the surface (SFS) can occur for any of the m group controls Once again the failure rates used account for this fact (Effective failure rate equals n or m times component failure rate)
33
Topside
Hydraulic power unit
Hydraulic Lines surface
termination
Electric power unit
Electric Lines surface
termination
Electric Lines
Electric Lines subsea
termination
Electric template
trunk lines
Surface control unit
Signal Lines surface
termination
Signal Lines
Signal Lines subsea
termination
Signal template
trunk lines
Control pod electronics
Um
bilic
al
Hydraulic Lines
Hydraulic Lines subsea
termination
Hydraulic template
trunk lines
Control pod hydraulics
Baseplate
Control Pod
Figure 12 Subsea Control Subsystems
34
Critical Failure
HFLEFP HFP SFCHFC SFP SFSSFL
OR
Figure 13 Fault Tree for Subsea SCADA
Based on the data from SINTEF (1997) the following fault rates are used for the basic events in the fault tree
EFP = 428 HFC = 381 SFP = 381 SFS = 1369 HFL = 762 SFC = 190 HFP = 190 SFL = 574
where all fault rates are in failures per million hours It is easily seen that the electric power failure at the pod (EFP) and the signal transmission failure - line (SFL) are the dominant failure modes The overall failure rate for critical failures is 13293 failures per million hours or about 116 failures per year This corresponds to a mean time to failure of about 086 years
This failure rate may seem high but in this context a ldquocritical failurerdquo means loss of automatic control Oil spills will also require a simultaneous leak in a critical valve component This aspect of the reliability study has not been addressed
Calculating the Availability of the Top Event
Processing the availabilities of component failures through a series of ANDOR gates in a fault tree is a well established process In general an AND gate with n inputs each with availability of failure of qi results in a new state with availability
35
A(output of AND gate ) = q q Lqi 2 n
n
= prodq i i=1
In the case of an OR gate the availability of the new state when there are n inputs each with availability of failure of qi is
( ( L 1 qA(output of OR gate ) = minus minus 1 1 q ) 1minus q ) ( minus )i 2 n
1 q= minusprodn
(1minus i ) i=1
A program capable of performing these operations for a general fault tree without dependent basic events was available and was used to calculate the availability of the top event in these fault trees
Remember availability of the top event is the fraction of time a system of components with repair will be in an unsuccessful or failed state
Non-Independent Basic Events
The above calculation would be rather routine if it were not for the problem of non-independent basic events The fault tree for the surface system has nine basic events that are repeated They are failure of bull Pressure safety valve (PSV) bull Pressure vessel bull Level safety low (LSL) bull Atmospheric vessel bull Ventilation bull Pressure safety low (PSL) bull Temperature safety high (PSH) bull Motor Starter Interlock bull Containment
These particular basic events occur at more than one point in the fault tree This complicates the calculation because if the basic event occurs at one input with availability of failure qi then it must occur at all other locations with availability of 1 Similarly if it does not occur at one input with availability 1 - qi then it does not occur at all other locations with availability of 0
Consider a fault tree with one basic event q1 that is repeated The availability of the top event can be found using Bayes Theorem as
36
A(top event ) = q A (topevent q occurs )+ (1minus q ) A(top event q doesnt occur )1 1 2 1
q1 occurs ) can be found by forcing q1 = 1 and calculating the The term A(top event unavailability of the top event using the fault tree program In a similar fashion A(top event q1 doesnt occur ) can be found by forcing q1 = 0 and using the fault tree program
When nine repeated basic events occur the situation is somewhat more complicated Now one must consider all combinations of these nine events Since each event can occur or not occur there are 29 = 512 combinations In theory the program should be run 512 times In reality one can get a very good approximation by considering only ten of the 512 states These ten states are the following
State 1 No basic event failures exist or qi = 0 i = 1 9 State 2 rarr 10 One and only one basic event failure exists or
q1 = 1 qi = 0 i = 1 9 and i ne 1 q2 = 1 qi = 0 i = 1 9 and i ne 2 etc
Then the availability of the top event will be
9
all q = 0)A(top event ) = prod(1 = qi ) A(top event i i=1
9 9 +sumqi prod(1minus q j )A(top event all q = 0 except q = 1)j i
i=1 j=1 j ine
The terms that are neglected all have more than one factor of qi Since these terms are small the product of two or more of these terms is negligibly small
When the preceding calculation was done for the surface system a very small availability of the top event resulted (76times10-13) This is logical since any path through the fault tree from basic events to top event involves at least four or five failures with availabilities in the 10-3 or 10-4 range When these are processed through AND gates one winds up with (10-3 or 10-4)-m where m is 3 or 4
The subsea portion of the fault tree is somewhat simpler and represents more of a ldquoseriesrdquo type system where one or two failures can lead to the top event Even though individual availabilities of failure are relatively small because of the nature of the system and its fault tree the availability of the top event is 000618 This corresponds to about 50 hours
37
of outage per year In terms of events per year the top event would have a frequency of 116 failuresyear
It should be noted that compressors and pumps have high failure rates and contribute the most to the occurrence of the top event Containment is also a key since it strongly influences the occurrence of the top event
Failure of the SCADA System
Figure 14 shows the fault tree for a typical SCADA system as shown in Figure 2 Using failure rates and repair rates availabilities and unavailabilities can be found for each subsystem The communication network failure availability is from one operator The other availabilities are from SINTEF (1997) The availability of the top event (failure of the SCADA system) can be found by analyzing the fault tree diagram with the basic event data of Table 3 Calculating this value results in the availability of the top event (SCADA system failed) equal to 12times10-2 Note that the failure rate is dominated by the communication network
The low availability values for the SCADA system failure and the surfacesubsea failure makes it unlikely that these two events could occur simultaneously The overall availability of a surfacesubsea failure and a SCADA failure is about 83times10-4 If such an event took an average of one hour to repair this would lead to a failure rate of about 8300 failures106 hours or about one failure in 14 years
38
Failure of SCADA
Remote Comm PC Network (1) (2)
Scndry PrmryPC PC (3) (4)
A CompPLC (6)
Wst Ht PLC (8)
Alarm Turbine PLC PLC (10) (11)
Wtrfld PLC (13)
Turbine PLC (15)
VRU EmergPLC
LACT PLC
(9) (7) Filter PLC PLC(5) (16)
Well PLC (12)
Sfty SysPLC (14)
Figure 14 Fault Tree for Distributed Platform SCADA System
39
Table 3 Failure Data for Basic Events in SCADA Fault Tree
No Basic Events
Failure Rates of Basic Events (Failures per Year)
Repair Times for Basic Events (Repairs per Year)
Availability of Failure
1Remote PC 1075 21366 00005 2Comm System 1091 8760 001
3 4PC 1075 21366 00005 5-16PLC 118 79636 000015
Pipelines
Figure 15 shows the fault tree for a typical offshore pipeline as shown in Figure 5 The corresponding failure rate information is in Table 4
The pipeline failure rate is from the US Dept of Transportation (DOT 2000) In 14 years 2827 failures have occurred Average pipeline mileage is 154265 miles So one can conclude that 142827=202 failures per year By dividing 202 failuresper year by the average mileage we have 1310-3 failures per year per mile This number includes both offshore and onshore pipelines It also includes all types of failures The failure rate in Table 4 assumes a 30 mile pipeline The other numbers are from SINTEF 1997
For this failure data the probability of the top event (MTBF) is 67910-3 (failures per year) For the same data the unavailability of the system is 26710-2 Therefore the availability of the system is 09733
The SCADA system for a pipeline is generally less complicated than the distributed platform Nevertheless we can assume the reliability is probably about the same since the reliability of the platform system is dominated by the communication system
Table 4 Failure Data for Pipeline Fault Tree
No Basic Events
Failure Rates of Basic Events (Failures per Year)
Repair Times for Basic Events (Repairs per Year)
Availability of Failure
1Press Sensor 001 755 0117 2Shut-off Valve 003 10950 01169 3Pipeline 0039 183 012 4Valve 011 345 0026 5Pump 003 322 0094
40
Release of hydrocarbon
Failure of safety system
Pressure Sensor
(1)
Shut-off Valve
(2)
Failure of pipeline system
Pipeline (3)
Pump (5)
Valve (4)
Figure 15 Pipeline Fault Tree
Human Error
One of the most difficult tasks in a reliability study is to assess the relative importance of human error versus component failures One of the investigators on this project spent several years applying reliability techniques to electrical safety in underground coal mines In the course of analyzing historical data on safety it became clear that the majority of fatalities and lost-time injuries resulted from human error In fact human error was the source of two thirds of the fatalities and lost-time injuries
Data exist on the frequency of human error in common tasks found in an industrial environment (Henley and Kumamoto 1992 Shooman 1968) The fact that there is a high degree of automation in the operation should minimize the chance of human error
For the SCADA systems used in offshore platforms there is not much need for human actions The SCADA system can fail because of incorrect human action at the remote PC and one of the PLCrsquos shown as the fault tree in Figure 16 For each PLC the probability of checking the wrong indicator lamp on the local operator panel is 0003 (Henley and Kumamoto 1985) For the PC the probability of wrongly reading an indicator is 0001 (Henley and Kumamoto 1985) Using these numbers the human reliability in the SCADA system is 0999964 The human error probability is 1-0999964=35410-5
Since the system is highly automated the reliability number is considerably relevant
41
Human-induced Failure
of SCADA
Remote PC (1)
A CompPLC (3)
Wst Ht PLC (5)
Alarm Turbine PLC PLC (7) (8)
Wtrfld PLC (10)
Turbine PLC (12)
VRU LACT PLC (4)
EmergPLC (6)
Filter PLC Well PLC (9) PLC(2)
Sfty SysPLC (11) (13)
An area of future study should be to analyze significant failures to determine the relative influence of hardware failuressoftware failureshuman error
Figure 16 Human-induced SCADA Failure Fault Tree
Software Reliability
The software reliability was approached in a manner similar to that of the overall SCADA system The fault tree is the same as for the SCADA system (Figure 14) but with the failure information shown in Table 5
For each PC in the SCADA system there are 12266 failures per 106 hours According to OREDA (SINTEF 1997) 561 of these failures are due to software failures Thus one
42
can calculate 688 (12266561 =688) failures per 106 hours The MTTR for PCrsquos is 41 hours From this information the software availability is calculated as 099997
The failure rate compares in a similar way to digital controllers used in the nuclear industry which have a failure rate of 10-7 ndash 10-9
For each PLC there are 13483 failures per 106 hours Assuming 561 of these failures are due to software failures there are 756 (13483561=756) failures per million hours The MTTR for a PLC is 11 hours From this information the calculated software availability is 099999
For the routers the assumption is that 561 of the failures are software failures Communication link availability is assumed to be the same as for the analysis of the entire SCADA system
The overall availability of the software for the system is 09906 As with the previous SCADA system analysis communication links dominate the calculations
Table 5 Software-induced Failure Data for Basic Events in SCADA Fault Tree
No Basic Events
Failure Rates of Basic Events (Failures per Year)
Repair Times for Basic Events (Repairs per Year)
Availability of Failure
1Remote PC 0060 21366 000003 2Comm System 1091 8760 001
34PC 0060 21366 000003 5-16PLC 0066 79636 000001
Operator Reliability Experience
All of the operators indicated that distant network communications is the weak link in all of their systems The conversion of analog microwave to a digital microwave network that has a loop architecture has helped in this regard Nevertheless the operators program their systems to reliably function even when communications are disrupted
In the electronic control system the end devices (sensors actuators) are the most unreliable parts The PLC rarely fails For example one operator with 200 PLCs had one PLC processor failure in 10 years
In general operators were reluctant to share their operational reliability information
43
Summary of Reliability Analysis Results
System Surface Subsea SurfaceSubsea SCADA (Platform Pipeline) SurfaceSubseaSCADA Pipeline Human Error Software
MTBF (years) Failure Availability 25times108
086 086 009 14
00068 NA
0095
76times10-13
000618 000618 0012
000083 0027
0000035
00094
human error probability
Software Quality
According to the surveyed operators software products are selected for offshore platform and pipeline systems based on many of the following features bull Operating system supported (Windows NT or UNIX) bull Range of supported PLCDCSRTU vendors and communication protocols bull Ease of modification bull Intranet Web bull DDE interface bull Alarming bull Historical trending bull Built-in diagnostics
Many of the offshore operators use Wonderware InTouch because it is easy to learn and modify it also supports a large number of PLC and RTU vendors Rockwell Software is another leading vendor Others include Intellution Siemens GE Fanuc and CiTech In addition users and third parties often develop interfaces for special or obscure equipment
Vendors and operators are always reluctant to share defect data software companies are no different Thus in order to gain an alternate appreciation of software quality and reliability we also chose a qualitative and more subjective approach We requested an interview of the major software vendors to discuss their software development and maintenance processes including quality assurance (QA) We assured them that no comments would be attributed to a specific source but that we whould share summary information and highlight best practices again in a non-attributional fashion A questionnaire was developed based on the Software Engineering Institutes Software Capability Maturity Model (Humphrey and Sweet 1987) and on industrial software supplier evaluation processes (Nielsen and Miller 1996) The questionnaire was provided
44
to the vendors prior to the interview The complete questionnaire is included in Appendix A
Software Survey Results
Software products included control software and human-machine interface software Typically development teams are small in size and focus on a particular aspect of the total software package The total software products are large (15 ndash 2 Million Lines of Code)
The following contains a list of best practices and a list of deficiencies which were found No single company performed all of the best practices no single vendor had all of the noted deficiencies Those software development teams with established engineering roots in the company seem to have the best processes Smaller software-only companies tend to have less well-defined processes and operate more on an ad hoc basis However as those companies addressed the issue of multiple releases and long-term maintenance they have instituted additional processes and some have utilized third-party vendors for maintenance and configuration management
Best practices noted among the interviewees were
bull A defined software process that is utilized throughout the organization The process does not need to be cumbersome or labor-intensive in fact some of the best were quite streamlined the important aspect is that the process was consistently applied Training in the process for new hires was also noted as a best practice
bull Migration to a common software infrastructure Several of the vendors are developing a framework into which existing components (either in-house or from other vendors) can be ldquopluggedrdquo This allows for shared components reducing development time and redundancy of information
bull Frequent solicitation of customer input requirements and satisfaction through well-defined channels The best vendors had a formal mechanism by which they could learn of new customer expectations as well as problems and issues
bull On-line sites for customer access of updates issues and information Many have websites for customers One vendor moderates a website in which customers provide feedback and carry discussion threads on various topics of interest
bull Software teams which included staff with industrial experience using SCADA equipment (the highest percentage found was 15) These individuals tended to serve as application engineers and product architects rather than as programmers or testers
bull Reviews at various phases of development that include participants from other development teams as well as test and QA
bull Previews or ldquolook-aheadrdquo meetings that bring together software architects and application engineers to determine risks and potential pitfalls of next phase of development
bull Concern for documentation ease of use by customeroperator bull Independent test teams with separate reporting relationship from development team
45
Deficiencies noted include
bull Ill-defined software development processes or multiple processes that vary from team to team
bull Conducting reviews in which not all parties have examined the material in advance or in which not all perspectives are present
bull Lack of formal regression testing procedures and test suites bull Lack of emphasis on failure scenario tests bull Lack of concern for intrusion detection capability
Lastly while vendors stated that they had requirements for safety reliability quality and real-time operation no one shared specific quantifiable requirements This is an area for further exploration
46
Recommendations
Based on the reliability assessment of current SCADA technology we propose the following additional guidelines for those operators that use SCADA systems These are in addition to the guidelines in NTL N00G06 (effective February 4 2000) bull All developed software for SCADA systems should follow a defined software
process that process does not necessarily need to be an SEI or ISO or IEEE standard although those may be applicable This recommendation applies both to software developed by the vendors and application-specific software developed by the operatorsvendorscontractors
bull Software should also be tested for survivability under typical intrusion mechanisms such as buffer overrun If the software contains embedded third-party components those components should be thoroughly tested within the total system This includes testing of ldquonegative requirementsrdquo that is testing of features of the embedded component that should not be activated in the larger framework
bull Critical parts of the system such as the emergency shutdown system should be redundant For subsea systems the communication channels should be redundant
Other recommendations bull MMS should organize a project to collect failure data that is not covered by current
SINTEF projects Specifically operators in the OCS of North America should be surveyed to collect data on pneumatic safety systems pipeline system components and human operators This project should be organized like the SINTEF projects
bull MMS should survey offshore platform operators concerning their long-term plans about remotely operating offshore platforms from the shore
bull MMS should require a reliability assessment of complete subsea processing systems
47
References
API 1998 Recommended Practice 14C sixth edition March 1998 Recommended Practice for Analysis Design Installation and Testing of Basic Surface Safety Systems for Offshore Production Platforms
ARC Advisory Group 1999 Oil amp Gas Water SCADA Systems Global Outlook ARC Advisory Group Dedham MA 399
Bellcore 1992 Reliability Prediction for Electronic Equipment Report TR-NWT-000332 Issue 4 September
Billinton R and RN Allan 1992 Reliability Evaluation of Engineering Systems Concepts and Techniques 2nd Ed New York Plenum Press
DOD (US Department of Defense) 1991 Reliability Prediction of Electronic Equipment Mil-Handbook-217F New York Griffiss Air Force Base December
DOT ( US Department of Transporation) Office of Pipeline Safety 2000 Pipeline Statistics Web page address httpopsdotgovstatshtm
Gertman and Blackman 1994 Human Reliability and Safety Analysis Handbook New York Wiley
Henley EJ and H Kumamoto 1985 Designing for Reliability and Safety Control New Jersey Prentice-Hall Inc
Henley EJ and H Kumamoto 1992 Probabilistic Risk Assessment New York IEEE Press
Humphrey W and W Sweet 1987 A Method for Assessing the Software Engineering Capability of Contractors Tech Report CMUSEI-87-TR23 Pittsburgh Software Eng Inst
IEEE (Institute of Electrical and Electronics Engineers) 1983 IEEE Guide to Collection and Presentation of Electrical Electronic and Sensing Component and Mechanical Equipment Reliability Data for Nuclear Power Generating Stations Std 500-1984 New York IEEE
ISA (Instrument Society of America) 1998 ldquoSCADA Software Rounduprdquo Industrial Computing 17 18-37 October
Mitchell CM and K Williams 1993 ldquoFailure Experience of Programmable Logic Controllers Used in Emergency Shutdown Systemsrdquo Reliability Engineering and System Safety 39329-331
48
Musa JD A Iannino and K Okumoto Software Reliability Measurement Prediction Application McGraw-Hill 1987
Neilsen J and A Miller 1996 ldquoSelecting Software Subcontractorsrdquo IEEE Software 104-109 July
Paula HM 1993 ldquoFailure Rates for Programmable Logic Controllersrdquo Reliability Engineering and System Safety 39325-328
Paula HM MW Roberts and RE Battle 1993 ldquoOperational Failure Experience of Fault-tolerant Digital Control Systemsrdquo Reliability Engineering and System Safety 39273-289
Paulk M B Curtis M Chrissis C Weber 1993 Capability Maturity Model for Software Version 11 Tech Report CMUSEI-93-TR-24 Pittsburgh Software Eng Inst
RAC (Reliability Analysis Center) 1995 Nonelectronic Parts Reliability Data 1995 Rome N Y Reliability Analysis Center
Shooman Martin L Probabilistic Reliability An Engineering Approach McGraw-Hill New York 1968
SINTEF 1997 OREDA - Offshore Reliability Data 3rd Edition SINTEF Industrial Management Trondheim Norway
USNRC (U S Nuclear Regulatory Commission) 1975 Reactor Safety Study An Assessment of Accident Risks in US Commercial Nuclear Plants NUREG-75014 USNRC Report WASH-1400 Washington DC USNRC October
USNRC 1980 Data Summaries of Licensee Event Reports of Diesel Generators at US Commercial Nuclear Plants NUREGCR-1362 Washington DC USNRC March
USNRC 1982a Data Summaries of Licensee Event Reports of Pumps at US Commercial Nuclear Plants NUREGCR-1205 Washington DC USNRC January
USNRC 1982b Data Summaries of Licensee Event Reports of Valves at US Commercial Nuclear Plants NUREGCR-1363 Washington DC USNRC October
USNRC 1993 Software Reliability and Safety in Nuclear Protection Systems NUREGCR-6101 Washington DC USNRC
Wheeler DA B Brykczynski and RN Meeson (eds) 1996 Software Inspection An Industry Best Practice New York IEEE Press
49
50
Appendix A
SCADA SOFTWARE QUESTIONNAIRE
University of Missouri ndash Rolla for
Department of the Interior MMS Technology Assessment and Research Program SOL 14335-01-99-RP-3995
Survey Participants
Senior Executive (30 minutes) SCADA product development manager (60 minutes) SCADA product marketing manager (60 minutes) QA manager or a QA engineer (60 minutes) Team meeting with a developer a tester and a configuration manager (60 minutes)
Questions
General Management
What is the vision of the company How do the communications control and SCADA products fit within the companys product line With regard to communications control and SCADA applications does the company produce software only or systems of software and hardware What levels of the organization have direct customer contact If individuals do not have direct customer contact who internally serves as their customer interface Who internally serves as customer advocate How is customer satisfaction measured (all measures that apply)
SCADA Software Process Information Personnel
What is the size of the software team What percentage are developers Testers Other team members How many have had industrial experience using SCADA equipment (Numbers or percent of total) What training is provided to new hires (General andor SCADA-specific) Is there an annual training goal Is it a mandate an opportunity or something in between Is there a training course or program for new managers If so what topics
51
SCADA Software Process Information Requirements and Configuration Management
How are customer requirements determined How are product requirements determined What quantifiable requirements exist for Safety Reliability Quality Real-time Operation How are requirements tracked throughout the product development life cycle How are releases determined and how is functionality assigned to releases How are releases managed How are customer-reported defects fixed (Work-around patches andor new releases)
SCADA Software Process Information Development
What automated tool support is used Is any of the communicationscontrolSCADA software externally supplied If so subcontract development or COTS product
SCADA Software Process Information Test and Quality Assurance
What internal reviews and audits are regular activities (SEI CMM ISO etc) What standard reviews and audits are regular activities (SEI CMM ISO etc) For each of these what is the periodicity of reviewaudit How are defects identified fixed tracked and verified Is the test team independent of the development team What is the reporting relationship of the test team relative to the development team What levels and types of testing are performed How are fail-safe requirements if any tested How are real-time requirements if any tested Who approves product releaseshipment On what basis If a customer purchases your software product what if any are the stated liabilities
52
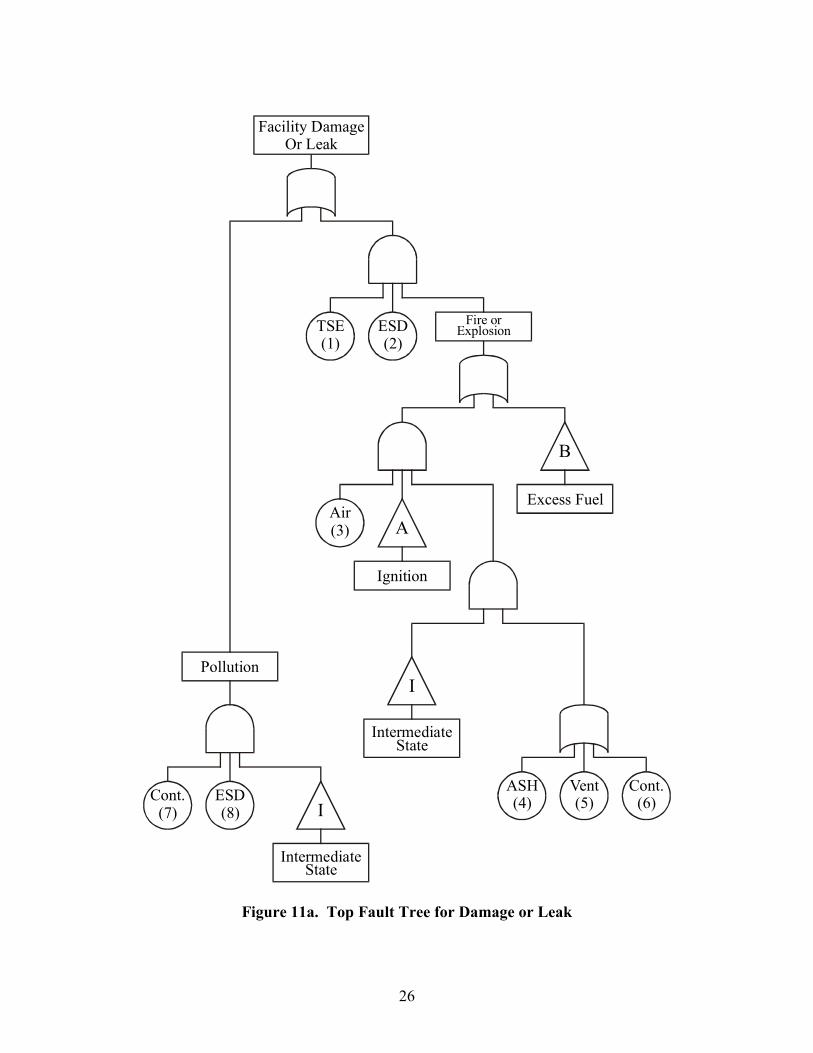