Embed Size (px)
Citation preview
SURVEY OF SCHOOLS: ICT IN EDUCATION
COUNTRY PROFILE: ESTONIA
November 2012
Page 2
This report was prepared by the Contractor: European Schoolnet and University of Liège under contract SMART 2010/0039.
The views expressed in this report are those of the authors and do not necessarily reflect those of the European Commission. Neither the European Commission nor any person acting on behalf of the Commission is responsible for the information provided in this document.
Copyright 2012. Material in this report may be freely reproduced provided the source is acknowledged.
Page 3
Table of Contents
1. Introduction ............................................................................................................................................... 4
ICT in the school education system of Estonia ............................................................................................ 4
The Survey of Schools: ICT in Education ..................................................................................................... 4
2. ICT infrastructure ...................................................................................................................................... 6
Availability of computers for educational purposes ...................................................................................... 6
Broadband .................................................................................................................................................... 7
‘Connectedness’ ........................................................................................................................................... 8
3. Frequency of ICT use in class .................................................................................................................. 9
Frequency of ICT use by teachers in class .................................................................................................. 9
Students’ ICT use ....................................................................................................................................... 10
4. Digital confidence ................................................................................................................................... 12
Teachers .................................................................................................................................................... 12
Students ..................................................................................................................................................... 13
5. Professional development ...................................................................................................................... 15
Time spent on training ................................................................................................................................ 15
Engagement in training .............................................................................................................................. 16
6. School support measures ....................................................................................................................... 18
ICT coordinator ........................................................................................................................................... 18
Incentives ................................................................................................................................................... 19
7: Clusters .................................................................................................................................................. 21
The digitally supportive school ................................................................................................................... 21
Digitally confident and supportive teachers ................................................................................................ 22
The digitally supportive student .................................................................................................................. 23
The digitally equipped school ..................................................................................................................... 24
Conclusion ...................................................................................................................................................... 26
ANNEX ........................................................................................................................................................... 27
Tables ......................................................................................................................................................... 27
Notes .......................................................................................................................................................... 32
Page 4
1. INTRODUCTION
ICT IN THE SCHOOL EDUCATION SYSTEM OF ESTONIA
In Estonia the education system is centrally managed by the ministry of Education and Research. Primary and lower secondary education is organised as a single structure system, beginning at the age of seven and consisting of nine years of compulsory schooling. Upper secondary education is not compulsory, but the vast majority of the population participates. The standard of basic education (requirements for the contents of studies and study results) is determined by the national curriculum for basic schools.1
According to Eurydice’s Key Data on Learning and Innovation through ICT at school in Europe2, in Estonia there are national strategies covering training measures in all areas3 as well as research in the areas of ICT in schools, e-learning, and digital/media literacy. There are central steering documents for ICT learning objectives4 at both primary and secondary education level for, using a computer, using office applications, and searching for information, and also in using mobile devices at secondary level. In primary and secondary schools ICT is taught as a general tool for other subjects/or as a tool for specific tasks in other subjects, and in addition in secondary schools ICT is included within technology as a subject, and also taught as a separate subject. At primary and secondary education level recommendations or suggestions and support are provided in all ICT hardware areas, except for e-book readers, and for all ICT software categories5 except communication software. According to official steering documents, both students and teachers at secondary level are expected to use ICT in all subjects both in class and for complementary activities. There are central recommendations on the use of ICT in student assessment as regards using ICT as an information source in traditional tests. Public-private partnerships for promoting the use of ICT are encouraged for ICT training for pupils/students, and for providing extra-curricular activities.
THE SURVEY OF SCHOOLS: ICT IN EDUCATION
In 2011, the European Commission Directorate General Communications Networks, Content and Technology6 launched the Survey of Schools: ICT in Education, the primary goal of which is to benchmark countries' performance in terms of access, use and attitudes to ICT at grades 4, 8 and 11. The Survey of Schools is one of a series within the European Union's cross-sector benchmarking activities comparing national progress to Digital Agenda for Europe (DAE) and EU2020 goals. The
1 https://webgate.ec.europa.eu/fpfis/mwikis/eurydice/index.php?title=Home
2 http://eacea.ec.europa.eu/education/eurydice/documents/key data series/129EN.pdf, published in 2011, specifically the following tables and associated commentaries: A6, B6, B7, C2, C3, C4, C12 and E10
3 from the following areas: ICT in schools, e-learning, e-inclusion, digital/media literacy, e-skills development
4 i.e. knowledge of computer hardware and electronics, using a computer, using mobile devices, using office applications, searching for information, using multimedia, developing programming skills, and using social media
5 from a range of hardware and software, i.e. computers, projectors or beamers, DVDs, videos, TV, cameras, mobile devices, e-book readers, smartboards, virtual learning environments; tutorial software, office applications, multimedia applications, digital learning games, communication software, digital resources
6 www.ec.europa.eu/dgs/connect/
Page 5
Survey is funded by the European Commission Communications Networks, Content and Technology Directorate General and is a partnership between European Schoolnet and the Service d’Approches Quantitatives des faits éducatifs in the Department of Education of the University of Liège. The survey took place between January 2011 and May 2012, with data collection in autumn 2011, and covered 31 countries (the EU27, Croatia, Iceland, Norway and Turkey). In four countries (Germany, Iceland, Netherlands and the United Kingdom) the response rate was insufficient, making reliable analysis of the data impossible; therefore the findings in this report are based on data from 27 countries.
This country profile should be read in conjunction with the Report of the Survey of Schools: ICT in Education (the ‘main report’). The profile presents key indicators concerning access, use and attitudes to Information and Communication Technology in primary and secondary schools derived from responses to surveys completed by head teachers, teachers and students, showing national results against the EU average and, where possible, for grade 8 only. Charts for this grade are shown but not for other grades for reasons of brevity and clarity and because results at this grade tend to be indicative of all grades (i.e. having the characteristics and revealing issues found both at grade 4 and at grade 11). The text provides information about the results and rankings at other grades and a reference to the particular chart in the main report.
The full report, country profiles, background information, questionnaires, tables, details of the methodology and the raw data are freely available at https://ec.europa.eu/digital-agenda/en/pillar-6-enhancing-digital-literacy-skills-and-inclusion. The authors may be contacted at [email protected] and information about the survey is at http://essie.eun.org.
Page 6
2. ICT INFRASTRUCTURE
AVAILABILITY OF COMPUTERS FOR EDUCATIONAL PURPOSES
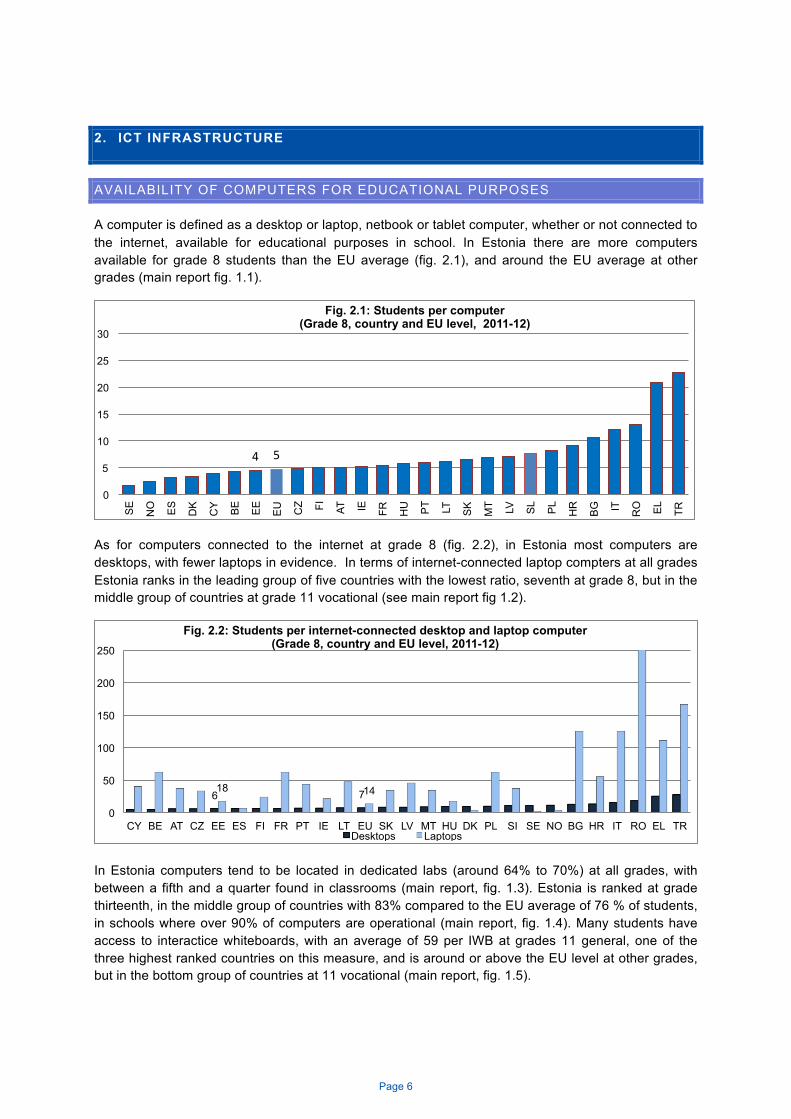
A computer is defined as a desktop or laptop, netbook or tablet computer, whether or not connected to the internet, available for educational purposes in school. In Estonia there are more computers available for grade 8 students than the EU average (fig. 2.1), and around the EU average at other grades (main report fig. 1.1).
As for computers connected to the internet at grade 8 (fig. 2.2), in Estonia most computers are desktops, with fewer laptops in evidence. In terms of internet-connected laptop compters at all grades Estonia ranks in the leading group of five countries with the lowest ratio, seventh at grade 8, but in the middle group of countries at grade 11 vocational (see main report fig 1.2).
In Estonia computers tend to be located in dedicated labs (around 64% to 70%) at all grades, with between a fifth and a quarter found in classrooms (main report, fig. 1.3). Estonia is ranked at grade thirteenth, in the middle group of countries with 83% compared to the EU average of 76 % of students, in schools where over 90% of computers are operational (main report, fig. 1.4). Many students have access to interactice whiteboards, with an average of 59 per IWB at grades 11 general, one of the three highest ranked countries on this measure, and is around or above the EU level at other grades, but in the bottom group of countries at 11 vocational (main report, fig. 1.5).
4 5
0
5
10
15
20
25
30
SE
NO
ES
DK
CY BE
EE
EU
CZ FI
AT
IE
FR
HU
PT LT
SK
MT LV
SL
PL
HR
BG
IT
RO
EL
TR
Fig. 2.1: Students per computer (Grade 8, country and EU level, 2011-12)
6 7 18 14
0
50
100
150
200
250
CY BE AT CZ EE ES FI FR PT IE LT EU SK LV MT HU DK PL SI SE NO BG HR IT RO EL TR
Fig. 2.2: Students per internet-connected desktop and laptop computer (Grade 8, country and EU level, 2011-12)
Desktops Laptops
Page 7
BROADBAND
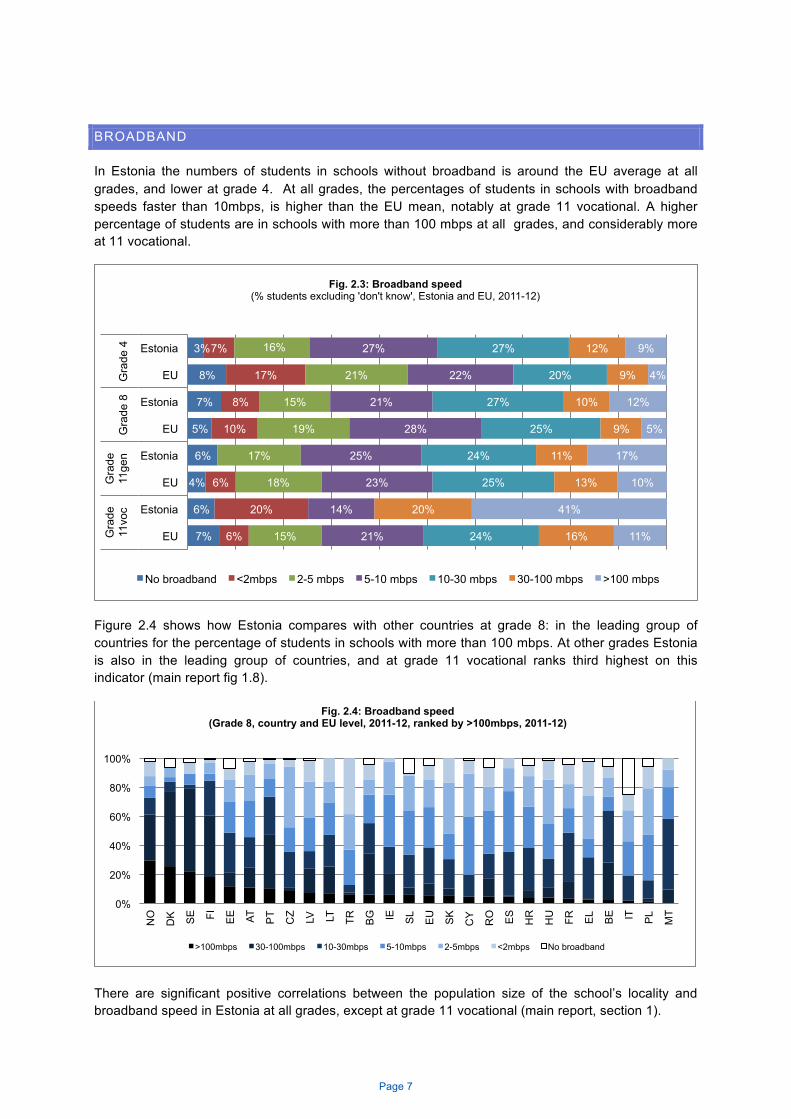
In Estonia the numbers of students in schools without broadband is around the EU average at all grades, and lower at grade 4. At all grades, the percentages of students in schools with broadband speeds faster than 10mbps, is higher than the EU mean, notably at grade 11 vocational. A higher percentage of students are in schools with more than 100 mbps at all grades, and considerably more at 11 vocational.
Figure 2.4 shows how Estonia compares with other countries at grade 8: in the leading group of countries for the percentage of students in schools with more than 100 mbps. At other grades Estonia is also in the leading group of countries, and at grade 11 vocational ranks third highest on this indicator (main report fig 1.8).
There are significant positive correlations between the population size of the school’s locality and broadband speed in Estonia at all grades, except at grade 11 vocational (main report, section 1).
3%
8%
7%
5%
6%
4%
6%
7%
7%
17%
8%
10%
6%
20%
6%
16%
21%
15%
19%
17%
18%
15%
27%
22%
21%
28%
25%
23%
14%
21%
27%
20%
27%
25%
24%
25%
24%
12%
9%
10%
9%
11%
13%
20%
16%
9%
4%
12%
5%
17%
10%
41%
11%
0% 10% 20% 30% 40% 50% 60% 70% 80% 90% 100%
Estonia
EU
Estonia
EU
Estonia
EU
Estonia
EU
Gra
de 4
G
rade
8
Gra
de
11ge
n G
rade
11
voc
Fig. 2.3: Broadband speed (% students excluding 'don't know', Estonia and EU, 2011-12)
No broadband <2mbps 2-5 mbps 5-10 mbps 10-30 mbps 30-100 mbps >100 mbps
0%
20%
40%
60%
80%
100%
NO
DK
SE
FI
EE
AT
PT
CZ LV
LT
TR
BG
IE
SL
EU
SK
CY
RO
ES
HR
HU
FR
EL
BE
IT
PL
MT
Fig. 2.4: Broadband speed (Grade 8, country and EU level, 2011-12, ranked by >100mbps, 2011-12)
>100mbps 30-100mbps 10-30mbps 5-10mbps 2-5mbps <2mbps No broadband
Page 8
‘CONNECTEDNESS’
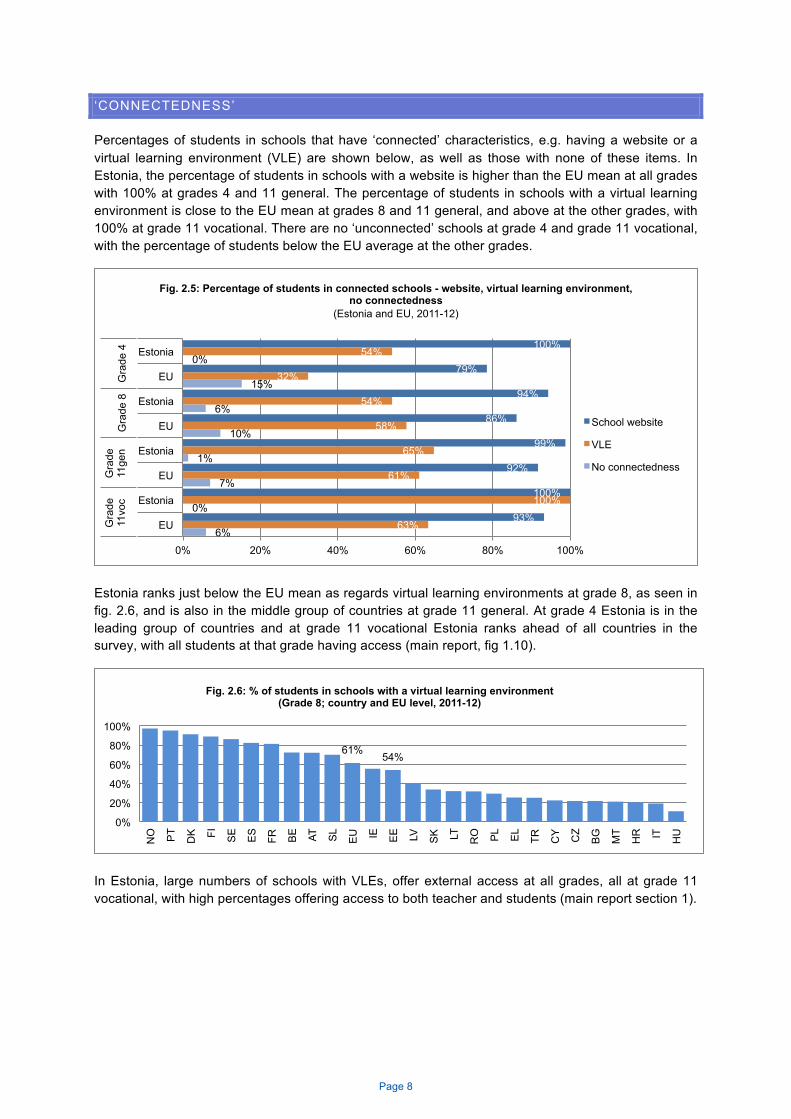
Percentages of students in schools that have ‘connected’ characteristics, e.g. having a website or a virtual learning environment (VLE) are shown below, as well as those with none of these items. In Estonia, the percentage of students in schools with a website is higher than the EU mean at all grades with 100% at grades 4 and 11 general. The percentage of students in schools with a virtual learning environment is close to the EU mean at grades 8 and 11 general, and above at the other grades, with 100% at grade 11 vocational. There are no ‘unconnected’ schools at grade 4 and grade 11 vocational, with the percentage of students below the EU average at the other grades.
Estonia ranks just below the EU mean as regards virtual learning environments at grade 8, as seen in fig. 2.6, and is also in the middle group of countries at grade 11 general. At grade 4 Estonia is in the leading group of countries and at grade 11 vocational Estonia ranks ahead of all countries in the survey, with all students at that grade having access (main report, fig 1.10).
In Estonia, large numbers of schools with VLEs, offer external access at all grades, all at grade 11 vocational, with high percentages offering access to both teacher and students (main report section 1).
100%
79%
94%
86%
99%
92%
100%
93%
54%
32%
54%
58%
65%
61%
100%
63%
0%
15%
6%
10%
1%
7%
0%
6% 0% 20% 40% 60% 80% 100%
Estonia
EU
Estonia
EU
Estonia
EU
Estonia
EU
Gra
de 4
G
rade
8
Gra
de
11ge
n G
rade
11
voc
Fig. 2.5: Percentage of students in connected schools - website, virtual learning environment, no connectedness
(Estonia and EU, 2011-12)
School website
VLE
No connectedness
61% 54%
0%
20%
40%
60%
80%
100%
NO
PT
DK
FI
SE
ES
FR
BE
AT
SL
EU
IE
EE
LV
SK
LT
RO
PL
EL
TR
CY CZ
BG
MT
HR
IT
HU
Fig. 2.6: % of students in schools with a virtual learning environment
(Grade 8; country and EU level, 2011-12)
Page 9
3. FREQUENCY OF ICT USE IN CLASS
FREQUENCY OF ICT USE BY TEACHERS IN CLASS
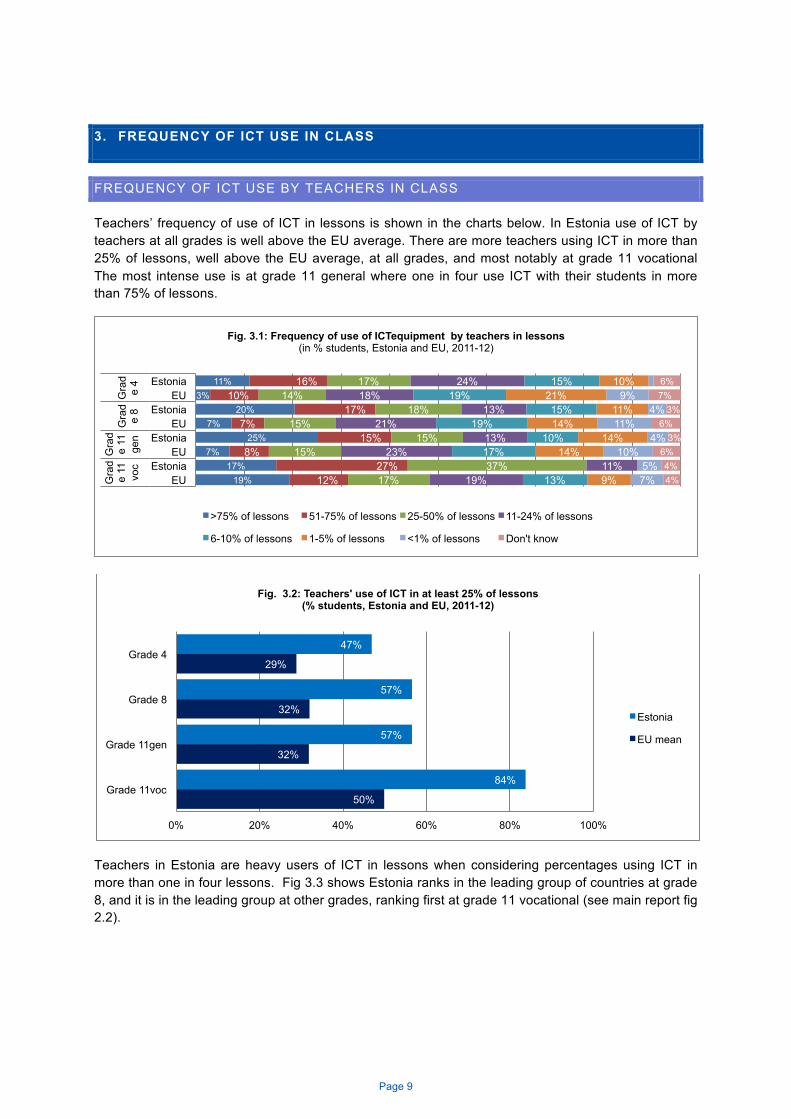
Teachers’ frequency of use of ICT in lessons is shown in the charts below. In Estonia use of ICT by teachers at all grades is well above the EU average. There are more teachers using ICT in more than 25% of lessons, well above the EU average, at all grades, and most notably at grade 11 vocational The most intense use is at grade 11 general where one in four use ICT with their students in more than 75% of lessons.
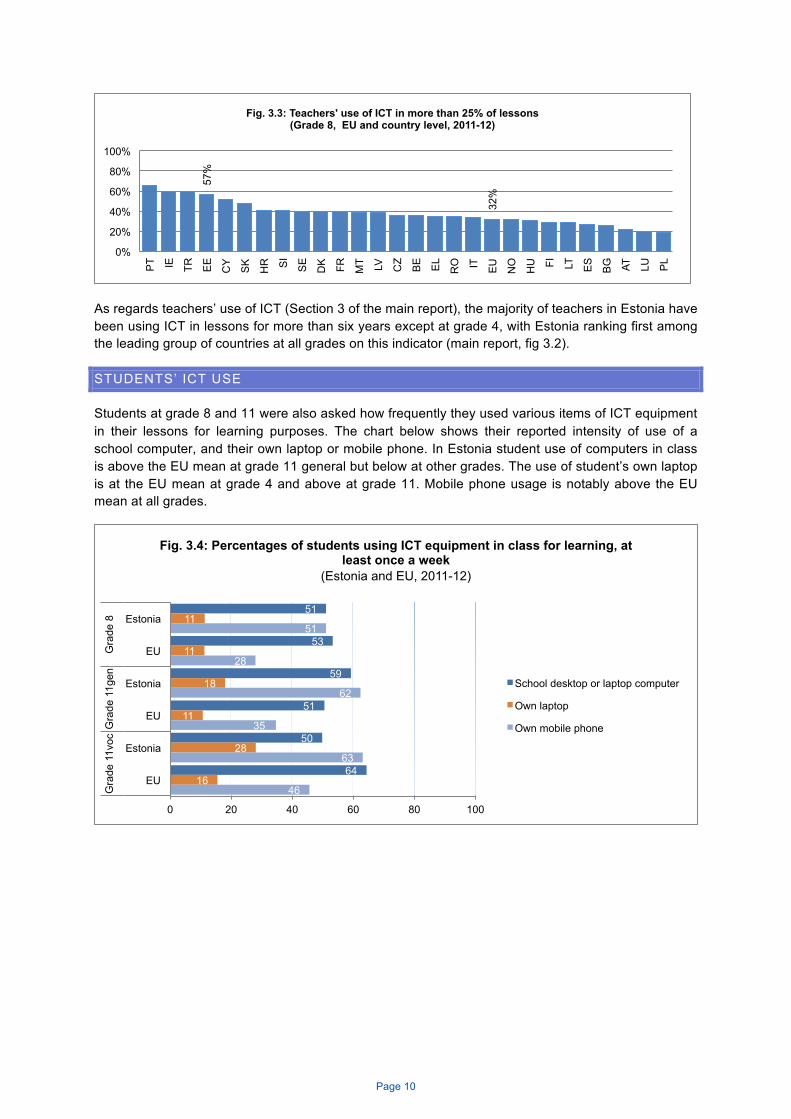
Teachers in Estonia are heavy users of ICT in lessons when considering percentages using ICT in more than one in four lessons. Fig 3.3 shows Estonia ranks in the leading group of countries at grade 8, and it is in the leading group at other grades, ranking first at grade 11 vocational (see main report fig 2.2).
11% 3%
20% 7%
25% 7%
17% 19%
16% 10%
17% 7%
15% 8%
27% 12%
17% 14%
18% 15%
15% 15%
37% 17%
24% 18%
13% 21%
13% 23%
11% 19%
15% 19%
15% 19%
10% 17%
13%
10% 21%
11% 14%
14% 14%
9%
9% 4%
11% 4%
10% 5% 7%
6% 7%
3% 6%
3% 6% 4% 4%
Estonia EU
Estonia EU
Estonia EU
Estonia EU
Gra
de
4 G
rad
e 8
Gra
de
11
gen
Gra
de
11
voc
Fig. 3.1: Frequency of use of ICTequipment by teachers in lessons (in % students, Estonia and EU, 2011-12)
>75% of lessons 51-75% of lessons 25-50% of lessons 11-24% of lessons
6-10% of lessons 1-5% of lessons <1% of lessons Don't know
47%
57%
57%
84%
29%
32%
32%
50%
0% 20% 40% 60% 80% 100%
Grade 4
Grade 8
Grade 11gen
Grade 11voc
Fig. 3.2: Teachers' use of ICT in at least 25% of lessons (% students, Estonia and EU, 2011-12)
Estonia
EU mean
Page 10
As regards teachers’ use of ICT (Section 3 of the main report), the majority of teachers in Estonia have been using ICT in lessons for more than six years except at grade 4, with Estonia ranking first among the leading group of countries at all grades on this indicator (main report, fig 3.2).
STUDENTS’ ICT USE
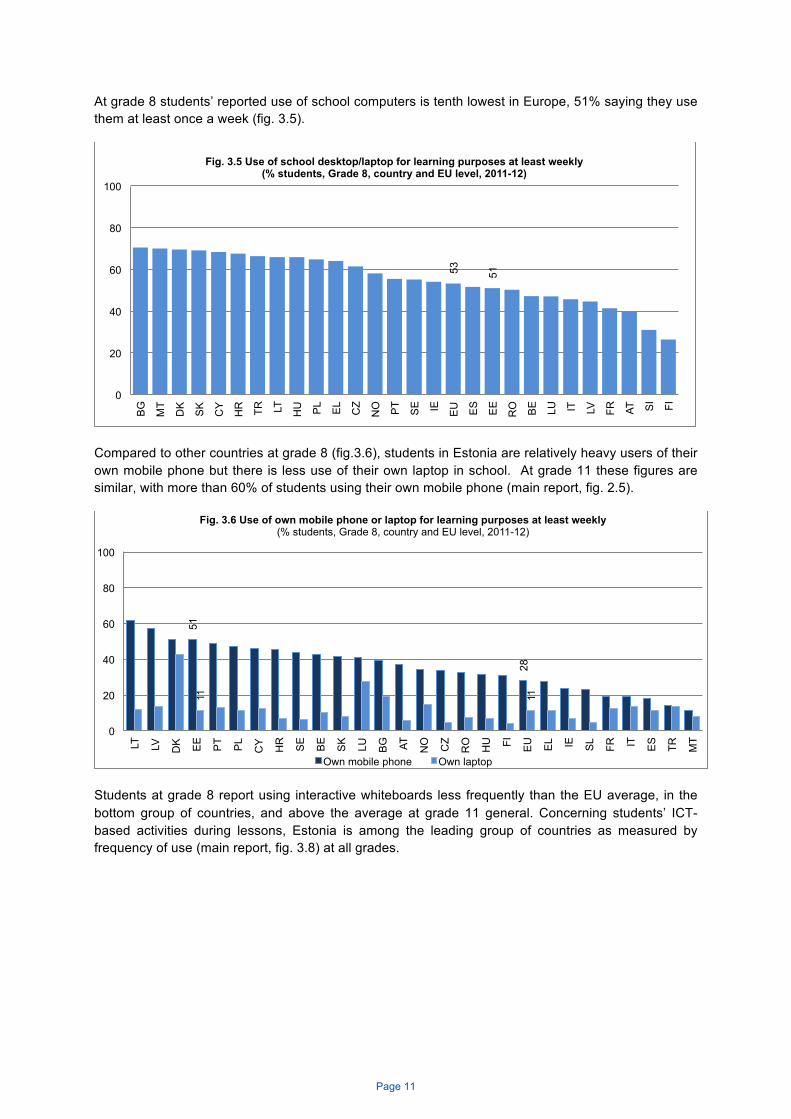
Students at grade 8 and 11 were also asked how frequently they used various items of ICT equipment in their lessons for learning purposes. The chart below shows their reported intensity of use of a school computer, and their own laptop or mobile phone. In Estonia student use of computers in class is above the EU mean at grade 11 general but below at other grades. The use of student’s own laptop is at the EU mean at grade 4 and above at grade 11. Mobile phone usage is notably above the EU mean at all grades.
57%
32%
0%
20%
40%
60%
80%
100% P
T IE
TR
EE
CY
SK
HR
SI
SE
DK
FR
MT LV
CZ
BE
EL
RO
IT
EU
NO
HU
FI
LT
ES
BG
AT
LU
PL
Fig. 3.3: Teachers' use of ICT in more than 25% of lessons (Grade 8, EU and country level, 2011-12)
51
53
59
51
50
64
11
11
18
11
28
16
51
28
62
35
63
46
0 20 40 60 80 100
Estonia
EU
Estonia
EU
Estonia
EU
Gra
de 8
G
rade
11g
en
Gra
de 1
1voc
Fig. 3.4: Percentages of students using ICT equipment in class for learning, at least once a week
(Estonia and EU, 2011-12)
School desktop or laptop computer
Own laptop
Own mobile phone
Page 11
At grade 8 students’ reported use of school computers is tenth lowest in Europe, 51% saying they use them at least once a week (fig. 3.5).
Compared to other countries at grade 8 (fig.3.6), students in Estonia are relatively heavy users of their own mobile phone but there is less use of their own laptop in school. At grade 11 these figures are similar, with more than 60% of students using their own mobile phone (main report, fig. 2.5).
Students at grade 8 report using interactive whiteboards less frequently than the EU average, in the bottom group of countries, and above the average at grade 11 general. Concerning students’ ICT-based activities during lessons, Estonia is among the leading group of countries as measured by frequency of use (main report, fig. 3.8) at all grades.
53
51
0
20
40
60
80
100
BG
MT
DK
SK
CY
HR
TR
LT
HU
PL
EL
CZ
NO
PT
SE
IE
EU
ES
EE
RO
BE
LU
IT
LV
FR
AT
SI FI
Fig. 3.5 Use of school desktop/laptop for learning purposes at least weekly (% students, Grade 8, country and EU level, 2011-12)
51
28
11
11
0
20
40
60
80
100
LT
LV
DK
EE
PT PL
CY HR
SE
BE
SK
LU
BG
AT
NO
CZ
RO
HU
FI
EU
EL IE
SL
FR
IT
ES
TR
MT
Fig. 3.6 Use of own mobile phone or laptop for learning purposes at least weekly (% students, Grade 8, country and EU level, 2011-12)
Own mobile phone Own laptop
Page 12
4. DIGITAL CONFIDENCE
TEACHERS
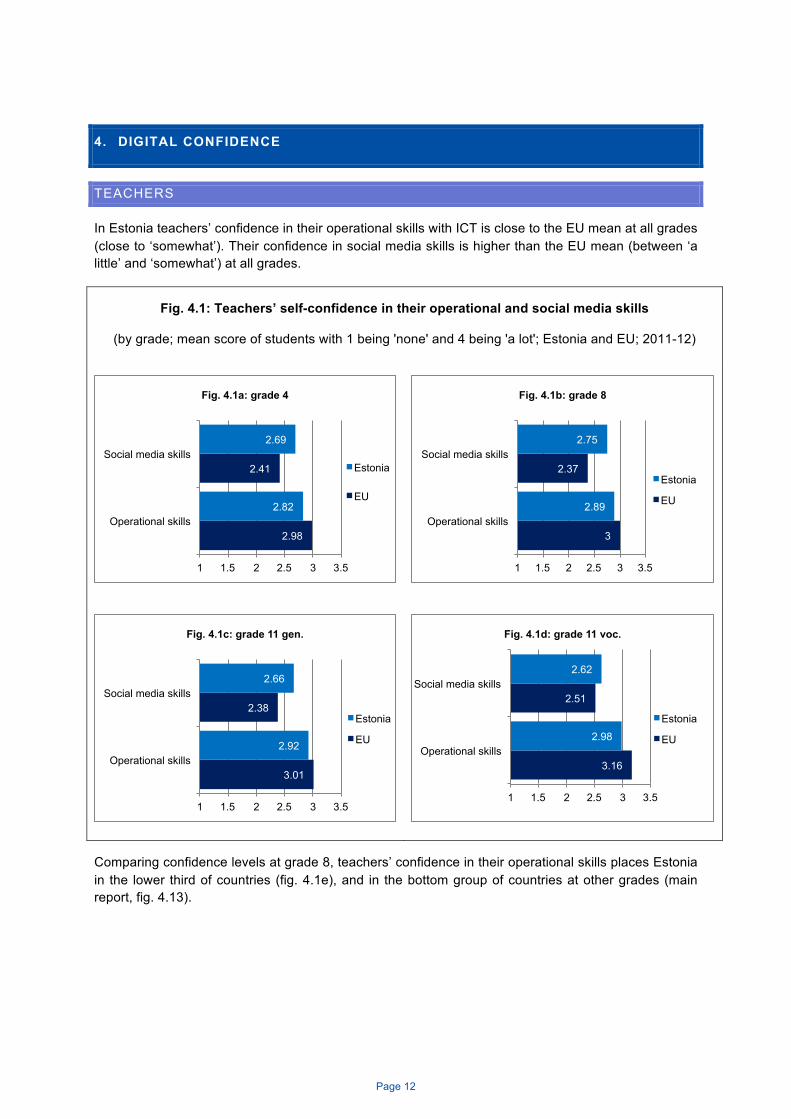
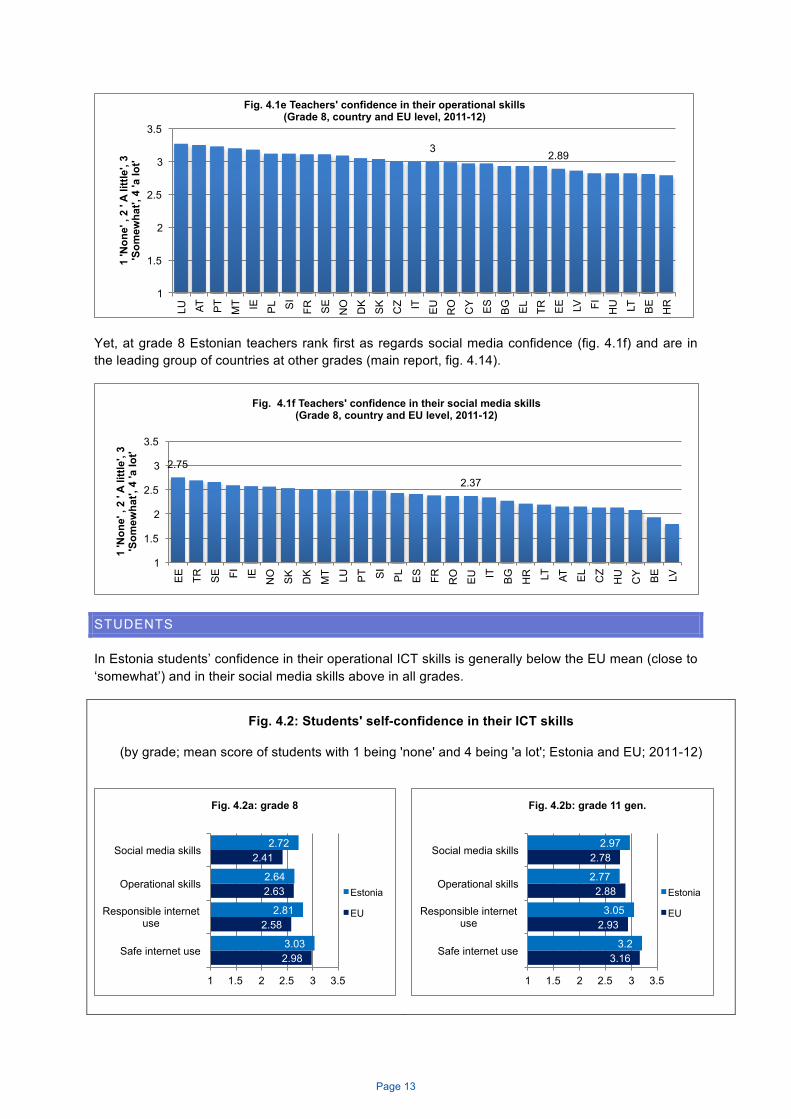
In Estonia teachers’ confidence in their operational skills with ICT is close to the EU mean at all grades (close to ‘somewhat’). Their confidence in social media skills is higher than the EU mean (between ‘a little’ and ‘somewhat’) at all grades.
Fig. 4.1: Teachers’ self-confidence in their operational and social media skills
(by grade; mean score of students with 1 being 'none' and 4 being 'a lot'; Estonia and EU; 2011-12)
Comparing confidence levels at grade 8, teachers’ confidence in their operational skills places Estonia in the lower third of countries (fig. 4.1e), and in the bottom group of countries at other grades (main report, fig. 4.13).
2.98
2.41
2.82
2.69
1 1.5 2 2.5 3 3.5
Operational skills
Social media skills
Fig. 4.1a: grade 4
Estonia
EU
3
2.37
2.89
2.75
1 1.5 2 2.5 3 3.5
Operational skills
Social media skills
Fig. 4.1b: grade 8
Estonia
EU
3.01
2.38
2.92
2.66
1 1.5 2 2.5 3 3.5
Operational skills
Social media skills
Fig. 4.1c: grade 11 gen.
Estonia
EU
3.16
2.51
2.98
2.62
1 1.5 2 2.5 3 3.5
Operational skills
Social media skills
Fig. 4.1d: grade 11 voc.
Estonia
EU
Page 13
Yet, at grade 8 Estonian teachers rank first as regards social media confidence (fig. 4.1f) and are in the leading group of countries at other grades (main report, fig. 4.14).
STUDENTS
In Estonia students’ confidence in their operational ICT skills is generally below the EU mean (close to ‘somewhat’) and in their social media skills above in all grades.
Fig. 4.2: Students' self-confidence in their ICT skills
(by grade; mean score of students with 1 being 'none' and 4 being 'a lot'; Estonia and EU; 2011-12)
3 2.89
1
1.5
2
2.5
3
3.5
LU
AT
PT
MT IE
PL SI
FR
SE
NO
DK
SK
CZ IT
EU
RO
CY ES
BG
EL
TR
EE
LV
FI
HU
LT
BE
HR
1 'N
one'
, 2
' A li
ttle'
, 3
'Som
ewha
t', 4
'a lo
t'
Fig. 4.1e Teachers' confidence in their operational skills (Grade 8, country and EU level, 2011-12)
2.75
2.37
1
1.5
2
2.5
3
3.5
EE
TR
SE
FI
IE
NO
SK
DK
MT LU
PT SI
PL
ES
FR
RO
EU
IT
BG
HR
LT
AT
EL
CZ
HU
CY BE
LV
1 'N
one'
, 2
' A li
ttle'
, 3
'Som
ewha
t', 4
'a lo
t'
Fig. 4.1f Teachers' confidence in their social media skills (Grade 8, country and EU level, 2011-12)
2.98
2.58
2.63
2.41
3.03
2.81
2.64
2.72
1 1.5 2 2.5 3 3.5
Safe internet use
Responsible internet use
Operational skills
Social media skills
Fig. 4.2a: grade 8
Estonia
EU
3.16
2.93
2.88
2.78
3.2
3.05
2.77
2.97
1 1.5 2 2.5 3 3.5
Safe internet use
Responsible internet use
Operational skills
Social media skills
Fig. 4.2b: grade 11 gen.
Estonia
EU
Page 14
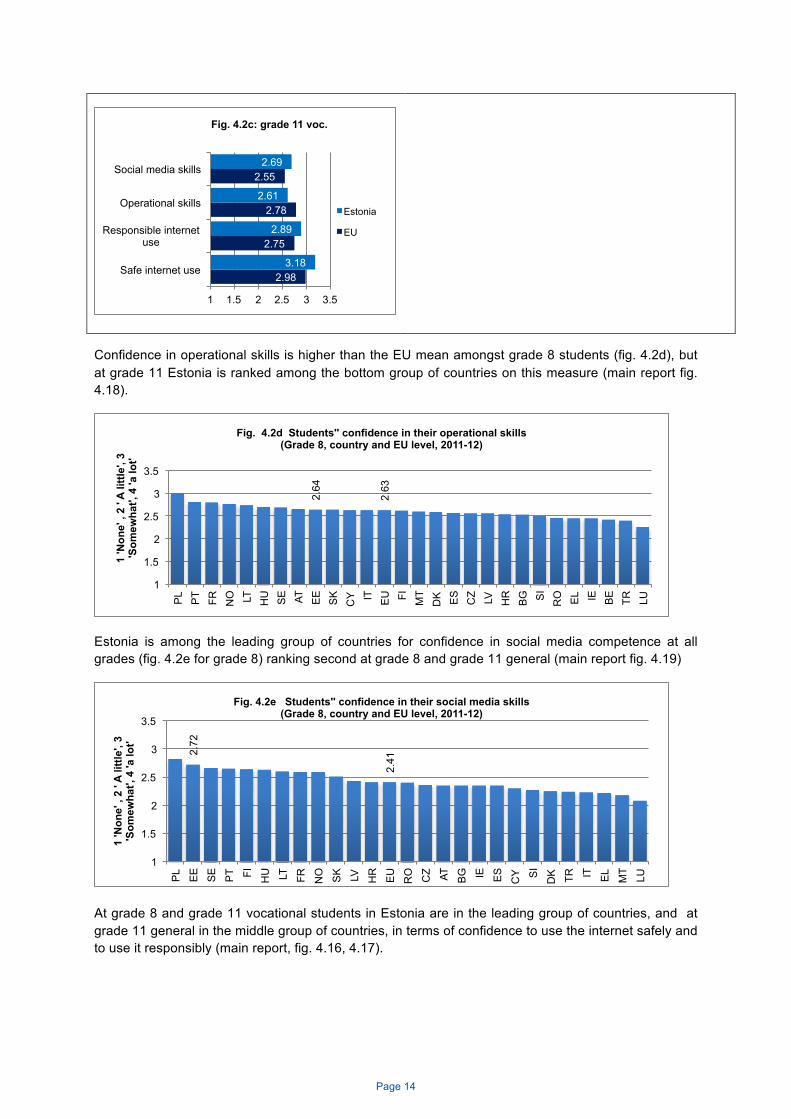
Confidence in operational skills is higher than the EU mean amongst grade 8 students (fig. 4.2d), but at grade 11 Estonia is ranked among the bottom group of countries on this measure (main report fig. 4.18).
Estonia is among the leading group of countries for confidence in social media competence at all grades (fig. 4.2e for grade 8) ranking second at grade 8 and grade 11 general (main report fig. 4.19)
At grade 8 and grade 11 vocational students in Estonia are in the leading group of countries, and at grade 11 general in the middle group of countries, in terms of confidence to use the internet safely and to use it responsibly (main report, fig. 4.16, 4.17).
2.98
2.75
2.78
2.55
3.18
2.89
2.61
2.69
1 1.5 2 2.5 3 3.5
Safe internet use
Responsible internet use
Operational skills
Social media skills
Fig. 4.2c: grade 11 voc.
Estonia
EU
2.64
2.63
1
1.5
2
2.5
3
3.5
PL
PT
FR
NO
LT
H
U
SE
AT
E
E
SK
C
Y IT
EU
FI
M
T D
K
ES
C
Z LV
HR
B
G
SI
RO
E
L IE
BE
TR
LU
1 'N
one'
, 2
' A li
ttle'
, 3
'Som
ewha
t', 4
'a lo
t'
Fig. 4.2d Students'' confidence in their operational skills (Grade 8, country and EU level, 2011-12)
2.72
2.41
1
1.5
2
2.5
3
3.5
PL
EE
SE
PT FI
HU
LT
FR
NO
SK
LV
HR
EU
RO
CZ AT
BG
IE
ES
CY SI
DK
TR
IT
EL
MT
LU
1 'N
one'
, 2
' A li
ttle'
, 3
'Som
ewha
t', 4
'a lo
t'
Fig. 4.2e Students'' confidence in their social media skills (Grade 8, country and EU level, 2011-12)
Page 15
5. PROFESSIONAL DEVELOPMENT
TIME SPENT ON TRAINING
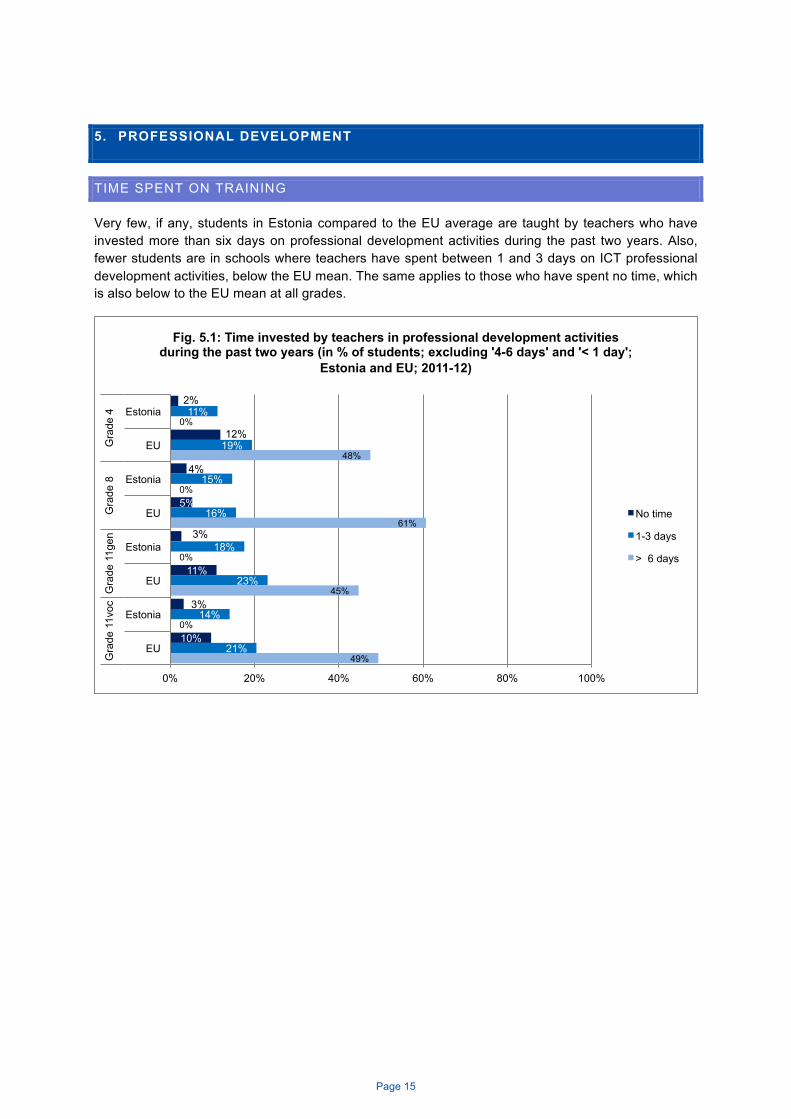
Very few, if any, students in Estonia compared to the EU average are taught by teachers who have invested more than six days on professional development activities during the past two years. Also, fewer students are in schools where teachers have spent between 1 and 3 days on ICT professional development activities, below the EU mean. The same applies to those who have spent no time, which is also below to the EU mean at all grades.
2%
12%
4%
5%
3%
11%
3%
10%
11%
19%
15%
16%
18%
23%
14%
21%
0%
48%
0%
61%
0%
45%
0%
49%
0% 20% 40% 60% 80% 100%
Estonia
EU
Estonia
EU
Estonia
EU
Estonia
EU
Gra
de 4
G
rade
8
Gra
de 1
1gen
G
rade
11v
oc
Fig. 5.1: Time invested by teachers in professional development activities during the past two years (in % of students; excluding '4-6 days' and '< 1 day';
Estonia and EU; 2011-12)
No time
1-3 days
> 6 days
Page 16
ENGAGEMENT IN TRAINING
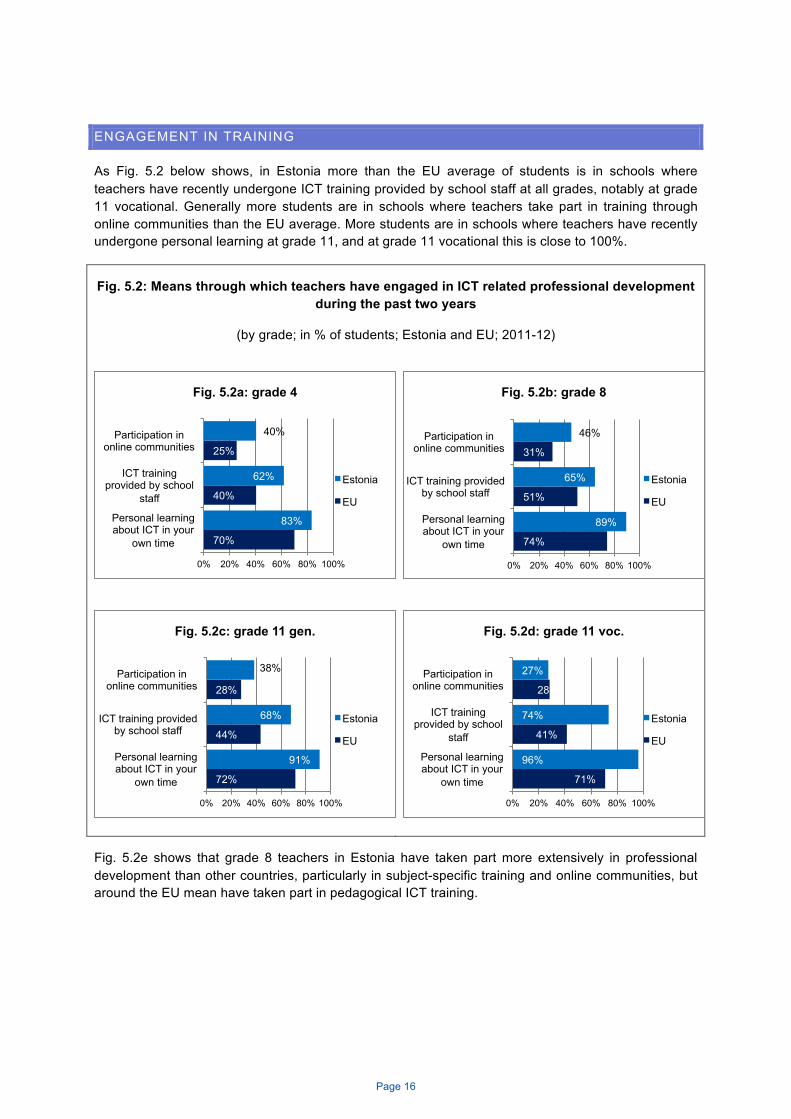
As Fig. 5.2 below shows, in Estonia more than the EU average of students is in schools where teachers have recently undergone ICT training provided by school staff at all grades, notably at grade 11 vocational. Generally more students are in schools where teachers take part in training through online communities than the EU average. More students are in schools where teachers have recently undergone personal learning at grade 11, and at grade 11 vocational this is close to 100%.
Fig. 5.2: Means through which teachers have engaged in ICT related professional development during the past two years
(by grade; in % of students; Estonia and EU; 2011-12)
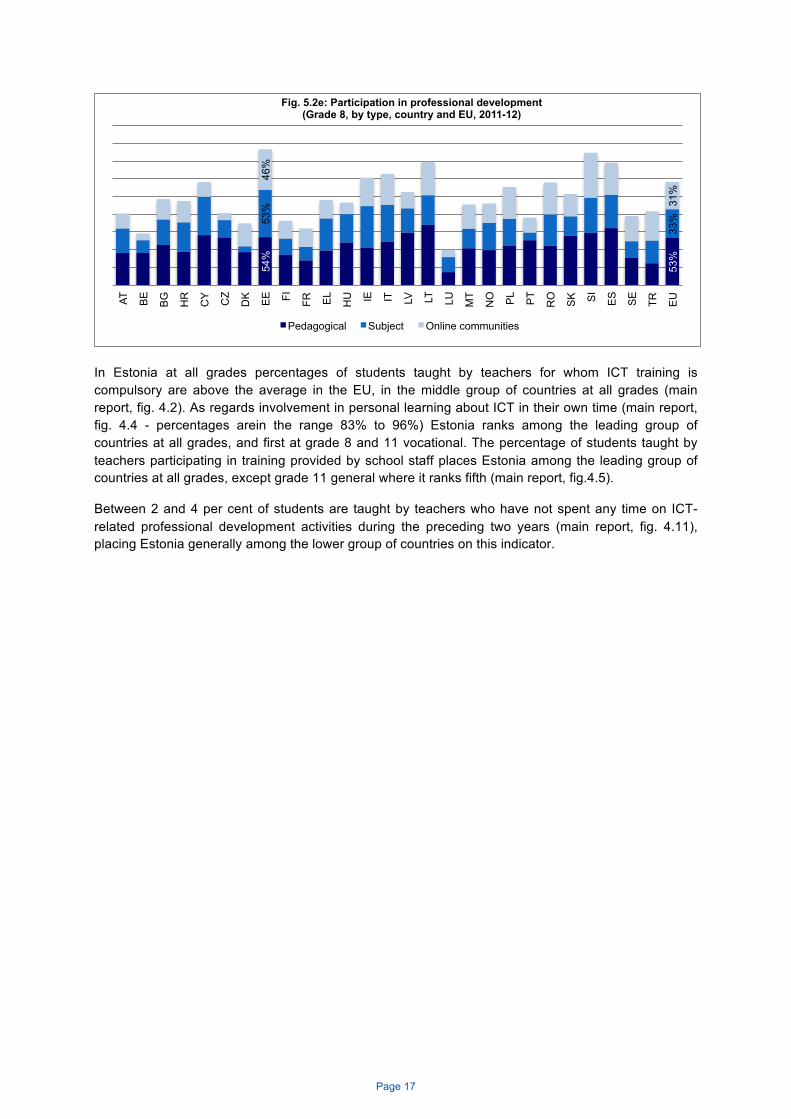
Fig. 5.2e shows that grade 8 teachers in Estonia have taken part more extensively in professional development than other countries, particularly in subject-specific training and online communities, but around the EU mean have taken part in pedagogical ICT training.
70%
40%
25%
83%
62%
40%
0% 20% 40% 60% 80% 100%
Personal learning about ICT in your
own time
ICT training provided by school
staff
Participation in online communities
Fig. 5.2a: grade 4
Estonia
EU
74%
51%
31%
89%
65%
46%
0% 20% 40% 60% 80% 100%
Personal learning about ICT in your
own time
ICT training provided by school staff
Participation in online communities
Fig. 5.2b: grade 8
Estonia
EU
72%
44%
28%
91%
68%
38%
0% 20% 40% 60% 80% 100%
Personal learning about ICT in your
own time
ICT training provided by school staff
Participation in online communities
Fig. 5.2c: grade 11 gen.
Estonia
EU
71%
41%
28%
96%
74%
27%
0% 20% 40% 60% 80% 100%
Personal learning about ICT in your
own time
ICT training provided by school
staff
Participation in online communities
Fig. 5.2d: grade 11 voc.
Estonia
EU
Page 17
In Estonia at all grades percentages of students taught by teachers for whom ICT training is compulsory are above the average in the EU, in the middle group of countries at all grades (main report, fig. 4.2). As regards involvement in personal learning about ICT in their own time (main report, fig. 4.4 - percentages arein the range 83% to 96%) Estonia ranks among the leading group of countries at all grades, and first at grade 8 and 11 vocational. The percentage of students taught by teachers participating in training provided by school staff places Estonia among the leading group of countries at all grades, except grade 11 general where it ranks fifth (main report, fig.4.5).
Between 2 and 4 per cent of students are taught by teachers who have not spent any time on ICT-related professional development activities during the preceding two years (main report, fig. 4.11), placing Estonia generally among the lower group of countries on this indicator.
54%
53%
53%
33%
46%
31%
AT
BE
BG
HR
CY CZ
DK
EE
FI
FR
EL
HU
IE
IT
LV
LT
LU
MT
NO
PL
PT
RO
SK
SI
ES
SE
TR
EU
Fig. 5.2e: Participation in professional development (Grade 8, by type, country and EU, 2011-12)
Pedagogical Subject Online communities
Page 18
6. SCHOOL SUPPORT MEASURES
Students in Estonia are in schools where at grade 4 and grade 11 general above EU averages of ICT strategies are implemented (main report, fig. 5.3), but below at grade 8 and 11 vocational (where they are in the bottom three countries on this measure. There are however high percentages of students in schools with strategies to support teacher collaboration (main report, fig. 5.7), ranking Estonia among the leading group of countries at all grades, and second at grade 11 vocational. Estonia at grade 4 and grade 11 general ranks among the middle group of countries as regards strategies about responsible internet and social media use (main report, fig. 5.10), but in the bottom group at grade 8 and 11 vocational.
Estonia is first in the leading group of countries for percentages of students in schools with change management programmes at all grades (main report, fig. 5.14), except at grade 11 general where it ranks second.
ICT COORDINATOR
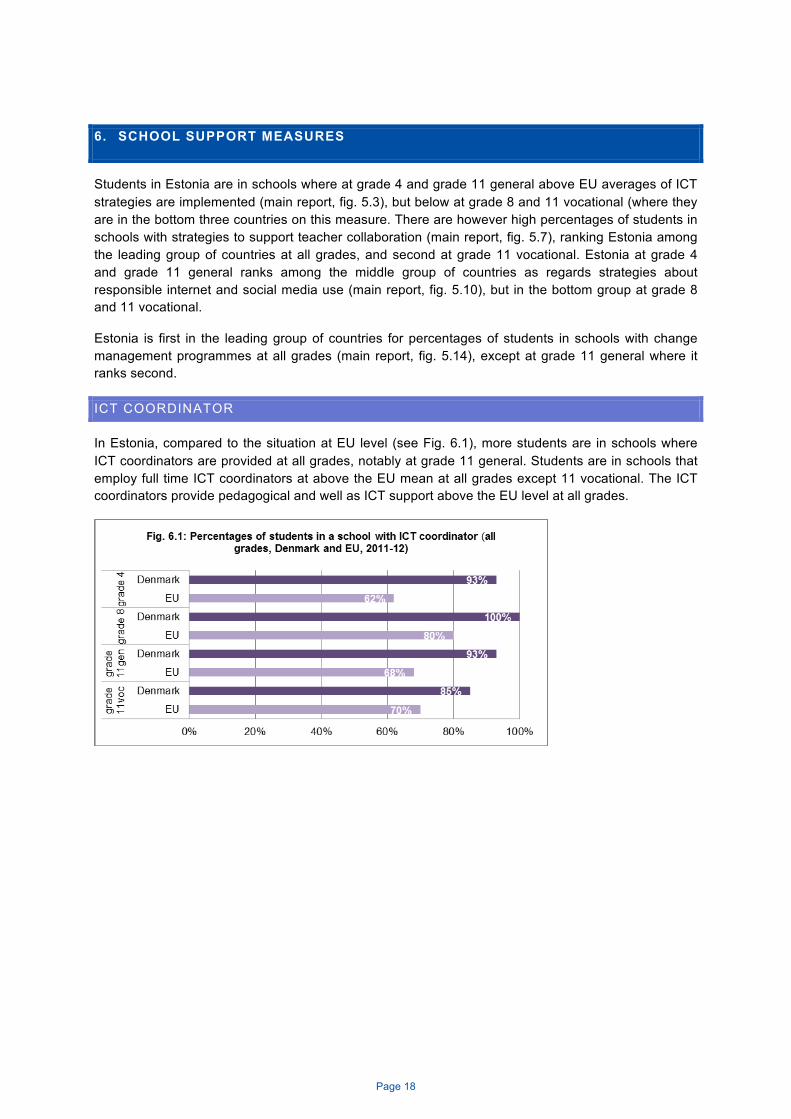
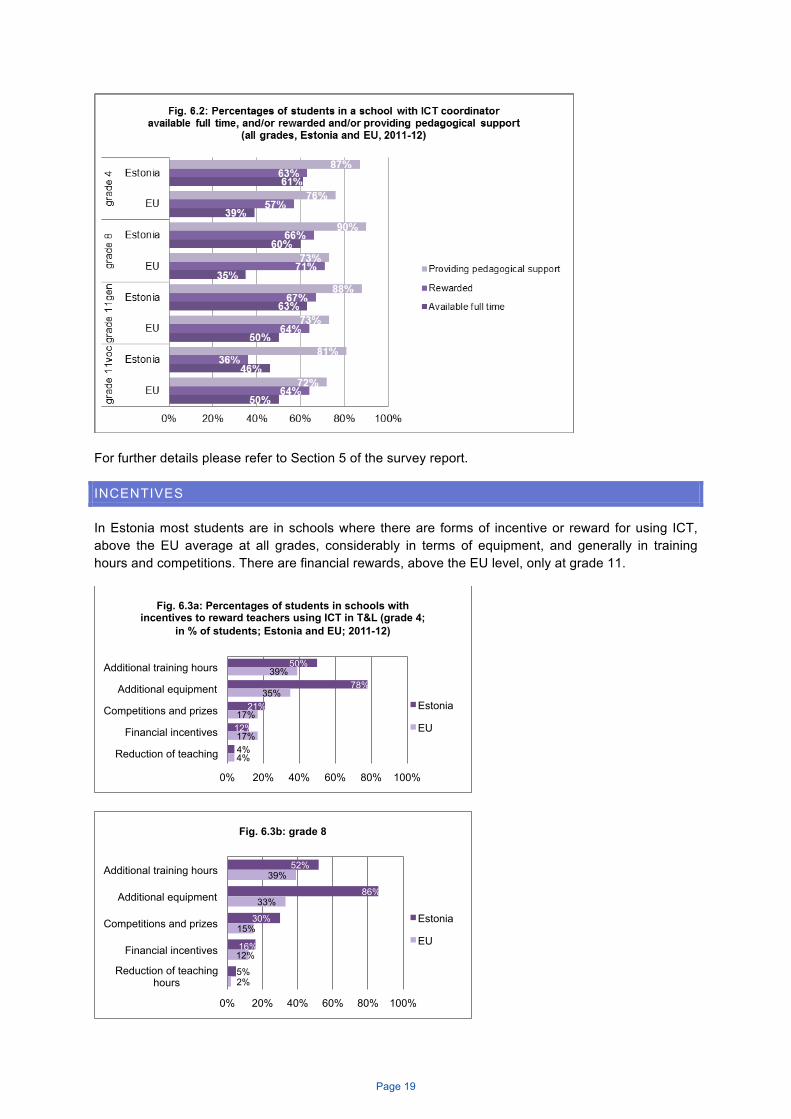
In Estonia, compared to the situation at EU level (see Fig. 6.1), more students are in schools where ICT coordinators are provided at all grades, notably at grade 11 general. Students are in schools that employ full time ICT coordinators at above the EU mean at all grades except 11 vocational. The ICT coordinators provide pedagogical and well as ICT support above the EU level at all grades.
Page 19
For further details please refer to Section 5 of the survey report.
INCENTIVES
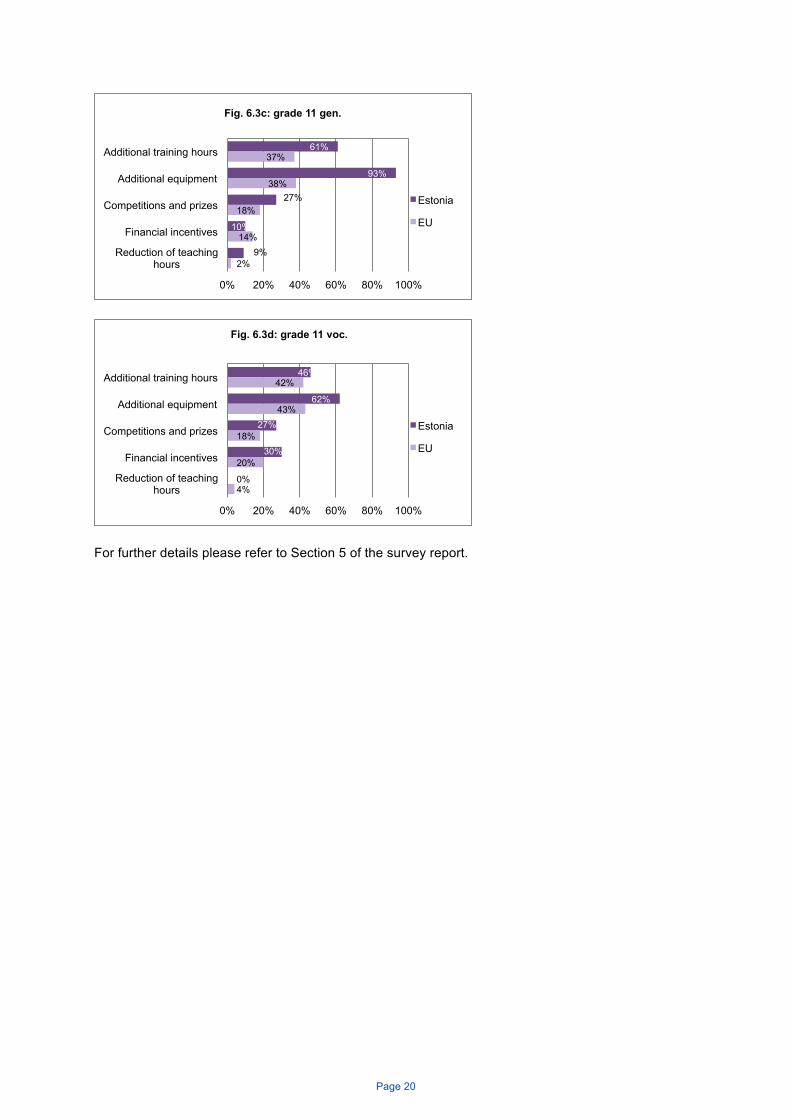
In Estonia most students are in schools where there are forms of incentive or reward for using ICT, above the EU average at all grades, considerably in terms of equipment, and generally in training hours and competitions. There are financial rewards, above the EU level, only at grade 11.
50%
78%
21%
12%
4%
39%
35%
17%
17%
4%
0% 20% 40% 60% 80% 100%
Additional training hours
Additional equipment
Competitions and prizes
Financial incentives
Reduction of teaching
Fig. 6.3a: Percentages of students in schools with incentives to reward teachers using ICT in T&L (grade 4;
in % of students; Estonia and EU; 2011-12)
Estonia
EU
52%
86%
30%
16%
5%
39%
33%
15%
12%
2%
0% 20% 40% 60% 80% 100%
Additional training hours
Additional equipment
Competitions and prizes
Financial incentives
Reduction of teaching hours
Fig. 6.3b: grade 8
Estonia
EU
Page 20
For further details please refer to Section 5 of the survey report.
61%
93%
27%
10%
9%
37%
38%
18%
14%
2%
0% 20% 40% 60% 80% 100%
Additional training hours
Additional equipment
Competitions and prizes
Financial incentives
Reduction of teaching hours
Fig. 6.3c: grade 11 gen.
Estonia
EU
46%
62%
27%
30%
0%
42%
43%
18%
20%
4%
0% 20% 40% 60% 80% 100%
Additional training hours
Additional equipment
Competitions and prizes
Financial incentives
Reduction of teaching hours
Fig. 6.3d: grade 11 voc.
Estonia
EU
Page 21
7: CLUSTERS
THE DIGITALLY SUPPORTIVE SCHOOL
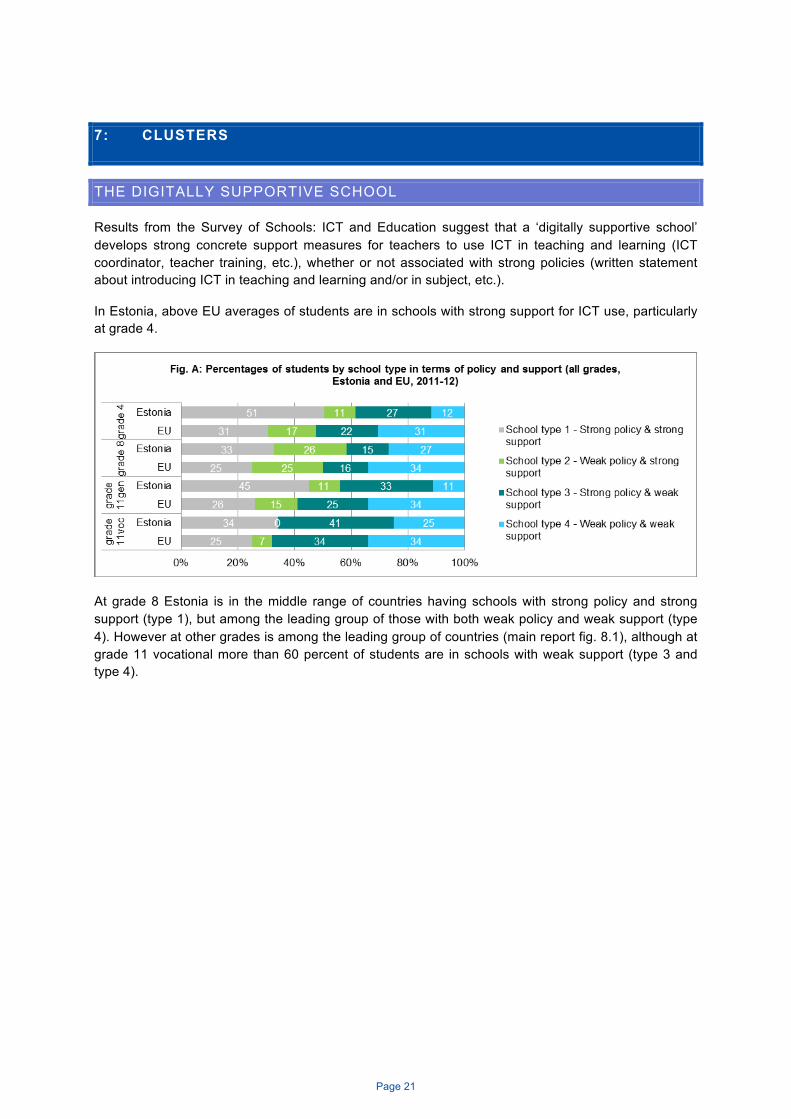
Results from the Survey of Schools: ICT and Education suggest that a ‘digitally supportive school’ develops strong concrete support measures for teachers to use ICT in teaching and learning (ICT coordinator, teacher training, etc.), whether or not associated with strong policies (written statement about introducing ICT in teaching and learning and/or in subject, etc.).
In Estonia, above EU averages of students are in schools with strong support for ICT use, particularly at grade 4.
At grade 8 Estonia is in the middle range of countries having schools with strong policy and strong support (type 1), but among the leading group of those with both weak policy and weak support (type 4). However at other grades is among the leading group of countries (main report fig. 8.1), although at grade 11 vocational more than 60 percent of students are in schools with weak support (type 3 and type 4).
Page 22
DIGITALLY CONFIDENT AND SUPPORTIVE TEACHERS
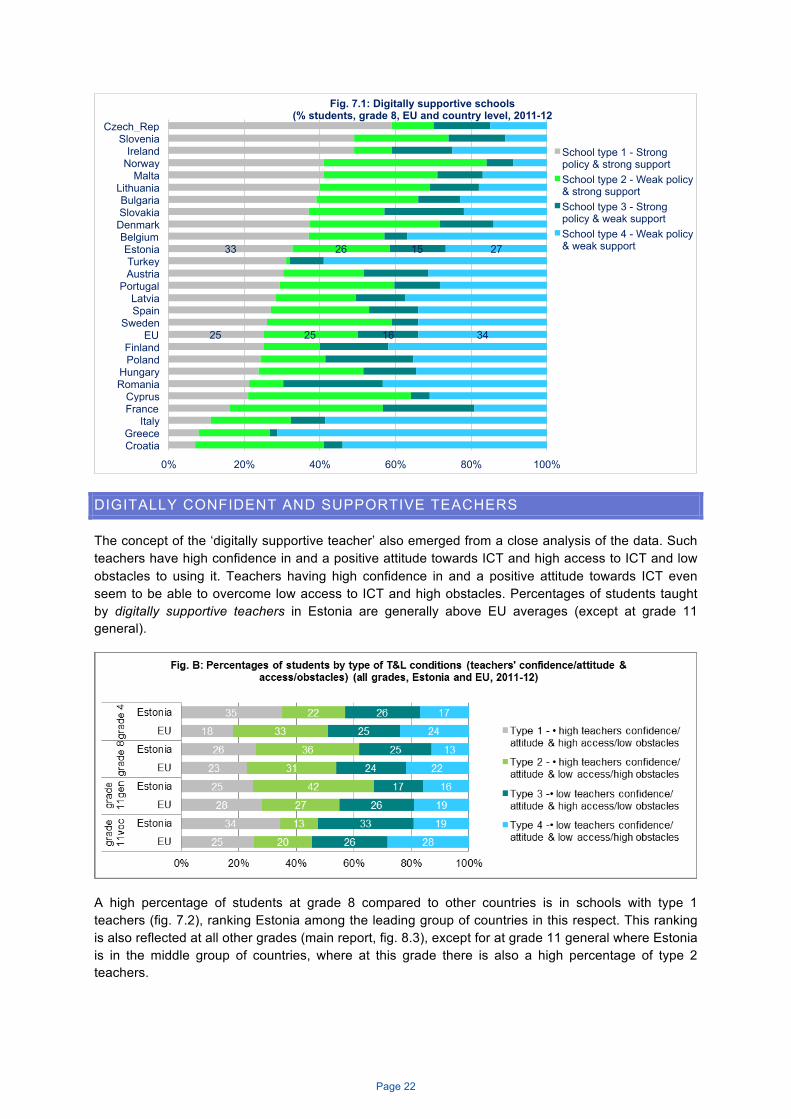
The concept of the ‘digitally supportive teacher’ also emerged from a close analysis of the data. Such teachers have high confidence in and a positive attitude towards ICT and high access to ICT and low obstacles to using it. Teachers having high confidence in and a positive attitude towards ICT even seem to be able to overcome low access to ICT and high obstacles. Percentages of students taught by digitally supportive teachers in Estonia are generally above EU averages (except at grade 11 general).
A high percentage of students at grade 8 compared to other countries is in schools with type 1 teachers (fig. 7.2), ranking Estonia among the leading group of countries in this respect. This ranking is also reflected at all other grades (main report, fig. 8.3), except for at grade 11 general where Estonia is in the middle group of countries, where at this grade there is also a high percentage of type 2 teachers.
25
33
25
26
16
15
34
27
0% 20% 40% 60% 80% 100%
Croatia Greece
Italy France Cyprus
Romania Hungary
Poland Finland
EU Sweden
Spain Latvia
Portugal Austria Turkey
Estonia Belgium
Denmark Slovakia Bulgaria
Lithuania Malta
Norway Ireland
Slovenia Czech_Rep
Fig. 7.1: Digitally supportive schools (% students, grade 8, EU and country level, 2011-12
School type 1 - Strong policy & strong support School type 2 - Weak policy & strong support School type 3 - Strong policy & weak support School type 4 - Weak policy & weak support
Page 23
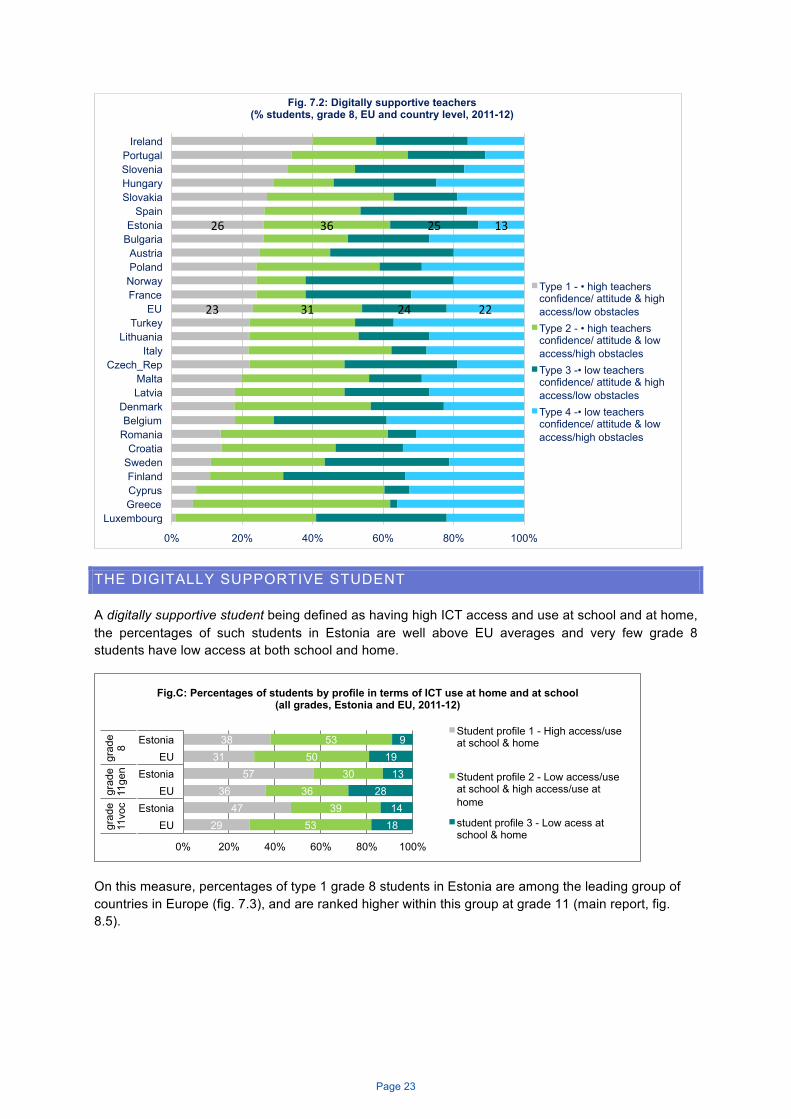
THE DIGITALLY SUPPORTIVE STUDENT
A digitally supportive student being defined as having high ICT access and use at school and at home, the percentages of such students in Estonia are well above EU averages and very few grade 8 students have low access at both school and home.
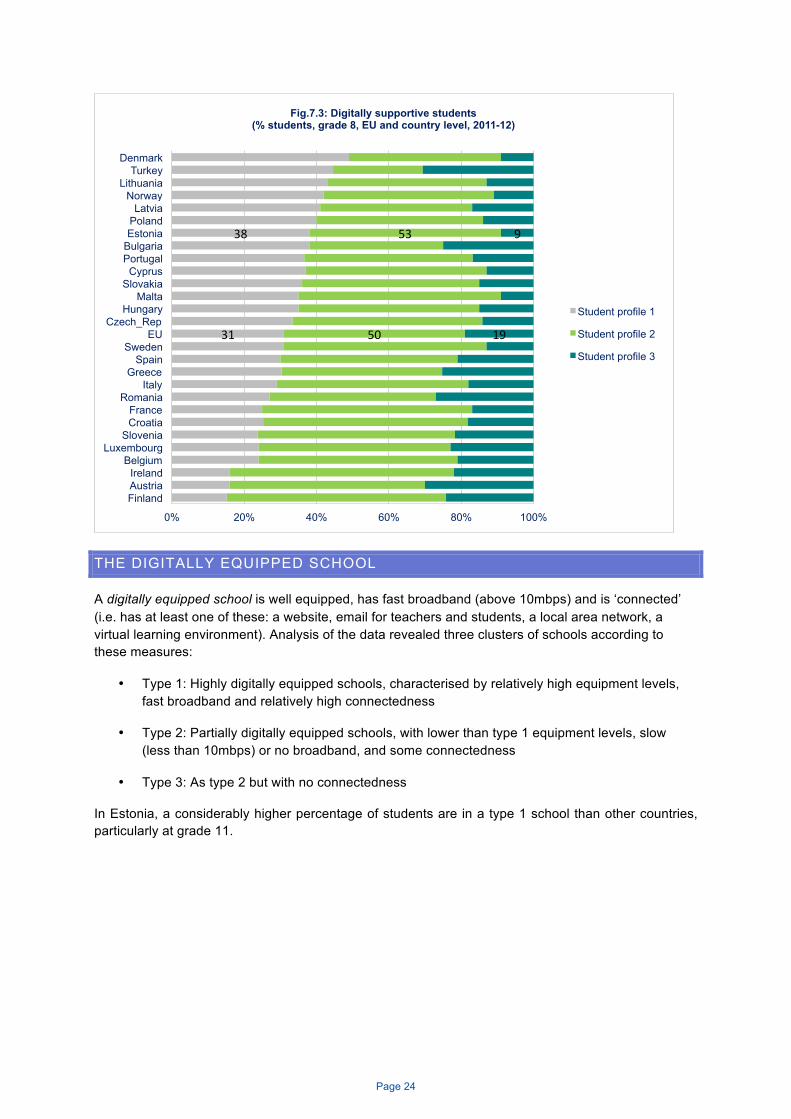
On this measure, percentages of type 1 grade 8 students in Estonia are among the leading group of countries in Europe (fig. 7.3), and are ranked higher within this group at grade 11 (main report, fig. 8.5).
23
26
31
36
24
25
22
13
0% 20% 40% 60% 80% 100%
Luxembourg Greece Cyprus Finland
Sweden Croatia
Romania Belgium
Denmark Latvia Malta
Czech_Rep Italy
Lithuania Turkey
EU France Norway Poland Austria
Bulgaria Estonia
Spain Slovakia Hungary Slovenia Portugal
Ireland
Fig. 7.2: Digitally supportive teachers (% students, grade 8, EU and country level, 2011-12)
Type 1 - • high teachers confidence/ attitude & high access/low obstacles Type 2 - • high teachers confidence/ attitude & low access/high obstacles Type 3 -• low teachers confidence/ attitude & high access/low obstacles Type 4 -• low teachers confidence/ attitude & low access/high obstacles
29 47
36 57
31 38
53 39
36 30
50 53
18 14
28 13
19 9
0% 20% 40% 60% 80% 100%
EU Estonia
EU Estonia
EU Estonia
grad
e 11
voc
grad
e 11
gen
grad
e 8
Fig.C: Percentages of students by profile in terms of ICT use at home and at school (all grades, Estonia and EU, 2011-12)
Student profile 1 - High access/use at school & home
Student profile 2 - Low access/use at school & high access/use at home
student profile 3 - Low acess at school & home
Page 24
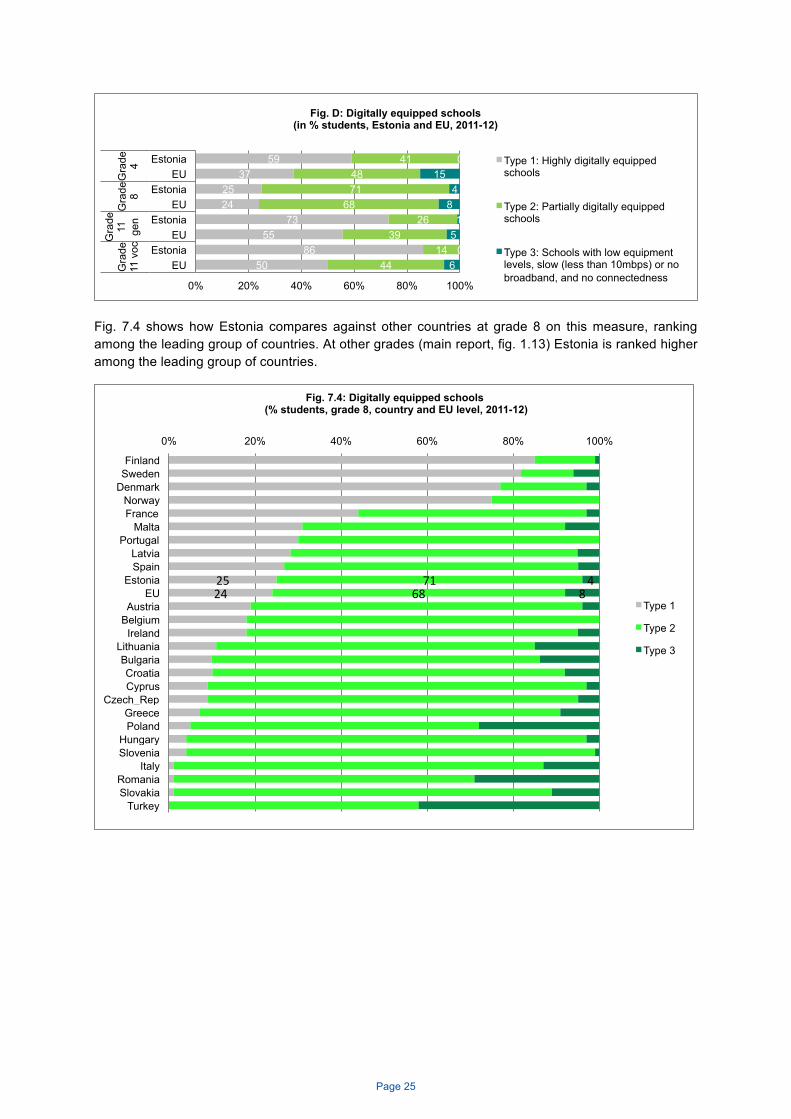
THE DIGITALLY EQUIPPED SCHOOL
A digitally equipped school is well equipped, has fast broadband (above 10mbps) and is ‘connected’ (i.e. has at least one of these: a website, email for teachers and students, a local area network, a virtual learning environment). Analysis of the data revealed three clusters of schools according to these measures:
• Type 1: Highly digitally equipped schools, characterised by relatively high equipment levels, fast broadband and relatively high connectedness
• Type 2: Partially digitally equipped schools, with lower than type 1 equipment levels, slow (less than 10mbps) or no broadband, and some connectedness
• Type 3: As type 2 but with no connectedness
In Estonia, a considerably higher percentage of students are in a type 1 school than other countries, particularly at grade 11.
31
38
50
53
19
9
0% 20% 40% 60% 80% 100%
Finland Austria Ireland
Belgium Luxembourg
Slovenia Croatia France
Romania Italy
Greece Spain
Sweden EU
Czech_Rep Hungary
Malta Slovakia
Cyprus Portugal Bulgaria Estonia Poland Latvia
Norway Lithuania
Turkey Denmark
Fig.7.3: Digitally supportive students (% students, grade 8, EU and country level, 2011-12)
Student profile 1
Student profile 2
Student profile 3
Page 25
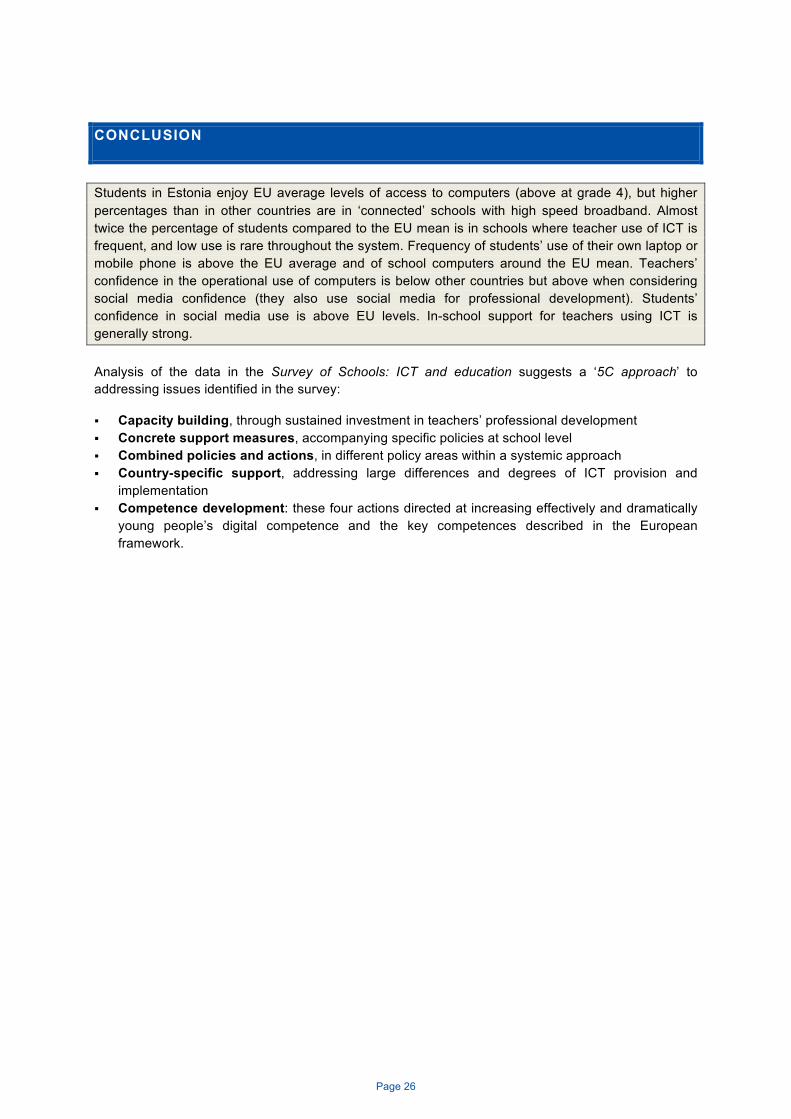
Fig. 7.4 shows how Estonia compares against other countries at grade 8 on this measure, ranking among the leading group of countries. At other grades (main report, fig. 1.13) Estonia is ranked higher among the leading group of countries.
59 37
25 24
73 55
86 50
41 48 71
68 26
39 14
44
0 15
4 8
1 5
0 6
0% 20% 40% 60% 80% 100%
Estonia EU
Estonia EU
Estonia EU
Estonia EU
Gra
de
4 G
rade
8
Gra
de
11
gen
Gra
de
11 v
oc
Fig. D: Digitally equipped schools (in % students, Estonia and EU, 2011-12)
Type 1: Highly digitally equipped schools
Type 2: Partially digitally equipped schools
Type 3: Schools with low equipment levels, slow (less than 10mbps) or no broadband, and no connectedness
25 24
71 68
4 8
0% 20% 40% 60% 80% 100%
Finland Sweden
Denmark Norway France
Malta Portugal
Latvia Spain
Estonia EU
Austria Belgium Ireland
Lithuania Bulgaria Croatia Cyprus
Czech_Rep Greece Poland
Hungary Slovenia
Italy Romania Slovakia
Turkey
Fig. 7.4: Digitally equipped schools (% students, grade 8, country and EU level, 2011-12)
Type 1
Type 2
Type 3
Page 26
CONCLUSION
Students in Estonia enjoy EU average levels of access to computers (above at grade 4), but higher percentages than in other countries are in ‘connected’ schools with high speed broadband. Almost twice the percentage of students compared to the EU mean is in schools where teacher use of ICT is frequent, and low use is rare throughout the system. Frequency of students’ use of their own laptop or mobile phone is above the EU average and of school computers around the EU mean. Teachers’ confidence in the operational use of computers is below other countries but above when considering social media confidence (they also use social media for professional development). Students’ confidence in social media use is above EU levels. In-school support for teachers using ICT is generally strong.
Analysis of the data in the Survey of Schools: ICT and education suggests a ‘5C approach’ to addressing issues identified in the survey:
§ Capacity building, through sustained investment in teachers’ professional development § Concrete support measures, accompanying specific policies at school level § Combined policies and actions, in different policy areas within a systemic approach § Country-specific support, addressing large differences and degrees of ICT provision and
implementation § Competence development: these four actions directed at increasing effectively and dramatically
young people’s digital competence and the key competences described in the European framework.
Page 27
ANNEX
TABLES
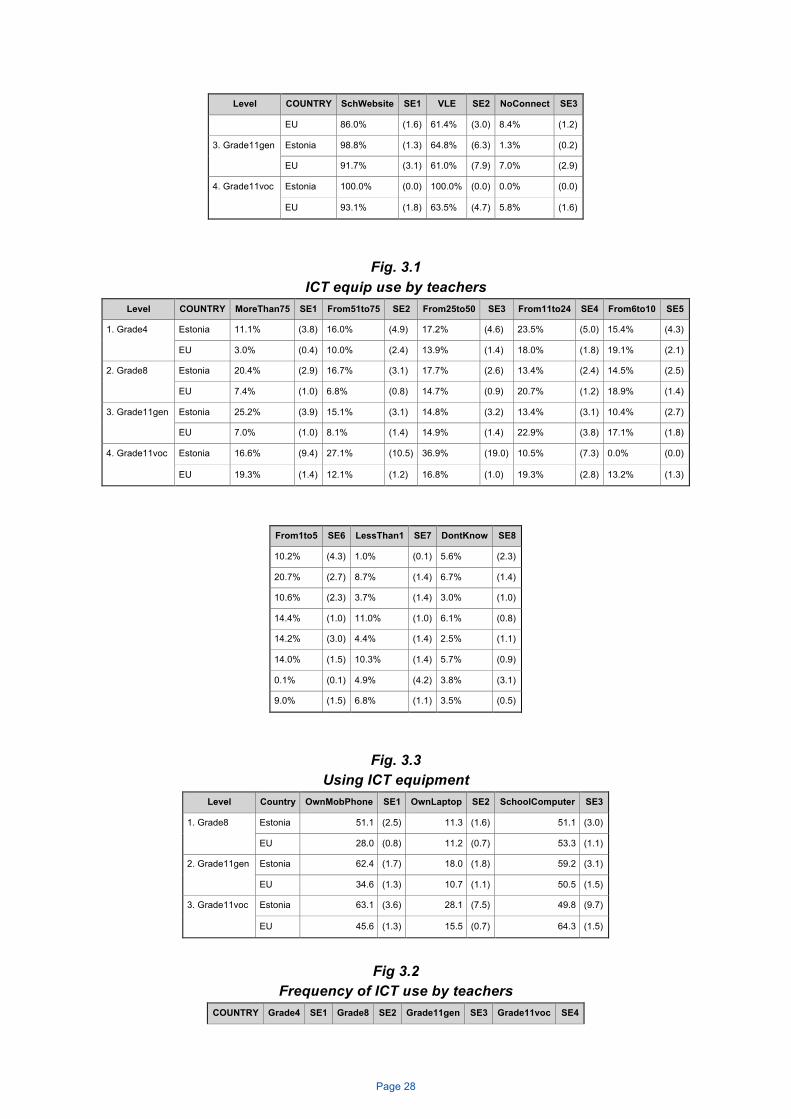
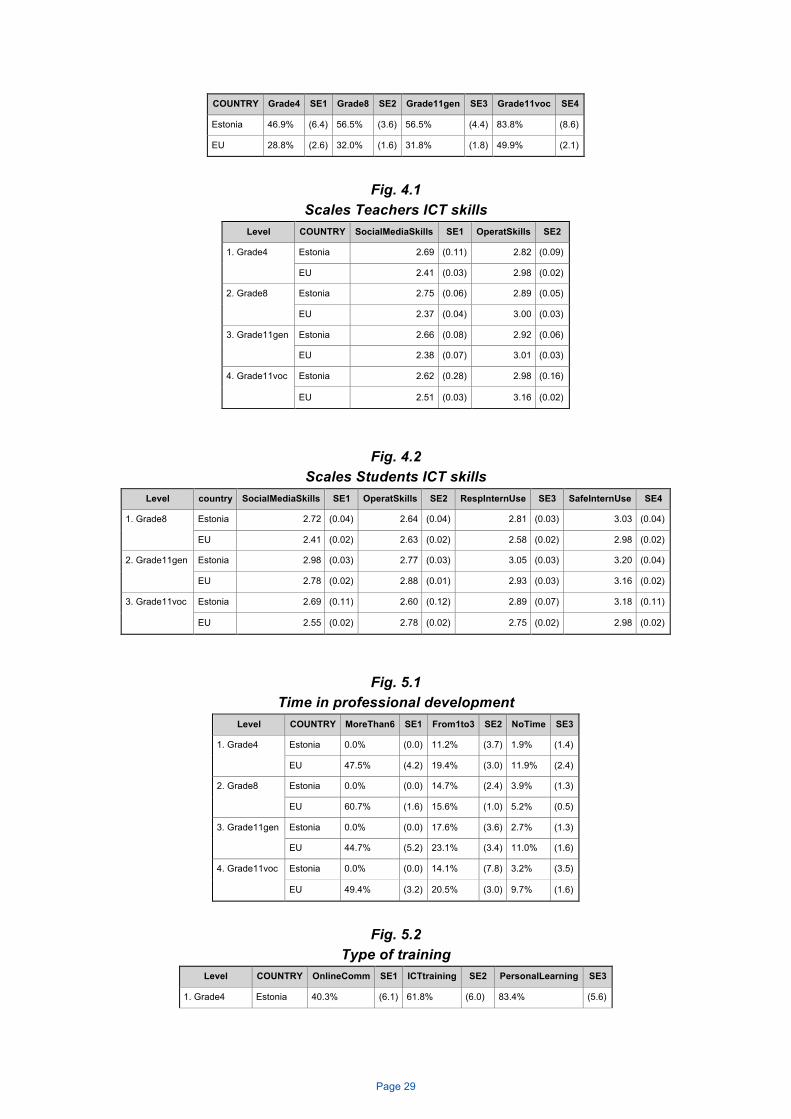
Note: For reasons of space, only selected country-EU data tables are shown here; those for all-country charts (e.g. fig. 2.2) are available online. SE = Standard Error.
Fig. 2.1 Computers per 100 students
COUNTRY Grade4 SE1 Grade8 SE2 Grade11gen SE3 Grade11voc SE4
Estonia 20.7 (1.5) 22.4 (1.8) 19.2 (1.3) 31.8 (4.7)
EU 14.5 (0.7) 21.1 (1.2) 23.2 (7.7) 33.6 (10.6)
Fig. 2.3
Broadband speed Level COUNTRY NoBroadband SE1 LessThan2 SE2 From2to5 SE3
1. Grade4 Estonia 3.2% (1.9) 6.5% (4.4) 15.7% (4.4)
EU 8.0% (1.3) 16.5% (2.3) 21.4% (2.4)
2. Grade8 Estonia 6.9% (2.5) 8.1% (3.0) 14.7% (3.6)
EU 5.0% (0.8) 9.6% (1.3) 19.1% (2.3)
3. Grade11gen Estonia 6.2% (2.8) 0.0% (0.0) 17.4% (5.7)
EU 3.7% (1.3) 6.2% (0.8) 18.0% (2.8)
4. Grade11voc Estonia 5.6% (2.4) 19.5% (13.1) 0.0% (0.0)
EU 6.5% (1.8) 6.2% (1.3) 15.2% (3.0)
From5to10 SE4 From10to30 SE5 From30to100 SE6 MoreThan100 SE7
26.8% (5.2) 27.4% (5.8) 11.7% (4.6) 8.7% (3.6)
22.1% (2.2) 19.5% (2.2) 8.6% (1.4) 4.0% (1.3)
21.4% (4.0) 27.4% (5.2) 9.6% (3.1) 11.9% (3.3)
27.7% (2.4) 24.8% (2.3) 8.6% (1.6) 5.2% (1.2)
25.1% (5.2) 24.0% (5.1) 10.7% (3.7) 16.6% (4.4)
23.2% (3.0) 25.4% (3.9) 13.3% (2.6) 10.3% (8.0)
13.9% (11.2) 0.0% (0.0) 20.3% (13.5) 40.8% (24.2)
21.2% (2.6) 24.2% (4.6) 15.7% (7.1) 10.9% (5.3)
Fig. 2.5 Connectedness
Level COUNTRY SchWebsite SE1 VLE SE2 NoConnect SE3
1. Grade4 Estonia 100.0% (0.0) 54.0% (6.6) 0.0% (0.0)
EU 69.7% (3.6) 26.8% (2.0) 15.9% (2.2)
2. Grade8 Estonia 94.3% (2.7) 54.0% (5.2) 5.9% (2.8)
Page 28
Level COUNTRY SchWebsite SE1 VLE SE2 NoConnect SE3
EU 86.0% (1.6) 61.4% (3.0) 8.4% (1.2)
3. Grade11gen Estonia 98.8% (1.3) 64.8% (6.3) 1.3% (0.2)
EU 91.7% (3.1) 61.0% (7.9) 7.0% (2.9)
4. Grade11voc Estonia 100.0% (0.0) 100.0% (0.0) 0.0% (0.0)
EU 93.1% (1.8) 63.5% (4.7) 5.8% (1.6)
Fig. 3.1 ICT equip use by teachers
Level COUNTRY MoreThan75 SE1 From51to75 SE2 From25to50 SE3 From11to24 SE4 From6to10 SE5
1. Grade4 Estonia 11.1% (3.8) 16.0% (4.9) 17.2% (4.6) 23.5% (5.0) 15.4% (4.3)
EU 3.0% (0.4) 10.0% (2.4) 13.9% (1.4) 18.0% (1.8) 19.1% (2.1)
2. Grade8 Estonia 20.4% (2.9) 16.7% (3.1) 17.7% (2.6) 13.4% (2.4) 14.5% (2.5)
EU 7.4% (1.0) 6.8% (0.8) 14.7% (0.9) 20.7% (1.2) 18.9% (1.4)
3. Grade11gen Estonia 25.2% (3.9) 15.1% (3.1) 14.8% (3.2) 13.4% (3.1) 10.4% (2.7)
EU 7.0% (1.0) 8.1% (1.4) 14.9% (1.4) 22.9% (3.8) 17.1% (1.8)
4. Grade11voc Estonia 16.6% (9.4) 27.1% (10.5) 36.9% (19.0) 10.5% (7.3) 0.0% (0.0)
EU 19.3% (1.4) 12.1% (1.2) 16.8% (1.0) 19.3% (2.8) 13.2% (1.3)
From1to5 SE6 LessThan1 SE7 DontKnow SE8
10.2% (4.3) 1.0% (0.1) 5.6% (2.3)
20.7% (2.7) 8.7% (1.4) 6.7% (1.4)
10.6% (2.3) 3.7% (1.4) 3.0% (1.0)
14.4% (1.0) 11.0% (1.0) 6.1% (0.8)
14.2% (3.0) 4.4% (1.4) 2.5% (1.1)
14.0% (1.5) 10.3% (1.4) 5.7% (0.9)
0.1% (0.1) 4.9% (4.2) 3.8% (3.1)
9.0% (1.5) 6.8% (1.1) 3.5% (0.5)
Fig. 3.3 Using ICT equipment
Level Country OwnMobPhone SE1 OwnLaptop SE2 SchoolComputer SE3
1. Grade8 Estonia 51.1 (2.5) 11.3 (1.6) 51.1 (3.0)
EU 28.0 (0.8) 11.2 (0.7) 53.3 (1.1)
2. Grade11gen Estonia 62.4 (1.7) 18.0 (1.8) 59.2 (3.1)
EU 34.6 (1.3) 10.7 (1.1) 50.5 (1.5)
3. Grade11voc Estonia 63.1 (3.6) 28.1 (7.5) 49.8 (9.7)
EU 45.6 (1.3) 15.5 (0.7) 64.3 (1.5)
Fig 3.2
Frequency of ICT use by teachers COUNTRY Grade4 SE1 Grade8 SE2 Grade11gen SE3 Grade11voc SE4
Page 29
COUNTRY Grade4 SE1 Grade8 SE2 Grade11gen SE3 Grade11voc SE4
Estonia 46.9% (6.4) 56.5% (3.6) 56.5% (4.4) 83.8% (8.6)
EU 28.8% (2.6) 32.0% (1.6) 31.8% (1.8) 49.9% (2.1)
Fig. 4.1
Scales Teachers ICT skills Level COUNTRY SocialMediaSkills SE1 OperatSkills SE2
1. Grade4 Estonia 2.69 (0.11) 2.82 (0.09)
EU 2.41 (0.03) 2.98 (0.02)
2. Grade8 Estonia 2.75 (0.06) 2.89 (0.05)
EU 2.37 (0.04) 3.00 (0.03)
3. Grade11gen Estonia 2.66 (0.08) 2.92 (0.06)
EU 2.38 (0.07) 3.01 (0.03)
4. Grade11voc Estonia 2.62 (0.28) 2.98 (0.16)
EU 2.51 (0.03) 3.16 (0.02)
Fig. 4.2 Scales Students ICT skills
Level country SocialMediaSkills SE1 OperatSkills SE2 RespInternUse SE3 SafeInternUse SE4
1. Grade8 Estonia 2.72 (0.04) 2.64 (0.04) 2.81 (0.03) 3.03 (0.04)
EU 2.41 (0.02) 2.63 (0.02) 2.58 (0.02) 2.98 (0.02)
2. Grade11gen Estonia 2.98 (0.03) 2.77 (0.03) 3.05 (0.03) 3.20 (0.04)
EU 2.78 (0.02) 2.88 (0.01) 2.93 (0.03) 3.16 (0.02)
3. Grade11voc Estonia 2.69 (0.11) 2.60 (0.12) 2.89 (0.07) 3.18 (0.11)
EU 2.55 (0.02) 2.78 (0.02) 2.75 (0.02) 2.98 (0.02)
Fig. 5.1 Time in professional development
Level COUNTRY MoreThan6 SE1 From1to3 SE2 NoTime SE3
1. Grade4 Estonia 0.0% (0.0) 11.2% (3.7) 1.9% (1.4)
EU 47.5% (4.2) 19.4% (3.0) 11.9% (2.4)
2. Grade8 Estonia 0.0% (0.0) 14.7% (2.4) 3.9% (1.3)
EU 60.7% (1.6) 15.6% (1.0) 5.2% (0.5)
3. Grade11gen Estonia 0.0% (0.0) 17.6% (3.6) 2.7% (1.3)
EU 44.7% (5.2) 23.1% (3.4) 11.0% (1.6)
4. Grade11voc Estonia 0.0% (0.0) 14.1% (7.8) 3.2% (3.5)
EU 49.4% (3.2) 20.5% (3.0) 9.7% (1.6)
Fig. 5.2
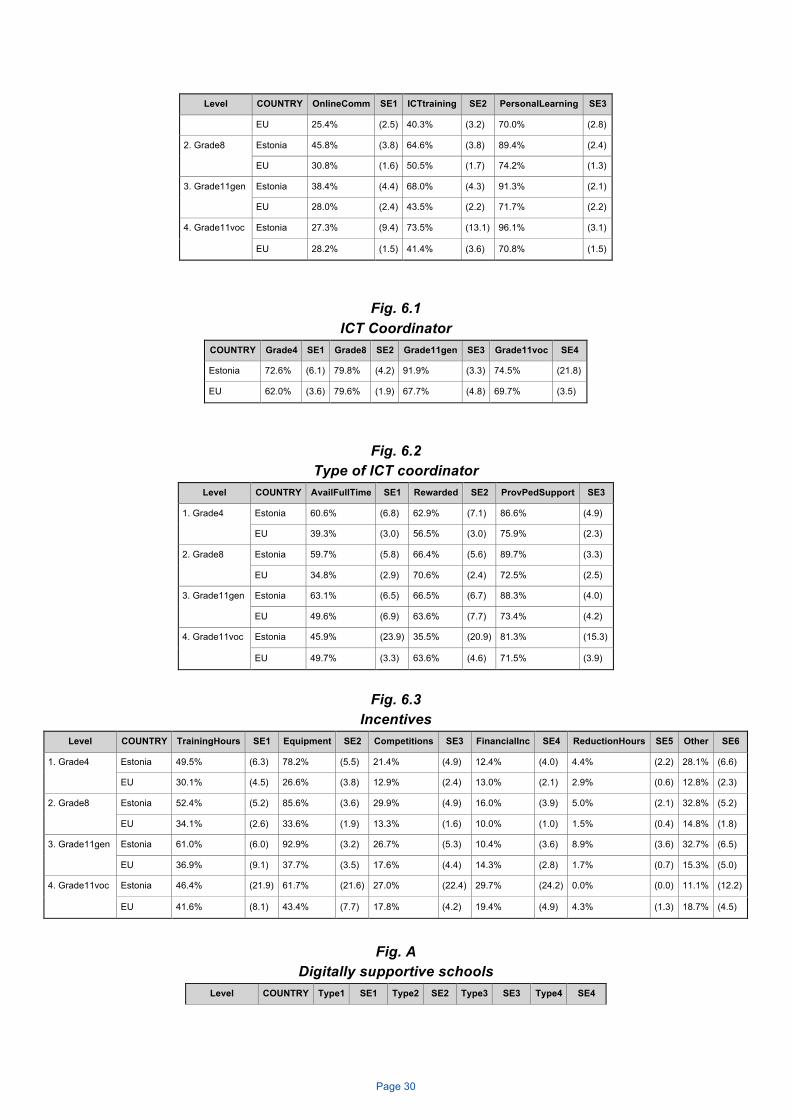
Type of training Level COUNTRY OnlineComm SE1 ICTtraining SE2 PersonalLearning SE3
1. Grade4 Estonia 40.3% (6.1) 61.8% (6.0) 83.4% (5.6)
Page 30
Level COUNTRY OnlineComm SE1 ICTtraining SE2 PersonalLearning SE3
EU 25.4% (2.5) 40.3% (3.2) 70.0% (2.8)
2. Grade8 Estonia 45.8% (3.8) 64.6% (3.8) 89.4% (2.4)
EU 30.8% (1.6) 50.5% (1.7) 74.2% (1.3)
3. Grade11gen Estonia 38.4% (4.4) 68.0% (4.3) 91.3% (2.1)
EU 28.0% (2.4) 43.5% (2.2) 71.7% (2.2)
4. Grade11voc Estonia 27.3% (9.4) 73.5% (13.1) 96.1% (3.1)
EU 28.2% (1.5) 41.4% (3.6) 70.8% (1.5)
Fig. 6.1 ICT Coordinator
COUNTRY Grade4 SE1 Grade8 SE2 Grade11gen SE3 Grade11voc SE4
Estonia 72.6% (6.1) 79.8% (4.2) 91.9% (3.3) 74.5% (21.8)
EU 62.0% (3.6) 79.6% (1.9) 67.7% (4.8) 69.7% (3.5)
Fig. 6.2 Type of ICT coordinator
Level COUNTRY AvailFullTime SE1 Rewarded SE2 ProvPedSupport SE3
1. Grade4 Estonia 60.6% (6.8) 62.9% (7.1) 86.6% (4.9)
EU 39.3% (3.0) 56.5% (3.0) 75.9% (2.3)
2. Grade8 Estonia 59.7% (5.8) 66.4% (5.6) 89.7% (3.3)
EU 34.8% (2.9) 70.6% (2.4) 72.5% (2.5)
3. Grade11gen Estonia 63.1% (6.5) 66.5% (6.7) 88.3% (4.0)
EU 49.6% (6.9) 63.6% (7.7) 73.4% (4.2)
4. Grade11voc Estonia 45.9% (23.9) 35.5% (20.9) 81.3% (15.3)
EU 49.7% (3.3) 63.6% (4.6) 71.5% (3.9)
Fig. 6.3
Incentives Level COUNTRY TrainingHours SE1 Equipment SE2 Competitions SE3 FinancialInc SE4 ReductionHours SE5 Other SE6
1. Grade4 Estonia 49.5% (6.3) 78.2% (5.5) 21.4% (4.9) 12.4% (4.0) 4.4% (2.2) 28.1% (6.6)
EU 30.1% (4.5) 26.6% (3.8) 12.9% (2.4) 13.0% (2.1) 2.9% (0.6) 12.8% (2.3)
2. Grade8 Estonia 52.4% (5.2) 85.6% (3.6) 29.9% (4.9) 16.0% (3.9) 5.0% (2.1) 32.8% (5.2)
EU 34.1% (2.6) 33.6% (1.9) 13.3% (1.6) 10.0% (1.0) 1.5% (0.4) 14.8% (1.8)
3. Grade11gen Estonia 61.0% (6.0) 92.9% (3.2) 26.7% (5.3) 10.4% (3.6) 8.9% (3.6) 32.7% (6.5)
EU 36.9% (9.1) 37.7% (3.5) 17.6% (4.4) 14.3% (2.8) 1.7% (0.7) 15.3% (5.0)
4. Grade11voc Estonia 46.4% (21.9) 61.7% (21.6) 27.0% (22.4) 29.7% (24.2) 0.0% (0.0) 11.1% (12.2)
EU 41.6% (8.1) 43.4% (7.7) 17.8% (4.2) 19.4% (4.9) 4.3% (1.3) 18.7% (4.5)
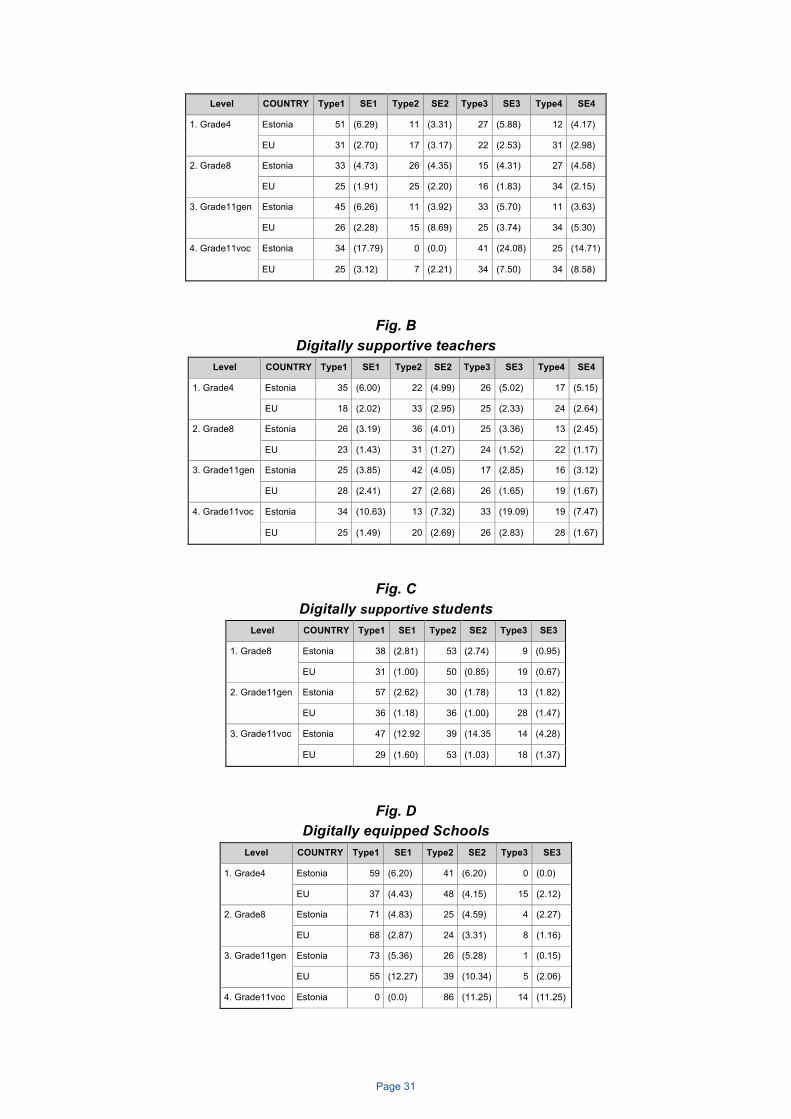
Fig. A
Digitally supportive schools Level COUNTRY Type1 SE1 Type2 SE2 Type3 SE3 Type4 SE4
Page 31
Level COUNTRY Type1 SE1 Type2 SE2 Type3 SE3 Type4 SE4
1. Grade4 Estonia 51 (6.29) 11 (3.31) 27 (5.88) 12 (4.17)
EU 31 (2.70) 17 (3.17) 22 (2.53) 31 (2.98)
2. Grade8 Estonia 33 (4.73) 26 (4.35) 15 (4.31) 27 (4.58)
EU 25 (1.91) 25 (2.20) 16 (1.83) 34 (2.15)
3. Grade11gen Estonia 45 (6.26) 11 (3.92) 33 (5.70) 11 (3.63)
EU 26 (2.28) 15 (8.69) 25 (3.74) 34 (5.30)
4. Grade11voc Estonia 34 (17.79) 0 (0.0) 41 (24.08) 25 (14.71)
EU 25 (3.12) 7 (2.21) 34 (7.50) 34 (8.58)
Fig. B Digitally supportive teachers
Level COUNTRY Type1 SE1 Type2 SE2 Type3 SE3 Type4 SE4
1. Grade4 Estonia 35 (6.00) 22 (4.99) 26 (5.02) 17 (5.15)
EU 18 (2.02) 33 (2.95) 25 (2.33) 24 (2.64)
2. Grade8 Estonia 26 (3.19) 36 (4.01) 25 (3.36) 13 (2.45)
EU 23 (1.43) 31 (1.27) 24 (1.52) 22 (1.17)
3. Grade11gen Estonia 25 (3.85) 42 (4.05) 17 (2.85) 16 (3.12)
EU 28 (2.41) 27 (2.68) 26 (1.65) 19 (1.67)
4. Grade11voc Estonia 34 (10.63) 13 (7.32) 33 (19.09) 19 (7.47)
EU 25 (1.49) 20 (2.69) 26 (2.83) 28 (1.67)
Fig. C Digitally supportive students
Level COUNTRY Type1 SE1 Type2 SE2 Type3 SE3
1. Grade8 Estonia 38 (2.81) 53 (2.74) 9 (0.95)
EU 31 (1.00) 50 (0.85) 19 (0.67)
2. Grade11gen Estonia 57 (2.62) 30 (1.78) 13 (1.82)
EU 36 (1.18) 36 (1.00) 28 (1.47)
3. Grade11voc Estonia 47 (12.92 39 (14.35 14 (4.28)
EU 29 (1.60) 53 (1.03) 18 (1.37)
Fig. D Digitally equipped Schools
Level COUNTRY Type1 SE1 Type2 SE2 Type3 SE3
1. Grade4 Estonia 59 (6.20) 41 (6.20) 0 (0.0)
EU 37 (4.43) 48 (4.15) 15 (2.12)
2. Grade8 Estonia 71 (4.83) 25 (4.59) 4 (2.27)
EU 68 (2.87) 24 (3.31) 8 (1.16)
3. Grade11gen Estonia 73 (5.36) 26 (5.28) 1 (0.15)
EU 55 (12.27) 39 (10.34) 5 (2.06)
4. Grade11voc Estonia 0 (0.0) 86 (11.25) 14 (11.25)
Page 32
Level COUNTRY Type1 SE1 Type2 SE2 Type3 SE3
EU 6 (1.88) 50 (13.83) 44 (12.07)
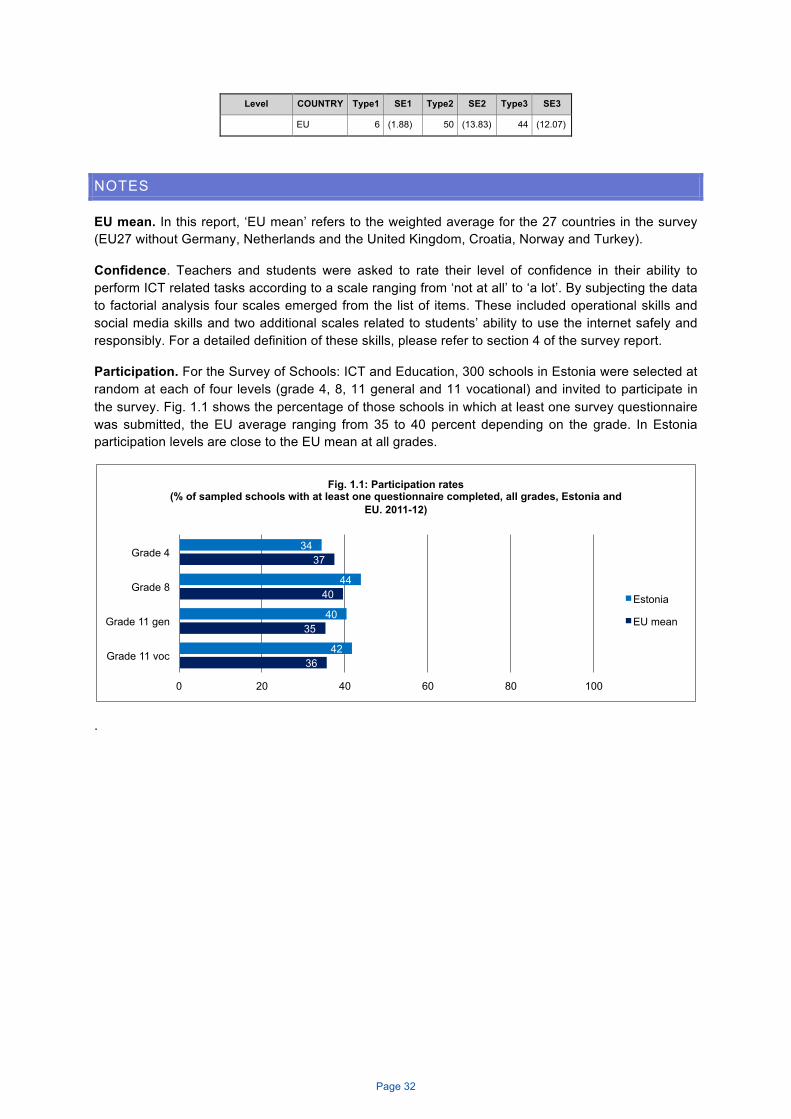
NOTES
EU mean. In this report, ‘EU mean’ refers to the weighted average for the 27 countries in the survey (EU27 without Germany, Netherlands and the United Kingdom, Croatia, Norway and Turkey).
Confidence. Teachers and students were asked to rate their level of confidence in their ability to perform ICT related tasks according to a scale ranging from ‘not at all’ to ‘a lot’. By subjecting the data to factorial analysis four scales emerged from the list of items. These included operational skills and social media skills and two additional scales related to students’ ability to use the internet safely and responsibly. For a detailed definition of these skills, please refer to section 4 of the survey report.
Participation. For the Survey of Schools: ICT and Education, 300 schools in Estonia were selected at random at each of four levels (grade 4, 8, 11 general and 11 vocational) and invited to participate in the survey. Fig. 1.1 shows the percentage of those schools in which at least one survey questionnaire was submitted, the EU average ranging from 35 to 40 percent depending on the grade. In Estonia participation levels are close to the EU mean at all grades.
.
34
44
40
42
37
40
35
36
0 20 40 60 80 100
Grade 4
Grade 8
Grade 11 gen
Grade 11 voc
Fig. 1.1: Participation rates (% of sampled schools with at least one questionnaire completed, all grades, Estonia and
EU. 2011-12)
Estonia
EU mean

Page 33