Embed Size (px)
Citation preview

Summary of main results for those aged 65 and over
2004 2009 2010 2011
Average gross weekly equivalised income €289.05 €428.86 €411.90 €407.28
At risk of poverty rate 27.1% 9.6% 8.7% 9.7%
Deprivation rate1
10.0% 9.5% 9.8% 11.3%
Consistent poverty rate 3.9% 1.1% 0.9% 1.9%
1Experienced two or more types of enforced deprivation
15 August 2013
Survey on Income and Living Conditions(SILC)Thematic Report on the Elderly2004, 2009, 2010 (revised) and 2011
The Survey on Income and Living Conditions (SILC) in Ireland is a household
survey covering a broad range of issues in relation to income and living conditions.
This report includes information on the composition of the elderly cohort (ie those
aged 65 and over), the level and composition of gross weekly equivalised income,
the at risk of poverty rate, the consistent poverty rate and rates of enforced
deprivation experienced by the elderly. It updates to 2011 information previously
published and revises results for 20101. A summary of the key results of the 2011
survey, along with revised results for 2010 and comparable results from previous
years is presented below:
Summary of main findings
� The average income (ie gross weekly equivalised income) decreased by 5%between 2009 and 2011. It reversed the upward trend in the income of theelderly which increased by 48% between 2004 and 2009. See table 2
� Between 2004 and 2011, the proportion of income coming from earningsdecreased (from 24.1% in 2004 to 16.1% in 2011) while the proportion ofincome coming from social transfers increased (from 56.8% in 2004 to62.7% in 2011).
� Overall the at risk of poverty rate fell from 27.1% in 2004 to 9.7% in 2011.There was no statistically significant change in the rate between 2009, 2010and 2011. See table 9.
� The rate of enforced deprivation among the elderly was 11.3% in 2011representing no significant change from 2010, 2009 and 2004.
� The consistent poverty rate for the elderly fell from 3.9% in 2004 to 1.1% in2009 and 0.9% in 2010 but increased to 1.9% in 2011.
1Please see http://cso.ie/shorturl.aspx/178 for more information.
For more information contact Pamela Lafferty or Aude Martin at 021 453 5268,or Anne McGrath at 021 453 5487.
Published by the Central Statistics Office, Ireland.
Ardee Road Skehard RoadDublin 6 CorkIreland Ireland
LoCall: 1890 313 414 (ROI)0870 876 0256 (UK/NI)
Tel: +353 1 498 4000 Tel: +353 21 453 5000Fax: +353 1 498 4229 Fax: +353 21 453 5492
Both offices may be contacted through any of thesetelephone numbers.
CSO on the Web: www.cso.ie
and go to
People and Society: Health and Social
Conditions
Director General: Pádraig Dalton
Enquiries:
Income statistics Direct Dial (021) 453 5268Email: income&[email protected]
General queries Information Section, ext [email protected]
� Central Statistics OfficeThe contents of this release may be quoted provided thesource is given clearly and accurately. Reproduction for ownor internal use is permitted.
0%
5%
10%
15%
20%
25%
30%
At risk ofpoverty rate
Deprivationrate
Consistentpoverty rate
Poverty and deprivation rates of the elderly in Ireland,SILC 2004, 2009, 2010 revised and 2011
2004
2009
2010
2011
An Phríomh-Oifig Staidrimh
Central Statistics Office

2
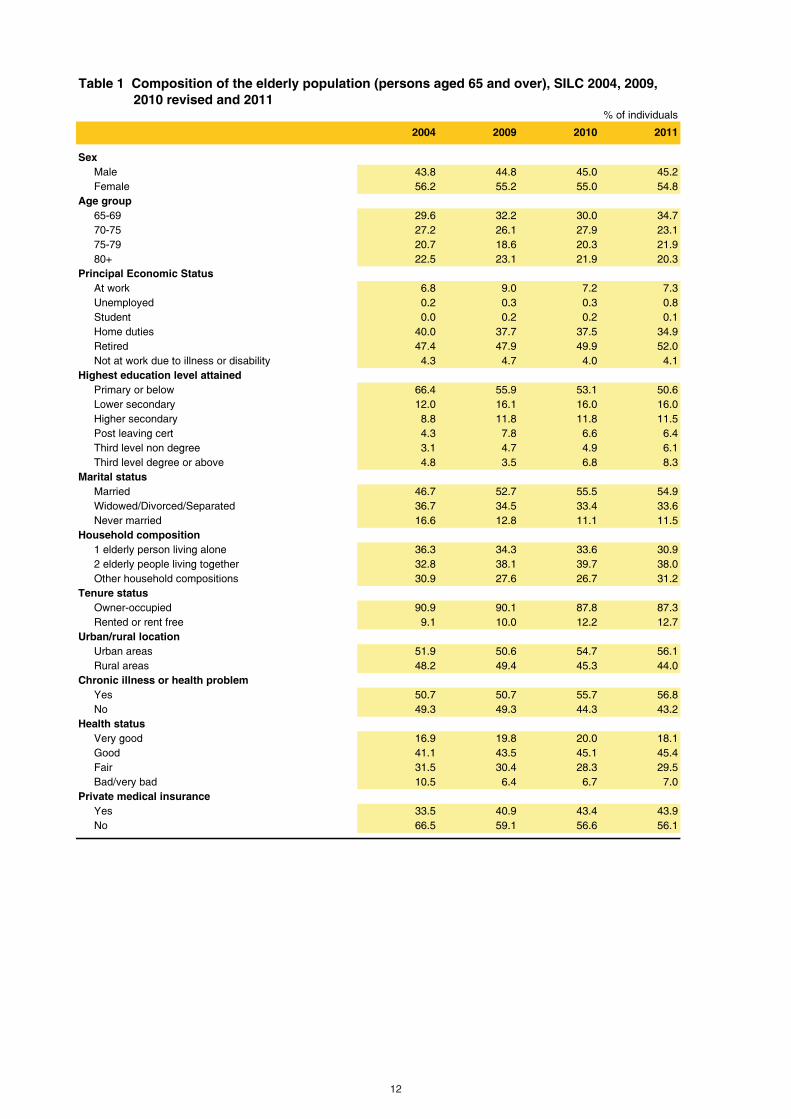
Composition of the elderly cohort in 2011
An elderly person is defined as a person aged 65 or over at the time of the SILC interview. An overview of the elderly,
according to SILC results, is presented in table 1. Some of the key findings for 2011 are presented below.
� In 2011 nearly 55% of the elderly were female, almost 9% had a highest educational attainment of ‘third level
degree or above’ while just over one third of the elderly were widowed, divorced or separated. The majority of the
elderly were retired or on home duties (52% and 35% respectively) with just over 7% at work.
� Just over 56% of the elderly lived in an urban area. More than 87% were living in owner-occupied accommodation.
� Even though only 7% of the elderly described their health status as ‘bad or very bad’, more than 56% said that they
suffered from a chronic illness or a health problem. Almost 44% were covered by private medical insurance. See
figure 1.

Income
The gross weekly income of the elderly population increased from €289.05 in 2004 to €428.86 in 2009, an increase of more
than 48% over the five year period. However, it decreased by 5% between 2009 and 2011 from €428.86 to €407.28.
Comparing the elderly with other age groups showed that between 2004 and 2009 the income for those of working age
(18-64) increased by just under 18% while the income of those aged 0-17 increased by just under 17%. Between 2009 and
2011 income decreased for all age groups (note that the equivalised gross income is applied to each member of the
household). See table A and table 2.
In figure 2, the average income of the elderly is broken down by its main components. This analysis indicates that the
increase in the average income between 2004 and 2011 was driven primarily by increases in both social transfers and
occupational pensions.
Social transfers remained the most significant source of income over time, representing well over half of gross income in
both 2004 and 2009 and nearly two-thirds of gross income in 2010 and 2011. Earnings fell as a proportion of gross income
from 24.1% in 2004 to 16.1% in 2011.
3
24.118.3
13.7 16.1
56.858.4
62.562.7
12.916.2 17.4 15.6
6.2 7.1 6.3 5.6
0%
10%
20%
30%
40%
50%
60%
70%
80%
90%
100%
2004 2009 2010 2011
Year
Figure 2 Composition of average gross weekly equivalised income ofpersons aged 65 and over, SILC 2004, 2009, 2010 revised and 2011
Other Income
Occupational Pension
Social Transfers
Earnings
Table A Gross weekly equivalised income by age group and year
% change % change % change % change % change
2004 2009 2010 2011 2004-2009 2004-2011 2009-2010 2009-2011 2010-2011
€ € € € % % % % %
Total population 460.91 551.39 534.66 522.87 + 19.6 + 13.4 - 3.0 - 5.2 - 2.2
Age Group
0-17 433.81 505.67 490.66 495.18 + 16.6 + 14.1 - 3.0 - 2.1 + 0.9
18-64 503.26 592.57 576.78 557.09 + 17.7 + 10.7 - 2.7 - 6.0 - 3.4
65 and over 289.05 428.86 411.90 407.28 + 48.4 + 40.9 - 4.0 - 5.0 - 1.1
Income by socio-demographic characteristics
Income of the elderly was analysed by socio-demographic characteristics and some key findings are presented below.
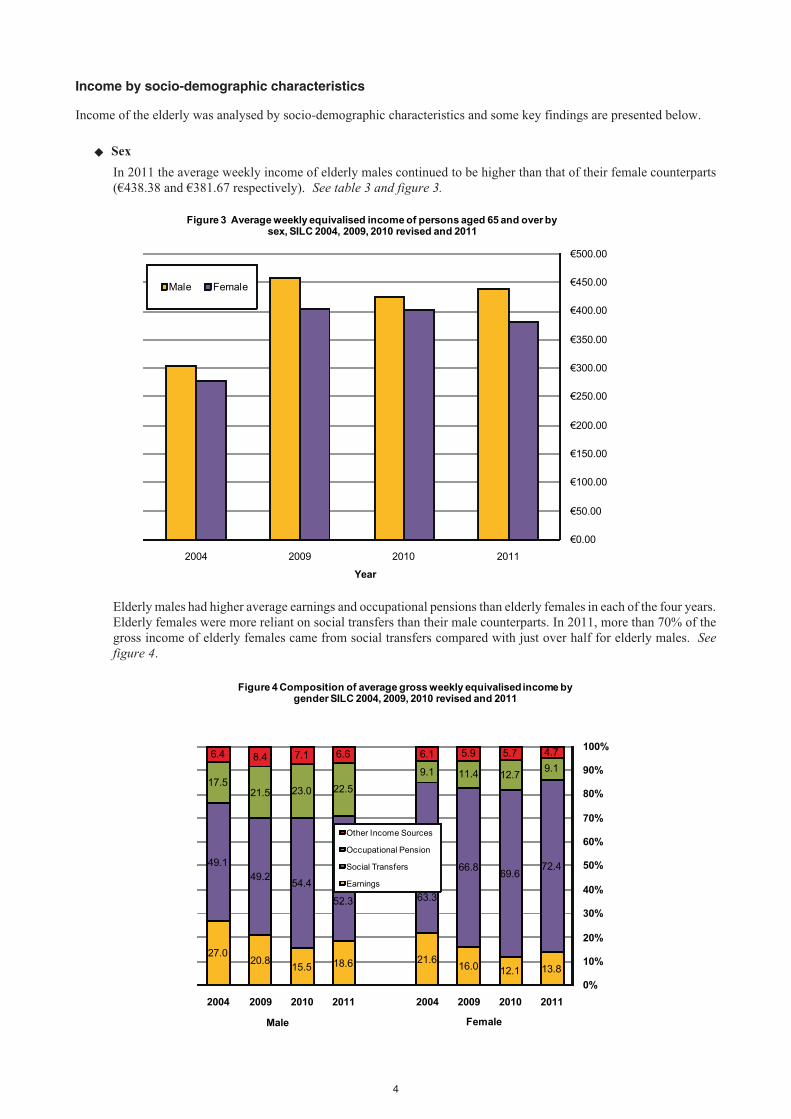
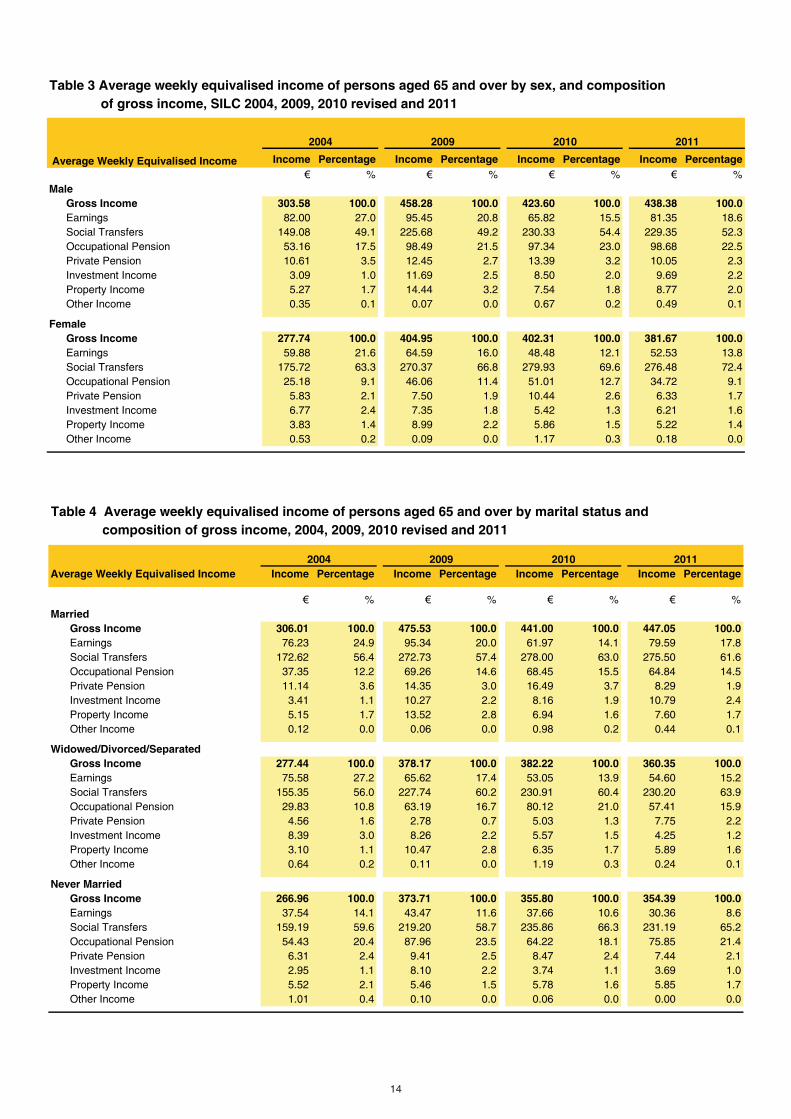
� Sex
In 2011 the average weekly income of elderly males continued to be higher than that of their female counterparts
(€438.38 and €381.67 respectively). See table 3 and figure 3.
Elderly males had higher average earnings and occupational pensions than elderly females in each of the four years.
Elderly females were more reliant on social transfers than their male counterparts. In 2011, more than 70% of the
gross income of elderly females came from social transfers compared with just over half for elderly males. See
figure 4.
4
27.020.8
15.5 18.6 21.616.0 12.1 13.8
49.1
49.254.4
52.3 63.3
66.869.6
72.4
17.521.5 23.0 22.5
9.1 11.4 12.79.1
6.4 8.4 7.1 6.6 6.1 5.9 5.7 4.7
0%
10%
20%
30%
40%
50%
60%
70%
80%
90%
100%
2004 2009 2010 2011 2004 2009 2010 2011
FemaleMale
Figure 4 Composition of average gross weekly equivalisedincome bygender SILC 2004, 2009, 2010 revised and 2011
Other Income Sources
Occupational Pension
Social Transfers
Earnings
€0.00
€50.00
€100.00
€150.00
€200.00
€250.00
€300.00
€350.00
€400.00
€450.00
€500.00
2004 2009 2010 2011
Year
Figure 3 Average weekly equivalised income of persons aged 65 and over bysex, SILC 2004, 2009, 2010 revised and 2011
Male Female
� Marital status
In 2011 elderly people who were married continued to have a higher average gross income when compared with
those who were never married or those who were widowed, divorced or separated. Elderly people who were
married had an average income of €447.05 in 2011 compared with €360.35 for elderly people who were widowed,
divorced or separated and €354.39 for elderly people who were never married.
The composition of gross income also differed by marital status. Those who described their marital status as ‘never
married’ were more reliant on occupational pensions than the others. For example in 2011, occupational pensions
represented 21.4% of the average income of elderly people who were never married compared with 15.9% for those
who were widowed, divorced and separated and 14.5% for those who were married. See table 4.
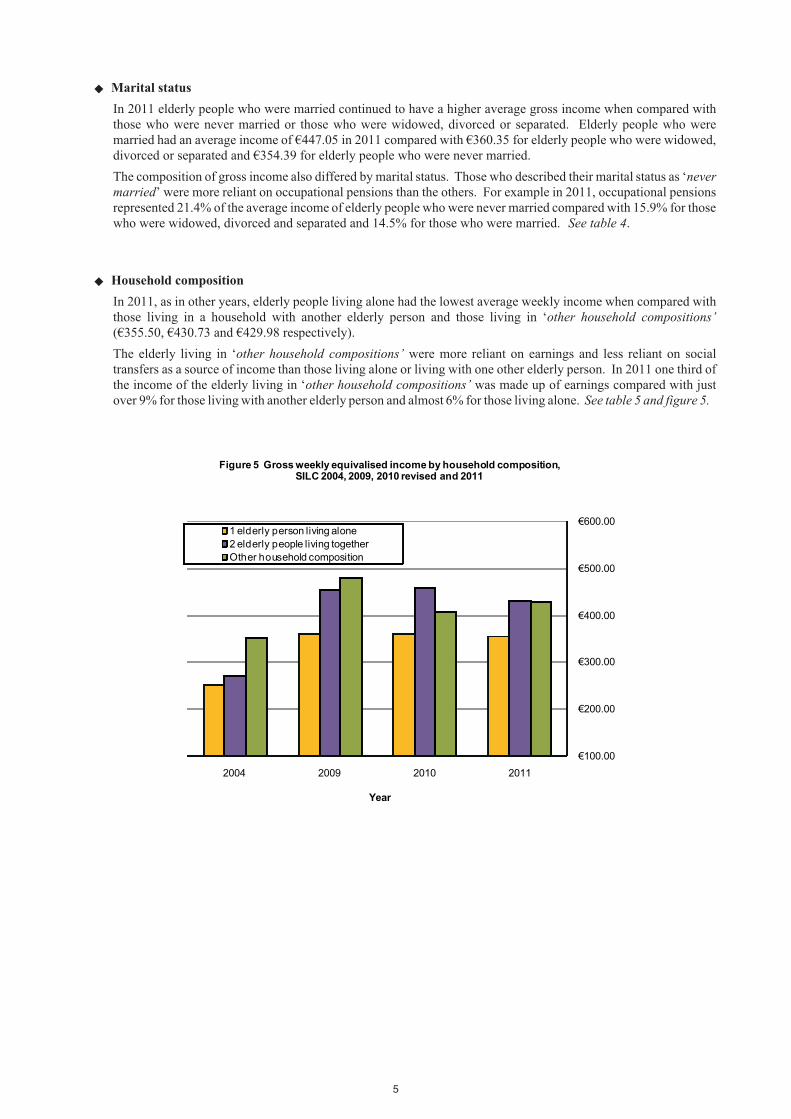
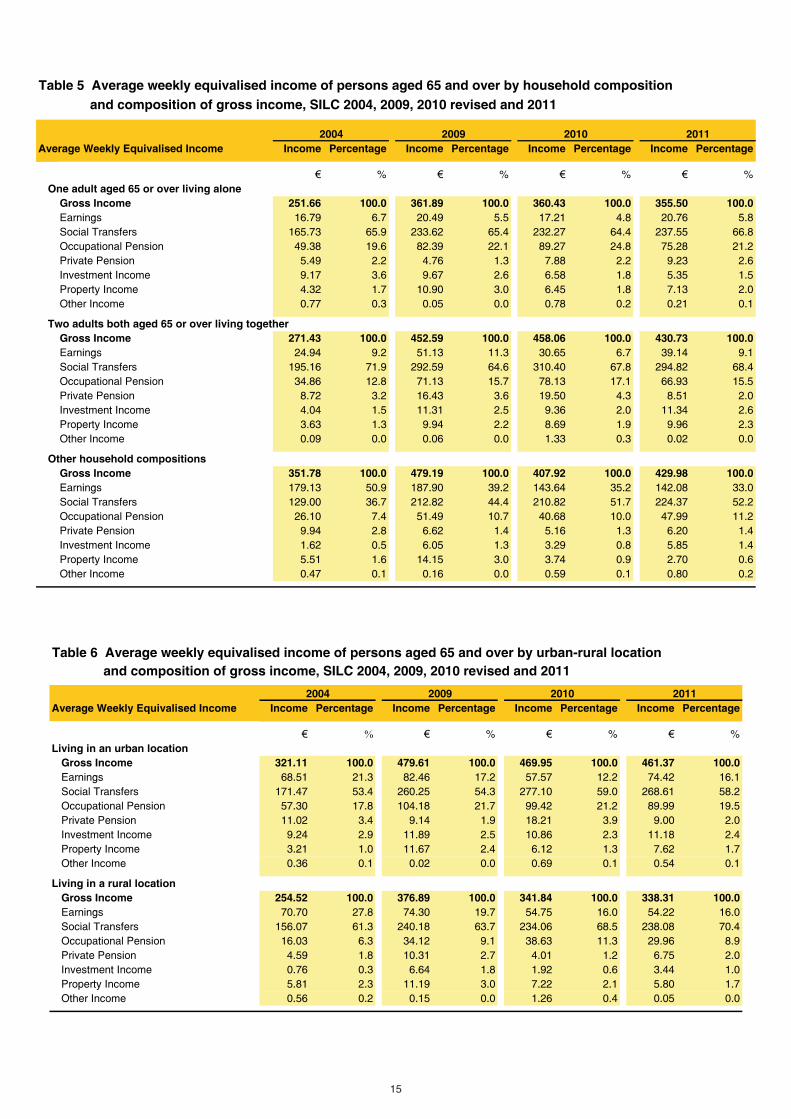
� Household composition
In 2011, as in other years, elderly people living alone had the lowest average weekly income when compared with
those living in a household with another elderly person and those living in ‘other household compositions’
(€355.50, €430.73 and €429.98 respectively).
The elderly living in ‘other household compositions’ were more reliant on earnings and less reliant on social
transfers as a source of income than those living alone or living with one other elderly person. In 2011 one third of
the income of the elderly living in ‘other household compositions’ was made up of earnings compared with just
over 9% for those living with another elderly person and almost 6% for those living alone. See table 5 and figure 5.
5
€100.00
€200.00
€300.00
€400.00
€500.00
€600.00
2004 2009 2010 2011
Year
Figure 5 Gross weekly equivalised income by household composition,SILC 2004, 2009, 2010 revised and 2011
1 elderly person living alone
2 elderly people living together
Other household composition

� Urban or rural location
In 2011, as in other years, elderly people living in urban areas had a higher average income than those living in rural
areas (€461.37 compared with €338.31).
Those living in rural areas were more dependent on social transfers and less reliant on occupational pensions as a
source of income than those living in urban areas. See table 6 and figure 6.
� Tenure status
In each of the four years elderly people living in owner-occupied accommodation had a higher average income than
those living in rented accommodation (€421.65 compared with €308.68 in 2011). Those living in rented
accommodation were more reliant on social transfers than those living in owner-occupied accommodation. For
example, in 2011, 77% of the income of those elderly living in rented accommodation was made up of social
transfers compared with 61% of the income of those living in owner-occupied accommodation. Less than 8 % of
the income of elderly people living in rented accommodation came from occupational pensions compared with just
under 17% for those living in owner-occupied accommodation. See table 7 and figure 7
6
25.118.9
13.8 16.5 13.2 9.5 12.8 12.2
55.6
56.660.8
61.168.9
84.1 80.277.4
13.316.9 18.5 16.5 9.2
6.1 6.67.6
6.0 7.6 6.9 5.9 8.7
0%
10%
20%
30%
40%
50%
60%
70%
80%
90%
100%
2004 2009 2010 2011 2004 2009 2010 2011
RentedOwner-occupied
Figure 7 Composition of gross income by tenure status,SILC 2004,2009, 2010 revised and 2011
Other Income Sources
Occupational Pension
Social Transfers
Earnings
16.112.217.2
21.316.016.019.7
27.8
58.259.0
54.353.4
70.468.563.7
61.3
19.521.221.717.8
8.911.39.1
6.3
6.17.66.87.44.74.27.54.6
0
10
20
30
40
50
60
70
80
90
100
20112010200920042011201020092004
Rural Location
%Figure 6 Compostion of gross income by location, SILC 2004, 2009,
2010 revised and 2011
Other IncomeSources
OccupationalPension
SocialTransfers
Earnings
Urban Location

� Quintiles
An analysis of the income distribution of the elderly by quintile showed that those in the lowest income quintile
were largely dependent on social transfers as a source of income. In 2011, over 85% of the income of those in the
lowest income quintile was made up of social transfers, while just over 37% of the income of those in the highest
quintile came from social transfers.
However, between 2004 and 2011 the proportion of income made up of social transfers in the highest income
quintile increased (27.3% to 37.3%) and the proportion of income made up of earnings fell from 41.5% to 26.5%.
See table 8 and figure 8.
7
5.1 8.5
41.5
26.5
89.4 85.627.3
37.3
20.9 26.9
10.3 9.3
0%
10%
20%
30%
40%
50%
60%
70%
80%
90%
100%
2004 2011 2004 2011
Quintile 5Quintile 1
Figure 8 Composition of average gross weekly equivalised income byextreme quintiles, SILC 2004 and 2011
Other Income Sources
Occupational Pension
Social Transfers
Earnings
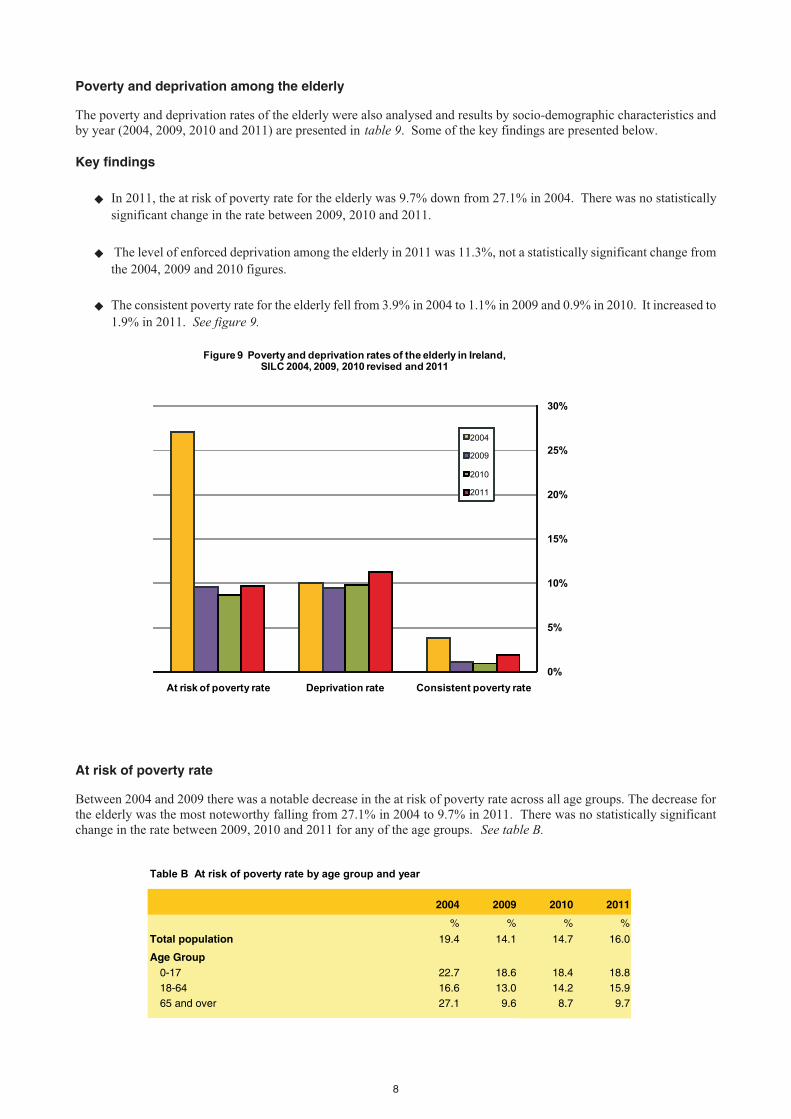
Poverty and deprivation among the elderly
The poverty and deprivation rates of the elderly were also analysed and results by socio-demographic characteristics and
by year (2004, 2009, 2010 and 2011) are presented in table 9. Some of the key findings are presented below.
Key findings
� In 2011, the at risk of poverty rate for the elderly was 9.7% down from 27.1% in 2004. There was no statistically
significant change in the rate between 2009, 2010 and 2011.
� The level of enforced deprivation among the elderly in 2011 was 11.3%, not a statistically significant change from
the 2004, 2009 and 2010 figures.
� The consistent poverty rate for the elderly fell from 3.9% in 2004 to 1.1% in 2009 and 0.9% in 2010. It increased to
1.9% in 2011. See figure 9.
At risk of poverty rate
Between 2004 and 2009 there was a notable decrease in the at risk of poverty rate across all age groups. The decrease for
the elderly was the most noteworthy falling from 27.1% in 2004 to 9.7% in 2011. There was no statistically significant
change in the rate between 2009, 2010 and 2011 for any of the age groups. See table B.
8
Table B At risk of poverty rate by age group and year
2004 2009 2010 2011
% % % %
Total population 19.4 14.1 14.7 16.0
Age Group
0-17 22.7 18.6 18.4 18.8
18-64 16.6 13.0 14.2 15.9
65 and over 27.1 9.6 8.7 9.7
0%
5%
10%
15%
20%
25%
30%
At risk of poverty rate Deprivation rate Consistent poverty rate
Figure 9 Poverty and deprivation rates of the elderly in Ireland,SILC 2004, 2009, 2010 revised and 2011
2004
2009
2010
2011

� In 2011, as in 2010, the elderly had the lowest at risk of poverty rate at 9.7% when compared with other age groups.
This was in contrast to 2004 when the elderly had the highest at risk of poverty rate at 27.1%.
� In 2004 elderly groups with the highest at risk of poverty rates were elderly people living alone (37.2%), those who
described their marital status as ‘never married’ (36.5%) and those who described their health status as ‘bad or very
bad’ (34.3%).
� From 2009 to 2011, the elderly groups who had some of the highest at risk of poverty rates were people living in
rural areas (nearly 13% of them through the period), those who were never married (almost 11% in 2009 and 2010
and 13.7% in 2011) and those who did not have private medical insurance (about 12.5% from 2009 to 2011).
� In 2011 elderly people who described their principal economic status as ‘at work’ had an at risk of poverty rate of
18% up from 6.4% in 2010.
� An analysis of the elderly group by age showed that those who were aged 80 and over had the highest at risk of
poverty rates (13.3% in 2009 and 12.5% in 2011), followed by the youngest group of elderly people, those aged
between 65 to 69 years, with a rate of nearly 10.5% through the period.
Level of enforced deprivation
In 2011, 11.3% of the elderly population experienced enforced deprivation (i.e. two or more of the 11 types of deprivation)
representing no significant change on the 2004, 2009 and 2010 figures. In general, elderly people tended to experience
lower rates of enforced deprivation than other groups in society. In 2011, over 32% of those aged 0-17 years and 24% of
those aged 18-64 years experienced enforced deprivation. See table D.
� In 2004, 2009, 2010 and 2011, the elderly groups who were most likely to experience relatively high levels ofenforced deprivation were those who described their health status as ‘bad or very bad’ (27.9% in 2011), those whowere not at work due to illness or disability (25.2% in 2011) and those living in rented accommodation (22.0% in2011).
� In 2011 the deprivation rate of those whose highest education level was third degree or above increased significantlyfrom nearly 2% between 2004 and 2010 to 10.3% in 2011. Similarly, the deprivation rate of those living withanother elderly person increased from 3.2% in 2010 to 8.0% in 2011.
� The elderly who described their health status as ‘bad or very bad’ had the highest deprivation rates (29.7% in 2010and 27.9% in 2011). Between 2010 and 2011 the deprivation rates of those with a ‘very good’ health statusincreased from 2.9% to 9.4%.
9
Table D Deprivation rate by age group and year
2004 2009 2010 2011
% % % %
Total population 14.1 17.1 22.6 24.5
Age Group
0-17 18.2 23.5 30.5 32.1
18-64 13.1 16.0 21.6 23.7
65 and over 10.0 9.5 9.8 11.3

Consistent poverty rate
The consistent poverty rate of the elderly increased from 0.9% in 2010 to 1.9% in 2011, this compared with decreases from
3.9% in 2004 and 1.1% in 2009.
� Those aged 65 and over had the lowest consistent poverty rate at 1.9% in 2011 when compared with those aged
18-64 (6.8%) and those aged 0-17 (9.3%). Similar patterns could be observed in 2004, 2009 and 2010.
� As the number of people at risk of poverty and also experiencing enforced deprivation was very small, it was not
possible to provide the consistent poverty rates across all socio-demographic groups of the elderly population.
10
Table C Consistent poverty rate by age group and year
2004 2009 2010 2011
% % % %
Total population 6.6 5.5 6.3 6.9
Age Group
0-17 9.2 8.7 8.8 9.3
18-64 5.9 4.9 6.2 6.8
65 and over 3.9 1.1 0.9 1.9

Tables
12
Table 1 Composition of the elderly population (persons aged 65 and over), SILC 2004, 2009,
2010 revised and 2011
2004 2009 2010 2011
Sex
Male 43.8 44.8 45.0 45.2
Female 56.2 55.2 55.0 54.8
Age group
65-69 29.6 32.2 30.0 34.7
70-75 27.2 26.1 27.9 23.1
75-79 20.7 18.6 20.3 21.9
80+ 22.5 23.1 21.9 20.3
Principal Economic Status
At work 6.8 9.0 7.2 7.3
Unemployed 0.2 0.3 0.3 0.8
Student 0.0 0.2 0.2 0.1
Home duties 40.0 37.7 37.5 34.9
Retired 47.4 47.9 49.9 52.0
Not at work due to illness or disability 4.3 4.7 4.0 4.1
Highest education level attained
Primary or below 66.4 55.9 53.1 50.6
Lower secondary 12.0 16.1 16.0 16.0
Higher secondary 8.8 11.8 11.8 11.5
Post leaving cert 4.3 7.8 6.6 6.4
Third level non degree 3.1 4.7 4.9 6.1
Third level degree or above 4.8 3.5 6.8 8.3
Marital status
Married 46.7 52.7 55.5 54.9
Widowed/Divorced/Separated 36.7 34.5 33.4 33.6
Never married 16.6 12.8 11.1 11.5
Household composition
1 elderly person living alone 36.3 34.3 33.6 30.9
2 elderly people living together 32.8 38.1 39.7 38.0
Other household compositions 30.9 27.6 26.7 31.2
Tenure status
Owner-occupied 90.9 90.1 87.8 87.3
Rented or rent free 9.1 10.0 12.2 12.7
Urban/rural location
Urban areas 51.9 50.6 54.7 56.1
Rural areas 48.2 49.4 45.3 44.0
Chronic illness or health problem
Yes 50.7 50.7 55.7 56.8
No 49.3 49.3 44.3 43.2
Health status
Very good 16.9 19.8 20.0 18.1
Good 41.1 43.5 45.1 45.4
Fair 31.5 30.4 28.3 29.5
Bad/very bad 10.5 6.4 6.7 7.0
Private medical insurance
Yes 33.5 40.9 43.4 43.9
No 66.5 59.1 56.6 56.1
% of individuals

Table 2 Average weekly equivalised income of persons aged 65 and over by age-group and
composition of gross income, SILC 2004, 2009, 2010 revised and 2011
Average Weekly Equivalised Income Income Percentage Income Percentage Income Percentage Income Percentage
€ % € % € % € %
All persons aged 65 and over
Gross Income 289.05 100.0 428.86 100.0 411.90 100.0 407.28 100.0
Earnings 69.56 24.1 78.43 18.3 56.28 13.7 65.54 16.1
Social Transfers 164.06 56.8 250.33 58.4 257.59 62.5 255.19 62.7
Occupational Pension 37.43 12.9 69.56 16.2 71.87 17.4 63.61 15.6
Private Pension 7.92 2.7 9.72 2.3 11.77 2.9 8.01 2.0
Investment Income 5.16 1.8 9.30 2.2 6.81 1.7 7.78 1.9
Property Income 4.46 1.5 11.43 2.7 6.62 1.6 6.82 1.7
Other Income 0.45 0.2 0.08 0.0 0.95 0.2 0.32 0.1
Age 65-69
Gross Income 329.87 100.0 483.03 100.0 414.77 100.0 449.58 100.0
Earnings 102.10 31.0 127.06 26.3 79.39 19.1 109.34 24.3
Social Transfers 160.54 48.7 241.06 49.9 240.01 57.9 244.51 54.4
Occupational Pension 45.83 13.9 73.79 15.3 69.44 16.7 71.04 15.8
Private Pension 10.70 3.2 15.67 3.2 11.35 2.7 8.81 2.0
Investment Income 4.48 1.4 9.85 2.0 7.41 1.8 8.81 2.0
Property Income 5.76 1.7 15.50 3.2 7.12 1.7 6.21 1.4
Other Income 0.47 0.1 0.10 0.0 0.05 0.0 0.87 0.2
Age 70-74
Gross Income 274.03 100.0 453.56 100.0 448.63 100.0 416.45 100.0
Earnings 58.71 21.4 66.90 14.7 52.36 11.7 47.83 11.5
Social Transfers 168.51 61.5 272.48 60.1 286.41 63.8 282.91 67.9
Occupational Pension 34.89 12.7 82.12 18.1 76.79 17.1 64.21 15.4
Private Pension 6.51 2.4 9.44 2.1 14.32 3.2 8.13 2.0
Investment Income 2.26 0.8 8.31 1.8 6.89 1.5 8.47 2.0
Property Income 2.74 1.0 14.30 3.2 9.49 2.1 4.87 1.2
Other Income 0.41 0.1 0.02 0.0 2.37 0.5 0.01 0.0
Age 75-79
Gross Income 257.52 100.0 414.83 100.0 421.62 100.0 386.95 100.0
Earnings 46.02 17.9 56.36 13.6 39.44 9.4 36.73 9.5
Social Transfers 160.34 62.3 250.58 60.4 263.27 62.4 259.00 66.9
Occupational Pension 32.07 12.5 74.14 17.9 86.47 20.5 66.48 17.2
Private Pension 7.81 3.0 9.78 2.4 16.19 3.8 5.99 1.5
Investment Income 4.26 1.7 12.71 3.1 10.23 2.4 7.51 1.9
Property Income 6.43 2.5 11.20 2.7 5.04 1.2 11.20 2.9
Other Income 0.58 0.2 0.05 0.0 0.98 0.2 0.04 0.0
Age 80 or over
Gross Income 282.53 100.0 336.84 100.0 352.03 100.0 346.27 100.0
Earnings 61.55 21.8 41.45 12.3 45.29 12.9 41.83 12.1
Social Transfers 166.73 59.0 238.08 70.7 239.60 68.1 237.74 68.7
Occupational Pension 34.38 12.2 45.84 13.6 55.41 15.7 47.05 13.6
Private Pension 6.09 2.2 1.70 0.5 5.00 1.4 8.70 2.5
Investment Income 10.38 3.7 6.89 2.0 2.70 0.8 5.52 1.6
Property Income 3.03 1.1 2.72 0.8 3.72 1.1 5.36 1.5
Other Income 0.37 0.1 0.16 0.0 0.32 0.1 0.06 0.0
2004 2009 2010 2011
13
14
Table 3 Average weekly equivalised income of persons aged 65 and over by sex, and composition
of gross income, SILC 2004, 2009, 2010 revised and 2011
Income Percentage Income Percentage Income Percentage Income Percentage
€ % € % € % € %
Male
Gross Income 303.58 100.0 458.28 100.0 423.60 100.0 438.38 100.0
Earnings 82.00 27.0 95.45 20.8 65.82 15.5 81.35 18.6
Social Transfers 149.08 49.1 225.68 49.2 230.33 54.4 229.35 52.3
Occupational Pension 53.16 17.5 98.49 21.5 97.34 23.0 98.68 22.5
Private Pension 10.61 3.5 12.45 2.7 13.39 3.2 10.05 2.3
Investment Income 3.09 1.0 11.69 2.5 8.50 2.0 9.69 2.2
Property Income 5.27 1.7 14.44 3.2 7.54 1.8 8.77 2.0
Other Income 0.35 0.1 0.07 0.0 0.67 0.2 0.49 0.1
Female
Gross Income 277.74 100.0 404.95 100.0 402.31 100.0 381.67 100.0
Earnings 59.88 21.6 64.59 16.0 48.48 12.1 52.53 13.8
Social Transfers 175.72 63.3 270.37 66.8 279.93 69.6 276.48 72.4
Occupational Pension 25.18 9.1 46.06 11.4 51.01 12.7 34.72 9.1
Private Pension 5.83 2.1 7.50 1.9 10.44 2.6 6.33 1.7
Investment Income 6.77 2.4 7.35 1.8 5.42 1.3 6.21 1.6
Property Income 3.83 1.4 8.99 2.2 5.86 1.5 5.22 1.4
Other Income 0.53 0.2 0.09 0.0 1.17 0.3 0.18 0.0
Average Weekly Equivalised Income
2004 20112009 2010
Table 4 Average weekly equivalised income of persons aged 65 and over by marital status and
composition of gross income, 2004, 2009, 2010 revised and 2011
Average Weekly Equivalised Income Income Percentage Income Percentage Income Percentage Income Percentage
€ % € % € % € %
Married
Gross Income 306.01 100.0 475.53 100.0 441.00 100.0 447.05 100.0
Earnings 76.23 24.9 95.34 20.0 61.97 14.1 79.59 17.8
Social Transfers 172.62 56.4 272.73 57.4 278.00 63.0 275.50 61.6
Occupational Pension 37.35 12.2 69.26 14.6 68.45 15.5 64.84 14.5
Private Pension 11.14 3.6 14.35 3.0 16.49 3.7 8.29 1.9
Investment Income 3.41 1.1 10.27 2.2 8.16 1.9 10.79 2.4
Property Income 5.15 1.7 13.52 2.8 6.94 1.6 7.60 1.7
Other Income 0.12 0.0 0.06 0.0 0.98 0.2 0.44 0.1
Widowed/Divorced/Separated
Gross Income 277.44 100.0 378.17 100.0 382.22 100.0 360.35 100.0
Earnings 75.58 27.2 65.62 17.4 53.05 13.9 54.60 15.2
Social Transfers 155.35 56.0 227.74 60.2 230.91 60.4 230.20 63.9
Occupational Pension 29.83 10.8 63.19 16.7 80.12 21.0 57.41 15.9
Private Pension 4.56 1.6 2.78 0.7 5.03 1.3 7.75 2.2
Investment Income 8.39 3.0 8.26 2.2 5.57 1.5 4.25 1.2
Property Income 3.10 1.1 10.47 2.8 6.35 1.7 5.89 1.6
Other Income 0.64 0.2 0.11 0.0 1.19 0.3 0.24 0.1
Never Married
Gross Income 266.96 100.0 373.71 100.0 355.80 100.0 354.39 100.0
Earnings 37.54 14.1 43.47 11.6 37.66 10.6 30.36 8.6
Social Transfers 159.19 59.6 219.20 58.7 235.86 66.3 231.19 65.2
Occupational Pension 54.43 20.4 87.96 23.5 64.22 18.1 75.85 21.4
Private Pension 6.31 2.4 9.41 2.5 8.47 2.4 7.44 2.1
Investment Income 2.95 1.1 8.10 2.2 3.74 1.1 3.69 1.0
Property Income 5.52 2.1 5.46 1.5 5.78 1.6 5.85 1.7
Other Income 1.01 0.4 0.10 0.0 0.06 0.0 0.00 0.0
2004 2009 2010 2011
15
Table 5 Average weekly equivalised income of persons aged 65 and over by household composition
and composition of gross income, SILC 2004, 2009, 2010 revised and 2011
Average Weekly Equivalised Income Income Percentage Income Percentage Income Percentage Income Percentage
€ % € % € % € %
One adult aged 65 or over living alone
Gross Income 251.66 100.0 361.89 100.0 360.43 100.0 355.50 100.0
Earnings 16.79 6.7 20.49 5.5 17.21 4.8 20.76 5.8
Social Transfers 165.73 65.9 233.62 65.4 232.27 64.4 237.55 66.8
Occupational Pension 49.38 19.6 82.39 22.1 89.27 24.8 75.28 21.2
Private Pension 5.49 2.2 4.76 1.3 7.88 2.2 9.23 2.6
Investment Income 9.17 3.6 9.67 2.6 6.58 1.8 5.35 1.5
Property Income 4.32 1.7 10.90 3.0 6.45 1.8 7.13 2.0
Other Income 0.77 0.3 0.05 0.0 0.78 0.2 0.21 0.1
Two adults both aged 65 or over living together
Gross Income 271.43 100.0 452.59 100.0 458.06 100.0 430.73 100.0
Earnings 24.94 9.2 51.13 11.3 30.65 6.7 39.14 9.1
Social Transfers 195.16 71.9 292.59 64.6 310.40 67.8 294.82 68.4
Occupational Pension 34.86 12.8 71.13 15.7 78.13 17.1 66.93 15.5
Private Pension 8.72 3.2 16.43 3.6 19.50 4.3 8.51 2.0
Investment Income 4.04 1.5 11.31 2.5 9.36 2.0 11.34 2.6
Property Income 3.63 1.3 9.94 2.2 8.69 1.9 9.96 2.3
Other Income 0.09 0.0 0.06 0.0 1.33 0.3 0.02 0.0
Other household compositions
Gross Income 351.78 100.0 479.19 100.0 407.92 100.0 429.98 100.0
Earnings 179.13 50.9 187.90 39.2 143.64 35.2 142.08 33.0
Social Transfers 129.00 36.7 212.82 44.4 210.82 51.7 224.37 52.2
Occupational Pension 26.10 7.4 51.49 10.7 40.68 10.0 47.99 11.2
Private Pension 9.94 2.8 6.62 1.4 5.16 1.3 6.20 1.4
Investment Income 1.62 0.5 6.05 1.3 3.29 0.8 5.85 1.4
Property Income 5.51 1.6 14.15 3.0 3.74 0.9 2.70 0.6
Other Income 0.47 0.1 0.16 0.0 0.59 0.1 0.80 0.2
2004 2009 2010 2011
Table 6 Average weekly equivalised income of persons aged 65 and over by urban-rural location
and composition of gross income, SILC 2004, 2009, 2010 revised and 2011
Average Weekly Equivalised Income Income Percentage Income Percentage Income Percentage Income Percentage
€ % € % € % € %
Living in an urban location
Gross Income 321.11 100.0 479.61 100.0 469.95 100.0 461.37 100.0
Earnings 68.51 21.3 82.46 17.2 57.57 12.2 74.42 16.1
Social Transfers 171.47 53.4 260.25 54.3 277.10 59.0 268.61 58.2
Occupational Pension 57.30 17.8 104.18 21.7 99.42 21.2 89.99 19.5
Private Pension 11.02 3.4 9.14 1.9 18.21 3.9 9.00 2.0
Investment Income 9.24 2.9 11.89 2.5 10.86 2.3 11.18 2.4
Property Income 3.21 1.0 11.67 2.4 6.12 1.3 7.62 1.7
Other Income 0.36 0.1 0.02 0.0 0.69 0.1 0.54 0.1
Living in a rural location
Gross Income 254.52 100.0 376.89 100.0 341.84 100.0 338.31 100.0
Earnings 70.70 27.8 74.30 19.7 54.75 16.0 54.22 16.0
Social Transfers 156.07 61.3 240.18 63.7 234.06 68.5 238.08 70.4
Occupational Pension 16.03 6.3 34.12 9.1 38.63 11.3 29.96 8.9
Private Pension 4.59 1.8 10.31 2.7 4.01 1.2 6.75 2.0
Investment Income 0.76 0.3 6.64 1.8 1.92 0.6 3.44 1.0
Property Income 5.81 2.3 11.19 3.0 7.22 2.1 5.80 1.7
Other Income 0.56 0.2 0.15 0.0 1.26 0.4 0.05 0.0
2004 2009 2010 2011

16
Table 7 Average weekly equivalised income of persons aged 65 and over by tenure status, and
composition of gross income, SILC 2004, 2009, 2010 revised and 2011
Average Weekly Equivalised Income Income Percentage Income Percentage Income Percentage Income Percentage
Tenure Status € % € % € % € %
Accommodation owned outright or with a mortgage
Gross Income 293.50 100.0 445.32 100.0 427.67 100.0 421.65 100.0
Earnings 73.72 25.1 84.14 18.9 58.80 13.7 69.62 16.5
Social Transfers 163.15 55.6 251.99 56.6 260.13 60.8 257.55 61.1
Occupational Pension 39.06 13.3 75.38 16.9 79.15 18.5 69.44 16.5
Private Pension 8.68 3.0 10.76 2.4 13.35 3.1 8.82 2.1
Investment Income 3.60 1.2 10.27 2.3 7.68 1.8 8.78 2.1
Property Income 4.91 1.7 12.68 2.8 7.47 1.7 7.07 1.7
Other Income 0.40 0.1 0.09 0.0 1.08 0.3 0.37 0.1
Accommodation is rented or provided rent free
Gross Income 249.78 100.0 279.90 100.0 298.52 100.0 308.68 100.0
Earnings 32.97 13.2 26.70 9.5 38.23 12.8 37.55 12.2
Social Transfers 172.10 68.9 235.34 84.1 239.36 80.2 239.03 77.4
Occupational Pension 23.03 9.2 16.99 6.1 19.56 6.6 23.59 7.6
Private Pension 1.29 0.5 0.28 0.1 0.39 0.1 2.45 0.8
Investment Income 18.91 7.6 0.45 0.2 0.51 0.2 0.95 0.3
Property Income 0.53 0.2 0.14 0.1 0.46 0.2 5.10 1.7
Other Income 0.96 0.4 0.00 0.0 0.00 0.0 0.00 0.0
2004 2009 2010 2011

17
Ta
ble
8A
ve
rag
ew
ee
kly
eq
uiv
alis
ed
inc
om
eo
fp
ers
on
sa
ge
d6
5a
nd
ov
er
by
qu
inti
lea
nd
co
mp
os
itio
no
fg
ros
sin
co
me
SIL
C2
00
4,
20
09
,2
01
0re
vis
ed
an
d2
01
1
Avera
ge
Weekly
Eq
uiv
ali
sed
Inco
me
Inco
me
Perc
en
tag
eIn
co
me
Perc
en
tag
eIn
co
me
Perc
en
tag
eIn
co
me
Perc
en
tag
eIn
co
me
Perc
en
tag
eIn
co
me
Perc
en
tag
e
€%
€%
€%
€%
€%
€%
Gro
ss
Inco
me
185.4
5100.0
274.0
7100.0
312.0
8100.0
423.6
6100.0
842.1
4100.0
407.2
8100.0
Earn
ings
15.8
28.5
5.0
31.8
13.6
34.4
70.9
716.8
222.7
626.5
65.5
416.1
Socia
lT
ransfe
rs158.6
985.6
260.5
595.1
275.4
588.3
266.8
563.0
314.4
037.3
255.1
962.7
OccupationalP
ensio
n5.8
33.1
3.4
91.3
14.6
44.7
67.8
616.0
226.6
626.9
63.6
115.6
Private
Pensio
n0.8
80.5
2.5
20.9
2.6
00.8
8.0
81.9
26.0
23.1
8.0
12.0
Investm
ent
Incom
e2.7
41.5
1.1
30.4
2.7
60.9
3.1
30.7
29.1
63.5
7.7
81.9
Pro
pert
yIn
com
e1.4
00.8
1.3
40.5
3.0
11.0
6.7
61.6
21.6
42.6
6.8
21.7
Oth
er
Incom
e0.0
90.0
0.0
20.0
0.0
00.0
0.0
10.0
1.5
00.2
0.3
20.1
Avera
ge
Weekly
Eq
uiv
ali
sed
Inco
me
Inco
me
Perc
en
tag
eIn
co
me
Perc
en
tag
eIn
co
me
Perc
en
tag
eIn
co
me
Perc
en
tag
eIn
co
me
Perc
en
tag
eIn
co
me
Perc
en
tag
e
€%
€%
€%
€%
€%
€%
Gro
ss
Inco
me
197.1
5100.0
276.6
3100.0
322.1
3100.0
426.9
4100.0
841.3
8100.0
411.9
0100.0
Earn
ings
5.8
02.9
10.2
93.7
23.9
77.4
57.6
613.5
185.1
922.0
56.2
913.7
Socia
lT
ransfe
rs177.7
590.2
260.8
194.3
263.1
081.7
278.2
365.2
308.5
436.7
257.5
962.5
OccupationalP
ensio
n9.2
34.7
3.8
81.4
21.8
96.8
76.6
117.9
249.8
529.7
71.8
717.4
Private
Pensio
n1.4
30.7
0.8
30.3
3.0
71.0
4.8
41.1
49.0
85.8
11.7
72.9
Investm
ent
Incom
e0.8
10.4
0.4
10.1
3.8
51.2
2.6
60.6
26.5
03.1
6.8
11.7
Pro
pert
yIn
com
e2.0
51.0
0.3
80.1
5.5
31.7
4.8
71.1
20.4
02.4
6.6
21.6
Oth
er
Incom
e0.0
90.0
0.0
30.0
0.7
30.2
2.0
80.5
1.8
30.2
0.9
50.2
Avera
ge
Weekly
Eq
uiv
ali
sed
Inco
me
Inco
me
Perc
en
tag
eIn
co
me
Perc
en
tag
eIn
co
me
Perc
en
tag
eIn
co
me
Perc
en
tag
eIn
co
me
Perc
en
tag
eIn
co
me
Perc
en
tag
e
€%
€%
€%
€%
€%
€%
Gro
ss
Inco
me
209.4
1100.0
277.3
4100.0
320.7
7100.0
430.4
4100.0
911.4
4100.0
428.8
6100.0
Earn
ings
9.0
84.3
8.8
53.2
23.7
47.4
75.9
317.6
276.6
230.3
78.4
318.3
Socia
lT
ransfe
rs183.7
987.8
262.6
094.7
262.1
181.7
256.4
559.6
286.9
931.5
250.3
358.4
OccupationalP
ensio
n7.1
63.4
2.8
31.0
24.9
17.8
80.5
818.7
234.1
225.7
69.5
616.2
Private
Pensio
n3.3
41.6
1.4
30.5
2.9
00.9
6.8
41.6
34.3
53.8
9.7
22.3
Investm
ent
Incom
e3.1
41.5
1.1
90.4
1.7
30.5
6.0
91.4
34.6
03.8
9.3
02.2
Pro
pert
yIn
com
e2.8
71.4
0.3
50.1
5.3
51.7
4.4
11.0
44.6
14.9
11.4
32.7
Oth
er
Incom
e0.0
30.0
0.0
90.0
0.0
30.0
0.1
30.0
0.1
40.0
0.0
80.0
Avera
ge
Weekly
Eq
uiv
ali
sed
Inco
me
Inco
me
Perc
en
tag
eIn
co
me
Perc
en
tag
eIn
co
me
Perc
en
tag
eIn
co
me
Perc
en
tag
eIn
co
me
Perc
en
tag
eIn
co
me
Perc
en
tag
e
€%
€%
€%
€%
€%
€%
Gro
ss
Inco
me
153.7
7100.0
188.7
7100.0
214.8
3100.0
300.9
5100.0
587.2
9100.0
289.0
5100.0
Earn
ings
7.8
35.1
4.6
12.4
19.7
79.2
71.8
223.9
243.9
941.5
69.5
624.1
Socia
lT
ransfe
rs137.4
389.4
179.4
795.1
178.0
082.9
164.9
754.8
160.4
527.3
164.0
656.8
OccupationalP
ensio
n3.7
52.4
3.1
61.7
10.9
85.1
46.6
815.5
122.6
620.9
37.4
312.9
Private
Pensio
n1.1
20.7
0.2
20.1
3.5
81.7
10.0
83.4
24.6
34.2
7.9
22.7
Investm
ent
Incom
e0.2
90.2
0.2
50.1
1.2
00.6
2.0
70.7
22.0
03.7
5.1
61.8
Pro
pert
yIn
com
e2.1
51.4
0.7
90.4
0.8
70.4
5.1
51.7
13.3
52.3
4.4
61.5
Oth
er
Incom
e1.1
90.8
0.2
80.1
0.4
20.2
0.1
80.1
0.2
00.0
0.4
50.2
Qu
inti
le5:
Gro
ss
Inco
me
>€520.1
1
All
pers
on
sag
ed
65
an
d
over
Qu
inti
le1
:G
ros
sIn
co
me
<=
€257.8
3
Qu
inti
le2:
Gro
ss
Inco
me
<=
€286.5
3
Qu
inti
le3:
Gro
ss
Inco
me
<=
€350.7
1
Qu
inti
le4:
Gro
ss
Inco
me
<=
€520.1
1
All
pers
on
sag
ed
65
an
d
over
Qu
inti
le1
:G
ros
sIn
co
me
<=
€263.0
5
Qu
inti
le2:
Gro
ss
Inco
me
<=
€290.9
3
Qu
inti
le3:
Gro
ss
Inco
me
<=
€369.2
2
Qu
inti
le4:
Gro
ss
Inco
me
<=
€520.3
7
Qu
inti
le5:
Gro
ss
Inco
me
>€520.3
7
2010
2009
Qu
inti
le4:
Gro
ss
Inco
me
<=
€374.9
0
Qu
inti
le5:
Gro
ss
Inco
me
>€374.9
0
2011
All
pers
on
sag
ed
65
an
d
over
All
pers
on
sag
ed
65
an
d
over
Qu
inti
le1
:G
ros
sIn
co
me
<=
€261.2
0
Qu
inti
le2:
Gro
ss
Inco
me
<=
€292.4
2
Qu
inti
le3:
Gro
ss
Inco
me
<=
€365.5
4
Qu
inti
le4:
Gro
ss
Inco
me
<=
€494.8
6
Qu
inti
le5:
Gro
ss
Inco
me
>€494.8
6
2004
Qu
inti
le1
:G
ros
sIn
co
me
<=
€179.9
7
Qu
inti
le2:
Gro
ss
Inco
me
<=
€197.6
7
Qu
inti
le3:
Gro
ss
Inco
me
<=
€243.5
7

Ta
ble
9P
ov
ert
ya
nd
de
pri
va
tio
nra
tes
of
the
eld
erl
yp
op
ula
tio
nin
Ire
lan
d(p
ers
on
sa
ge
d6
5a
nd
ov
er)
,S
ILC
20
04
,2
00
9,
20
10
rev
ise
da
nd
20
11
%of
indiv
iduals
aged
65
and
over
At
risk
of
Co
nsis
ten
tA
tri
sk
Co
nsis
ten
tA
tri
sk
Co
nsis
ten
tA
tri
sk
Co
nsis
ten
t
po
vert
yD
ep
rivati
on
po
vert
yo
fp
overt
yD
ep
rivati
on
po
vert
yo
fp
overt
yD
ep
rivati
on
po
vert
yo
fp
overt
yD
ep
rivati
on
po
vert
y
rate
rate
1ra
tera
tera
te1
rate
rate
rate
1ra
tera
tera
te1
rate
All
pers
on
sag
ed
65
an
do
ver
27.1
10.0
3.9
9.6
9.5
1.1
8.7
9.8
0.9
9.7
11.3
1.9
Sex Male
25.8
8.8
4.0
8.9
7.6
0.8
9.3
7.1
1.3
10.1
9.2
2.1
Fem
ale
28.2
10.9
3.8
10.2
11.1
1.4
8.3
11.9
0.7
9.4
13.0
1.8
Ag
eg
rou
p65-6
929.5
11.3
5.2
10.4
11.0
1.1
10.8
10.6
0.7
10.1
14.9
3.4
70-7
526.2
10.8
4.8
7.1
6.5
1.5
5.5
7.2
1.0
7.1
9.5
1.1
75-7
927.3
9.6
2.8
7.2
11.2
0.1
9.6
10.0
0.7
9.4
13.2
1.2
80+
25.0
7.6
2.0
13.3
9.5
1.6
9.2
11.6
1.5
12.5
5.1
1.2
Pri
ncip
al
Eco
no
mic
Sta
tus
At
work
19.5
11.7
4.0
13.5
1.6
0.0
6.4
4.8
0.0
18.0
13.2
6.2
Unem
plo
yed
**
**
**
**
**
**
Stu
dent
**
**
**
**
**
**
Hom
eduties
30.2
11.1
4.1
9.5
13.5
1.3
8.6
12.1
0.6
9.6
11.7
1.6
Retire
d24.0
7.8
2.9
8.3
8.1
1.2
7.8
6.6
0.7
8.6
10.0
1.7
Not
at
work
due
toill
ness/d
isabili
ty34.2
20.3
11.4
16.0
8.4
1.6
24.6
31.7
10.0
9.2
25.2
0.5
Mari
tal
sta
tus
Marr
ied
21.2
6.1
2.1
9.3
5.9
1.4
7.6
5.4
0.9
7.8
7.9
0.8
Wid
ow
ed/S
epara
ted/D
ivorc
ed
30.5
12.3
4.2
9.4
12.5
1.0
9.9
14.9
1.3
11.4
17.1
3.8
Never
marr
ied
36.5
15.7
8.2
11.3
16.1
0.4
11.1
16.1
0.2
13.7
10.7
1.7
Hig
hest
ed
ucati
on
level
att
ain
ed
Prim
ary
or
belo
w31.7
12.7
5.2
10.7
13.0
1.3
10.7
13.7
0.9
11.5
14.2
2.4
Low
er
secondary
21.5
5.0
1.3
9.4
7.8
1.1
8.6
6.6
2.0
7.1
5.7
2.7
Hig
her
secondary
20.9
5.1
1.9
7.7
3.6
0.9
6.8
5.7
0.4
9.8
6.9
1.3
Post
leavin
gcert
19.0
5.6
0.7
7.4
6.4
1.4
5.1
5.8
0.7
7.8
15.3
1.7
Third
levelnon
degre
e15.3
4.6
0.0
12.0
0.2
0.0
8.5
4.0
0.3
4.8
3.0
0.0
Third
leveldegre
eor
above
5.5
1.6
0.6
1.1
2.0
1.4
1.1
2.0
0.0
9.8
10.3
0.0
Ho
useh
old
co
mp
osit
ion
1eld
erly
pers
on
livin
galo
ne
37.2
13.8
5.8
9.5
13.9
0.6
8.0
15.1
0.8
9.1
14.2
1.3
2eld
erly
people
livin
gto
geth
er
21.4
3.7
1.6
8.5
5.5
0.0
7.6
3.2
0.1
8.5
8.0
0.9
Oth
er
household
com
positio
n21.5
12.1
4.0
11.2
9.5
3.3
11.4
12.8
2.4
11.8
12.5
3.8
Ten
ure
sta
tus
Ow
ner-
occupie
d27.1
8.7
3.5
9.4
7.9
0.7
8.5
7.7
0.7
9.9
9.7
2.0
Rente
dor
rent
free
27.6
22.6
7.3
11.6
23.9
4.9
10.4
24.7
2.6
8.2
22.0
1.6
Urb
an
/ru
ral
locati
on
Urb
an
are
as
21.5
9.8
3.1
6.8
9.5
1.4
5.0
9.9
0.7
7.3
12.1
2.1
Rura
lare
as
33.2
10.2
4.7
12.5
9.5
0.8
13.3
9.6
1.2
12.7
10.2
1.7
Ch
ron
icil
lness
or
healt
hp
rob
lem
Yes
28.5
11.9
5.0
9.4
13.6
1.4
8.1
14.4
1.2
9.1
14.9
2.2
No
25.7
8.0
2.7
9.8
5.3
0.9
9.5
3.9
0.6
10.5
6.6
1.6
Healt
hsta
tus
Very
good
18.7
5.9
3.3
10.4
3.6
0.8
7.7
2.9
0.3
11.6
9.4
0.6
Good
27.8
8.3
2.9
8.7
7.7
1.0
8.7
6.7
0.6
8.7
9.0
1.9
Fair
28.3
10.3
4.3
10.0
13.0
1.1
9.0
14.7
1.3
10.6
12.1
3.0
Bad/v
ery
bad
34.3
22.1
7.1
11.7
23.2
2.9
11.5
29.7
3.9
7.7
27.9
1.2
Pri
vate
med
ical
insu
ran
ce
Yes
15.1
3.2
0.7
5.5
4.2
0.1
3.5
3.0
0.1
6.2
5.5
0.1
No
33.2
13.4
5.5
12.5
13.2
1.9
12.7
14.9
1.6
12.5
15.8
3.4
1E
xperiencin
g2
or
more
ofth
e11
types
ofdeprivation.
*S
am
ple
occurr
ence
too
sm
all
for
estim
ation.
Fig
ure
sin
pare
nth
eses
[]in
dic
ate
perc
enta
ges
based
on
sm
all
num
bers
,and
are
,th
ere
fore
,subje
ctto
aw
ide
marg
inoferr
or.
2004
2009
2011
2010
18

19
A1 Sample size by demographic characteristics and year
2004 2009 2010 2011
All those aged over 65 and over 2,339 2,434 2,046 1,850
Sex
Male 1,084 1,104 940 852
Female 1,315 1,330 1,106 998
Age group
65-69 707 708 584 586
70-75 658 651 567 435
75-79 508 479 415 423
80+ 526 596 480 406
Principal Economic Status
At work 171 179 140 126
Unemployed 5 7 9 6
Student 1 5 4 3
Home duties 976 928 763 651
Retired 1,146 1,230 1,040 1,001
Not at work due to illness or disability 84 81 78 56
Highest education level attained
Primary or below 1,575 1,353 1,122 965
Lower secondary 303 371 310 280
Higher secondary 209 287 238 212
Post leaving cert 94 193 118 128
Third level non degree 79 116 108 116
Third level degree or above 125 108 129 132
Marital status
Married 1,135 1,310 1,094 982
Widowed/Divorced/Separated 852 806 697 637
Never married 412 318 255 231
Household composition
1 elderly person living alone 958 861 775 657
2 elderly people living together 850 970 796 718
Other household composition 591 603 475 475
Tenure status
Owner-occupied 2,175 2,196 1,828 1,636
Rented or rent free 224 238 218 214
Urban/rural location
Urban areas 1,287 1,330 1,082 995
Rural areas 1,112 1,104 964 855
Chronic illness or health problem
Yes 1,228 1,246 1,156 1,066
No 1,171 1,188 890 784
Health status
Very good 423 476 413 324
Good 994 1,067 893 853
Fair 758 715 607 544
Bad/very bad 224 176 133 129
Private medical insurance
Yes 799 1,013 856 809
No 1,600 1,421 1,190 1,041
Number of individuals aged 65 and over

Central Statistics Office Survey on Income and Living Conditions ( SILC)
Background NotesPurpose of
surveyThe primary focus of the Survey on Income and Living Conditions (SILC) is the collection ofinformation on the income and living conditions of different types of households in Ireland,in order to derive indicators on poverty, deprivation and social exclusion. It is a voluntary(for potential respondents) survey of private households. It is carried out under EUlegislation (Council Regulation No 1177/2003) and commenced in Ireland in June 2003.
Reference Period This report presents results for the elderly i.e. those aged 65 and over on the date of interview,based on data collected in the period January 2011 to January 2012 (2011), December 2009to December 2010 (2010), December 2008 to January 2010 (2009) and data collectedJanuary to December 2004 (2004). The income reference period of this report is twelvemonths prior to the date of interview.
Statisticalsignificance
All year to year changes in proportions quoted here are statistically significant unlessotherwise stated. SILC is a sample survey. As in all sample surveys, margins of statisticalerror exist. Thus, where there is a nominal change in the value of an item from one year to thenext, given the inherent margin of statistical error in reality there may be no change in thevalue of that indicator. Changes in proportions presented in this publication are only noted ifthey are statistically significant using a 95% confidence interval.
Definitions ofincome
Gross income: Income details are collected at both a household and individual level inSILC. In this analysis, each individual’s income is summed up to household level and in turnadded to household level income components to calculate gross household income. Thecomponents of gross household income are:
1. Earnings: This includes income from employment, self-employment and employer’ssocial insurance contributions.
2. Social Transfers: Benefits obtained from the state are included in this category e.g.Old age pension. Retirement lump sum values are also included here when applicable.
3. Occupational Pensions: Income from a pension scheme generated by a company ororganisation for the benefit of its employees is included here.
4. Private Pensions: Income received from private pension plans which is a pensionscheme fully organised and paid for by the respondent or a deceased spouse orrelative.
5. Investment Income: Income received from investments held.
6. Property Income: Income received from rental property or land.
7. Other income: Income not included elsewhere e.g. value of goods produced for ownconsumption.
Equivalencescales
Equivalence scales are used to calculate the equivalised household size in a household.Although there are numerous scales, we focus on the national scale in this report. Thenational scale attributes a weight of 1 to the first adult, 0.66 to each subsequent adult (aged14+ living in the household) and 0.33 to each child aged less than 14. The weights for eachhousehold are then summed to calculate the equivalised household size.
EquivalisedGross Income
Gross household income is divided by the equivalised household size to calculate equivalisedgross income for each person, which essentially is an approximate measure of how much ofthe income, can be attributed to each member of the household. This equivalised grossincome is then applied to each member of the household.
Indicators At-risk-of-poverty rate
This is the share of persons with an equivalised income below a given percentage (usually60%) of the national median income. The rate is calculated by ranking persons byequivalised income from smallest to largest and the median or middle value is extracted.Anyone with an equivalised income of less than 60% of the median is consideredat-risk-of-poverty at a 60% level.
21
Central Statistics Office Survey on Income and Living Conditions ( SILC)
Consistent poverty
The consistent poverty measure looks at those persons who are defined as being at risk ofpoverty and assesses the extent to which this group may be excluded and marginalised fromparticipating in activities which are considered the norm for other people in society. Theidentification of the marginalised or deprived is currently achieved on the basis of a set of
eleven basic deprivation indicators. These are the ability to afford:
1. Two pairs of strong shoes
2. A warm waterproof overcoat
3. Buy new not second-hand clothes
4. Eat meat with meat, chicken, fish (or vegetarian equivalent) every second day
5. Have a roast joint or its equivalent once a week
6. Had to go without heating during the last year through lack of money
7. Keep the home adequately warm
8. Buy presents for family or friends at least once a year
9. Replace any worn out furniture
10. Have family or friends for a drink or meal once a month
11. Have a morning, afternoon or evening out in the last fortnight for entertainment
An individual is defined as being in ‘consistent poverty’ if they are:
• Identified as being at risk of poverty and
• Living in a household deprived of two or more of the eleven basic deprivation items listedabove (note that it is enforced deprivation that is relevant in this context. For example, ahousehold may not have a roast once a week. The household is classified as deprived ofthis basic indicator only if the reason they did not have it was because they could not affordit).
For more information go tohttp://www.cso.ie/en/media/csoie/releasespublications/documents/silc/2011/silc_2011.pdf
22