Embed Size (px)
Citation preview

Survey Report on Overseas Business Operations by Japanese Manufacturing Companies
Results of the JBIC FY2014 Survey:
- Outlook for Japanese Foreign Direct Investment (26th Annual Survey)-
November 2014
Research Division, Policy and Strategy Office for Financial Operations
Japan Bank for International Cooperation

This report is made to serve as a reference for the research and discussions of the JBIC.
The views expressed in this report do not represent the official position of the JBIC.
Copying of this report without the consent of JBIC is strictly prohibited. JBIC shall not be
held liable for any damages that may occur from the use of this report.

Copyright © 2014 JBIC All Rights Reserved.
Table of Contents p.1
Survey Overview and Companies Surveyed
1. Survey Overview p. 2 16. p. 32
2. Trends of Overseas Affiliates p. 3 17. p. 33
3. Ratios of Overseas Production, Overseas Sales and Overseas Income p. 4 p. 34
p. 35
I. Summary and Key Findings 18. p. 36
1. Summary p. 5 19. p. 37
2. Key Findings p. 7 20. p. 38
21. p. 39
II. Performance Evaluations (FY2013 Performance)
1. Evaluations of Degrees of Satisfaction with Profits and Net Sales p. 9 V.
(by major country and region) 1. p. 41
2. Reasons for Satisfaction with Profitability (by major country and region) p. 10 2. p. 42
3. Reasons for Dissatisfaction with Profitability (by major country and region) p. 11 3. p. 43
4. Evaluations of Degrees of Satisfaction with Net Sales and Profits (by industry) p. 12 4. p. 44
5. p. 45
III.Business Prospects 6. p. 46
1. Attitudes toward Strengthening Businesses (domestic & overseas) p. 13
2. Attitudes toward Strengthening Businesses (domestic & overseas, by industry) p. 14 VI.
3. Cross Analysis of Overseas Business and Domestic Business Prospects p. 15 1. p. 47
4. Stance foward Overseas Production Outsourcing p. 16 2. p. 48
3. p. 50
IV.Promising Countries/Regions over the Medium Term 4. p. 51
1. Rankings of Promising Countries/Regions (Medium-term Prospects) p. 17 5. p. 52
2. Promising Countries/Regions: Changes in Percentage Shares (8 main countries) p. 18 6. p. 53
3. Existence of Real Business Plans (Top 10 countries/regions) p. 19
4. Rankings of Promising Countries/Regions (by industry, long-term prospects) p. 20 Appendices
5. Reasons for Countries as Promising and Issues (India) p. 21 Appendix 1 Changes and Details for Promising Countries/Regions for Overseas Business Operations p. 54
6. Reasons for Countries as Promising and Issues (Indonesia) p. 22 Appendix 2 Promising Countries/Regions for Overseas Business Operations p. 55
7. Reasons for Countries as Promising and Issues (China) p. 23 (details of reasons for countries being viewed as promising)
8. Reasons for Countries as Promising and Issues (Thailand) p. 24 Appendix 3 Promising Countries/Regions for Overseas Business Operations (details of issues) p. 56
9. Reasons for Countries as Promising and Issues (Vietnam) p. 25 Appendix 4 Medium-term Prospects for Business Operations (domestic/overseas, by industry) p. 57
10. Reasons for Countries as Promising and Issues (Mexico) p. 26 Appendix 5 Medium-term Prospects for Business Operations (by major country/region) p. 58
11. Reasons for Countries as Promising and Issues (Brazil) p. 27 Appendix 6 Overseas Production, Sales & Income Ratios (details by industry) p. 59
12. Reasons for Countries as Promising and Issues (USA) p. 28 Appendix 7 Evaluations of Degrees of Satisfaction with Net Sales and Profits (details) p. 60
13. Reasons for Countries as Promising and Issues (Russia) p. 29 Appendix 8 Existence of Real Business Plans in Promising Countries/Regions p. 61
14. Reasons for Countries as Promising and Issues (Myanmar) p. 30 Appendix 9 Domestic and Overseas Production Bases - Trends in the Division of Roles p. 62
15. Reasons for Not Listing Certain Countries in the Top 5 Most Promising Countries p. 31 Appendix 10 Research & Development Bases in Japan and Abroad - Trends in the Division of Roles p. 63
Appendix 11 Ranking of Promising Countries for Japanese Manufacturing Companies p. 64
in Infrastructure-related Business by Fields of Interest (Excluding the Top 10 Fields)
Medium-Term Approaches to Overseas Infrastructure-related Business
Collaboration with Other Companies in Overseas Infrastructure-related Business
Countries/Regions/Fields for Strengthening Businesses: (1) China, India &Vietnam
Promising Countries in Overseas Infrastructure-related Business in the Medium Term
Domestic and Overseas Production Bases - Trends in the Division of Roles
Research & Development Bases in Japan and Abroad - Trends in the Division of Roles
Current Situation of R&D Bases in Japan
Business Opportunities for Overseas Infrastructure-related Business
Fields of Interest in Overseas Infrastructure-related Business
Entry and Performance Evaluation
Competitiveness of Japanese Manufacturing Companies and Trends in Global Production Systems
Involvement of Japanese Manufacturing Companies in Overseas Infrastructure-re lated Business
Prospects for Overseas Operation by Region
Requirements for Living Conditions in Overseas Business Locations
Competition in the Global Market
Local Production and Delivery (Sales) within Asia - Current and Future
Prospect for Division of Labor in Production System in Asia
Approach to Production Scale of Companies Entering China’s Coastal Areas
Preferred Production Locations – China, or Other Countries/Regions
Recent International Affairs and Attitudes for Business Operations
Countries/Regions/Fields for Strengthening Businesses: (2) NIEs 3・ASEAN 5
Countries/Regions/Fields for Strengthening Businesses: (3) Americas, Europe, Middle East & Africa

Copyright © 2014 JBIC All Rights Reserved.
Survey Overview and Companies Surveyed
Copyright © 2014 JBIC All Rights Reserved.
1. Survey Overview p.2
Figure 1: No. of Respondent Companies by Industrial Classification
Figure 2:
No. of Respondent
Companies by Capital
Figure 3:
No. of Respondent
Companies by Net Sales
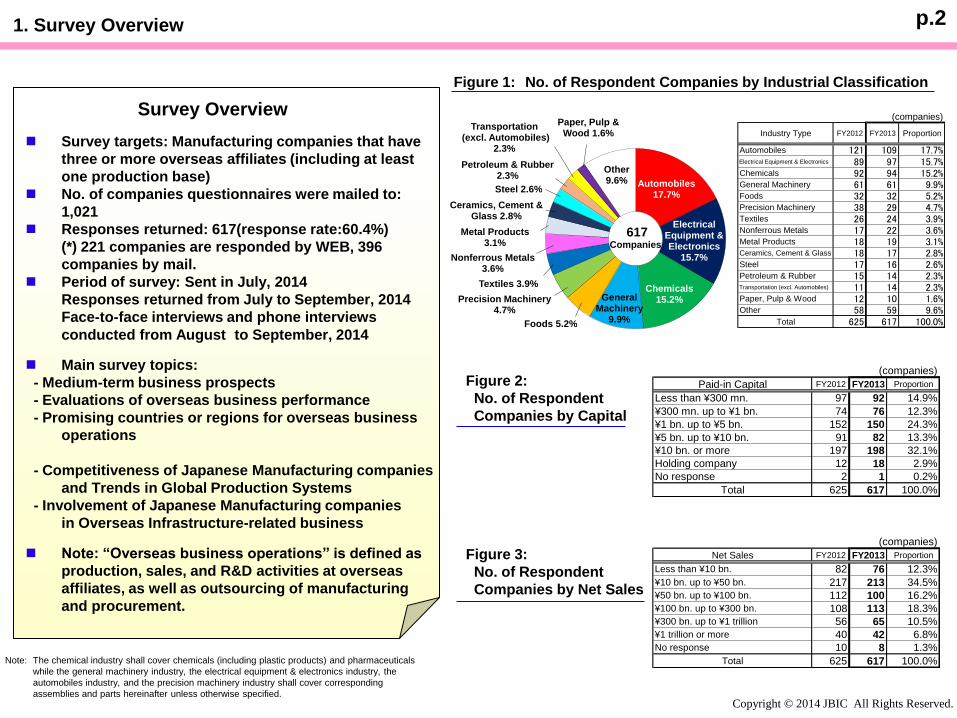
Survey Overview
Survey targets: Manufacturing companies that have
three or more overseas affiliates (including at least
one production base)
No. of companies questionnaires were mailed to:
1,021
Responses returned: 617(response rate:60.4%)
(*) 221 companies are responded by WEB, 396
companies by mail.
Period of survey: Sent in July, 2014
Responses returned from July to September, 2014
Face-to-face interviews and phone interviews
conducted from August to September, 2014
Main survey topics:
- Medium-term business prospects
- Evaluations of overseas business performance
- Promising countries or regions for overseas business
operations
- Competitiveness of Japanese Manufacturing companies
and Trends in Global Production Systems
- Involvement of Japanese Manufacturing companies
in Overseas Infrastructure-related business
Note: “Overseas business operations” is defined as
production, sales, and R&D activities at overseas
affiliates, as well as outsourcing of manufacturing
and procurement.
Note: The chemical industry shall cover chemicals (including plastic products) and pharmaceuticals
while the general machinery industry, the electrical equipment & electronics industry, the
automobiles industry, and the precision machinery industry shall cover corresponding
assemblies and parts hereinafter unless otherwise specified.
(companies)
Industry Type FY2012 FY2013 Proportion
Automobiles 121 109 17.7%Electrical Equipment & Electronics 89 97 15.7%Chemicals 92 94 15.2%General Machinery 61 61 9.9%Foods 32 32 5.2%Precision Machinery 38 29 4.7%Textiles 26 24 3.9%Nonferrous Metals 17 22 3.6%Metal Products 18 19 3.1%Ceramics, Cement & Glass 18 17 2.8%Steel 17 16 2.6%Petroleum & Rubber 15 14 2.3%Transportation (excl. Automobiles) 11 14 2.3%Paper, Pulp & Wood 12 10 1.6%Other 58 59 9.6%
Total 625 617 100.0%
Automobiles17.7%
Electrical Equipment & Electronics
15.7%
Chemicals15.2%General
Machinery 9.9%Foods 5.2%
Precision Machinery 4.7%
Textiles 3.9%
Nonferrous Metals3.6%
Metal Products3.1%
Ceramics, Cement & Glass 2.8%
Steel 2.6%
Petroleum & Rubber2.3%
Transportation(excl. Automobiles)
2.3%
Paper, Pulp & Wood 1.6%
Other9.6%
Companies
617
(companies)
Paid-in Capital FY2012 FY2013 Proportion
Less than ¥300 mn. 97 92 14.9%
¥300 mn. up to ¥1 bn. 74 76 12.3%
¥1 bn. up to ¥5 bn. 152 150 24.3%
¥5 bn. up to ¥10 bn. 91 82 13.3%
¥10 bn. or more 197 198 32.1%
Holding company 12 18 2.9%
No response 2 1 0.2%
Total 625 617 100.0%
(companies)
Net Sales FY2012 FY2013 Proportion
Less than ¥10 bn. 82 76 12.3%
¥10 bn. up to ¥50 bn. 217 213 34.5%
¥50 bn. up to ¥100 bn. 112 100 16.2%
¥100 bn. up to ¥300 bn. 108 113 18.3%
¥300 bn. up to ¥1 trillion 56 65 10.5%
¥1 trillion or more 40 42 6.8%
No response 10 8 1.3%
Total 625 617 100.0%

Copyright © 2014 JBIC All Rights Reserved.
2. Trends of Overseas Affiliates ※Aggregate calculation regarding respondent companies p.3
Figure 4: Increase/decrease in the Number of Overseas Affiliates(During FY2013) Figure 5: State of Holding of Overseas Affiliates
Note: The
percentage
written in the
table shows
the proportion
of respondent
companies.
-100
-50
0
50
100
150
(companies)
Increase
Decrease
Production
Other
Area administration
R&D
Sales
The number of overseas affiliates continues to increase • The number of overseas affiliates established by companies surveyed in FY2013 was 574 (Breakdown: Production: 215, sales: 245, R&D: 17, Area
administration: 16, others: 81); it continues to increase but was less than in FY2012 (720). The net increase, the increase less the decrease, was 371 (501 in the previous survey).
By region, there were large increases in China, ASEAN 5 and Europe • When analyzed by region, on an individual country basis, the increase in China was the largest (109 companies), but combined ASEAN 5 exceeded
China with an increase of 113 companies. Among the ASEAN 5, Indonesia’s increase (45 companies) was the largest in the ASEAN region. Also,
compared to the previous survey, the number of overseas affiliates in North America increased by just 58 (119 in the previous survey), whereas the
number in Europe increased by 93 (86 in the previous survey), reflecting a continued strong stance toward establishment in Europe.
The Classification of Areas in China
Northeastern China (Heilongjiang, Jilin, Liaoning)
Northern China (Beijing, Tientsin, Hebei, Shandong)
Eastern China (Shanghai, Jiangsu, Anhui, Zhejiang)
Southern China (Fujian, Guangdong, Hainan)
Inland China (Provinces other than those mentioned above and autonomous regions)
The Classification of Major Regions
NIEs3 (Korea, Taiwan, Hong Kong)
ASEAN5 (Singapore, Thailand, Indonesia, Malaysia, Philippines)
North America (United States, Canada)
EU15 (United Kingdom, Germany, France, Italy, Netherlands, Belgium, Greece,
Luxembourg, Denmark, Spain, Portugal, Austria, Finland, Sweden, Ireland)
Central & Eastern Europe (Poland, Hungary, Czech Republic, Slovak Republic, Bulgaria,
Romania, Slovenia, Albania, Croatia, Serbia, Montenegro,
Bosnia-Herzegovina, Former Yugoslav Republic of Macedonia)
① One or more overseas affiliates for production
Country/Area
No. of
respondents
(company)Proportion
1 China 508 82.3%
2 Thailand 297 48.1%
3 North America 250 40.5%
4 Indonesia 201 32.6%
5 EU 15 158 25.6%
6 Taiwan 147 23.8%
7 Vietnam 133 21.6%
8 India 130 21.1%
Malaysia 130 21.1%
10 Korea 129 20.9%
11 Mexico 95 15.4%
12 Philippines 83 13.5%
13 Brazil 72 11.7%
14 Singapore 63 10.2%
15 Central & Eastern Europe 52 8.4%
②One or more overseas affiliates for sales
Country/Area
No. of
respondents
(company)Proportion
1 China 347 56.2%
2 North America 293 47.5%
3 EU 15 250 40.5%
4 Hong Kong 187 30.3%
Thailand 187 30.3%
6 Singapore 185 30.0%
7 Taiwan 159 25.8%
8 Korea 155 25.1%
9 India 116 18.8%
10 Indonesia 108 17.5%
11 Malaysia 88 14.3%
12 Brazil 81 13.1%
13 Mexico 71 11.5%
14 Vietnam 64 10.4%
15 Philippines 52 8.4%

Copyright © 2014 JBIC All Rights Reserved.
3. Ratios of Overseas Production, Overseas Sales and Overseas Income p.4
※Refer to Appendix 6 regarding values of Figures 7 to 9.
Figure 7: Ratios of Overseas Production※1 by Major Industry
Figure 8: Ratios of Overseas Sales※2 by Major Industry
Figure 9: Ratios of Overseas Income ※3 by Major Industry
※1 (Overseas Production) / (Domestic Production + Overseas Production)
※2 (Overseas Sales) / (Domestic Sales + Overseas Sales)
※3 (Overseas Operating Income)/ (Domestic Operating Income + Overseas Operating Income)
※4 Ratios were calculated by simply averaging the values the respondent companies provided.
Figure 6: Ratios of Overseas Production※1 , Overseas Sales※2
and Overseas Income※3
No. of
respondent
companies
No. of
respondent
companies
No. of
respondent
companies
No. of
respondent
companies
Chemicals 25.0% 82 28.0% 80 29.3% 79 32.6% 72
General
Machinery25.2% 56 23.7% 52 24.4% 50 26.8% 45
Electrical Equipment &
Electronics43.3% 78 48.6% 84 49.5% 83 52.3% 79
Automobiles 39.4% 114 43.0% 102 44.8% 101 48.1% 96
All industries 32.9% 559 35.2% 547 36.5% 539 39.9% 508
FY2012 (Actual)FY2014
(Projected)FY2013 (Actual)
Medium-term
plans (FY2017)
No. of
respondent
companies
No. of
respondent
companies
No. of
respondent
companies
Chemicals 31.1% 90 35.7% 89 37.5% 88
General
Machinery39.9% 59 39.2% 57 40.9% 54
Electrical Equipment &
Electronics42.8% 86 48.1% 93 48.7% 91
Automobiles 38.8% 117 42.2% 107 44.2% 100
All industries 35.4% 601 37.5% 591 38.8% 571
FY2014
(Projected)FY2012 (Actual) FY2013 (Actual)
No. of
respondent
companies
No. of
respondent
companies
Chemicals 35.4% 74 36.9% 73
General
Machinery30.5% 47 29.0% 45
Electrical Equipment &
Electronics39.1% 71 41.8% 71
Automobiles 42.4% 101 46.0% 96
All industries 33.7% 517 35.5% 505
FY2013 (Actual)FY2014
(Projected)
Overseas production ratios based on FY2013 performance at record
high levels • The actual FY2013 overseas ratio was 35.2%, which exceeded the actual FY2012 ratio
(32.9%) by 2.3 percentage points and set a record high, surpassing the actual FY2010 ratio
(33.3%), the most recent peak. • FY2014 performance estimates project new record highs for both the overseas sales ratio
(38.8%) and overseas production ratio (36.5%). From 2013 into 2014, the yen continued to
gradually depreciate, but the growth trend in the overseas production ratio remains
unchanged (Figure 6).
Overseas production ratios for major industries are projected to
increase even further • The projection for the overseas production ratio in medium-term plans (FY2017) is 39.9%,
nearly reaching the 40% level. • When analyzed by major industry, overseas production is projected to expand even further,
in particular for electrical equipment & electronics (FY2013 performance → medium-term
plans: 3.7 percentage point increase), with projections exceeding 50% in medium-term
plans for the first time (Figure 7).
Overseas income ratios at levels that rival overseas sales ratios • The actual FY2013 overseas income ratio was 33.7%, a level rivaling the overseas sales
ratio (37.5%). When analyzed by major industry, in automobiles, the ratio exceeded the
overseas sales ratio, indicating the high profitability of overseas business (Figure 8 and
Figure 9).
27.9%
29.1%
33.5% 34.0%34.7%
34.2%
34.7%
34.2%
35.4%
37.5%
38.8%
24.6%
26.0% 26.1%
28.0%
29.2%30.5%
30.6%
30.8% 31.0%
33.3%
31.3%
32.9%
35.2% 36.5%
39.9%
33.7%
35.5%
20%
22%
24%
26%
28%
30%
32%
34%
36%
38%
40%
42%
44%
01 02 03 04 05 06 07 08 09 10 11 12 13 14 (FY)
Overseas Sales Ratios
Overseas Production Ratios
Overseas Income Ratios
Actual
Medium-term plans (FY2017)
FY2014Projected

Copyright © 2014 JBIC All Rights Reserved.
I. Summary and Key Findings

Copyright © 2014 JBIC All Rights Reserved.
I.1. Summary p.5
1. Japanese manufacturing companies’ stance of continuing expansion for overseas
business operation
Overseas production and sales ratios are reaching close to a 40% level respectively and the importance of
overseas business is increasing. About 80% of companies that responded continue to have a stance of
strengthening/expansion for overseas business and about 90% of them also have a stance of maintenance or
expansion in their domestic businesses. Out of the total companies that responded, just less than 30% have a
stance of strengthening/expansion and about 60% are maintaining the present level of domestic businesses.
(→ Chapters III)
2. Voting ratios of India, Indonesia and China balance out in promising countries
over medium term
In the survey of the most promising countries over the medium term, as of the last survey, the ranking
continued to fluctuate, and for the first time since this survey began, India with high expectation for its
market expansion ranked 1st place. Indonesia that ranked 1st place in last year’s survey fell to 2nd place and
China that ranked 4th last year advanced to 3rd place. The top three countries competed for the voting ratios at
approximately 45%. Contrarily, Thailand has fallen to 4th place with much fewer votes this year from last
year’s 3rd place. (→ Chapter IV) Upon the research of the reason for not voting this year for last year’s top five countries (India, Indonesia,
China, Thailand and Vietnam) as the most promising countries over the medium term, many companies
responded that they did not vote for them since they already have a certain scale of businesses in China and
Thailand. (→ Chapter IV) With regard to the recent political and social conditions of countries and regions, they tend to be widely
concerned by the countries and regions that have close economic relations with them, not limited to the
countries and regions where it has occurred. (→ Chapter IV)

Copyright © 2014 JBIC All Rights Reserved.
I.1. Summary p.6
3. In sales power evaluation of competitors, Chinese and Korean companies are
declining. While the local production and delivery in Asian countries and within
the region are expanding, the prospect for the division of labor in production
within the region differs by industry.
With regard to the assessment by Japanese companies of the sales power of their competitors, European and
North American companies were rated more highly than in the FY2012 survey, but the assessment of Chinese
and Korean companies has been decreasing, which suggests that Japanese companies are regaining their
confidence. In Asian countries and within the Asian region, the local production and delivery are expected to
increase centering China and ASEAN countries. Also, the division of labor in production within the Asian
region is expected to expand, but the responses were different depending on industry. (→ Chapters V)
4. While strengthening of functions at overseas bases by Japanese companies
progresses gradually, Japanese domestic bases continue to play important roles
in both production and R&D.
For roles that are required for production bases, while the stance is toward strengthening the functions of
overseas bases, there were many views that domestic bases will continue to play a important role in terms of
innovation and human resource development. With regard to research and development(R&D), Japanese
domestic bases have been shown to continue to play a central role in all stages of basic, application and
development. (→ Chapters V)

Copyright © 2014 JBIC All Rights Reserved.
I.2. Key Findings (Annual Questions) p.7
Japanese manufacturing companies’ overseas business operations tending toward strengthening/expansion over the medium term • The increase in overseas affiliates (574 companies) was less than in the previous survey (720 companies), but the number continues to increase. (→ Page 3) Overseas production ratios
(FY2013 actual: 35.2%) are projected to continue to increase, and when analyzed by industry, the overseas production ratio for electrical equipment & electronics is projected to exceed
50% for the first time (FY2017 medium-term plans: 52.3%). (→ Page 4) Also, for the fifth consecutive year since the collapse of Lehman Brothers, over 80% of respondent companies
(80.9%) expressed a stance of medium-term overseas business strengthening/expansion, which indicates a continued strong overseas-oriented stance. (→ Page 13)
Approximately 90% of companies strengthening/expanding overseas businesses have stance of maintaining/strengthening/expanding
domestic businesses • The stance of strengthening/expanding domestic businesses was nearly even with the previous survey (28.0%→27.6%), and 60% of respondent companies have a stance of maintaining
current levels. (→ Page 13). When analyzing by industry, there was an increase in the contractive stance of the automobile industry (19.0%→20.4%). (→ Page 14) However, this does
not necessarily mean that strengthening/expansion of overseas businesses is connected to contraction of domestic businesses; nearly 90% (88.8%) of companies
strengthening/expanding overseas businesses over the medium term (484 companies) have a stance of maintaining or strengthening/expanding domestic businesses. (→ Page 15)
The evaluation of overseas business operations shows improvement from the previous survey in degrees of satisfaction with sales and
profits • When analyzing by degree of satisfaction with profits, results for Thailand (2.87→2.62) and Indonesia (2.73→2.55) both fell, suggesting the impact of perceived deceleration in both
countries’ economies. The results for China (2.25→2.50) and EU 15 (2.36→2.79) improved, so the total of all regions exceeded the previous survey (2.56→2.65). (→ Pages 9 – 12)
In promising countries and regions for business operations over the medium term, India ranked 1st for the first time since this survey
began. Indonesia was 2nd, and China rose from 4th place in the previous survey to 3rd. The voting ratio for the top three countries
balances out. • India took 1st place in the ranking of promising countries for the first time since this survey began. Indonesia was second and China rose from 4th to 3rd, but the number of companies
voting for Thailand dropped substantially, and it fell to 4th place. The voting ratio for the top three countries of India, Indonesia and China was around 45% and balanced out. (→ Pages
17 and 18)
Top reason given for not citing the top five countries among promising countries over the medium term was “already conducting business
of a certain scale ” • In a survey of the reasons that the top five countries in the previous survey’s ranking of promising countries over the medium term (India, Indonesia, China, Thailand and Vietnam) were
not cited as promising countries over the medium term in this survey, the top reason was that in Indonesia, China and Thailand “already conducting business of a certain scale”;
approximately half of respondent companies responded for China (51.6%) and Thailand (49.8%). Also, with regard to China and Thailand, increasing labor costs and insecurity in the
political/social situation were also among the top reasons. For India and Vietnam, “do not consider it a target region for our company’s business” was the top reason, at over 40% for both,
but the inadequacy of local infrastructure was also among the top reasons. (→ Page 31)
Even with personnel and other costs increasing, the positioning of China as a production base is high, and among the reasons for
maintaining/expanding production scale in coastal areas, the presence of customers and markets is rated most highly. • Approximately 90% of the 462 respondent companies rated China highly as a production base, and with regard to production scale in coastal areas, where personnel and other costs are
rising, almost half of the respondent companies selected maintain/expand. (→ Page 36)
Recent political and social conditions of countries and regions tend to be widely concerned by the countries and regions that have close
economic relations with them, not limited to the countries and regions where it has occurred. • The political/diplomatic relations in China and ASEAN countries and the trends in ASEAN economic integration is broadly recognized in the NIEs 3, China and ASEAN countries,
economic sanctions against Russia, in all of Europe, and tapering of quantitative easing (QE) in the USA , in Asia, Europe and Central and South America; even with situations not
occurring in countries and regions where business is being conducted or planned, there is widespread recognition centering on countries and regions with strong economic relationships
with those countries and regions. (→ Page 38)

Copyright © 2014 JBIC All Rights Reserved.
I.2. Key Findings (Individual Themes) p.8
Regarding the sales power of competitor companies, European and American companies are rated highly, while the assessment of
Chinese and Korean companies is on the decline • With regard to the assessment of the sales power of competitor companies in each sales markets, European and American companies were rated more highly than in the FY2012
survey, but the assessment of Chinese and Korean companies is on the decline, the survey indicated. When analyzing competitor companies with higher-level sales power than one’s
own company by sales market, European and American companies were cited in the markets of India, North America, EU 15 and Brazil, Japanese companies were cited in the ASEAN
5 market, and Chinese companies were cited in the Chinese market. (→ Page 41)
Within Asian countries/regions, local production and delivery(sales) are expected to expand, centering on China and the ASEAN region.
Regarding the division of labor in production within Asia, there were differences in responses depending on the industry. • Basically, the business structure is local production and delivery(sales) in each country and region, and it is projected that there will be no change in this trend over the medium term
and that local production and delivery(sales) will expand centering on China and the ASEAN region, but with regard to production in Japan, the survey indicated a projected increase in
overseas delivery(sales) to Europe, North America, China, the ASEAN region, etc. (→ Page 42) Regarding the division of labor in production within Asia, overall the division is
projected to make progress centering on China and the ASEAN region, but there were differences in responses depending on the industry. (→ Page 43)
Japanese domestic bases will primarily fulfill innovation and human resources development functions on the production side and
continue playing an important role in every stage of R&D. • Regarding the division of roles at overseas and domestic production bases, approximately 60% of respondent companies selected Japanese domestic bases as bases for innovation
and human resources development. With respect to the role of overseas production bases, the survey indicated a relatively high positioning for core component production and
response to variety of demand over the long term. (→ Page 44)
• In terms of research and development(R&D), the percentage that responded Japan for all stages (basic research, applied research, development research) exceeded 70%. (→ Page
45)
Companies considering overseas infrastructure-related business as a business opportunity was 28% overall, somewhat lower than in
FY2011 (35.6%) • Among the 574 respondent companies, 13.4% (77 companies) indicated “We consider it a business opportunity,” and 14.6% (84 companies), “We more or less think it is a business
opportunity,” so combined, 28% (161 companies) consider overseas infrastructure-related business to be a business opportunity. The same question was asked in FY2011 as well, and
at that time 35.6% (192 out of 539 companies) considered it a business opportunity, so there has been a decline of 7.6 percentage points (31 companies). (→ Page 47)
Fields attracting the most interest were, in order, photovoltaic power generation, urban railways, etc., and high-speed railways. A majority
of companies already entered assessed their performance in infrastructure-related business overseas as “according to plan.” • The field attracting the most interest in the overseas infrastructure-related business was photovoltaic power generation, the same as the previous time the question was asked (FY2011),
but the number of respondent companies was half. Second was urban railways, etc., and third was high-speed railways. (→ Page 48)
• Over 50% of companies already entered responded “according to plan” with respect to their business performance thus far. Less than 10% of companies responded “better than
planned.” 40% responded “worse than planned.” (→ Page 50)
Approaches to the overseas infrastructure-related business primarily include supply of parts/component materials and supply of
equipment/facilities. There is a trend toward collaboration between Japanese companies, European/American companies and companies
in emerging countries to acquire customers and sales channels, improve cost competitiveness, etc. • As in FY2011, the percentage of companies citing “supply of parts/component materials” and “supply of equipment/facilities” was relatively high in nearly all fields. (→ Page 52)
• Among companies with an interest in the overseas infrastructure-related business, 27.0% are already collaborating with other companies and 10.8% are currently considering doing so.
Companies that cited Japanese companies as partner companies outnumbered those that cited companies in emerging countries or European/American companies. As to objectives
for collaboration, the most commonly cited reason regardless of partner company was “to acquire customer and sales channels.” (→ Page 53)

Copyright © 2014 JBIC All Rights Reserved.
II. Performance Evaluations (FY2013 Performance)

Copyright © 2014 JBIC All Rights Reserved.
p.9 II. 1. Evaluations of Degrees of Satisfaction with Profits and Net Sales (by major country and region)
Which of the following applies concerning your company’s FY2013 net sales and profits
compared with initial targets in the countries/regions overseas you invested in?
⇒ 1: Unsatisfactory 2: Somewhat unsatisfactory
3: Can’t say either way 4: Somewhat satisfactory 5: Satisfactory
Q
Figure 10: Satisfaction with Net Sales/Profits (all-industry averages)
Figure 11: Satisfaction with Profits (By region)
(Note 1) (2) Inter-America: Individual aggregation of Mexico and Brazil have been separated from Latin America
since FY2012 results.
(3) Europe/Russia: Aggregation for Turkey has been added since FY2012 results.
(Note 2) See Appendix 7 for more detailed data collated by country/region.
(Note 1) These figures are simple averages of assessments by country and region.
(Note 2) Numbers in parentheses indicate the increase/decrease over the previous year’s assessments.
(1) Asian Countries (2) Inter-America (3) Europe/Russia
Satisfactory
Unsatisfactory
Figure 12: Countries/Regions More Profitable than Japan
(Descending order by ratio)
(Note) When companies were asked about their profitability in FY2013 in countries/regions in
which they had businesses, they were asked to respond regarding the country/region
which had higher rates of profitability than Japan. “Total responses (2)” is the sum of the
number of companies that responded to inquiries about satisfaction with profits and those
that responded to the comparison of profitability with Japan.
(FY of performance) FY2011 FY2012 FY2013
Net Sales 2.64 (▲0.21) 2.63 (▲0.01) 2.71 (+0.08)
Profits 2.54 (▲0.21) 2.56 (+0.02) 2.65 (+0.09)
1.80
2.00
2.20
2.40
2.60
2.80
3.00
3.20
2009 2010 2011 2012 2013
Total
Indonesia
Thailand
China
India
(FY of performance)
(Average score)
1.80
2.00
2.20
2.40
2.60
2.80
3.00
3.20
2009 2010 2011 2012 2013
Total
Latin America
Mexico
Brazil
North America
1.80
2.00
2.20
2.40
2.60
2.80
3.00
3.20
2009 2010 2011 2012 2013
Total
Russia
Central & Eastern Europe
EU 15
Turkey
(Companies)
"More Profitable than
Japan" responses (1)
Responses per
region/countries (2)
Ratio:
[(1)/(2)]
1. Thailand 120 366 32.8%
2. China 124 513 24.2%
3. North America 89 386 23.1%
4. NIEs3 59 265 22.3%
5. Indonesia 54 257 21.0%
Country/Region
Slight increase in evaluation of degrees of satisfaction
with net sales and profits ・Degrees of satisfaction in FY2013 performance (overseas business)
were 2.71 for net sales (+0.08 on the previous year) and 2.65 for
profits (+0.09), as both figures increased slightly compared to the
previous year (Figure 10).
Lower satisfaction for Thailand and Indonesia,
recovering for China ・There was little change in overall degrees of satisfaction, but when
analyzed by region, satisfaction evaluations fall into two categories.
First, in Asia, satisfaction in Indonesia and Thailand was lower, also
falling below the overall average. On the other hand, the evaluation
for China, which had been declining since FY2010, reversed course
and rose. (Figure 11 (1)). In Thailand, deterioration in the
political/social situation is one factor, but over 30% of respondent
companies indicated that profit ratios were higher than Japan, and
there has been no change in the fact that Thailand occupies an
important position among overseas bases (Figure 12).
・Satisfaction in India fell further from the previous year, though only
slightly, and it replaced China as the country with the lowest degree
of satisfaction.
Higher satisfaction in North America, sharp recovery in
EU 15 and Central & Eastern Europe ・Degree of satisfaction in North America rose and was ranked first
overall in net sales and second overall in profits. In EU 15 and
Central & Eastern Europe, where economies have been slow to
recover since the collapse of Lehman Brothers, the brakes have
finally been put on market contraction, and satisfaction recovered
sharply to a level exceeding the overall average (Figure 11 (2), (3)).

Copyright © 2014 JBIC All Rights Reserved.
0%
20%
40%
60%
80%
100%
2009
(150)
2010
(141)
2011
(71)
2012
(54)
2013
(100)
0%
20%
40%
60%
80%
100%
2009
(20)
2010
(25)
2011
(15)
2012
(16)
2013
(14)
0%
20%
40%
60%
80%
100%
2009
(51)
2010
(83)
2011
(64)
2012
(86)
2013
(106)
0%
20%
40%
60%
80%
100%
2009
(35)
2010
(49)
2011
(40)
2012
(24)
2013
(56)
Figure 13: Reasons for Satisfaction with Profitability over Time (Multiple responses)
p.10 II. 2. Reasons for Satisfaction with Profitability (by major country and region)
(Note) Companies who responded with “4. Somewhat satisfactory” and/or “5 Satisfactory” regarding profitability were asked for the reasons on a region/country basis. The percentages
represent the ratios of each choice to the total number of responses (shown in parentheses under the fiscal year of performance) for reasons given for the relevant region/country.
Multiple choices were possible.
1. Good performance of sales in the country/region
2. Good performance of exports in the country/region
3. Successful cost cuts (personnel, materials, etc.)
4. Cost cuts via consolidation of manufacturing
5. Manufacturing facilities brought fully on line
6. Foreign exchange gains (including effects of
Yen rates in consolidated accounting)
▲
ASEAN 5 China India North America EU 15
0%
20%
40%
60%
80%
100%
2009
(248)
2010
(289)
2011
(170)
2012
(212)
2013
(196)
(FY of Performance)
(Companies)
Effects of yen depreciation, in North America and EU 15 especially, contributing to higher profit
satisfaction ・Among the reasons given for profit satisfaction, the most common response in all the regions was “1. Good
performance of sales in the country/region,” but compared to the previous survey (FY2012 performance), “6. Foreign
exchange gains” (including effects of yen conversion at consolidated settlement) rose as a reason for profit satisfaction,
which is a characteristic of this year (FY2013 performance). The trend was particularly noteworthy for the EU 15
(29.2%→37.5%, 8.3 percentage point increase) and North America (19.8%→25.5%, 5.7 percentage point increase).
ASEAN 5 evaluation reflects regional economic slowdown in regional economy
・The most common reason cited for satisfaction with profits was “1. Good performance of sales in the country/region,”
but the ratio for this response was lower for ASEAN 5 and China compared to the previous survey. It can be surmised
that this reflects perceived slowing in the economies of both regions. For India, the ratio for “1. Good performance of
sales in the country/region” rose, but it should be noted that few companies originally responded that they were
satisfied with profits in India.

0%
20%
40%
60%
80%
100%
2009
(222)
2010
(194)
2011
(249)
2012
(304)
2013
(252)
0%
20%
40%
60%
80%
100%
2009
(72)
2010
(70)
2011
(93)
2012
(104)
2013
(106)
0%
20%
40%
60%
80%
100%
2009
(237)
2010
(148)
2011
(163)
2012
(140)
2013
(129)
0%
20%
40%
60%
80%
100%
2009
(176)
2010
(126)
2011
(131)
2012
(142)
2013
(98)
0%
20%
40%
60%
80%
100%
2009
(436)
2010
(329)
2011
(447)
2012
(418)
2013
(460)
(FY of Performance)
(Companies)
Copyright © 2014 JBIC All Rights Reserved.
Figure 14: Reasons for Dissatisfaction with Profitability over Time (Multiple responses)
p.11 II. 3. Reasons for Dissatisfaction with Profitability (by major country and region)
1. Difficulty in cutting costs (personnel, materials, etc.)
2. Not brought fully on line right after establishment
3. Demand for discounts from customers
4. Difficulty in getting customers (intense competition)
5. Shrinking market due to economic fluctuations
6. Decreased competitiveness of products due to
a strong Yen
7. Foreign exchange losses (including effects of
Yen rates in consolidated accounting)
◆
(Note) Companies who responded with “1. Unsatisfactory” and/or “2. Somewhat unsatisfactory” regarding profitability were asked for the reasons on a region/country basis.
The percentages represent the ratios of each choice to the total number of responses (shown in parentheses under the fiscal year of performance) for reasons given for
the relevant region/country. Multiple choices were possible.
India China North America EU 15 ASEAN 5
Further decline for all countries/regions in response ratio for “6. Decreased
competitiveness of products due to a strong yen” ・The main reasons for dissatisfaction with profits were “4. Difficulty in getting customers (intense competition),”
and in addition to that, in China in particular, the response ratio for “1. Difficulty in cutting costs (personnel,
materials, etc.)” rose (increase of 11.0 percentage points). ・Regarding “6. Decreased competitiveness of products due to a strong yen,” for some companies it was a factor
for lower profit satisfaction in FY2013 as the impact of the strong yen remained through the first half of FY2013,
but overall there was a major decline in companies citing this as a reason for dissatisfaction, and the response
ratio also dropped significantly to less than 10%.
In ASEAN 5, slight increase in response ratio for “5. Shrinking market due to economic fluctuations”
・For North America and EU 15, the response ratio for “5. Shrinking market due to economic fluctuations”
decreased, and there are signs of recovery in the local market. However, for ASEAN 5, the response ratio for
the same item rose from 11.5% to 18.3% (increase of 6.8 percentage points), and it moved up to third in
reasons for dissatisfaction. ・India is characterized by the high response ratio for “2. Not brought fully on line right after establishment”
compared to other regions. This item rose from 16.3% to 34.9% in this survey, placing it second among the
reasons for dissatisfaction with profits.

1.50
2.00
2.50
3.00
3.50
4.00FY2011 performance
FY2012 performance
FY2013 performance
1.50
2.00
2.50
3.00
3.50
4.00
FY2011 performance
FY2012 performance
FY2013 performance
1.50
2.00
2.50
3.00
3.50
4.00
FY2011 performance
FY2012 performance
FY2013 performance
Copyright © 2014 JBIC All Rights Reserved.
p.12 II. 4. Evaluations of Degrees of Satisfaction with Net Sales and Profits (by industry)
Figure 15: Evaluating Satisfaction of Net Sales & Profits (FY2013
performance)
Figure 16: Satisfaction with Profits by Country/Region (three key industries)
(Note) The industries in the table above are ordered according to average values for
Profits from highest to lowest.
(Note) In Figure 16, Mexico and Brazil have been separated from Latin America since
FY2012 performance. Turkey has been added since FY2012 performance.
(3) Automobiles
(2) Chemicals
(1) Electrical Equipment & Electronics
Satisfactory
Unsatisfactory
Satisfactory
Unsatisfactory
Satisfactory
Unsatisfactory
As with the previous year (FY2012 performance), the top two industries were steel and chemicals
• The rankings for degree of satisfaction with profitability by industry were the same as the
previous survey; steel was first (2.89) and chemicals second (2.81) (Figure 15). Steel
exceeded the average for profit satisfaction (2.65) in regions other than the Philippines,
Vietnam and Brazil, and in NIEs 3, China and Thailand, the evaluation was 3.00 or higher.
In chemicals too, there were high ratings for profit satisfaction of over 3.00 in Central &
Eastern Europe and some other countries/regions.
In three key industries, satisfaction up for North America and down
for Indonesia • Figure 16 shows profit satisfaction in the three industries with large numbers of
respondent companies by country/region. The evaluation for North America was higher
than the previous survey (FY2012 performance) in all three industries, but for Indonesia it
was lower. Also, profit satisfaction remains low in India and Brazil. • With regard to China, satisfaction recovered substantially in automobiles after the impact
of boycotts of Japanese products in the previous survey (Figure 16 (3)).
Net sales Profits Net sales Profits
1. Steel 2.77 2.89 +0.06 +0.04 15 NIEs3(3.57)
2. Chemicals 2.93 2.81 +0.13 +0.07 87 Central & Eastern Europe(3.50)
3. Petroleum & Rubber 2.68 2.71 +0.01 +0.05 14 Turkey(3.50)
4. Precision Machinery 2.62 2.70 +0.16 +0.34 28 Russia(3.18)
5. Automobile 2.81 2.68 +0.06 +0.17 103 Philippines(3.38)
6.Electrical Equipment &
Electronics2.70 2.64 +0.15 +0.06 87 North America(3.00)
7. Foods 2.76 2.62 +0.03 ▲0.09 26 EU15(3.33)
8. General machinery 2.59 2.61 +0.02 +0.01 58 North America(3.03)
9. Nonferrous Metals 2.67 2.58 +0.18 +0.07 22 Brazil(3.25)
10. Metal Products 2.86 2.56 +0.23 +0.03 18 NIEs3, Mexico, Russia(3.00)
11.Transportation
(excl. Automobiles)2.65 2.55 ▲0.09 ▲0.16 13 EU15(3.25)
12. Paper, Pulp & Wood 2.55 2.53 +0.01 +0.10 8 Brazil(4.00)
13. Textiles 2.61 2.52 ▲0.15 ▲0.03 24 Malaysia(3.33)
14. Other 2.54 2.52 +0.06 +0.09 52 NIEs3(3.11)
15.Ceramics, Cements &
Glasses2.22 2.17 ▲0.10 +0.01 17 Singapore(2.60)
Average by industryComparison with
last FYNo. of
respondent
companies
Countries/regions with
highest average in profits

Copyright © 2014 JBIC All Rights Reserved.
III. Business Prospects

31.2%25.9% 25.7% 28.0% 27.6%
58.1%62.0%
56.5%58.9% 60.4%
6.6% 6.2%
9.5%
8.2% 7.3%
4.1% 5.8% 8.3% 4.9% 4.6%
0%
10%
20%
30%
40%
50%
60%
70%
80%
90%
100%
2010 2011 2012 2013 2014
Undecided
Scale back
Maintain present level
Strengthen/expand
(589) (582) (588) (610) (604)
(FY)
Copyright © 2014 JBIC All Rights Reserved.
p.13 III. 1. Attitudes toward Strengthening Businesses (domestic & overseas)
Question concerning medium-term (next 3 yrs. or so) overall prospects for overseas and domestic operations. Q.
Figure 17: Medium-term Prospects (next 3 yrs. or so)
for Overseas Operations
Figure 18: Medium-term Prospects (next 3 yrs. or so)
for Domestic Operations Overseas Domestic
Total responding companies (Supplementary Info)
Mid-tier firms/SMEs
(Supplementary Info)
Mid-tier firms/SMEs Total responding companies
Note 1: “Overseas operations” is
defined as production, sales and
R&D activities at overseas bases,
as well as the outsourcing of
manufacturing and procurement
overseas.
Note 2: The numbers in the
parentheses above the bar
graphs indicate the numbers of
responding companies to the
question.
Note 3: Mid-tier firms/SMEs are
companies whose paid-in capital
is less than 1 billion Japanese
Yen.
82.8%87.2% 84.4% 82.5% 80.9%
16.5%12.6%
14.8% 16.1% 18.4%
0.7% 0.2% 0.9% 1.5% 0.7%
0%
10%
20%
30%
40%
50%
60%
70%
80%
90%
100%
2010 2011 2012 2013 2014
Scale back/withdraw
Maintain present level
Strengthen/expand(FY)
(594) (586) (588) (610) (602)
31.6%22.8% 25.0% 29.2%
23.5%
58.7%
61.1% 57.2%57.1% 65.1%
5.2%9.3% 9.2%
8.9% 7.8%
4.5% 6.8% 8.6% 4.8% 3.6%
0%
10%
20%
30%
40%
50%
60%
70%
80%
90%
100%
2010 2011 2012 2013 2014
検討中
縮小する
現状程度を維持する
強化・拡大する
(155) (162) (152) (168) (166)
(FY)
The stance of strengthening/expanding overseas business continues at a high level • In this survey, the number of companies that responded “strengthen/expand” the overseas business over the medium term was 487 (response ratio of 80.9%). The
response ratio continued to decline slightly from the previous survey (decrease of 1.6 percentage points), but it remains at a high level of over 80%, indicating a
stance of strengthening/expanding overseas business. The response ratio of “scale back/withdraw” declined from 1.5% in the previous survey to 0.7%; and mid-tier
firms/SMEs gave no response (Figure 17).
For domestic business, 60% of respondent companies to maintain present level • Regarding prospects for the domestic business, 27.6% of respondent companies selected “strengthen/expand” (down 0.4 percentage points from the previous
survey), which is equivalent to the previous survey, but the ratio of “scale back” dropped to 7.3%. As for mid-tier firms/SMEs, 23.5% of respondent companies
selected “strengthen/expand” (down 5.7 percentage points from the previous survey), but the ratio of “scale back” declined to 7.8% (down 1.1 percentage points
compared to the previous survey), so the stance toward scaling back of domestic business operations over the medium term has weakened (Figure 18).
71.2%78.5%
72.5% 74.0% 74.7%
28.2%21.5%
26.1% 23.7% 25.3%
0.6% 0.0% 1.3% 2.4% 0.0%
0%
10%
20%
30%
40%
50%
60%
70%
80%
90%
100%
2010 2011 2012 2013 2014
縮小・撤退する
現状程度を維持する
強化・拡大する
(156) (163) (153) (169) (166)
(FY)

28.0% 27.6%
58.1%51.7%
26.9% 29.2%24.2% 26.4%
39.3%
21.7%
33.7% 30.9%
8.6% 9.3%
50.0% 48.3%
58.9% 60.4%
38.7%44.8%
65.4% 62.5%64.8% 61.5%
54.1%
66.7%53.5% 62.8%
69.0% 64.8%
39.5% 44.8%
0%
10%
20%
30%
40%
50%
60%
70%
80%
90%
100%
13 14 13 14 13 14 13 14 13 14 13 14 13 14 13 14
Undecided
Scale back
Maintain present level
Strengthen/expand
(610)(604) (31) (29) (26)(24) (91) (91) (61) (60) (86)(94) (116)(108) (38) (29)
(FY)
All industries
Foods Textiles Chemicals General Machinery
Electrical Equipment & Electronics
Automobiles Precision Machinery
82.5% 80.9%90.6% 93.5%
84.6%75.0%
85.4% 82.8% 86.9%81.0%
69.8%78.7%
87.0% 83.8%78.9% 82.8%
0%
10%
20%
30%
40%
50%
60%
70%
80%
90%
100%
13 14 13 14 13 14 13 14 13 14 13 14 13 14 13 14
Scale back/withdraw
Maintain present level
Strengthen/expand
(610)(602) (32) (31) (26)(24) (89) (93) (61) (58) (86)(94) (115)(105) (38) (29)
(FY)
All industries
Foods Textiles Chemicals General Machinery
Electrical Equipment & Electronics
Automobiles Precision Machinery
Copyright © 2014 JBIC All Rights Reserved.
p.14 III. 2. Attitudes toward Strengthening Businesses (domestic & overseas, by industry)
※See Appendix 4 regarding data by industry of Figure 19 and 20.
Domestic
Overseas
Figure 19:
Medium-term Prospects
for Overseas Operations
Figure 20:
Medium-term Prospects
for Domestic Operations
Note1: “Overseas operations” is defined as
production, sales and R&D activities at
overseas bases, as well as the
outsourcing of manufacturing and
procurement overseas.
Note 2: Numbers in parentheses above the
bar graph indicate the number of
companies that answered the question.
Heightened differences between
industries on strengthen/expand
stance toward overseas business • The stance of strengthening/expanding
overseas business continues to be at a
high level, but the stance of maintaining
the present level gained strength, with
the exception of foods, electrical
equipment & electronics and precision
machinery. • The food industry is the typical domestic
demand based industry, and the stance
of strengthening overseas business was
even higher than in the previous survey.
Regarding prospects for the
domestic business, stance of
maintain present level is stronger
in a broad range of industries,
but the scale back stance is
significant in automobiles • Analyzing prospects for the domestic
business by industry, the stance toward
maintaining present levels gained
strength in foods (44.8%), general
machinery (66.7%), electrical equipment
& electronics (62.8%) and precision
machinery (44.8%). • The scale back stance for domestic
business prospects weakened across
industries from the previous survey, but
in automobiles, where ripple effects to
other industries are significant, the
percentage was high at 20.4% (19.0%
in the previous survey), exceeding the
strengthen/expand stance (9.3%). Of
the 108 respondent companies, 101
were parts manufacturers.

No. of
respondent
companies
Proportion
Strengthen/expand 146 30.2%Strengthen/expand Maintain present level 280 57.9%
484 Scale back 41 8.5%
(484 companies) Undecided 17 3.5%
Strengthen/expand 20 18.2%Maintain present level Maintain present level 80 72.7%
110 Scale back 3 2.7%
(110 companies) Undecided 7 6.4%
Strengthen/expand 1 25.0%Scale back/withdraw Maintain present level 2 50.0%
4 Scale back 0 0.0%
(4 companies) Undecided 1 25.0%
Medium-term Prospects (next 3 yrs. or so)
Overseas business Domestic business
Copyright © 2014 JBIC All Rights Reserved.
88.0%
(Reference)Transition of the number of companies which will maintain
or expand domestic business while expanding overseas business
III. 3. Cross Analysis of Overseas Businesses and Domestic Business Prospects
Figure 21: Cross Analysis of Prospects for Overseas and
Domestic Businesses (n=598 companies)
Figure 22: Profile of Companies
(41 companies) Which
Selected to Expand
Overseas Businesses
and Scale Back
Domestic Business
p.15
Survey Year FY2012 FY2013 FY2014
Ratio(%) 81.8 86.4 88.0number of companies 401 432 426
Nearly 90% of companies strengthening/expanding the overseas business over the medium term (484 companies) expect to maintain or strengthen/expand
the domestic business • Almost 90% (88.0%, 426 companies) of companies indicating that they will “strength/expand” their overseas business over the medium term (484 companies) responded that they will
maintain or expand their domestic business. Compared to the previous survey, the number of companies responding “strengthen overseas business, maintain or expand domestic business”
decreased from 432 companies to 426 companies, but the percentage of the total rose from 86.4% to 88.0%. (Reference) • At the same time, the number of companies responding “expand overseas business, scale back domestic business” declined somewhat from the previous survey (47 companies → 41
companies), while the percentage declined from 9.4% to 8.5%. Analyzed by industry, approximately half (51.2%) was the automobile industry.
(1) Volume of net salesNo. of companies
responding “scale
back” for domestic
business prospect
(A)
No. of
respondent
companies
(B)
(A)/(B)
¥1 trillion or more 3 42 7.1%¥300 bn. up to ¥1 trillion. 4 65 6.2%¥100 bn. up to ¥300 bn. 13 113 11.5%¥50 bn. up to ¥100 bn. 7 100 7.0%¥10 bn. up to ¥50 bn. 12 213 5.6%Less than ¥10 bn. 1 76 1.3%
No Answer 1 8 -Total 41 617 6.6%
(2) Volume of paid-in capitalNo. of companies
responding “scale
back” for domestic
business prospect
(A)
No. of
respondent
companies
(B)
(A)/(B)
Large Corporations 29 448 6.5%Mid-tier firms/SMEs 12 168 7.1%
No answer/Holding company - 1 -Total 41 617 6.6%
(3) IndustryNo. of companies
responding “scale
back” for domestic
business prospect
(A)
No. of
respondent
companies
(B)
(A)/(B)
Automobiles 21 109 19.3%Electrical Equipment & Electronics 4 97 4.1%Chemicals 5 94 5.3%General Machinery 2 61 3.3%Foods 0 32 0.0%Precision Machinery 1 29 3.4%Textiles 2 24 8.3%Nonferrous Metals 1 22 4.5%Metal Products 1 19 5.3%Ceramics, Cement & Glass 2 17 11.8%Steel 0 16 0.0%Petroleum & Rubber 0 14 0.0%Transportation (excl. Automobiles) 1 14 7.1%Paper, Pulp & Wood 0 10 0.0%
Other 1 59 1.7%
Total 41 617 6.6%

Using overseas production
outsourcing: 326 companies,
55.4%
Not using overseas
production outsourcing:
262 companies, 44.6%
129 companies, 39.8%
173 companies, 53.4%
19 companies, 5.9%
3 companies, 0.9%
1. Will use more actively
2. Will maintain current usage
3. Will lower current usage
4. Will not use
94 companies, 39.5%
131 companies, 55.0%
11 companies, 4.6%
2 companies, 0.8%
35 companies, 41.2%
42 companies, 49.4%
7 companies, 8.2%
1 company, 1.2%
Figure 23: Present situation of using
Overseas Production Outsourcing
Copyright © 2014 JBIC All Rights Reserved.
p.16
(No. of responding companies = 324) (1) All industries
(2) Size of Company
① Large corporations (238 companies) ② Mid-tier firms/SMEs (85 companies)
(No. of responding companies = 588)
III. 4. Stance toward Overseas Production Outsourcing
Please choose one of the following options that
applies to the situation in your company as
regards your present situation of using overseas
production outsourcing.
Q Please choose one of the following options that best describes your
company's attitude towards the use of overseas production
outsourcing over the medium term (approx. the next 3 years).
Q
Figure 24: Use of Overseas Production Outsourcing over the Medium Term
Majority of respondent companies are using overseas production
outsourcing • This survey investigated the use of overseas production outsourcing and attitudes
toward medium-term use. A majority (55.4%) of respondent companies (326 of 588
companies) responded that they are using overseas production outsourcing (Figure 23).
Over the medium term, over 90% of both large corporations and mid-tier
firms/SMEs intend to use overseas production outsourcing in excess of
current usage levels • Regarding the stance toward medium-term use of overseas production outsourcing,
“use more actively” and “maintain current levels” accounted for 93.2% of the total, and a
majority of companies utilizing overseas production outsourcing indicated that they will
continue to use it in the future (Figure 24).
• Overseas production outsourcing is positioned by many companies as a cost-cutting
measure, but there is also risk of technology leakage. In company interviews, examples
were given of responding to this problem by limiting consignment to production of
general products or parts to prevent leakage of the company’s core technologies, and
protecting intellectual property by clarifying rights and obligations in license production
agreements.

Copyright © 2014 JBIC All Rights Reserved.
IV. Promising Countries/Regions over the Medium-Term

Copyright © 2014 JBIC All Rights Reserved.
p.17 IV. 1. Rankings of Promising Countries/Regions (Medium-term prospects)
Figure 25: Promising Countries/Regions for Overseas Business over
the Medium-term (next 3 yrs. or so) (multiple answers are possible)
The respondents were each asked to name
the top 5 countries that they consider to have
promising prospects for business operations
over the Medium-term (next 3 yrs. or so).
※ Percentage
share =
No. of respondents citing
country/region
Total No. of respondent
companies
Q
※ See Appendix 1 for pre-FY2012 results of Figure 25 and for
Promising Countries/Regions for Mid-tier firms/SMEs over
the Medium Term
Note 1: The countries and regions other than those listed above included North America (25
companies, 5.0% of the total), EU/Europe (17 companies, 3.4% of the total), and
Southeast Asia/ASEAN (6 companies, 1.2% of the total).
Note 2: In case of the same ranking, listed by alphabetical order.
2014 2013(Total) 499 488
1 - 2 India 229 213 45.9 43.6
2 1 Indonesia 228 219 45.7 44.9
3 4 China 218 183 43.7 37.5
4 3 Thailand 176 188 35.3 38.5
5 - 5 Vietnam 155 148 31.1 30.3
6 7 Mexico 101 84 20.2 17.2
7 6 Brazil 83 114 16.6 23.4
8 - 10 USA 66 54 13.2 11.1
9 - 9 Russia 60 60 12.0 12.3
10 8 Myanmar 55 64 11.0 13.1
11 - 11 Philippines 50 39 10.0 8.0
12 - 12 Malaysia 46 37 9.2 7.6
13 14 Turkey 26 23 5.2 4.7
14 - 16 Singapore 25 19 5.0 3.9
15 17 Cambodia 20 12 4.0 2.5
15 13 Korea 20 28 4.0 5.7
17 14 Taiwan 19 23 3.8 4.7
18 - 18 Germany 9 10 1.8 2.0
19 - 28 France 7 2 1.4 0.4
19 23 Saudi Arabia 7 4 1.4 0.8
19 18 South Africa 7 10 1.4 2.0
2013
Percentage
Share(%)
No. of
CompaniesRanking
2014 2013← 2014Country/Region
India takes 1st place for the first time • India took first place as a promising country/region for the first time since 1992
when the question was first posed in its present form. It received responses from
a wide range of industries, including automobiles, chemicals and electrical
equipment & electronics. The number of companies indicating Thailand, which
was 3rd in the previous survey, declined significantly, while companies indicating
China, which was 4th last year, increased, and 2nd place Indonesia and 3rd
place China balanced out.
Continued strong evaluation for Indonesia in 2nd • Despite the number of respondent companies increasing from 219 companies to
228 companies, Indonesia lost to India by a narrow margin, though it continued
to be rated highly.
China up to 3rd; recovery in number of respondents and
voting ratio • China declined substantially in voting ratio and number of respondent
companies in the previous survey, falling to 4th place, but in this survey, both
recovered. Rising production costs and intensifying competition are issues, but
there is well-rooted support in terms of both production bases and markets and
there are signs of a resurgence.
Thailand slips to 4th place • Thailand’s rank dropped one place from 3rd in the previous survey, but the
number of respondent companies declined significantly, as the difference with
5th place Vietnam narrowed. It can be surmised that this reflects deterioration in
economic conditions within the country, but in company interviews, past flooding
and the impact of the recent political situation were also cited.
For Brazil, major decrease in respondent companies • In this survey, Mexico (6th) and Brazil (7th) switched positions from the previous
survey, but the margin of decline in the number of companies choosing Brazil is
significant. Background factors are likely Brazil’s stagnating economy in recent
years and lower expectations for the future.
Presence of ASEAN countries remains high • After Indonesia, Thailand, Vietnam and Myanmar, the Philippines, Malaysia,
Singapore and Cambodia were all in the top 20, showing the continuing strong
presence of ASEAN countries among promising countries/regions.

0
20
40
60
80
100
92 93 94 95 96 97 98 99 00 01 02 03 04 05 06 07 08 09 10 11 12 13 14
(%)
(FY)
India
Indonesia
China
Thailand
Vietnam
Brazil
USA
Russia
Tro
ub
le w
ith n
eig
hb
orin
g
co
un
tries
“L
eh
ma
n B
roth
ers
Sh
oc
k”
An
ti-Jap
an
ese p
rote
sts
in C
hin
a
BR
ICs
Re
po
rt
SA
RS
ou
tbre
ak
Ch
ina
's e
ntry
into
the
WT
O
9/1
1 a
ttacks
Bu
rstin
g o
f the
IT B
ub
ble
As
ian
cu
rren
cy c
risis
So
uth
ern
tou
r lectu
re
Copyright © 2014 JBIC All Rights Reserved.
p.18 IV. 2. Promising Countries/Regions: Changes in Percentage Shares (8 main countries)
Figure 26: Promising Countries/Regions for Overseas Business
over the Medium-term (next 3 yrs. or so): Percentage Shares
(Reference) The Number of Companies Which
Have One or More Overseas
Affiliates of Production in China
Note: The ratio in the table shows the ratio of
the number of companies which have one
or more overseas affiliates of production
in China to the number of responding
companies to the question regarding the
number of overseas affiliates.
Year of surveyNo. of
respondentProportion
FY2000 268 57.5%
FY2003 408 71.8%
FY2005 487 82.5%
FY2010 481 80.3%
FY2012 490 81.3%
FY2013 487 77.9%
FY2014 508 82.3%
Voting ratios of top promising countries balance out • The number of companies voting for India, Indonesia and China increased
steadily due primarily to local market expansion, and their voting ratios are
trending upward. However, because the number of companies voting for
Thailand and Brazil declined considerably, the voting ratio of the top three
promising countries (India, Indonesia and China) balance out at around 45%.
India’s voting ratio increases slightly • India’s voting ratio peaked in the FY2010 survey and had been declining
since then, but in this survey, it rose 2.3 percentage points over the previous
survey, to 45.9%. • India’s voting ratio has been at or above 40% since the FY2006 survey, but
only 21.1% of companies have production bases in India and only 18.8%
have sales bases, so despite high expectations long term, the number of
companies that have entered India remains low.
China’s voting ratio recovers • In the previous survey, the percentage of companies voting for China as
promising (37.5%) fell below 40%, and the number of companies dropped
from 319 to 183, a record low, but this trend reversed itself in this year’s
survey. • Over 80% of respondent companies have production bases in China
(reference). Support for the importance of China both as a production base
and market is well rooted, but along with rising costs and intensifying
completion, it can be surmised that the voting ratio did not return to over
60% as was the case in FY2012 and earlier due also in part to a break in
new entries to the market.

Copyright © 2014 JBIC All Rights Reserved.
p.19 IV. 3. Existence of Real Business Plans(Top 10 countries/regions)
Plans, including either for new
business forays or additional
investment, do exist
No concrete plans exist at this point
No response
Companies that named promising
countries over the medium-term
in Figure 25 were asked whether
they had business plans for each
of the countries they chose.
Q
Note 1: The ratio in the graph was obtained by dividing
the number of responding companies for “Plans
exist” by the number of companies that responded
as promising.
Note 2: The figures in parenthesis above the bar graph
indicate the number of companies which
responded to the countries as being promising.
Note 3: Refer to Appendix 8 regarding the number of
responding companies for each choice.
Figure 27: Existence of Real Business Plans in Promising Countries
Figure 28: Promising Countries/Regions for Overseas Operations over the Medium-term (next 3 yrs. or so) prospects
(Aggregated the number of companies which responded that “Plans exist”) Approximately 60% of respondent companies have real business plans for
China, Thailand and the USA • Companies that indicated promising countries over the medium term were asked about the
existence of business plans in the countries they voted for, and the countries with the highest ratios
for “Plans exist” were China, Thailand and the USA, at approximately 60% (Figure 27). Next highest
was Mexico, which was down slightly from its 51.2% mark in FY2013, but which still maintained a
relatively high level of 49.5%. Meanwhile, for India, the top promising country over the medium term,
the percentage was just 40.2%. • The country with the highest number of companies that responded “Plans exist” was China (Figure
28). The number of respondent companies for China declined by nearly half from 219 companies in
FY2012 to 116 companies in FY2013, but in this year’s survey, the number recovered somewhat to
136 companies, more than 30 companies more than Thailand (104 companies) and Indonesia (101
companies), and more than 40 companies more than India (92 companies).
“Plans exist” percentage gradually increasing for Myanmar • Myanmar ranked in the top 10 of promising countries over the medium term for the first time in
FY2012. At that time, 6 companies, or 11.8% of the total, responded “Plans exist,” putting
expectations quite far ahead of plans. The number of companies responding “Plan exist” for
Myanmar increased this year to 16, or 29.1% of the total, suggesting that concrete business is now
in the process of being formed.
India Indonesia China Thailand Vietnam Mexico Brazil USA Russia Myanmar
44.6 40.2
47.9 44.3
63.4 62.4 59.0 59.1
46.6
33.5
51.2 49.5
31.6
42.2
66.7 59.1
41.7 36.7
18.8
29.1
0
10
20
30
40
50
60
70
80
90
100
13 14 13 14 13 14 13 14 13 14 13 14 13 14 13 14 13 14 13 14
(%)(213)(229) (219)(228) (183)(218) (188)(176) (148)(155) (84)(101) (114)(83) (54)(66) (60)(60) (64)(55)
2014 2013 2012
1 China 136 116 219 20
2 Thailand 104 111 90 ▲ 7
3 Indonesia 101 105 99 ▲ 4
4 India 92 95 120 ▲ 3
5 Vietnam 52 69 63 ▲ 17
6 Mexico 50 43 38 7
7 USA 39 36 24 3
8 Brazil 35 36 54 ▲ 1
9 Russia 22 25 23 ▲ 3
10 Philippines 20 15 8 5
13 Myanmar 16 12 6 4
Rank Country
No. of respondent
companies
Change from
last survey
('14-'13)

Copyright © 2014 JBIC All Rights Reserved.
p.20 IV. 4. Rankings of Promising Countries/Regions (by industry, long-term prospects)
Figure 29: Promising Countries/Regions for Overseas Operations
over the Medium-term (next 3 yrs. or so) Prospects
(by major industry)
Figure 30: Promising Countries/Regions for Overseas Operations
over the Long-term (next 10 yrs. or so) Prospects
(by major industry)
Note: The number of responded companies in the previous survey (FY2013 Survey)
was 360. Refer to Appendix 1 regarding ranking in the previous survey.
Chemicals Automobiles
FY2014 FY2013 FY2014 FY2013
(Total 76) (Total 71) (Total 89) (Total 97)
1 India 41 35 1 Indonesia 53 56
2 China 35 36 2 India 50 54
3 Indonesia 33 33 3 China 44 33
4 Thailand 32 30 4 Mexico 43 39
5 Vietnam 26 17 5 Thailand 27 44
6 Mexico 16 12 6 Brazil 17 26
7 Brazil 14 20 7 Russia 16 20
8 USA 10 10 8 USA 10 9
9 Malaysia 7 7 9 Vietnam 8 20
10 Myanmar 6 4 10 Myanmar 6 12
10 Russia 6 3
Electrical Equipment & Electronics General Machinery
FY2014 FY2013 FY2014 FY2013
(Total 75) (Total 67) (Total 53) (Total 55)
1 India 40 31 1 Indonesia 27 21
2 China 32 24 2 India 22 27
3 Vietnam 26 18 3 Thailand 20 23
4 Indonesia 25 20 4 China 17 22
5 Thailand 24 21 5 Vietnam 16 15
6 Brazil 14 22 6 Brazil 12 18
7 Philippines 9 8 7 Russia 10 11
8 Myanmar 8 7 8 USA 9 10
9 Mexico 7 7 9 Mexico 8 8
10 Russia 6 6 10 Malaysia 7 5
Rank CountryRank Country
Rank Country Rank Country
By industry: 1st place in four major industries held by India and
Indonesia • In FY2011, China took 1st place among promising countries in all four major industries. In
FY2012, it was first in the three industries other than automobiles, and in FY2013 it maintained
first place only in chemicals, but this year, it ranked 2nd or below in all four industries. Taking
its place, India and Indonesia shared the top positions. • There was no major change in the makeup of the top countries in the four industries, but there
were contrasts in Latin America. The number of respondent companies increased for Mexico in
chemicals and automobiles, and the number was the same as the previous year in electrical
equipment & electronics and general machinery, while Brazil saw the number of respondent
companies fall in all four industries. The largest declines in number of respondent companies
from the previous year were Thailand (down 17 companies) and Vietnam (down 12 companies)
in automobiles.
Long-term promising countries: India has maintained 1st place since
the FY2010 survey • India took first place among long-term promising countries for the fifth consecutive year,
overwhelmingly beating out the other countries, with 207 companies. Profit satisfaction has
been low recently, but a majority of respondent companies (55.6%) citied India as a promising
country over the long term, which indicates that many companies continue to have
expectations with regard to the country’s economic potential. Rising into 2nd place and taking
the place of China was Indonesia. • Myanmar, which entered the top ten promising countries over the long term for the first time in
FY2012, maintained 7th place, though respondent companies did decline by five, to 70
companies.
• Brazil, which was 4th last fiscal year, fell to 6th place as respondent companies declined
significantly from 114 to 91 companies.
No. of
respondent
companies
Change from
last survey
(Total 372) (companies)
1 India 207 55.6% 16
2 Indonesia 163 43.8% 28
3 China 150 40.3% 11
4 Vietnam 117 31.5% 21
5 Thailand 105 28.2% 6
6 Brazil 91 24.5% ▲ 23
7 Myanmar 70 18.8% ▲ 5
8 Russia 65 17.5% 0
9 Mexico 58 15.6% 11
10 USA 47 12.6% 0
CountryRankPercentage
Share

Copyright © 2014 JBIC All Rights Reserved.
p.21
※ Refer to Appendix 2, 3 for details of reasons for being promising for the top ten promising countries over
the medium-term and issues.
(Note 1) (Note 2)
Note 1: The “No. of companies” here refers to the number of companies that responded to questions concerning “reasons for being a promising country” and “issues” out
of the number of companies that listed the country/region in Figure 25. For this reason, the number of companies here may not be the same as in Figure 25.
Note 2: “Ratio” refers to the number of companies that cited “reasons for being a promising country” or “issues “ divided by the total number of respondent companies.
Reasons
Issues
Changes over
past 5 years
Changes over
past 5 years
IV. 5. Reasons for Countries as Promising and Issues: India
No.1: India
(Total No. of respondent companies: 220)No. of
companies Ratio
1 Future growth potential of local market 187 85.0%
2 Inexpensive source of labor 74 33.6%
3 Current size of local market 70 31.8%
4 Supply base for assemblers 46 20.9%
5 Qualified human resources 30 13.6%
(Total No. of respondent companies: 188)No. of
companies Ratio
1 Underdeveloped infrastructure 97 51.6%
2 Intense competition with other companies 69 36.7%
3 Execution of legal system unclear 66 35.1%
4 Complicated tax system 53 28.2%
5 Labor problems 46 24.5%
5 Security/social instability 46 24.5%
85.0%
33.6%
0%
10%
20%
30%
40%
50%
60%
70%
80%
90%
100%
2010
(310)
2011
(283)
2012
(279)
2013
(208)
2014
(220)
1.Future growth potential of local market
2.Inexpensive source of labor
3.Current size of local market
4.Supply base for assemblers
5.Qualified human resources
(FY)
(No. of companies)
51.6%
36.7%
0%
10%
20%
30%
40%
50%
60%
70%
80%
90%
100%
2010
(294)
2011
(255)
2012
(255)
2013
(194)
2014
(188)
1.Underdeveloped infrastructure
2.Intense competition with other companies
3.Execution of legal system unclear
4.Complicated tax system
5.Labor problems
5.Security/social instability
(FY)
(No. of companies)
The top reason for being promising remained “Future growth potential of local
market,” at 85.0%. This indicates that there are still high expectations for India’s
growth potential. The percentage for “Current size of local market” has been
rising since 2010, and even given its current scale, it can be said that the promise
of the Indian market is high. The top issue continued to be “Underdeveloped infrastructure” (51.6%). The
percentage declined from the previous survey’s 57.2%, but it still indicates that a
majority of respondent companies recognize the largest issue to be infrastructure
development.

Copyright © 2014 JBIC All Rights Reserved.
Reasons
Issues
Changes over
past 5 years
Changes over
past 5 years
p.22 IV. 6. Reasons for Countries as Promising and Issues: Indonesia
No.2: Indonesia
(Total No. of respondent companies: 220)No. of
companies Ratio
1 Future growth potential of local market 188 85.5%
2 Current size of local market 82 37.3%
3 Inexpensive source of labor 63 28.6%
4 Supply base for assemblers 56 25.5%
5 Base of export to third countries 30 13.6%
(Total No. of respondent companies: 188)No. of
companies Ratio
1 Rising labor costs 83 44.1%
2 Execution of legal system unclear 77 41.0%
3 Intense competition with other companies 61 32.4%
3 Underdeveloped infrastructure 61 32.4%
5 Difficult to secure management-level staff 51 27.1%
85.5%
37.3%
0%
10%
20%
30%
40%
50%
60%
70%
80%
90%
2010
(105)
2011
(141)
2012
(208)
2013
(215)
2014
(220)
1.Future growth potential of local market
2.Current size of local market
3.Inexpensive source of labor
4.Supply base for assemblers
5.Base of export to third countries
(FY)
(No. of companies)
44.1%
41.0%
0%
10%
20%
30%
40%
50%
60%
70%
80%
90%
2010
(98)
2011
(119)
2012
(171)
2013
(194)
2014
(188)
1.Rising labor costs
2.Execution of legal system unclear
3.Intense competition with other companies
3.Underdeveloped infrastructure
5.Difficult to secure management-level staff
(FY)
(No. of companies)
The top reason for being cited as promising remained “Future growth of local market”
(85.5%), but “Current size of local market” rose to 2nd place (37.3%), and last year’s 2nd
place, “Inexpensive source of labor,” its response ratio dropped by 9.5 percentage points,
falling from 2nd place last year to 3rd place this year.
The top issue continued to be “Rising labor costs,” and the response ratio increased by 2.9
percentage points from the previous year, rising to 44.1%. Indonesia trended down
somewhat in terms of its attractiveness as a low-cost production base. The 2nd place issue
was “Execution of legal system unclear” (41.0%); it increased by 9.6 percentage points from
the previous year. This issue was indicated not only for nonferrous metals, which was
impacted by the new mining law (enforced January 2014) but for a wide range of industries,
including foods, chemicals and electrical equipment & electronics.

Copyright © 2014 JBIC All Rights Reserved.
Reasons
Issues
Changes over
past 5 years
Changes over
past 5 years
p.23 IV. 7. Reasons for Countries as Promising and Issues: China
No.3: China
(Total No. of respondent companies: 214)No. of
companies Ratio
1 Future growth potential of local market 146 68.2%
2 Current size of local market 122 57.0%
3 Supply base for assemblers 50 23.4%
4 Concentration of industry 45 21.0%
5 Inexpensive source of labor 38 17.8%
(Total No. of respondent companies: 199)No. of
companies Ratio
1 Rising labor costs 150 75.4%
2 Intense competition with other companies 117 58.8%
3 Execution of legal system unclear 108 54.3%
4 Insufficient protection for intellectual property rights 94 47.2%
5 Restrictions on foreign currency/ transfers of money overseas 65 32.7%
5 Security/social instability 65 32.7%
68.2%
57.0%
0%
10%
20%
30%
40%
50%
60%
70%
80%
90%
100%
2010
(394)
2011
(351)
2012
(312)
2013
(183)
2014
(214)
1.Future growth potential of local market
2.Current size of local market
3.Supply base for assemblers
4.Concentration of industry
5.Inexpensive source of labor
(FY)
(No. of companies)
75.4%
58.8%
0%
10%
20%
30%
40%
50%
60%
70%
80%
90%
100%
2010
(377)
2011
(339)
2012
(300)
2013
(179)
2014
(199)
1.Rising labor costs
2.Intense competition with othercompanies
3.Execution of legal system unclear
4.Insufficient protection for intellectualproperty rights
5.Restrictions on foreign currency/transfers of money overseas
5.Security/social instability
(FY)
(No. of companies)
The top reason for being cited as promising was “Future growth potential of local market”
(68.2%). The figure was nearly even with the previous survey. The 2nd place reason was
“Current size of local market;” its response ratio fell to 57.0%, but like in the previous survey it
continues to maintain substantial support. The other reasons’ response ratios declined from the
previous survey, though their order was the same. It can be concluded that companies citing
China as a promising country are most focused on its promise as a current and future market.
Issues were “Rising labor costs” (75.4%), “Intense competition with other companies” (58.8%),
“Execution of legal system unclear” (54.3%), and “Insufficient protection for intellectual property
rights” (47.2%), the same order as the previous survey. “Security/social instability” (32.7%)
continued to be cited by over 30%, as was the case in the previous survey, in light of the
boycotting of Japanese products and chilling in Japan-China relations that began two years
ago, among other factors.

Copyright © 2014 JBIC All Rights Reserved.
Reasons
Issues
Changes over
past 5 years
Changes over
past 5 years
p.24 IV. 8. Reasons for Countries as Promising and Issues: Thailand
No.4 : Thailand
(Total No. of respondent companies: 173)No. of
companies Ratio
1 Future growth potential of local market 94 54.3%
2 Current size of local market 73 42.2%
3 Concentration of industry 61 35.3%
4 Inexpensive source of labor 49 28.3%
5 Supply base for assemblers 48 27.7%
5 Base of export to third countries 48 27.7%
5 Developed local infrastructure 48 27.7%
54.3%
42.2%
0%
10%
20%
30%
40%
50%
60%
70%
80%
2010
(132)
2011
(159)
2012
(160)
2013
(185)
2014
(173)
1.Future growth potential of local market
2.Current size of local market
3.Concentration of industry
4.Inexpensive source of labor
5.Supply base for assemblers
5.Base of export to third countries
5.Developed local infrastructure
(FY)
(No. of companies)
52.8%
52.1%
0%
10%
20%
30%
40%
50%
60%
70%
80%
2010
(128)
2011
(133)
2012
(137)
2013
(157)
2014
(142)
1.Security/social instability
2.Rising labor costs
3.Intense competition with other companies
4.Difficult to secure management-level staff
5.Difficult to secure technical/engineeringstaff
(FY)
(No. of companies)
The actual FY2013 performance evaluation was not very favorable, but companies that cited
Thailand as a promising country have the most expectations with respect to the current size of
the local market and its future potential. Reflecting rising labor costs, the response ratio for
“Inexpensive source of labor” has been trending down. While concentration of industry and local
infrastructure continue to receive high ratings as part of Thailand’s appeal.
Rising sharply to become the top issue was “Security/social instability” (52.8%), reflecting the
political turmoil there. There was also the impact of economic slowing and delays in procedures
for investment permission, etc., but in company interviews, many companies held the view that
the country would return to a growth path over the medium/long term. On the other hand, the
2nd place issue was “Rising labor costs,” which has stayed in the 50% range, suggesting the
possibility that companies will disperse production bases in countries neighboring Thailand.
(Total No. of respondent companies: 142)No. of
companies Ratio
1 Security/social instability 75 52.8%
2 Rising labor costs 74 52.1%
3 Intense competition with other companies 64 45.1%
4 Difficult to secure management-level staff 43 30.3%
5 Difficult to secure technical/engineering staff 31 21.8%

Copyright © 2014 JBIC All Rights Reserved.
Reasons
Issues
Changes over
past 5 years
Changes over
past 5 years
p.25 IV. 9. Reasons for Countries as Promising and Issues: Vietnam
No.5: Vietnam
(Total No. of respondent companies: 127)No. of
companies Ratio
1 Underdeveloped infrastructure 52 40.9%
2 Execution of legal system unclear 44 34.6%
3 Difficult to secure management-level staff 40 31.5%
4 Rising labor costs 38 29.9%
5 Underdeveloped legal system 33 26.0%
69.5%
53.0%
0%
10%
20%
30%
40%
50%
60%
70%
80%
2010
(165)
2011
(149)
2012
(160)
2013
(146)
2014
(151)
1.Future growth potential of local market
2.Inexpensive source of labor
3.Qualified human resources
4.Good for risk diversification to other countries
5.Current size of local market
(FY)
(No. of companies)
40.9%
34.6%
0%
10%
20%
30%
40%
50%
60%
70%
80%
2010
(156)
2011
(121)
2012
(129)
2013
(132)
2014
(127)
1.Underdeveloped infrastructure
2.Execution of legal system unclear
3.Difficult to secure management-level staff
4.Rising labor costs
5.Underdeveloped legal system
(FY)
(No. of companies)
The top reason for being cited as promising was “Future growth potential of local market”
(69.5%), and second was “Inexpensive source of labor” (53.0%), the same as last year. The
response ratio for “Inexpensive source of labor” has been declining every year, but it remains
next highest after Myanmar (69.8%) among the top promising countries. The 4th place
reason, “Good for risk diversification to other countries” (19.2%), one of the characteristics of
Vietnam’s reasons for being promising, continues to be regarded highly by close to 20% of
companies.
The top issue remained “Underdeveloped infrastructure.” The response ratio was 40.9%,
lower than India (51.6%) and Myanmar (66.0%), but potentially one of the barriers when
companies consider establishing a new production base or transferring production from
another country. Due in part to its late participation in the WTO in 2007, many companies
indicated systematic issues like “Execution of legal system unclear” (34.6%) and
“underdeveloped legal system” (26.0%).
(Total No. of respondent companies: 151)No. of
companies Ratio
1 Future growth potential of local market 105 69.5%
2 Inexpensive source of labor 80 53.0%
3 Qualified human resources 30 19.9%
4 Good for risk diversification to other countries 29 19.2%
5 Current size of local market 27 17.9%

Copyright © 2014 JBIC All Rights Reserved.
Reasons
Issues
Changes over
past 5 years
Changes over
past 5 years
p.26 IV. 10. Reasons for Countries as Promising and Issues: Mexico
No. 6: Mexico
(Total No. of respondent companies: 99)No. of
companies Ratio
1 Future growth potential of local market 63 63.6%
2 Supply base for assemblers 50 50.5%
3 Inexpensive source of labor 32 32.3%
4 Current size of local market 28 28.3%
5 Base of export to third countries 25 25.3%
63.6%
50.5%
0%
10%
20%
30%
40%
50%
60%
70%
80%
2010
(25)
2011
(29)
2012
(70)
2013
(81)
2014
(99)
1.Future growth potential of local market
2.Supply base for assemblers
3.Inexpensive source of labor
4.Current size of local market
5.Base of export to third countries
(FY)
(No. of companies)
52.4%
36.9%
0%
10%
20%
30%
40%
50%
60%
70%
80%
2010
(23)
2011
(23)
2012
(59)
2013
(70)
2014
(84)
1.Security/social instability
2.Difficult to secure management-level staff
3.Intense competition with other companies
4.Difficult to secure technical/engineering staff
5.Rising labor costs
5.Underdeveloped local supporting industries
(FY)
(No. of companies)
The top reason for being cited as promising was “Future growth potential of local market,” which rose to 63.6%. “Supply base for assemblers” also continued from the previous survey at a high level, 50.5%. Mexico has entered many FTAs including NAFTA, etc., so in addition to the appeal of its local market, it is rated highly as a supply base for North and South America, and this reason improved one rank from the previous survey. Respondent companies increased by 17 from the previous survey to 101 companies, indicating a high level of interest after Asian major countries.
The top issue was “Security/social instability” (52.4%), with a majority of respondent companies citing it. The second was “Difficult to secure management-level staff” (36.9%), followed by “Difficult to secure technical/engineering staff” (19.0%) and “Rising labor costs” (17.9%)—many companies cited labor issues like these.
(Total No. of respondent companies: 84)No. of
companies Ratio
1 Security/social instability 44 52.4%
2 Difficult to secure management-level staff 31 36.9%
3 Intense competition with other companies 17 20.2%
4 Difficult to secure technical/engineering staff 16 19.0%
5 Rising labor costs 15 17.9%
5 Underdeveloped local supporting industries 15 17.9%

Copyright © 2014 JBIC All Rights Reserved.
Reasons
Issues
Changes over
past 5 years
Changes over
past 5 years
p.27 IV. 11. Reasons for Countries as Promising and Issues: Brazil
No. 7: Brazil
(Total No. of respondent companies: 79)No. of
companies Ratio
1 Future growth potential of local market 65 82.3%
2 Current size of local market 23 29.1%
3 Supply base for assemblers 13 16.5%
4 Inexpensive source of labor 9 11.4%
5 Base of export to third countries 7 8.9%
(Total No. of respondent companies: 61)No. of
companies Ratio
1 Security/social instability 28 45.9%
2 Execution of legal system unclear 19 31.1%
2 Intense competition with other companies 19 31.1%
4 Complicated tax system 18 29.5%
5 Execution of tax system unclear 14 23.0%
82.3%
29.1%
0%
10%
20%
30%
40%
50%
60%
70%
80%
90%
100%
2010
(126)
2011
(138)
2012
(132)
2013
(113)
2014
(79)
1.Future growth potential of local market
2.Current size of local market
3.Supply base for assemblers
4.Inexpensive source of labor
5.Base of export to third countries
(FY)
(No. of companies)
45.9%
31.1%
0%
10%
20%
30%
40%
50%
60%
70%
80%
90%
100%
2010
(120)
2011
(115)
2012
(110)
2013
(99)
2014
(61)
1.Security/social instability
2.Execution of legal system unclear
2.Intense competition with other companies
4.Complicated tax system
5.Execution of tax system unclear
(FY)
(No. of companies)
The top reason for being cited as a promising country was “Future growth potential of local
market” (82.3%), with over 80% of companies that cited it as a promising country selecting this
reason. Next was “Current size of local market” (29.1%), and both give an indication of the
expectations for the current state of the local market and its future growth potential, but in both
cases, percentages were lower than the previous survey. The country slid one rank to 7th
place, and the number of companies selecting it fell by 31 companies from the previous survey
to just 83 companies.
The top issue was “Security/social instability” (45.9%), the 2nd place reason in the previous
survey, and the response ratio increased markedly from 26.3% in the previous survey.
“Execution of legal system unclear” (31.1%) and “Intense competition with other companies”
(31.1%) had the same percentage, and in both cases the response ratio increased from the
previous survey. This indicates increasing concern over deterioration in the security and social
situation in the country.

Copyright © 2014 JBIC All Rights Reserved.
Reasons
Issues
Changes over
past 5 years
Changes over
past 5 years
p.28 IV. 12. Reasons for Countries as Promising and Issues: USA
No. 8: USA
(Total No. of respondent companies: 66)No. of
companies Ratio
1 Current size of local market 44 66.7%
2 Future growth potential of local market 37 56.1%
3 Developed local infrastructure 30 45.5%
3 Social/political situation stable 30 45.5%
5 Developed local logistics services 21 31.8%
(Total No. of respondent companies: 47)No. of
companies Ratio
1 Intense competition with other companies 37 78.7%
2 Rising labor costs 10 21.3%
3 Labor problems 9 19.1%
4 Increased taxation 6 12.8%
4 Difficult to secure management-level staff 6 12.8%
66.7%
56.1%
0%
10%
20%
30%
40%
50%
60%
70%
80%
90%
100%
2010
(58)
2011
(47)
2012
(53)
2013
(54)
2014
(66)
1.Current size of local market
2.Future growth potential of local market
3.Developed local infrastructure
3.Social/political situation stable
5.Developed local logistics services
(FY)
(No. of companies)
78.7%
21.3%
0%
10%
20%
30%
40%
50%
60%
70%
80%
90%
100%
2010
(52)
2011
(41)
2012
(41)
2013
(40)
2014
(47)
1.Intense competition with other companies
2.Rising labor costs
3.Labor problems
4.Increased taxation
4.Difficult to secure management-level staff
(FY)
(No. of companies)
The top reason for being cited as promising was “Current size of local market” (66.7%), with
the response ratio declining from the previous survey, but still remaining at a high level, and
the second was “Future growth potential of local market” (56.1%), indicating the positive view
of the expectations for the current state of the USA economy and its future growth. The
country gained two ranks from the previous survey and was selected by 66 companies, 12
more than in the previous survey.
The top issue was the same as the previous survey: “Intense competition with other
companies” (78.7%), which was selected by a large majority. In company interviews, there
was mention of competition intensifying with European, North American and Japanese
companies centering on high-end products, against a backdrop of a solid USA economy. The
2nd place and other issues were “Rising labor costs” (21.3%), “Labor problems” (19.1%).

Copyright © 2014 JBIC All Rights Reserved.
Reasons
Issues
Changes over
past 5 years
Changes over
past 5 years
p.29 IV. 13. Reasons for Countries as Promising and Issues: Russia
No. 9: Russia
(Total No. of respondent companies: 57)No. of
companies Ratio
1 Future growth potential of local market 46 80.7%
2 Current size of local market 24 42.1%
3 Supply base for assemblers 13 22.8%
4 Profitability of local market 6 10.5%
5 Qualified human resources 4 7.0%
5 Base of export to third countries 4 7.0%
(Total No. of respondent companies: 50)No. of
companies Ratio
1 Security/social instability 21 42.0%
2 Execution of legal system unclear 20 40.0%
3 Intense competition with other companies 18 36.0%
4 Complicated/unclear procedures for investment permission 14 28.0%
5 Execution of tax system unclear 12 24.0%
5 Lack of information on the country 12 24.0%
80.7%
42.1%
0%
10%
20%
30%
40%
50%
60%
70%
80%
90%
100%
2010
(75)
2011
(58)
2012
(63)
2013
(60)
2014
(57)
1.Future growth potential of local market
2.Current size of local market
3.Supply base for assemblers
4.Profitability of local market
5.Qualified human resources
5.Base of export to third countries
(FY)
(No. of companies)
42.0%
40.0%
0%
10%
20%
30%
40%
50%
60%
70%
80%
90%
100%
2010
(71)
2011
(51)
2012
(52)
2013
(56)
2014
(50)
1.Security/social instability
2.Execution of legal system unclear
3.Intense competition with other companies
4.Complicated/unclear procedures forinvestment permission
5.Execution of tax system unclear
5.Lack of information on the country
(FY)
(No. of companies)
The top reason for being cited as promising was “Future growth potential of local market” (80.7%) and the second was “Current size of local market” (42.1%). Both response ratios were up, indicating the expectations for the current state of the local market and its future.
The top issue was “Security/social instability” (42.0%) and its response ratio rose significantly from the previous survey, as the recent situation there has very likely had an impact. Other issues were “Execution of legal system unclear” (40.0%) and “Intense competition with other companies” (36.0%).

Copyright © 2014 JBIC All Rights Reserved.
Reasons
Issues
Changes over
past 4 years
Changes over
past 4 years
p.30 IV. 14. Reasons for Countries as Promising and Issues: Myanmar
No. 10: Myanmar
(Total No. of respondent companies: 50)No. of
companies Ratio
1 Underdeveloped infrastructure 33 66.0%
2 Underdeveloped legal system 29 58.0%
3 Execution of legal system unclear 24 48.0%
4 Security/social instability 18 36.0%
5 Complicated/unclear procedures for investment permission 17 34.0%
69.8%
69.8%
0%
10%
20%
30%
40%
50%
60%
70%
80%
90%
100%
2011
(7)
2012
(48)
2013
(60)
2014
(53)
1.Inexpensive source of labor
1.Future growth potential of local market
3.Good for risk diversification to other countries
4.Base of export to third countries
4.Current size of local market
(FY)
(No. of companies)
66.0%
58.0%
0%
10%
20%
30%
40%
50%
60%
70%
80%
90%
100%
2011
(5)
2012
(43)
2013
(56)
2014
(50)
1.Underdeveloped infrastructure
2.Underdeveloped legal system
3.Execution of legal system unclear
4.Security/social instability
5.Complicated/unclear proceduresfor investment permission
(FY)
(No. of companies)
The top reasons for citing Myanmar as promising were “Inexpensive source of labor” and
“Future growth potential of local market,” which shared the same percentage (69.8%).
The latter in particular increased significantly by 9.3 percentage points from the previous
survey, suggesting a high level of interest in the future potential of the local market.
The top issue was “Underdeveloped infrastructure” (66.0%), the same as last fiscal year.
The second was “Underdeveloped legal system” (58.0%, up 9.8 percentage points from
the previous survey), and third was “Execution of legal system unclear” (48.0%, up 21.2
percentage points). Also, rising to 5th place was “Complicated/unclear procedures for
investment permission” (34.0%, up 23.3 percentage points), as many systematic issues
are coming to be pointed out with more and more companies entering the country.
(Total No. of respondent companies: 53)No. of
companies Ratio
1 Inexpensive source of labor 37 69.8%
1 Future growth potential of local market 37 69.8%
3 Good for risk diversification to other countries 7 13.2%
4 Base of export to third countries 6 11.3%
4 Current size of local market 6 11.3%

This question is put to those respondents who did not list India, Indonesia, China, Thailand or Vietnam in their top 5 most promising countries
over the medium term in Figure 25 above. Please select the reasons that apply from options 1-9 below for each individual country. (Multiple
responses possible)
Q
Figure 31: Reasons for Not Listing the Following Countries As Promising Countries over the Medium Term
Copyright © 2014 JBIC All Rights Reserved.
IV. 15. Reasons for Not Listing Certain Countries in the Top 5 Most Promising Countries p.31
Approximately half of companies not citing China and Thailand as promising countries over the medium term indicated that they were
already conducting business of a certain scale as the reason ・In the results last fiscal year to the question of promising countries over the medium term, the number of companies selecting China and India declined by a large margin. So, this year,
companies that did not select India, Indonesia, China, Thailand or Vietnam, which have been included among the top promising countries for the medium term in recent years, as among
the top five promising countries over the medium term were asked the reasons, and the response trends differed (Figure 31). The biggest reason for not selecting China and Thailand was
“We are already conducting business of a certain scale,” which was selected by around 50% of the companies. At the same time, the most common reason for India and Vietnam was “We
do not consider the country a target region for our company's business,” which was chosen by over 40% of companies responding. For Indonesia, response ratios for both these reasons
were around 30%.
Rank
1
2. We do not consider the
country a target region for our
company's business
43.2%
1. We are already conducting
business of a certain scale and
do not intend to expand our
business beyond that
32.5%
1. We are already conducting
business of a certain scale and
do not intend to expand our
business beyond that
51.6%
1. We are already conducting
business of a certain scale and
do not intend to expand our
business beyond that
49.8%
2. We do not consider the
country a target region for our
company's business
44.7%
26. There is a lack of
infrastructure in the area31.3%
2. We do not consider the
country a target region for our
company's business
30.6% 3. Local labor costs are rising 51.2%4. The local social/political
situation is unstable19.6%
1. We are already conducting
business of a certain scale and
do not intend to expand our
business beyond that
23.0%
3
1. We are already conducting
business of a certain scale and
do not intend to expand our
business beyond that
18.8%
5. Increasing intense
competition with other
companies
4. The local social/political
situation is unstable28.6% 3. Local labor costs are rising 17.8%
6. There is a lack of
infrastructure in the area15.7%
4
5. Increasing intense
competition with other
companies
14.2%6. There is a lack of
infrastructure in the area
5. Increasing intense
competition with other
companies
18.0%
2. We do not consider the
country a target region for our
company's business
16.0%9. Local circumstances other
than 3. - 8. above12.0%
57. The local legal system is
inadequate10.8%
9. Local circumstances other
than 3. - 8. above11.3%
2. We do not consider the
country a target region for our
company's business
5. Increasing intense
competition with other
companies
14.2%
5. Increasing intense
competition with other
companies
8.3%
64. The local social/political
situation is unstable3. Local labor costs are rising 10.6%
7. The local legal system is
inadequate
8. The local economy is
stagnating6.2%
8. The local economy is
stagnating5.5%
79. Local circumstances other
than 3. - 8. above
4. The local social/political
situation is unstable6.3%
8. The local economy is
stagnating5.1%
9. Local circumstances other
than 3. - 8. above5.8% 3. Local labor costs are rising 4.6%
88. The local economy is
stagnating7.4%
7. The local legal system is
inadequate4.4%
9. Local circumstances other
than 3. - 8. above4.1%
6. There is a lack of
infrastructure in the area2.2%
7. The local legal system is
inadequate4.1%
9 3. Local labor costs are rising 3.4%8. The local economy is
stagnating3.1%
6. There is a lack of
infrastructure in the area1.8%
7. The local legal system is
inadequate0.4%
4. The local social/political
situation is unstable2.3%
11.9%
9.7%
8.0%
India Indonesia China Thailand Vietnam(No. of respondent companies=176) (No. of respondent companies=160) (No. of respondent companies=217) (No. of respondent companies=225) (No. of respondent companies=217)

34.7%
57.4%
52.4%
67.0%
52.0%
66.2%
39.2%
46.8% 49.2%
57.5%60.5% 58.4%
0%
10%
20%
30%
40%
50%
60%
70%
80%
90%
100%
12 13 14 12 13 14 12 13 14 12 13 14 12 13 14 12 13 14 12 13 14 12 13 14 12 13 14 12 13 14 12 13 14 12 13 14(FY)
1,2801,235678 696 645
1,1751,1911,230 1,083 79 79 7798 86 86111 106 10677 63 61120 120 109277 284 283369 387 370337 393 373571 699 681
Copyright © 2014 JBIC All Rights Reserved.
Note: The number above the
bar graph indicates the
number of respondent
companies to each
country/region.
Scale back/withdraw
Maintain present level
Strengthen/expand
Figure 32: Medium-term Prospects for
Overseas Operations (by region)
IV. 16. Prospects for Overseas Operation by Region
Companies were asked about medium-term (next 3 yrs. or so) prospects for businesses in
countries/regions where they are currently operating or planning to operate.
Q
p.32
NIEs3 ASEAN5 China North
America
Latin
America
EU15 Rest of Europe & CIS
Middle
East
Rest of Asia &
Oceania
Central & Eastern Europe
Russia Africa
Stance of “maintain present level” continues with respect to prospects for business operations in China • The response ratio for strengthening business operations in China peaked in the FY2011 survey and has been falling since then, and in this year’s survey the ratio
increased by 1.0 percentage points from 51.4% in the previous survey, though this is nearly level with the previous survey. It indicates that one out of every two
companies operating in China continues to intend to “maintain present level.”
Growth in business expansion stance for ASEAN 5, Rest of Asia & Oceania, and Latin America • The response ratio for “strengthen/expand” for the ASEAN 5 was 57.4%, down slightly from the previous survey (59.6%), but it indicates a continued stance toward
business expansion in a broad range of industries. The response ratio for “strengthen/expand” for the rest of Asia and Oceania was 67%, exceeding the previous
survey, and among those countries, the ratios for India, Vietnam and Myanmar were each over 70%. For Latin America, the ratio reached 66.2% thanks to Mexico
and Brazil both being around 70%. By contrast, the response ratio for “strengthen/expand” for Russia fell from 64.2% in the previous survey to 57.5%.
Regions with business expansion stance falling below 50% were NIEs 3, EU 15, Central & Eastern Europe and Rest of Europe & CIS • In this year’s survey, the Middle East and Africa both exceeded 50%, and in both regions response ratios for “strengthen/expand” rose from the standpoint of
strengthening sales functions. The number of regions where the stance toward business expansion fell below 50% decreased by two from the six regions in the
previous survey, making the result four out of the 12 regions. By region, Europe (EU 15, Central & Eastern Europe, and Rest of Europe & CIS) continued to
primarily have the stance of “maintain present level.”

2 2 6 2 11 14 8 3 7 10
34 27 19 12 17 22
48 36
127 107
72 78
29 31
74
64 63
64
- -
4
2
4
3
4 3
1 2
6
3 8
7
0
50
100
150
200
13 14 13 14 13 14 13 14 13 14 13 14 13 14
(companies)
Outsource to others
Bolster existing plant(s)
Establish new plant(s)
東北 華北 華東 華南 内陸 インド ベトナム
(FY)
2 6 5 6 5 11 2 10 3 4 18 16 15 11 17
18 38 28
88 65
51 38
21 14
54 50 41
33 26 25
37 34
61
52
44 33
31 23
49
37 50
43
0
50
100
150
200
13 14 13 14 13 14 13 14 13 14 13 14 13 14
(companies)
More use of agencies
Bolster existing bases
Start new sales bases
東北 華北 華東 華南 内陸 インド ベトナム
(FY)
Copyright © 2014 JBIC All Rights Reserved.
p.33
Figure 35 : Areas in which to strengthen/expand (sales)
Figure 34 : Areas in which to strengthen/expand (production)
Figure 33 : Medium-term Prospects for
Overseas Operations (China, India & Vietnam)
IV. 17 Countries/Regions/Fields for Strengthening Businesses: (1) China, India & Vietnam
* Figures 34 and 35 summarize the specific efforts by the companies responding
“strengthening/ expansion” in Figure 33 by production and sales. All applicable
answers are included.
Note 1: Figures in the graph are number of responding companies in each country/ region.
Note 2: The figures in the bar graph in Figure 33 are proportions of the companies responding
“strengthen/expand” (unit: percentage).
Strengthen/expand Maintain present level Scale back/withdraw
Vietnam Northeastern China
Northern China
Eastern China
Southern China
Inland China
India
Vietnam Northeastern China
Northern China
Eastern China
Southern China
Inland China
India
Vietnam Northeastern
China
Northern
China
Eastern
China
Southern
China
Inland
China
India
48.4
55.2 50.0
45.1
53.1 52.5 51.3 53.3 51.3
59.8
75.7 73.0
69.6 70.0
0%
20%
40%
60%
80%
100%
13 14 13 14 13 14 13 14 13 14 13 14 13 14
強化・拡大する 現状程度を維持する 縮小・撤退する
(companies)
(FY)
414 375218 204 271 257 243 233 224 207122 125 150 122
Increase in percentage of companies indicating “strengthen/expand” in
Northeastern and Inland China • In the previous survey, there was some loosening in the stance toward strengthening business
in China, and in all five regions, the percentages for “strengthen/expand” fell to around 50%, but
in this year’s survey, “strengthen/expand” percentages increased for Northeastern China and
Inland China (Figure 33). • “Scale back/withdraw” was 2.4% (26 companies) for China as a whole, about the same level as
the previous survey (2.0%, 23 companies). Among them, only 14 companies indicated “transfer
to a third country/separate.” (Reference)
Strengthen/expand stance toward business in India higher than
Indonesia and Vietnam • In India, the percentage of companies responding “strengthen/expand” fell from 75.7% in the
previous survey to 73.0%, but this was still next highest after top ranked Myanmar (77.3%), and
exceeded Indonesia at 70.2% and Vietnam at 70.0%.

4 2 4 4 1 2 4 7 18 24 14 29
7 9 5 6 25 33 35 33
20 25 32
40
76 66
55 46
22 35
16 10
32 28 25 24
16 19
26 24
50 55
62 50
30
36
27 31
0
50
100
150
200
250
13 14 13 14 13 14 13 14 13 14 13 14 13 14 13 14
(companies)
More use of agencies
Bolster existing bases
Start new sales bases
(FY)
4 6 3 1 - 1 4 2 35
24 31 23 9 8 7 7
31 28 34 24 7 7 19
15
159
137 121
90
38 39 32 29
6 2 1 1
- 1 -1
5
8 8
3
2 1 1 1
0
50
100
150
200
250
13 14 13 14 13 14 13 14 13 14 13 14 13 14 13 14
(companies)
Outsource to others
Bolster existing plant(s)
Establish new plant(s)
(FY)
35.141.0
32.4 33.0
21.2
29.2
36.6 35.2
70.864.8
77.8
70.2
45.9
53.450.6 52.1
0%
20%
40%
60%
80%
100%
13 14 13 14 13 14 13 14 13 14 13 14 13 14 13 14
(companies)
(FY)
242 227 198 185256 233 227 219 297 289380 372 154 146222 204
Copyright © 2014 JBIC All Rights Reserved.
p.34 IV. 17. Countries/Regions/Fields for Strengthening Businesses: (2) NIEs3・ASEAN5
* Figures 37 and 38 summarize the specific efforts by the companies responding
“strengthening/ expansion” in Figure 36 by production and sales. All applicable
answers are included.
Note 1: Figures in the graph are number of responding companies in each country/ region.
Note 2: The figures in the bar graph in Figure 36 are proportions of the companies responding
“strengthen/expand” (unit: percentage)
Figure 36 : Medium-term Prospects for
Overseas Operations (NIEs3・ASEAN5)
Figure 38 : Areas in which to strengthen/expand (sales)
Figure 37 : Areas in which to strengthen/expand (production)
Strengthen/expand Maintain present level Scale back/withdraw
Korea Taiwan Hong
Kong
Singapore Thailand
Indonesia Malaysia
Philippines Korea Singapore Taiwan Hong
Kong Thailand
Indonesia
Malaysia
Philippines
Korea Singapore Taiwan Hong
Kong Thailand
Indonesia
Malaysia
Philippines
“Maintain present level” at 60-70% in NIEs3, “strengthen/expand” at over 50% in 4
ASEAN countries • The percentage of companies indicating “strengthen/expand” in the NIEs 3—Korea, Taiwan and
Hong Kong—rose from the previous year, but 60-70% of companies with business operations in the
region intend to maintain present levels over the medium term. In the ASEAN 5, with the exception
of Singapore, over 50% of companies responded “strengthen/expand.” In particular, percentages for
Indonesia (70.2%) and Thailand (64.8%) were high. The Philippines was 52.1% (up 1.5 percentage
points) and has maintained an upward trend since FY2009 (22.3%).
Stance toward strengthening production functions strong in Thailand and
Indonesia • Analyzing strengthen/expand specifics for NIEs 3 and ASEAN 5 reveals that many companies intend
to strengthen existing production basis and, on the sales side, to bolster existing bases and increase
use of agencies. Focusing on production, the number of companies intending to strengthen
production functions in Thailand and Indonesia in particular is striking, and though the figure is lower
than last year, over 20 companies are considering establishing new production bases.

North America
Mexico Brazil EU15 Russia Middle East
Africa Central & Eastern Europe
8 14 10 18 15 12 10 7 2 7 8 6 4 5 3 7
74 69
19
23 29 29 49
42
14 17 18 22
9 18
5 12
51 47
17
19
32 31
34 44
20
24 26 21
23
27
27
26
0
50
100
150
13 14 13 14 13 14 13 14 13 14 13 14 13 14 13 14
(companies)
More use of agencies
Bolster existing bases
Start new sales bases
(FY)
North America
Mexico Brazil EU15 Russia Middle East
Africa Central & Eastern Europe
12 21 24 22 17 12 4 5 4 - 6 5 3 3 5 2
104 84
47 54
32
25 31 30
16 9
13 10 8 3 2 3
6
3
2 2
2
6 1 2
-
-
3 2
1 - - -
0
50
100
150
13 14 13 14 13 14 13 14 13 14 13 14 13 14 13 14
(companies)
Outsource to others
Bolster existing plant(s)
Establish new plant(s)
(FY)
Figure 39: Medium-term Prospects for
Overseas Operations (Americas, Europe, Middle East & Africa)
53.7 52.0
65.3
71.867.1 67.4
37.739.2
45.046.8
64.2
57.5
48.8
60.5
48.1
58.4
0%
20%
40%
60%
80%
100%
13 14 13 14 13 14 13 14 13 14 13 14 13 14 13 14
強化・拡大する 現状程度を維持する 縮小・撤退する
393 373 155 138167 170 284 283 106 106120 109 79 7786 86
(companies)
(FY)
Copyright © 2014 JBIC All Rights Reserved.
p.35 IV. 17. Countries/Regions/Fields for Strengthening Businesses: (3) Americas, Europe, Middle East & Africa
* Figures 40 and 41 summarize the specific efforts by the companies responding
“strengthening/ expansion” in Figure 39 by production and sales. All applicable
answers are included.
Note 1: Figures in the graph are number of responding companies in each country/ region.
Note 2: The figures in the bar graph in Figure 39 are proportions of the companies responding
“strengthen/expand” (unit: percentage)
Figure 41 : Areas in which to strengthen/expand (sales)
Figure 40 : Areas in which to strengthen/expand (production)
Strengthen/expand Maintain present level Scale back/withdraw
North America
Mexico Brazil Central & Eastern Europe
EU15 Russia Middle East
Africa
Mexico rated highly as production base • The stance toward strengthening business in Mexico continued to rise from the previous survey
(65.3%), to 71.8%. Among companies that indicated fields to “strengthen/expand” in production (78
companies), many (54 companies) responded that on the production side they would strengthen
existing bases.
Business strengthen/expand stance in North America unchanged • The stance toward strengthening business in North America fell from the previous survey’s 53.7% to
52.0%, but still a majority of respondent companies are indicating an intention to
“strengthen/expand.” In addition, regarding the fields for strengthening/expansion, compared to the
previous survey, there was an increase in establishment of new bases to respond, both on the
production and sales sides.
Stance toward strengthening/expanding business in the Middle East and
Africa increasing • In this survey, the stance toward strengthening business in the Middle East and Africa rose to nearly
60% in both cases. In both regions, compared to the previous survey, the number of companies
indicating “more use of agencies” and “bolster existing bases” increased on the sales side, which
shows a continued stance of strengthen and expand.

1. Primarily as a sales market:43 companies,
9.3%
2. Primarily as a production base:
96 companies, 20.8%
3. Positioned both as a sales market and production base:323 companies,
69.9%
1. Maintain current scales or
expand in China’s coastal
areas:160 companies,
51.0%
2. Maintain current scales in China’s coastal areas + Expand in other regions
of China/other countries: 121 companies,
38.5%
3. Reduce current scales
in China’s coastal areas +Expand in
other regions of China/
other countries: 19 companies,
6.1%
4. Withdraw from China’s coastal areas + Expand in
other regions of China/other countries:
3 companies, 1.0%
5. Other: 11 companies,
3.5%
1. Maintain current scales or expand in
China’s coastal areas:
45 companies, 47.4%
2. Maintain current scales in China’s coastal areas + Expand in other regions
of China/other countries: 30 companies,
31.6%
3. Reduce current scales in China’s coastal areas +Expand in other regions
of China/other countries: 11 companies,
11.6%
4. Withdraw from China’s coastal areas
+ Expand in other regions of China/other countries:1 company, 1.1%
5. Other:8 companies,
8.4%
Please choose one of the following options that most closely matches your company‘s
opinion on the scale of production in China’s coastal areas over the medium term (next 3
years or so), given the rise in China‘s domestic labor costs etc. in recent years. 1. Maintain or expand the current scale of production in China's coastal areas (i.e. maintain or expand production ratios in coastal areas) 2. Maintain the scale of production in China's coastal areas and expand the scale in other regions of China, or alternatively in other countries. 3. Scale back production in China's coastal areas and expand the scale in other regions of China, or alternatively in other countries. 4. Withdraw from China's coastal areas and expand the scale of production in other regions of China, or alternatively in other countries. 5. Other
Copyright © 2014 JBIC All Rights Reserved.
p.36
(No. of responding companies = 462)
This question is put to those in companies with production bases in
China's coastal areas (who selected the regions of Northern China,
Eastern China and Southern China). Please choose one of the
following options that most closely matches your company's opinion on
the medium-term (next 3 years or so) position of China.
Q Q
Figure 42: China’s Medium Term Position
Figure 43: Forecasts on Scale of Production in China’s Coastal Areas
The number of companies rating China highly as a production base over the medium/long term is over 90% • Of the 462 respondent companies, 96 companies (20.8%) indicated “2. Primarily as a production base,” and 323 companies (69.9%) indicated “3. Positioned both as a sales market and
production base,” so combined, this shows that 90% of total respondent companies rate China highly as a production base.
Regarding prospects for production scale in coastal China, around half of respondents indicated “maintain or expand” production as their
stance, and when looking just at “maintain” production, the percentage was around 80% • Regarding the prospects for production scale in China’s coastal areas, the percentage of companies responding “Primarily as a production base” that then indicated “1. Maintain or expand,”
was 47.4%, and among companies responding “Positioned both as a sales market and production base,” it was 51.0%; moreover considering the stance of “2. Maintain + Expand in other
regions/countries,” the percentages indicating they would maintain production scale in China’s coastal areas were approximately 80% and over 80% respectively. Even with the increases in
wages and other costs, companies indicated that they intended to maintain or expand production in China’s coastal region.
Companies that responded
“Primarily as a production base”
in Figure 42 - 95 companies
Companies that responded
“Positioned both as a sales
market and production base” in
Figure 42 - 314 companies
IV. 18. Approach to Production Scale of Companies Entering China’s Coastal Areas

This question is put to those who answered “2.” – “4.”in Figure 43. Please
select the other regions within China, or countries other than China, as
appropriate from options “1.” – “7.” below. (Multiple responses possible)
Please choose the main reasons that you selected “1. Maintain/expand the scale of
production” in Figure 43 from those below. (Multiple responses possible)
Copyright © 2014 JBIC All Rights Reserved.
p.37
25.0
60.0
25.0
2.5
22.5
7.5
1. Industrial agglomerationsare making progress
2. Existence ofmarkets/customers
3. Improving skills amonglocal labor force
4. Possibility of costreductions
5. Cost competitiveness
6. Other
0 20 40 60 80 100 (%)
13.3
89.2
17.7
8.9
8.9
1.9
1.
2.
3.
4.
5.
6.
0 20 40 60 80 100 (%)
27.3
7.0
59.4
35.0
16.1
9.1
7.7
1.
2.
3.
4.
5.
6.
7.
0 20 40 60 (%)
IV. 19. Preferred Production Locations – China, or Other Countries/Regions
Q Q
Figure 45: Other regions within China, or countries other than China Figure 44: Reasons for replying “1. Maintain/expand the scale of production.”
Companies that replied
“Primarily as a production
base” - 42 companies
Companies that replied
“Positioned as both a sales
market and a production base”
– 143 companies
Companies that replied
“Primarily as a production
base” – 40 companies
Companies that replied
“Positioned both as a sales market
and production base” – 158
companies
The biggest reason for expanding the scale of production in China is because there are customers and markets • In Figure 44, the main reason given for expanding the scale of production in China’s coastal areas was “2. Existence of customers/markets” - 60.0% of respondents who viewed China
“Primarily as a production base” and 89.2% of respondents who replied “Positioned both as a sales market and production base” ranked it as their top reason. Those companies that viewed
China “Primarily as a production base” also assessed other reasons as: “1. Industrial agglomerations are making progress” (25.0%); “3. Improving skills among local labor force” (25.0%);
and “5. Cost competitiveness.” (22.5%)
Expansion mainly in ASEAN countries in the options for “Other regions in China, or other countries” • In Figure 45, "3. ASEAN5" was the most popular answer to alternative locations "In other regions in China, or in other countries" given by those companies that viewed China ”Primarily as a
production base" (45.2%) and those that replied ” Positioned both as a sales market and production base "(59.4%). The second most popular answer was "1. Inland China" (33.3%) for the
former; and "4. Non-ASEAN5 nations" (35.0%) for the latter; with the results for the latter showing a significant trend toward expanding the scale of production in countries outside China,
including ASEAN nations.
33.3
7.1
45.2
26.2
4.8
7.1
4.8
1. Inland China
2. North easternChina
3. ASEAN5
4. Non-ASEAN5nations of ASEAN
5. India
6. Japan
7. Other
0 20 40 60(%)

Figure 46 : Percentage of votes for the impact of respective national/regional affairs on individual countries and regions ※
Copyright © 2014 JBIC All Rights Reserved.
p.38 IV. 20. Recent International Affairs and Attitudes for Business Operations
This question relates to the medium term prospects for business operations (next 3 years or so) made in Figure 32 with regard to the respective countries/regions
where your company currently has, or is planning to have, business operations. Please choose some of the following options listed in [1.] - [9.] if your company
took them into consideration when giving answers on these prospects. (Multiple responses possible)
1.Economic sanctions against Russia 2.Political & diplomatic relations in China and ASEAN Countries
3.Political & diplomatic relations between China and Japan 4.Tapering of quantitative easing (QE) in the USA
5.USA's increasing use of shale gas & oil 6.Political situation in Thailand
7.Policies of Indonesia's new administration 8.Policies of India's new administration
9.Trends in ASEAN economic integration
Q
※ Figures indicate the percentage of respondent companies doing/planning business in each country/region who voted that the respective international affairs had an impact
Companies have a broad awareness of recent political and social affairs in those countries and regions that have strong economic ties
with the countries and regions in which they do (or are planning to do) business; even if such affairs have not actually occurred in the
country/region where they do (or plan to do) business • In Figure 46, looking at political and social situations in the respective countries and regions, we find that a significant percentage of companies answered that when discussing
business prospects they "considered" these situations not only in the countries/regions where the events were actually taking place, but also in countries and regions that had strong
economic ties to them. In particular, companies consider "2. Political & diplomatic relations in China and ASEAN Countries" and "9. Trends in ASEAN economic integration" in
relation to business in NIEs3, China and ASEAN nations; and "1. Economic sanctions in Russia" with regard to operations in Europe as a whole; as well as "4. Reduction in USA's
monetary easing policies,” which is seen as having a wide-ranging impact on Asia, Europe and Central & South America.
(%)
Sin
ga
po
re
Th
aila
nd
Ind
on
esia
Ma
laysia
Ph
ilipp
ine
s
Ind
ia
Vie
tna
m
Cam
bo
dia
La
os
Mya
nm
ar
Oth
ers
Me
xic
o
Bra
zil
Oth
ers
EU
15
Cen
tral &
Ea
ste
rn E
uro
pe
Tu
rke
y
Rest o
f Eu
rop
e &
CIS
1.Economic sanctions against Russia 1.8 0.3 1.5 - 0.7 - - 0.8 - - - - - 3.5 - - 10.0 76.2 80.0 85.7 90.9 100.0 7.1 -
2.Political & diplomatic relations in China and ASEAN Countries 43.9 42.7 28.4 12.6 16.4 32.8 50.0 10.8 66.3 45.5 71.4 41.2 22.2 - - 14.3 10.0 - - - - - - 20.0
3.Political & diplomatic relations between China and Japan 52.6 91.8 6.0 2.0 2.7 4.9 2.1 2.5 5.8 9.1 14.3 5.9 11.1 4.3 - - - 7.1 - - - - - 20.0
4.Tapering of quantitative easing (QE) in the USA 10.5 3.8 4.5 4.9 9.6 8.2 8.3 10.8 4.7 9.1 14.3 17.6 11.1 58.3 88.9 78.6 60.0 26.2 20.0 14.3 - - 28.6 60.0
5.USA's increasing use of shale gas & oil - 1.6 3.0 - 1.4 1.6 2.1 0.8 1.2 - - - 22.2 64.3 44.4 21.4 20.0 7.1 13.3 14.3 9.1 3.5 78.6 40.0
6.Political situation in Thailand 5.3 1.9 16.4 93.1 6.2 8.2 6.3 1.7 5.8 18.2 28.6 11.8 11.1 1.7 11.1 7.1 10.0 2.4 6.7 14.3 9.1 1.8 7.1 20.0
7.Policies of Indonesia's new administration 1.8 0.3 9.0 2.4 80.8 6.6 2.1 0.8 1.2 - - - - - - - 10.0 - - - - - - -
8.Policies of India's new administration - 0.6 4.5 1.6 2.1 - - 93.3 - - - - - - - 7.1 10.0 - - - - - 14.3 -
9.Trends in ASEAN economic integration 31.6 7.3 76.1 34.8 48.6 78.7 68.8 9.2 65.1 90.9 85.7 88.2 55.6 0.9 - - - - - - - 1.8 14.3 -
No. of respondent companies 57 316 67 247 146 61 48 120 86 11 7 17 9 115 18 14 10 42 15 7 11 57 14 5
Latin America
NIE
s3
Chin
a
ASEAN 5 Rest of Asia & Oceania
North
Am
eric
a
Europe
Russia
Mid
dle
Ea
st
Afric
a

0%
50%
100%
Kore
a
Ta
iwan
Hong K
ong
North
-easte
rn C
hin
a
North
ern
Chin
a
Easte
rn C
hin
a
South
ern
Chin
a
Inla
nd C
hin
a
Sin
gapore
Th
aila
nd
Indonesia
Mala
ysia
Philip
pin
es
India
Vie
tnam
Cam
bodia
Laos
Myanm
ar
Oth
ers
North
Am
eric
a
Mexic
o
Bra
zil
Oth
ers
EU
15
Centra
l & E
aste
rn E
uro
pe
Tu
rkey
Rest o
f Euro
pe &
CIS
Russia
Mid
dle
East
Afric
a
凡例・項目貼付用1.施設のキャパシティが足りない
2.施設のクオリティが不十分(費用対効果を含む)
3.キャパシティ及びクオリティともに不十分
Are there any facilities from those listed in 1. - 6. that you would like to see improved in overseas business locations for Japanese employees
(including expatriate staff) who are dispatched there? Please select by individual country/region. (Multiple responses possible)
Figure 47 : Requirements for Living Conditions in Overseas Business Locations
1.3 0.4 - 3.27.4 5.6 4.7
8.20.5 1.3
5.92.0 1.4
29.6
8.216.116.713.6
4.6 2.49.4 7.2 8.1
1.85.5 3.6 1.6
6.6 7.011.7
0
10
20
30
Copyright © 2014 JBIC All Rights Reserved.
(227)(233)(185)
(125)(204) (375) (257) (122)
(219)(372)(289)(204)(146)
(233) (207) (62) (48) (66) (65)
(373)
(170)(138) (62) (283)
(83)
(61)
(106) (77)
NIEs3
China
ASEAN5 Rest of Asia & Oceania
Latin America
Europe
p.39 IV. 21. Requirements for Living Conditions in Overseas Business Locations
Q
Note 1: The figures in the graph represent
the percentage of companies whose
responses indicated that there are
facilities that should be improved; i.e.
the percentage from among the total
number of companies actually doing
business, or planning to do business in
a given country/region.
Note 2: The figures in brackets beneath
each country/region represent the total
number of companies doing business,
or planning to do business, in that
country/region.
(1)
Apartments
for long-
term stay
(2) Hotels
(3)
Shopping
centers
(4)
Hospitals
(5) Schools
(6)
Restaurants
(Japanese
foods etc.)
(109)
(86)
1.8 0.9 0.54.0 3.4
7.2 6.2 8.2-
5.1 5.2 3.4 3.4
17.2
7.211.312.510.6
1.5 2.18.2 7.2
3.2 0.44.6 2.4 1.6 4.7 3.5 6.5
0
10
20
30
1.3 1.3 0.56.4 9.3 10.4 9.3
13.1
0.5 3.8
14.9
4.4 4.1
21.5
9.7 12.910.413.6
3.1 0.38.2 6.5
1.6 1.14.6 4.8 1.6
6.6 3.5 6.5
0
10
20
30
- - - 2.4 1.5 3.7 1.9 3.3 - 1.6 1.4 1.5 2.1
17.6
7.2 6.5 8.3 10.63.1 0.3 2.4 2.9 1.6 -
3.7- - 2.8 1.2 2.6
0
10
20
30
1.3 - 1.6 3.2 2.9 4.5 1.9 3.3 3.2 2.26.2
0.54.1
16.7
5.8 8.1 10.4
19.7
1.5 0.8 2.96.5
1.6 - - 2.4 -6.6 3.5 5.2
0
10
20
30
Reponses rank India No. 1
for each facility - with all in
need of improvement • In Figure 47, we can see that
responses rank India as No.1 for all
facilities; a result that shows the
level of hardship in the country.
• After India, the overall response
rate was quite high for some
ASEAN countries such as Myanmar,
Laos, Cambodia and Vietnam.
1.8 1.7 1.18.0 6.9 7.5 7.4 10.7
3.7 4.3
13.8
1.55.5
24.9
9.7 9.7 12.516.7
4.6 1.38.8 7.2 4.8 1.8 2.8 2.4 -
3.8 5.8 9.1
0
10
20
30(%)

Are there any facilities from those listed in 1. - 6. that you would like to see improved in overseas business locations for Japanese employees (including expatriate
staff) who are dispatched there? If you find any inadequacy, please select from options [1.] - [3.] below by individual countries/regions. (Multiple responses possible)
0%
50%
100%
North
-easte
rn
Chin
a
North
ern
Chin
a
Easte
rn C
hin
a
South
ern
Chin
a
Inla
nd C
hin
a
Thaila
nd
Indonesia
India
Vie
tnam
Myanm
ar
North
Am
eric
a
Mexic
o
Bra
zil
Russia
凡例・項目貼付用1. Insufficient capacity of facilities
2. Inadequate quality of facilities (incl. cost effectiveness)
3. Both capacity and quality of facilities are inadequate
0%
50%
100%(4) (15) (21) (12) (10) (5) (17) (69) (17) (9) (9) (16) (10) (7)
100
50
0
0%
50%
100%(5) (7) (27) (16) (10) (19) (15) (40) (15) (7) (8) (14) (10) (5)
100
50
0
0%
50%
100%(8) (19) (39) (24) (16) (14) (43) (50) (20) (9) (1) (14) (9) (7)
100
50
0
0%
50%
100%(3) (3) (14) (5) (4) (6) (4) (41) (15) (7) (1) (4) (4) (3)
100
50
0
0%
50%
100%(4) (6) (17) (5) (4) (8) (18) (39) (12) (13) (3) (5) (9) (7)
100
50
0
0%
50%
100%
North
-easte
rn C
hin
a
North
ern
Chin
a
Easte
rn C
hin
a
South
ern
Chin
a
Inla
nd C
hin
a
Th
aila
nd
Indonesia
Ind
ia
Vie
tna
m
Myanm
ar
North
Am
eric
a
Mexic
o
Bra
zil
Russia
凡例・項目貼付用1. Insufficient capacity of facilities
2. Inadequate quality of facilities (incl. cost effectiveness)
3. Both capacity and quality of facilities are inadequate
0%
50%
100%(10) (14) (28) (19) (13) (16) (40) (58) (20) (11) (5) (15) (10) (4)
100
50
0
(%)
Copyright © 2014 JBIC All Rights Reserved.
China
p.40
(2) Hotels
(3)
Shopping
centers
(4)
Hospitals
(5) Schools
Note 1: A breakdown of the responses given by companies who answered that there are facilities that should be improved by country/region in Figure 47 on the previous page
Note 2 : The figures in brackets above each bar in the graph indicate the number of companies that responded there should be improvements in that facility in a given
country/region
Q
Strong views that India’s
facilities are lacking both
in capacity and quality,
and that quality in
Eastern China is
inadequate • China aside, generally ratios were
high for “3. Both capacity and
quality of facilities are inadequate”
in India, Indonesia, Vietnam,
Mexico and Myanmar. Meanwhile,
“2. Inadequate quality of facilities”
showed high ratios in Brazil and
Russia.
• With regard to China, in Northern
China and Eastern China (both
regions where Japanese
companies have made
considerable in-roads) a lot of
responses cited “2. Inadequate
quality of facilities.” Meanwhile in
both Southern China and Inland
China, there was a comparatively
large response rate for “3. Both
capacity and quality of facilities
are inadequate.”
(1)
Apartments
for long-
term stay
(6)
Restaurants
(Japanese
foods etc.)
IV. 21. Requirements for Living Conditions in Overseas Business Locations
0%
50%
100%
North
easte
rn
Chin
a
North
ern
Chin
a
Easte
rn C
hin
a
South
ern
Chin
a
Inla
nd C
hin
a
Thaila
nd
Indonesia
India
Vie
tnam
Myanm
ar
North
Am
eric
a
Mexic
o
Bra
zil
Russia
凡例・項目貼付用1. Insufficient capacity of facilities
2. Inadequate quality of facilities (incl. cost effectiveness)
3. Both capacity and quality of facilities are inadequate
Figure 48 : Requirements for Living Conditions in Overseas Business Locations
(Top 10 Most Promising Countries over the Medium Term)

Copyright © 2014 JBIC All Rights Reserved.
Ⅴ. Competitiveness of Japanese Manufacturing Companies
and Trends in Global Production Systems
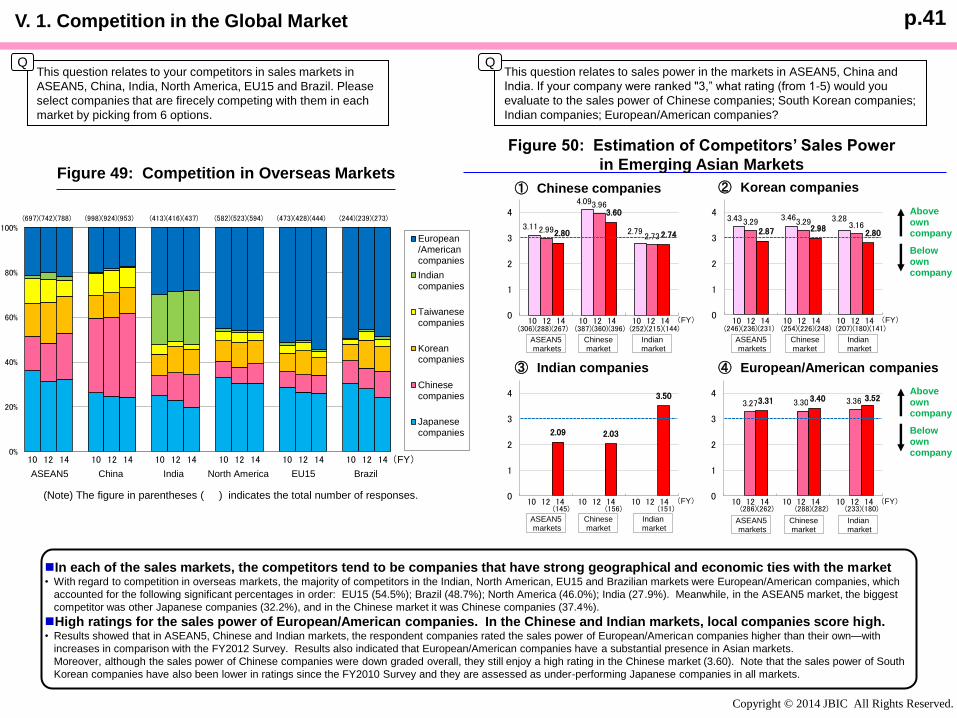
3.11
4.09
2.79 2.99
3.96
2.73 2.80
3.60
2.74
0
1
2
3
4
10 12 14 10 12 14 10 12 14(306)(288)(267) (387)(360)(396) (252)(215)(144)
ASEAN5 markets
Chinese market
Indian market
3.43 3.46 3.28 3.29 3.29 3.16 2.87 2.98
2.80
0
1
2
3
4
10 12 14 10 12 14 10 12 14(246)(236)(231) (254)(226)(248) (207)(180)(141)
ASEAN5 markets
Chinese market
Indian market
2.09 2.03
3.50
0
1
2
3
4
10 12 14 10 12 14 10 12 14(145) (156) (151)
ASEAN5 markets
Chinese market
Indian market
3.27 3.30 3.36 3.31 3.40 3.52
0
1
2
3
4
10 12 14 10 12 14 10 12 14(286)(262) (288)(282) (233)(180)
ASEAN5 markets
Chinese market
Indian market
Copyright © 2014 JBIC All Rights Reserved.
③ Indian companies ④ European/American companies
① Chinese companies ② Korean companies
p.41 V. 1. Competition in the Global Market
0%
20%
40%
60%
80%
100%
10 12 14 10 12 14 10 12 14 10 12 14 10 12 14 10 12 14
European/Americancompanies
Indiancompanies
Taiwanesecompanies
Koreancompanies
Chinesecompanies
Japanesecompanies
ASEAN5 China India North America BrazilEU15
(697)(742)(788) (998)(924)(953) (413)(416)(437) (582)(523)(594) (473)(428)(444) (244)(239)(273)
(Note) The figure in parentheses ( ) indicates the total number of responses.
This question relates to your competitors in sales markets in
ASEAN5, China, India, North America, EU15 and Brazil. Please
select companies that are firecely competing with them in each
market by picking from 6 options.
Q
Figure 49: Competition in Overseas Markets
This question relates to sales power in the markets in ASEAN5, China and
India. If your company were ranked "3,” what rating (from 1-5) would you
evaluate to the sales power of Chinese companies; South Korean companies;
Indian companies; European/American companies?
Q
Figure 50: Estimation of Competitors’ Sales Power
in Emerging Asian Markets
In each of the sales markets, the competitors tend to be companies that have strong geographical and economic ties with the market • With regard to competition in overseas markets, the majority of competitors in the Indian, North American, EU15 and Brazilian markets were European/American companies, which
accounted for the following significant percentages in order: EU15 (54.5%); Brazil (48.7%); North America (46.0%); India (27.9%). Meanwhile, in the ASEAN5 market, the biggest
competitor was other Japanese companies (32.2%), and in the Chinese market it was Chinese companies (37.4%).
High ratings for the sales power of European/American companies. In the Chinese and Indian markets, local companies score high. • Results showed that in ASEAN5, Chinese and Indian markets, the respondent companies rated the sales power of European/American companies higher than their own—with
increases in comparison with the FY2012 Survey. Results also indicated that European/American companies have a substantial presence in Asian markets.
Moreover, although the sales power of Chinese companies were down graded overall, they still enjoy a high rating in the Chinese market (3.60). Note that the sales power of South
Korean companies have also been lower in ratings since the FY2010 Survey and they are assessed as under-performing Japanese companies in all markets.
Aboveowncompany
Belowowncompany
Aboveowncompany
Belowowncompany
(FY)
(FY) (FY)
(FY) (FY)

Figure 51: Current Main Delivery (Sales) Destination and Changes
in Delivery Volumes over the Medium Term (Reference) Break-down by Industry of Changes in Delivery Volumes over the Medium Term
Copyright © 2014 JBIC All Rights Reserved.
[Automobiles]
[Chemicals]
[Electrical Equipment & Electronics]
[General Machinery]
p.42 V. 2. Local Production and Delivery (Sales) within Asia - Current and Future
This question is for those in companies with production bases in NIEs3, China, ASEAN, or India. Please indicate the main delivery (sales) destination
(countries/regions) to which the goods manufactured in each of your production bases (factories) are currently delivered (sold). Then please mark those
countries/regions where you expect delivery volumes to increase over the medium term (next 3 years or so) with a “+”, and those where you expect delivery
volumes to decrease with a “-”. Please leave blank if you expect no change and mark with a “+” if you expect to add it as a new delivery destination.
Q
[Current Main Delivery (Sales) Destination]
[Changes in Delivery Volumes over the Medium Term]
Expansion in local production/deliveries with the focus on China and ASEAN,
and plans to increase overseas deliveries from Japan • According to Figure 51, trends in basic business models (whereby production and deliveries are
localized in each individual country/region) will remain unchanged over the medium term; but increases
in deliveries are expected in countries and regions out-with those where production bases are located.
• In terms of the number of respondent companies by country and region, those with the largest number
were China, Japan and ASEAN in that order. Looking at medium term changes in delivery volumes, the
number of companies that answered there would be an increase in products made in China "being
delivered in China" was 265; while 211 companies responded that there would be an increase in
products made in ASEAN "being delivered in ASEAN." This indicates that companies plan to increase
local production and deliveries; particularly within China and the ASEAN region.
• As regards products made in Japan, only 94 companies replied that they would be increasing "deliveries
within Japan,” while conversely 83 companies anticipated a fall in deliveries. However results for the
number of companies replying that they would increase deliveries overseas were as follows: to China -
87 companies; to ASEAN - 99 companies; and to Europe/America - 76 companies.
• Looking at the 83 companies who responded that they anticipated a fall in "deliveries within Japan" by
industry, we find that the automobiles industry accounted for 31 companies - indicating differing attitudes
depending on the industry (reference).
(companies)
Japan NIEs3 China ASEAN IndiaEurope
/America
Japan (438) 420 171 201 200 88 199
NIEs3 (148) 42 132 50 37 12 23
China (441) 188 76 401 109 29 100
ASEAN (360) 160 59 75 306 48 109
India (128) 12 5 6 7 114 13
Main Delivery (Sales) Destination
Pro
du
ctio
n
Ba
se
s
No. of respondent
companies
(companies)
+ - + - + - + - + - + -Japan 94 -83 69 -20 87 -36 99 -29 55 -10 76 -27
NIEs3 10 -1 48 -6 29 -2 21 -1 12 0 14 -1
China 78 -24 44 -8 265 -7 74 -15 29 -3 57 -13
ASEAN 76 -10 38 -1 56 -2 211 -6 41 -1 77 -2
India 6 0 3 0 7 0 16 0 76 -1 12 -1
Pro
du
ctio
n
Ba
se
s
Main Delivery (Sales) Destination
Japan NIEs3 China ASEAN India Europe /America
(companies)
+ - + - + - + - + - + -Japan 15 -31 4 -1 9 -6 5 -8 4 -2 4 -11
NIEs3 2 0 10 -3 3 -1 1 0 2 0 2 0
China 15 -9 2 -1 67 -1 7 -3 3 -1 11 -4
ASEAN 14 -4 4 0 6 0 51 -1 5 0 14 -1
India 2 0 1 0 3 0 4 0 35 0 6 0
Europe /America
Pro
du
ctio
n
Ba
se
s
Main Delivery (Sales) Destination
Japan NIEs3 China ASEAN India
(companies)
+ - + - + - + - + - + -Japan 12 -6 9 -2 18 -4 15 -3 12 -1 13 -2
NIEs3 0 0 4 -1 5 0 5 0 3 0 2 0
China 18 -3 11 -2 40 -2 13 -3 9 -1 14 -2
ASEAN 16 -1 9 -1 11 0 25 -2 9 0 17 0
India 1 0 0 0 1 0 2 0 3 -1 0 0
Europe /America
Pro
du
ctio
n
Ba
se
s
Main Delivery (Sales) Destination
Japan NIEs3 China ASEAN India
(companies)
+ - + - + - + - + - + -Japan 16 -8 12 -5 13 -7 24 -3 13 0 13 -3
NIEs3 3 0 13 -1 6 0 3 -1 1 0 2 0
China 12 0 5 -2 37 0 12 0 4 0 7 0
ASEAN 8 0 9 0 11 -1 36 -1 7 0 9 0
India 1 0 0 0 0 0 6 0 13 0 3 -1
Europe /America
Pro
du
ctio
n
Ba
se
s
Main Delivery (Sales) Destination
Japan NIEs3 China ASEAN India
(companies)
+ - + - + - + - + - + -Japan 12 -5 11 -4 8 -6 15 -4 7 -3 10 -2
NIEs3 1 -1 6 -1 4 -1 4 0 2 0 2 -1
China 4 -1 5 -1 23 -1 10 -2 4 0 1 -3
ASEAN 9 0 1 0 4 0 16 -1 6 0 8 -1
India 0 0 1 0 1 0 0 0 4 0 1 0
Europe /America
Pro
du
ctio
n
Ba
se
s
Main Delivery (Sales) Destination
Japan NIEs3 China ASEAN India

38.1
37.5
8.1
5.3
27.5
1. Expansion of division oflabor in production within
the ASEAN region
2. Expansion of division oflabor in production
betwteen ASEAN & China
3. Expansion of division oflabor in production
between ASEAN & India
4. Expansion of division oflabor in production
betwteen China & India
5. Production completedwithin each country
0 20 40 60 (%)
Having the prospect:360 companies, 65.9%
Not having the prospect: 186 companies, 34.1%
What are your company‘s medium term (next 3 years or so) plans
for dividing your production system in Asia?
Copyright © 2014 JBIC All Rights Reserved.
p.43 V. 3. Prospect for Division of Labor in Production System in Asia
Companies that responded
they have the prospect
360 companies - 65.9%
Q
Figure 52: Prospect for Division of Labor in Production System in Asia
(No. of responding companies = 546)
(1) All industries
(2) Responses in Major Industries
① Automobiles
(74 companies)
② Electrical Equipment &
Electronics (56 companies)
③ Chemicals
(49 companies)
④ General Machinery (37 companies)
Looking at companies which have prospect for division of labor in their production systems in Asia by industry, in the electrical equipment &
electronics industry a large number of companies responded that they plan to develop “expansion of division of labor in production between
ASEAN and China.” • 65.9% of companies surveyed indicated that they have prospects for the division of labor in their production systems within Asia in place, and results show that overall, 38.1% of respondents
intend to develop "expansion of division of labor in production within the ASEAN region," while 37.5% plan to proceed with "expansion of division of labor in production between ASEAN and
China." Note that the expansion of division of labor in production between ASEAN & India, and China & India stayed at the low rates of 8.1% and 5.3%, respectively.
• The electrical equipment & electronics industry indicated plans to split production between ASEAN and China, with 51.8% of respondents stating that they plan a “expansion of division of labor in
production between ASEAN and China”; a level that was relatively high compared to other industries. One of the factors for this is thought to be that, compared to China, production sites in the
ASEAN region have a head start in miniaturized semi-conductors, small motors and other electronic components and have developed the modularization of such products. Consequently, these
ASEAN sites are expected to partially supply growing demand for parts in China, as well as demand from other sites established in ASEAN as part of China Plus One strategies.
(Note) Multiple responses possible
23.2
51.8
5.4
10.7
23.2
1.
2.
3.
4.
5.
0 20 40 60 (%)
51.4
29.7
8.1
2.7
16.2
1.
2.
3.
4.
5.
0 20 40 60 (%)
36.7
32.7
4.1
10.2
26.5
1.ASEAN域内の
生産分業が進展
2.ASEAN・中国間の
生産分業が進展
3.ASEAN・インド間の
生産分業が進展
4.中国・インド間の
生産分業が進展
5.国毎に完結
0 20 40 60 (%)
44.6
31.1
14.9
4.1
32.4
1. Expansion of division oflabor in production within the
ASEAN region
2. Expansion of division oflabor in production betwteen
ASEAN & China
3. Expansion of division oflabor in production between
ASEAN & India
4. Expansion of division oflabor in production betwteen
China & India
5. Production completedwithin each country
0 10 20 30 40 50 60(%)
44.6
31.1
14.9
4.1
32.4
1.ASEAN域内の
生産分業が進展
2.ASEAN・中国間の
生産分業が進展
3.ASEAN・インド間の
生産分業が進展
4.中国・インド間の
生産分業が進展
5.国毎に完結
0 20 40 60 (%)
44.6
31.1
14.9
4.1
32.4
1. Expansion of division oflabor in production within the
ASEAN region
2. Expansion of division oflabor in production betwteen
ASEAN & China
3. Expansion of division oflabor in production between
ASEAN & India
4. Expansion of division oflabor in production betwteen
China & India
5. Production completedwithin each country
0 10 20 30 40 50 60(%)

What are the current and long-term (next 5 years or so) roles that you expect of production bases (factories) you have in the
following 5 countries/regions: Japan, China, ASEAN, India and Europe & America? Please select and circle the answers that most
closely match your company’s view from 1. - 5. below. (Multiple responses possible)
(Options)
1. Top-runner base with state-of-the-art production facilities
2. Product (process) innovation hub
3. Production base for core components, etc.
4. Base that can respond to a wide variety of market demands (i.e., to produce multiple products)
5. Base for human resource training and skills transfer
Copyright © 2014 JBIC All Rights Reserved.
V. 4. Domestic and Overseas Production Bases - Trends in the Division of Roles p.44
Q
Figure 53: Role of Production Bases (No. of responding companies = 538)
Current
Long term
Results showed that production bases in Japan continue to fulfill important roles as top-runner bases, innovation hubs and human resource
training bases. • Figure 53 shows that Japan is an important base of operations—both currently and in the long term. Around 60% of respondent companies selected Japan as a base for top-runner
operations, innovation and human resource training. Results also showed that a relatively high proportion of non-Japanese production sites are already regarded as bases that respond to
variety of market demands—a result that seems to be due to the increase in close-to-market production.
Production sites in China and ASEAN are used as production bases for core components, as well as bases that can respond to a wide variety
of market demands. • Results showed that over the long term, production sites in Japan are being used less to respond to wide-ranging market demands and for core component production; On the other hand the
reverse is true of sites in China and ASEAN, where these roles are of growing importance. As companies continue to develop their businesses in China and ASEAN, it seems that some of
the roles traditionally fulfilled by Japanese production bases will be transferred there.
6.9
8.2
19.7
26.6
5.9
9.9
14.3
21.6
36.6
13.8
1.
2.
3.
4.
5.
0 20 40 60 80 (%)
7.2
5.9
16.2
27.7
5.6
12.3
13.6
24.5
36.6
15.2
1.
2.
3.
4.
5.
0 20 40 60 80 (%)
0.4
1.9
4.1
7.4
1.1
1.1
3.7
6.5
11.3
1.9
1.
2.
3.
4.
5.
0 20 40 60 80 (%)
8.0
8.6
9.7
13.0
6.5
9.9
12.3
10.6
16.0
10.2
1.
2.
3.
4.
5.
0 20 40 60 80 (%)
※See Appendix 9 for Responses in Major Industries of Figures 53.
63.8
65.4
48.3
45.7
68.8
59.3
63.9
40.7
39.4
66.9
1. Top runner base
2. Innovation hub
3. Core componentproduction base
4. Base able torespond to a variety of
demands
5. Human resourcetraining base
0 20 40 60 80 (%)
63.8
65.4
48.3
45.7
68.8
59.3
63.9
40.7
39.4
66.9
1. Top runner base
2. Innovation hub
3. Core componentproduction base
4. Base able torespond to a variety
of demands
5. Human resourcetraining base
0 20 40 60 80 (%)
(1) Japan (2) China (3) ASEAN (4) India (5) Europe & America

Copyright © 2014 JBIC All Rights Reserved.
p.45 V. 5. Research & Development Bases in Japan and Abroad - Trends in the Division of Roles
What are the current and long-term (next 5 years or so) roles that you expect of R&D bases you have in the following 5 countries/regions : Japan,
China, ASEAN, India, Europe & America? Please select the answers that most closely match your company’s view from 1. - 3. below. (Multiple
responses possible)
1. Basic Research: Empirical research that is undertaken for the purpose of forming hypotheses and theories and discovering new knowledge
regarding observable facts
2. Applied Research: Research that explores how to use the knowledge discovered in basic research for practical possibilities and new applications
3. Development Research: Research that introduces or improves new materials, devices, products, systems and processes, etc., using the
knowledge obtained through basic and applied research, etc.
Q
Figure 54: The Role of R&D Bases (No. of responding companies = 507)
(1) Japan (2) China (3) ASEAN (4) India (5) Europe & America
Current
Long term
Over 70% of respondent companies replied that Japan would play a role in all forms of research: basic, applied and development • The proportion of respondent companies that cited Japan as the hub for their current R&D activities was as follows: basic research - 76.3%; applied research - 75.3%; development research
- 87.8%. This shows that Japan is the center of R&D. Results also indicated virtually no changes in these percentages over the long-term, which leads us to believe that Japan will continue
to play a central role in all forms of research - basic, applied and development.
In the long-term, R&D bases in China, ASEAN and Europe & America will be used for “Development Research” stage • Results showed that at present there are only a few R&D activities conducted outside of Japan. However, there is some basic, applied and development R&D carried out in Europe & America,
and the proportion is expected to increase a little over the long-term. Moreover, in the long-term around 20% of companies replied that they would be conducting “Development Research” in
the following countries: China (20.3%); Europe & America (19.9%); and ASEAN (18.5%). This, presumably, is to put the focus on R&D in locations close to the markets so that companies
can introduce products that meet market demands.
76.3
75.3
87.8
72.4
72.6
86.2
1. Basic Research
2. Applied Research
3. DevelopmentResearch
0 20 40 60 80 100 (%)
5.1
5.9
9.5
4.7
14.0
20.3
1.
2.
3.
0 20 40 60 80 100(%)
1.6
2.2
1.8
1.6
4.7
4.7
1.
2.
3.
0 20 40 60 80 100 (%)
3.6
5.5
7.1
4.9
12.2
18.5
1.
2.
3.
0 20 40 60 80 100 (%)
8.3
10.7
16.6
9.7
13.6
19.9
1.
2.
3.
0 20 40 60 80 100 (%)
※See Appendix 10 for Responses in Major Industries of Figures 54.

46 companies, 13.2%
15 companies, 4.3%
89 companies, 25.5%
37 companies, 10.6%
130 companies, 37.2%
32 companies, 9.2%
39 companies, 29.3%
8 companies, 6.0%29 companies,
21.8%
12 companies, 9.0%
33 companies, 24.8%
12 companies, 9.0%
16 companies, 18.2%
7 companies, 8.0%
27 companies, 30.7%
6 companies, 6.8%
24 companies, 27.3%
8 companies, 9.1%
14 companies, 18.7%
2 companies, 2.7%
19 companies, 25.3%
6 companies, 8.0%
29 companies, 38.7%
5 companies, 6.7%
6 companies, 7.3%
6 companies, 7.3%
24 companies, 29.3%
10 companies, 12.2%
29 companies, 35.4%
7 companies, 8.5%
15 companies, 32.6%
0 companies, 0.0%7 companies,
15.2%
3 companies, 6.5%
18 companies, 39.1%
3 companies, 6.5%
Copyright © 2014 JBIC All Rights Reserved.
p.46 V. 6. Current Situation of R&D Bases in Japan
Please select one of the options below that best describes your current situation with regard to R&D bases in Japan for your company. 1. There is a progressive decline in domestic R&D capabilities due to a lack of management resources (such as human resources and capital ) 2. There is a progressive decline in domestic R&D capabilities due to the fact that more management resources (such as human resources and capital) are being allocated to R&D bases abroad 3. There is a clearer distinction between the roles of domestic R&D bases and those abroad 4. Domestic R&D capabilities are improving thanks to progress in the global exchange of personnel 5. Domestic R&D capabilities are improving due to the fact that more management resources (such as human resources and capital) are being allocated to R&D bases in Japan 6. Other
Q
Figure 55: Current Situation of R&D Bases
in Japan
(No. of responding companies = 483)
(1) All industries
(2) Major Industries
① Automobiles
(88 companies)
② Electrical Equipment &
Electronics (75 companies)
③ Chemicals
(82 companies)
④ General Machinery (46 companies)
① Large Corporations (349 companies)
② Mid-tier Firms/SMEs (133 companies)
43.8% of respondent companies report improvements in R&D capabilities within Japan; but contributions from the global exchange of human
resources are limited • 33.7% of respondent companies chose option 5 "Domestic R&D capabilities are improving due to the fact that more management resources (such as human resources and capital) are being
allocated to R&D bases in Japan"; while only 10.1% selected option 4 "Domestic R&D capabilities are improving thanks to progress in the global exchange of personnel"; indicating that the
global exchange of human resources is only making a limited contribution to R&D in Japan.
• In addition 29.3% of respondents in mid-tier firms/SMEs chose “1. There is a progressive decline in domestic R&D capabilities due to a lack of management resources (such as human
resources and capital )"; a figure that was relatively high compared to large corporations, indicating that a lack of management resources for R&D is an issue for SME.
• Note that while 24.6% of respondent companies chose the option 3 “There is a clearer distinction between the roles of domestic R&D bases and those abroad,” looking answers to the
questions in Figure 54 given by these same companies, we find that around 70% of them reported that basic, applied and development research will take place in Japan. This shows that
although such companies may distinguish between roles, they continue to conduct R&D mainly in Japan.
(3) Size of Company
1. Insufficient resources +decline in domestic R&D
2. Overseas allocation up +decline in domestic R&D
3. Roles divided
4. Global exchange of personnel+ improvement in domestic R&D
5. Sufficient resources +improvement in domestic R&D
6. Other
1. Insufficient resources +decline in domestic R&D
2. Overseas allocation up +decline in domestic R&D
3. Roles divided
4. Global exchange of personnel+ improvement in domestic R&D
5. Sufficient resources +improvement in domestic R&D
6. Other
1. Insufficient resources + decline in domestic R&D:
85 companies, 17.6%
2. Overseas allocation up +
decline in domestic R&D:
23 companies, 4.8%
3. Roles divided: 119 companies,
24.6%
4. Global exchange of personnel + improvement in domestic R&D:
49 companies, 10.1%
5. Sufficient resources +
improvement in domestic R&D: 163 companies,
33.7%
6. Other: 44 companies, 9.1%

Copyright © 2014 JBIC All Rights Reserved.
Ⅵ. Involvement of Japanese Manufacturing Companies
in Overseas Infrastructure-related Business
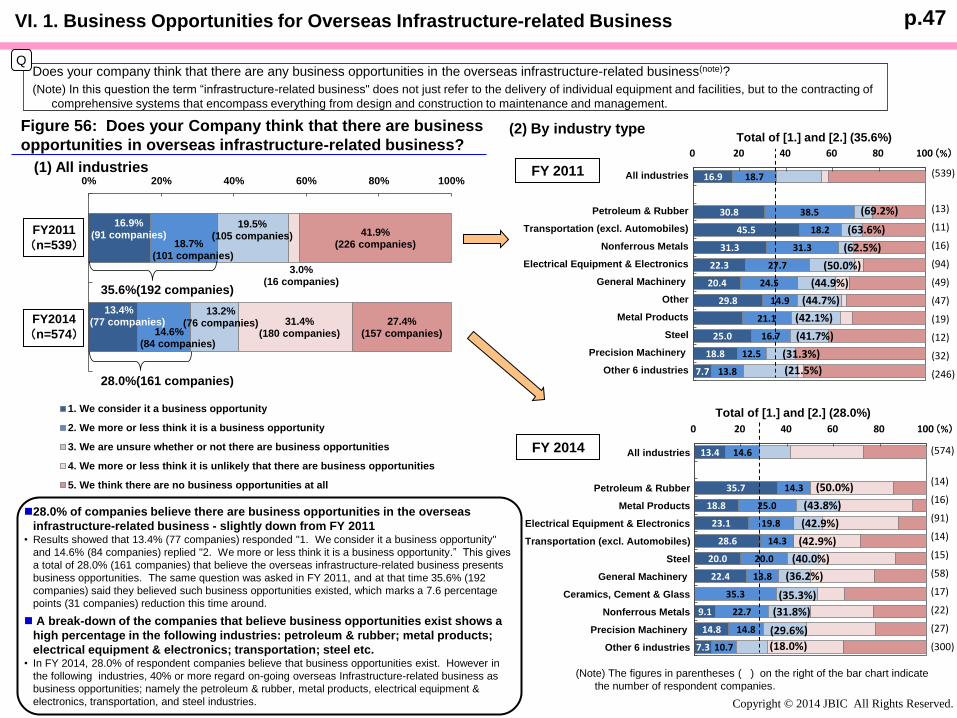
16.9%(91 companies)
13.4%(77 companies)
18.7%(101 companies)
14.6%(84 companies)
19.5%(105 companies)
13.2%(76 companies)
3.0%(16 companies)
31.4%(180 companies)
41.9%(226 companies)
27.4%(157 companies)
0% 20% 40% 60% 80% 100%
FY2011
(n=539)
FY2014
(n=574)
1. We consider it a business opportunity
2. We more or less think it is a business opportunity
3. We are unsure whether or not there are business opportunities
4. We more or less think it is unlikely that there are business opportunities
5. We think there are no business opportunities at all
35.6%(192 companies)
28.0%(161 companies)
Figure 56: Does your Company think that there are business
opportunities in overseas infrastructure-related business?
Copyright © 2014 JBIC All Rights Reserved.
(1) All industries
(2) By industry type
p.47
28.0% of companies believe there are business opportunities in the overseas
infrastructure-related business - slightly down from FY 2011 • Results showed that 13.4% (77 companies) responded "1. We consider it a business opportunity"
and 14.6% (84 companies) replied "2. We more or less think it is a business opportunity.” This gives
a total of 28.0% (161 companies) that believe the overseas infrastructure-related business presents
business opportunities. The same question was asked in FY 2011, and at that time 35.6% (192
companies) said they believed such business opportunities existed, which marks a 7.6 percentage
points (31 companies) reduction this time around.
A break-down of the companies that believe business opportunities exist shows a
high percentage in the following industries: petroleum & rubber; metal products;
electrical equipment & electronics; transportation; steel etc. • In FY 2014, 28.0% of respondent companies believe that business opportunities exist. However in
the following industries, 40% or more regard on-going overseas Infrastructure-related business as
business opportunities; namely the petroleum & rubber, metal products, electrical equipment &
electronics, transportation, and steel industries.
VI. 1. Business Opportunities for Overseas Infrastructure-related Business
Does your company think that there are any business opportunities in the overseas infrastructure-related business(note)?
(Note) In this question the term “infrastructure-related business" does not just refer to the delivery of individual equipment and facilities, but to the contracting of
comprehensive systems that encompass everything from design and construction to maintenance and management.
Q
(Note) The figures in parentheses ( ) on the right of the bar chart indicate
the number of respondent companies.
FY 2011
FY 2014
Total of [1.] and [2.] (28.0%)
13.4
35.7
18.8
23.1
28.6
20.0
22.4
9.1
14.8
7.3
14.6
14.3
25.0
19.8
14.3
20.0
13.8
35.3
22.7
14.8
10.7
0 50 100
All industries
Petroleum & Rubber
Metal Products
Electrical Equipment & Electronics
Transportation (excl. Automobiles)
Steel
General Machinery
Ceramics, Cement & Glass
Nonferrous Metals
Precision Machinery
Other 6 industries
(%)
1. 商機だと思う 2. どちらかといえば商機だと思う
3. どちらともいえない 4. どちらかといえば商機だと思わない
5. 全く商機だと思わない
(574)
(14)
(16)
(91)
(14)
(15)
(58)
(17)
(22)
(27)
(300)
「1.」と「2.」の合計 (28.0%)
(50.0%)
(43.8%)
(42.9%)
(42.9%)
(29.6%)
(31.8%)
(40.0%)
(35.3%)
(36.2%)
(18.0%)
16.9
30.8
45.5
31.3
22.3
20.4
29.8
25.0
18.8
7.7
18.7
38.5
18.2
31.3
27.7
24.5
14.9
21.1
16.7
12.5
13.8
0 20 40 60 80 100
全業種
石油・ゴム製品
輸送機(自動車を除く)
非鉄金属
電機・電子
一般機械
その他
金属製品
鉄鋼
精密機械
他 6業種
(%)
1. 商機だと思う 2. どちらかといえば商機だと思う
3. どちらともいえない 4. どちらかといえば商機だと思わない
5. 全く商機だと思わない
(539)
(13)
(11)
(16)
(94)
(49)
(47)
(19)
(12)
(32)
(246)
「1.」と「2.」の合計 (35.6%)
(69.2%)
(63.6%)
(50.0%)
(62.5%)
(31.3%)
(41.7%)
(44.9%)
(42.1%)
(44.7%)
(21.5%)
Total of [1.] and [2.] (35.6%)
16.9
30.8
45.5
31.3
22.3
20.4
29.8
21.1
25.0
18.8
7.7
18.7
38.5
18.2
31.3
27.7
24.5
14.9
21.1
16.7
12.5
13.8
0 50 100
All industries
Petroleum & Rubber
Transportation (excl. Automobiles)
Nonferrous Metals
Electrical Equipment & Electronics
General Machinery
Other
Metal Products
Steel
Precision Machinery
Other 6 industries
(%)
1. 商機だと思う 2. どちらかといえば商機だと思う
3. どちらともいえない 4. どちらかといえば商機だと思わない
5. 全く商機だと思わない
13.4
35.7
18.8
23.1
28.6
20.0
22.4
9.1
14.8
7.3
14.6
14.3
25.0
19.8
14.3
20.0
13.8
35.3
22.7
14.8
10.7
0 20 40 60 80 100 (%)
1. 商機だと思う 2. どちらかといえば商機だと思う
3. どちらともいえない 4. どちらかといえば商機だと思わない
5. 全く商機だと思わない
(574)
(14)
(16)
(91)
(14)
(15)
(58)
(17)
(22)
(27)
(300)
(50.0%)
(43.8%)
(42.9%)
(42.9%)
(29.6%)
(31.8%)
(40.0%)
(35.3%)
(36.2%)
(18.0%)

(companies)
2014 2011 2014 2011 2014 2011 2014 2011 2014 2011
All industries 56 116 51 58 48 64 46 70 46 54
Petroleum & Rubber 0 4 2 3 2 2 2 0 3 2
Metal Products 4 9 1 3 1 4 0 3 1 3
Electrical Equipment & Electronics 21 33 13 12 14 10 10 13 6 6
Transportation (excl. Automobiles) 0 1 4 4 3 3 2 4 1 3
Steel 2 2 4 3 3 4 4 3 3 3
General Machinery 3 8 8 5 4 5 9 10 7 6
Ceramics, Cement & Glass 3 4 1 0 1 1 0 1 3 0
Nonferrous Metals 4 9 2 4 3 6 1 0 4 1
Precision Machinery 2 5 2 1 2 3 4 2 2 2
Other 6 industries 17 41 14 23 15 26 14 34 16 28
Photovoltaic
power
generation
Urban
railways, etc.
High-speed
railways
Sewage
systems
Roads and
bridges
Copyright © 2014 JBIC All Rights Reserved.
p.48
Photovoltaic power generation remains the No. 1 field of interest; with railway-related fields emerging in 2nd and 3rd place • When questioned about fields of interest, the field that had the most respondent companies was photovoltaic power generation; however, in comparison to the previous survey of FY 2011,
the number of respondent companies fell by approximately a half (116 companies in FY 2011 → 56 companies in FY 2014). If we look at those fields of interest ranked 2nd place and lower,
we find that urban railways, high-speed railways, roads and bridges, and wind-power generation all improved their rankings; while the positions of water supply, sewerage systems, and
smart grids all fell (Figure 57 (1))
Significant declines in the interest in photovoltaic power generation in electrical equipment & electronics • Figure 57(2) shows trends in the major industries’ responces in the top 5 fields of interest. Looking at these trends and at the respondent companies with an interest in photovoltaic power
generation, we see a fall in interest across a number of industries, including a reduction of 12 companies in the electrical equipment & electronics (33 companies → 21 companies); and a
reduction of 5 companies in metal products, general machinery and nonferrous metals (Reference: Figure 58 on the next page compares the results for FY 2011 and FY 2014 for all
industries and the 3 industries that had the greatest number of respondent companies for the question on the fields of interest).
VI. 2. Fields of Interest in Overseas Infrastructure-related Business
This question is for those companies that answered “1. We consider it a business opportunity”; “2. We more or less think it is a business
opportunity”; or “3. We are unsure whether or not there are business opportunities” in Figure 56. Please select those fields that you are
interested in from the 18 infrastructure fields. (Multiple responses possible)
Q
Figure 57: Fields of Interest of Japanese Manufacturing Companies in Overseas Infrastructure-related Business
(1) All Fields (2) Industry Responses to the Top 5 Fields
(Note) We have organized response trends in the top 5 highest fields of
interest for those industries that, in the results for FY 2014 shown in
Figure 56 on the previous page, gave the highest percentages of
replies as "We consider it a business opportunity" or "We more or less
think it is a business opportunity.”
2014 2011
1 ― 1 Photovoltaic power generation 56 116 ▲ 60
2 6 Urban railways, etc. (including subways, freight trains, etc.) 51 58 ▲ 7
3 4 High-speed railways 48 64 ▲ 16
4 2 Sewage systems (including other waste water treatment facilities and industrial sewage)
46 70 ▲ 24
4 7 Roads and bridges 46 54 ▲ 8
6 5 Water supply (including water for industrial use) 40 60 ▲ 20
7 8 Wind-power generation 37 43 ▲ 6
8 3 Smart grids 36 69 ▲ 33
8 9 Smart Communities/Eco-Towns 36 41 ▲ 5
10 ― 10 Seawater desalination 29 40 ▲ 11
11 10 Advanced information and telecommunications networks 25 40 ▲ 15
12 18 Other 24 15 9
13 14 Nuclear power generation 23 22 1
14 12 Electricity transmission and distribution 22 34 ▲ 12
15 13 High-efficiency coal-fired power generation (ultra-supercritical pressure, supercritical pressure)
15 24 ▲ 9
15 ― 15 Solar thermal power generation 15 21 ▲ 6
15 16 Coal gasification power generation (IGCC, IGFC) 15 19 ▲ 4
18 17 Carbon dioxide capture and storage (CCS) 10 18 ▲ 8
No. of Respondent Companies (excluding those who did not reply) 198 254 ▲ 56
RankFields of Interest
No. of respondent
companies Change
2014 2011
c

14
23
6 8
-10
-5
0
5
10
15
20
25
30
35(companies)
3
32 33
10
21 21
-10
-5
0
5
10
15
20
25
30
35(companies)
5 5 8 8 8
3
-10
-5
0
5
10
15
20
25
30
35(companies)
70 69
116
46 36
56
-60
-40
-20
0
20
40
60
80
100
120(companies)
Figure 58: (Reference) Fields of Interest of Japanese Manufacturing Companies
in Overseas Infrastructure-related Business (by Industry)
Copyright © 2014 JBIC All Rights Reserved.
General Machinery
Chemicals
All industries
Electrical Equipment & Electronics
p.49
(Note 1) This is a comparison of the results for FY 2011 and FY 2014 for all industries and also the 3 industries with the most respondent
companies for the question on the fields of interest
(Note 2) “Difference” in the graphs is the figure obtained by subtracting the number of respondent companies for FY 2011 from the
number for FY 2014.
14
23
6 8
-10
-5
0
5
10
15
20
25
30
35(companies)
FY2011
FY2014
Difference
VI. 2. Fields of Interest in Overseas Infrastructure-related Business

7.9
14.3
17.6
11.5
9.7
8.3
7.7
6.7
52.7
64.3
58.8
70.0
68.4
53.8
51.6
45.8
46.2
46.7
50.0
44.4
39.3
21.4
23.5
30.0
31.6
34.6
38.7
45.8
46.2
46.7
50.0
55.6
0 20 40 60 80 100
Overall
Roads and bridges
High-speed railways
Smart Communities/Eco-Towns
Wind-power generation
Urban railways, etc
Photovoltaic powergeneration
Sewage systems
Nuclear power generation
Seawater desalination
Electricity transmission anddistribution
Water supply
(%)
1. Better than planned 2. According to plan 3. Worse than planned
(239)
(14)
(17)
(10)
(19)
(26)
(31)
(24)
(13)
(15)
(10)
(18)
(239)
(14)
(17)
(10)
(19)
(26)
(31)
(24)
(13)
(15)
(10)
(18)
Copyright © 2014 JBIC All Rights Reserved.
p.50 VI. 3. Entry and Performance Evaluation
This question is for those companies that replied "1. We consider it a business opportunity"; "2. We more or less
think it is a business opportunity"; or " 3. We are unsure whether or not there are business opportunities" in
Figure 56. Please explain your current entry status into fields of interest.
Q
Photovoltaic power generation is the field with the largest number of
companies already entered • Looking at current entry status in fields of interest, we find that photovoltaic power generation is the one
with largest number of companies already entered. Meanwhile, the fields that had the most number of
companies considering entry in detail were high-speed railways and smart grids (Figure 59).
50% of companies already entered responded that performance has been
“According to plan.” • When companies were asked to evaluate their performance in individual fields that they already entered
into, overall 50% replied that performance was "according to plan." Less than 10% said that it was
"better than planned,” while 40% thought it was "worse than planned" (Figure 60)
• Fields with a high total percentage (of 70% or more) of responses for "Better than planned" and
"According to plan " included roads and bridges; high-speed railways; and smart communities/eco-towns.
Figure 59: Current Entry Status into Fields of Interest (FY 2014)
(Note) Placed in order of the number of companies responding “1. Already entered”
Figure 60: Performance Evaluation for
Companies Already Entered
(Note1) Placed in order of the total number of companies responding “1.
Better than planned” and “2. According to plan.” Results not displayed
for fields with less than 10 respondent companies
(Note2) The figures in parentheses ( ) on the right of the bar chart indicate
the number of respondent companies
33
28
26
21
20
19
17
16
15
12
11
10
9
7
7
7
6
4
10
13
6
6
8
16
2
8
4
9
4
1
3
3
2
9
16
3
13
10
14
10
12
13
9
22
3
14
7
4
9
5
5
9
14
3
0 10 20 30 40 50 60
Photovoltaic power generation
Urban railways, etc
Sewage systems
Wind-power generation
Water supply
High-speed railways
Seawater desalination
Roads and bridges
Nuclear power generation
Smart Communities/Eco-Towns
Electricity transmission and distribution
High-efficiency coal-fired power generation
Other
Coal gasification power generation
Solar thermal power generation
Advanced information andtelecommunications networks
Smart grids
Carbon dioxide capture and storage
(companies)
1. Already entered
2. Considering entry in detail
3. No current plans to enter

Rank
Photovoltaic
power
generation
2014 2011 RankUrban railways,
etc2014 2011 Rank
High-speed
railways2014 2011 Rank
Sewage
systems2014 2011 Rank
Roads and
bridges2014 2011
1 China 20 45 1 India 14 17 1 China 14 30 1 China 16 29 1 China 15 15
2 India 6 18 2 China 13 23 2 India 12 13 2 Vietnam 10 7 2 Vietnam 12 82 Thailand 6 11 3 Indonesia 11 5 3 Vietnam 10 9 3 India 7 14 3 Indonesia 10 44 USA 5 14 4 Vietnam 10 7 4 USA 5 7 3 Indonesia 7 6 4 India 6 135 Japan 4 6 5 Thailand 6 3 5 Thailand 4 4 5 Thailand 5 5 5 Philippines 5 16 Malaysia 2 1 5 USA 6 4 6 Brazil 3 10 5 Malaysia 5 1 6 Turkey 3 06 Taiwan 2 8 7 Malaysia 3 1 6 Indonesia 3 2 5 Philippines 5 1 7 Thailand 2 4
8 Brazil 2 8 8 UK 2 1 8 Singapore 3 3 7 USA 2 18 Singapore 2 2 9 Myanmar 2 0 7 Myanmar 2 08 Taiwan 2 2 9 Cambodia 2 0 7 Mexico 2 0
9 Middle East 2 1 7 Malaysia 2 09 Southeast Asia 2 1 7 Africa 2 0
7 Cambodia 2 17 Taiwan 2 07 Japan 2 0
Rank Water supply 2014 2011 RankWind-power
generation2014 2011 Rank Smart grids 2014 2011 Rank
Smart
Communities/
Eco-Towns
2014 2011 RankSeawater
desalination2014 2011
1 China 11 18 1 China 7 16 1 China 8 21 1 China 9 18 1 Saudi Arabia 8 9
2 Vietnam 8 6 2 Japan 3 2 2 Indonesia 4 4 2 Indonesia 5 2 2 UAE 4 43 Indonesia 5 7 3 India 2 12 2 USA 4 9 3 USA 4 6 3 Singapore 3 53 Philippines 5 1 3 EU 2 3 4 EU 3 1 3 Philippines 4 0 3 Kuwait 3 05 Malaysia 4 2 3 Taiwan 2 0 4 Philippines 3 0 5 Malaysia 3 0 5 China 2 86 Singapore 4 3 3 Netherlands 2 0 6 India 2 13 6 India 2 12 5 India 2 77 India 3 14 6 Japan 2 4 5 Vietnam 2 47 Thailand 3 59 Cambodia 2 0
Copyright © 2014 JBIC All Rights Reserved.
p.51 VI. 4. Promising Countries in Overseas Infrastructure-related Business in the Medium Term
Figure 61: Ranking of Promising Countries
by Field of Interest (Top 10 Fields)
This question is for those companies that provided answers on their fields of
interest in Figure 57. For each field of interest, please name the most
promising countries (maximum of 3) where your company hopes to expand
(or start) business in the medium term (the next 3 years or so) .
Q
(Note 1) Aggregate statistics for FY 2011 showed the top 5 most promising countries in the medium term. In this survey aggregate calculations have been
modified to display results for the top 3 countries,
(Note 2) The responses for FY 2014 do not list countries/regions for which only a single company responded in the number of respondent companies.
(Note 3) See Appendix 11 (excluding the top 10 fields).
Despite a drop in the number of respondent companies, interest continues to be high across all fields in emerging countries such as China, India and Indonesia
etc. • If we calculate the aggregate of overseas infrastructure-related business by field to find the top 3 most promising countries over the medium term, and compare figures for FY 2011 and FY 2014,
the results show that in many fields of interest there was a fall in the number of countries/regions reported. This suggests companies trying to develop infrastructure-related business overseas
are tending to give more careful attention to their choice of destination than before. In light of this, the destinations that ranked top were emerging countries such as China, India and Indonesia.
With regard to sea water desalination, many companies have high hopes for projects in the Gulf States of Saudi Arabia, and the UAE, etc.
Higher interest in developed countries in some fields too
・There is also higher interest in photovoltaic power and wind-power generation, etc. in developed countries such as USA, EU and Japan, etc. that have already established regimes (e.g. the Feed In Tariff (FIT) system) to encourage companies to enter the market.
India Indonesia China Developed countries

50% or more
30% or more; but less than 50%
(%)No. of
Respondent
Companies
(with
interests)
1. R&D
2. Research
(Feasibility
Studies,
Marketing,
etc.)
3.
Consulting
4. Design
/Construction
Management
5. Supply of
parts
/component
materials
6. Supply of
equipment
/facilities
7. Provision
of Services
(Civil
Engineering
Works, etc.)
8. Operation
/Management
/Maintenance
9.
Investment10. Other
Photovoltaic power generation 51 9.8 25.5 3.9 5.9 49.0 29.4 3.9 9.8 2.0 2.0
Urban railways, etc 46 15.2 30.4 10.9 13.0 52.2 43.5 15.2 6.5 2.2 2.2
High-speed railways 42 14.3 28.6 9.5 14.3 52.4 40.5 11.9 7.1 4.8 2.4
Sewage systems 40 15.0 27.5 7.5 22.5 32.5 55.0 15.0 25.0 10.0 5.0
Roads and bridges 36 13.9 33.3 8.3 22.2 52.8 33.3 11.1 5.6 5.6 2.8
Water supply 35 17.1 34.3 8.6 25.7 40.0 57.1 17.1 25.7 11.4 5.7
Smart Communities/Eco-Towns 33 36.4 45.5 15.2 15.2 42.4 42.4 12.1 18.2 9.1 6.1
Smart grids 33 30.3 45.5 12.1 15.2 39.4 36.4 9.1 9.1 6.1 3.0
Wind-power generation 32 25.0 25.0 9.4 9.4 56.3 37.5 6.3 6.3 3.1 0.0
Advanced information and telecommunications networks 25 20.0 40.0 16.0 12.0 44.0 36.0 12.0 16.0 8.0 4.0
Seawater desalination 23 13.0 39.1 17.4 17.4 43.5 47.8 17.4 26.1 4.3 8.7
Nuclear power generation 20 35.0 45.0 25.0 20.0 45.0 50.0 20.0 25.0 15.0 0.0
Electricity transmission and distribution 19 5.3 26.3 15.8 21.1 42.1 42.1 10.5 10.5 10.5 5.3
Other 18 27.8 44.4 5.6 22.2 33.3 38.9 16.7 11.1 16.7 5.6
High-efficiency coal-fired power generation 13 23.1 46.2 15.4 38.5 30.8 76.9 23.1 38.5 23.1 0.0
Coal gasification power generation 12 33.3 41.7 8.3 16.7 8.3 41.7 16.7 16.7 8.3 0.0
Carbon dioxide capture and storage 10 50.0 60.0 20.0 10.0 20.0 50.0 20.0 20.0 10.0 0.0
Solar thermal power generation 10 20.0 30.0 10.0 20.0 50.0 50.0 20.0 20.0 10.0 0.0
Copyright © 2014 JBIC All Rights Reserved.
p.52 VI. 5. Medium-Term Approaches to Overseas Infrastructure-related Business
(Note 1) "No. of Respondent Companies (with interests)" refers to the number of companies (from among those providing responses in "Figure 57: Fields of Interest of
Japanese Manufacturing Companies in the Overseas Infrastructure-related Business") that responded to this question.
(Note 2) Percentages calculated by dividing the number of respondent companies for each option by the “No. of Respondent Companies (with interests)” . Multiple
responses were possible for this question.
Figure 62: Medium-Term Approaches of Japanese Manufacturing Companies
to Overseas Infrastructure-related Business
Relatively high percentage of companies involved in "5. Supply of parts/component materials" and "6. supply of equipment/facilities.” • Asking about medium-term approaches to each respective field of the overseas infrastructure-related business, we found that across virtually all fields a relatively high
percentage of companies answered “5. Supply of parts/component materials” and “6. supply of equipment /facilities” —this was the same in FY 2011 (Figure 62). After
this came “2. Research” and “1. R&D.” With the exception of certain fields, in many cases involvement in other fields was less than 30%.
This question is for those companies that provided answers on their fields of interest in Figure 57.
What sort of involvement does your company envisage in the medium term (the next 3 years or so)? Please select the most appropriate
answers from options 1. - 10. (Multiple responses possible)
Q

(companies)
Japanese CompanyCompany from
Emerging Countries
European/American
Company
26 1 13
(44.8%) (2.9%) (52.0%)
7 18 3
(12.1%) (51.4%) (12.0%)
43 30 21
(74.1%) (85.7%) (84.0%)
20 7 6
(34.5%) (20.0%) (24.0%)
1 0 0
(1.7%) (0.0%) (0.0%)
No. of Companies
Responding to this58 35 25
1. To acquire technology
and know-how
2. To improve cost
competitiveness
3. To acquire customer
and sales channels
4. To share risk
5. Other
55 companies,
27.0%
22 companies,
10.8%49 companies,
24.0%
78 companies,
38.2%
1. Collaborating
2. Considering collaboration
3. No plans for collaboration
4. Unsure
Around 40% of respondents are collaborating, or are considering
collaboration, with other companies in their overseas infrastructure-related
business • Of those companies interested in overseas the infrastructure-related business, 27.0% are
already collaborating with other companies, and 10.8% are currently considering doing so
(Figure 63 (1)).
• 64.5% of respondent companies said that they collaborate with manufacturing companies
as partners, while 44.7% stated that their partners were trading companies. In terms of
nationality the highest proportion of companies (76.6%) said that their partners were other
Japanese companies, but if we just look at the companies who stated they were
"considering collaboration,” we find that equal numbers replied they were considering
partners from emerging countries as those that were considering Japanese partners
(Figure 63(2)).
The main purpose of collaboration - the acquisition of customers and sales
channels • If we look at the respective nationalities of collaborative partners and investigate the
purpose behind the collaboration, we find that in all cases "to acquire customers and sales
channels" scores the highest percentage; with the percentage rising to 85.7% for partners
from emerging countries. The next most popular purpose, in the case of Japanese and
European/American partners was "to acquire technology and know-how"; and in the case
of partners from emerging countries "to improve cost competitiveness" (Figure 63 (2)). Copyright © 2014 JBIC All Rights Reserved.
77 companies(37.8%)
p.53 VI. 6. Collaboration with Other Companies in Overseas Infrastructure-related Business
This question is for those who answered “1. We consider it a business opportunity”;
“2. We more or less think it is a business opportunity”; or “3. We are unsure whether or
not there are business opportunities” in Figure 56. Please explain any collaboration with
other companies in the overseas infrastructure-related business.
Q
Figure 63: Collaboration with Other Companies in Overseas
Infrastructure-related Business (2) ①Type of the
company that you
collaborate with
(Note 1) Multiple responses possible for (2)
(Note 2) “4. Company Involved in Infrastructure, etc.” refers to power
companies, railway operators, water suppliers, etc.
②Nationality of the
company that you
collaborate with
<Purpose of Collaboration>
(Note) No. of responding companies = 204
(1) Current Situation for Collaboration 36
27
20
10
1
13
7
10
8
1
0 20 40 60
1. Manufacturing Company
2. Trading Company
3. Construction/Engineeringcompany
4. Company Involved inInfrastructure, etc.
5. Other
(companies)
1. Collaborating(54) 2. Considering collaboration(22)
30 companies(39.5%)
34 companies(44.7%)
18 companies(23.7%)
49 companies(64.5%)
2 companies(2.6%)
(Note) The percentages indicates the proportion to respondent companies
46
23
17
4
13
13
8
1
0 20 40 60
1. Japanese Company
2. Company from EmergingCountries
3. European/American Company
4. Other
(companies)
1.連携している(55) 2.連携を検討中(22)
25 companies(32.5%)
36 companies(46.8%)
5 companies(6.5%)
59 companies(76.6%)

Copyright © 2014 JBIC All Rights Reserved.
Appendices

Copyright © 2014 JBIC All Rights Reserved.
p.54 Appendix 1. Change and Details for Promising Countries/Regions for Overseas Business Operations
Promising Countries/Regions for Overseas
Business Operations over the Medium-term Note: “Medium-term” here means about the next three years or so.
Note: “Long-term” here means the next
ten years or so.
Promising Countries/Regions
over the Long-term
Promising Countries/Regions for
Mid-tier/SMEs over the Medium-term
Note: “Mid-tier firm/SMEs” here means
companies with paid-in capital of less
than ¥1 billion.
No.of
Companies
Percentage
share
No.of
Companies
Percentage
share
131 (%) 124 (%)
1 Indonesia 63 48.1 India 51 41.1
2 India 51 38.9 Indonesia
3 China 45 34.4 Thailand
4 Vietnam 44 33.6 Vietnam 44 35.5
5 Thailand 42 32.1 China 36 29.0
6 Mexico 27 20.6 Brazil 26 21.0
7 Myanmar 18 13.7 Myanmar 24 19.4
8 Brazil 16 12.2 Mexico 20 16.1
9 Malaysia 15 11.5 Philippines 15 12.110 Philippines Russia 13 10.5
FY2013
SurveyRank
FY2014
Survey
No.of
Companies
Percentage
share
No.of
Companies
Percentage
share
372 (%) 360 (%)
1 India 207 55.6 India 191 53.1
2 Indonesia 163 43.8 China 139 38.6
3 China 150 40.3 Indonesia 135 37.5
4 Vietnam 117 31.5 Brazil 114 31.7
5 Thailand 105 28.2 Thailand 99 27.5
6 Brazil 91 24.5 Vietnam 96 26.7
7 Myanmar 70 18.8 Myanmar 75 20.8
8 Russia 65 17.5 Russia 65 18.1
9 Mexico 58 15.6 Mexico 47 13.110 USA 47 12.6 USA
RankFY2013
Survey
FY2014
Survey
No.of
Companies
Percentage
share
No.of
Companies
Percentage
share
No.of
Companies
Percentage
share
No.of
Companies
Percentage
share
No.of
Companies
Percentage
share
499 (%) 488 (%) 514 (%) 507 (%) 516 (%)
1 India 229 45.9 Indonesia 219 44.9 China 319 62.1 China 369 72.8 China 399 77.32 Indonesia 228 45.7 India 213 43.6 India 290 56.4 India 297 58.6 India 312 60.53 China 218 43.7 Thailand 188 38.5 Indonesia 215 41.8 Thailand 165 32.5 Vietnam 166 32.24 Thailand 176 35.3 China 183 37.5 Thailand 165 32.1 Vietnam 159 31.4 Thailand 135 26.25 Vietnam 155 31.1 Vietnam 148 30.3 Vietnam 163 31.7 Brazil 145 28.6 Brazil 127 24.66 Mexico 101 20.2 Brazil 114 23.4 Brazil 132 25.7 Indonesia Indonesia 107 20.77 Brazil 83 16.6 Mexico 84 17.2 Mexico 72 14.0 Russia 63 12.4 Russia 75 14.58 USA 66 13.2 Myanmar 64 13.1 Russia 64 12.5 USA 50 9.9 USA 58 11.29 Russia 60 12.0 Russia 60 12.3 USA 53 10.3 Malaysia 39 7.7 Korea 30 5.8
10 Myanmar 55 11.0 USA 54 11.1 Myanmar 51 9.9 Taiwan 35 6.9 Malaysia 29 5.611 Philippines 50 10.0 Philippines 39 8.0 Malaysia 36 7.0 Korea 31 6.1 Taiwan12 Malaysia 46 9.2 Malaysia 37 7.6 Korea 23 4.5 Mexico 29 5.7 Mexico 25 4.813 Turkey 26 5.2 Korea 28 5.7 Turkey Singapore 25 4.9 Singapore 21 4.114 Singapore 25 5.0 Taiwan 23 4.7 Taiwan 22 4.3 Philippines 15 3.0 Philippines 14 2.715 Cambodia 20 4.0 Turkey Philippines 21 4.1 Turkey 12 2.4 Australia 8 1.616 Korea Singapore 19 3.9 Singapore 16 3.1 Australia 8 1.6 Bangladesh17 Taiwan 19 3.8 Cambodia 12 2.5 Cambodia 13 2.5 Bangladesh Turkey18 Germany 9 1.8 Germany 10 2.0 Australia 11 2.1 Cambodia Germany 7 1.419 France 7 1.4 South Africa Bangladesh 10 1.9 Myanmar 7 1.4 UK 6 1.220 Saudi Arabia Laos 9 1.8 Germany 6 1.2 UK 6 1.2 5 1.0
South Africa
Myanmar
Poland
Saudi Arabia
South Africa
UAE
RankFY2012
Survey
FY2013
Survey
FY2011
Survey
FY2010
Survey
FY2014
Survey

Copyright © 2014 JBIC All Rights Reserved.
p.55 Appendix 2. Promising Countries/Regions for Overseas Business Operations
(details of reasons for countries being viewed as promising)
Note 1: The number of respondent companies refers to the number of companies that cited reasons for a country being promising.
Note 2: The colored cells indicate the top three reasons most often cited for each country.
No. of
CompaniesRatio
No. of
CompaniesRatio
No. of
CompaniesRatio
No. of
CompaniesRatio
No. of
CompaniesRatio
No. of
CompaniesRatio
No. of
CompaniesRatio
No. of
CompaniesRatio
No. of
CompaniesRatio
No. of
CompaniesRatio
No. of respondent companies 220 100% 220 100% 214 100% 173 100% 151 100% 99 100% 79 100% 66 100% 57 100% 53 100%
1. Qualified human resources 30 13.6% 10 4.5% 18 8.4% 20 11.6% 30 19.9% 6 6.1% 3 3.8% 10 15.2% 4 7.0% 5 9.4%
2. Inexpensive source of labor 74 33.6% 63 28.6% 38 17.8% 49 28.3% 80 53.0% 32 32.3% 9 11.4% - 0.0% 2 3.5% 37 69.8%
3. Inexpensive components/raw materials 14 6.4% 13 5.9% 19 8.9% 17 9.8% 15 9.9% 4 4.0% 2 2.5% 1 1.5% 1 1.8% 5 9.4%
4. Supply base for assemblers 46 20.9% 56 25.5% 50 23.4% 48 27.7% 22 14.6% 50 50.5% 13 16.5% 10 15.2% 13 22.8% 4 7.5%
5. Concentration of industry 25 11.4% 21 9.5% 45 21.0% 61 35.3% 12 7.9% 15 15.2% 6 7.6% 14 21.2% 3 5.3% - 0.0%
6. Good for risk diversification to other countries 9 4.1% 22 10.0% 3 1.4% 19 11.0% 29 19.2% 9 9.1% - 0.0% 2 3.0% 1 1.8% 7 13.2%
7. Base of export to Japan 5 2.3% 10 4.5% 19 8.9% 14 8.1% 19 12.6% 1 1.0% 2 2.5% 2 3.0% 2 3.5% 3 5.7%
8. Base of export to third countries 27 12.3% 30 13.6% 30 14.0% 48 27.7% 23 15.2% 25 25.3% 7 8.9% 3 4.5% 4 7.0% 6 11.3%
9. Advantages in terms of raw material procurement 4 1.8% 7 3.2% 12 5.6% 9 5.2% 6 4.0% 2 2.0% 3 3.8% 7 10.6% 1 1.8% - 0.0%
10. Current size of local market 70 31.8% 82 37.3% 122 57.0% 73 42.2% 27 17.9% 28 28.3% 23 29.1% 44 66.7% 24 42.1% 6 11.3%
11. Future growth potential of local market 187 85.0% 188 85.5% 146 68.2% 94 54.3% 105 69.5% 63 63.6% 65 82.3% 37 56.1% 46 80.7% 37 69.8%
12. Profitability of local market 16 7.3% 21 9.5% 20 9.3% 20 11.6% 13 8.6% 11 11.1% 6 7.6% 19 28.8% 6 10.5% 4 7.5%
13. Base for product development 3 1.4% 1 0.5% 10 4.7% 4 2.3% 1 0.7% 1 1.0% 1 1.3% 7 10.6% 1 1.8% - 0.0%
14. Developed local infrastructure 2 0.9% 7 3.2% 31 14.5% 48 27.7% 6 4.0% 6 6.1% 2 2.5% 30 45.5% 2 3.5% - 0.0%
15. Developed local logistics services 2 0.9% 2 0.9% 11 5.1% 23 13.3% 2 1.3% 2 2.0% 2 2.5% 21 31.8% 1 1.8% - 0.0%
16. Tax incentives for investment - 0.0% 5 2.3% 2 0.9% 33 19.1% 8 5.3% 8 8.1% - 0.0% 1 1.5% 1 1.8% 5 9.4%
17. Stable policies to attract foreign investment - 0.0% 4 1.8% 2 0.9% 20 11.6% 5 3.3% 5 5.1% 1 1.3% 4 6.1% 2 3.5% 2 3.8%
18. Social/political situation stable 6 2.7% 10 4.5% 4 1.9% 2 1.2% 17 11.3% 8 8.1% 1 1.3% 30 45.5% 1 1.8% 3 5.7%
No. of
CompaniesRatio
No. of
CompaniesRatio
No. of
CompaniesRatio
No. of
CompaniesRatio
No. of
CompaniesRatio
No. of
CompaniesRatio
No. of
CompaniesRatio
No. of
CompaniesRatio
No. of
CompaniesRatio
No. of
CompaniesRatio
No. of respondent companies 215 100% 208 100% 185 100% 183 100% 146 100% 113 100% 81 100% 60 100% 60 100% 54 100%
1. Qualified human resources 11 5.1% 28 13.5% 29 15.7% 12 6.6% 37 25.3% 4 3.5% 2 2.5% 6 10.0% 2 3.3% 8 14.8%
2. Inexpensive source of labor 82 38.1% 70 33.7% 60 32.4% 31 16.9% 84 57.5% 14 12.4% 23 28.4% 42 70.0% 4 6.7% 1 1.9%
3. Inexpensive components/raw materials 11 5.1% 11 5.3% 15 8.1% 29 15.8% 9 6.2% 5 4.4% 6 7.4% 4 6.7% 2 3.3% 1 1.9%
4. Supply base for assemblers 54 25.1% 48 23.1% 59 31.9% 49 26.8% 16 11.0% 18 15.9% 37 45.7% 3 5.0% 13 21.7% 11 20.4%
5. Concentration of industry 32 14.9% 24 11.5% 58 31.4% 46 25.1% 12 8.2% 11 9.7% 24 29.6% - 0.0% 5 8.3% 15 27.8%
6. Good for risk diversification to other countries 20 9.3% 11 5.3% 22 11.9% 3 1.6% 27 18.5% 3 2.7% 9 11.1% 12 20.0% 3 5.0% 1 1.9%
7. Base of export to Japan 13 6.0% 6 2.9% 18 9.7% 12 6.6% 7 4.8% 1 0.9% 1 1.2% 5 8.3% 1 1.7% 2 3.7%
8. Base of export to third countries 29 13.5% 29 13.9% 53 28.6% 32 17.5% 17 11.6% 8 7.1% 22 27.2% 6 10.0% 1 1.7% 4 7.4%
9. Advantages in terms of raw material procurement 7 3.3% 9 4.3% 6 3.2% 13 7.1% 1 0.7% 5 4.4% 2 2.5% 1 1.7% 2 3.3% 3 5.6%
10. Current size of local market 66 30.7% 53 25.5% 64 34.6% 112 61.2% 18 12.3% 35 31.0% 24 29.6% 5 8.3% 18 30.0% 38 70.4%
11. Future growth potential of local market 181 84.2% 181 87.0% 111 60.0% 124 67.8% 97 66.4% 100 88.5% 49 60.5% 32 53.3% 46 76.7% 29 53.7%
12. Profitability of local market 17 7.9% 6 2.9% 16 8.6% 17 9.3% 10 6.8% 2 1.8% 7 8.6% 1 1.7% 5 8.3% 12 22.2%
13. Base for product development 1 0.5% 5 2.4% 6 3.2% 11 6.0% 1 0.7% 1 0.9% 2 2.5% 1 1.7% - 0.0% 8 14.8%
14. Developed local infrastructure 8 3.7% 3 1.4% 55 29.7% 18 9.8% 4 2.7% 4 3.5% 6 7.4% - 0.0% 2 3.3% 16 29.6%
15. Developed local logistics services 5 2.3% 2 1.0% 23 12.4% 7 3.8% 2 1.4% 2 1.8% 4 4.9% - 0.0% 1 1.7% 15 27.8%
16. Tax incentives for investment 6 2.8% 2 1.0% 39 21.1% 4 2.2% 10 6.8% 2 1.8% 6 7.4% 3 5.0% 2 3.3% 1 1.9%
17. Stable policies to attract foreign investment 7 3.3% 3 1.4% 25 13.5% 2 1.1% 4 2.7% 2 1.8% 5 6.2% - 0.0% 1 1.7% 2 3.7%
18. Social/political situation stable 14 6.5% 6 2.9% 30 16.2% 3 1.6% 18 12.3% 6 5.3% 5 6.2% 1 1.7% 1 1.7% 19 35.2%
9 10
Indonesia Vietnam6 7
India81 2 3 4
MyanmarMexico5
Russia
Russia USA9 10
Myanmar1 2 3 4
USA7 8
BrazilIndia Indonesia China Thailand Vietnam5 6
Mexico
Thailand China Brazil
FY2014 Survey
FY2013 Survey

Copyright © 2014 JBIC All Rights Reserved.
p.56 Appendix 3. Promising Countries/Regions for Overseas Business Operations (details of issues)
Note 1: The number of respondent companies refers to the number of companies that cited issues.
Note 2: The colored cells indicate the top three issues most often cited for each country.
No. of
CompaniesRatio
No. of
CompaniesRatio
No. of
CompaniesRatio
No. of
CompaniesRatio
No. of
CompaniesRatio
No. of
CompaniesRatio
No. of
CompaniesRatio
No. of
CompaniesRatio
No. of
CompaniesRatio
No. of
CompaniesRatio
Respondent companies 188 100% 188 100% 199 100% 142 100% 127 100% 84 100% 61 100% 47 100% 50 100% 50 100%1. Underdeveloped legal system 34 18.1% 33 17.6% 19 9.5% 7 4.9% 33 26.0% 3 3.6% 5 8.2% - 0.0% 3 6.0% 29 58.0%2. Execution of legal system unclear 66 35.1% 77 41.0% 108 54.3% 17 12.0% 44 34.6% 12 14.3% 19 31.1% 4 8.5% 20 40.0% 24 48.0%3. Complicated tax system 53 28.2% 21 11.2% 35 17.6% 6 4.2% 9 7.1% 11 13.1% 18 29.5% 1 2.1% 7 14.0% 3 6.0%4. Execution of tax system unclear 43 22.9% 41 21.8% 57 28.6% 7 4.9% 25 19.7% 7 8.3% 14 23.0% 2 4.3% 12 24.0% 9 18.0%5. Increased taxation 21 11.2% 32 17.0% 55 27.6% 15 10.6% 10 7.9% 6 7.1% 2 3.3% 6 12.8% 5 10.0% 4 8.0%6. Restrictions on foreign investment 30 16.0% 31 16.5% 48 24.1% 11 7.7% 14 11.0% 2 2.4% 11 18.0% - 0.0% 5 10.0% 9 18.0%7. Complicated/unclear procedures for investment permission 35 18.6% 28 14.9% 53 26.6% 12 8.5% 22 17.3% 2 2.4% 3 4.9% 1 2.1% 14 28.0% 17 34.0%8. Insufficient protection for intellectual property rights 18 9.6% 10 5.3% 94 47.2% 5 3.5% 11 8.7% 2 2.4% 3 4.9% 1 2.1% 4 8.0% 6 12.0%9. Restrictions on foreign currency/ transfers of money overseas 22 11.7% 16 8.5% 65 32.7% 7 4.9% 14 11.0% 1 1.2% 8 13.1% - 0.0% 10 20.0% 14 28.0%10. Import restrictions/customs procedures 22 11.7% 34 18.1% 55 27.6% 6 4.2% 14 11.0% 8 9.5% 11 18.0% - 0.0% 10 20.0% 8 16.0%11. Difficult to secure technical/engineering staff 22 11.7% 32 17.0% 25 12.6% 31 21.8% 32 25.2% 16 19.0% 2 3.3% 4 8.5% 7 14.0% 12 24.0%12. Difficult to secure management-level staff 36 19.1% 51 27.1% 47 23.6% 43 30.3% 40 31.5% 31 36.9% 11 18.0% 6 12.8% 8 16.0% 15 30.0%13. Rising labor costs 33 17.6% 83 44.1% 150 75.4% 74 52.1% 38 29.9% 15 17.9% 9 14.8% 10 21.3% 10 20.0% 6 12.0%14. Labor problems 46 24.5% 35 18.6% 43 21.6% 16 11.3% 13 10.2% 9 10.7% 9 14.8% 9 19.1% 7 14.0% 2 4.0%15. Intense competition with other companies 69 36.7% 61 32.4% 117 58.8% 64 45.1% 28 22.0% 17 20.2% 19 31.1% 37 78.7% 18 36.0% 6 12.0%16. Difficulties in recovering money owed 20 10.6% 9 4.8% 50 25.1% 4 2.8% 13 10.2% 1 1.2% 6 9.8% 1 2.1% 5 10.0% 7 14.0%17. Difficulty in raising funds 17 9.0% 4 2.1% 12 6.0% 2 1.4% 3 2.4% 1 1.2% 3 4.9% - 0.0% 3 6.0% 4 8.0%18. Underdeveloped local supporting industries 25 13.3% 24 12.8% 7 3.5% 7 4.9% 24 18.9% 15 17.9% 5 8.2% - 0.0% 6 12.0% 13 26.0%19. Sense of instability regarding currency and/or costs 22 11.7% 33 17.6% 3 1.5% 10 7.0% 20 15.7% 8 9.5% 12 19.7% - 0.0% 7 14.0% 6 12.0%20. Underdeveloped infrastructure 97 51.6% 61 32.4% 11 5.5% 9 6.3% 52 40.9% 7 8.3% 11 18.0% - 0.0% 5 10.0% 33 66.0%21. Security/social instability 46 24.5% 43 22.9% 65 32.7% 75 52.8% 15 11.8% 44 52.4% 28 45.9% - 0.0% 21 42.0% 18 36.0%22. Lack of information on the country 26 13.8% 19 10.1% 3 1.5% 7 4.9% 16 12.6% 9 10.7% 10 16.4% - 0.0% 12 24.0% 12 24.0%
No. of
CompaniesRatio
No. of
CompaniesRatio
No. of
CompaniesRatio
No. of
CompaniesRatio
No. of
CompaniesRatio
No. of
CompaniesRatio
No. of
CompaniesRatio
No. of
CompaniesRatio
No. of
CompaniesRatio
No. of
CompaniesRatio
Respondent companies 194 100% 194 100% 157 100% 179 100% 132 100% 99 100% 70 100% 56 100% 56 100% 40 100%1. Underdeveloped legal system 24 12.4% 29 14.9% 3 1.9% 19 10.6% 25 18.9% 10 10.1% 4 5.7% 27 48.2% 5 8.9% - 0.0%2. Execution of legal system unclear 59 30.4% 60 30.9% 14 8.9% 99 55.3% 39 29.5% 23 23.2% 12 17.1% 15 26.8% 19 33.9% - 0.0%3. Complicated tax system 17 8.8% 48 24.7% 5 3.2% 25 14.0% 6 4.5% 17 17.2% 5 7.1% 2 3.6% 3 5.4% 1 2.5%4. Execution of tax system unclear 34 17.5% 37 19.1% 6 3.8% 46 25.7% 22 16.7% 22 22.2% 9 12.9% 3 5.4% 4 7.1% - 0.0%5. Increased taxation 20 10.3% 16 8.2% 13 8.3% 44 24.6% 7 5.3% 9 9.1% 5 7.1% 2 3.6% 5 8.9% 7 17.5%6. Restrictions on foreign investment 20 10.3% 25 12.9% 12 7.6% 42 23.5% 10 7.6% 11 11.1% 4 5.7% 9 16.1% 6 10.7% - 0.0%7. Complicated/unclear procedures for investment permission 25 12.9% 31 16.0% 5 3.2% 47 26.3% 19 14.4% 11 11.1% 5 7.1% 6 10.7% 14 25.0% - 0.0%8. Insufficient protection for intellectual property rights 8 4.1% 11 5.7% 5 3.2% 83 46.4% 8 6.1% 5 5.1% 6 8.6% 3 5.4% 2 3.6% - 0.0%9. Restrictions on foreign currency/ transfers of money overseas 6 3.1% 22 11.3% 8 5.1% 56 31.3% 12 9.1% 14 14.1% 2 2.9% 9 16.1% 5 8.9% - 0.0%10. Import restrictions/customs procedures 26 13.4% 27 13.9% 9 5.7% 35 19.6% 13 9.8% 24 24.2% 9 12.9% 5 8.9% 9 16.1% 1 2.5%11. Difficult to secure technical/engineering staff 40 20.6% 26 13.4% 35 22.3% 20 11.2% 26 19.7% 12 12.1% 14 20.0% 9 16.1% 3 5.4% 2 5.0%12. Difficult to secure management-level staff 52 26.8% 26 13.4% 36 22.9% 38 21.2% 36 27.3% 18 18.2% 22 31.4% 14 25.0% 9 16.1% 5 12.5%13. Rising labor costs 80 41.2% 35 18.0% 88 56.1% 138 77.1% 35 26.5% 20 20.2% 16 22.9% 7 12.5% 8 14.3% 8 20.0%14. Labor problems 52 26.8% 49 25.3% 24 15.3% 46 25.7% 12 9.1% 15 15.2% 15 21.4% 5 8.9% 2 3.6% 9 22.5%15. Intense competition with other companies 58 29.9% 64 33.0% 73 46.5% 111 62.0% 32 24.2% 29 29.3% 14 20.0% 6 10.7% 15 26.8% 34 85.0%16. Difficulties in recovering money owed 7 3.6% 14 7.2% 2 1.3% 43 24.0% 6 4.5% 8 8.1% 1 1.4% 2 3.6% 3 5.4% - 0.0%17. Difficulty in raising funds 6 3.1% 13 6.7% 5 3.2% 12 6.7% 4 3.0% 3 3.0% 2 2.9% 6 10.7% 4 7.1% - 0.0%18. Underdeveloped local supporting industries 25 12.9% 20 10.3% 7 4.5% 8 4.5% 25 18.9% 10 10.1% 8 11.4% 11 19.6% 4 7.1% - 0.0%19. Sense of instability regarding currency and/or costs 24 12.4% 27 13.9% 2 1.3% 7 3.9% 16 12.1% 28 28.3% 6 8.6% 5 8.9% 2 3.6% - 0.0%20. Underdeveloped infrastructure 61 31.4% 111 57.2% 12 7.6% 19 10.6% 54 40.9% 23 23.2% 9 12.9% 36 64.3% 5 8.9% - 0.0%21. Security/social instability 41 21.1% 47 24.2% 22 14.0% 57 31.8% 6 4.5% 26 26.3% 34 48.6% 14 25.0% 8 14.3% - 0.0%22. Lack of information on the country 15 7.7% 23 11.9% 4 2.5% 5 2.8% 13 9.8% 23 23.2% 9 12.9% 18 32.1% 17 30.4% - 0.0%
MyanmarMexico5 81 2 3 4
Indonesia Vietnam6 7
India Thailand China Brazil Russia USA9 10
India Indonesia China Thailand Vietnam1 2 3 4 5
Mexico Brazil USA Russia Myanmar7 8 9 106
FY2014 Survey
FY2013 Survey

2013 2014 2013 2014 2013 2014 2013 2014 2013 2014 2013 2014 2013 2014
All Industries 82.5% 80.9% 16.1% 18.4% 1.5% 0.7% All Industries 28.0% 27.6% 58.9% 60.4% 8.2% 7.3% 4.9% 4.6%
Foods 90.6% 93.5% 9.4% 6.5% - - Foods 58.1% 51.7% 38.7% 44.8% 3.2% - - 3.4%
Textiles 84.6% 75.0% 15.4% 20.8% - 4.2% Textiles 26.9% 29.2% 65.4% 62.5% 7.7% 8.3% - -
Paper, Pulp & Wood 75.0% 60.0% 25.0% 40.0% - - Paper, Pulp & Wood 41.7% 50.0% 50.0% 50.0% 8.3% - - -
Chemicals (total) 85.4% 82.8% 13.5% 17.2% 1.1% - Chemicals (total) 24.2% 26.4% 64.8% 61.5% 2.2% 5.5% 8.8% 6.6%
Chemicals (incl. plastic products) 86.4% 84.9% 12.3% 15.1% 1.2% - Chemicals (incl. plastic products) 21.7% 23.8% 67.5% 63.1% 2.4% 6.0% 8.4% 7.1%
Pharmaceuticals 75.0% 57.1% 25.0% 42.9% - - Pharmaceuticals 50.0% 57.1% 37.5% 42.9% - - 12.5% -
Petroleum & Rubber 92.9% 78.6% 7.1% 21.4% - - Petroleum & Rubber 14.3% 7.1% 71.4% 85.7% 7.1% - 7.1% 7.1%
Ceramics, Cement & Glass 77.8% 82.4% 16.7% 17.6% 5.6% - Ceramics, Cement & Glass 16.7% 23.5% 72.2% 52.9% 5.6% 17.6% 5.6% 5.9%
Steel 100.0% 87.5% - 12.5% - - Steel 12.5% 12.5% 87.5% 81.3% - - - 6.3%
Nonferrous Metals 94.1% 86.4% 5.9% 13.6% - - Nonferrous Metals 17.6% 22.7% 64.7% 72.7% 17.6% 4.5% - -
Metal Products 61.1% 66.7% 38.9% 33.3% - - Metal Products 27.8% 27.8% 61.1% 55.6% 5.6% 11.1% 5.6% 5.6%
General Machinery (total) 86.9% 81.0% 13.1% 17.2% - 1.7% General Machinery (total) 39.3% 21.7% 54.1% 66.7% 6.6% 3.3% - 8.3%
Assembly 91.5% 82.6% 8.5% 15.2% - 2.2% Assembly 42.6% 20.8% 51.1% 64.6% 6.4% 4.2% - 10.4%
Parts 71.4% 75.0% 28.6% 25.0% - - Parts 28.6% 25.0% 64.3% 75.0% 7.1% - - -
Electrical Equipment & Electronics (total) 69.8% 78.7% 27.9% 21.3% 2.3% - Electrical Equipment & Electronics (total) 33.7% 30.9% 53.5% 62.8% 4.7% 4.3% 8.1% 2.1%
Assembly 76.3% 87.2% 18.4% 12.8% 5.3% - Assembly 31.6% 38.5% 57.9% 56.4% 5.3% 2.6% 5.3% 2.6%
Parts 64.6% 72.7% 35.4% 27.3% - - Parts 35.4% 25.5% 50.0% 67.3% 4.2% 5.5% 10.4% 1.8%
Transportation (excl. Automobiles) 81.8% 71.4% 18.2% 28.6% - - Transportation (excl. Automobiles) 9.1% 35.7% 63.6% 57.1% 18.2% 7.1% 9.1% -
Automobiles (total) 87.0% 83.8% 12.2% 16.2% 0.9% - Automobiles (total) 8.6% 9.3% 69.0% 64.8% 19.0% 20.4% 3.4% 5.6%
Assembly 100.0% 83.3% - 16.7% - - Assembly 16.7% - 66.7% 71.4% - - 16.7% 28.6%
Parts 86.4% 83.8% 12.7% 16.2% 0.9% - Parts 8.2% 9.9% 69.1% 64.4% 20.0% 21.8% 2.7% 4.0%
Precision Machinery (total) 78.9% 82.8% 18.4% 17.2% 2.6% - Precision Machinery (total) 50.0% 48.3% 39.5% 44.8% 7.9% 3.4% 2.6% 3.4%
Assembly 80.8% 90.0% 15.4% 10.0% 3.8% - Assembly 53.8% 50.0% 30.8% 45.0% 11.5% 5.0% 3.8% -
Parts 75.0% 66.7% 25.0% 33.3% - - Parts 41.7% 44.4% 58.3% 44.4% - - - 11.1%
Other 78.9% 77.2% 15.8% 19.3% 5.3% 3.5% Other 38.2% 48.3% 45.5% 44.8% 5.5% 1.7% 10.9% 5.2%
Maintain
present levelScale back undecided
Strengthen
/expand
Maintain
present level
Scale back
/withdraw
Strengthen
/expand
Copyright © 2014 JBIC All Rights Reserved.
p.57 Appendix 4. Medium-term Prospects for Business Operations (domestic and overseas , by industry)
Medium-term Prospects for Overseas Business Operations (by industry)
Overseas Domestic

Korea Taiwan Hong Kong Singapore Thailand Indonesia Malaysia Philippines
North-
eastern
China
Northern
China
Eastern
China
Southern
China
Inland
China
Strengthen/expand 41.0% 33.0% 29.2% 35.2% 64.8% 70.2% 53.4% 52.1% 55.2% 45.1% 52.5% 53.3% 59.8%
Maintain present level 58.1% 65.2% 69.2% 59.8% 34.7% 29.1% 45.6% 47.3% 43.2% 54.9% 44.3% 43.6% 36.9%
Scale back/withdraw 0.9% 1.7% 1.6% 5.0% 0.5% 0.7% 1.0% 0.7% 1.6% - 3.2% 3.1% 3.3%
India Vietnam Cambodia Laos Myanmar Others Mexico Brazil Others
Strengthen/expand 73.0% 70.0% 59.7% 56.3% 77.3% 40.0% 71.8% 67.4% 48.4%
Maintain present level 25.8% 30.0% 40.3% 43.8% 22.7% 55.4% 28.2% 31.9% 51.6%
Scale back/withdraw 1.3% - - - - 4.6% - 0.7% -
China
Latin America
NIEs3 ASEAN5
Rest of Asia & Oceania
2013 2014 2013 2014 2013 2014 2013 2014 2013 2014 2013 2014
Strengthen/expand 30.2% 34.7% 59.6% 57.4% 51.4% 52.4% 63.4% 67.0% 53.7% 52.0% 62.0% 66.2%
Maintain present level 68.4% 63.9% 38.9% 41.1% 46.6% 45.2% 35.8% 32.2% 45.8% 47.5% 37.0% 33.5%
Scale back/withdraw 1.4% 1.4% 1.5% 1.5% 2.0% 2.4% 0.9% 0.9% 0.5% 0.5% 1.0% 0.3%
2013 2014 2013 2014 2013 2014 2013 2014 2013 2014 2013 2014
Strengthen/expand 37.7% 39.2% 45.0% 46.8% 38.1% 49.2% 64.2% 57.5% 48.8% 60.5% 48.1% 58.4%
Maintain present level 60.2% 58.0% 51.7% 52.3% 60.3% 50.8% 34.0% 42.5% 50.0% 39.5% 49.4% 41.6%
Scale back/withdraw 2.1% 2.8% 3.3% 0.9% 1.6% 0.0% 1.9% 0.0% 1.2% 0.0% 2.5% 0.0%
Latin America
AfricaRussiaEU15
NIEs3
Central & Eastern
Europe
Rest of Europe &
CISMiddle East
ASEAN5 ChinaRest of Asia &
OceaniaNorth America
Copyright © 2014 JBIC All Rights Reserved.
p.58
Prospects for Medium-term Overseas Business Operation (Regions in Detail)
Appendix 5. Medium-term Prospects for Business Operations (by major country/region)
Medium-term Prospects for Overseas Business Operation (by major countries/regions)
Major countries
/Regions
Regions in detail

Copyright © 2014 JBIC All Rights Reserved.
p.59 Appendix 6. Overseas Production , Sales & Income Ratios (details by industry)
※1 Overseas Production Ratio : (Overseas Production) / (Domestic Production + Overseas Production)
※2 Overseas Sales Ratio : (Overseas Sales) / (Domestic Sales + Overseas Sales)
※3 Overseas Income Ratio : (Overseas Operating Income)/ (Domestic Operating Income + Overseas Operating Income)
No. of
Com-
panies
No. of
Com-
panies
No. of
Com-
panies
No. of
Com-
panies
No. of
Com-
panies
No. of
Com-
panies
No. of
Com-
panies
No. of
Com-
panies
No. of
Com-
panies
No. of
Com-
panies
No. of
Com-
panies
Foods 20.4% 28 18.6% 28 16.5% 27 18.0% 27 18.9% 23 18.4% 29 19.5% 29 18.3% 30 17.5% 28 18.2% 28 16.1% 27
Textiles 49.8% 25 48.2% 25 53.7% 23 55.0% 23 57.4% 21 18.8% 26 18.6% 25 26.7% 23 27.6% 23 28.9% 23 28.5% 23
Paper, Pulp & Wood 16.0% 10 25.8% 12 16.0% 10 16.0% 10 20.6% 9 11.7% 9 13.3% 12 13.0% 10 14.0% 10 13.9% 9 15.0% 9
Chemicals (total) 24.2% 74 25.0% 82 28.0% 80 29.3% 79 32.6% 72 30.1% 86 31.1% 90 35.7% 89 37.5% 88 35.4% 74 36.9% 73
Chemicals (incl. plastic products) 25.1% 67 25.8% 77 29.2% 74 30.6% 73 34.2% 66 30.3% 78 31.5% 82 35.8% 83 38.2% 82 35.3% 69 37.4% 68
Pharmaceuticals 15.0% 7 13.0% 5 13.3% 6 13.3% 6 15.0% 6 28.8% 8 27.5% 8 33.3% 6 28.3% 6 37.0% 5 31.0% 5
Petroleum & Rubber 34.3% 15 36.4% 14 37.1% 14 37.1% 14 42.9% 14 31.0% 15 32.9% 14 35.0% 12 35.0% 12 33.3% 12 33.3% 12
Ceramics, Cement & Glass 30.4% 13 35.0% 16 33.6% 14 35.7% 14 41.4% 14 40.7% 14 41.1% 18 38.3% 15 39.7% 15 33.6% 14 42.9% 14
Steel 20.0% 16 25.0% 15 19.0% 15 19.7% 15 26.4% 14 25.0% 17 28.8% 16 22.5% 16 23.7% 15 15.0% 14 16.4% 14
Nonferrous Metals 21.3% 19 28.1% 13 37.9% 17 40.0% 16 43.1% 16 25.0% 23 29.1% 17 28.3% 21 29.5% 20 22.6% 21 25.5% 20
Metal Products 31.3% 27 42.8% 18 38.5% 17 38.5% 17 44.4% 16 33.2% 28 43.3% 18 42.8% 18 46.2% 17 40.0% 18 39.4% 18
General Machinery (total) 24.3% 45 25.2% 56 23.7% 52 24.4% 50 26.8% 45 43.2% 45 39.9% 59 39.2% 57 40.9% 54 30.5% 47 29.0% 45
Assembly 24.3% 41 26.1% 45 24.8% 41 26.0% 40 27.6% 35 43.0% 41 41.1% 46 41.0% 45 42.5% 44 28.9% 36 28.7% 35
Parts 25.0% 4 21.4% 11 19.5% 11 18.0% 10 24.0% 10 45.0% 4 35.8% 13 32.5% 12 34.0% 10 35.9% 11 30.0% 10
45.2% 88 43.3% 78 48.6% 84 49.5% 83 52.3% 79 45.1% 94 42.8% 86 48.1% 93 48.7% 91 39.1% 71 41.8% 71
Assembly 35.0% 34 42.1% 34 43.1% 32 43.8% 32 48.7% 30 36.1% 38 38.2% 38 43.1% 36 43.9% 35 34.7% 29 37.4% 29
Parts 51.7% 54 44.3% 44 51.9% 52 53.0% 51 54.6% 49 51.3% 56 46.5% 48 51.3% 57 51.8% 56 42.1% 42 44.8% 42
Transportation (excl. Automobiles) 17.1% 14 11.4% 11 23.6% 14 25.0% 13 25.8% 12 30.0% 14 26.8% 11 37.1% 14 35.0% 13 23.3% 12 25.0% 10
Automobiles (total) 33.4% 98 39.4% 114 43.0% 102 44.8% 101 48.1% 96 36.0% 102 38.8% 117 42.2% 107 44.2% 100 42.4% 101 46.0% 96
Assembly 30.0% 8 41.0% 5 40.0% 6 43.3% 6 37.5% 4 51.7% 9 46.7% 6 55.0% 7 53.0% 5 63.0% 5 68.3% 3
Parts 33.7% 90 39.3% 109 43.2% 96 44.9% 95 48.6% 92 34.5% 93 38.3% 111 41.3% 100 43.7% 95 41.4% 96 45.3% 93
Precision Machinery (total) 29.2% 31 28.4% 32 25.7% 28 27.2% 27 31.7% 27 48.0% 33 53.8% 34 49.5% 29 52.6% 29 44.6% 24 47.5% 24
Assembly 28.9% 23 27.6% 23 23.4% 19 24.5% 19 28.7% 19 50.0% 24 53.8% 24 55.0% 20 58.5% 20 49.2% 19 52.4% 19
Parts 30.0% 8 30.6% 9 30.6% 9 33.8% 8 38.8% 8 42.8% 9 54.0% 10 37.2% 9 39.4% 9 27.0% 5 29.0% 5
Other 31.0% 47 31.7% 45 36.8% 50 38.2% 50 40.6% 50 29.1% 51 30.1% 55 31.8% 57 32.1% 56 27.9% 49 29.7% 49
Overall 31.3% 550 32.9% 559 35.2% 547 36.5% 539 39.9% 508 34.2% 586 35.4% 601 37.5% 591 38.8% 571 33.7% 517 35.5% 505
Electrical Equipment & Electronics (total)
(actual) (actual) (projected) (actual) (projected)(actual) (actual) (projected) plans(FY2017) (actual)
FY2013 FY2014
Overseas Income Ratio ※3
Industry
Overseas Production Ratio ※1
Medium-term
Overseas Sales Ratio ※2
FY2011 FY2012 FY2014FY2013FY2013FY2012 FY2014FY2011
(actual)

Copyright © 2014 JBIC All Rights Reserved.
p.60 Appendix 7. Evaluations of Degrees of Satisfaction with Net Sales and Profits (details)
Countries/Regions More Profitable than Japan
(Descending order by ratio)
Evaluations of Degrees of Satisfaction
with Net Sales and Profits (details)
Note: When companies were asked about their profitability in FY2013 in
countries/regions in which they had businesses, they were asked to
respond regarding the country/region which had higher rates of
profitability than Japan. “Total responses (2)” is the sum of the number
of companies that responded to inquiries about satisfaction with net
sales and profits and those that responded to the comparison of
profitability with Japan.
Note1: Data of companies which answered both net sales and profits were summed up.
Note2: Individual aggregation of Mexico and Brazil have been separated from Latin America since FY2012 performance.
Aggregation for Turkey has been added since FY2012 performance.
(1) Net Sales
FY2010 Performance FY2011 Performance FY2012 Performance FY2013 PerformanceAverage 2.85 Average 2.64 Average 2.63 Average 2.71
1 ASEAN 5 2.98 1 North America 2.74 1 North America 2.94 1 North America 2.98
2 NIEs 3 2.94 2 Vietnam 2.71 2 Mexico * 2.82 2 NIEs 3 2.90
3 China 2.90 3 NIEs 3 2.70 3 ASEAN 5 2.78 3 Mexico * 2.82
4 Latin America 2.89 3 ASEAN 5 2.70 4 NIEs 3 2.71 4 EU 15 2.81
5 Vietnam 2.79 5 Latin America 2.61 5 Turkey * 2.64 5 Central & Eastern Europe 2.77
6 North America 2.72 6 Russia 2.58 6 Vietnam 2.58 6 ASEAN 5 2.72
7 EU 15 2.63 7 China 2.57 7 Russia 2.56 7 Turkey * 2.70
8 India 2.60 8 EU 15 2.55 8 Central & Eastern Europe 2.49 8 Vietnam 2.66
9 Central & Eastern Europe 2.57 8 Central & Eastern Europe 2.55 9 Brazil * 2.46 9 Russia 2.59
9 Russia 2.57 10 India 2.40 10 EU 15 2.45 10 China 2.58
11 India 2.35 11 Brazil * 2.51
2.57 12 China 2.26 12 India 2.28
ASEAN 5 breakdown ASEAN 5 breakdown ASEAN 5 breakdown ASEAN 5 breakdown
1 Indonesia 3.19 1 Indonesia 2.95 1 Thailand 2.97 1 Singapore 2.83
2 Thailand 3.17 2 Singapore 2.72 2 Indonesia 2.77 2 Philippines 2.79
3 Singapore 2.91 2 Philippines 2.72 3 Singapore 2.70 3 Malaysia 2.69
4 Philippines 2.74 4 Thailand 2.61 4 Philippines 2.69 4 Indonesia 2.68
5 Malaysia 2.69 5 Malaysia 2.51 5 Malaysia 2.60 5 Thailand 2.67
(2) Profits
FY2010 Performance FY2011 Performance FY2012 Performance FY2013 PerformanceAverage 2.75 Average 2.54 Average 2.56 Average 2.65
1 ASEAN 5 2.91 1 Vietnam 2.63 1 ASEAN 5 2.72 1 NIEs 3 2.87
2 NIEs 3 2.81 2 NIEs 3 2.62 1 Mexico * 2.72 2 North America 2.83
2 Latin America 2.81 3 ASEAN 5 2.61 1 North America 2.72 3 EU 15 2.79
4 China 2.79 4 Latin America 2.59 4 NIEs 3 2.63 4 Central & Eastern Europe 2.77
5 Vietnam 2.67 5 North America 2.56 4 Vietnam 2.63 5 Turkey * 2.67
6 North America 2.62 6 Russia 2.51 6 Turkey * 2.62 5 Vietnam 2.67
7 Russia 2.61 7 Central & Eastern Europe 2.49 7 Russia 2.60 7 ASEAN 5 2.65
8 EU 15 2.51 8 China 2.44 8 Brazil * 2.40 8 Mexico * 2.64
8 Central & Eastern Europe 2.51 8 EU 15 2.44 8 Central & Eastern Europe 2.40 9 Russia 2.57
10 India 2.50 10 India 2.28 10 EU 15 2.36 10 China 2.50
11 India 2.30 11 Brazil * 2.42
12 China 2.25 12 India 2.24
ASEAN 5 breakdown ASEAN 5 breakdown ASEAN 5 breakdown ASEAN 5 breakdown
1 Thailand 3.10 1 Indonesia 2.82 1 Thailand 2.87 1 Singapore 2.78
2 Indonesia 2.96 2 Singapore 2.65 2 Indonesia 2.73 2 Philippines 2.75
3 Singapore 2.91 2 Philippines 2.65 3 Singapore 2.66 3 Malaysia 2.64
4 Philippines 2.76 4 Thailand 2.53 4 Philippines 2.62 4 Thailand 2.62
5 Malaysia 2.64 5 Malaysia 2.48 5 Malaysia 2.60 5 Indonesia 2.55
(Companies)
"More Profitable
than Japan"
responses (1)
Total
responses
(2)
Ratio:
[(1)/(2)]
1. Thailand 120 366 32.8%
2. China 124 513 24.2%
3. North America 89 386 23.1%
4. NIEs3 59 265 22.3%
5. Indonesia 54 257 21.0%
6. Vietnam 35 181 19.3%
7. Malaysia 37 195 19.0%
8. Singapore 38 223 17.0%
9. Philippines 22 130 16.9%
10. Central & Eastern Europe 15 103 14.6%
11. EU 15 37 272 13.6%
12. Mexico 13 131 9.9%
13. Brazil 10 127 7.9%
14. India 14 202 6.9%
15. Russia 5 92 5.4%
16. Turkey 3 67 4.5%
Country/Region

Copyright © 2014 JBIC All Rights Reserved.
p.61 Appendix 8. Existence of Real Business Plans in Promising Countries/Regions
Note: Each “Ratio” refers to the number of companies answering “Plans exist”, “No plans” or “No response” divided by the total number of respondent companies per respective countries (companies answered as promising countries).
Respondent
companiesRatio
Respondent
companiesRatio
Respondent
companiesRatio
Respondent
companiesRatio
Respondent
companiesRatio
Respondent
companiesRatio
Respondent
companiesRatio
Respondent
companiesRatio
Respondent
companiesRatio
Respondent
companiesRatio
Total 229 100% 228 100% 218 100% 176 100% 155 100% 101 100% 83 100% 66 100% 60 100% 55 100%
Plans exist 92 40.2% 101 44.3% 136 62.4% 104 59.1% 52 33.5% 50 49.5% 35 42.2% 39 59.1% 22 36.7% 16 29.1%
No plans 129 56.3% 117 51.3% 78 35.8% 66 37.5% 95 61.3% 49 48.5% 45 54.2% 27 40.9% 36 60.0% 37 67.3%
No response 8 3.5% 10 4.4% 4 1.8% 6 3.4% 8 5.2% 2 2.0% 3 3.6% 0 0.0% 2 3.3% 2 3.6%
Respondent
companiesRatio
Respondent
companiesRatio
Respondent
companiesRatio
Respondent
companiesRatio
Respondent
companiesRatio
Respondent
companiesRatio
Respondent
companiesRatio
Respondent
companiesRatio
Respondent
companiesRatio
Respondent
companiesRatio
Respondent
companiesRatio
Total 50 100% 46 100% 26 100% 25 100% 20 100% 20 100% 19 100% 9 100% 7 100% 7 100% 7 100%
Plans exist 20 40.0% 17 37.0% 10 38.5% 17 68.0% 8 40.0% 8 40.0% 7 36.8% 4 44.4% 2 28.6% 2 28.6% 3 42.9%
No plans 28 56.0% 28 60.9% 14 53.8% 7 28.0% 10 50.0% 11 55.0% 11 57.9% 5 55.6% 5 71.4% 4 57.1% 4 57.1%
No response 2 4.0% 1 2.2% 2 7.7% 1 4.0% 2 10.0% 1 5.0% 1 5.3% 0 0.0% 0 0.0% 1 14.3% 0 0.0%
No. 19
South Africa
No. 5
Vietnam
No. 1
India
No. 2
Indonesia
No. 3
China
No. 4
Thailand
No. 11
Philippines
No. 12
Malaysia
No. 13
Turkey
No. 14
Singapore
No. 19
Saudi Arabia
No.6
Mexico
No. 7
Brazil
No. 8
USA
No.9
Russia
No.10
Myanmar
No. 15
Cambodia
No. 15
Korea
No. 17
Taiwan
No. 18
Germany
No. 19
France

Role of Production Bases ④ General Machinery
What are the current and long-term (next 5 years or so) roles that you expect of production bases (factories) you have in the
following 5 countries/regions: Japan, China, ASEAN, India and Europe & America? Please select and circle the answers that most
closely match your company’s view from 1. - 5. below. (Multiple responses possible)
(Options)
1. Top-runner base with state-of-the-art production facilities
2. Product (process) innovation hub
3. Production base for core components, etc.
4. Base that can respond to a wide variety of market demands (i.e., to produce multiple products)
5. Base for human resource training and skills transfer
Q
Appendix 9. Domestic and Overseas Production Bases - Trends in the Division of Roles
(4 Major Industries)
Role of Production Bases ① Automobiles
(No. of responding companies = 94)
Current
Long term
(1) Japan (2) China (3) ASEAN (4) India (5) Europe & America
Role of Production Bases ② Electrical Equipment & Electronics
(No. of responding companies = 82)
Current
Long term
(1) Japan (2) China (3) ASEAN (4) India (5) Europe & America
Role of Production Bases ③ Chemicals
(No. of responding companies = 86)
Current
Long term
(1) Japan (2) China (3) ASEAN (4) India (5) Europe & America
(No. of responding companies = 52)
Current
Long term
(1) Japan (2) China (3) ASEAN (4) India (5) Europe & America
p.62
Copyright © 2014 JBIC All Rights Reserved.
63.8
65.4
48.3
45.7
68.8
59.3
63.9
40.7
39.4
66.9
1. Top runner base
2. Innovation hub
3. Core componentproduction base
4. Base able torespond to a variety
of demands
5. Human resourcetraining base
0 20 40 60 80 (%)
63.8
65.4
48.3
45.7
68.8
59.3
63.9
40.7
39.4
66.9
1. Top runner base
2. Innovation hub
3. Core componentproduction base
4. Base able torespond to a variety
of demands
5. Human resourcetraining base
0 20 40 60 80 (%)
63.8
65.4
48.3
45.7
68.8
59.3
63.9
40.7
39.4
66.9
1. Top runner base
2. Innovation hub
3. Core componentproduction base
4. Base able torespond to a variety
of demands
5. Human resourcetraining base
0 20 40 60 80 (%)
63.8
65.4
48.3
45.7
68.8
59.3
63.9
40.7
39.4
66.9
1. Top runner base
2. Innovation hub
3. Core componentproduction base
4. Base able torespond to a variety
of demands
5. Human resourcetraining base
0 20 40 60 80 (%)

Copyright © 2014 JBIC All Rights Reserved.
Appendix 10. Research & Development Bases in Japan and Abroad - Trends in the Division of Roles
(4 Major Industries)
p.63
What are the current and long-term (next 5 years or so) roles that you expect of R&D bases you have in the following 5 countries/regions : Japan,
China, ASEAN, India, Europe & America? Please select the answers that most closely match your company’s view from 1. - 3. below. (Multiple
responses possible)
1. Basic Research: Empirical research that is undertaken for the purpose of forming hypotheses and theories and discovering new knowledge
regarding observable facts
2. Applied Research: Research that explores how to use the knowledge discovered in basic research for practical possibilities and new applications
3. Development Research: Research that introduces or improves new materials, devices, products, systems and processes, etc., using the
knowledge obtained through basic and applied research, etc.
Q
The Role of R&D Bases ① Automobiles
(No. of responding companies = 94)
Current
Long term
(1) Japan (2) China (3) ASEAN (4) India (5) Europe & America
The Role of R&D Bases ② Electrical Equipment & Electronics
(No. of responding companies = 78)
Current
Long term
(1) Japan (2) China (3) ASEAN (4) India (5) Europe & America
76.3
75.3
87.8
72.4
72.6
86.2
1. Basic Research
2. Applied Research
3. DevelopmentResearch
0 20 40 60 80 100 (%)
76.3
75.3
87.8
72.4
72.6
86.2
1. Basic Research
2. Applied Research
3. DevelopmentResearch
0 20 40 60 80 100 (%)
76.3
75.3
87.8
72.4
72.6
86.2
1. Basic Research
2. Applied Research
3. DevelopmentResearch
0 20 40 60 80 100 (%)
76.3
75.3
87.8
72.4
72.6
86.2
1. Basic Research
2. Applied Research
3. DevelopmentResearch
0 20 40 60 80 100 (%)
The Role of R&D Bases ③ Chemicals
(No. of responding companies = 85)
Current
Long term
(1) Japan (2) China (3) ASEAN (4) India (5) Europe & America
The Role of R&D Centers ④ General Machinery
(No. of responding companies = 47)
Current
Long term
(1) Japan (2) China (3) ASEAN (4) India (5) Europe & America

Copyright © 2014 JBIC All Rights Reserved.
(Note 1) Aggregate statistics for FY 2011 showed the top 5 most promising countries in the medium term. In this survey aggregate calculations have been
modified to display results for the top 3 countries.
(Note 2) The responses for FY 2014 do not list countries/regions for which only a single company responded in the number of respondent companies.
Regarding "Solar thermal power generation," it has not been published because there was no more than one company that replied for each of the
promising countries.
p.64 Appendix 11. Ranking of Promising Countries for Japanese Manufacturing Companies in Infrastructure-related Business by Fields of Interest
(Excluding the Top 10 Fields)
Rank
Advanced information
and
telecommunications
networks
2014 2011 RankNuclear power
generation2014 2011 Rank
Electricity
transmission
and distribution
2014 2011 Rank
High-efficiency
coal-fired
power
generation
2014 2011
1 China 7 18 1 China 6 7 1 China 4 4 1 Indonesia 5 5
2 India 4 13 2 Turkey 4 0 1 India 4 9 2 India 4 103 Philippines 3 0 2 Vietnam 4 4 3 Indonesia 3 4 3 Vietnam 4 33 Vietnam 3 1 4 India 3 5 3 Myanmar 3 0 4 China 3 53 USA 3 7 4 USA 3 3 5 Thailand 2 4 5 Malaysia 2 06 Indonesia 2 1 6 Russia 2 0 5 Vietnam 2 4 5 USA 2 16 Singapore 2 0 6 UK 2 0
8 Taiwan 2 0
Rank
Coal
gasification
power
generation
2014 2011 Rank
Carbon dioxide
capture and
storage
2014 2011 Rank Other 2014 2011
1 China 3 7 1 Thailand 2 2 1 Indonesia 6 2
1 Indonesia 3 3 1 USA 2 3 2 China 4 21 Japan 3 2 2 Vietnam 4 1
4 Philippines 3 15 Malaysia 2 05 Taiwan 2 05 Thailand 2 1

Survey Report on Overseas Business Operations by
Japanese Manufacturing Companies
Results of the JBIC FY2014 Survey
Edited and published by the Policy and Strategy Office for Financial Operations, JBIC
Published on November 28, 2014
Ⓒ2014 Japan Bank for International Cooperation All right reserved.
Website : http://www.jbic.go.jp/en/
(For further information)
4-1, Ohtemachi 1-chome, Chiyoda-ku, Tokyo 100-8144, Japan
Policy and Strategy Office for Financial Operations, Japan Bank for International Cooperation
Telephone: +81-3-5218-9244 (Group direct line)
Facsimile : +81-3-5218-9696
E-mail : [email protected]
(Recycled Paper)