Embed Size (px)
Citation preview

SURVEY REPORT
May 2018
Technical and financial support of the National Community-Driven Development Program (NCDDP) in collaboration with the National Institute of Statistics (INS)
Realized by: NKONG HILL TOP ASSOCIATION FOR DEVELOPMENT (NADEV)
REPUBLIQUE DU CAMEROUN **************
Paix – Travail – Patrie ****************
REGION DE SUD OUEST ****************
DEPARTEMENT DU FAKO ***************
COMMUNE DE MUYUKA
REPUBLIC OF CAMEROON ****************
Peace – Work – Fatherland ****************
SOUTHWEST REGION ***************
FAKO DIVISION **************
MUYUKA COUNCIL
MECHANISM OF CITIZEN CONTROL OF THE PUBLIC
ACTION WITHIN THE MUYUKA COUNCIL

1
TABLE OF CONTENTS
TABLE OF CONTENTS .................................................................................................................I
LIST OF FIGURES ......................................................................................................................... 3
LIST OF TABLES. .......................................................................................................................... 3
LIST OF ABBREVIATIONS .......................................................................................................... 4
PREFACE .................................................................................. ERREUR ! SIGNET NON DEFINI.
EXECUTIVE SUMMARY ............................................................................................................. 6
I) BRIEF PRESENTATION OF THE OBJECTIVES OF THE SCORECARD, ITS METHODOLOGY AND MAIN
RESULTS ........................................................................................................................................... 6
II) LISTS OF RECOMMENDATIONS BASED ON THE RESULTS ........................................................... 6
CHAPTER ONE ............................................................................................................................ 10
LEGISLATIVE AND REGULATORY FRAMEWORK OF DECENTRALISATION AND LOCAL
DEVELOPMENT IN CAMEROON ............................................................................................ 10
LEGISLATIVE AND REGULATORY FRAMEWORK OF DECENTRALISATION ........................... 10
LOCAL DEVELOPMENT PROMOTION .................................................................................... 12
THE MINISTRY OF DECENTRALISATION AND LOCAL DEVELOPMENT (MINDDEVEL) ...... 13
BRIEF PRESENTATION OF THE MUYUKA COUNCIL AREA. ................................................... 14 HISTORICAL AND ADMINISTRATIVE ORGANIZATION OF THE COUNCIL .................................. 14
ECONOMIC ACTIVITIES ........................................................................................................ 14
BRIEF DESCRIPTION OF THE BIO-PHYSICAL ENVIRONMENT ................................................... 15
DEMOGRAPHY ..................................................................................................................... 16
ETHNICITY ........................................................................................................................... 17
SETTLEMENT PATTERN ......................................................................................................... 17
RELIGION ............................................................................................................................. 17
CHAPTER TWO ........................................................................................................................... 18
METHODOLOGY FOR THE EXECUTION OF CITIZENS CONTROL OF PUBLIC ACTION
WITHIN THE MUYUKA MUNICIPALITY ............................................................................... 18
STUDY CONTEXT ................................................................................................................... 18
OBJECTIVE AND METHODOLOGY OF CCPA ......................................................................... 18
METHOD OF SAMPLING AND DATA COLLECTION. ................................................................ 19 SAMPLING ............................................................................................................................ 19
DATA COLLECTION .............................................................................................................. 20
METHOD FOR MEASURING INDICATORS OF PERCEPTION .................................................... 21
CHAPTER THREE....................................................................................................................... 22

2
MAIN FINDINGS AND SUGGESTED RECOMMENDATIONS .............................................. 22
CHARACTERISTICS OF THE SAMPLED POPULATION ............................................................. 22
WATER SECTOR .................................................................................................................... 24 AVAILABILITY AND UTILISATION ......................................................................................... 24
QUALITY AND COST OF WATER SERVICES............................................................................ 25
APPRECIATION OF WATER SERVICES .................................................................................... 26
DISSATISFACTION WITH THE PROVISION OF PORTABLE WATER SUPPLY ............................... 28
3.2.5 MAIN EXPECTATIONS IN THE SUPPLY OF PORTABLE WATER ................................................ 28
................................................................................................................................................ 29
OVERVIEW OF HOUSEHOLD PERCEPTION ON PORTABLE WATER SUPPLY SERVICES AND
SUGGESTED RECOMMENDATIONS .................................................................................................... 29
HEALTH SECTOR ................................................................................................................... 30 3.3.1 AVAILABILITY AND UTILISATION ......................................................................................... 30
3.3.2 QUALITY AND COST OF HEALTH SERVICES .......................................................................... 32
3.3.3 APPRECIATION OF HEALTH SERVICES .................................................................................. 33
3.3.4 DISSATISFACTION OF HOUSEHOLDS WITH HEALTH SERVICES ............................................... 34
3.3.5 EXPECTATIONS OF HOUSEHOLDS WITH REGARDS TO HEALTH SERVICES .............................. 34
3.3.6 OVERVIEW OF HOUSEHOLDS PERCEPTION ON HEALTH SERVICES AND SUGGESTED
RECOMMENDATIONS ....................................................................................................................... 34
3.4 EDUCATIONAL SECTOR (BASIC, PRIMARY, SECONDARY AND VOCATIONAL TRAINING) ..... 35 3.4.1 AVAILABILITY AND UTILIZATION OF EDUCATIONAL SERVICES ............................................ 36
3.4.2 QUALITY AND COST IN THE PROVISION OF EDUCATIONAL SERVICES .................................... 37
3.4.3 APPRECIATION OF EDUCATIONAL SERVICES......................................................................... 40
3.4.4 DISSATISFACTION OF HOUSEHOLDS WITH EDUCATIONAL SERVICES ..................................... 41
3.4.5 EXPECTATIONS OF HOUSEHOLDS WITH REGARDS TO EDUCATIONAL SERVICES ..................... 41
3.4.6 OVERVIEW OF HOUSEHOLD PERCEPTION OF EDUCATIONAL SERVICES AND SUGGESTED
RECOMMENDATIONS ....................................................................................................................... 42
3.5 COMMUNAL SERVICES .......................................................................................................... 43 3.5.1 AVAILABILITY AND UTILIZATION OF COUNCIL SERVICES ..................................................... 43
3.5.2 QUALITY AND COST IN THE PROVISION OF COUNCIL SERVICES ............................................ 44
3.5.3 APPRECIATION OF COUNCIL SERVICES ................................................................................. 44
3.5.4 DISSATISFACTION OF HOUSEHOLDS WITH COUNCIL SERVICES ............................................. 45
3.5.5 EXPECTATIONS OF HOUSEHOLDS WITH REGARDS TO COUNCIL SERVICES ............................. 45
3.5.6 OVERVIEW OF HOUSEHOLD PERCEPTION OF COUNCIL SERVICES AND SUGGESTED
RECOMMENDATIONS ....................................................................................................................... 46
3.6 CONCLUSION AND PRINCIPAL RECOMMENDATIONS ............................................................ 47
CHAPTER FOUR ......................................................................................................................... 49
ACTION PLAN FOR THE IMPLEMENTATION OF CITIZEN CONTROL OF PUBLIC
ACTION ........................................................................................................................................ 49
PROGRAM FOR THE DISSEMINATION OF RESULTS AND PRESENTATION OF ACTION PLAN . 49
ACTION PLAN FOR THE IMPLEMENTATION OF THE CITIZEN CONTROL OF PUBLIC ACTION.49
ANNEXES ..................................................................................................................................... 57
ANNEX 1: QUESTIONNAIRE FOR THE STUDY ................................................................................ 57
ANNEX 2: PHOTO GALLERY .................................................................................................... 64

3
LIST OF FIGURES
Figure 1 Percentage Distribution of Respondents by Age.................................................................. 22
Figure 2: Percentage Distribution of Respondents by Gender .......................................................... 22
Figure 3: Age Distribution of Household Heads ................................................................................ 23
Figure 4: Gender Distribution of Household Heads .......................................................................... 24
Figure 5: Availability and Use of Drinking Water Sources ............................................................... 24
Figure 6: General Portable Water Quality within Muyuka Municipality ......................................... 25
Figure 7: Detailed Portable Water Quality within Muyuka Municipality ......................................... 25
Figure 8: Time used on Foot to fetch water for the Household (%) .................................................. 26
Figure 9: Period Used for the Maintenance of Damaged Water Points (%) ..................................... 26
Figure 10: Main stakeholders in charge of meeting the needs expressed by households in terms of
portable water supply (%) .................................................................................................................... 27
Figure 11: Reasons for Households Dissatisfaction with the Provision of Portable Water Supply
Services (%) .......................................................................................................................................... 28
Figure 12: Household Expectations with respect to Water Supply Services ..................................... 29
Figure 13: Closest Health Units to Households within Muyuka Municipality ................................. 31
Figure 14: Time used to get to the nearest Health Center by Households in the Community.......... 31
Figure 15: Households preference of Health service in case of Illness ............................................ 32
Figure 16: Cost of Consultation of Households ................................................................................. 33
Figure 17: Appreciation of Medical Staff by Households .................................................................. 33
Figure 18: Households expectations of health service sector ............................................................ 34
Figure 19: Distance Covered by Households Children to get to School. ........................................... 36
Figure 20: Availability of Class rooms and Benches within Educational Institutions ..................... 37
Figure 21: Average Number of Pupil/Students per Classrooms ........................................................ 38
Figure 22: Attendance frequency of Teachers.................................................................................... 38
Figure 23: Household Perception of Tuition Fee .............................................................................. 39
Figure 24: Institutions in charge of maintenance activities within schools in case of damages ...... 40
Figure 25: Level of Satisfaction of Households with Educational Services ...................................... 41
Figure 26: Expectation of Households with respect to Educational Services ................................... 42
Figure 27: Councils Services as demanded by Households ............................................................... 43
Figure 28: Percentage of households who regards the council service time as long or very long ... 44
Figure 29: Household Participation in Council Development Activities........................................... 44
Figure 30: Reasons for Non Satisfaction of Council Services of Households .................................. 45
Figure 31: Households expectations from council services ............................................................... 46
LIST OF TABLES.
Table1: Demography data per village. ................................................................................................ 16
Table 2: Program for the Dissemination of Results and Presentation of Action Plan. .................... 49
Table 3: Problems Identified, Suggested Solution and Level of implementation. ............................. 49
Table 4: Action plan. ............................................................................................................................ 53

4
LIST OF ABBREVIATIONS CCPA Citizen Control of Public Action
CDE Cameroun Des Eau
CRC Citizen Reporting Card
CSO Civil Society Organizations
EC-ECAM 4 Complementary Survey of the Fourth Cameroon Household Survey
MINATD Ministry of Territorial Administration and Decentralisation
MINEDUB Ministry of Basic Education
MINEE Ministry of Water and Energy
MINEPAT Ministry, of Economy, Planning & Territorial Development
MINESEC Ministry of Secondary Education
MINSANTE Ministry of Public Health
NADEV Nkong Hill Top Association for Development
NIS National Institute of Statistics
PNDP National Community Driven Development Program
UCCC Union of Cities and Councils of Cameroon
UN United Nations

5

6
EXECUTIVE SUMMARY
i) Brief presentation of the objectives of the ScoreCard, its methodology and main
results
The municipality of Muyuka was one of the recipients of the Scorecard survey with main
objective to increase effectiveness of public actions, and enhance the capacities of vulnerable
population and the underprivileged persons within the community. The survey specifically
intends to provide more information on;
The indicators pertaining to the perception of water services
The indicators pertaining to the perception of health services
The indicators pertaining to the perception of education services
The indicators pertaining to the perception of council services
Going these objective, 320 households were selected within the municipality with the help of
the National Institute of Statistics (NIS) to take part in the survey. Data collected was analysed
by NIS and interpreted by Nkong Hill Top Association for Development (NADEV). The results
will later on be disseminated to the general public of the Muyuka municipality so as to cause
actions.
The study shows that 31.9% of households were not satisfied with Water supply services,
28.4% of households also expressed their dissatisfaction health service provision, 7%-26% of
households expressed their dissatisfaction to education services and 47.4% of the households
were not satisfied with the delivery of council services.
ii) Lists of recommendations based on the results
Water Supply;
Increase of government involvement in water supply.
More water supply points should be constructed within the municipality
Organize workshop to train water management committee on how to manage their water
supply system.
More communication should be done between the water authorities and the citizens.
Repair works should be carried out on damaged water points.
Community water schemes should be put in place.
Buffer zones should be respected in order to improve on the quality of water.
Commenté [r1]: These are aims of CCPA and deserves to be here
7
Sensitization on the protection and the management of potable water to the populations.
Notify the population on time in case of water cuts.
Health Sector;
More drugs should be made available within the health care units, and a detailed list of all
drug prices, including all other fees to be paid for any service from the unit.
Lobby for more medical personnel
More hospital equipment should be provided for the health care units.
Build capacity of medical staff of the health units.
Mayor should take up responsibilities in setting up dialogued structures within the different
health structures.
Education Sector;
More vocational training centres should be made available to promote skilled talents
More school equipment should be provided for schools, so as to improve the quality of
educational care services provided to the public.
Improve on the capacity of teaching staff to better render educational care services to the
population.
School infrastructure should be provided in all areas of the municipality.
Council Services;
More transparency of the council in its budgeting and expenditures
Improvement on council staff behaviours.
Timelines in providing services.
More communication between the council and its population.
The council should get involved in all the stages in the action plan (Health, Education,
Water supply).

8
GENERAL INTRODUCTION
Institutional reform in African countries in recent years has been marked by trials of various
forms of decentralisation. In general, hitherto centralised governments have initiated a reform
agenda with the aim of transferring some powers, tasks, and resources to regional governments
and local authorities. Cameroon like many African countries is currently in the process of
decentralising significant functions, previously exercised by the central administration, to local
governments. This is in line with the 1996 Constitution, which transformed the country into ‘a
decentralised unitary state’ comprising a central government and several ‘autonomous’ sub-
national governments. It was only after 15 years that the constitutional provisions were
transformed into reality, to the satisfaction of many of its citizens. It took another more than 7
years of preparatory work, before the parliament of Cameroon passed three laws on
decentralisation in 2004. They establish a framework for decentralisation and make provision
for the devolution of powers to local authorities in the economic, social, health, educational,
cultural and sports development areas. The supervising authority of state institutions at various
levels has been slightly reduced as a result of the law.
It was in line of achieving the much-cherished goal of decentralisation that the government of
Cameroon put in place a number of tools towards the aim. One of the main tools used was the
National Community Driven Development Programme (with French acronym PNDP),
commissioned to contribute towards poverty alleviation using participatory strategies at the
level of the local councils. Within the framework for the execution of the PNDP, an agreement
was signed between Muyuka Council, the PNDP and NADEV (Nkong Hill Top Association
for Development), in which the PNDP has offered technical and financial support to enable
NADEV (Local Support Organisation) establish a Citizens' Report Card for the Muyuka
Council area. This report card known as the Citizen Control of Public Action (CCPA) has as
main objective to get the perception of the local man on the various services offered to them in
domains of Water, Health, Education, and Communal Services.
Given this exercise, a survey was conducted by NADEV within the Muyuka municipality, for
which the results will help provide suggestions for changes in the domains of Water, Health,
Education, and Communal Services. NADEV is expected during this exercise to;
1. Take part in the preparatory activities for the launching of the process;
2. Participate in the Regional workshop of the launching of the process;
3. Technically organize the launching process at the council level;
4. Contribute in the sensitization of stakeholders;

9
5. Select enumerators and organize their training while putting at their disposal collection
tools;
6. Collect data from sample households within the Muyuka council area (average 320
households). The collection of data shall be done with the help of questionnaires which
shall be put at the disposal of NADEV by the Program;
7. Interpret and produce a report on the investigation for Muyuka council;
8. Negotiate changes in the course of council restitution workshops;
9. Participate in restitution workshops at the divisional, regional and national levels.
NADEV so far has accomplished the first six tasks, and is currently on the seventh task for
which this report is intended.
Structure of the document
The structure of the report constitutes the following sections:
Executive summary
General Introduction
Methodology for the Execution of Citizens Control of Public Action Within the
Muyuka Municipality
Main findings and suggested recommendations
Plan of action for the establishment of the citizen control of public actions in the
Muyuka municipality
Annexes
10
CHAPTER ONE
LEGISLATIVE AND REGULATORY FRAMEWORK OF
DECENTRALISATION AND LOCAL DEVELOPMENT
IN CAMEROON
Legislative and Regulatory Framework of Decentralisation
Law No. 96/06 of 18 January 1996 to amend the Constitution of 2 June 1972, deliberated by
the National Assembly and enacted by the President of the Republic, clearly defines the role
played by the legislative Executive and Judicial arms of government. This law also defines the
geographical boundaries of the regions and the creation of regions by the Head of State.
The first major innovation ushered by the reforms of 2004 is the creation of the Region. As of
now, the administrative Regions have been created by a decree of the Head of State. The former
ten provinces were transformed into ten Regions. The said regions, however, are still to
effectively take off in their functioning as provided for by Law No. 2004/19 of 22 July 2004 to
fix the Rules Applicable to Regions.
The latest laws on Decentralisation in Cameroon date back to 2004, 2009 and 2011 with the
specifications on the transfer of powers in various domains by the State to local authorities.
The three main laws of 2004, however, include:
- Law No. 2004/17 of 22 July 2004 on the Orientation of Decentralisation;
- Law No. 2004/18 of 22 July 2004 to fix the Rule Applicable to Councils;
- Law No. 2004/19 of 22 July 2004 to fix the Rules Applicable to Regions.
These laws introduced some major innovations compared to the previous law, viz, law No.
74/23 of 5 December 1974 to Organise Councils. Presently the domains of competence of local
authorities have increased from social, cultural and economic, to include, health, education,
water supply, sports and other local services. For example, hence forth, councils can create,
equip, manage, maintain council health centres on the one hand; create, equip, manage, and
maintain kindergartens, nursery, and primary schools on the other.
As concerns the survey on citizen perception of public action, the sectors of health, water
supply, education, and council were of primary concern at the council levels. Here, the councils
have the following competencies;

11
Education.
Decree No. 2010/0247/PM of 26 Feb, 2010 lays down conditions for the exercise of some
powers transferred by the State to councils relating to Basic Education. This decree lays
down the conditions for the exercise by councils, as from the 2010 financial year, of
the powers transferred by the State relating to Basic Education and is an execution of the July
2004 law, on the rules applicable to councils, which concerns nursery, primary, secondary and
vocational training institutions. The Law states that councils shall;
Take part in keeping with the school map, setting up, equipping, managing, tending,
and maintaining council nursery and primary schools and pre-school establishments.
Recruit and manage back-up staff for the schools.
Participate in the procurement of school supplies and equipment
Participate in the management and administration of state high schools and colleges in
the region through dialogue and consultation structures.
Prepare a local forward plan for training and retraining
Draw up a council plan for vocational integration and reintegration.
Participate in the setting up, maintenance and management of training centers.
Water sector.
Decree No. 2010/0239/PM OF 26 Feb, 2010 lays down conditions for the exercise by councils,
as from the 2010 financial year, of some powers transferred by the State relating to safe
drinking water supply in areas not covered by the public water distribution network conceded
by the State, especially the project ownership and management of wells and boreholes.
Councils shall exercise the powers transferred by the State relating to the project ownership
and management of wells and boreholes, without prejudice to the following State
responsibilities and prerogatives:
Design and implementation of sustainable water and sanitation development
plans and projects;
Definition of guidelines, national policies and strategies on water resources
management;
Spring and mineral water exploitation;
Laying down of conditions for the protection and exploitation of surface and
underground waters.

12
Health sector.
Decree No. 2010/0246/PM OF 26 Feb. 2010 lay down the conditions for the exercise by
councils, as from the 2010 financial year, some powers transferred by the State relating to
health, particularly the building, equipping, maintenance and management of Integrated Health
Centres.
Councils shall:
Participate in drawing up, implementation and the continuous assessment of public
health policy.
Participate in the organization, management and development of public hospital
establishments and the technical control of private health establishments.
Participate in defining conditions for the creation, opening and running of public and
private health establishments.
Participate in the laying down and controlling of the building, equipping and
maintenance Standards of public and Private hospitals establishments.
Participate in drawing up and updating the health map.
Council.
Law No 2004/018 of 22 July 2004 in its sections 15, 16 and 17 lays down the powers devolved
upon councils for economic development.
Here the Council shall be in charge of the;
Organization of local trade fairs
Provision of support income and job generating micro projects
Development of local agricultural, pastoral, handicraft and fish farming activities
Development of local tourist attractions
Building, equipment, management and maintenance of markets, bus stations and
Slaughter houses.
Local Development Promotion
Law No 2004/018 of 22 July 2004 in its sections 15, 16 and 17 lays down the powers devolved
upon councils for economic development:
Organization of local trade fairs
Provision of support to income and job generating micro projects
Development of local agricultural, pastoral, handicraft and fish farming activities

13
Development of local tourist attractions
Building, equipment, management and maintenance of markets, bus stations and
Slaughter houses
Drinking water supply
Protection of underground and surface water resources
Contributing to the electrification of areas inhabited by the poor
In essence, practicing local economic development means working directly to build up the
economic competitiveness of a local area to improve its economic future. Prioritizing the
local economy and increasing the productive capacity of local firms, entrepreneurs and
workers is crucial if communities are to succeed in the fast changing world. The ability of
communities to improve the lives of their members today depends upon them being able to
adapt to the fast changing and increasingly competitive market environment. From the
perspective of a given territory – the municipality should aim at restructuring the production
system, to increase capacity to create enterprises, generate employment and improve the
living standards of the population thus enhancing the attractiveness of the municipality for
investors and consumers in its entirety
The Ministry of Decentralisation and Local Development (MINDDEVEL)
In a move that has been seen as a major step in furthering the decentralization process in
Cameroon the President created on the 2nd March 2018 the Ministry of Decentralisation and
Local Development.
The missions assigned to this ministry are oriented towards two specific areas: decentralization
and local development.
With regards to decentralization, the ministry is in charge of:
The elaboration of legislation and regulations relating to the organization and operation
of decentralized territorial communities,
The evaluation and monitoring of the implementation of decentralization.;
The monitoring and control of decentralized territorial authorities (CTD);
The application of legislation and regulations on civil status;
Finally, under the authority of the President of the Republic, the Minister of
Decentralization and Local Development exercises the supervision of the State over
decentralized territorial councils.

14
In the field of local development, the ministry promotes the socio-economic development of
regional and local authorities and ensures the practice of good governance within them.
In addition, the ministry exercises State supervision over a number of organizations involved
in this sector. This is the case with the Local Council Support Fund for Mutual Assistance
(FEICOM), the Local Government Training Center (CEFAM) and the National Civil Status
Registry Bureau (BUNEC).
Brief Presentation of the Muyuka Council Area.
Historical and Administrative organization of the council
The Muyuka council was created in 1977 by decree number 77/203 of 29th june 1977 as a
Divisional Council. At the time of its creation, it was headed by a council administrator
appointed by the then Ministry of Territorial Administration. The council then moved from a
divisional council to a sub-divisional council and then called as the ‘Muyuka Rural Council’
(MRC). The appellation of the council was later on changed to the ‘Muyuka Council’ (MC)
following the signing into law of the 22nd July, 2004 (laws on decentralization), which
transferred responsibilities and competences to councils and removed and transformed the
rural/urban qualification to mere councils within the dispensation of decentralization. The
monographic study of the council presented 18 villages made up of 98 quarters. It is a small
town in Fako Division of the South West Region of Cameroon, located (4.72167°N and
9.64083°E) about 31km from Buea, the Region capital. It is host to one of the four councils
(Muyuka council) that make up Fako Division. A total of some 18 villages make up the council
area: Muyuka (Administrative Head Quarter of the Council), Masone, Munyenge, Lylale,
Lykoko, Ikata, Bafia, Bavenga, Owe, Malende, Yoke, Ekona Mbenge, Ekona Lelu, Massuma,
Leo La Buea, Mundame, Mpondu Balong and Mautu.
Economic Activities
A number of primary productive structure development and human welfare/livelihoods in the
municipality was identified to include: agriculture, animal husbandry and fishing, hunting,
forest exploitation, commerce and industries.
Opportunities presented by economic activities are employment, sources income, food self-
sufficiency which are all avenues for economy growth. The constraints are insufficient capital
for expansion and inadequate sustainability skills. Consult the consolidated report for details
regarding economic activities.

15
Brief description of the bio-physical environment
Climate
Average monthly temperatures are like any other part of Fako division, with the hottest month
recording a monthly temperature of 33°c (February and March) and the coldest months
recording as low as 23°c (June–October)
Two major seasons exist in the area, the rainy and the dry seasons. In the past, the rainy season
occurred from March and extends to October and the dry season from November to February
each year. Present climatic change has caused variation in both seasons. The rainy season
extends up to October and December.
Relief
The topography of this council area is characterized by steep/gentle slopes and lowlands.
Settlements are located between 45m and 898m above sea level.The village with the highest
altitude point above sea level is Ekona Lelu (898m) above sea level while Muyuka has the
lowest location point of 45m above sea level.
Soil
Like any other part of the Mount Cameroon region, the Muyka municipality is rich in andosols
even though water remains one of the vital natural resources appealing to the local inhabitants
of the eastern slope. Traces of clay soils can also be found in certain areas. Generally, the area
is rich in sandy soil, black volcanic soil with high humus content. However, the Municipality
is suffering from high soil erosion due to increasing human intervention.
Hydrology
The major water bodies in this municipality are the Yoke River found in Yoke, the Mungo
River that flows across Mpondu village and “Lake Mboudong” in Masoni village and other
small streams in various villages.
Flora and vegetation
Primary forest and secondary forester with savannah vegetation dominate flora species of the
municipality. However, over 80% of the primary forest had long been exploited by timber
companies.
Fauna
Wild life and domesticated animals are found within the Muyuka sub division. Cattle, goats,
sheep, pigs, poultry (local and improved breeds), ducks, cane rats and rat moles constitute the
domesticated animals whilst the antelope, hare, deer, monkeys, elephants, pangoline,

16
chimpanzee, gorilla, bush baby and squirrels constitute those found in the wild. Moreover, the
wild birds include: Grey headed sparrow, Swallow, Hawk, Weaver bird, Sunbird Owls, bats,
Kingfisher and parrots.
Demography
Population size and structure
The population size of the Muyuka Municipality s estimated at 118,470 inhabitants with detail
presentation in the table below.
Table1: Demography data per village.
Villages Males Females
Children (less
than16 years)
infants (less than 5
years) Total
Munyenge 3000 4000 2000 7000 16,000
Masone 2 0 18 1 21
Lylale 100 200 700 500 1,500
Lykoko 800 1200 3000 2000 7,000
Bafia 1200 1800 2000 3000 8,000
Bavenga 30 18 2 0 50
Ikata 800 1200 1100 2000 5,100
Owe 1000 1500 3500 2000 8,000
Muyuka 2000 3000 12000 8000 25,000
Ekona Mbenge 7000 11000 3000 1300 18,000
Malende 4500 6500 1300 600 11,000
Yoke 4100 5900 700 300 10,000
Leola Buea 26 13 5 6 39
Massuma 23 2 0 0 25
Mautu 2500 3200 987 350 5,700
Mundame 60 40 12 5 100
Mpondo
Balong 250 450 900 800 2,400
Ekona Lelu 387 148 25 3 535
TOTAL 27778 31578 31,249 27,865 118,470
(Muyuka CDP , 2011).

17
Population Mobility
Population mobility includes movement within, out and into the municipality. Population
mobility within the municipality is inter-communities. People migrate from other communities
to settle in communities which are considered urban areas within the municipalities because of
the present of basic amenities like schools, health care, water and electricity.
Other form of mobility is movement out of the Municipality (rural exodus). The reason for this
flow of population is the search for better living conditions.
Characteristics of Vulnerable Population
The municipality has a significant number of vulnerable persons who are either stigmatized or
neglected:
persons living with disabilities (blind, deaf and dumb, aged persons, orphans),
people living with HIV/AIDS, and
aged persons
Ethnicity
Historically, two main ethnic groupings made up the municipality - the Bakweri and the Balong
which could be described as the native inhabitants of the Council area. In recent times, the area
has witnessed a surge in diverse ethnic representation drawn from within and without
Cameroon comprising the Bangwa’s, Bamileke, Bikom, Mankon, Bafut, Ibo’s, Ibiobos.
Settlement pattern
Over the years, population and economic growth have transformed some a number linear
settlement patterns to cluster. For example, communities like Munyenge, Bafia, Ikata, Owe,
Muyuka, Ekona Mbenge, Malende and Yoke that are today classified as urban centres grew
out from linear settlement patterns to cluster.
Religion
Christianity was introduced in the Municipality in the 1950s by the Basel mission. Since then,
the acknowledgment and fear of the creator is embedded in the mines of residents in the
Muyuka Municipality. For this reason, one could identify churches of different denomination
in most villages in the Municipality. Some churches include: the Roman Catholic, Presbyterian
Church of Cameroon, Baptist, Apostolic, Full Gospel church etc.

18
CHAPTER TWO
METHODOLOGY FOR THE EXECUTION OF
CITIZENS CONTROL OF PUBLIC ACTION WITHIN
THE MUYUKA MUNICIPALITY
Study Context
As mentioned already above, since the second phase of the PNDP Program, one of the expected
results is "the number of councils that have put in place an operational mechanism on citizen
control and access to information" A pilot phase was conducted in 2011and covered 10 councils
in the 10 regions (Idenau in the Southwest Region). This first experience provided knowledge
for the scaling up of the third phase. The pilot phase has enable us to;
See a great enthusiasm of the population to give their opinion on the development of
their localities.
Identify some points of improvement on which the various sectors and Mayors need to
take into consideration in the management of their sectors and localities respectively.
Identify some points of attention for a successful operation.
In order to obtain reliable information for this operation, phase III of PNDP was to carry out a
survey in 160 councils with households in order to capture their perceptions for the services
offered in the domains of Water, Health, Education and Council services. For this exercise
responsibility was distributed as follows;
The technical leadership of the operation entrusted to NADEV (CSOs) for their
independence and their knowledge of the environment.
The technical support from the National Institute of Statistics (NIS) is predominant both
on design and on the operationalization.
Objective and Methodology of CCPA
The main aim was to support the council in realising a citizen control mechanism of the
activities of the council. The CCPA also had as objectives after the realisation of the Scorecard
survey aims to promote governance, increase effectiveness of public actions, and enhance the

19
capacities of vulnerable population and the underprivileged persons to make known their
problems. More specifically, the CCPA aimed at;
Identifying the stakes and actors (administration and users)
Collecting data and disseminating the results in160 councils in collaboration with 19
Civil Society Organizations (CSO)
Strengthening the capacity of 160 councils to take advantage of the knowledge acquired
and adopt changes that will be suggested at the end of the activity.
Putting in place an effective framework that will regroup several institutional actors at
the council, Divisional, Regional and National levels in order to promote the
institutionalization of CCPA
In this light, the methodology adopted for the execution of the CCPA included:
Putting in place coordination and execution bodies at the National, Regional and
Council levels.
Organize a workshop at the National and Regional levels to bring together
institutional actors who can contribute to the institutionalization of this operation
(MINEPAT, MINATD, UCCC, MINSANTE, MINEE, MINEDUB, MINESEC, NIS,
GIZ, etc.)
Negotiate the engagement with stakeholders on the operation.
Collect, process and analyse data.
Produce reports.
Disseminate information / knowledge acquired and negotiate the changes with target
councils.
Method of Sampling and Data Collection.
Sampling
Survey Area and Target Population
The study on CCPA covered the entire Muyuka municipality, with a target population of all
households within the municipality. Based on a list of enumerated households provided by the
Complementary Survey of the Fourth Cameroon Household Survey (EC-ECAM 4), the opinion
polls were gotten from a number of sampled households within each village/quarter within the
municipality.

20
Sampling Method of the Survey
A stratified random sampling technique was employed in the identification of households to
take part in the study, and was done by NIS
Sample Size of the Study
The sample size of the study was given as 320 households per council area. Again, this figure
was provided by PNDP to NADEV which was also calculated by NIS. The formula
employed for this is given below as follows;
𝑛 =𝑧² × 𝑃(1 − 𝑃)
𝑒² +𝑧²×𝑃(1−𝑃)
𝑁
Where:
N represents the total number of households in the community
e is the error margin (set at 5%)
z refers to the level of reliability (at 95%, z=1,96)
P stands for the proportion of the population satisfied with the services offered (given
that the level of this indicator is unknown to our population, we set it at 50%)
The application of the above formula gives us a sampling size of 320 households.
Data Collection
i) Data Collection Tools
The main tool for data collection was the questionnaire made up of five main sections; the
background, Drinking water, Health, Education, and Council services. It was accompanied
with the cartographic map and list of households in the municipality, and the data collection
manual.
ii) Data Collection
The data collection process was carried in two main stages, the training of enumerators and the
proper collection of data.
a. Training of Enumerators
Training of enumerators within the Muyuka municipality took place between the 11 and 13 of
October 2017, at Our Lady of Grace Catholic Secondary School Muyuka. This training had as
main objective to build the capacities of enumerators who were the principal collectors of data

21
from the households, on the understanding of the concept of the CCPA and the objectives of
the activity. To accomplish this task, a very participative approach was used, including
simulations for each sections of the questionnaire. In all thirteen (14) enumerators were trained
and Ten (10) were retained based on an appraisal test while three (04) were on the waiting list
in case of discontinuity of any of the preselected enumerators during the survey.
b. Data Collection Proper
Data collection within the Muyuka municipality occurred between the 19th and 24th of October
2017. Enumerators under the supervision of the Council supervisor for the Scorecard, were
handed cartographic maps, list of households and the names of the household heads to facilitate
identification of these households. As mentioned above, the main data collection tool was the
questionnaire which was only to be administered to the household head or his/her spouse, or
any other adult household member capable of providing answers to the questionnaire in the
absence of the household head. The enumerators were arranged in pairs of two (02) and
deployed to the various quarters/villages within the Muyuka council area.
c. Treatment and Analysis of the Data Collected
Data collected from the field was verified and validated by council supervisor, which was later
transferred to NADEV coordination for validation, and finally handed to PNDP. The data was
keyed in into computers by PNDP, then treated and analysed by NIS, thereof producing tables
which will be used for the analysis in this report.
Method for Measuring Indicators of Perception
Perception indicators were measured quantitatively making use of mostly categorical variable.
The questionnaire was designed with most of the questions having predefined set of responses
which facilitates treatment and analysis of the responses. The most important question for all
the sections dealing with respondent satisfaction of services within the said sector had three
(03) predefined answers; satisfied, unsatisfied, and indifferent, which are also known as
categories for the said question.

22
CHAPTER THREE
MAIN FINDINGS AND SUGGESTED
RECOMMENDATIONS
Characteristics of the Sampled Population
A general characteristic of the sampled population is presented below.
Figure 1 Percentage Distribution of Respondents by Age.
Source: survey report CCPA Muyuka 2017
Majority of respondents were between the age of 20 to 44, accounting for a cumulative
frequency of 62.2%. Respondents aged 20 to 29 contributed a high percentage to the majority
of the respondents. Those aged 20 years and 45 to 65 and above contributed less than 10% for
each respective age group. Also, slightly more female respondent (49.6%) than males (48.8%)
contributed to the study in Muyuka. This shown on figure 2 below.
Figure 2: Percentage Distribution of Respondents by Gender
Source: survey report CCPA Muyuka, 2017
0,0%
2,0%
4,0%
6,0%
8,0%
10,0%
12,0%
14,0%
16,0%
48,8%49,6%
1,6%
Males
Females
Unknown
23
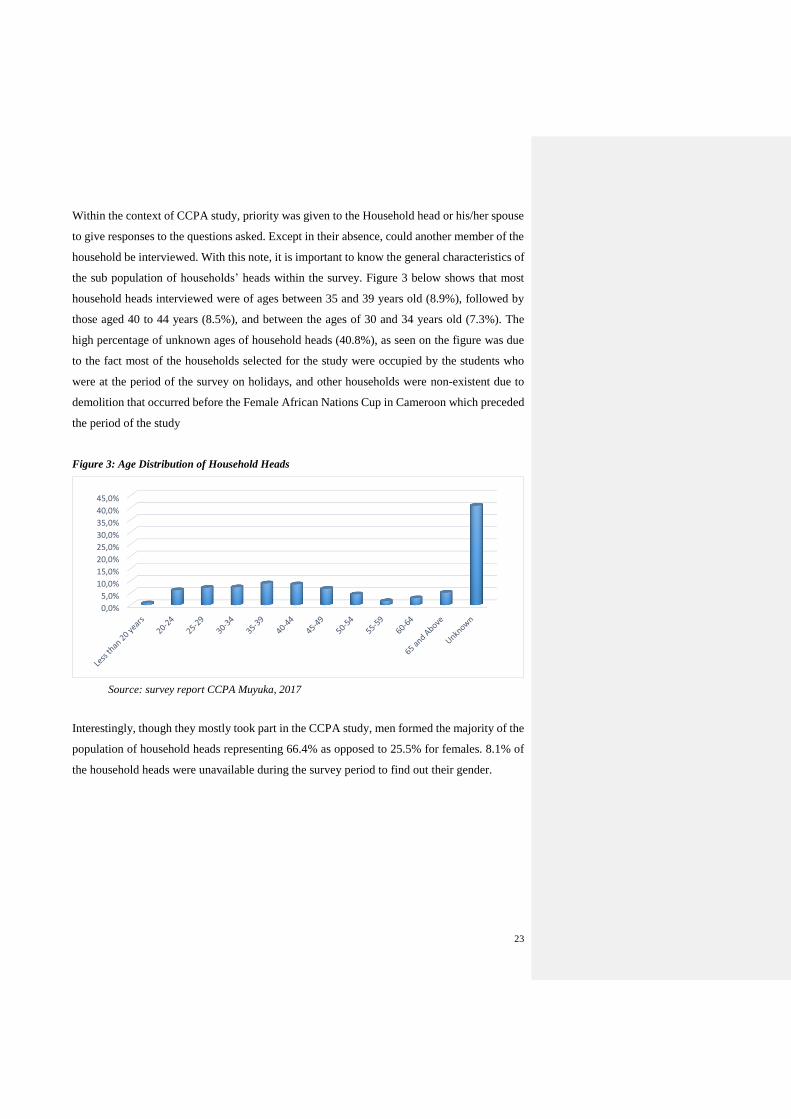
Within the context of CCPA study, priority was given to the Household head or his/her spouse
to give responses to the questions asked. Except in their absence, could another member of the
household be interviewed. With this note, it is important to know the general characteristics of
the sub population of households’ heads within the survey. Figure 3 below shows that most
household heads interviewed were of ages between 35 and 39 years old (8.9%), followed by
those aged 40 to 44 years (8.5%), and between the ages of 30 and 34 years old (7.3%). The
high percentage of unknown ages of household heads (40.8%), as seen on the figure was due
to the fact most of the households selected for the study were occupied by the students who
were at the period of the survey on holidays, and other households were non-existent due to
demolition that occurred before the Female African Nations Cup in Cameroon which preceded
the period of the study
Figure 3: Age Distribution of Household Heads
Source: survey report CCPA Muyuka, 2017
Interestingly, though they mostly took part in the CCPA study, men formed the majority of the
population of household heads representing 66.4% as opposed to 25.5% for females. 8.1% of
the household heads were unavailable during the survey period to find out their gender.
0,0%
5,0%
10,0%
15,0%
20,0%
25,0%
30,0%
35,0%
40,0%
45,0%

24
Figure 4: Gender Distribution of Household Heads
Source: survey report CCPA Muyuka, 2017
Water Sector
Access to potable water within this municipality is inadequate. The service of CAMWATER
(CDE at the time of the survey) is limited to Muyuka, Malende and Yoke and the rest of the
communities like Ekona Mbenge, Mundame, Ekona Lelu, Bafia, Ikata and Owe have benefited
from water schemes though insufficiency remain a greater problem due to large population
size, and non-treatment of water source or non-functional water system remain a major
problem.
Availability and Utilisation
Figure 5: Availability and Use of Drinking Water Sources
Source: survey report CCPA Muyuka, 2017
Six (6) portable water supply sources were identified from the survey of households, which
include canalization with 52.9 %, river/spring (40.4%), wells equipped with a pump (26.5%),
protected well (21.1%), open pit well (10%), and boreholes with manually operated pumps
(7%). When it comes to usage of these various sources of portable water supply, two (2)
66,4%
25,5%
8,1%
Males
Females
Unavailable
26,5
10
21,1
7
40,4
52,9
17,1
2 2,7 1,8
35,241,3
0
10
20
30
40
50
60
Well Equipedwith a pump
Open pit well Protectedwell
Boreholewith a
manuallyoperated
pump
River/spring Portablewater supply
Availability
Usage

25
principal sources stood out from the other, canalisation (41.3%) and River/spring (35.2%). In
all, 50 % of households have access to portable water within Muyuka municipality.
Accessibility to portable water supply is accounted for by the community water supply systems
established and ran each community. Availability of rivers and spring in Muyuka serves as
water source for 34.2 % of the households. Well-equipped pump usage was 17.1%. Open pit
well, protected well and boreholes accounted for less than 5% usage.
Quality and Cost of Water Services
Water quality within the Muyuka municipality is generally good as affirmed by 83.7% of the
households surveyed, while 13% said the water quality was bad. Though the general quality of
water is good, less than 11 % of the households said water had odour, colour, or taste. This is
shown on figure 6 and 7 below.
Figure 6: General Portable Water Quality within Muyuka Municipality
Source: survey report CCPA Muyuka, 2017
Figure 7: Detailed Portable Water Quality within Muyuka Municipality
Source: survey report CCPA Muyuka, 2017
With regards to cost of portable within Muyuka, the research shows that only 12.1% of all
households surveyed, incur an average monthly cost for portable water.
83,7
13
3,4
Good
Bad
indifferent
5,7
93,7
0,6
10,4
89,6
06,6
93,4
00
20
40
60
80
100
Yes No Do not know
Odour
Taste
Colour

26
Appreciation of Water Services
On the whole, 74.2% of households surveyed have access to portable water all year round,
while 93.1% have access to portable water all day. The high access to portable water year
round can be explained by the fact that majority of the communities develop their water supply
systems from natural sources such as rivers and springs. Even though there is a high availability
of water supply, a great number of household members (63.3%) walk for more than 15 minutes
to fetch water, 18.2% for 15 to 30 minutes and 9 % for more than 30 minutes. Only 9.5% of
households fetch water on the spot.
Figure 8: Time used on Foot to fetch water for the Household (%)
Source: survey report CCPA Muyuka, 2017
In order to make water more accessible, it is necessary for the water supply pipelines to be
expanded, in order to supply more numbers of households. This will help reduced the time
household members spend to fetch water.
The proportion of households who said their public water source has been damaged within the
3 months was 35.4 %. Out of these, 44.9 % of them said that the public water source had been
damaged within a week to a month before any repairs are made. 35.5% of them experience
damage of the water sources for less than a week and 14.6 experience water damage problems
for more than three months before repairing. Just 2.1 % of the households in Muyaka have
undisturbed access to water.
Figure 9: Period Used for the Maintenance of Damaged Water Points (%)
0
10
20
30
40
50
60
70
On the Spot < 15 minutes 15 to 30minutes
> 30 minutes

27
Source: survey report CCPA Muyuka, 2017
For those households who reported the repair of a damaged water point, it was necessary to
find out which person or institution was responsible for the repairs. The survey showed that,
51.6% of the reported cases were solved by village and quarter heads, 20.4% was handled by
other partners/stakeholders (CSOs, NGOs, Foreign Agencies etc.), 9.4% handled by the
committee in charge of water supply, 8.6 by the council and 7.0% by the elites. No government
projects are involved in water supply and maintenance in Muyuka, so their water supply is
mainly managed at community and quarter levels. This is illustrated below.
Figure 10: Main stakeholders in charge of meeting the needs expressed by households in terms of
portable water supply (%)
Source: survey report CCPA Muyuka, 2017
The maintenance of water supply in Muyuka is highly dependent on the chief’s/quarter heads
and other partners. The water committee, the council and the elites contribute below 30% in
35,5
44,9
2,8 14,6
2,1
Less than a week
1week-1month
1month -3months
Greater than 3months
Not yet
0 10 20 30 40 50 60
Council
State
Elites
water supply comittee
chief/quarter heads
Administrative authorities
other partners

28
water supply maintenance. Considering these findings, it will be necessary for the government
to assist in getting involved in water supply projects to increase water access.
Dissatisfaction with the Provision of Portable Water Supply
In all 31.9% of households expressed their dissatisfaction in the provision of portable water
supply. The main reason for dissatisfaction pointed out by households in Muyuka in terms of
water supply is the insufficiency of the water supply, which accounts for 52.2% of household
dissatisfaction. Poor water quality accounts for 42% of the dissatisfactions and 29.7%
dissatisfaction for the remoteness from water source. Poor water supply dissatisfaction was
15.4%, delayed repairs of the water points 12.9% and less than 5 % of households expressed
dissatisfaction in terms of cost. This is shown below.
Figure 11: Reasons for Households Dissatisfaction with the Provision of Portable Water Supply
Services (%)
Source: survey report CCPA Muyuka, 2017
The reasons for households’ dissatisfaction are mainly because of insufficient water supply,
poor water quality, and remoteness from the water source. This is because the water supply is
mainly dependent on community actions which are not well coordinated.
3.2.5 Main Expectations in the Supply of Portable Water
With respect to the supply of portable within the Muyuka municipality, the households sampled
had a number of expectations from the services in charge. 56.5% of the households expect an
increase in water supply sources inspired by shortages in water supply within the community.
22.4% of the households expect improvement in the management of the existing water supply
0
10
20
30
40
50
60
Remotenessfrom water
source
poor waterquality
Insufficentwater supply
sources
Poor watersupply
management
Delay inrepairs of
water points
High cost ofwater supply

29
sources which will provide a more consistent water supply day and year round. Also, other
households expected the repairs of damaged existing water points (13.5%), improvement of
the quality of the existing water sources (15.5%), and other expectations (19.3%). Expectations
in reducing the cost of water were 1.8%.
Figure 12: Household Expectations with respect to Water Supply Services
Source: survey report CCPA Muyuka, 2017
Overview of Household Perception on Portable Water Supply Services and
Suggested Recommendations
In all, the Muyuka municipality has very high access to portable water as examined above,
but due to poor management, quality, and delayed repairs, access is not consistent
throughout the year. The problems so far identified for amelioration include:
Lack of funding for maintenance of water systems.
Remoteness and insufficient portable water supply sources within the community
Poor management of water supply sources, and poor quality of water
Inadequate communication between the population and water supply management
authorities
This has given rise to some suggested which if handled, will improve the availability and
quality of portable water within the community.
Increase of government involvement in water supply.
More water supply points should be constructed within the municipality
0
10
20
30
40
50
60
Increase watersources
improve mgt ofexisting sources
repair existingwater sources
improve qualityof exiating
water sources
Reduce cost ofwater supply
other
30
Organize workshop to train water management committee on how to manage their water
supply system.
More communication should be done between the water authorities and the citizens.
Repair works should be carried out on damaged water points.
Community water schemes should be put in place.
Buffer zones should be respected in order to improve on the quality of water.
Sensitization on the protection and the management of potable water to the populations.
Notify the population on time in case of water cuts.
Health Sector
The Government of Cameroon has invested much in the sector of heath in the Muyuka
municipality. A District Medical Hospital, Medical Health Center (CMA), Integrated Health
Center coupled with authorized private clinics is available in these communities. Communities
with either public or private health infrastructure are Muyuka, Eknona Mbenge, Malende,
Bafia, Ikata, and Munyenge. The most prevalence diseases reported in the health sector are
malaria and typhoid. Sexually transmitted diseases like HIV/AIDS, syphilis and gonorrhea as
testified by officials of these centres. Common problems related to health are inadequate
medical equipment and staff.
3.3.1 Availability and Utilisation
From all households sampled within the survey, private health centres appear to be most
accessible to households within the community with a response rate of 45.5%, followed by
public integrated health centres with 38.7%, and hospitals/CMA with 7.8%. Unfortunately, 8%
of households do not have any health unit near their households. The figure below helps
demonstrates the proximity of health units to households within the community.

31
Figure 13: Closest Health Units to Households within Muyuka Municipality
Source: survey report CCPA Muyuka 2017
Though, a number of health centres are quite close to the households, it was necessary to find
out the actual time required to get to these health units. The figure below shows that the larger
portion of households can get to the closest health unit within 15 minutes, 28.9% between 15
and 30 minutes, and 15.2% above 30 minutes to the health.
Figure 14: Time used to get to the nearest Health Center by Households in the Community
Source: survey report CCPA Muyuka, 2017
The research further revealed that, most households (49.4%) take preference to Public
integrated health centres when health issues arise within the house. 29.2% prefer private health
centres while 20.3% prefer going to the hospitals.
38,7
7,8
45,5
8
Private Health Cent
Hospital/CMA
Private Health Center
Others
55,9
28,9
15,2
0
10
20
30
40
50
60
<15 minutes 15-30 minutes >30 minutes

32
Figure 15: Households preference of Health service in case of Illness
Source: survey report CCPA Muyuka, 2017
Of all households sampled, 56.7% are use the nearest health care unit to their households. With
proportion, they are quite aware of the persons in charge of the health unit. The survey revealed
that 62.3% of the nearest health care units used by households are headed by medical doctors,
while 18.6% and 0.8% are headed respectively by nurses and assistant nurses. Unfortunately,
10.8% are not aware of the person responsible for the nearest health care unit which they use.
3.3.2 Quality and Cost of Health Services
In terms of quality of health service, the survey was interested in finding out the situation of
the health unit the last time a member of households visited the facility, in terms of personnel,
availability of medications, and equipment.
They survey revealed that, almost all health units used by households had the medical personnel
present, as seen by a 97% response from all households sampled. Also, minor equipment
(syringes, alcohol, scissors, etc.) where available in the health facility as said by 96% of
households. This shows that the health units are capable of carrying out minor emergency
cases. Also, 99.4% of households said hospitalisation wards were available for admission of
patience. In these hospitalisation wards, 5.6% of households reported less than 5 beds found in
the wards, 11.4% reported 5 to 10 beds, and 27.6% reported more than 10 beds, while 55.4%
could not tell the number of beds found in the ward.
With regards to availability of medication within the health care unit, all of the households
reported the availability of a pharmacy or pro-pharmacy, while 70.6% of households said the
pharmacies actually had drugs during their visit to the nearest health care unit.
49,4
20,329,2
0 0 1,10
10
20
30
40
50
60
Public integratedhealth center
Hospital/CMA Private HealthCenter Auto-Medication
Medical Staff Self-medication Others

33
In terms of cost of health services, 88.9% of households reported paying an amount of money
for consultation at the nearest health care unit visited.
Figure 16: Cost of Consultation of Households
Source: survey report CCPA Muyuka, 2017
From the figure, 56.3% of households reported paying between 500 and 1000 FCFA for
consultation, 28.7% above 1000 FCFA, and 15% below 500 FCFA. With these different costs
of consultation, 76.6% of households found the amount to be reasonable or affordable, while
22.9% found the amount to be high for them, and 0.5% said the amount was insignificant to
them and posed no inconveniences for them.
3.3.3 Appreciation of Health Services
In general, the majority of households sampled revealed that they found the attitude of the
medical staffs at the nearest health care unit visited to be good, as seen by a 56.6% response
rate, while 39% said their attitude was fair.
Figure 17: Appreciation of Medical Staff by Households
Source: survey report CCPA Muyuka, 2017
15
56,3
28,7
<500
between 500 and 1000
more than 1000
65.1
19.4
0
10
20
30
40
50
60
Good Fair

34
In general, the majority of households sampled revealed that they found the attitude of the
medical staffs at the nearest health care unit visited to be good, by a 65.1% response rate, while
19.4% said their attitude was fair.
In all, 68.3% of households agreed that, the nearest health care unit was capable of providing
appropriate solutions to a good number of health problems faced by the household.
3.3.4 Dissatisfaction of Households with Health Services
Only 28.4% of households were not satisfied with their health services, and were attributed to
reasons as remoteness of health care units, high cost of health care, insufficient drugs,
insufficient and poor equipment of the health unit etc.
3.3.5 Expectations of Households with regards to Health Services
As always, households are not short of expectations from the health sector. 25.8% of
households expect an increase in the number of health care units within the municipality, while
23.4% expect the provision of more and better equipment within the health care units. 16.6%
and 14.9% of households respectively, expect the supply of more drugs to health care units,
and the transfer of a medical personnel from the health care unit. 48.7% expect other
improvements of the health care units.
Figure 18: Households expectations of health service sector
Source: survey report CCPA Muyuka, 2017
3.3.6 Overview of Households perception on Health Services and Suggested
Recommendations
On a general note, the provision of health services within the Muyuka municipality is highly
appreciated by the population due to;
Availability of medical personnel at the various health care units
Availability of basic materials and equipment in health care units
25,816,6 14,9
23,4
48,7
0
10
20
30
40
50
60
More Health careunits
Supply of DrugsTransfer of medical
personnel
transfer of medicalstaff
supply ofequipments
others

35
The existence of pharmacies/pro-pharmacies within the various health care units
About 90% of the population judge the consultation fee to be insignificant or reasonable
The population have a good perception of the reception in health
The population is satisfied or generally satisfied with the health services offered in the
community
The non-preference for traditional medication in case of health problems
Though health care services are quite good within the municipality, some ameliorations need
to be done, to provide better quality services to the population. To help them achieve this goal,
it is suggested that;
More drugs should be made available within the health care units, and a detailed list of all
drug prices, including all other fees to be paid for any service from the unit.
Lobby for more medical personnel
More hospital equipment should be provided for the health care units.
Build capacity of medical staff of the health units.
Mayor should take up responsibilities in setting up dialogued structures within the different
health structures.
3.4 Educational Sector (Basic, Primary, Secondary and Vocational training)
Various educational institutions present in this Municipality are the public and lay private
schools at both basic and secondary level. Though the government has put in place technical
services (sub divisional inspectorate for basic education and Delegation of secondary
education) to monitor the smooth functioning of various schools in this municipality, these
institutions still face the problem of inadequate pedagogic materials, limited classrooms and
desks, ill equipped technical services and limited staff.
It should however be noted that, the actual number of households who answered questions with
regards to nursery and secondary education were less than 50 but greater than 25, and so a
genuine conclusion cannot really be drawn from their responses given the small sample size.
But their responses will serve just as an eye opener to the services involved. For the purpose
of our analysis, these figures of nursery and secondary education will be presented in
parenthesis. Also, the sample of households who actually answered questions with regards to
vocational training was less than 25 households, and so these responses will not be considered
in the framework of the study.

36
3.4.1 Availability and Utilization of Educational Services
The survey revealed the existence of nursery, primary and secondary institutions within the
municipality. All households with children in nursery school confirmed the existence of
nursery schools within their quarter/village, that is (100%), 99% of all households declared the
presence of a primary school within their village/quarter, and (97.2%) declared the presence of
a secondary school within their village/quarter. Within the community, the average number of
children per households attending the nursery school within the village/quarter was reported to
be approximately (1) child, 1 child still for primary, and (1) child also for secondary.
The distance to be covered by children of households to get school was also analysed, and it
showed the following;
Figure 19: Distance Covered by Households Children to get to School.
Source: survey report CCPA Muyuka, 2017
The survey revealed that, most nursery and primary and secondary schools are less than a
kilometer from the households as reported (58.8%, 56% and 31.7% respectively). 12. 1%,
14.1% and 25.8% of the households said that their children walk between 1 to 5 KM before
they arrive the nursery, primary and secondary schools respectively. 23.2 % of the households'
secondary students walk for over 5KM before arriving school, while less than 10% of
households with nursery and secondary students walked for over 5 KM. Many of the
households with students from the primary and secondary schools did not know the distance
they covered, the proportion is 20.5% and 19.3 % respectively.
It was also of interest to know if the various schooling institutions disposed of the complete
cycles as required by standards. The survey revealed that, most of the primary and secondary
schools have complete cycles as required. (96.1%) of households agree that the primary schools
58,8
12,1
4 4,5
56
14,19,4
20,5
31,725,8
23,219,3
0
10
20
30
40
50
60
70
<1KM 1 to 5 KM > 5 KM DON'T KNOW
Nursery
Primary
Secondary

37
had a complete cycle, while (95.4%) and (81.5%) of households declared respectively that the
secondary first and second cycle are both complete.
Figure 20: Availability of Class rooms and Benches within Educational Institutions
Source: survey report CCPA Muyuka, 2017
In addition, over 80% of all households said that every educational institution had all required
class rooms and all students were sited on benches. 12.6% of the households said that text
books were given to the pupil in nursery school and 10.3% of the households with children in
primary schools said that the pupils were given text books in schools. No text books are given
in secondary schools in the Muyuka municipality.
3.4.2 Quality and Cost in the Provision of Educational Services
The quality and cost of education is very vital for the development of any nation, and so some
emphasis was laid in finding out these aspects of the nursery, primary and secondary
educational systems. In the framework of this study, the main variables used in measuring the
quality of education included; number of children per classroom and attendance of teachers,
while the variables for cost included; average annual cost of tuition per child and additional
expenditures.
80
85
90
95
100
Nursery Primary Secondary
Classroom Benches

38
Figure 21: Average Number of Pupil/Students per Classrooms
Source: survey report CCPA Muyuka, 2017
The data obtained from the households with children in nursery schools could serve as a clue
to the number of students per class in nursery schools. Generally, 23% to 37% of the
households' said that there are averagely 30 to 60 students per class in the schools. In the
secondary schools 37.3% of the household said that there were above 60 students in a class,
and 10.6% in primary schools with above 60 children per class. A significant majority (24% to
31.6%) of respondents did not know the average number of students in a class.
Figure 22: Attendance frequency of Teachers
Source: survey report CCPA Muyuka, 2017
It was also necessary to know if the teachers were regular in school attendance. In line with
this, over 80% of household respondents said that the teachers were regular in the nursery and
primary schools, just less than 5% of respondents said the teachers were irregular or did not
know as concerns the nursery and primary schools. 69.9% of respondents said that the teachers
45,6
23
6,9
24,620,2
37,6
10,6
31,6
8,7
22,8
37,3
31,1
0
10
20
30
40
50
<30 students 30-60 students >60 students don’t know
Nursery primary secondary
0
20
40
60
80
100
Regular Average Irregular Don't know
Nursery Primary Secondary
39
were regular in the secondary schools, 13.8% were averagely irregular, 10.6% were irregular
and 5% did not know.
With regards to cost, almost all of the household pay the fees required for education (98%-
100%). However, the appreciation of the amount of money spent were divers with respect to
the respondents as shown below. It should be noted that the data obtained from the nursery
sector can only serve as an eye opener.
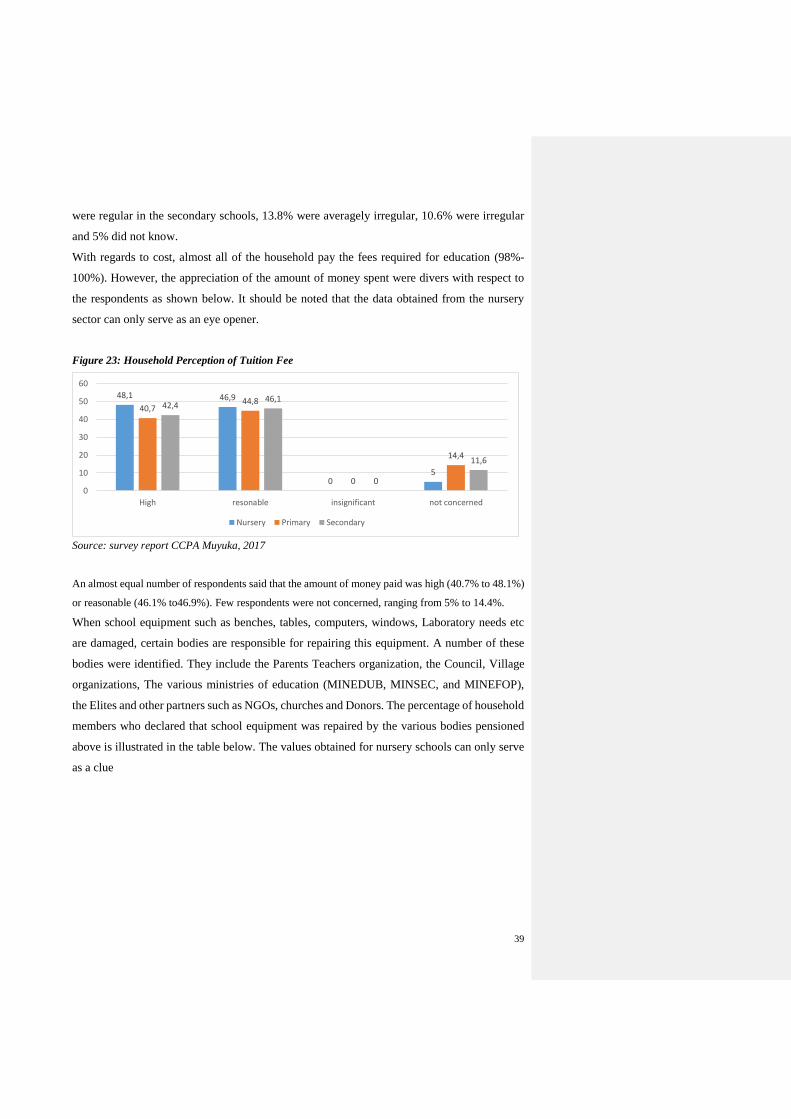
Figure 23: Household Perception of Tuition Fee
Source: survey report CCPA Muyuka, 2017
An almost equal number of respondents said that the amount of money paid was high (40.7% to 48.1%)
or reasonable (46.1% to46.9%). Few respondents were not concerned, ranging from 5% to 14.4%.
When school equipment such as benches, tables, computers, windows, Laboratory needs etc
are damaged, certain bodies are responsible for repairing this equipment. A number of these
bodies were identified. They include the Parents Teachers organization, the Council, Village
organizations, The various ministries of education (MINEDUB, MINSEC, and MINEFOP),
the Elites and other partners such as NGOs, churches and Donors. The percentage of household
members who declared that school equipment was repaired by the various bodies pensioned
above is illustrated in the table below. The values obtained for nursery schools can only serve
as a clue
48,1 46,9
05
40,744,8
0
14,4
42,446,1
0
11,6
0
10
20
30
40
50
60
High resonable insignificant not concerned
Nursery Primary Secondary

40
Figure 24: Institutions in charge of maintenance activities within schools in case of damages
Source: survey report CCPA Muyuka, 2017
The PTA is highly involved in the repairs, with a proportion of 60% and above, as declared by the
household members. The council, village organisations, the ministries of education, elites and other
organisations/ partners all contribute less than 10% in repairs as stated by household members, even
though they contribute more to the secondary schools than the primary and nursery schools.
3.4.3 Appreciation of Educational Services
A proportion of household members who have children attending the various cycles of
education were dissatisfied with the services provided by the schools. 15.1% were dissatisfied
with the nursery services, 19.5% dissatisfied with primary education and 17.3 not satisfied with
the secondary education. They expressed their dissatisfaction based on criteria such as distance
of school from house, lack of class rooms, lack of equipment, lack of schools, lack of qualified
teachers, and absence of distribution of school text books, poor results, high cost and other
reasons. The data obtained however can only serve as an eye opener to their dissatisfaction and
may not be statistically significant. This is illustrated bellow.
0
10
20
30
40
50
60
70
80
PTA Council Vilageorganisations
The Ministry Elites Other partners
Nursery Primary Secondary

41
3.4.4 Dissatisfaction of Households with Educational Services
Figure 25: Level of Satisfaction of Households with Educational Services
Source: survey report CCPA Muyuka, 2017
Over 24% of household participants expressed their dissatisfaction because of lack of qualified
teachers in the respective educational cycles. Less than 26% were dissatisfied because of lack
of class rooms and lack of schools. 10% to 27% expressed their dissatisfaction with the primary
schools, 10% to 36% of the households were not satisfied with the nursery education and 7%
to 26 not satisfied with the services of the secondary education. The highest concern was with
regards to the services offered by the nursery services.
3.4.5 Expectations of Households with regards to Educational Services
To ensure that the education of the children of the households to conducive, households have
a number of expectations. Many of them expect that class rooms should be added to create
more space for students, also employing qualified teachers is expected by the households. Other
expectations were raised by the participants as shown below
0
5
10
15
20
25
30
35
40
Nursery Primary Secondary

42
Figure 26: Expectation of Households with respect to Educational Services
Source: survey report CCPA Muyuka, 2017
The need for more teachers is highly expected by the household participants, with 19.1% for
the nursery schools, 21.2% for primary schools, 17.7% for secondary schools and 8.2% for
vocational training centres. More also needs to be done in adding wore class rooms to the
various educational cycles, with 17.3% for nursery schools, 21.2% for the primary schools,
15.2% and 3.2 for secondary and vocational training centres respectively. Also less than 10%
of the participants expect a drop in cost for education, have a school close to the house, and
equipment and shear text books in schools at the various educational levels. Less than 1% of
the participants expect more schools to be constructed, except vocational training centres
whose expectation is at 9.0%. Between 10% to 15% had other expectations at the nursery,
primary and secondary levels of education.
3.4.6 Overview of Household perception of Educational Services and Suggested
Recommendations
On a general note, the provision of educational services within the Muyuka municipality is
highly appreciated by the population due to;
Availability of nursery, primary and secondary cycles of education
Availability of basic materials and equipment in schools.
Availability of staff
Above 80% of the population are able to pay for their child’s education
The population have a good perception of the educational systems
The population is satisfied or generally satisfied with the educational services offered in
the community
0
5
10
15
20
25
School closeto House
More Classrooms
Moreequipments
moreschools
more staff shearschool
manuals
improve onresults
reduce cost others
Nursery Primary secondary Vocatioanl training

43
Though educational services are quite good within the municipality, some ameliorations need
to be done, to provide better quality services to the population. To help them achieve this goal,
it is suggested that;
More vocational training centres should be made available to promote skilled talents
More school equipment should be provided for schools, so as to improve the quality of
educational care services provided to the public.
Improve on the capacity of teaching staff to better render educational care services to the
population.
School infrastructure should be provided in all areas of the municipality.
3.5 Communal Services
The council represents the decentralised local authority at the level of the community, headed
by the mayor. As such, the council has the authority to provide certain services to the population
which it serves. Hence, this study was also in a bit to find out the various services offered by
the council to its community, the quality of these services and the perception of households
with regards to these services.
3.5.1 Availability and Utilization of Council Services
There are several reasons why the people of the Muyuka visit the council. According to the
study, the following communal services were evaluated and the time spent by the households
before the service was rendered. However, the data obtained on the time taken to deliver these
services was too small to be considered of statistical significance. Hence the study will focus
more on the proportion of households who went to the council to apply for one of its services
as illustrated bellow.
Figure 27: Councils Services as demanded by Households
Source: survey report CCPA Muyuka, 2017
0
2
4
6
8
10
12
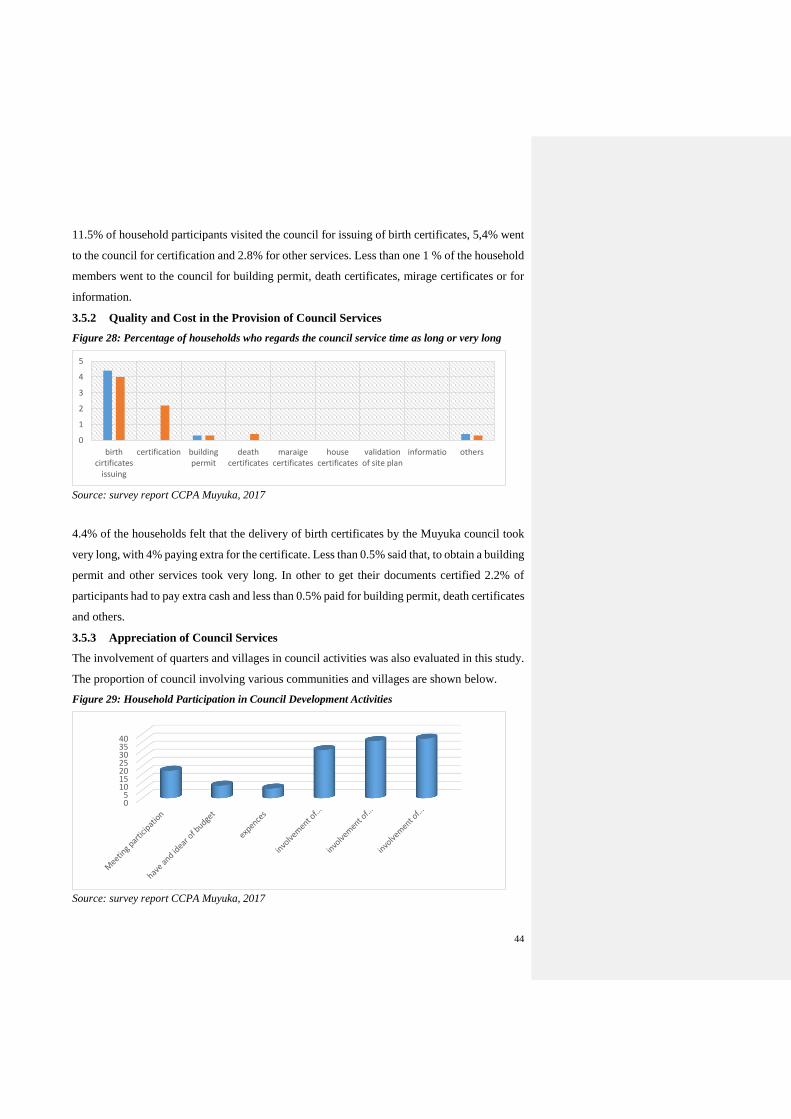
44
11.5% of household participants visited the council for issuing of birth certificates, 5,4% went
to the council for certification and 2.8% for other services. Less than one 1 % of the household
members went to the council for building permit, death certificates, mirage certificates or for
information.
3.5.2 Quality and Cost in the Provision of Council Services
Figure 28: Percentage of households who regards the council service time as long or very long
Source: survey report CCPA Muyuka, 2017
4.4% of the households felt that the delivery of birth certificates by the Muyuka council took
very long, with 4% paying extra for the certificate. Less than 0.5% said that, to obtain a building
permit and other services took very long. In other to get their documents certified 2.2% of
participants had to pay extra cash and less than 0.5% paid for building permit, death certificates
and others.
3.5.3 Appreciation of Council Services
The involvement of quarters and villages in council activities was also evaluated in this study.
The proportion of council involving various communities and villages are shown below.
Figure 29: Household Participation in Council Development Activities
Source: survey report CCPA Muyuka, 2017
0
1
2
3
4
5
birthcirtificates
issuing
certification buildingpermit
deathcertificates
maraigecertificates
housecertificates
validationof site plan
informatio others
05
10152025303540

45
The Muyuka council involves its communities and villages in executing development projects.
37.2% of the households said that the communities are involved in budgeting, 35.7% of
households said that the community was also involves in planning and a proportion of 30.1%
of household believed that the council involved the community in development activities. 17.2
% of participants take part in council meetings, and less than 10% of households had
knowledge on the expenses and budgeting of the council.
3.5.4 Dissatisfaction of Households with Council Services
Even though the council does a good work in providing services and involving its communities
in its development actions, a proportion of 47.4% of the households expressed their
dissatisfaction with regards to provision of these services.
Figure 30: Reasons for Non Satisfaction of Council Services of Households
Source: survey report CCPA Muyuka, 2017
However, 42.8% were not satisfied with how transparent the council is, 33.2% felt that the
communities were not involves in communal development and a proportion of 15.9% were not
happy with the behaviour of the staff at the Muyuka council. Less than 5% were not satisfied
with reception upon application for services and the presence of council executives in their
office, and a proportion of 55.3% of households were not satisfied for other reasons.
3.5.5 Expectations of Households with regards to Council Services
The households involved in the study also expressed their expectations from the council in
carrying out its activities. The proportion of expectation can be seen in the figure below;
0
10
20
30
40
50
60
treatment of serviceapplicants
non involvement ofpopulation
weeknesses ofstaff/poor
reception/curuption
non transparency absence of councilexecutives
others

46
Figure 31: Households expectations from council services
Source: survey report CCPA Muyuka, 2017
A proportion of 61.9% of households had expectations from the Muyuka council. However,
20.4% expressed their expectations in involving the population and communicating.
Expectations for transparency and close relationship with authorities have proportions of
12.1% and 12.4% respectively.
3.5.6 Overview of Household perception of Council Services and Suggested
Recommendations
On a general note, the provision of council services within the Muyuka municipality is highly
appreciated by the population due to;
Provision of communal services to the population
Provision of development projects and budgeting for various communities.
Availability of staff
The population have a good perception of council activities
The population is satisfied or generally satisfied with the council services
Though educational services are quite good within the municipality, some ameliorations need
to be done, to provide better quality services to the population. To help them achieve this goal,
NADEV suggest the following;
More transparency of the council in its budgeting and expenditures
Improvement on council staff behaviours.
Timelines in providing services.
More communication between the council and its population.
The council should get involved in all the stages in the action plan (Health, Education,
Water supply).
010203040506070
Moreinvolvementof population
morecomunictionon actions of
council
transparency closerelationship
withauthorities
others

47
3.6 Conclusion and Principal Recommendations
The aim of the ScoreCard survey done in the Muyuka municipality was to assess the
population’s perception on Water Supply Services, Health Care Services, Educational
Services, and Council Services. Though these services are appreciated by the people of the
municipality, NADEV has put in place the following recommendations for each of these
sectors.
Water Supply;
Increase of government involvement in water supply.
More water supply points should be constructed within the municipality
Organize workshop to train water management committee on how to manage their water
supply system.
More communication should be done between the water authorities and the citizens.
Repair works should be carried out on damaged water points.
Community water schemes should be put in place.
Buffer zones should be respected in order to improve on the quality of water.
Sensitization on the protection and the management of potable water to the populations.
Notify the population on time in case of water cuts.
Health Sector;
More drugs should be made available within the health care units, and a detailed list of all
drug prices, including all other fees to be paid for any service from the unit.
Lobby for more medical personnel
More hospital equipment should be provided for the health care units.
Build capacity of medical staff of the health units.
Mayor should take up responsibilities in setting up dialoged structures within the different
health structures.
Education Sector;
More vocational training centres should be made available to promote skilled talents
More school equipment should be provided for schools, so as to improve the quality of
educational care services provided to the public.
Improve on the capacity of teaching staff to better render educational care services to the
population.
School infrastructure should be provided in all areas of the municipality.

48
Council Services;
More transparency of the council in its budgeting and expenditures
Improvement on council staff behaviours.
Timelines in providing services.
More communication between the council and its population.
The council should get involved in all the stages in the action plan (Health, Education,
Water supply).

49
CHAPTER FOUR
ACTION PLAN FOR THE IMPLEMENTATION OF CITIZEN CONTROL OF PUBLIC ACTION
Program for the Dissemination of Results and Presentation of Action Plan
Table 2: Program for the Dissemination of Results and Presentation of Action Plan.
Phase Activities Expected Results Responsible Partners Start date End date
Production of
Reports
Submission of draft report
Final scorecard
report is available CSO
PNDP 28/04/2018 30/04/2018
Reading of the report Review panellists 01/05/2018 10/052018
Reading workshop
PNDP
Review panellists
Representatives of all
sectors involved 14/05/2018 26/05/2018
Submission of final report PNDP 28/05/2018 03/06/2018
Negotiation of
Recommendations
Restitution workshop for
councils
1. Lessons learned
and expected
changes
2. List of
negotiated
changes
PNDP
CSO
Review panellists
Representatives of all
sectors involved
05/06/2018 12/06/2018
Dissemination of
results Broadcasting of results
Results are fully
broadcasted to the
general public
CSO PNDP
Media houses 17/06/2018 06/07/2018
Implementation
Implementation of
accepted changes to
different sectors
Accepted changes
are implemented
Respective
sectors
PNDP
CSO 17/06/2018 14/08/2018
Action Plan for the Implementation of the Citizen Control of Public Action.
Table 3: Problems Identified, Suggested Solution and Level of implementation.

50
Sector Problems identified Suggested Solutions Level of implementation
Local1 Central
water
Remoteness of household from water
source
Poor water quality
Insufficent water supply sources
Poor water supply management
Delay in repairs of water points
High cost of water supply
Increase of government involvement in water supply.
Portable water sources should be increased within the community,
as some households used more than 30 minutes to fetch water for
their households.
Organize workshop to train water management committee on how
to manage their water supply system.
A good communication system should be put in place by the main
water distribution agency CAMWATER/Ministry, to better
communicate any problems arising with the main public water
supply sources.
Damaged existing sources of portable water supply should be
repaired as soon as possible because these damaged points increase
the pressure on other water points meant to serve a number of
households only.
The council authority should make available community water
schemes to help reduce the cost of households in getting portable
water.
The quality and quantity of portable water is a major player in the
health of households, and so special measures should be taken by the
authorities in charge to ensure very good quality of portable water
going into households within the community.
Commu
nities
CAMWATER,
Council

51
Buffer zones should be respected in order to improve on the quality
of water.
Sensitization on the protection and the management of potable
water to the populations.
Notify the population if the will be any water cut off.
Sector Problems identified Suggested Solutions Level of implementation
Local2 Central
Health Remoteness of health care units,
high cost of health care,
Insufficient drugs,
Insufficient and poor equipment of
the health unit
More drugs should be made available within the health care units,
and a detailed list of all drug prices, including all other fees to be
paid for any service from the unit.
More staff and hospital equipment should be provided for the health
care units, so as to improve the quality of health care services
provided to the public.
Improve on the capacity of medical staff to better render health care
services to the population.
Empower monitoring and evaluation committee for all health care
units at the communal level, to promote quality health service
management and delivery within the municipality.
Mayor should take up responsibilities in setting up dialogued
structures.
Hospital
s,
Clinics,
Health
centres
and
Commu
nities
District Medical
Officer, Council

52
Sector Problems identified Suggested Solutions Level of implementation
Local3 Central
Education
Distance of school from household.
Lack of class rooms
Lack of equipments
lack of schools
Lack of qualified teachers
No school manuals distributed
Poor results
High cost
More vocational training centres should be made available to
promote skilled talents
More school equipment should be provided for schools, so as to
improve the quality of educational care services provided to the
public.
Improve on the capacity of teaching staff to better render educational
care services to the population.
More school manuals should be distributed in schools in order to
ensure students active participation.
Make schools more accessible by improving on the road conditions
leading to these schools.
School infrastructure should be provided in all areas of the
municipality.
Schools,
Division
al
Delegati
on
MINEDUB
MINSEC
Council.

53
Sector Problems identified Suggested Solutions Level of implementation
Local4 Central
Council
Services Lack of transparence
Non Involvement of population
in council activities
Poor reception by council staff.
More transparency of the council in its budgeting and expenditures
Improvement on council staff behaviours.
Timelines in providing services.
More communication between the council and its population.
The council should get involved in all the stages in the action plan
(Health, Education, Water supply).
Council Ministry of
Territorial
Administration
Table 4: Action plan.
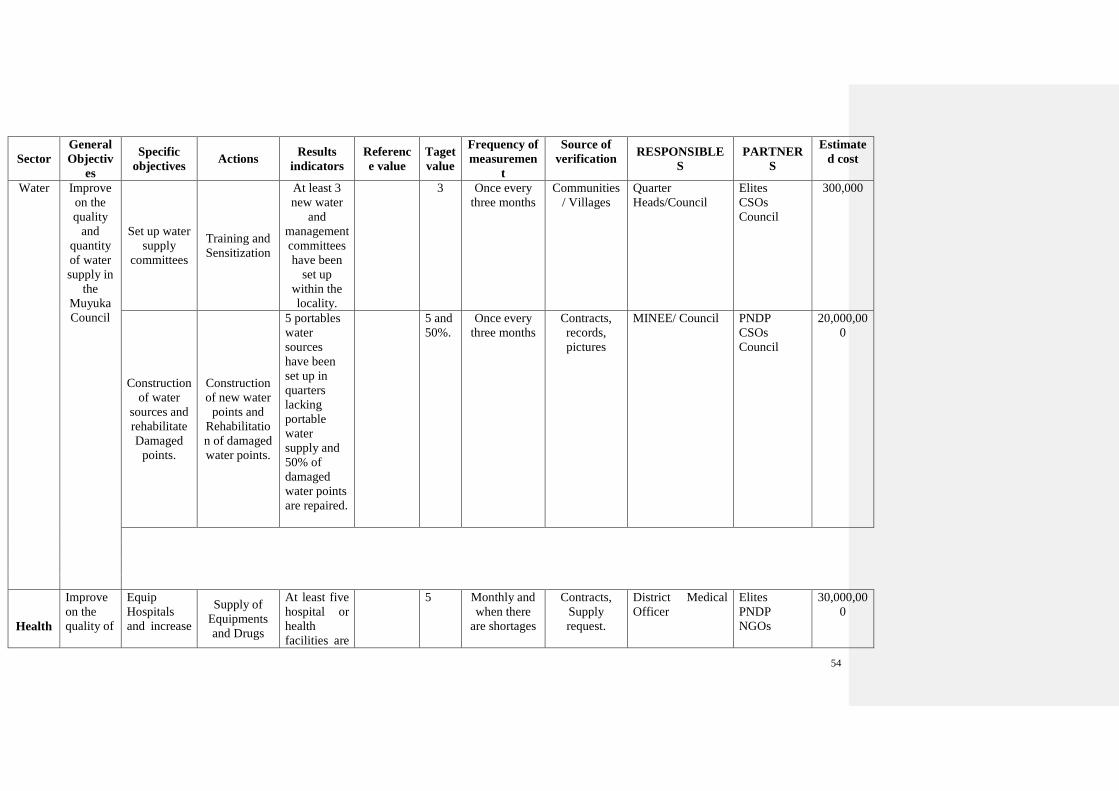
54
Sector
General
Objectiv
es
Specific
objectives Actions
Results
indicators
Referenc
e value
Taget
value
Frequency of
measuremen
t
Source of
verification RESPONSIBLE
S
PARTNER
S
Estimate
d cost
Water Improve
on the
quality
and
quantity
of water
supply in
the
Muyuka
Council
Set up water
supply
committees
Training and
Sensitization
At least 3
new water
and
management
committees
have been
set up
within the
locality.
3 Once every
three months
Communities
/ Villages
Quarter
Heads/Council
Elites
CSOs
Council
300,000
Construction
of water
sources and
rehabilitate
Damaged
points.
Construction
of new water
points and
Rehabilitatio
n of damaged
water points.
5 portables
water
sources
have been
set up in
quarters
lacking
portable
water
supply and
50% of
damaged
water points
are repaired.
5 and
50%.
Once every
three months
Contracts,
records,
pictures
MINEE/ Council PNDP
CSOs
Council
20,000,00
0
Health
Improve
on the
quality of
Equip
Hospitals
and increase
Supply of
Equipments
and Drugs
At least five
hospital or
health
facilities are
5 Monthly and
when there
are shortages
Contracts,
Supply
request.
District Medical
Officer
Elites
PNDP
NGOs
30,000,00
0

55
Health
health
services.
Improve
on the
quality of
health
services.
Drug
Supply.
well
equipped
with
materials
and supplied
with drugs
of essential
drugs.
Hospital
records
Supply
company
records.
Private
Clinics.
Council
Reinforce
the capacity
of health
personnel. Workshops
and Training
Sessions
At least 75%
of health
personnel
within the
locality have
been
properly
trained
75% Twice in three
months
Attendance
sheets,
pictures
District Medical
Officer
Elites
PNDP
CSOs
Private
Clinics.
Council
300,000
Community
Health
Visits
House to
house visits
and
consultation
At list 20
community
visit has
taken place
within two
years.
20 Once every
three months
Communities
/ Villages
District Medical
Officer
Private
Clinics
Council
1,000,000
Education Improve on
the quality
of
Education at
all levels
concerned
Build and
Equip
schools
and class
rooms.
Contract class
rooms and
supply of
equipments
Two vocational
training center,
and two
Secondary
schools have
been built and
equipped within
the locality
2 As often
as
possible
Contracts,
Pictures,
supply
Forms.
MINEDUB
MINSEC
Elites.
NGOs
PNDP
Churches.
Council
20,000,000
Reinforce
capacity of
teachers.
Training and
Workshops
At least 80% of
teachers within
the locality
have been
properly trained
80% Once
every
three
months
Attendance
sheet,
Pictures
MINEDUB
MINSEC
Elites
Council
400,000

56
Sensitizing
population
on
education
benefits.
Household
visits
At least 80% of
the population
have been
sensitized on
the benefits of
Education
80% Weekly Pictures MINEDUB
MINSEC
Elites.
NGOs
PNDP
Churches
Council
100,000
Council
Services
Improve on
the quality of
services
provided by
the council
Organize
sensitization
campaigns
on council
activities
and
services.
Workshops
and Training
activities
About 35% of
the community
participate in
council sessions
35% Pictures,
attendance
sheets
Council PNDP
CSOs
300,000
Train
council staff
on working
Ethics
Training and
workshops
At least 75% of
council workers
within the
locality have
been properly
trained
75%0. Attendance
sheets,
Pictures
Council PNDP
CSOs
300,000
Make
Public the
council
investment
budget.
Meetings and
Publicities
At least 55% of
the
municipality
are aware of the
council’s plan
of action and
budget
55% Notice
Boards,
Radio,
Newspapers.
PNDP
Council
MINATD
Village/Quarter
Heads,
CSO,
Elites
100,000
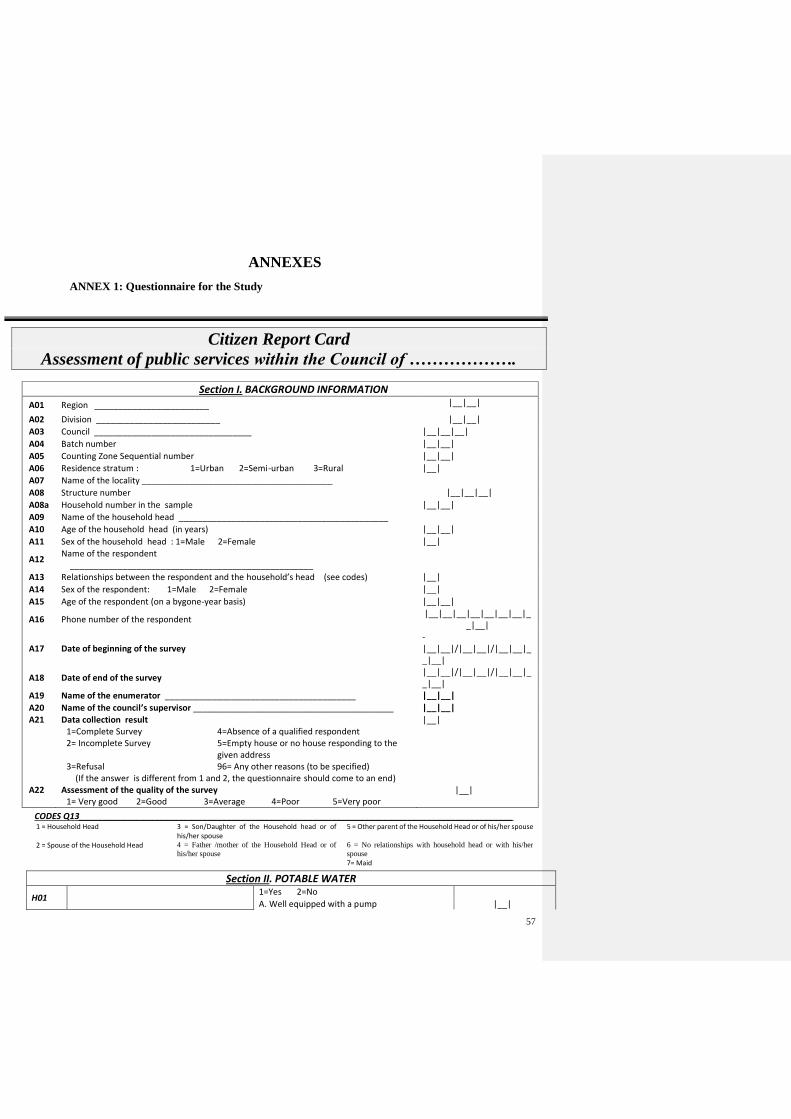
57
ANNEXES
ANNEX 1: Questionnaire for the Study
Citizen Report Card
Assessment of public services within the Council of ……………….
Section I. BACKGROUND INFORMATION
A01 Region ________________________ |__|__|
A02 Division __________________________ |__|__|
A03 Council _________________________________ |__|__|__|
A04 Batch number |__|__|
A05 Counting Zone Sequential number |__|__|
A06 Residence stratum : 1=Urban 2=Semi-urban 3=Rural |__|
A07 Name of the locality ________________________________________
A08 Structure number |__|__|__|
A08a Household number in the sample |__|__|
A09 Name of the household head ____________________________________________
A10 Age of the household head (in years) |__|__|
A11 Sex of the household head : 1=Male 2=Female |__|
A12 Name of the respondent ___________________________________________________
A13 Relationships between the respondent and the household’s head (see codes) |__|
A14 Sex of the respondent: 1=Male 2=Female |__|
A15 Age of the respondent (on a bygone-year basis) |__|__|
A16 Phone number of the respondent |__|__|__|__|__|__|__|_
_|__|
A17 Date of beginning of the survey -|__|__|/|__|__|/|__|__|__|__|
A18 Date of end of the survey |__|__|/|__|__|/|__|__|__|__|
A19 Name of the enumerator ________________________________________ |__|__|
A20 Name of the council’s supervisor __________________________________________ |__|__|
A21 Data collection result 1=Complete Survey 4=Absence of a qualified respondent 2= Incomplete Survey 5=Empty house or no house responding to the
given address 3=Refusal 96= Any other reasons (to be specified)
(If the answer is different from 1 and 2, the questionnaire should come to an end)
|__|
A22 Assessment of the quality of the survey 1= Very good 2=Good 3=Average 4=Poor 5=Very poor
|__|
CODES Q13___________________________________________________________________________________________
Section II. POTABLE WATER
H01 1=Yes 2=No
A. Well equipped with a pump |__|
1 = Household Head 3 = Son/Daughter of the Household head or of his/her spouse
5 = Other parent of the Household Head or of his/her spouse
2 = Spouse of the Household Head 4 = Father /mother of the Household Head or of
his/her spouse
6 = No relationships with household head or with his/her
spouse
7= Maid

58
Section II. POTABLE WATER
Which public water supply systems exist in your village/quarter? (Circle the corresponding letter(s)) Is there any other system?
B. Open pit well |__|
C. Protected well |__|
D. Boreholes equipped with a manually operated pump
|__|
E. Spring/river |__|
F. Access to potable water (pipe borne water) |__|
H01a Is your main water supply source run by a public or a private entity? 1=Public 2=Private If 2 H14
|__|
H02
What is your main public water supply source? (Just a single answer) 1= Well equipped with a pump 4= Boreholes equipped with a manually operated pump 2= Open pit well 5= Spring/river 3=Protected well 6 =Access to tap potable water
|__|
H03 What is the quality of the said water? 1=Good 2=Poor 3=Indifferent
|__|
H04 Does this water have an odour? 1=Yes 2=No 8=NSP |__|
H05 Does this water have a taste? 1=Yes 2=No 8=NSP |__|
H06 Does this water have a colour? 1=Yes 2=No 8=NSP |__|
H07 Do you pay something to get this water? 1=Yes 2=No If no H08 |__|
H07a If yes, how much do you spend on average per month? (give an amount in FCFA) |__|__|__|__|__|
H07b How do you appraise the said amount? 1=High 2=Affordable 3=Insignificant
|__|
H08 Is this water available throughout the year? 1=Yes 2=No |__|
H09 How many times do you need, on average, to go on foot and fetch water and come back? 1=On the spot 2=Less than 15 minutes 3=Between 15 and 30 minutes 4=more than 30 minutes
|__|
H10 Has this water point had a breakdown at a given time during the last six months, notably since ………? 1=Yes 2=No If no H11.
|__|
H10a
If your water point had a breakdown at a given point in time during the last six months, notably since …………, how long did it take for it to be repaired? 1=Less than one week 2=Between one week and one month 3=Between one month and three months 4=Over three months 5=Not yet, if 5, H11
|__|
H10b Who repair it? Who else?
1=Yes 2=No
A=Mayor (Council) |__|
B=State |__|
C=An elite |__|
D=The Water Management Committee |__|
E=the village/quarter head |__|
F=CAMWATER/SNEC/CDE |__|
G=Other partners/stakeholders : ____________________ |__|
H11 Do you have access to that water point at any moment of the day? 1=Yes 2=No If yes H13
|__|
H12 If no, what is the daily frequency in terms of potable water supply in your household?1=Once ; 2=Twice; 3=Thrice
|__|
H13 Does the said frequency correspond to your current need in terms of potable water consumption-? 1=Yes 2=No
|__|
H14 Did you express any need in terms of potable water supply in the course of the last 6 months, more specifically since ……………?1=Yes 2=No If no H18
|__|
H15
To whom did you submit your request/needs? (several answers are possible) Other?
1=Yes 2=No
A. Mayor (Council) |__|
B. State |__|
C. An elite |__|
D. The Water Management Committee |__|
E. The village/quarter head |__|
F. the Administrative authorities |__|

59
Section II. POTABLE WATER G. CAMWATER/SNEC/CDE |__|
X. Other stakeholders : _____________________________
|__|
H16 Has your need been met? 1=Yes 2=No If no H18 |__|
H17
In the event of a satisfactory answer, how much times did it take for your need to be satisfied? 1=Less than one month 3=Over three months 2=Between one and three months
|__|
H18
Broadly speaking, what is your level of satisfaction, especially in terms of water supply in your village? (Just circle a single answer) 1=Satisfied 2= Indifferent 3=Unsatisfied If 1 or 2 H20.
|__|
H19
State the reasons of your non--satisfaction with regard to water supply in your village (several answers are possible). Any other reason?
1=Yes 2=No
A. Far distance to access to the water point |__|
B. Poor quality of water |__|
C. Insufficiency of water supply points |__|
D. Poor management of the water supply |__|
E. Failure/delay to repair in case of breakdown F. High cost of water supply
|__|
|__|
X. Any other reasons to be specified : _________________
|__|
H20
What are your expectations in terms of supply of potable water? (Several answers are possible). Any other expectation?
1=Yes 2=No
A. Additional water points ; |__|
B. Improvement in terms of management of the existing water points;
|__|
C. Repair works should be carried out on the damaged water points ;
|__|
D. Improvement of the quality of the existing water points ; |__|
E. Reduction of price ; |__|
X. Other expectations to be specified : ______________ _______________________________
|__|
Section III. HEALTH
S01 Which is the nearest health care unit to your household? 1= Public integrated health Centre 2= Hospital/CMA 3= Private health Centre
|__|
S02 How much time do you need, on average, to reach the nearest health care unit from your household? 1=Less than 15 minutes 2=Between 15 and 30 minutes 3=Between 30 minutes and 1 hour, 4 = Over 1 hour
|__|
S03
Where do your household members preferably go when they have health problems? (Just a single answer) 1=Public integrated health Center 5=Medicine store 2=Hospital /CMA 6=Go to a medical staff me mber 3=Private health center 7= Treat at home Self -medication 4=Traditional healers 8=Others (to be specified)
|__|
S04 Has any member of your household gone, at least once, to the nearest health care unit in the course of the last 12 months, specifically since …………………………. ? 1=Yes 2=No If no S17
|__|
S05 Who is in charge of managing such health care units? 1=Medical doctor 2=Nurse 3= Nurse aider 4=Other (to be specified) ________________ 8= Does not know
|__|
The last time a member of your household was taken care of in such a health care unit,
S06 Were the medical staffs present? 1=Yes 2=No |__|
S07 Were minor medical equipment (such as scissors, syringes, alcohol, cotton, betadine, thermometer, tensiometer, medical scale, etc.) always available? 1=Yes 2=No 8=Do not know
|__|
S08 Is your health care unit (CMA or Hospital) provided with hospitalization rooms? 1=Yes 2=No If no S10.
|__|
S09 How many beds are available in the hospitalization rooms? 0= None, 1=Less than 5 beds 2=Between 5 and 10 beds 3=Over 10 beds 8=Does not know.
|__|
S10 How much did he/she paid for one consultation? (Session fees) 1=Free of charge 3=Between 500 and 1000 CFAF
|__|

60
Section III. HEALTH 2=Less than 500 CFAF 4=Over 1000 CFAF If S10=1 S14
S11 How do you appraise the said amount? 1=High 2=Affordable 3=Insignificant |__|
S12 In addition to the consultation fees, did the household member who received treatment give a tip to the medical staff for him/her to be better taken care of? 1=Yes2=No If no S14
|__|
S13 If yes, did the person doit willingly or was he/sheobligedby the medical staff to do so?1=Personal initiative 2=Obliged by the medical staff to do so
|__|
S14 How did the household memberappraise the welcome attitude of the medical staff of the said health care unit? 1=Caring 2=Fair3=Poor
|__|
S15 Is this health care unit provided with a pharmacy/pro-pharmacy? 1=Yes 2=No If no S17 |__|
S16 Are drugs always available?1=Yes 2=No 8=Do not know |__|
S17 Is this nearest health care unit capable of providing appropriate solutions to most of the health problems faced by your household?1=Yes 2=No
|__|
S18 Broadly speaking, what is the level of satisfaction as concerns health care services provided by the nearest health care unit to your household? (Only circle a single answer) 1=Satisfied 2=Indifferent 3=Not satisfied If S18=1 or 2 S20
|__|
S19
State the reasons of your non-satisfaction with regard to health services provided within the health care unit you attend? (several answers are possible) Any other reason?
1=Yes 2=No
A. Far distance to access the health care units |__|
B. Poor quality of services provided |__|
C. Insufficiency of existing health care units |__|
D. Defaults related to the health care unit staff |__|
E. Poor management of the health care unit |__|
F. Insufficiency of drugs |__|
G. Poor quality of/Insufficiency of equipments H. High cost with regard to health care access
|__|
X. To be specified) : _______________________________________
|__|
S20
What are your expectations with respectto health care services? Any other espectations?
1=Yes 2=No
A. Additional health care units |__|
B. Supply of drugs |__|
C.Transfer of a staff member |__|
D. Equipped health care units |__|
X. Other to be specified_______________________________________
|__|
Section IV. EDUCATION
Education cycle Nursery Primary Secondary Vocational
training
E01 Is your village/quarter provided with an education cycle « Name of the said cycle »? 1=Yes 2=No
|__|
|__|
|__|
|__|
E02 How many children from your household attend the nearest school? (name of the cycle) (write down the number in front of each cycle)
|__|__|
|__|__|
|__|__|
|__|__|
E03
How many Kilometers do children from your household cover, on average, to goto school?(name of the cycle)? 1=Less than 1 Km 2=Between 1 and 5 Kms 3=Over 5 Kms
|__| |__| |__| |__|
E04
What is, on average, the time spent covered by children from your household to reach the nearest school on foot? (name of the cycle) (estimated in minutes)
|__|__| |__|__| |__|__| |__|__|
E05
Is the school (name of the cycle) attended by children fromyour household provided with a complete cycle? 1=Yes 2=No
|__|
1st cycle
|__|
2nd cycle
|__|

61
E06
Is the vocational training center attended by children from your household provided with a complete workshop deemed suitable to their various trades? 1=Yes 2=No 3=Does not know
|__|
E07
Is the school (name of the cycle) attended by children from your household provided with a class-room per class level? 1=Yes 2=No
|__| |__| |__| |__|
E08
Are all the children seated on a bench in the school (name of the cycle) attended by children from your household? 1=Yes 2=No
|__| |__| |__| |__|
E09
Are school textbooks distributed to pupils in the school (name of the cycle) attended by children fromyour household? 1=Yes 2=No
|__| |__|
E10
How many student does a classroomattended by children from your household contain (name of the cycle)? 1=Less than 30 3=Over 60 2=Between 30 and 60 4=Does not know
|__|__| |__|__| |__|__| |__|__|
E11
How do you assess the frequency of the attendance of teachers in the class-room(s) (name of cycle) in which the children fromyour household are enrolled? 1=Regular 2=Averagely regular 3=Irregular
|__| |__| |__| |__|
E12
How much do you pay per child from your household on average (registration, tuition fees, Parent-teacher associations’ fees (PTA) (name of the cycle) throughout a school year? (write down the average amount)
--------------- (estimated
in FCFA)
--------------- (estimated in
FCFA)
---------------
(estimated in FCFA)
--------------- (estimated in n
FCFA)
E13 How do you appraise such amount? 1=High 2=Affordable 3=Insignificant
|__| |__| |__| |__|
E14
In addition to the fees, has your household paid additional fees to the personnel of the school (nameof the cycle) prior to the enrolment of children from your household in school?1=Yes 2=No If no E16
|__| |__| |__| |__|
E15 Were youobliged to pay such additional fees to the school (name of the cycle) 1=Yes 2=No
|__| |__| |__| |__|
E16
When classroom in the school of (name of the cycle) attended by children from your householdneed repairs, Who does the repairs? 1=Yes 2 =No
A. Parents-Teachers’ Associations (PTA) |__| |__| |__| |__|
B. The Mayor (Council) |__| |__| |__| |__|
C. A village organisation |__| |__| |__| |__|
D. MINEDUB/MINESEC/MINEFOP |__| |__| |__| |__|
E. Elites |__| |__| |__| |__|
X. Other partners/stakeholders (to be specified) __________ Any other?
|__| |__| |__| |__|
E17
In general, what is your level of satisfaction with regard to education services provided in the (nameof the cycle) your village? (Only a single answer is possible) 1=Satisfied 2=Indifferent 3=Not satisfied. If 1 or 2 E19.
|__| |__| |__| |__|
E18 State the reasons of your non-satisfaction in connection with the basic education services provided in (nameof the cycle) in your village?

62
(Several answers are possible) Any other reason? 1=Yes 2=No
A. Far distance to access the education service |__| |__| |__| |__|
B. Insufficiency of class-rooms |__| |__| |__| |__|
C. Insufficiency of equipments |__| |__| |__| |__|
D. Insufficiency of schools |__| |__| |__| |__|
E. Insufficiency of teaching Staff |__| |__| |__| |__|
F. No distribution of text books |__| |__| |__| |__|
G. Poor results |__| |__| |__| |__|
H. High tuition fees |__| |__| |__| |__|
X. Any other reason to be specified |__| |__| |__| |__|
E19
Do you have any expectations in terms of provision of education services in the (name of the cycle)? (Several answers are possible) Any other expectation? 1=yes 2=No
A. Have a school located nearer to the village/quarter
|__| |__| |__| |__|
B. Build more class-rooms |__| |__| |__| |__|
C. Add additional Equipments |__| |__| |__| |__|
D. Create more school/vocational training center |__| |__| |__| |__|
E. Recruit more teaching staff |__| |__| |__| |__|
F. Distribute text books |__| |__| |__| |__|
G. Improve the results |__| |__| |__| |__|
H. Reduce the costs |__| |__| |__| |__|
X. Others(specified) ___________________ |__| |__| |__| |__|
Section V. COUNCIL SERVICES
Council Services
C01Have you requested for a specific service to the council (name of the service) during the last 12 months, notably since.………….. ? 1=Yes 2=No
following service
C02 How were you received during your lasttime at the council? (Choose only one answer) 1=Well 2=Indifferent 3=Bad
C03 After how much time did you obtainthe service requested from the Council? 1=At most after one day 2=Between one day and one week 3=Between one week and one month 4=Between one month and three months 5=Beyond three months 6= Ongoing If C03=1 2, 3, 4 or 5 C04
C03a Since when did you ask forthisservice? (in day)
C04 How How do you assess this waiting time?
1=Reasonable 2=Long 3=Very long If C04=1 C06
C05 If C04=2 or 3, If the time were deemed so long, what could be the problem according to you? 1=Unavailabe staff /absent
2=Absence of working material
3=Corruption
4=Other factors (to be specified) ___________
C06Did you have to pay a tip in order to obtain the said service? 1=Yes 2=No
Issuance of birth certificates
|__| |__| |__| |__|__| |__| |__| |__|
Certification of official copies of documents
|__| |__| |__| |__|__| |__| |__| |__|
Building permit |__| |__| |__| |__|__| |__| |__| |__|
Death certificate |__| |__| |__| |__|__| |__| |__| |__|
Marriage certificate |__| |__| |__| |__|__| |__| |__| |__|
Certificate of residence
|__| |__| |__| |__|__| |__| |__| |__|
Approval of localisation plans
|__| |__| |__| |__|__| |__| |__| |__|
Information |__| |__| |__| |__|__| |__| |__| |__|

63
Other (to be specified) _______
|__| |__| |__| |__|__| |__| |__| |__|
C07 Has any member of your householdtaken part in the village assemblies aimed at drawing up the Council Development Plan? 1=Yes 2=No
|__|
C08 Is any member of your household informed about the amount of the annual budget of your council? 1=Yes 2=No |__|
C09 Is any member of your household informed about the expenditures and incomes of your council during the previous fiscal year? 1=Yes 2=No
|__|
C10
Does the council support the development actions of your village/quarter ( such as community activities, follow-up of village development committees, follow-up of management committees, setting up of village development and monitoring committees, carrying out of micro projects in your village/quarter, etc.)?1=Yes 2=No 8=Does not know
|__|
C11 Does the council involve your village/quarter when planning development actions? 1=Yes 2=No 8=Does not know
|__|
C12 Does the council involve your village/quarter when programming and budgetingdevelopment actions? 1=Yes 2=No 8=Does not know
|__|
C13 Broadly speaking, what is your level of satisfaction as concerns services provided by the council? (choose only a single answer)1=Satisfied 2=Indifferent 3=Not satisfied If 1 or 2 C15
|__|
C14
State the reasons of your non-satisfaction with regard to services provided by the council (Several answers are possible). Any other reason ?
1=Yes 2=No
A. Cumbersome procedures with regard to the processing of users’ requests
|__|
B. Non-involvement of the populations in the management of development activities by the council
|__|
C. Defaults inherent to the Council staff (absenteeism, corruption, poor reception, etc…)
|__|
D. Poor visibility of the council action on the populations |__|
E. Unavailability of the council executive (the Mayors and his/her deputies)
|__|
X. Any other reasons (to be specified) ______________________
|__|
C15
What do you expect from the council team? (Several answers are possible).
Any other expectation?
1=Yes 2=No
A. Increased involvement of the populations in the decision-making process
|__|
B. Increased communication by the council as far as its development actions are concerned
|__|
C. More transparency as far as management is concerned |__|
D. Closeness of the Councilto the populations |__|
X. Any other expectation (to be specified) : _____________________ |__|

64
ANNEX 2: PHOTO GALLERY
Muyuka Council Building
Launching of the scorecard survey at the Muyuka Council Hall
Training of Enumerators Group photo with PNDP and NIS

65
Data Collection within Muyuka