Embed Size (px)
Citation preview
Report of Survey Results on the Inclusion of New Indicators in the High School Academic Performance Index (API)
California Department of Education February 2014
Table of Contents
Executive Summary ....................................................................................................... 1
Summary of Survey Results ........................................................................................... 5
1. Background Information ......................................................................................... 6
2. Graduation Data ..................................................................................................... 8
Results for Survey Comments ............................................................................. 8
3. College and Career Indicator ................................................................................ 17
Part I Results – Inclusion of Course Completion ................................................ 17
Part II Results – Inclusion of Exams ................................................................... 18
Results for Survey Comments ............................................................................ 19
4. Consideration of Additional Indicators ................................................................... 34
Results for Survey Comments ............................................................................ 36
5. Possible Features for the College and Career Indicator ........................................ 49
6. College and Career School Report ....................................................................... 50
7. Timeline for Adding New Indicators to the API ....................................................... 51
8. Contact Information ............................................................................................... 52
9. Closing .................................................................................................................. 53
i
Charts
Chart 1 – Viewing of the CDE’s Video on Proposed Changes to the API ....................... 6
Chart 5 – Level of Support for the Quantitative Questions on College and Career
Chart 6 – Level of Support for the Quantitative Questions on College and Career
Chart 7 – Level of Support for the Quantitative Questions on Additional
Chart 8 – Support for CDE’s Approach for Including College and Career
Chart 10 – Results of Preferred Implementation Timeline for New Indicators
Chart 13 – Respondents Willing to Participate in Future Discussions of
Chart 2 – Urban, Suburban, Rural, and Not Applicable Respondents ............................ 7
Chart 3 – Respondents by County ................................................................................. 7
Chart 4 – Level of Support for the Quantitative Questions on the Graduation Data ....... 8
Indicator, Part I ............................................................................................................ 18
Indicator, Part II ............................................................................................................ 19
Indicators...................................................................................................................... 35
Measures in the API Results ........................................................................................ 49
Chart 9 – Importance of Features in College and Career Indicator Results ................. 50
in the API...................................................................................................................... 51
Chart 11 – All-At-Once Implementation Respondent Results ....................................... 52
Chart 12 – Gradual Implementation Respondent Results ............................................ 52
College and Career Indicators in the API ..................................................................... 53
ii
Tables
Table 1 – The Roles of the Respondents ....................................................................... 6
Table 3 – Full Credit for Special Education Students Who Earn a Certificate of
Table 24 – More Career Indicators Needed for Non-College Bound
Table 2 – Graduation Rate Data in the API ..................................................................... 9
Completion ................................................................................................................... 10
Table 4 – Full Credit for GEDs ....................................................................................... 11
Table 5 – Other Student Groups to Earn Bonus API Points for Graduating .................. 12
Table 6 – No Bonus API Points Awarded to Disadvantaged Graduates ....................... 13
Table 7 – Graduation Standards Across Districts ......................................................... 14
Table 8 – Adding the CHSPE as an Indicator ............................................................... 15
Table 9 – More Time Given for Students to Graduate .................................................. 16
Table 10 – Reasons for Opposition to Proposed Measures, Part I ............................... 18
Table 11 – Reasons for Opposition to Proposed Measures, Part II .............................. 19
Table 12 – College and Career Indicators in the API .................................................... 20
Table 13 – Course Grades Too Subjective ................................................................... 20
Table 14 – “C” Course Grade is not Proficient .............................................................. 21
Table 15 – Additional Courses Needed ........................................................................ 22
Table 16 – Honors Courses Lack Statewide Standards ............................................... 23
Table 17 – Too Many Exams ........................................................................................ 24
Table 18 – Not All Students Take Exams ...................................................................... 25
Table 19 – Lack of Student Motivation on Exams ......................................................... 26
Table 20 – Exams Do Not Test All of Students’ Abilities................................................ 27
Table 21 – Exams with Fees Should Not be Included in the API .................................. 28
Table 22 – Exams Do Not Measure College Readiness ............................................... 29
Table 23 – College and Career Indicators Weighed Equally ........................................ 30
Students ....................................................................................................................... 31
Table 25 – Equity .......................................................................................................... 32
Table 26 – Additional Funding Needed ......................................................................... 33
Table 27 – Reasons for Opposition to Additional Indicators ......................................... 35
Table 28 – Other Additional Indicators .......................................................................... 36
iii
Tables (Continued)
Table 29 – Additional Indicators in the API ................................................................... 36
Table 30 – Using Suspension and Expulsion Data in the API Negatively Impacts
Table 39 – Schools Should Not Be Punished or Rewarded for Their Student
Table 41 – Results for College or Career Areas to be Included in the School
School Safety ............................................................................................................... 37
Table 31 – Suspension and Expulsion is an Inappropriate API Measure...................... 38
Table 32 – Different Suspension and Expulsion Standards Among Districts ................ 39
Table 33 – Suspension and Expulsion Data Easily Manipulated .................................. 40
Table 34 – Lack of Funding for the Additional Indicators .............................................. 41
Table 35 – Equity in Accessibility to GATE, VPA, and Work Experience Programs ...... 42
Table 36 – Lack of Statewide Standards for GATE ....................................................... 43
Table 37 – Additional Indicators Do Not Measure Academic Performance ................... 44
Table 38 – Additional Indicators are Outside the School’s Control ............................... 46
Population .................................................................................................................... 47
Table 40 – Data for Additional Indicators are Not Valid and Reliable ............................ 48
Snapshot Report ......................................................................................................... 50
Table 42 – Additional Data to be Included in the School Snapshot Report ................... 51
iv
Executive Summary
The California Department of Education (CDE) administered the Inclusion of New Indicators in the High School Academic Performance Index Survey to the public. The quantitative survey results were presented to the Public Schools Accountability Act (PSAA) Advisory Committee on September 6, 2013. This report has been updated to include the qualitative results.
The survey questions were based on information and feedback the CDE received from the regional meetings held in April and May 2013. The survey opened on May 31, 2013 and closed on June 20, 2013. Overall, there were 1,768 respondents; 1,766 were in English; 2 were in Spanish. Both the English and Spanish results are included in this report.
Role Number Percent Parent or Guardian 153 9% Teacher (K-8) 107 6% Teacher (9-12) 492 28% School Administrator 359 20% Other School Staff Member 92 5% School Board Member 13 1% District Administrator 283 16% County Office of Education Administrator 52 3% Other District/County Staff Member 52 3% California Department of Education Staff 8 -Advocacy Group or Organization 43 2% Other 114 6%
Total 1,768 100%
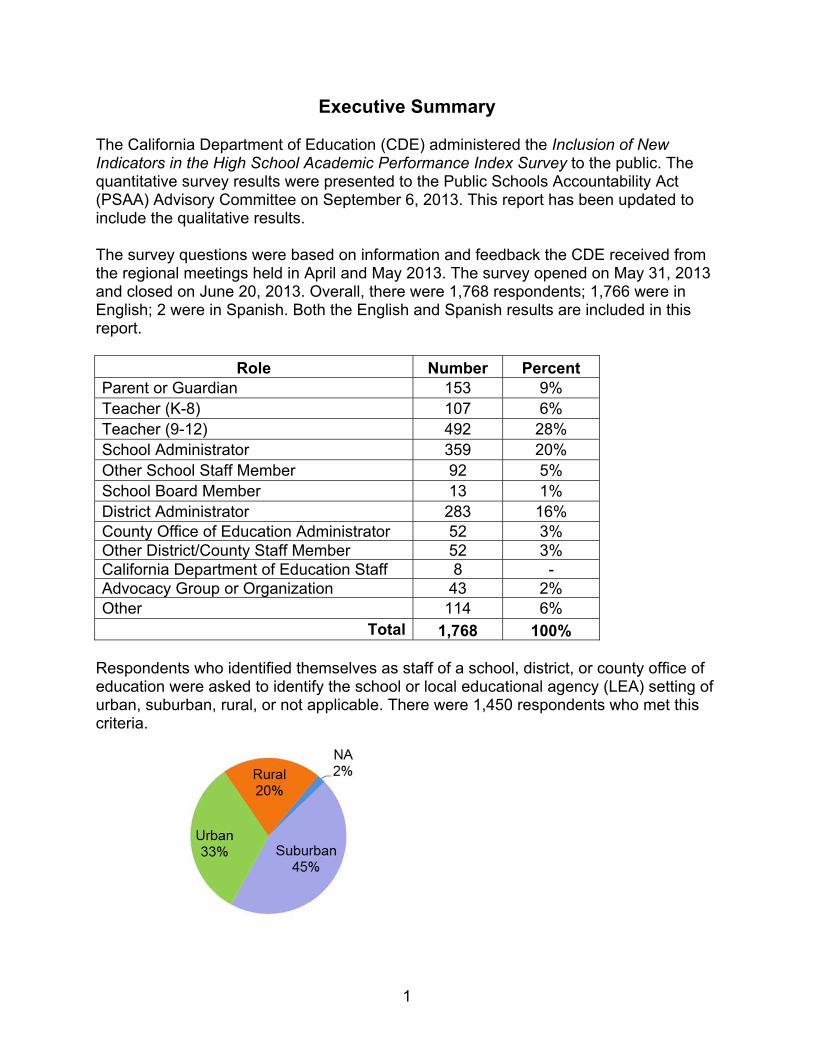
Respondents who identified themselves as staff of a school, district, or county office of education were asked to identify the school or local educational agency (LEA) setting of urban, suburban, rural, or not applicable. There were 1,450 respondents who met this criteria.
1
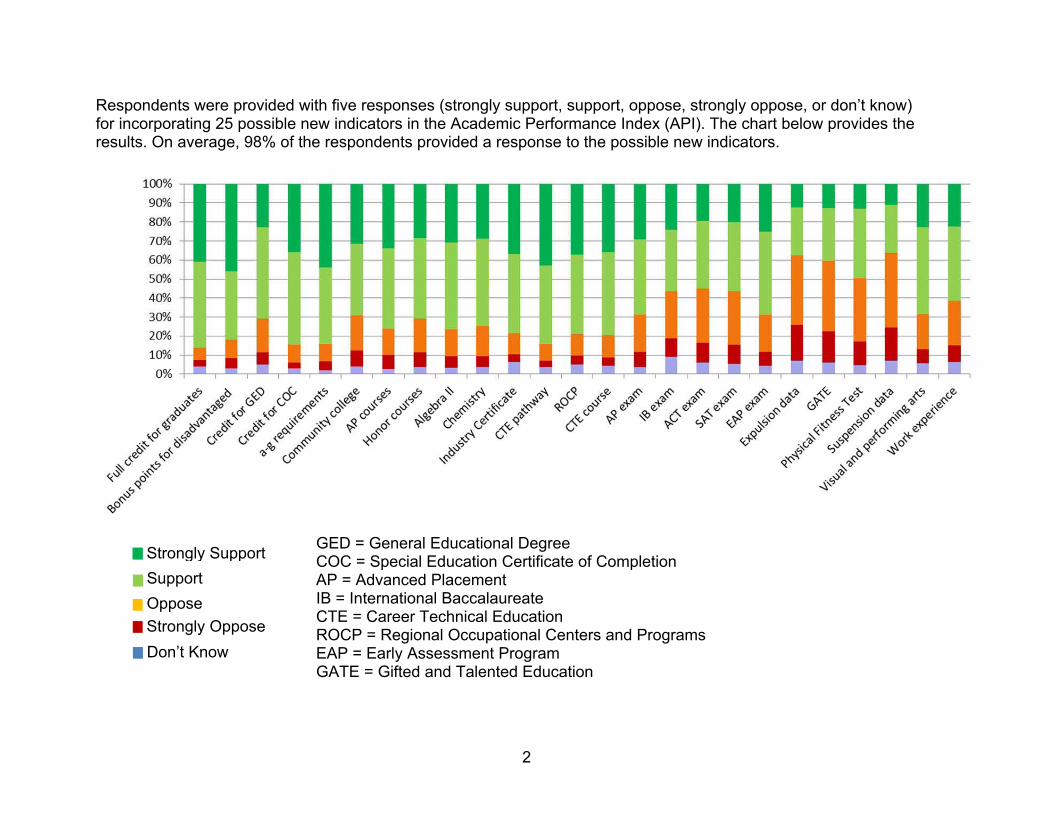
Respondents were provided with five responses (strongly support, support, oppose, strongly oppose, or don’t know) for incorporating 25 possible new indicators in the Academic Performance Index (API). The chart below provides the results. On average, 98% of the respondents provided a response to the possible new indicators.
Strongly Support Support Oppose Strongly Oppose Don’t Know
GED = General Educational Degree COC = Special Education Certificate of Completion AP = Advanced Placement IB = International Baccalaureate CTE = Career Technical Education ROCP = Regional Occupational Centers and Programs EAP = Early Assessment Program GATE = Gifted and Talented Education
2
Additional Indicators
Respondents were asked to list up to three additional indicators not listed in the survey. The table below lists the indicators that had gathered ten or more responses.
Indicator Number of Respondents
Student Attendance 62 Community Service 53 Individual Student Growth 40 Extracurricular Activities 36 Foreign Language 20 Civic Engagement/ Education 20
College Acceptance 19 Re-designated English Proficient Students 14
Technology Skills 14 Classroom Size 10 Social Studies 10
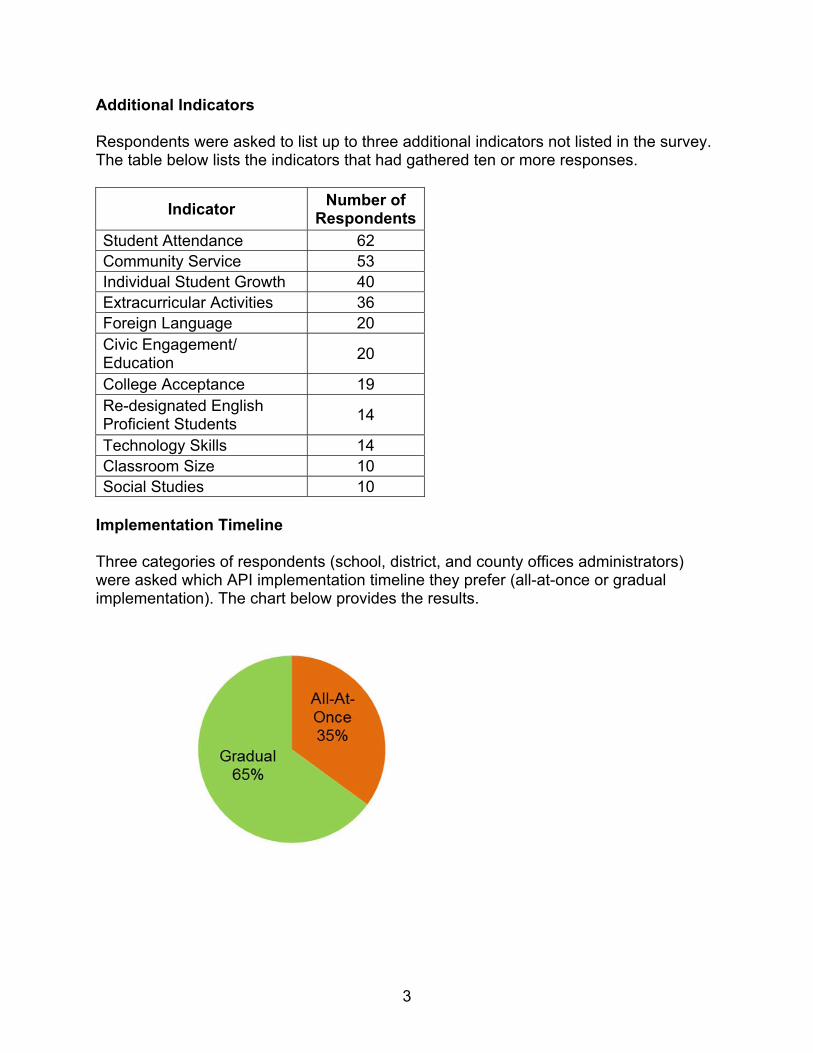
Implementation Timeline
Three categories of respondents (school, district, and county offices administrators) were asked which API implementation timeline they prefer (all-at-once or gradual implementation). The chart below provides the results.
3
Data for College and Career School Snapshot Report
Respondents were asked to identify up to five college and career areas they would like data displayed in a college and career snapshot. The table below provides the top five responses.
College or Career Area Number of Respondents
Completion of a-g requirements 1253 Completion of a CTE pathway 901 Four-year college or university acceptances 781 Community college enrollment 593 Completion of a ROCP 531
4
Summary of Survey Results
Overview of Survey
Overall, there were eight sections to the survey:
1. Background Information 2. Graduation Data 3. College and Career Indicator 4. Consideration of Additional Indicators 5. Possible Features for the College and Career Indicator 6. College and Career School Report 7. Timeline for Adding New Indicators to the Academic Performance Index (API) 8. Contact Information
Each section of the survey was reviewed and the results presented. The quantitative survey results were presented to the Public Schools Accountability Act (PSAA) Advisory Committee on September 6, 2013. This report has been updated to include the qualitative results. It should be noted that most of these questions were not mandatory.
5
1. Background Information
As mentioned in the previous section, there were 1,768 respondents who completed the survey. Table 1 displays the number of respondents for each role.
Table 1 – The Roles of the Respondents Role Number Percent
Parent or Guardian 153 8.7% Teacher (K-8) 107 6.1% Teacher (9-12) 492 27.8% School Administrator 359 20.3% Other School Staff Member 92 5.2% School Board Member 13 0.7% District Administrator 283 16.0% County Office of Education Administrator 52 2.9% Other District/County Staff Member 52 2.9% California Department of Education Staff 8 0.5% Advocacy Group or Organization 43 2.4% Other 114 6.4%
Total 1,768 100%
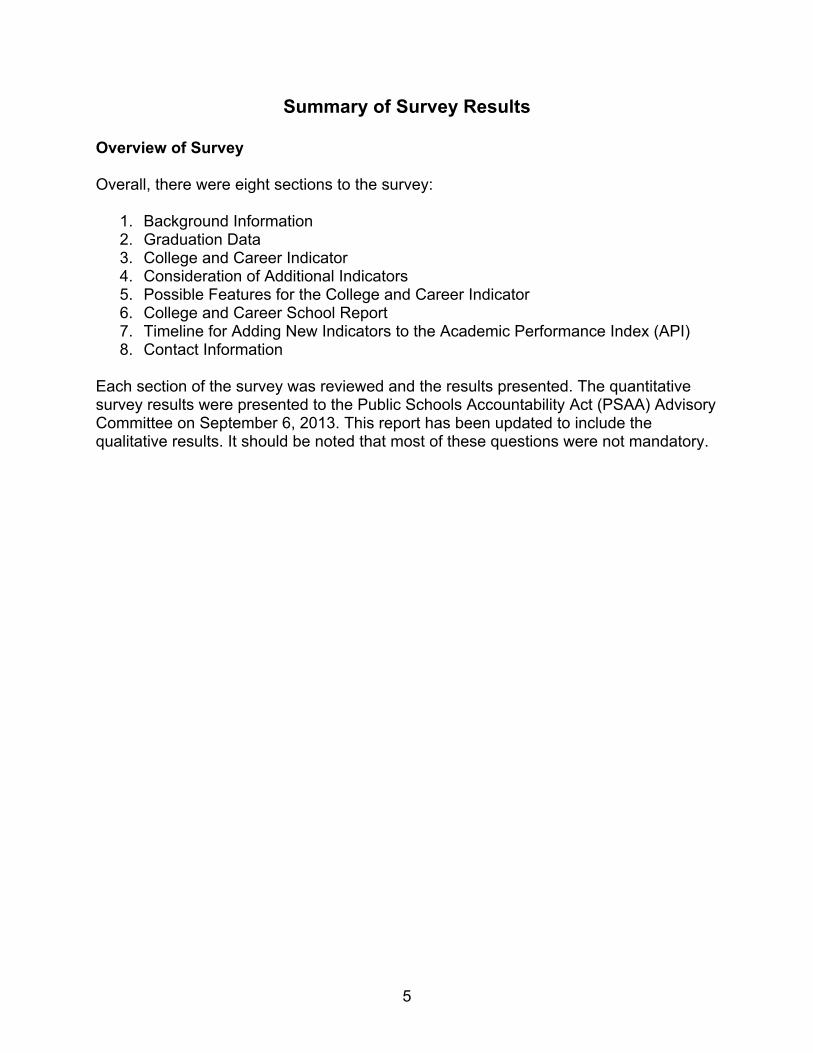
The California Department of Education’s (CDE’s) administered a survey to the public on the inclusion of new indicators in the high school API. The first question in the survey asked respondents to indicate if they had viewed the CDE’s video on the proposed changes to the API. In part five of the survey, questions about the information the video provided were asked of those respondents who indicated they had viewed the video. The following chart displays the percentage of respondents who indicated whether or not they had viewed the video.
Chart 1 – Viewing of the CDE’s Video on Proposed Changes to the API
Respondents who identified themselves as teachers, school administrators, other school staff member, school board members, district administrators, county office of education administrators, or other district/county staff member were also asked to identify if their schools or LEAs were in the setting of urban, suburban, rural, or not
6
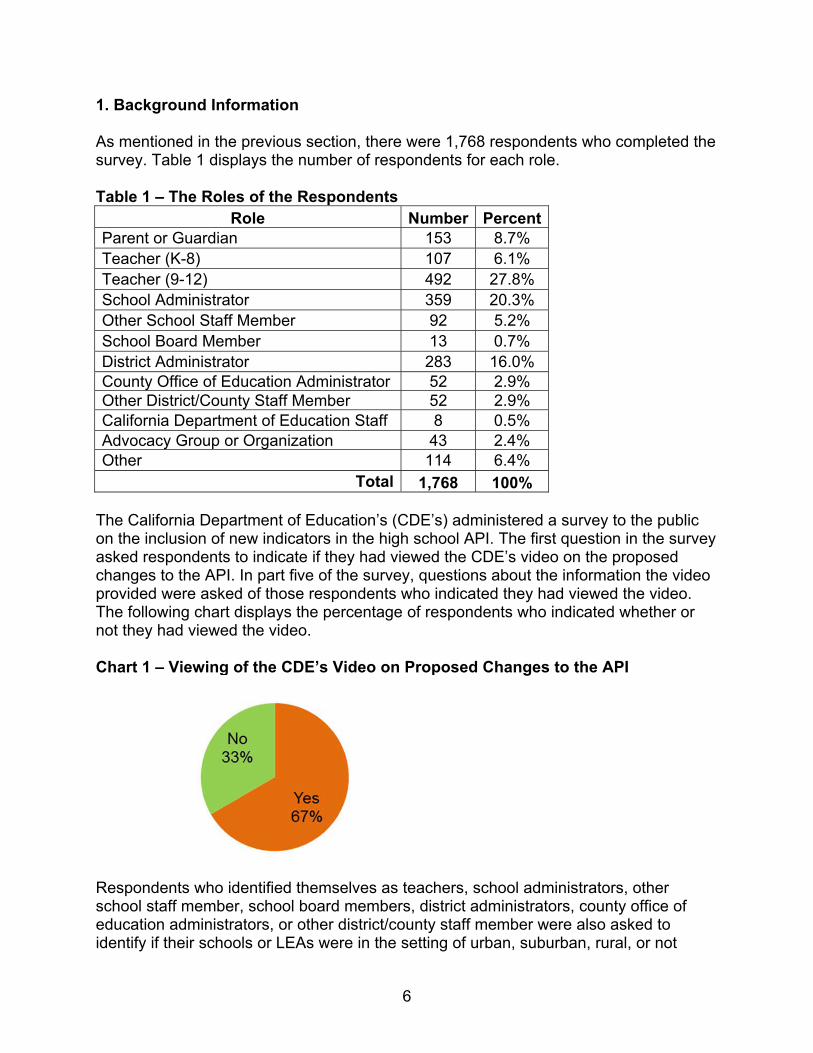
applicable and the county in which their school or district was located. Altogether there were 1,450 respondents who met these criteria. Chart 2 breaks down the respondents’ school or LEA setting.
Chart 2 – Urban, Suburban, Rural, and Not Applicable Respondents
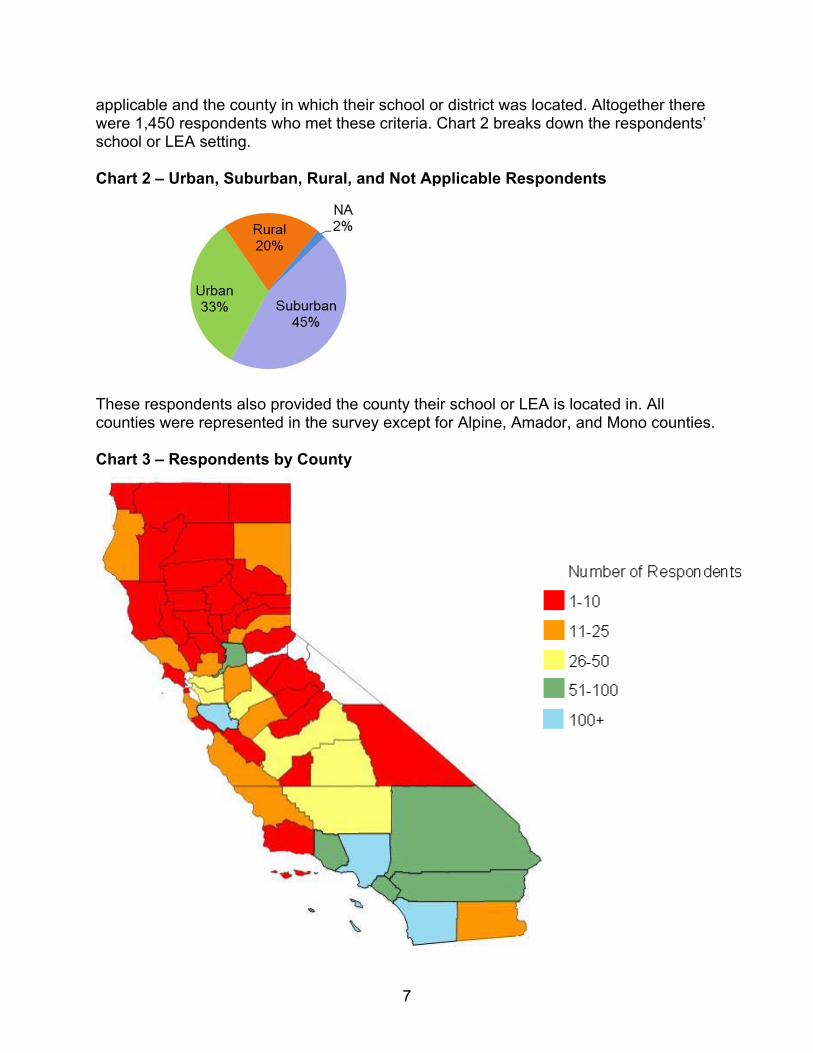
These respondents also provided the county their school or LEA is located in. All counties were represented in the survey except for Alpine, Amador, and Mono counties.
Chart 3 – Respondents by County
7
2. Graduation Data
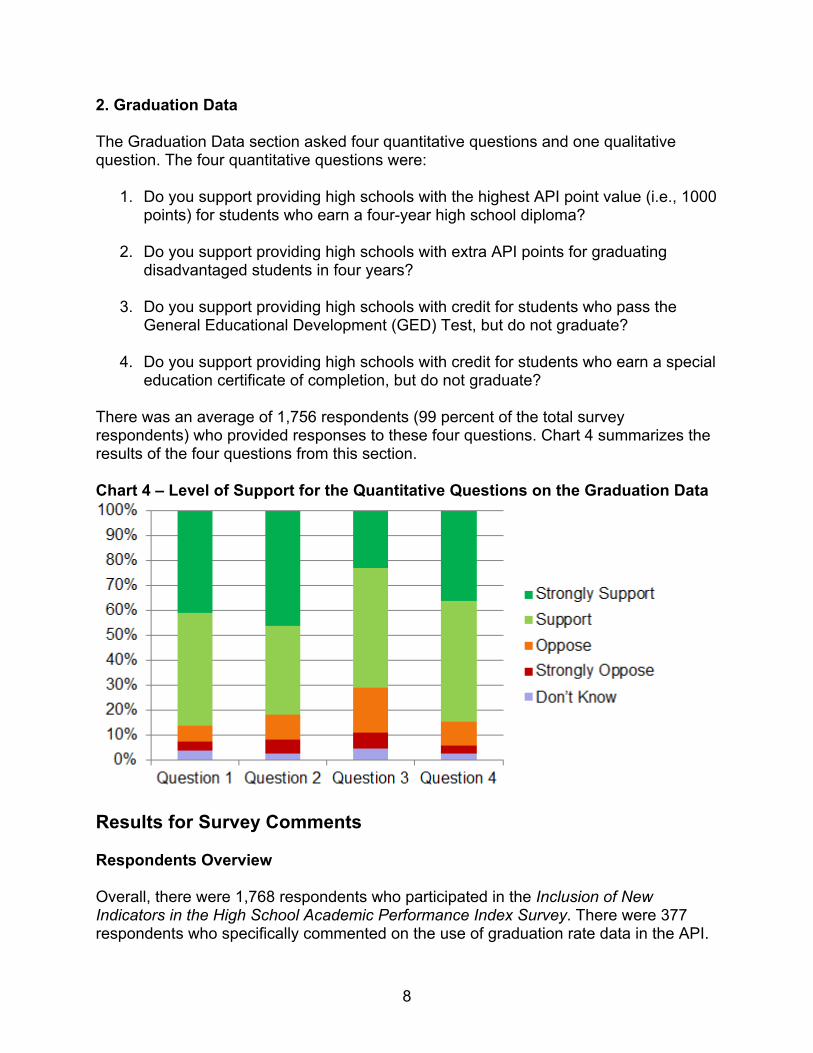
The Graduation Data section asked four quantitative questions and one qualitative question. The four quantitative questions were:
1. Do you support providing high schools with the highest API point value (i.e., 1000 points) for students who earn a four-year high school diploma?
2. Do you support providing high schools with extra API points for graduating disadvantaged students in four years?
3. Do you support providing high schools with credit for students who pass the General Educational Development (GED) Test, but do not graduate?
4. Do you support providing high schools with credit for students who earn a special education certificate of completion, but do not graduate?
There was an average of 1,756 respondents (99 percent of the total survey respondents) who provided responses to these four questions. Chart 4 summarizes the results of the four questions from this section.
Chart 4 – Level of Support for the Quantitative Questions on the Graduation Data
Results for Survey Comments
Respondents Overview
Overall, there were 1,768 respondents who participated in the Inclusion of New Indicators in the High School Academic Performance Index Survey. There were 377 respondents who specifically commented on the use of graduation rate data in the API.
8
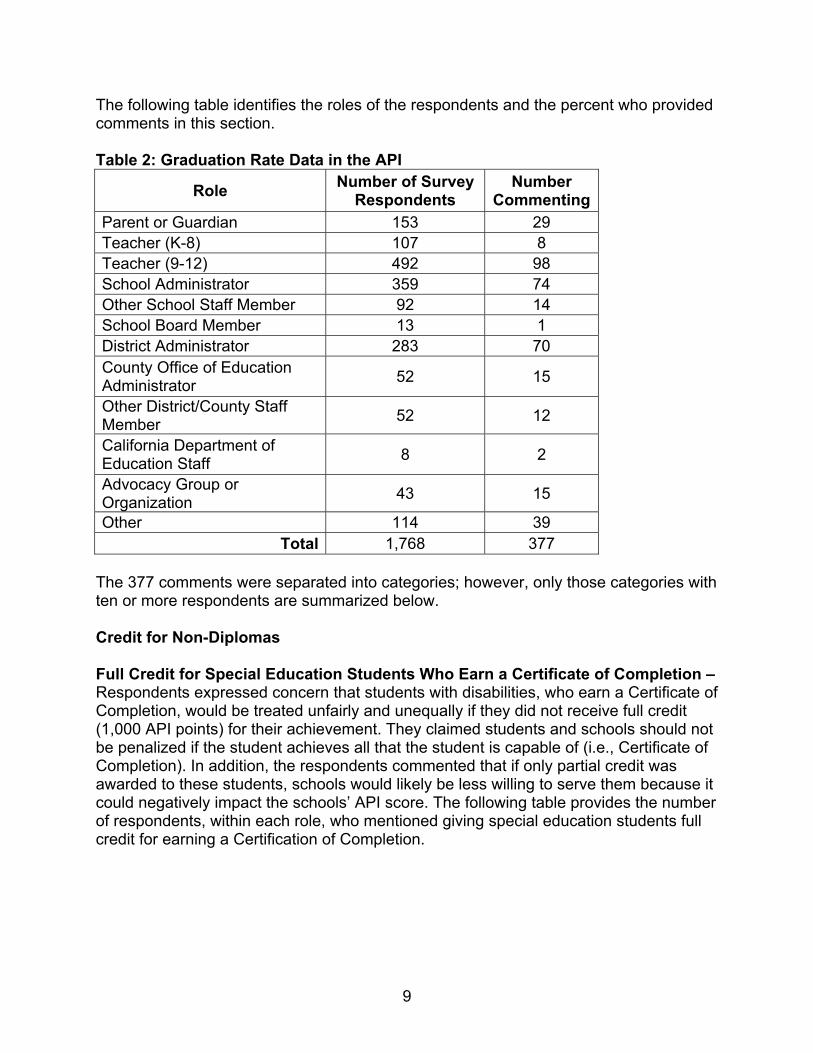
The following table identifies the roles of the respondents and the percent who provided comments in this section.
Table 2: Graduation Rate Data in the API
Role Number of Survey Respondents
Number Commenting
Parent or Guardian 153 29 Teacher (K-8) 107 8 Teacher (9-12) 492 98 School Administrator 359 74 Other School Staff Member 92 14 School Board Member 13 1 District Administrator 283 70 County Office of Education Administrator 52 15
Other District/County Staff Member 52 12
California Department of Education Staff 8 2
Advocacy Group or Organization 43 15
Other 114 39 Total 1,768 377
The 377 comments were separated into categories; however, only those categories with ten or more respondents are summarized below.
Credit for Non-Diplomas
Full Credit for Special Education Students Who Earn a Certificate of Completion – Respondents expressed concern that students with disabilities, who earn a Certificate of Completion, would be treated unfairly and unequally if they did not receive full credit (1,000 API points) for their achievement. They claimed students and schools should not be penalized if the student achieves all that the student is capable of (i.e., Certificate of Completion). In addition, the respondents commented that if only partial credit was awarded to these students, schools would likely be less willing to serve them because it could negatively impact the schools’ API score. The following table provides the number of respondents, within each role, who mentioned giving special education students full credit for earning a Certification of Completion.
9
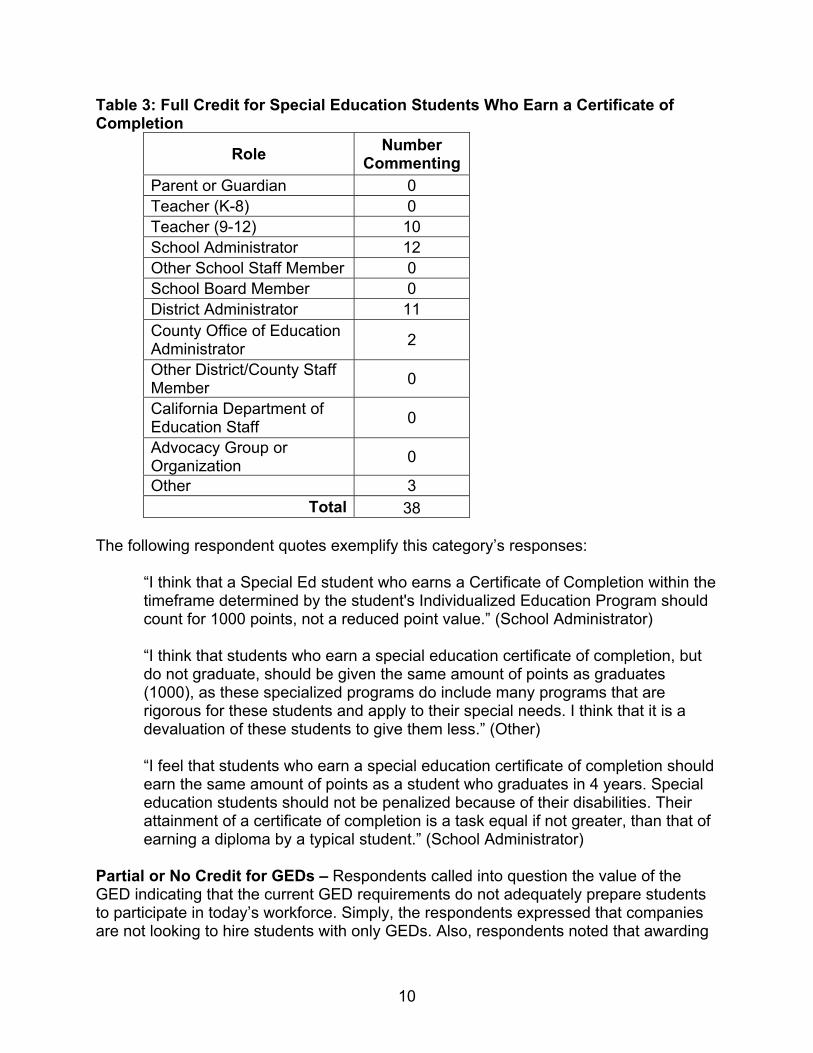
Table 3: Full Credit for Special Education Students Who Earn a Certificate of Completion
Role Number Commenting
Parent or Guardian 0 Teacher (K-8) 0 Teacher (9-12) 10 School Administrator 12 Other School Staff Member 0 School Board Member 0 District Administrator 11 County Office of Education Administrator 2
Other District/County Staff Member 0
California Department of Education Staff 0
Advocacy Group or Organization 0
Other 3 Total 38
The following respondent quotes exemplify this category’s responses:
“I think that a Special Ed student who earns a Certificate of Completion within the timeframe determined by the student's Individualized Education Program should count for 1000 points, not a reduced point value.” (School Administrator)
“I think that students who earn a special education certificate of completion, but do not graduate, should be given the same amount of points as graduates (1000), as these specialized programs do include many programs that are rigorous for these students and apply to their special needs. I think that it is a devaluation of these students to give them less.” (Other)
“I feel that students who earn a special education certificate of completion should earn the same amount of points as a student who graduates in 4 years. Special education students should not be penalized because of their disabilities. Their attainment of a certificate of completion is a task equal if not greater, than that of earning a diploma by a typical student.” (School Administrator)
Partial or No Credit for GEDs – Respondents called into question the value of the GED indicating that the current GED requirements do not adequately prepare students to participate in today’s workforce. Simply, the respondents expressed that companies are not looking to hire students with only GEDs. Also, respondents noted that awarding
10
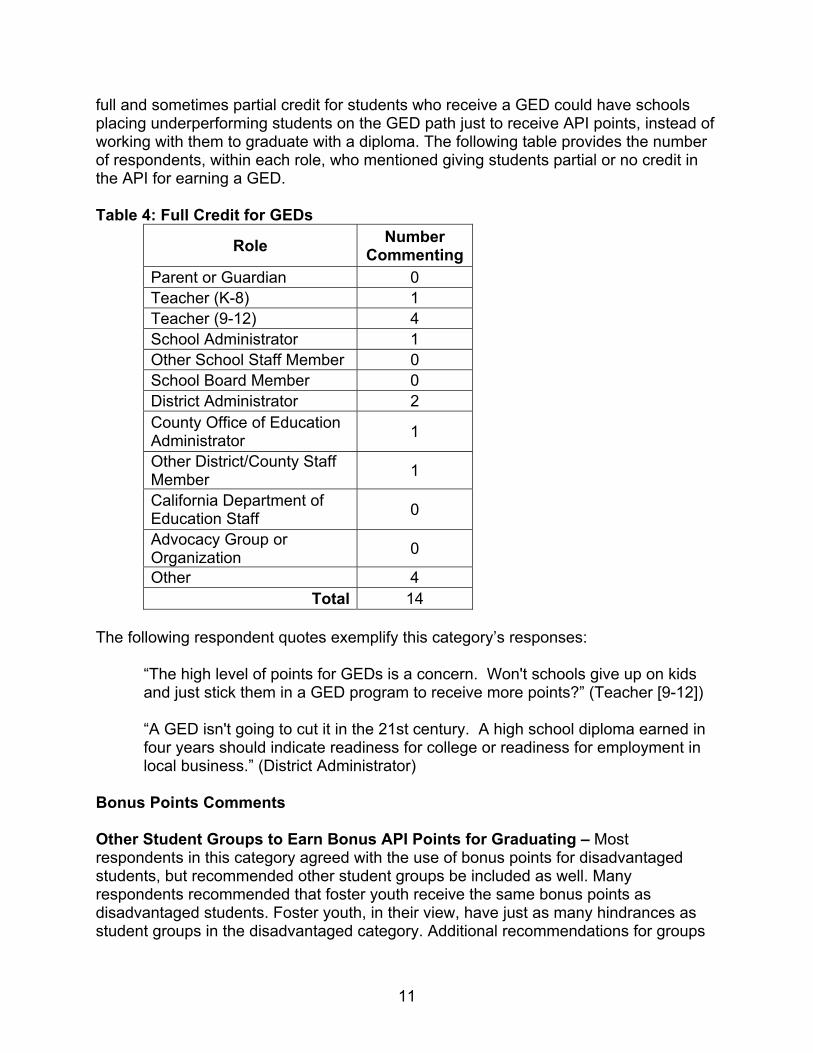
full and sometimes partial credit for students who receive a GED could have schools placing underperforming students on the GED path just to receive API points, instead of working with them to graduate with a diploma. The following table provides the number of respondents, within each role, who mentioned giving students partial or no credit in the API for earning a GED.
Table 4: Full Credit for GEDs
Role Number Commenting
Parent or Guardian 0 Teacher (K-8) 1 Teacher (9-12) 4 School Administrator 1 Other School Staff Member 0 School Board Member 0 District Administrator 2 County Office of Education Administrator 1
Other District/County Staff Member 1
California Department of Education Staff 0
Advocacy Group or Organization 0
Other 4 Total 14
The following respondent quotes exemplify this category’s responses:
“The high level of points for GEDs is a concern. Won't schools give up on kids and just stick them in a GED program to receive more points?” (Teacher [9-12])
“A GED isn't going to cut it in the 21st century. A high school diploma earned in four years should indicate readiness for college or readiness for employment in local business.” (District Administrator)
Bonus Points Comments
Other Student Groups to Earn Bonus API Points for Graduating – Most respondents in this category agreed with the use of bonus points for disadvantaged students, but recommended other student groups be included as well. Many respondents recommended that foster youth receive the same bonus points as disadvantaged students. Foster youth, in their view, have just as many hindrances as student groups in the disadvantaged category. Additional recommendations for groups
11
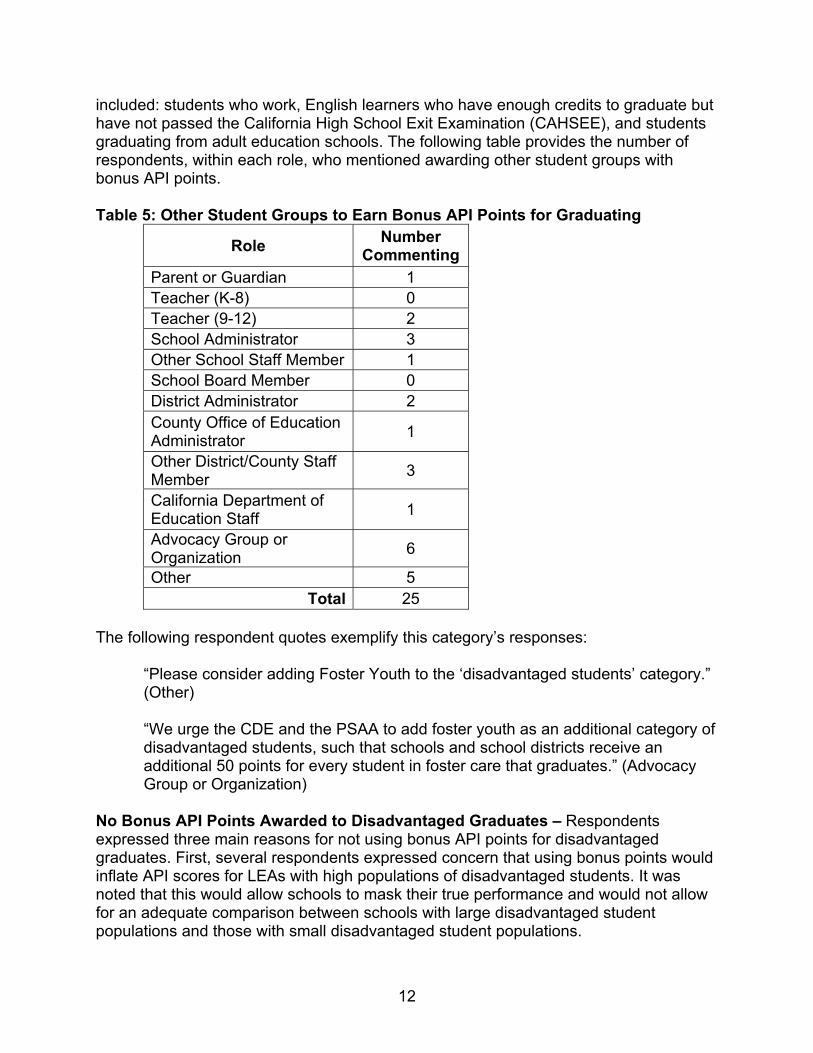
included: students who work, English learners who have enough credits to graduate but have not passed the California High School Exit Examination (CAHSEE), and students graduating from adult education schools. The following table provides the number of respondents, within each role, who mentioned awarding other student groups with bonus API points.
Table 5: Other Student Groups to Earn Bonus API Points for Graduating
Role Number Commenting
Parent or Guardian 1 Teacher (K-8) 0 Teacher (9-12) 2 School Administrator 3 Other School Staff Member 1 School Board Member 0 District Administrator 2 County Office of Education Administrator 1
Other District/County Staff Member 3
California Department of Education Staff 1
Advocacy Group or Organization 6
Other 5 Total 25
The following respondent quotes exemplify this category’s responses:
“Please consider adding Foster Youth to the ‘disadvantaged students’ category.” (Other)
“We urge the CDE and the PSAA to add foster youth as an additional category of disadvantaged students, such that schools and school districts receive an additional 50 points for every student in foster care that graduates.” (Advocacy Group or Organization)
No Bonus API Points Awarded to Disadvantaged Graduates – Respondents expressed three main reasons for not using bonus API points for disadvantaged graduates. First, several respondents expressed concern that using bonus points would inflate API scores for LEAs with high populations of disadvantaged students. It was noted that this would allow schools to mask their true performance and would not allow for an adequate comparison between schools with large disadvantaged student populations and those with small disadvantaged student populations.
12
Second, respondents claimed that bonus points treated students unequally. It was noted that bonus points would create incentives for schools to only focus on certain student groups to work the system.
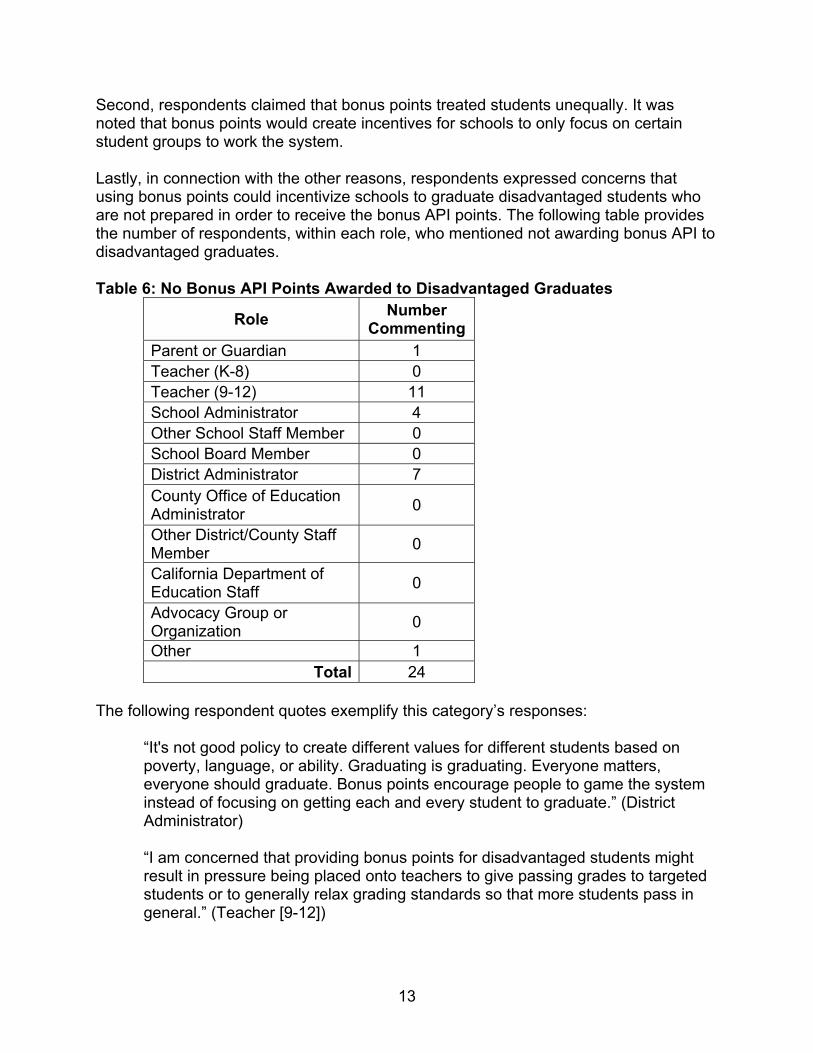
Lastly, in connection with the other reasons, respondents expressed concerns that using bonus points could incentivize schools to graduate disadvantaged students who are not prepared in order to receive the bonus API points. The following table provides the number of respondents, within each role, who mentioned not awarding bonus API to disadvantaged graduates.
Table 6: No Bonus API Points Awarded to Disadvantaged Graduates
Role Number Commenting
Parent or Guardian 1 Teacher (K-8) 0 Teacher (9-12) 11 School Administrator 4 Other School Staff Member 0 School Board Member 0 District Administrator 7 County Office of Education Administrator 0
Other District/County Staff Member 0
California Department of Education Staff 0
Advocacy Group or Organization 0
Other 1 Total 24
The following respondent quotes exemplify this category’s responses:
“It's not good policy to create different values for different students based on poverty, language, or ability. Graduating is graduating. Everyone matters, everyone should graduate. Bonus points encourage people to game the system instead of focusing on getting each and every student to graduate.” (District Administrator)
“I am concerned that providing bonus points for disadvantaged students might result in pressure being placed onto teachers to give passing grades to targeted students or to generally relax grading standards so that more students pass in general.” (Teacher [9-12])
13
General Comments
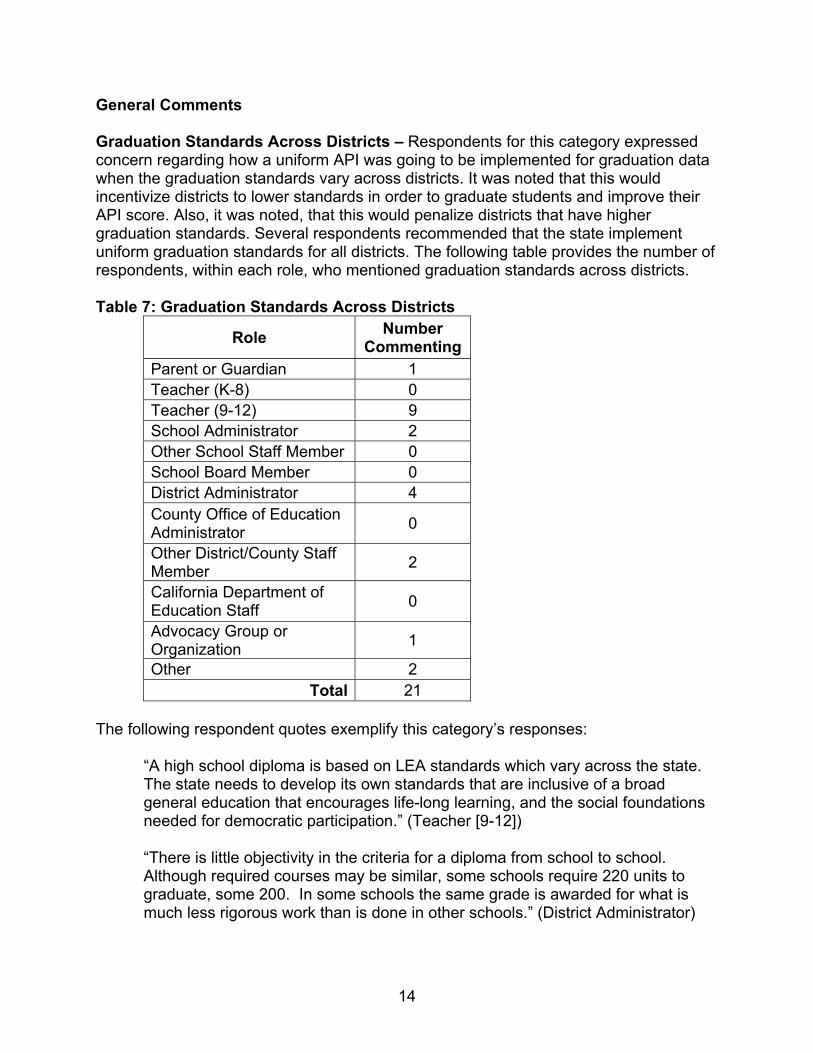
Graduation Standards Across Districts – Respondents for this category expressed concern regarding how a uniform API was going to be implemented for graduation data when the graduation standards vary across districts. It was noted that this would incentivize districts to lower standards in order to graduate students and improve their API score. Also, it was noted, that this would penalize districts that have higher graduation standards. Several respondents recommended that the state implement uniform graduation standards for all districts. The following table provides the number of respondents, within each role, who mentioned graduation standards across districts.
Table 7: Graduation Standards Across Districts
Role Number Commenting
Parent or Guardian 1 Teacher (K-8) 0 Teacher (9-12) 9 School Administrator 2 Other School Staff Member 0 School Board Member 0 District Administrator 4 County Office of Education Administrator 0
Other District/County Staff Member 2
California Department of Education Staff 0
Advocacy Group or Organization 1
Other 2 Total 21
The following respondent quotes exemplify this category’s responses:
“A high school diploma is based on LEA standards which vary across the state. The state needs to develop its own standards that are inclusive of a broad general education that encourages life-long learning, and the social foundations needed for democratic participation.” (Teacher [9-12])
“There is little objectivity in the criteria for a diploma from school to school. Although required courses may be similar, some schools require 220 units to graduate, some 200. In some schools the same grade is awarded for what is much less rigorous work than is done in other schools.” (District Administrator)
14
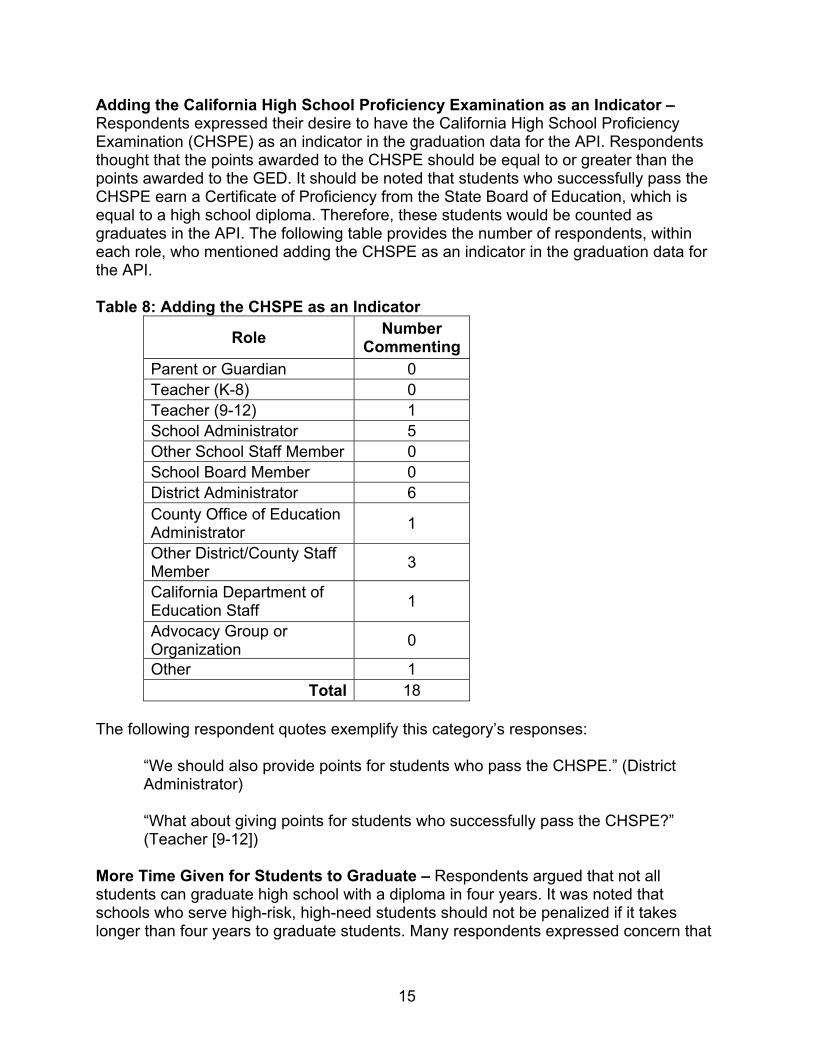
Adding the California High School Proficiency Examination as an Indicator – Respondents expressed their desire to have the California High School Proficiency Examination (CHSPE) as an indicator in the graduation data for the API. Respondents thought that the points awarded to the CHSPE should be equal to or greater than the points awarded to the GED. It should be noted that students who successfully pass the CHSPE earn a Certificate of Proficiency from the State Board of Education, which is equal to a high school diploma. Therefore, these students would be counted as graduates in the API. The following table provides the number of respondents, within each role, who mentioned adding the CHSPE as an indicator in the graduation data for the API.
Table 8: Adding the CHSPE as an Indicator
Role Number Commenting
Parent or Guardian 0 Teacher (K-8) 0 Teacher (9-12) 1 School Administrator 5 Other School Staff Member 0 School Board Member 0 District Administrator 6 County Office of Education Administrator 1
Other District/County Staff Member 3
California Department of Education Staff 1
Advocacy Group or Organization 0
Other 1 Total 18
The following respondent quotes exemplify this category’s responses:
“We should also provide points for students who pass the CHSPE.” (District Administrator)
“What about giving points for students who successfully pass the CHSPE?” (Teacher [9-12])
More Time Given for Students to Graduate – Respondents argued that not all students can graduate high school with a diploma in four years. It was noted that schools who serve high-risk, high-need students should not be penalized if it takes longer than four years to graduate students. Many respondents expressed concern that
15
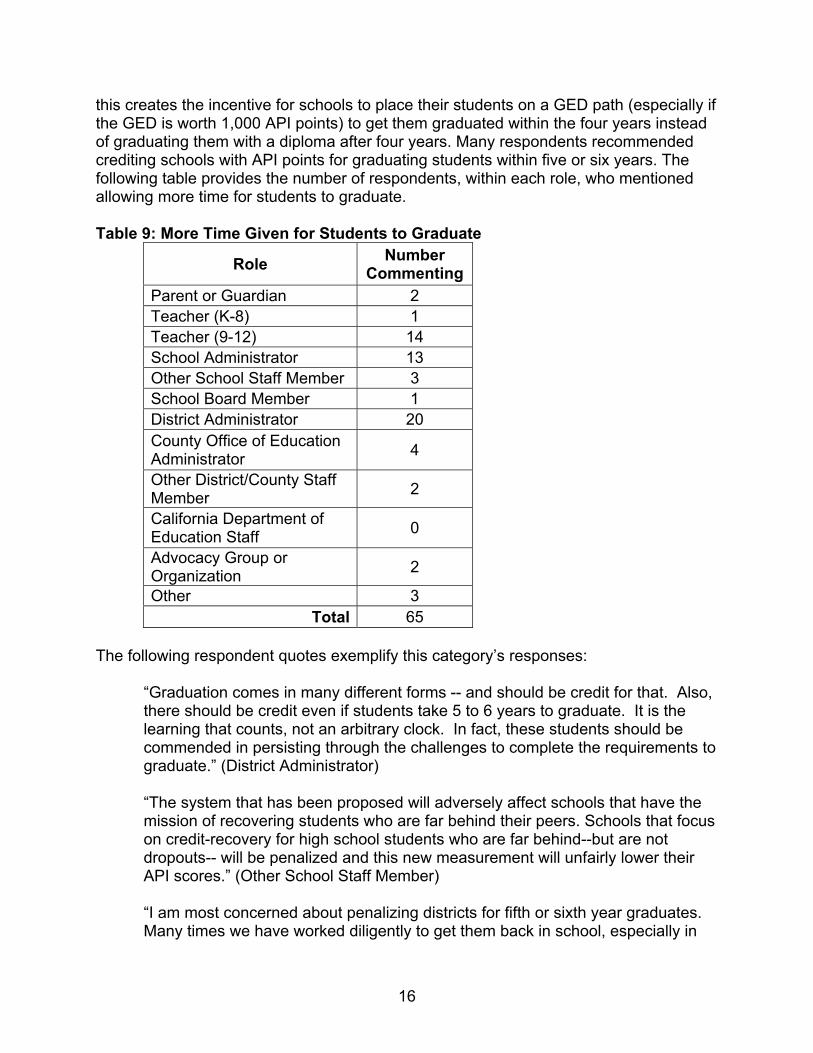
this creates the incentive for schools to place their students on a GED path (especially if the GED is worth 1,000 API points) to get them graduated within the four years instead of graduating them with a diploma after four years. Many respondents recommended crediting schools with API points for graduating students within five or six years. The following table provides the number of respondents, within each role, who mentioned allowing more time for students to graduate.
Table 9: More Time Given for Students to Graduate
Role Number Commenting
Parent or Guardian 2 Teacher (K-8) 1 Teacher (9-12) 14 School Administrator 13 Other School Staff Member 3 School Board Member 1 District Administrator 20 County Office of Education Administrator 4
Other District/County Staff Member 2
California Department of Education Staff 0
Advocacy Group or Organization 2
Other 3 Total 65
The following respondent quotes exemplify this category’s responses:
“Graduation comes in many different forms -- and should be credit for that. Also, there should be credit even if students take 5 to 6 years to graduate. It is the learning that counts, not an arbitrary clock. In fact, these students should be commended in persisting through the challenges to complete the requirements to graduate.” (District Administrator)
“The system that has been proposed will adversely affect schools that have the mission of recovering students who are far behind their peers. Schools that focus on credit-recovery for high school students who are far behind--but are not dropouts-- will be penalized and this new measurement will unfairly lower their API scores.” (Other School Staff Member)
“I am most concerned about penalizing districts for fifth or sixth year graduates. Many times we have worked diligently to get them back in school, especially in
16
our rural area where other educational opportunities are fewer.” (District Administrator)
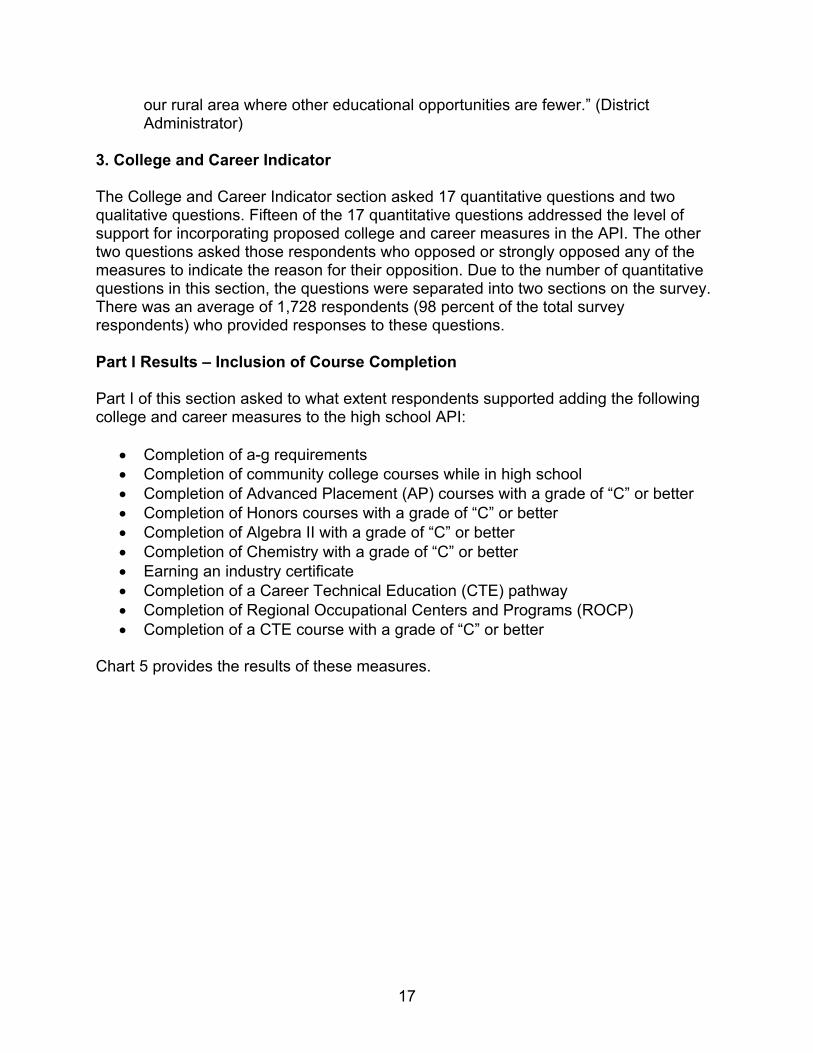
3. College and Career Indicator
The College and Career Indicator section asked 17 quantitative questions and two qualitative questions. Fifteen of the 17 quantitative questions addressed the level of support for incorporating proposed college and career measures in the API. The other two questions asked those respondents who opposed or strongly opposed any of the measures to indicate the reason for their opposition. Due to the number of quantitative questions in this section, the questions were separated into two sections on the survey. There was an average of 1,728 respondents (98 percent of the total survey respondents) who provided responses to these questions.
Part I Results – Inclusion of Course Completion
Part I of this section asked to what extent respondents supported adding the following college and career measures to the high school API:
Completion of a-g requirements Completion of community college courses while in high school Completion of Advanced Placement (AP) courses with a grade of “C” or better Completion of Honors courses with a grade of “C” or better Completion of Algebra II with a grade of “C” or better Completion of Chemistry with a grade of “C” or better Earning an industry certificate Completion of a Career Technical Education (CTE) pathway Completion of Regional Occupational Centers and Programs (ROCP) Completion of a CTE course with a grade of “C” or better
Chart 5 provides the results of these measures.
17
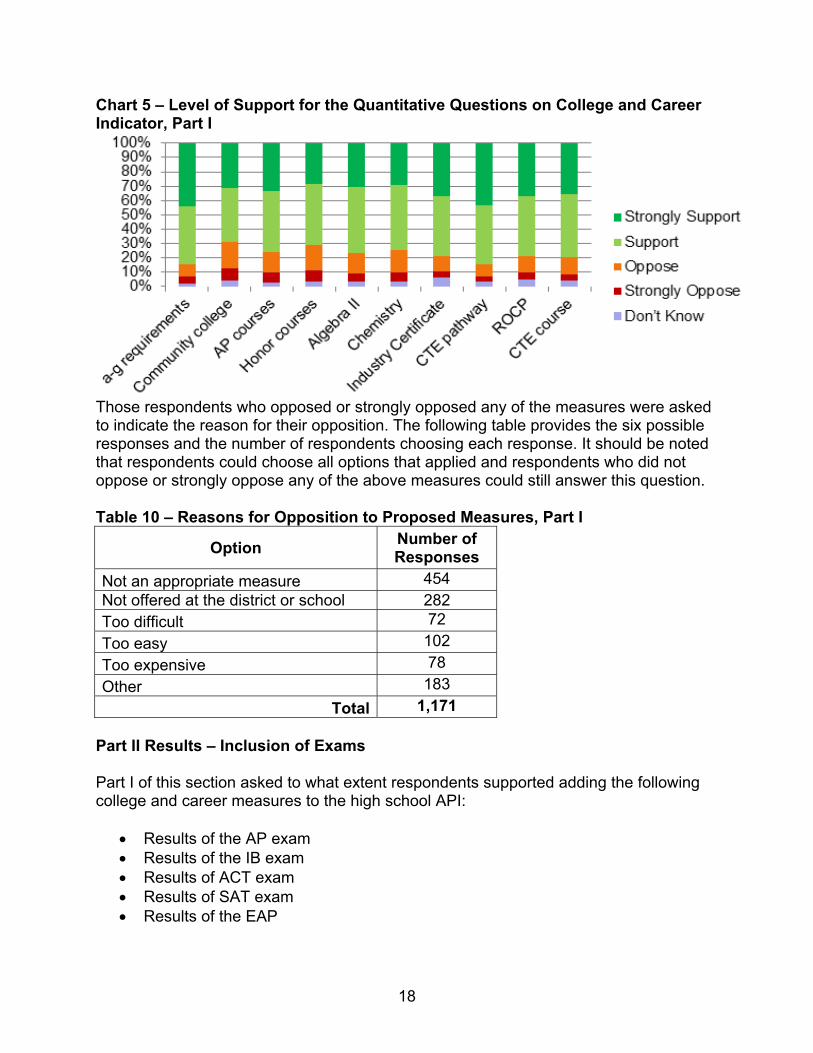
Chart 5 – Level of Support for the Quantitative Questions on College and Career Indicator, Part I
Those respondents who opposed or strongly opposed any of the measures were asked to indicate the reason for their opposition. The following table provides the six possible responses and the number of respondents choosing each response. It should be noted that respondents could choose all options that applied and respondents who did not oppose or strongly oppose any of the above measures could still answer this question.
Table 10 – Reasons for Opposition to Proposed Measures, Part I
Option Number of Responses
Not an appropriate measure 454 Not offered at the district or school 282 Too difficult 72 Too easy 102 Too expensive 78 Other 183
Total 1,171
Part II Results – Inclusion of Exams
Part I of this section asked to what extent respondents supported adding the following college and career measures to the high school API:
Results of the AP exam Results of the IB exam Results of ACT exam Results of SAT exam Results of the EAP
18
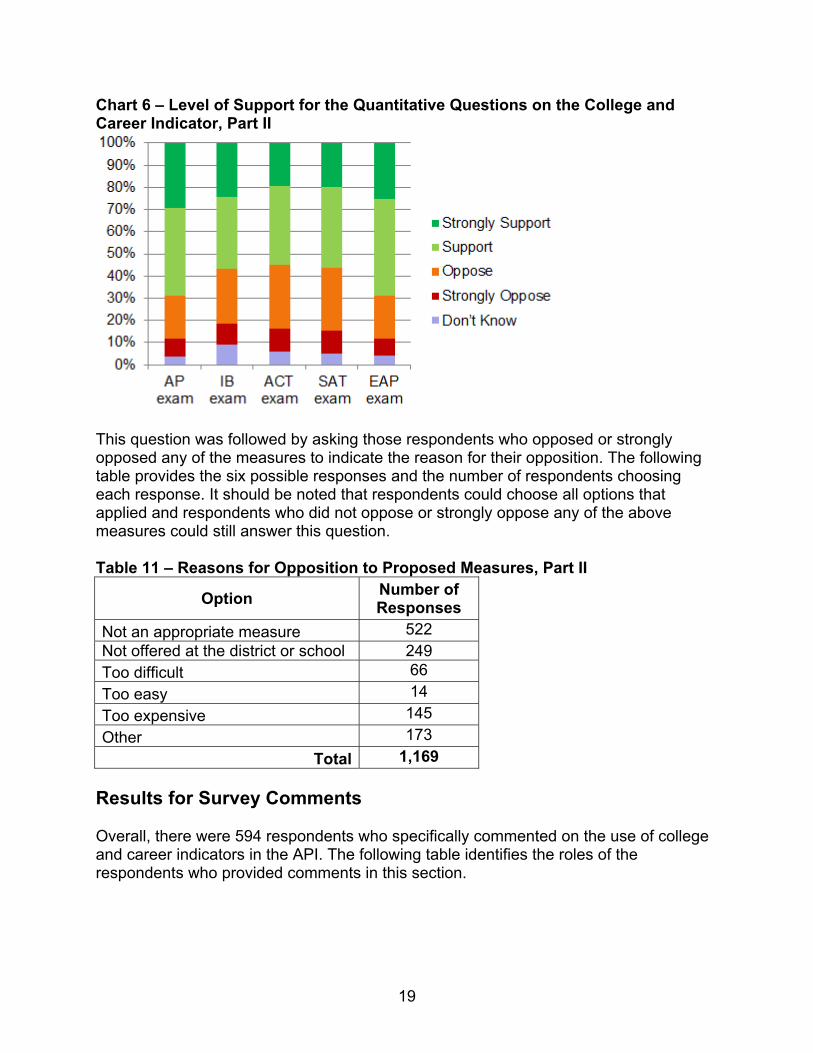
Chart 6 – Level of Support for the Quantitative Questions on the College and Career Indicator, Part II
This question was followed by asking those respondents who opposed or strongly opposed any of the measures to indicate the reason for their opposition. The following table provides the six possible responses and the number of respondents choosing each response. It should be noted that respondents could choose all options that applied and respondents who did not oppose or strongly oppose any of the above measures could still answer this question.
Table 11 – Reasons for Opposition to Proposed Measures, Part II
Option Number of Responses
Not an appropriate measure 522 Not offered at the district or school 249 Too difficult 66 Too easy 14 Too expensive 145 Other 173
Total 1,169
Results for Survey Comments
Overall, there were 594 respondents who specifically commented on the use of college and career indicators in the API. The following table identifies the roles of the respondents who provided comments in this section.
19
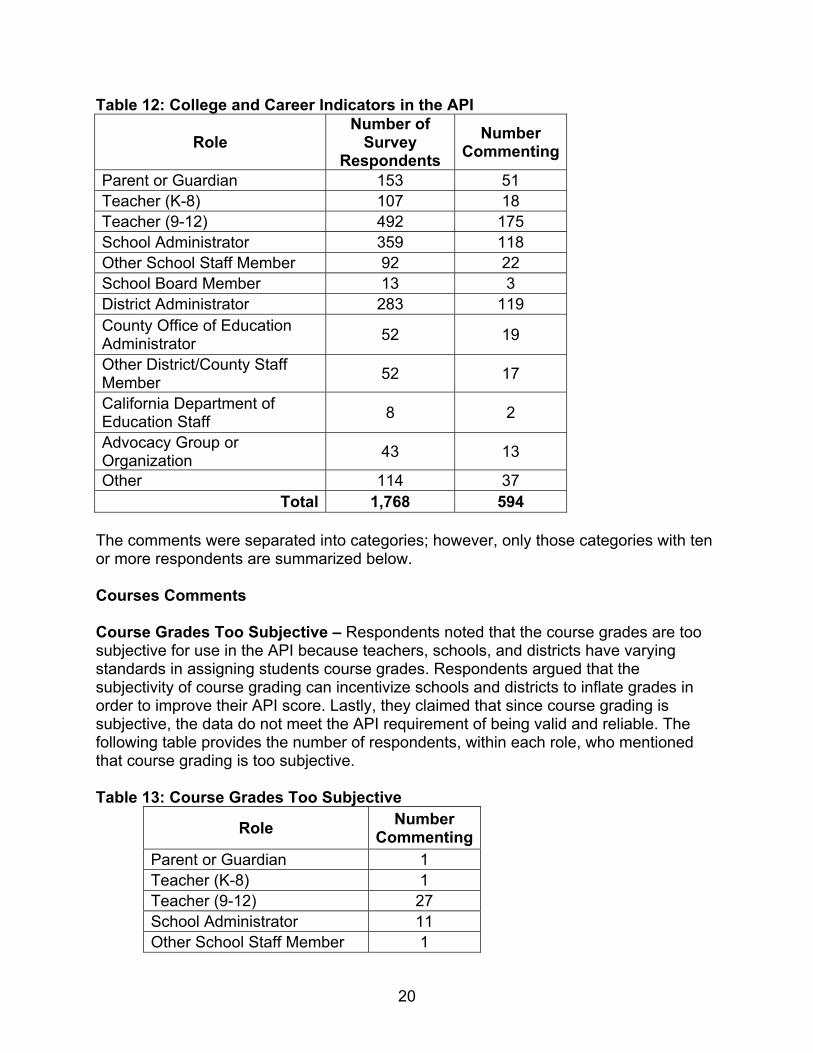
Table 12: College and Career Indicators in the API
Role Number of
Survey Respondents
Number Commenting
Parent or Guardian 153 51 Teacher (K-8) 107 18 Teacher (9-12) 492 175 School Administrator 359 118 Other School Staff Member 92 22 School Board Member 13 3 District Administrator 283 119 County Office of Education Administrator 52 19
Other District/County Staff Member 52 17
California Department of Education Staff 8 2
Advocacy Group or Organization 43 13
Other 114 37 Total 1,768 594
The comments were separated into categories; however, only those categories with ten or more respondents are summarized below.
Courses Comments
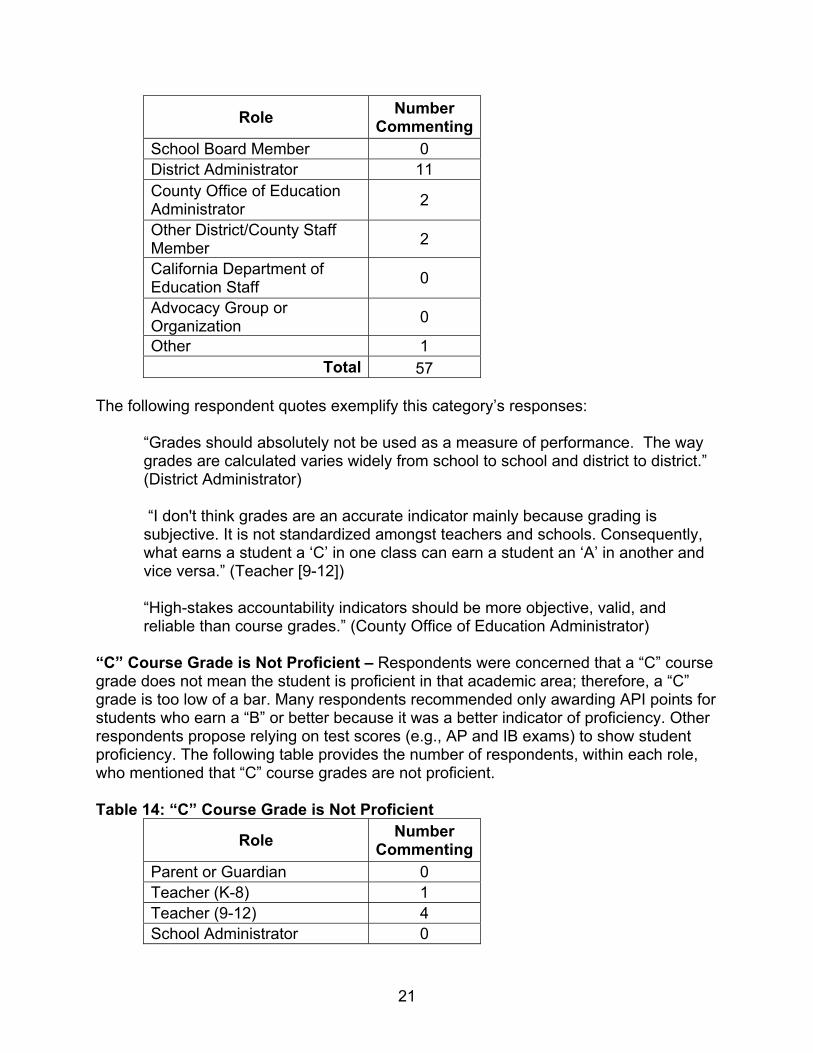
Course Grades Too Subjective – Respondents noted that the course grades are too subjective for use in the API because teachers, schools, and districts have varying standards in assigning students course grades. Respondents argued that the subjectivity of course grading can incentivize schools and districts to inflate grades in order to improve their API score. Lastly, they claimed that since course grading is subjective, the data do not meet the API requirement of being valid and reliable. The following table provides the number of respondents, within each role, who mentioned that course grading is too subjective.
Table 13: Course Grades Too Subjective
Role Number Commenting
Parent or Guardian 1 Teacher (K-8) 1 Teacher (9-12) 27 School Administrator 11 Other School Staff Member 1
20
Role Number Commenting
School Board Member 0 District Administrator 11 County Office of Education Administrator 2
Other District/County Staff Member 2
California Department of Education Staff 0
Advocacy Group or Organization 0
Other 1 Total 57
The following respondent quotes exemplify this category’s responses:
“Grades should absolutely not be used as a measure of performance. The way grades are calculated varies widely from school to school and district to district.” (District Administrator)
“I don't think grades are an accurate indicator mainly because grading is subjective. It is not standardized amongst teachers and schools. Consequently, what earns a student a ‘C’ in one class can earn a student an ‘A’ in another and vice versa.” (Teacher [9-12])
“High-stakes accountability indicators should be more objective, valid, and reliable than course grades.” (County Office of Education Administrator)
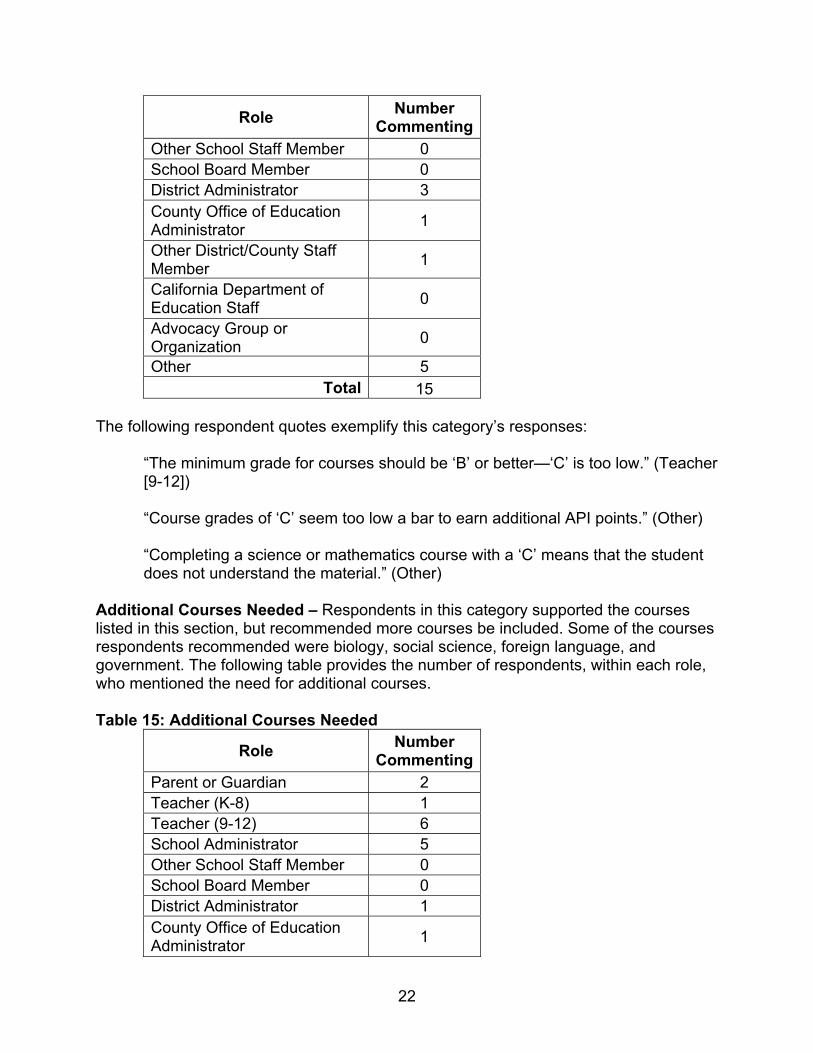
“C” Course Grade is Not Proficient – Respondents were concerned that a “C” course grade does not mean the student is proficient in that academic area; therefore, a “C” grade is too low of a bar. Many respondents recommended only awarding API points for students who earn a “B” or better because it was a better indicator of proficiency. Other respondents propose relying on test scores (e.g., AP and IB exams) to show student proficiency. The following table provides the number of respondents, within each role, who mentioned that “C” course grades are not proficient.
Table 14: “C” Course Grade is Not Proficient
Role Number Commenting
Parent or Guardian 0 Teacher (K-8) 1 Teacher (9-12) 4 School Administrator 0
21
Role Number Commenting
Other School Staff Member 0 School Board Member 0 District Administrator 3 County Office of Education Administrator 1
Other District/County Staff Member 1
California Department of Education Staff 0
Advocacy Group or Organization 0
Other 5 Total 15
The following respondent quotes exemplify this category’s responses:
“The minimum grade for courses should be ‘B’ or better—‘C’ is too low.” (Teacher [9-12])
“Course grades of ‘C’ seem too low a bar to earn additional API points.” (Other)
“Completing a science or mathematics course with a ‘C’ means that the student does not understand the material.” (Other)
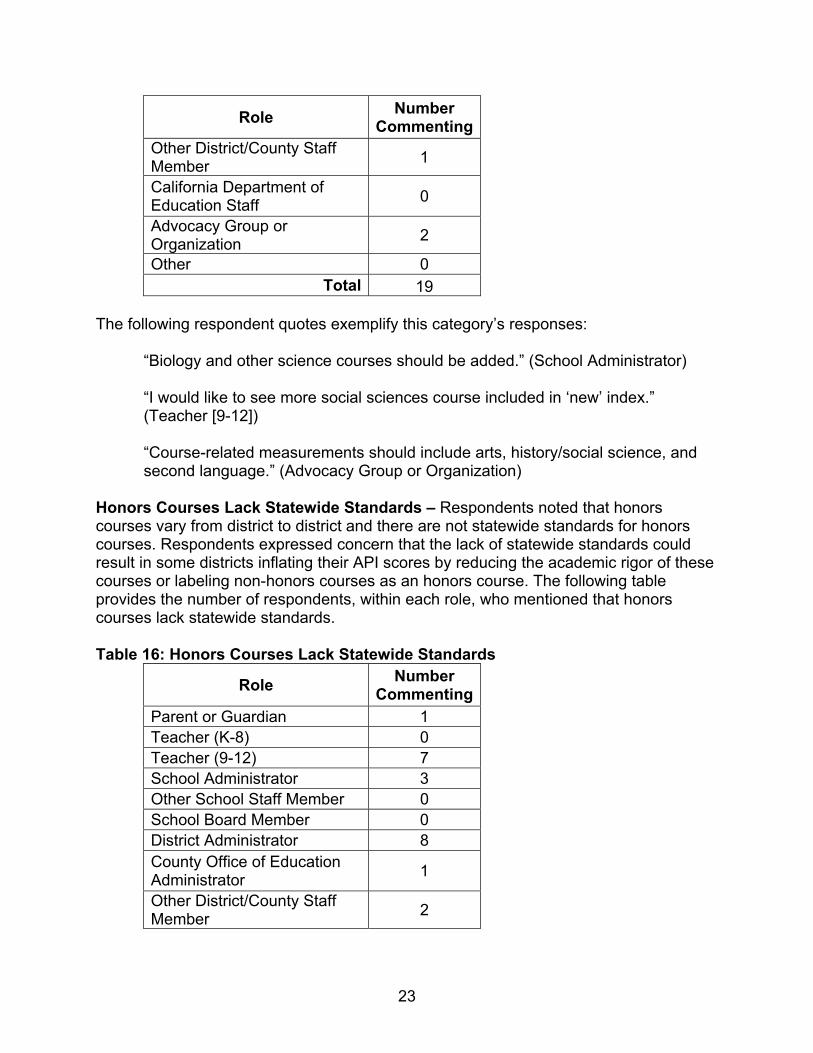
Additional Courses Needed – Respondents in this category supported the courses listed in this section, but recommended more courses be included. Some of the courses respondents recommended were biology, social science, foreign language, and government. The following table provides the number of respondents, within each role, who mentioned the need for additional courses.
Table 15: Additional Courses Needed
Role Number Commenting
Parent or Guardian 2 Teacher (K-8) 1 Teacher (9-12) 6 School Administrator 5 Other School Staff Member 0 School Board Member 0 District Administrator 1 County Office of Education Administrator 1
22
Role Number Commenting
Other District/County Staff Member 1
California Department of Education Staff 0
Advocacy Group or Organization 2
Other 0 Total 19
The following respondent quotes exemplify this category’s responses:
“Biology and other science courses should be added.” (School Administrator)
“I would like to see more social sciences course included in ‘new’ index.” (Teacher [9-12])
“Course-related measurements should include arts, history/social science, and second language.” (Advocacy Group or Organization)
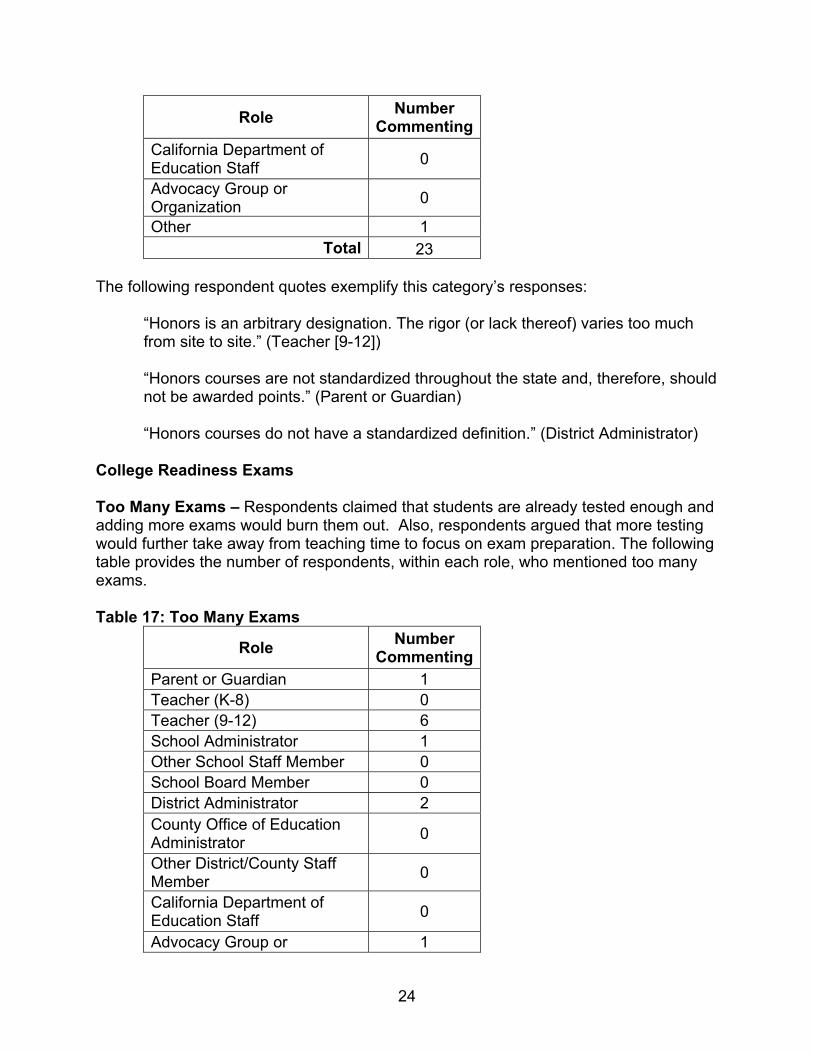
Honors Courses Lack Statewide Standards – Respondents noted that honors courses vary from district to district and there are not statewide standards for honors courses. Respondents expressed concern that the lack of statewide standards could result in some districts inflating their API scores by reducing the academic rigor of these courses or labeling non-honors courses as an honors course. The following table provides the number of respondents, within each role, who mentioned that honors courses lack statewide standards.
Table 16: Honors Courses Lack Statewide Standards
Role Number Commenting
Parent or Guardian 1 Teacher (K-8) 0 Teacher (9-12) 7 School Administrator 3 Other School Staff Member 0 School Board Member 0 District Administrator 8 County Office of Education Administrator 1
Other District/County Staff Member 2
23
Role Number Commenting
California Department of Education Staff 0
Advocacy Group or Organization 0
Other 1 Total 23
The following respondent quotes exemplify this category’s responses:
“Honors is an arbitrary designation. The rigor (or lack thereof) varies too much from site to site.” (Teacher [9-12])
“Honors courses are not standardized throughout the state and, therefore, should not be awarded points.” (Parent or Guardian)
“Honors courses do not have a standardized definition.” (District Administrator)
College Readiness Exams
Too Many Exams – Respondents claimed that students are already tested enough and adding more exams would burn them out. Also, respondents argued that more testing would further take away from teaching time to focus on exam preparation. The following table provides the number of respondents, within each role, who mentioned too many exams.
Table 17: Too Many Exams
Role Number Commenting
Parent or Guardian 1 Teacher (K-8) 0 Teacher (9-12) 6 School Administrator 1 Other School Staff Member 0 School Board Member 0 District Administrator 2 County Office of Education Administrator 0
Other District/County Staff Member 0
California Department of Education Staff 0
Advocacy Group or 1
24
Role Number Commenting
Organization Other 0
Total 11
The following respondent quotes exemplify this category’s responses:
“There are already too many tests required of our students. Our scarce dollars should be used to educate our students not testing them more.” (Teacher [9-12])
“11th graders are tested enough; I feel there are also other measures that are equally useful.” (School Administrator)
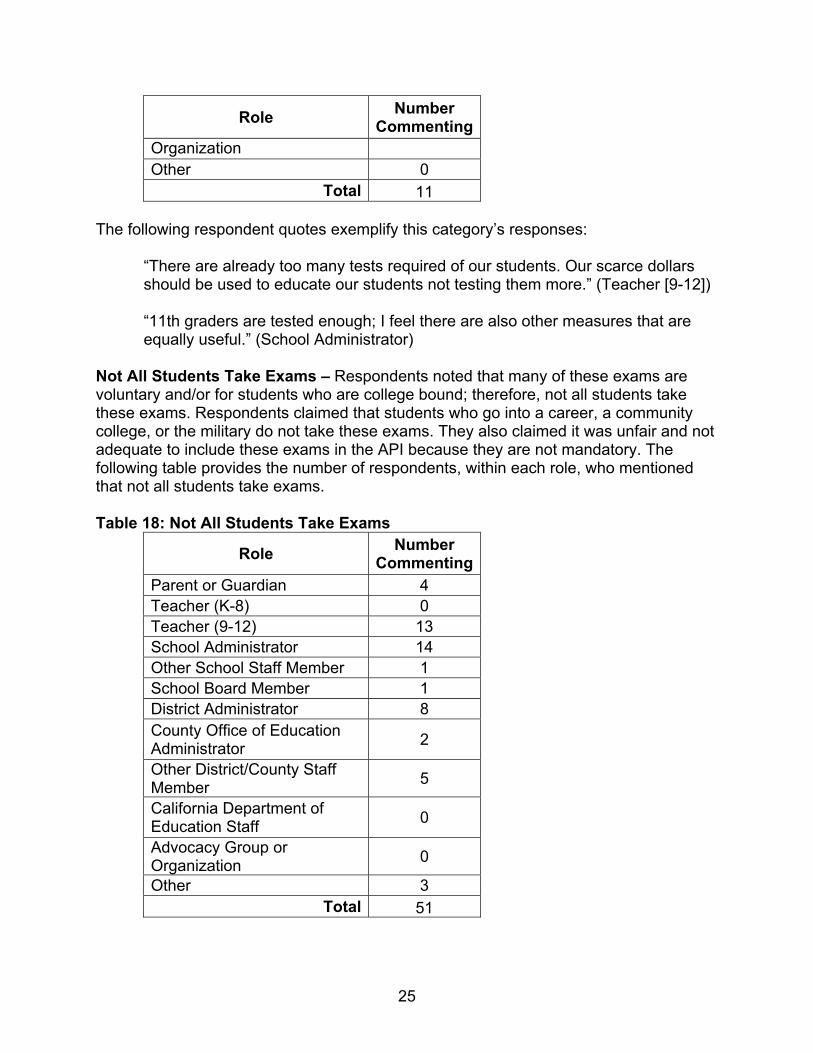
Not All Students Take Exams – Respondents noted that many of these exams are voluntary and/or for students who are college bound; therefore, not all students take these exams. Respondents claimed that students who go into a career, a community college, or the military do not take these exams. They also claimed it was unfair and not adequate to include these exams in the API because they are not mandatory. The following table provides the number of respondents, within each role, who mentioned that not all students take exams.
Table 18: Not All Students Take Exams
Role Number Commenting
Parent or Guardian 4 Teacher (K-8) 0 Teacher (9-12) 13 School Administrator 14 Other School Staff Member 1 School Board Member 1 District Administrator 8 County Office of Education Administrator 2
Other District/County Staff Member 5
California Department of Education Staff 0
Advocacy Group or Organization 0
Other 3 Total 51
25
The following respondent quotes exemplify this category’s responses:
“Not all students take ACT or SAT as they will start college at a local Community College.” (School Administrator)
“SAT and the ACT, although good measures, should not be used since many students do not take them.” (Teacher [9-12])
“ACT and SAT are for students who want to go to college. There are students who do not want to college, but it does not mean that the school's API should be affected.” (Teacher [9-12])
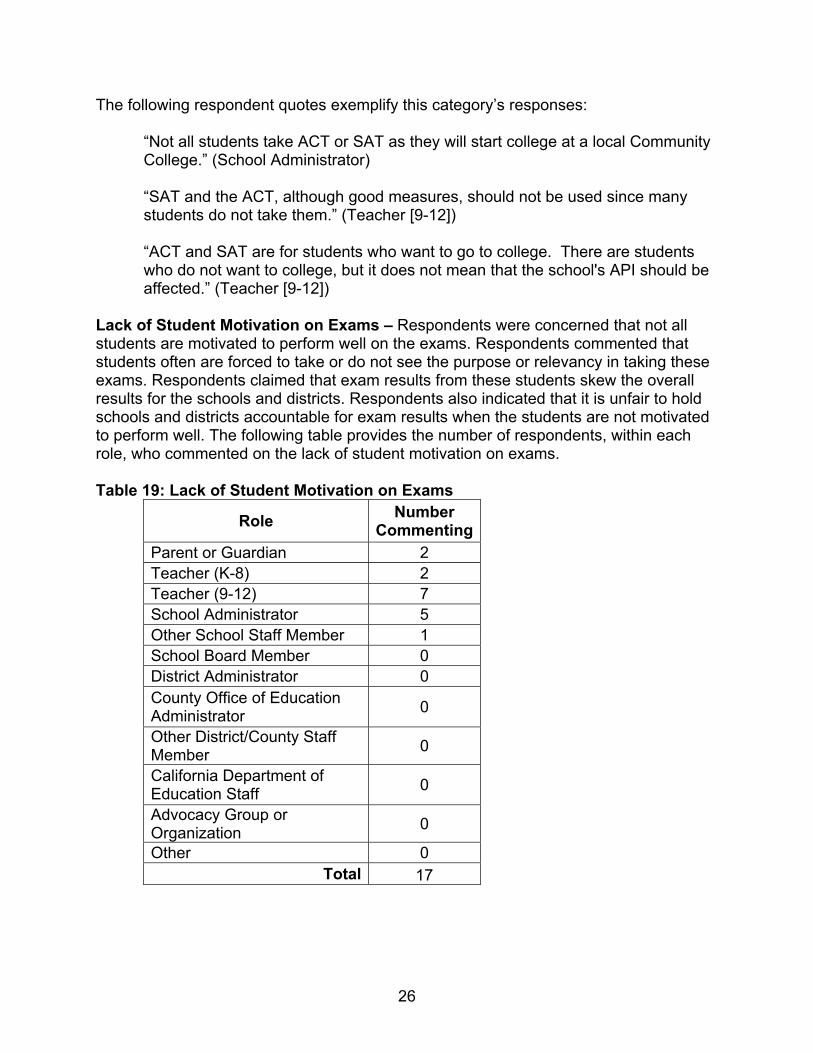
Lack of Student Motivation on Exams – Respondents were concerned that not all students are motivated to perform well on the exams. Respondents commented that students often are forced to take or do not see the purpose or relevancy in taking these exams. Respondents claimed that exam results from these students skew the overall results for the schools and districts. Respondents also indicated that it is unfair to hold schools and districts accountable for exam results when the students are not motivated to perform well. The following table provides the number of respondents, within each role, who commented on the lack of student motivation on exams.
Table 19: Lack of Student Motivation on Exams
Role Number Commenting
Parent or Guardian 2 Teacher (K-8) 2 Teacher (9-12) 7 School Administrator 5 Other School Staff Member 1 School Board Member 0 District Administrator 0 County Office of Education Administrator 0
Other District/County Staff Member 0
California Department of Education Staff 0
Advocacy Group or Organization 0
Other 0 Total 17
26
The following respondent quotes exemplify this category’s responses:
“Creating indicators that are based on measures where students don't have a fundamental motivation to perform well in them is problematic.” (School Administrator)
“Students rarely take the EAP seriously and this could have a detrimental effect on the overall results.” (Teacher [9-12])
“Students need a ‘buy in’ for this. Time and time again, students will tell me they don’t care because it doesn't affect them. There is no consequence for them if they don't care.” (Teacher [9-12])
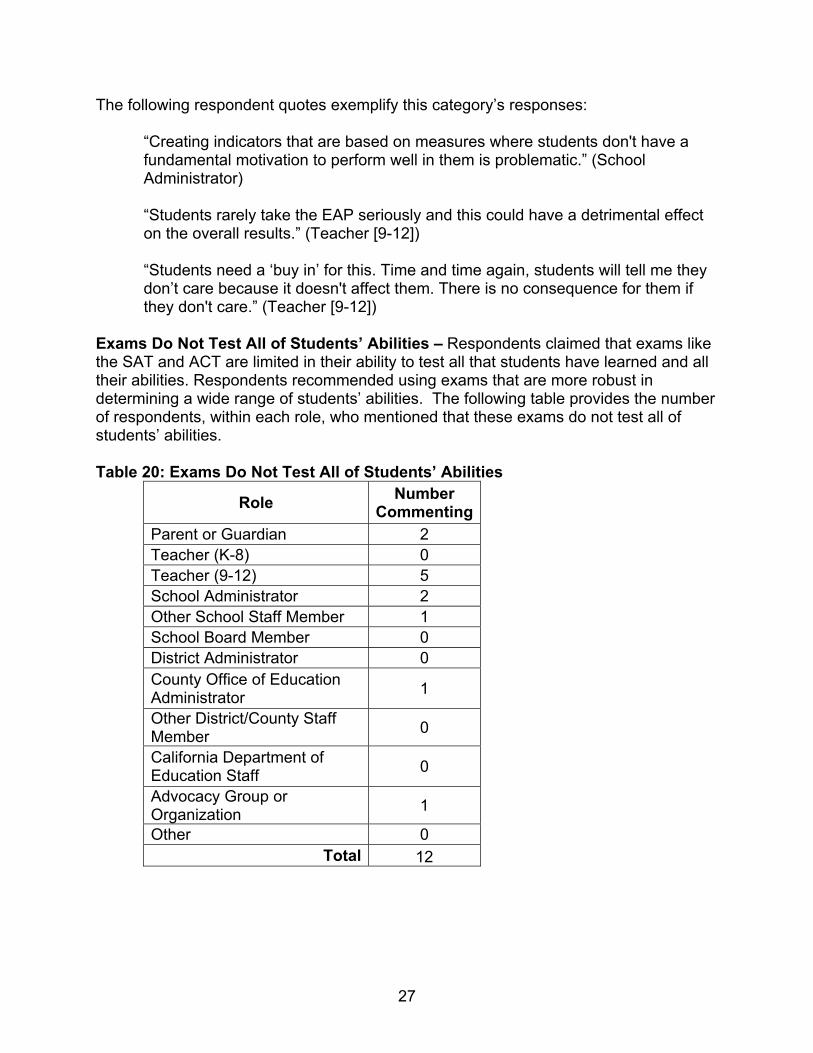
Exams Do Not Test All of Students’ Abilities – Respondents claimed that exams like the SAT and ACT are limited in their ability to test all that students have learned and all their abilities. Respondents recommended using exams that are more robust in determining a wide range of students’ abilities. The following table provides the number of respondents, within each role, who mentioned that these exams do not test all of students’ abilities.
Table 20: Exams Do Not Test All of Students’ Abilities
Role Number Commenting
Parent or Guardian 2 Teacher (K-8) 0 Teacher (9-12) 5 School Administrator 2 Other School Staff Member 1 School Board Member 0 District Administrator 0 County Office of Education Administrator 1
Other District/County Staff Member 0
California Department of Education Staff 0
Advocacy Group or Organization 1
Other 0 Total 12
27
The following respondent quotes exemplify this category’s responses:
“Tests alone are not a full measure of a student’s ability to think and reason effectively.” (Parent or Guardian)
“Single standardized tests are rarely a true measure of what a student has learned.” (Teacher [9-12])
“These standardized tests are not an accurate measure of what the student has learned in their school.” (Other School Staff Member)
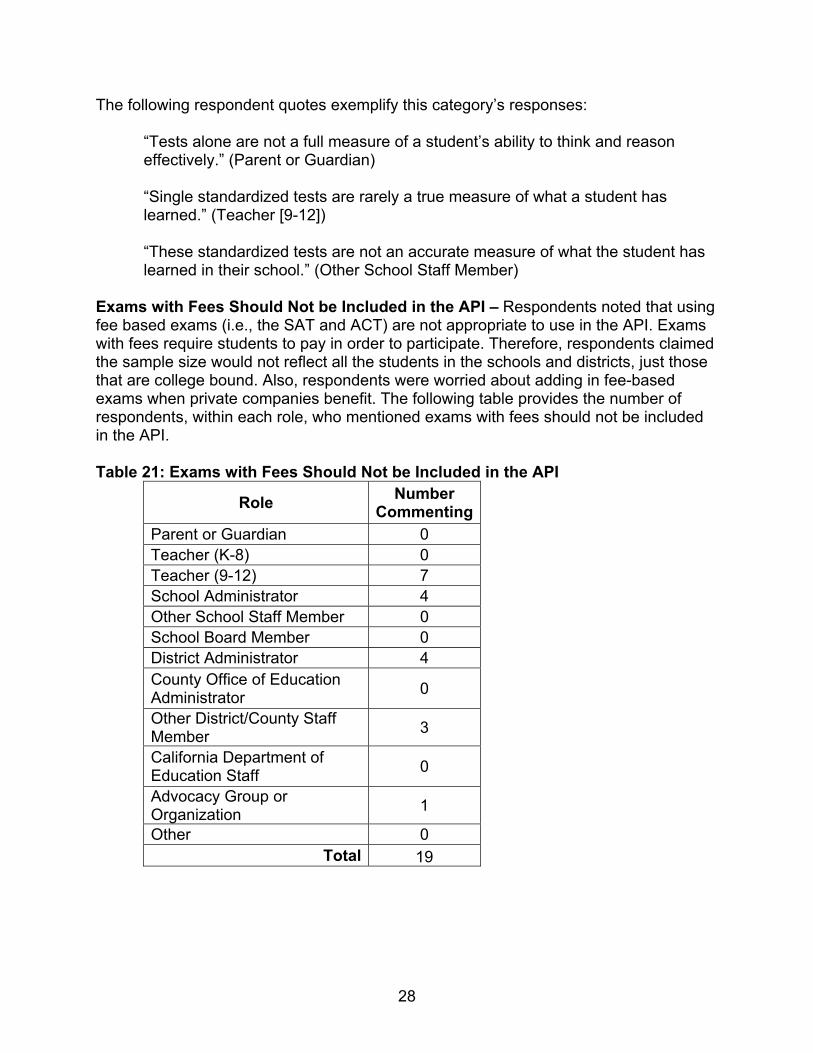
Exams with Fees Should Not be Included in the API – Respondents noted that using fee based exams (i.e., the SAT and ACT) are not appropriate to use in the API. Exams with fees require students to pay in order to participate. Therefore, respondents claimed the sample size would not reflect all the students in the schools and districts, just those that are college bound. Also, respondents were worried about adding in fee-based exams when private companies benefit. The following table provides the number of respondents, within each role, who mentioned exams with fees should not be included in the API.
Table 21: Exams with Fees Should Not be Included in the API
Role Number Commenting
Parent or Guardian 0 Teacher (K-8) 0 Teacher (9-12) 7 School Administrator 4 Other School Staff Member 0 School Board Member 0 District Administrator 4 County Office of Education Administrator 0
Other District/County Staff Member 3
California Department of Education Staff 0
Advocacy Group or Organization 1
Other 0 Total 19
28
The following respondent quotes exemplify this category’s responses:
“Because students pay for their own ACT/SAT, the sample size is not reflective of all students and it varies depending on socioeconomic status of school.” (School Administrator)
“Unless these tests were paid for, many of our students -- even with a reduced fee -- don't take these tests.” (Teacher [9-12])
“It's not fair to penalize a school or school district on factors that have a cost AND go towards a private institution.” (Teacher [9-12])
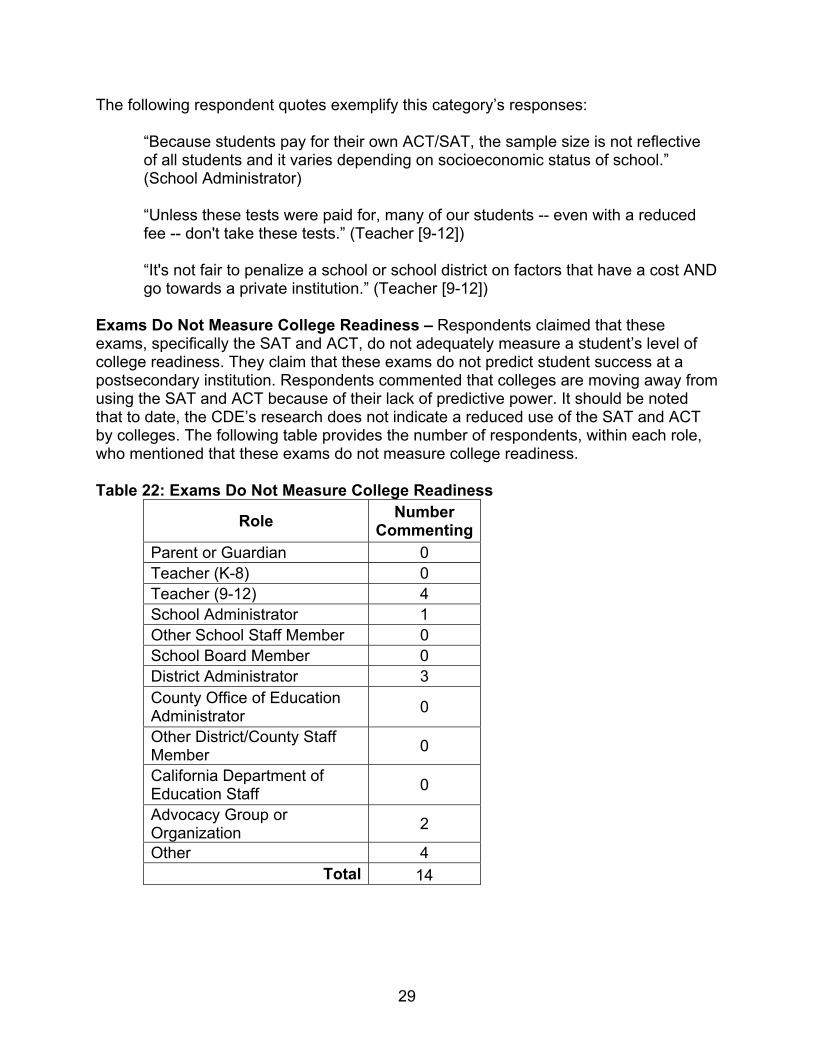
Exams Do Not Measure College Readiness – Respondents claimed that these exams, specifically the SAT and ACT, do not adequately measure a student’s level of college readiness. They claim that these exams do not predict student success at a postsecondary institution. Respondents commented that colleges are moving away from using the SAT and ACT because of their lack of predictive power. It should be noted that to date, the CDE’s research does not indicate a reduced use of the SAT and ACT by colleges. The following table provides the number of respondents, within each role, who mentioned that these exams do not measure college readiness.
Table 22: Exams Do Not Measure College Readiness
Role Number Commenting
Parent or Guardian 0 Teacher (K-8) 0 Teacher (9-12) 4 School Administrator 1 Other School Staff Member 0 School Board Member 0 District Administrator 3 County Office of Education Administrator 0
Other District/County Staff Member 0
California Department of Education Staff 0
Advocacy Group or Organization 2
Other 4 Total 14
29
The following respondent quotes exemplify this category’s responses:
“For the SAT and ACT, the vast majority of research has shown that these tests are not adequate measures for college readiness. A single assessment is not a valid measure for college readiness.” (Other)
“Colleges are no longer depending on the SAT and ACT as much, and we agree that an over-reliance on these tests to determine college readiness can be problematic.” (Other)
“Many colleges are no longer using the SAT or ACT exams. They are deemed as ineffective at predicting success in college.” (Teacher [9-12])
Career Indicators
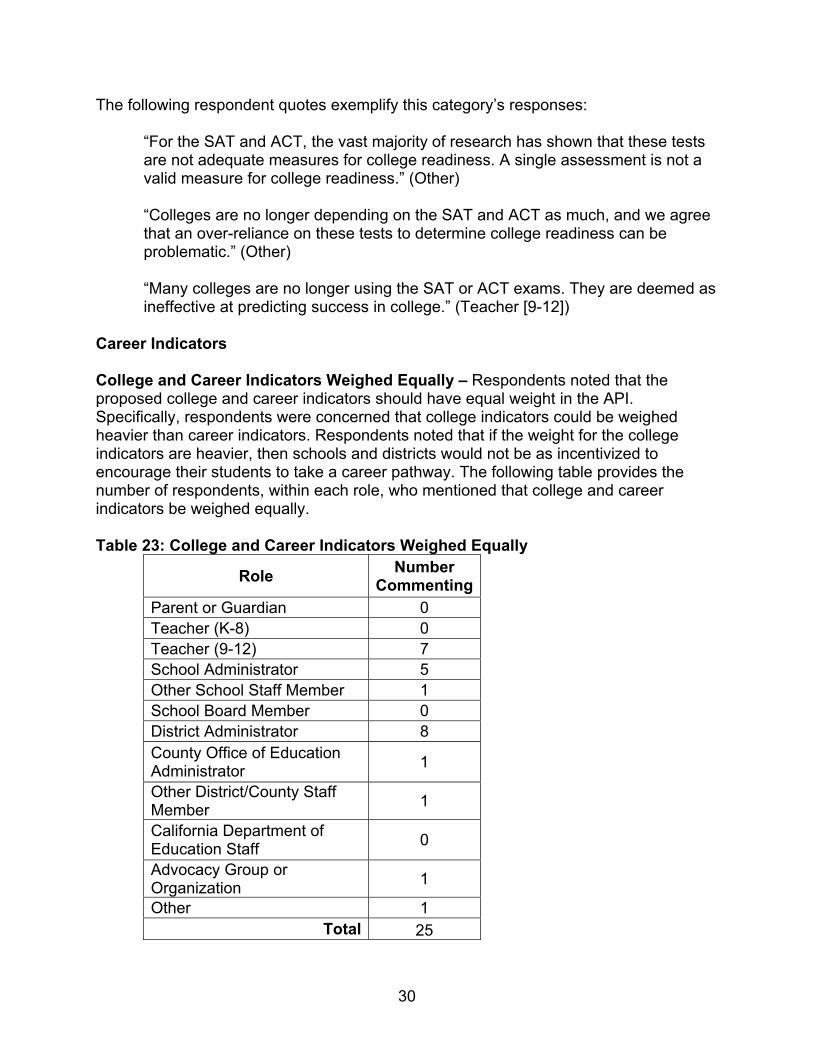
College and Career Indicators Weighed Equally – Respondents noted that the proposed college and career indicators should have equal weight in the API. Specifically, respondents were concerned that college indicators could be weighed heavier than career indicators. Respondents noted that if the weight for the college indicators are heavier, then schools and districts would not be as incentivized to encourage their students to take a career pathway. The following table provides the number of respondents, within each role, who mentioned that college and career indicators be weighed equally.
Table 23: College and Career Indicators Weighed Equally
Role Number Commenting
Parent or Guardian 0 Teacher (K-8) 0 Teacher (9-12) 7 School Administrator 5 Other School Staff Member 1 School Board Member 0 District Administrator 8 County Office of Education Administrator 1
Other District/County Staff Member 1
California Department of Education Staff 0
Advocacy Group or Organization 1
Other 1 Total 25
30
The following respondent quotes exemplify this category’s responses:
“Career readiness must be averaged in with equal weighting. If the weight is not equal, high schools will be incentivized to lean toward college prep only (or vice versa).” (Teacher [9-12])
“All of these indicators need to have the same weight.” (School Administrator)
“I would recommend that college and career indicators should be weighted equally.” (District Administrator)
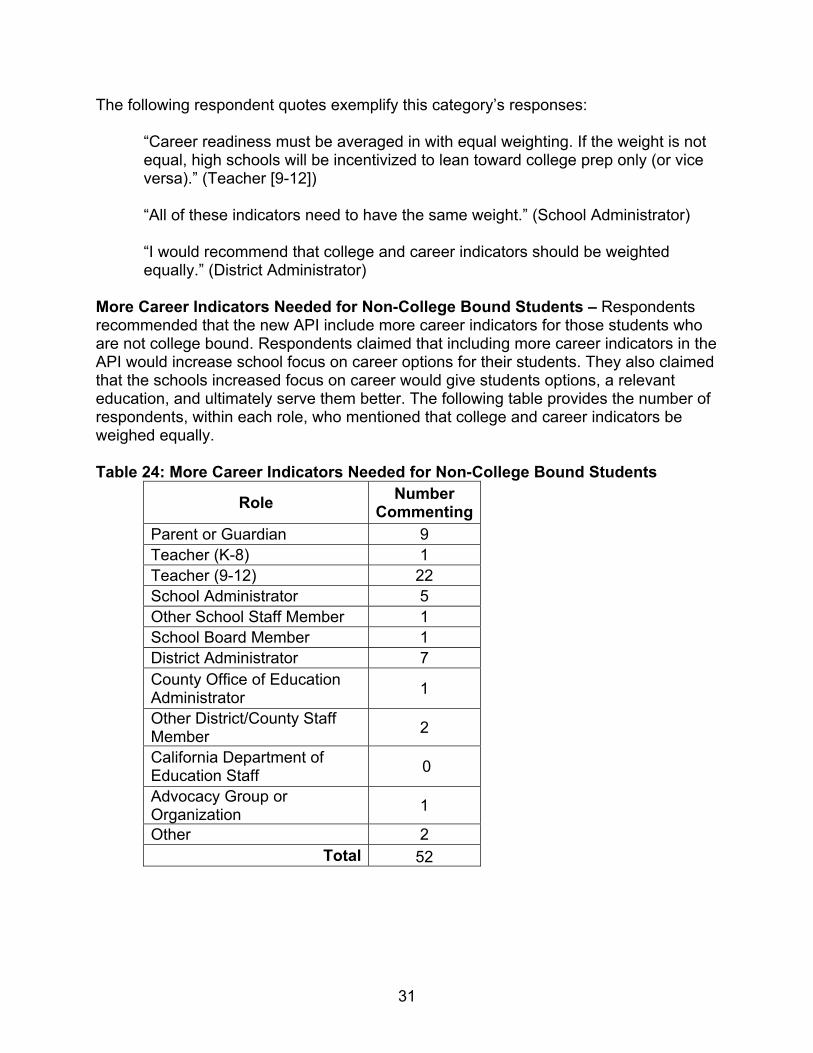
More Career Indicators Needed for Non-College Bound Students – Respondents recommended that the new API include more career indicators for those students who are not college bound. Respondents claimed that including more career indicators in the API would increase school focus on career options for their students. They also claimed that the schools increased focus on career would give students options, a relevant education, and ultimately serve them better. The following table provides the number of respondents, within each role, who mentioned that college and career indicators be weighed equally.
Table 24: More Career Indicators Needed for Non-College Bound Students
Role Number Commenting
Parent or Guardian 9 Teacher (K-8) 1 Teacher (9-12) 22 School Administrator 5 Other School Staff Member 1 School Board Member 1 District Administrator 7 County Office of Education Administrator 1
Other District/County Staff Member 2
California Department of Education Staff 0
Advocacy Group or Organization 1
Other 2 Total 52
31
The following respondent quotes exemplify this category’s responses:
“More vocational classes are needed, and they need to help with the API or schools won't promote them.” (Teacher [9-12]) “I would like to see a stronger emphasis on Career and Technical Education courses for all students to prepare them for both College and Career challenges.” (Teacher [9-12])
“There is too much emphasis on preparing students for college -- the emphasis on being college ready puts all students and programs at a disadvantage as college is not for everyone and we need students who are prepared to enter the job market.” (Teacher [9-12])
General Comments
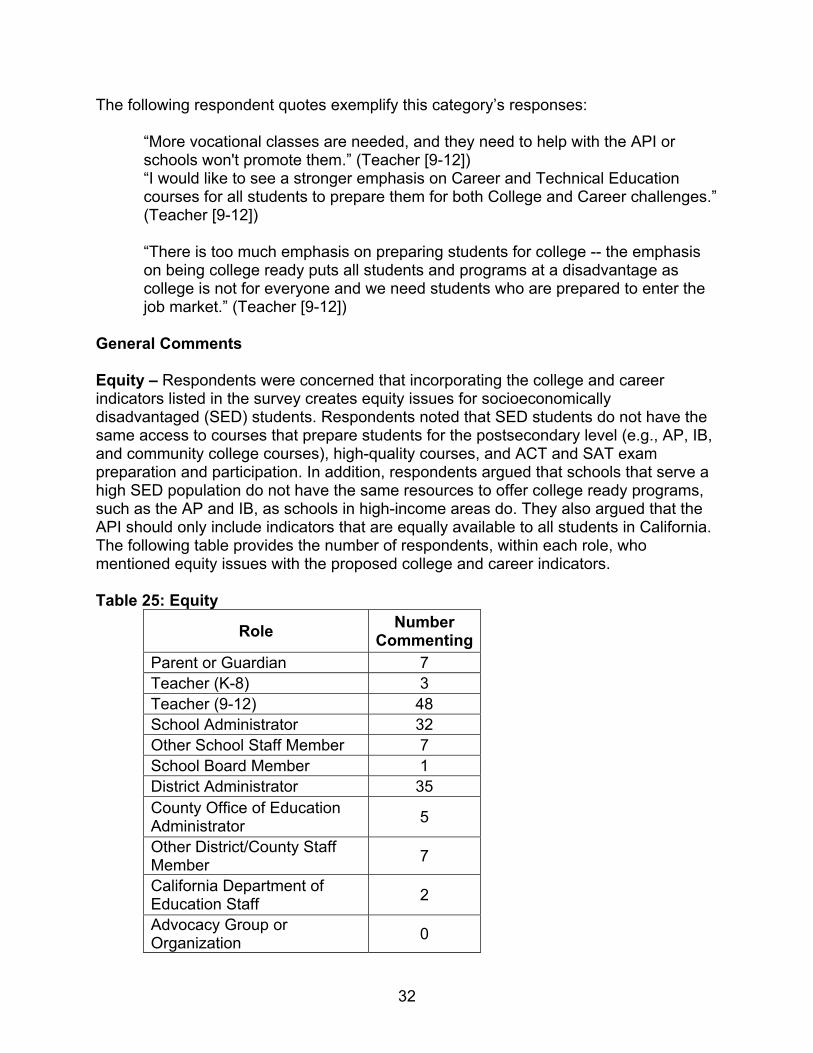
Equity – Respondents were concerned that incorporating the college and career indicators listed in the survey creates equity issues for socioeconomically disadvantaged (SED) students. Respondents noted that SED students do not have the same access to courses that prepare students for the postsecondary level (e.g., AP, IB, and community college courses), high-quality courses, and ACT and SAT exam preparation and participation. In addition, respondents argued that schools that serve a high SED population do not have the same resources to offer college ready programs, such as the AP and IB, as schools in high-income areas do. They also argued that the API should only include indicators that are equally available to all students in California. The following table provides the number of respondents, within each role, who mentioned equity issues with the proposed college and career indicators.
Table 25: Equity
Role Number Commenting
Parent or Guardian 7 Teacher (K-8) 3 Teacher (9-12) 48 School Administrator 32 Other School Staff Member 7 School Board Member 1 District Administrator 35 County Office of Education Administrator 5
Other District/County Staff Member 7
California Department of Education Staff 2
Advocacy Group or Organization 0
32
Role Number Commenting
Other 8 Total 155
The following respondent quotes exemplify this category’s responses:
“Access is a huge issue with regard to students taking community college courses. There are many students capable of taking community college courses but do not have the funds, the transportation, or the time” (District Administrator)
“Not all schools offer IB programs and the other exams are optional and can be costly. These factors would negatively impact lower socioeconomic schools/districts.” (District Administrator)
“Access to higher level, advanced courses, like IB programs and AP classes, may not be as prevalent in lower-income communities and so until access and funding is equalized in each community, points should not be given out for such tests.” (Other)
“Several of these options are not available to all students with equal support, especially to those students who are socio-economically disadvantaged. More wealthy school districts could gain a lot from the greater number of students who are able to take these exams and to take them multiple times (SAT & ACT), supported by prep classes, to improve their scores.” (Parent or Guardian)
Additional Funding Needed – Respondents were in favor of the college and career indicators; however, they were concerned about schools being able to provide these courses with limited funding. Respondents claimed it was unfair to hold schools accountable for these indicators without providing the subsequent funding to support them. The following table provides the number of respondents, within each role, who commented on the need for additional funding to implement the college and career indicators.
Table 26: Additional Funding Needed
Role Number Commenting
Parent or Guardian 0 Teacher (K-8) 0 Teacher (9-12) 3 School Administrator 6 Other School Staff Member 3 School Board Member 0 District Administrator 4
33
Role Number Commenting
County Office of Education Administrator 0
Other District/County Staff Member 1
California Department of Education Staff 0
Advocacy Group or Organization 0
Other 3 Total 20
The following respondent quotes exemplify this category’s responses:
“I didn't oppose most of the above indicators but many are not offered at my site and would be expensive. The notion of setting requirements and then not providing the funding to support the requirement is not appropriate.” (School Administrator)
“ROP and other career technical course rigor have deteriorated mainly because of a lack of funding.” (Other)
“This is the direction we need to be headed, but of course funding must be implemented at the same time.” (Other)
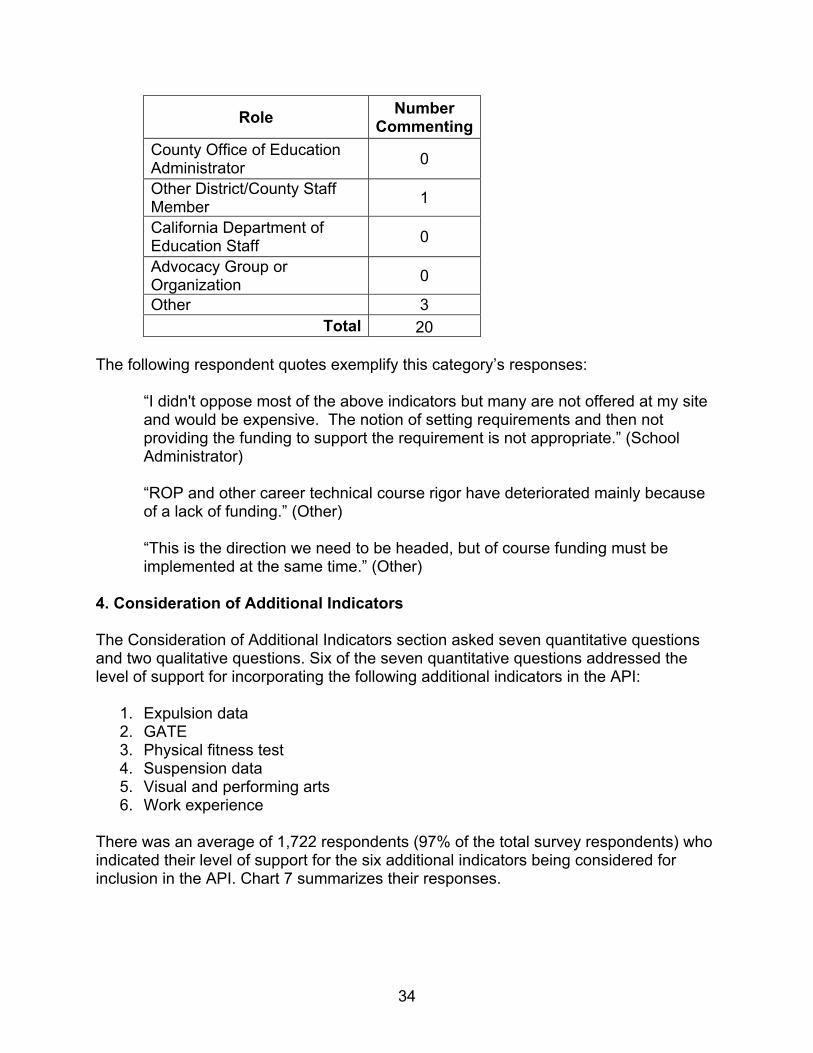
4. Consideration of Additional Indicators
The Consideration of Additional Indicators section asked seven quantitative questions and two qualitative questions. Six of the seven quantitative questions addressed the level of support for incorporating the following additional indicators in the API:
1. Expulsion data 2. GATE 3. Physical fitness test 4. Suspension data 5. Visual and performing arts 6. Work experience
There was an average of 1,722 respondents (97% of the total survey respondents) who indicated their level of support for the six additional indicators being considered for inclusion in the API. Chart 7 summarizes their responses.
34
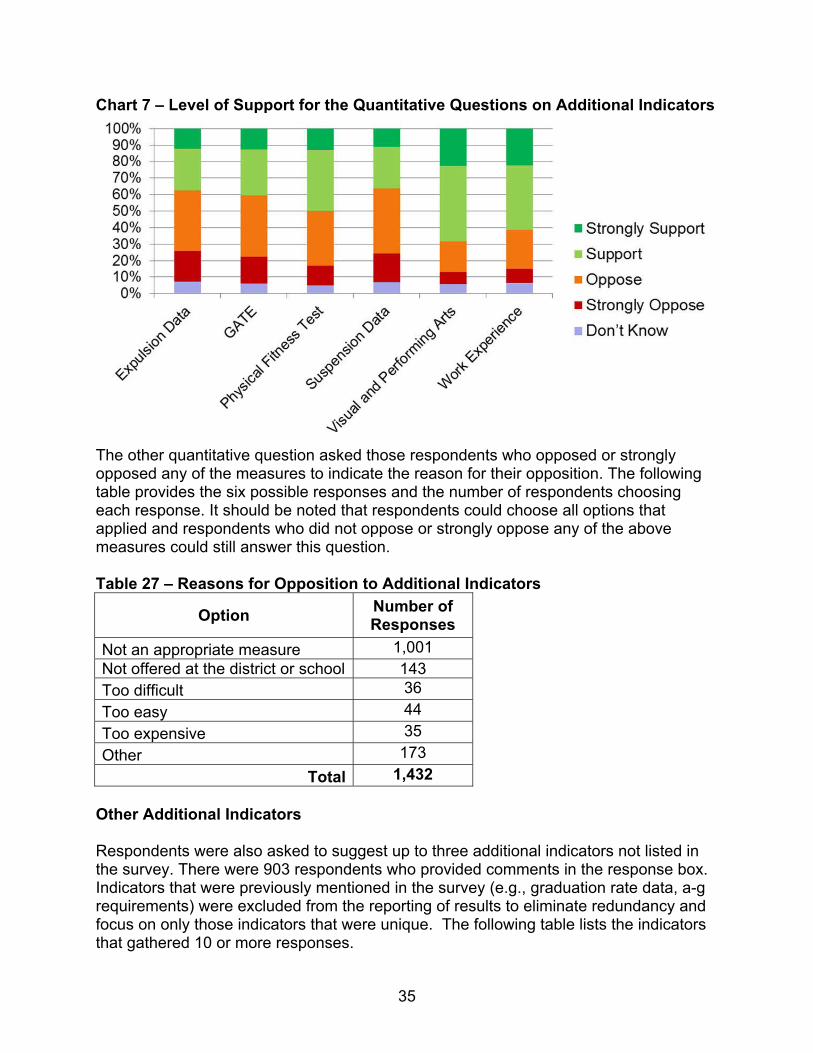
Chart 7 – Level of Support for the Quantitative Questions on Additional Indicators
The other quantitative question asked those respondents who opposed or strongly opposed any of the measures to indicate the reason for their opposition. The following table provides the six possible responses and the number of respondents choosing each response. It should be noted that respondents could choose all options that applied and respondents who did not oppose or strongly oppose any of the above measures could still answer this question.
Table 27 – Reasons for Opposition to Additional Indicators
Option Number of Responses
Not an appropriate measure 1,001 Not offered at the district or school 143 Too difficult 36 Too easy 44 Too expensive 35 Other 173
Total 1,432
Other Additional Indicators
Respondents were also asked to suggest up to three additional indicators not listed in the survey. There were 903 respondents who provided comments in the response box. Indicators that were previously mentioned in the survey (e.g., graduation rate data, a-g requirements) were excluded from the reporting of results to eliminate redundancy and focus on only those indicators that were unique. The following table lists the indicators that gathered 10 or more responses.
35
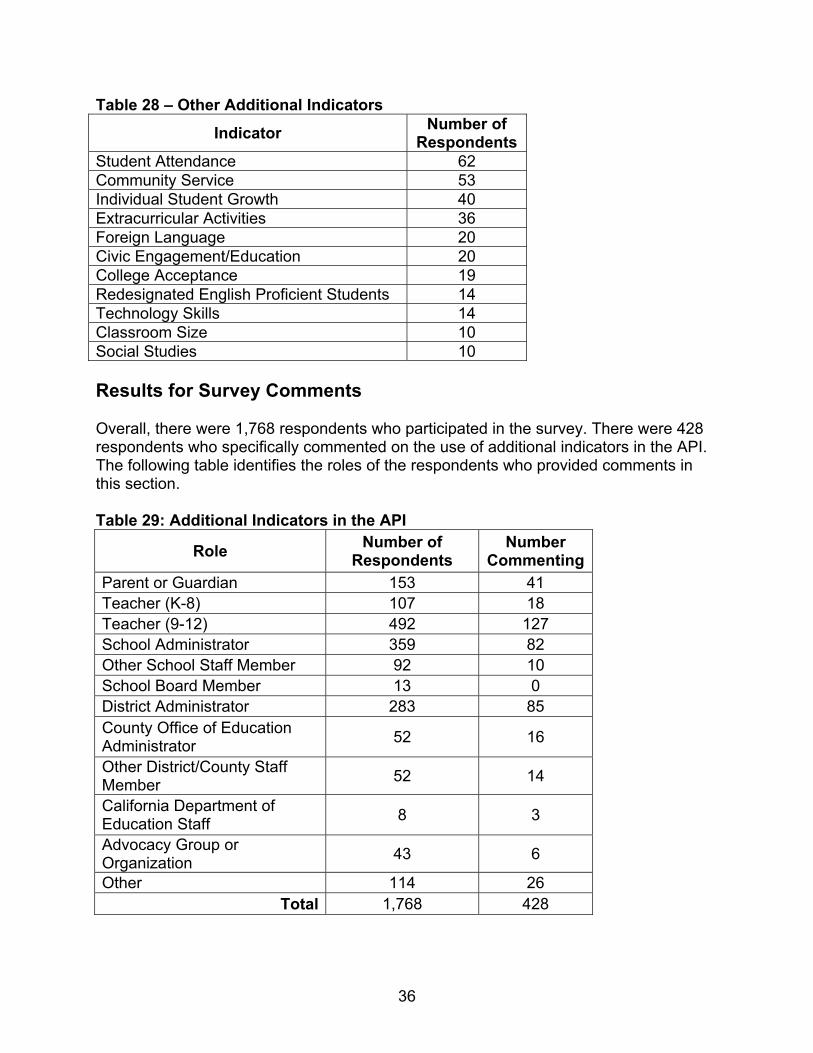
Table 28 – Other Additional Indicators
Indicator Number of Respondents
Student Attendance 62 Community Service 53 Individual Student Growth 40 Extracurricular Activities 36 Foreign Language 20 Civic Engagement/Education 20 College Acceptance 19 Redesignated English Proficient Students 14 Technology Skills 14 Classroom Size 10 Social Studies 10
Results for Survey Comments
Overall, there were 1,768 respondents who participated in the survey. There were 428 respondents who specifically commented on the use of additional indicators in the API. The following table identifies the roles of the respondents who provided comments in this section.
Table 29: Additional Indicators in the API
Role Number of Respondents
Number Commenting
Parent or Guardian 153 41 Teacher (K-8) 107 18 Teacher (9-12) 492 127 School Administrator 359 82 Other School Staff Member 92 10 School Board Member 13 0 District Administrator 283 85 County Office of Education Administrator 52 16
Other District/County Staff Member 52 14
California Department of Education Staff 8 3
Advocacy Group or Organization 43 6
Other 114 26 Total 1,768 428
36
The 428 comments were separated into categories; however, only those categories with ten or more respondents are summarized below.
Suspension and Expulsion Additional Indicator Comments
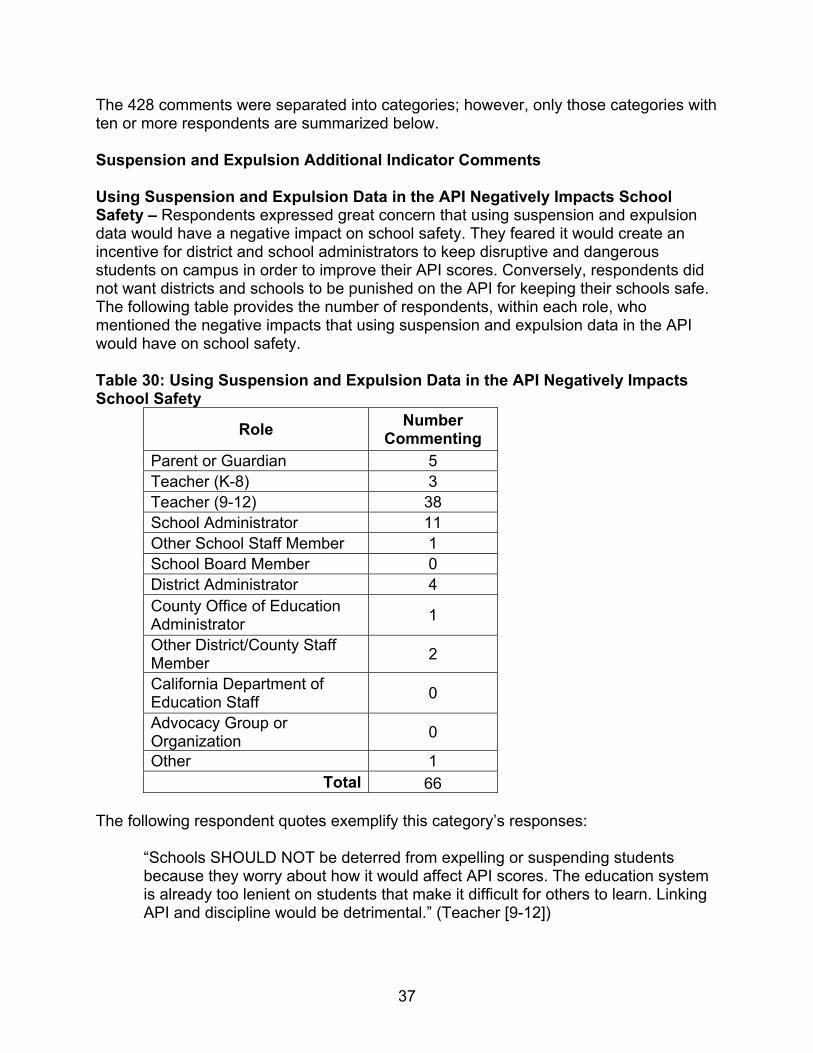
Using Suspension and Expulsion Data in the API Negatively Impacts School Safety – Respondents expressed great concern that using suspension and expulsion data would have a negative impact on school safety. They feared it would create an incentive for district and school administrators to keep disruptive and dangerous students on campus in order to improve their API scores. Conversely, respondents did not want districts and schools to be punished on the API for keeping their schools safe. The following table provides the number of respondents, within each role, who mentioned the negative impacts that using suspension and expulsion data in the API would have on school safety.
Table 30: Using Suspension and Expulsion Data in the API Negatively Impacts School Safety
Role Number Commenting
Parent or Guardian 5 Teacher (K-8) 3 Teacher (9-12) 38 School Administrator 11 Other School Staff Member 1 School Board Member 0 District Administrator 4 County Office of Education Administrator 1
Other District/County Staff Member 2
California Department of Education Staff 0
Advocacy Group or Organization 0
Other 1 Total 66
The following respondent quotes exemplify this category’s responses:
“Schools SHOULD NOT be deterred from expelling or suspending students because they worry about how it would affect API scores. The education system is already too lenient on students that make it difficult for others to learn. Linking API and discipline would be detrimental.” (Teacher [9-12])
37
“Using expulsion data will encourage administration to keep troublemakers in the classroom, limiting learning for all the other students.” (Parent or Guardian)
“Disciplinary data are not appropriate for inclusion in the API. Inclusion of these measures provides a perverse disincentive to take serious action (expulsion) against a student even when it is warranted and that student poses a threat to staff or other students on campus.” (School Administrator)
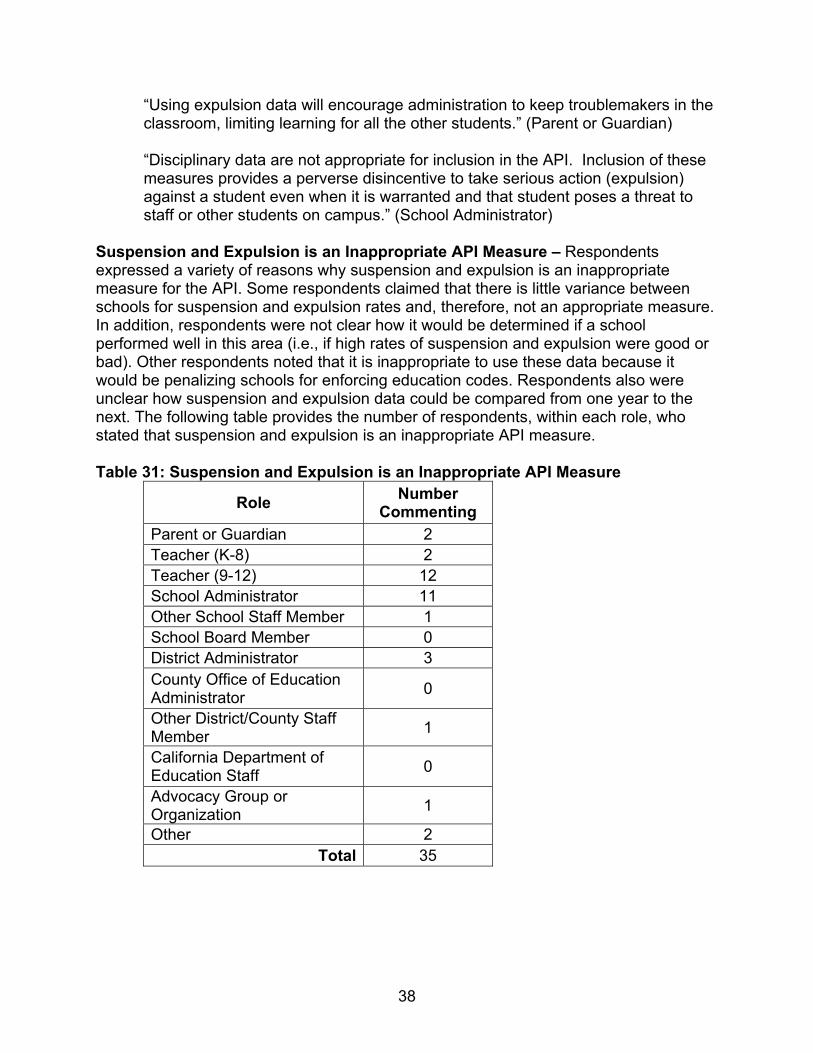
Suspension and Expulsion is an Inappropriate API Measure – Respondents expressed a variety of reasons why suspension and expulsion is an inappropriate measure for the API. Some respondents claimed that there is little variance between schools for suspension and expulsion rates and, therefore, not an appropriate measure. In addition, respondents were not clear how it would be determined if a school performed well in this area (i.e., if high rates of suspension and expulsion were good or bad). Other respondents noted that it is inappropriate to use these data because it would be penalizing schools for enforcing education codes. Respondents also were unclear how suspension and expulsion data could be compared from one year to the next. The following table provides the number of respondents, within each role, who stated that suspension and expulsion is an inappropriate API measure.
Table 31: Suspension and Expulsion is an Inappropriate API Measure
Role Number Commenting
Parent or Guardian 2 Teacher (K-8) 2 Teacher (9-12) 12 School Administrator 11 Other School Staff Member 1 School Board Member 0 District Administrator 3 County Office of Education Administrator 0
Other District/County Staff Member 1
California Department of Education Staff 0
Advocacy Group or Organization 1
Other 2 Total 35
38
The following respondent quotes exemplify this category’s responses:
“If students violate the education code, the schools should not be penalized.” (School Administrator)
“For expulsions, the rates are often so low that they don't provide any discrimination.” (District Administrator)
“I am not sure how you would score a school based on suspension/expulsion data. It seems an odd measure of school success, as the circumstances will be unique to each case.” (School Administrator)
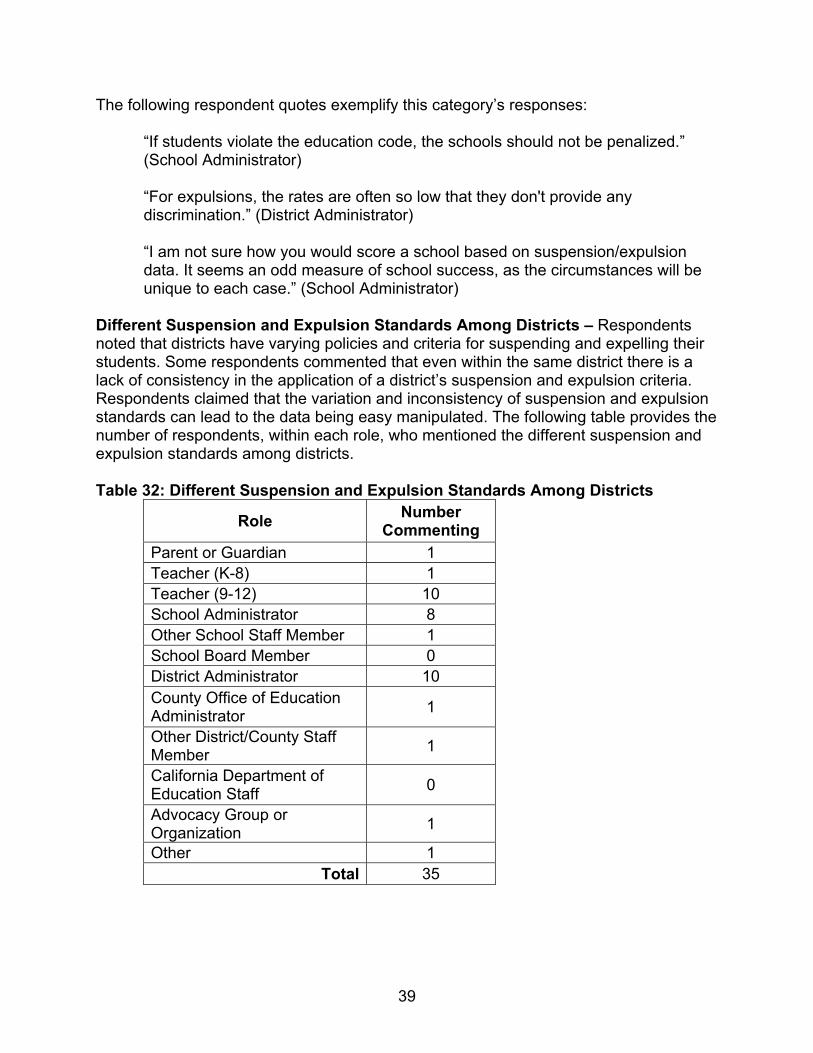
Different Suspension and Expulsion Standards Among Districts – Respondents noted that districts have varying policies and criteria for suspending and expelling their students. Some respondents commented that even within the same district there is a lack of consistency in the application of a district’s suspension and expulsion criteria. Respondents claimed that the variation and inconsistency of suspension and expulsion standards can lead to the data being easy manipulated. The following table provides the number of respondents, within each role, who mentioned the different suspension and expulsion standards among districts.
Table 32: Different Suspension and Expulsion Standards Among Districts
Role Number Commenting
Parent or Guardian 1 Teacher (K-8) 1 Teacher (9-12) 10 School Administrator 8 Other School Staff Member 1 School Board Member 0 District Administrator 10 County Office of Education Administrator 1
Other District/County Staff Member 1
California Department of Education Staff 0
Advocacy Group or Organization 1
Other 1 Total 35
39
The following respondent quotes exemplify this category’s responses:
“Suspension data is often too subjective a standard to be applied uniformly.” (Advocacy Group or Organization)
“Districts have different criteria for expulsion and suspension.” (School Administrator)
“Expulsion and suspension data should not be added because they are not meted out in a consistent manner throughout the state.” (Other District/County Staff Member)
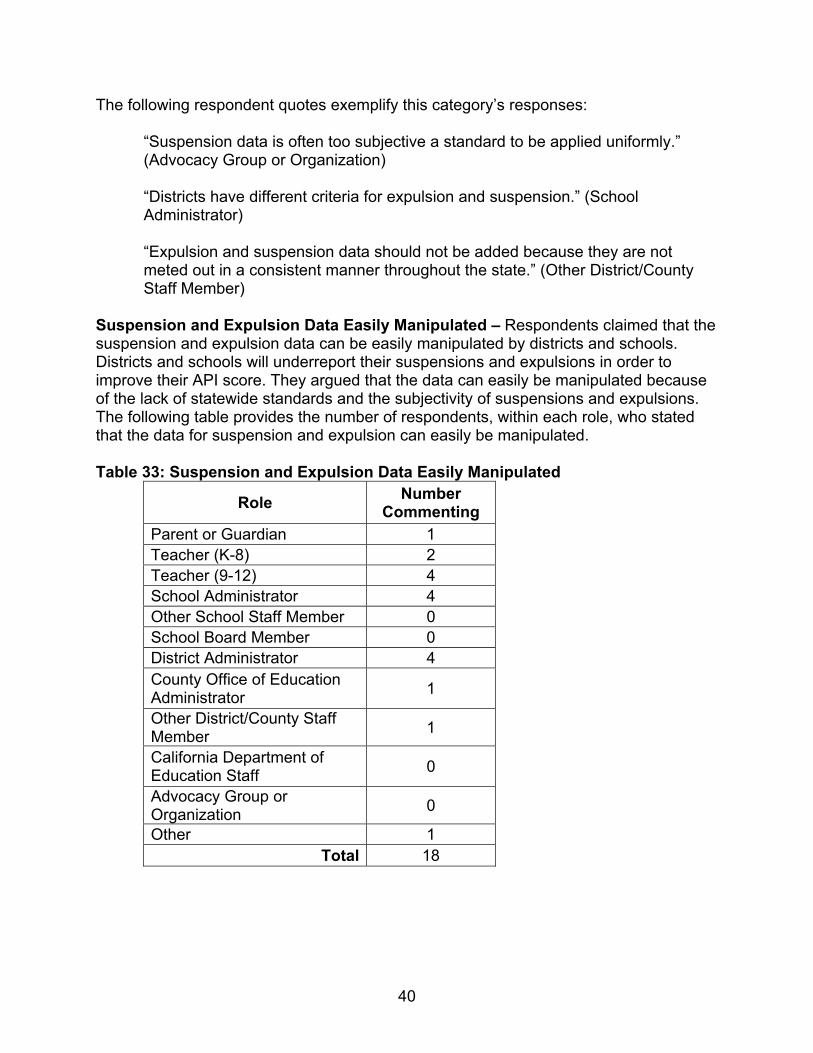
Suspension and Expulsion Data Easily Manipulated – Respondents claimed that the suspension and expulsion data can be easily manipulated by districts and schools. Districts and schools will underreport their suspensions and expulsions in order to improve their API score. They argued that the data can easily be manipulated because of the lack of statewide standards and the subjectivity of suspensions and expulsions. The following table provides the number of respondents, within each role, who stated that the data for suspension and expulsion can easily be manipulated.
Table 33: Suspension and Expulsion Data Easily Manipulated
Role Number Commenting
Parent or Guardian 1 Teacher (K-8) 2 Teacher (9-12) 4 School Administrator 4 Other School Staff Member 0 School Board Member 0 District Administrator 4 County Office of Education Administrator 1
Other District/County Staff Member 1
California Department of Education Staff 0
Advocacy Group or Organization 0
Other 1 Total 18
40
The following respondent quotes exemplify this category’s responses:
“Adding suspension and expulsion data would only cause schools to manipulate their data which would tie administrators' hands and cause a lack of order on campuses.” (Teacher [9-12])
“Expulsion and suspension data and approaches are too easily manipulated by school sites and districts.” (Parent or Guardian)
“Students threaten staff and other students and administration "throws out" or loses the suspension numbers, flat out lie about the numbers to make themselves look good, and oppose expulsion so they can have better statistics.” (Teacher [9-12])
GATE, Visual Performing Arts, and Work Experience Indicators
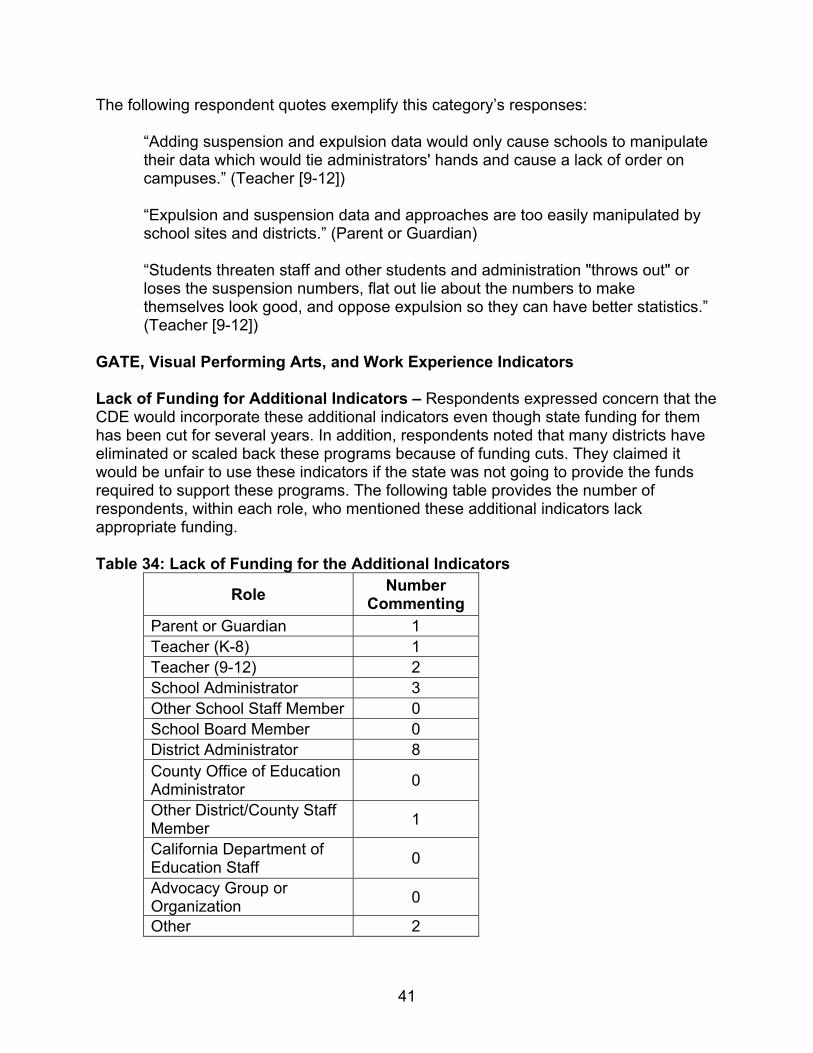
Lack of Funding for Additional Indicators – Respondents expressed concern that the CDE would incorporate these additional indicators even though state funding for them has been cut for several years. In addition, respondents noted that many districts have eliminated or scaled back these programs because of funding cuts. They claimed it would be unfair to use these indicators if the state was not going to provide the funds required to support these programs. The following table provides the number of respondents, within each role, who mentioned these additional indicators lack appropriate funding.
Table 34: Lack of Funding for the Additional Indicators
Role Number Commenting
Parent or Guardian 1 Teacher (K-8) 1 Teacher (9-12) 2 School Administrator 3 Other School Staff Member 0 School Board Member 0 District Administrator 8 County Office of Education Administrator 0
Other District/County Staff Member 1
California Department of Education Staff 0
Advocacy Group or Organization 0
Other 2
41
Role Number Commenting
Total 18
The following respondent quotes exemplify this category’s responses:
“GATE and performing arts are not applicable due to funding/budget cuts.” (Other District/County Staff Member)
“GATE is not a required program in the state and there have never been enough GATE funds for all schools to participate.” (District Administrator)
“Work experience and GATE should not be used unless they are separately funded by the state.” (District Administrator)
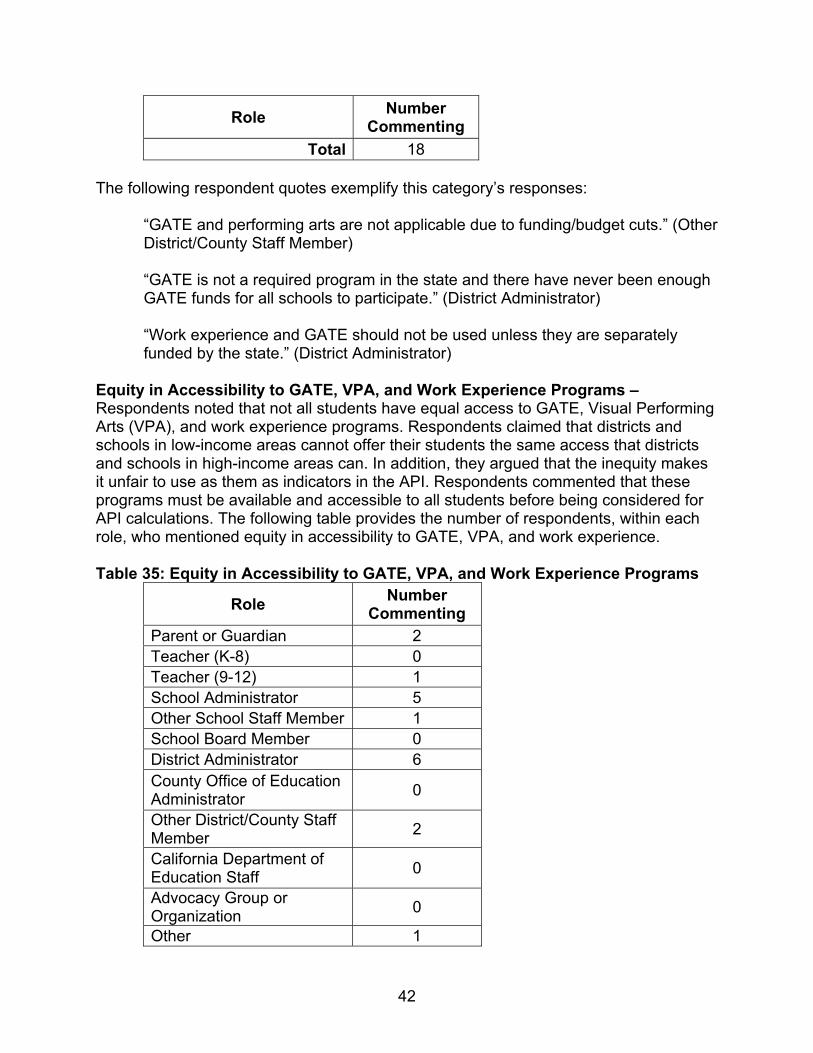
Equity in Accessibility to GATE, VPA, and Work Experience Programs – Respondents noted that not all students have equal access to GATE, Visual Performing Arts (VPA), and work experience programs. Respondents claimed that districts and schools in low-income areas cannot offer their students the same access that districts and schools in high-income areas can. In addition, they argued that the inequity makes it unfair to use as them as indicators in the API. Respondents commented that these programs must be available and accessible to all students before being considered for API calculations. The following table provides the number of respondents, within each role, who mentioned equity in accessibility to GATE, VPA, and work experience.
Table 35: Equity in Accessibility to GATE, VPA, and Work Experience Programs
Role Number Commenting
Parent or Guardian 2 Teacher (K-8) 0 Teacher (9-12) 1 School Administrator 5 Other School Staff Member 1 School Board Member 0 District Administrator 6 County Office of Education Administrator 0
Other District/County Staff Member 2
California Department of Education Staff 0
Advocacy Group or Organization 0
Other 1
42
Role Number Commenting
Total 18
The following respondent quotes exemplify this category’s responses:
“Again, these opportunities need to be available and supported for each and every student in the school districts, regardless of socioeconomic background.” (Parent or Guardian)
“Concern is whether or not all districts are able to offer the same programs and opportunities to student population. Districts with a higher number of disadvantaged students may be required by law to allocate funding to programs addressing needs of disadvantaged students which might result in an inability to offer AP classes, visual/performing arts, and other programs requiring funding.” (Other District/County Staff Member)
“GATE is a resource made available by some districts, but not all, for a narrow group of students.” (District Administrator)
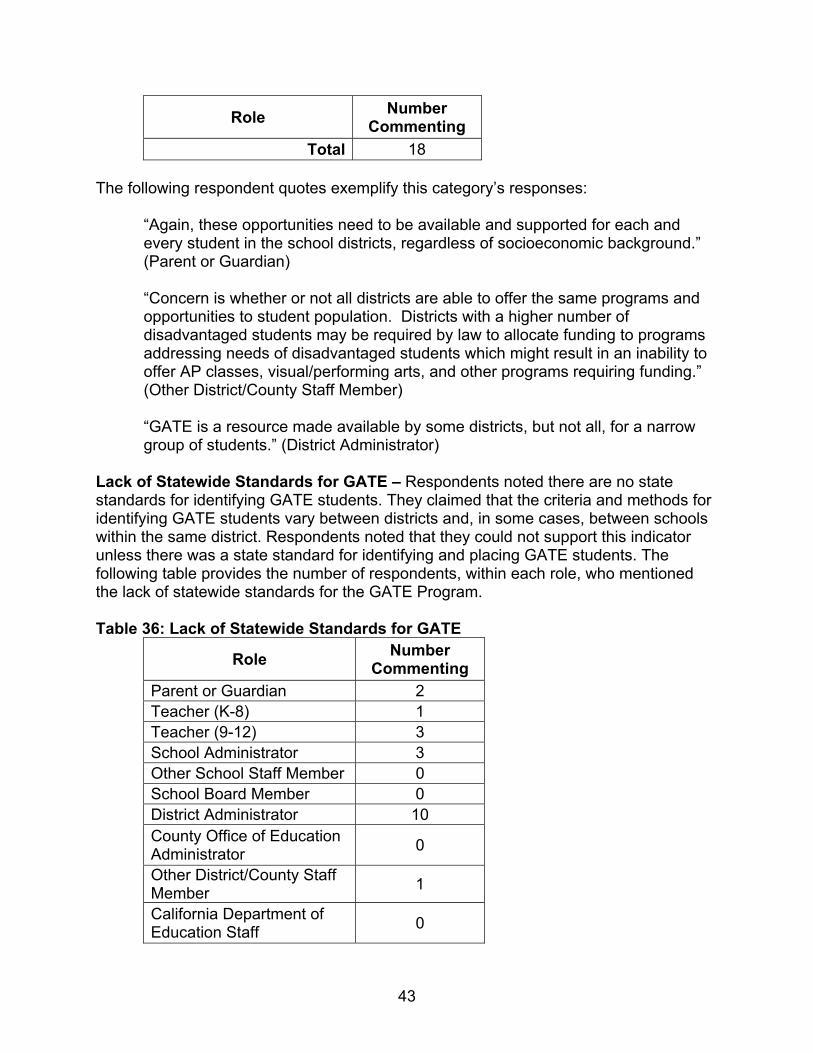
Lack of Statewide Standards for GATE – Respondents noted there are no state standards for identifying GATE students. They claimed that the criteria and methods for identifying GATE students vary between districts and, in some cases, between schools within the same district. Respondents noted that they could not support this indicator unless there was a state standard for identifying and placing GATE students. The following table provides the number of respondents, within each role, who mentioned the lack of statewide standards for the GATE Program.
Table 36: Lack of Statewide Standards for GATE
Role Number Commenting
Parent or Guardian 2 Teacher (K-8) 1 Teacher (9-12) 3 School Administrator 3 Other School Staff Member 0 School Board Member 0 District Administrator 10 County Office of Education Administrator 0
Other District/County Staff Member 1
California Department of Education Staff 0
43
Role Number Commenting
Advocacy Group or Organization 0
Other 1 Total 21
The following respondent quotes exemplify this category’s responses:
“GATE programs are not consistent in how they determine who is eligible to participate, and the measures they use are not consistent across the state.” (Parent or Guardian)
“GATE indicators vary across districts and would not be a consistent or fair measure.” (District Administrator)
General Comments on Additional Indicators
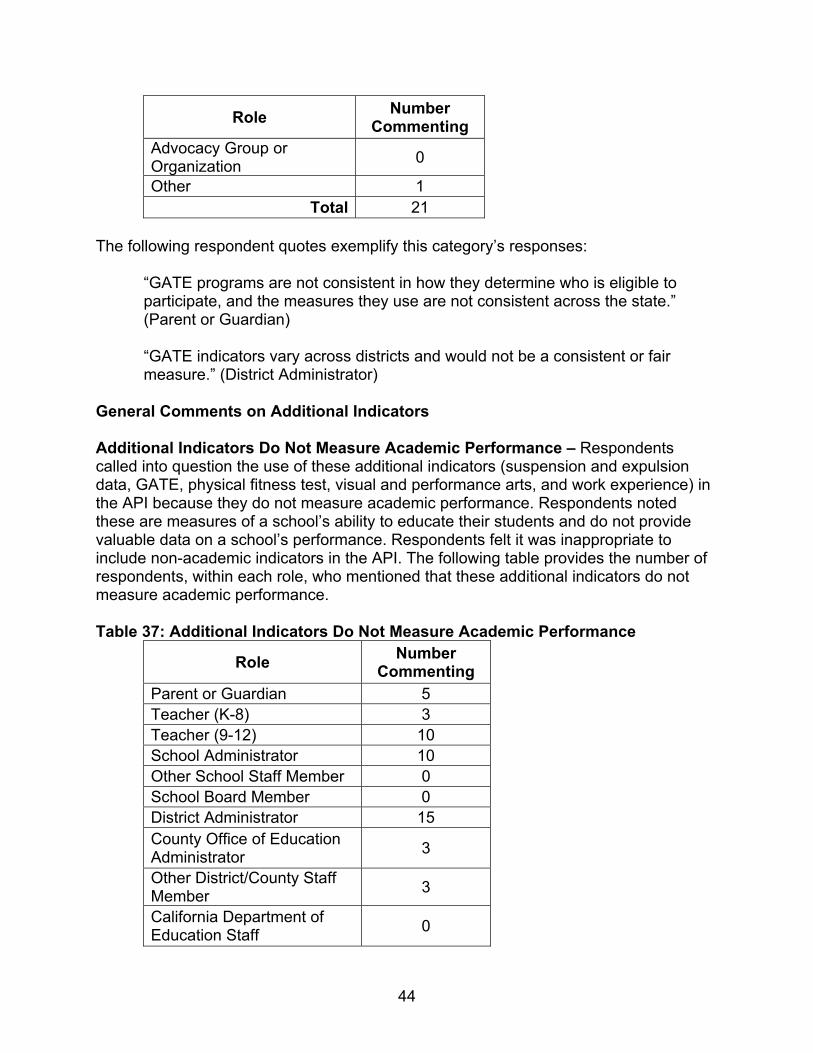
Additional Indicators Do Not Measure Academic Performance – Respondents called into question the use of these additional indicators (suspension and expulsion data, GATE, physical fitness test, visual and performance arts, and work experience) in the API because they do not measure academic performance. Respondents noted these are measures of a school’s ability to educate their students and do not provide valuable data on a school’s performance. Respondents felt it was inappropriate to include non-academic indicators in the API. The following table provides the number of respondents, within each role, who mentioned that these additional indicators do not measure academic performance.
Table 37: Additional Indicators Do Not Measure Academic Performance
Role Number Commenting
Parent or Guardian 5 Teacher (K-8) 3 Teacher (9-12) 10 School Administrator 10 Other School Staff Member 0 School Board Member 0 District Administrator 15 County Office of Education Administrator 3
Other District/County Staff Member 3
California Department of Education Staff 0
44
Role Number Commenting
Advocacy Group or Organization 0
Other 3 Total 52
The following respondent quotes exemplify this category’s responses:
“Programs such as GATE, suspensions and expulsions are not a measure of academic performance.” (District Administrator)
“API is ACADEMIC Performance Index, not a holistic evaluation of a school. These indicators do not fall under the Academic umbrella.” (School Administrator)
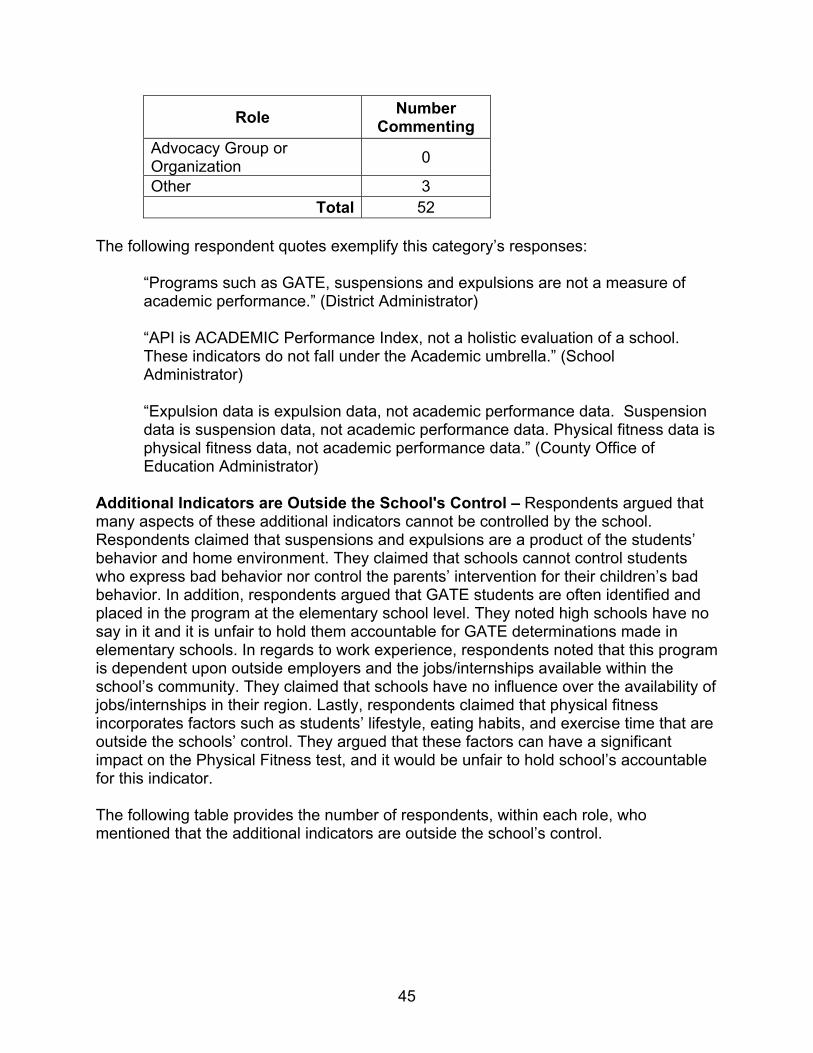
“Expulsion data is expulsion data, not academic performance data. Suspension data is suspension data, not academic performance data. Physical fitness data is physical fitness data, not academic performance data.” (County Office of Education Administrator)
Additional Indicators are Outside the School's Control – Respondents argued that many aspects of these additional indicators cannot be controlled by the school. Respondents claimed that suspensions and expulsions are a product of the students’ behavior and home environment. They claimed that schools cannot control students who express bad behavior nor control the parents’ intervention for their children’s bad behavior. In addition, respondents argued that GATE students are often identified and placed in the program at the elementary school level. They noted high schools have no say in it and it is unfair to hold them accountable for GATE determinations made in elementary schools. In regards to work experience, respondents noted that this program is dependent upon outside employers and the jobs/internships available within the school’s community. They claimed that schools have no influence over the availability of jobs/internships in their region. Lastly, respondents claimed that physical fitness incorporates factors such as students’ lifestyle, eating habits, and exercise time that are outside the schools’ control. They argued that these factors can have a significant impact on the Physical Fitness test, and it would be unfair to hold school’s accountable for this indicator.
The following table provides the number of respondents, within each role, who mentioned that the additional indicators are outside the school’s control.
45
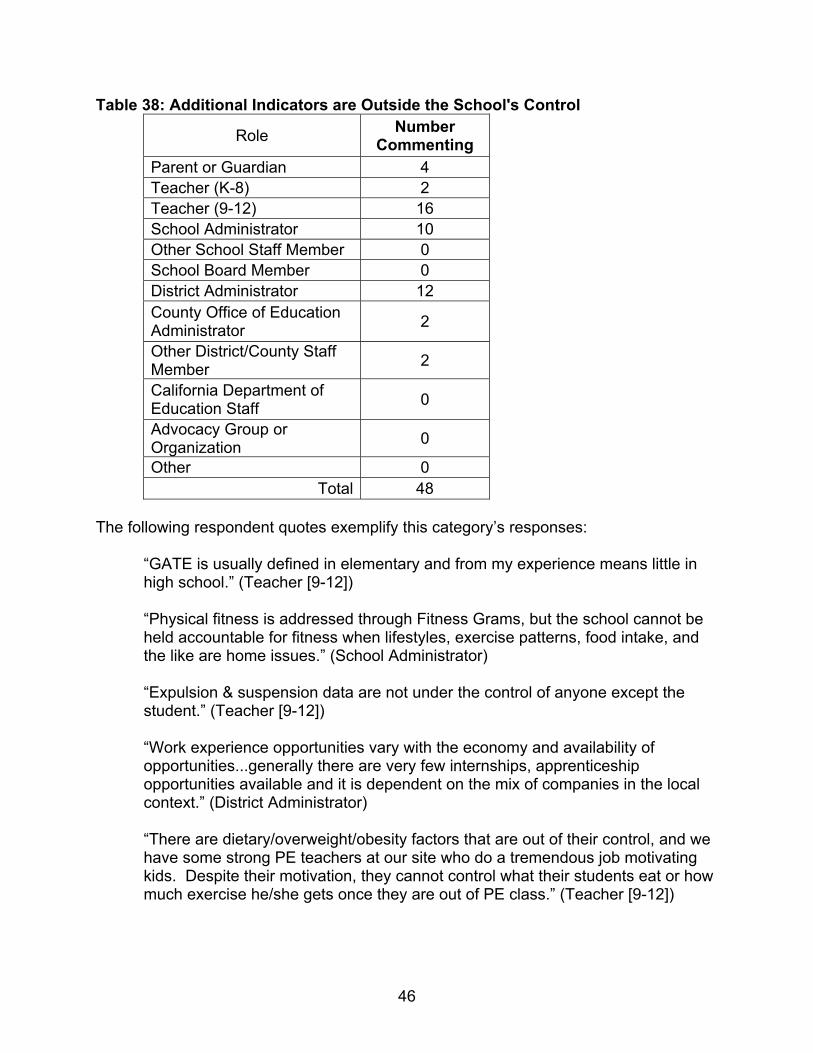
Table 38: Additional Indicators are Outside the School's Control
Role Number Commenting
Parent or Guardian 4 Teacher (K-8) 2 Teacher (9-12) 16 School Administrator 10 Other School Staff Member 0 School Board Member 0 District Administrator 12 County Office of Education Administrator 2
Other District/County Staff Member 2
California Department of Education Staff 0
Advocacy Group or Organization 0
Other 0 Total 48
The following respondent quotes exemplify this category’s responses:
“GATE is usually defined in elementary and from my experience means little in high school.” (Teacher [9-12])
“Physical fitness is addressed through Fitness Grams, but the school cannot be held accountable for fitness when lifestyles, exercise patterns, food intake, and the like are home issues.” (School Administrator)
“Expulsion & suspension data are not under the control of anyone except the student.” (Teacher [9-12])
“Work experience opportunities vary with the economy and availability of opportunities...generally there are very few internships, apprenticeship opportunities available and it is dependent on the mix of companies in the local context.” (District Administrator)
“There are dietary/overweight/obesity factors that are out of their control, and we have some strong PE teachers at our site who do a tremendous job motivating kids. Despite their motivation, they cannot control what their students eat or how much exercise he/she gets once they are out of PE class.” (Teacher [9-12])
46
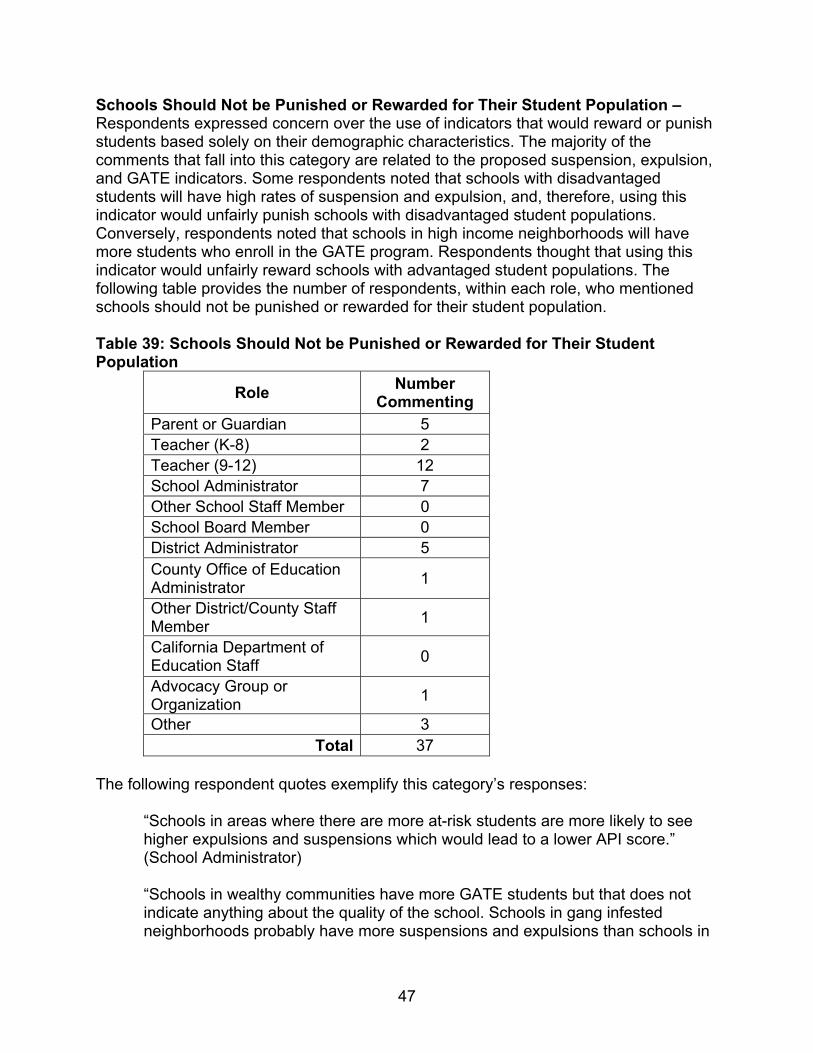
Schools Should Not be Punished or Rewarded for Their Student Population – Respondents expressed concern over the use of indicators that would reward or punish students based solely on their demographic characteristics. The majority of the comments that fall into this category are related to the proposed suspension, expulsion, and GATE indicators. Some respondents noted that schools with disadvantaged students will have high rates of suspension and expulsion, and, therefore, using this indicator would unfairly punish schools with disadvantaged student populations. Conversely, respondents noted that schools in high income neighborhoods will have more students who enroll in the GATE program. Respondents thought that using this indicator would unfairly reward schools with advantaged student populations. The following table provides the number of respondents, within each role, who mentioned schools should not be punished or rewarded for their student population.
Table 39: Schools Should Not be Punished or Rewarded for Their Student Population
Role Number Commenting
Parent or Guardian 5 Teacher (K-8) 2 Teacher (9-12) 12 School Administrator 7 Other School Staff Member 0 School Board Member 0 District Administrator 5 County Office of Education Administrator 1
Other District/County Staff Member 1
California Department of Education Staff 0
Advocacy Group or Organization 1
Other 3 Total 37
The following respondent quotes exemplify this category’s responses:
“Schools in areas where there are more at-risk students are more likely to see higher expulsions and suspensions which would lead to a lower API score.” (School Administrator)
“Schools in wealthy communities have more GATE students but that does not indicate anything about the quality of the school. Schools in gang infested neighborhoods probably have more suspensions and expulsions than schools in
47
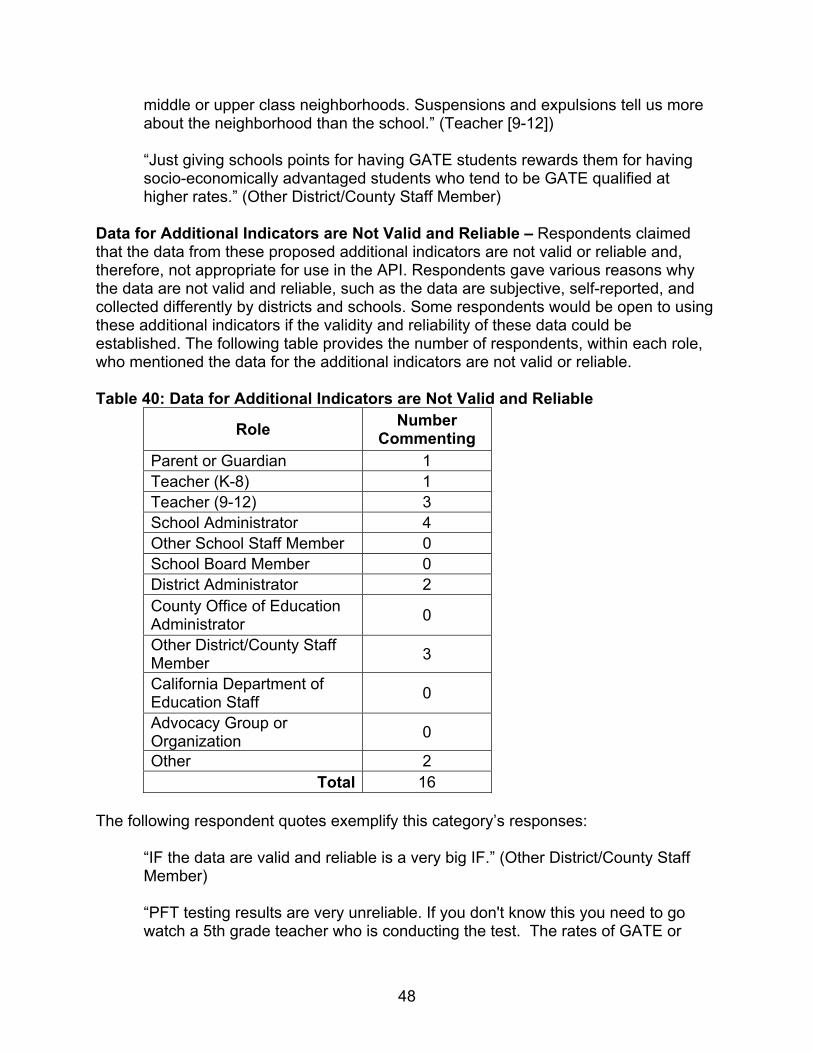
middle or upper class neighborhoods. Suspensions and expulsions tell us more about the neighborhood than the school.” (Teacher [9-12])
“Just giving schools points for having GATE students rewards them for having socio-economically advantaged students who tend to be GATE qualified at higher rates.” (Other District/County Staff Member)
Data for Additional Indicators are Not Valid and Reliable – Respondents claimed that the data from these proposed additional indicators are not valid or reliable and, therefore, not appropriate for use in the API. Respondents gave various reasons why the data are not valid and reliable, such as the data are subjective, self-reported, and collected differently by districts and schools. Some respondents would be open to using these additional indicators if the validity and reliability of these data could be established. The following table provides the number of respondents, within each role, who mentioned the data for the additional indicators are not valid or reliable.
Table 40: Data for Additional Indicators are Not Valid and Reliable
Role Number Commenting
Parent or Guardian 1 Teacher (K-8) 1 Teacher (9-12) 3 School Administrator 4 Other School Staff Member 0 School Board Member 0 District Administrator 2 County Office of Education Administrator 0
Other District/County Staff Member 3
California Department of Education Staff 0
Advocacy Group or Organization 0
Other 2 Total 16
The following respondent quotes exemplify this category’s responses:
“IF the data are valid and reliable is a very big IF.” (Other District/County Staff Member)
“PFT testing results are very unreliable. If you don't know this you need to go watch a 5th grade teacher who is conducting the test. The rates of GATE or
48
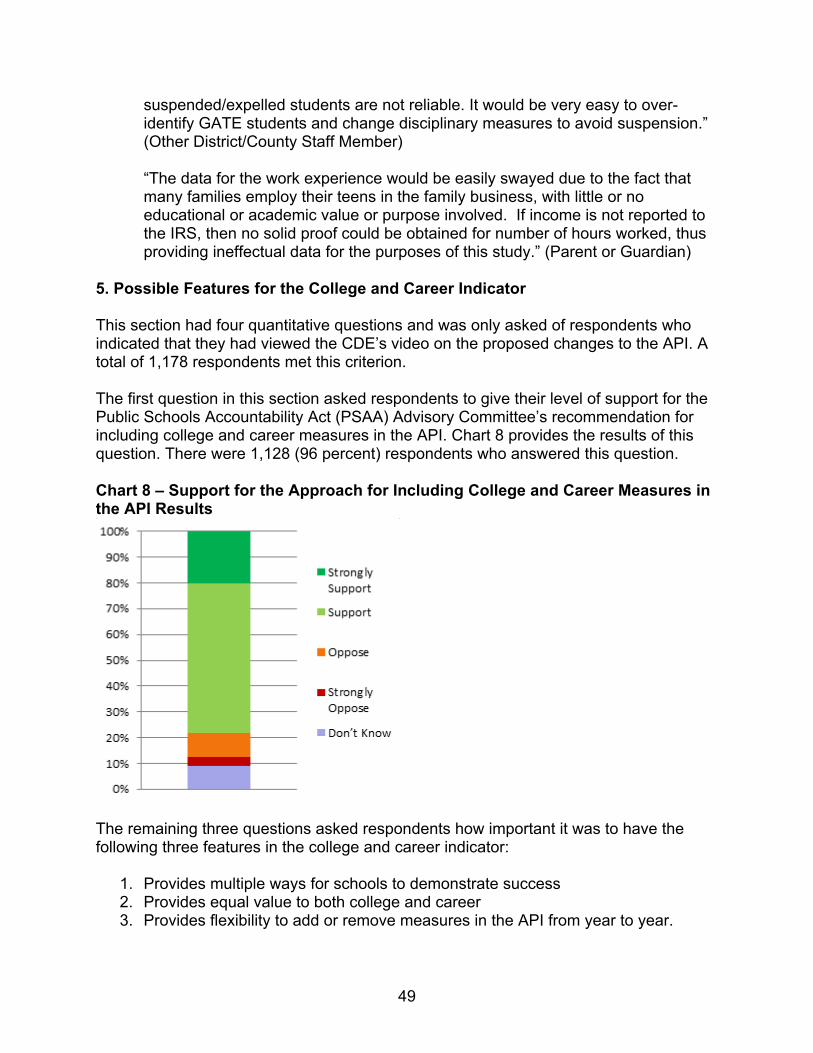
suspended/expelled students are not reliable. It would be very easy to over-identify GATE students and change disciplinary measures to avoid suspension.” (Other District/County Staff Member)
“The data for the work experience would be easily swayed due to the fact that many families employ their teens in the family business, with little or no educational or academic value or purpose involved. If income is not reported to the IRS, then no solid proof could be obtained for number of hours worked, thus providing ineffectual data for the purposes of this study.” (Parent or Guardian)
5. Possible Features for the College and Career Indicator
This section had four quantitative questions and was only asked of respondents who indicated that they had viewed the CDE’s video on the proposed changes to the API. A total of 1,178 respondents met this criterion.
The first question in this section asked respondents to give their level of support for the Public Schools Accountability Act (PSAA) Advisory Committee’s recommendation for including college and career measures in the API. Chart 8 provides the results of this question. There were 1,128 (96 percent) respondents who answered this question.
Chart 8 – Support for the Approach for Including College and Career Measures in the API Results
The remaining three questions asked respondents how important it was to have the following three features in the college and career indicator:
1. Provides multiple ways for schools to demonstrate success 2. Provides equal value to both college and career 3. Provides flexibility to add or remove measures in the API from year to year.
49
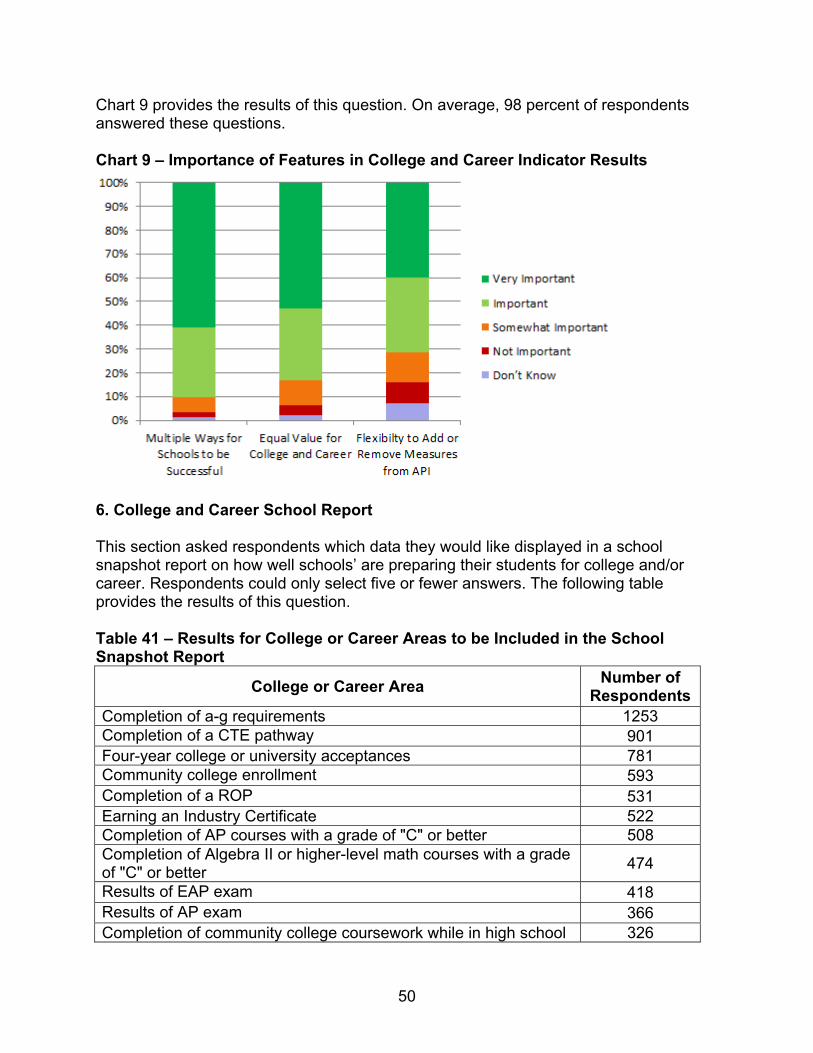
Chart 9 provides the results of this question. On average, 98 percent of respondents answered these questions.
Chart 9 – Importance of Features in College and Career Indicator Results
6. College and Career School Report
This section asked respondents which data they would like displayed in a school snapshot report on how well schools’ are preparing their students for college and/or career. Respondents could only select five or fewer answers. The following table provides the results of this question.
Table 41 – Results for College or Career Areas to be Included in the School Snapshot Report
College or Career Area Number of Respondents
Completion of a-g requirements 1253 Completion of a CTE pathway 901 Four-year college or university acceptances 781 Community college enrollment 593 Completion of a ROP 531 Earning an Industry Certificate 522 Completion of AP courses with a grade of "C" or better 508 Completion of Algebra II or higher-level math courses with a grade of "C" or better 474
Results of EAP exam 418 Results of AP exam 366 Completion of community college coursework while in high school 326
50
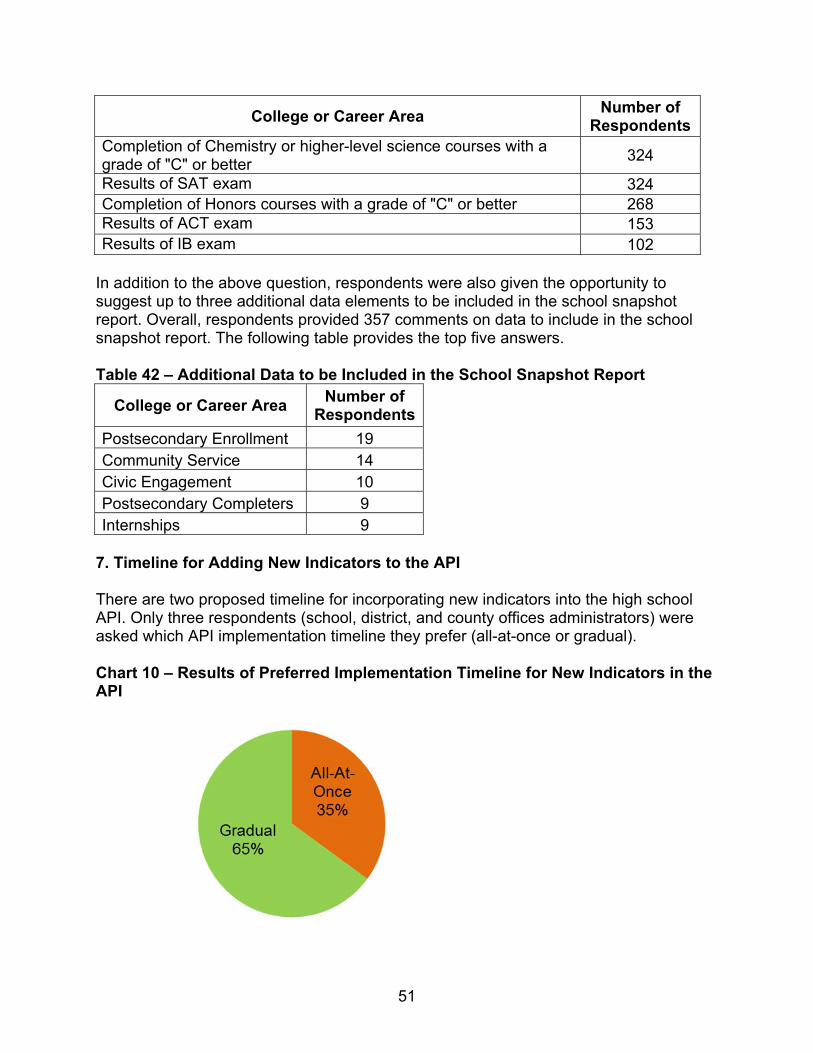
College or Career Area Number of Respondents
Completion of Chemistry or higher-level science courses with a grade of "C" or better 324
Results of SAT exam 324 Completion of Honors courses with a grade of "C" or better 268 Results of ACT exam 153 Results of IB exam 102
In addition to the above question, respondents were also given the opportunity to suggest up to three additional data elements to be included in the school snapshot report. Overall, respondents provided 357 comments on data to include in the school snapshot report. The following table provides the top five answers.
Table 42 – Additional Data to be Included in the School Snapshot Report
College or Career Area Number of Respondents
Postsecondary Enrollment 19 Community Service 14 Civic Engagement 10 Postsecondary Completers 9 Internships 9
7. Timeline for Adding New Indicators to the API
There are two proposed timeline for incorporating new indicators into the high school API. Only three respondents (school, district, and county offices administrators) were asked which API implementation timeline they prefer (all-at-once or gradual).
Chart 10 – Results of Preferred Implementation Timeline for New Indicators in theAPI
51
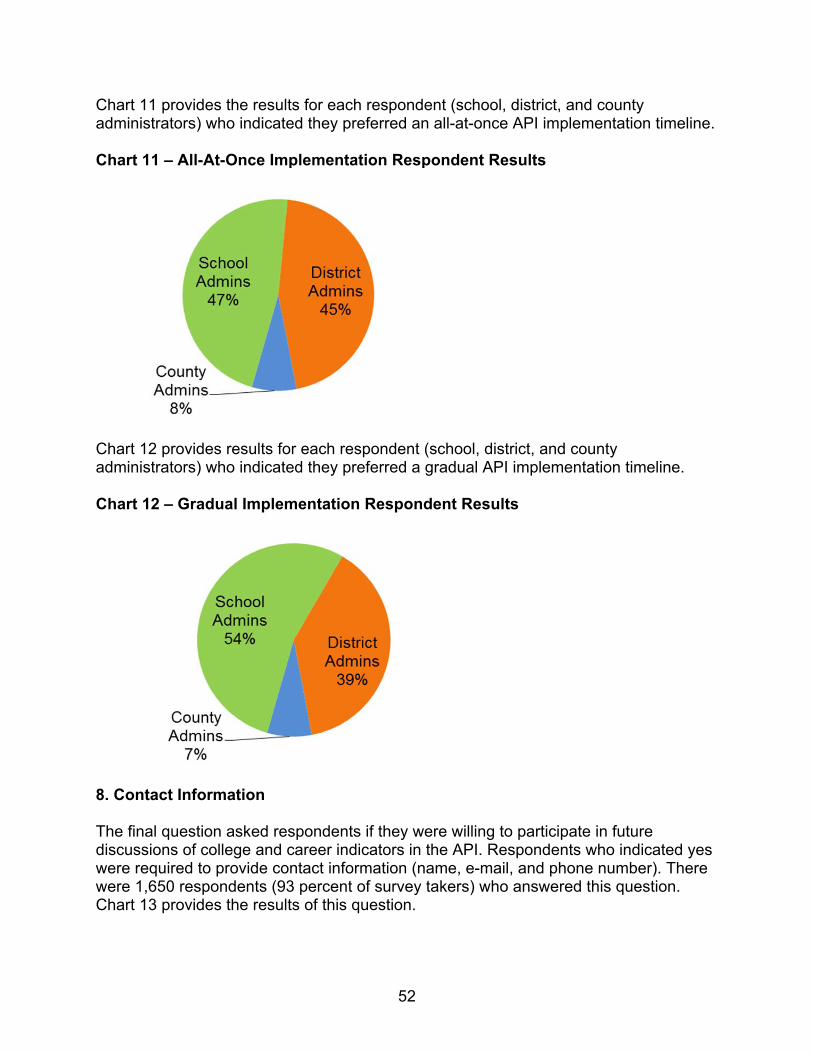
Chart 11 provides the results for each respondent (school, district, and county administrators) who indicated they preferred an all-at-once API implementation timeline.
Chart 11 – All-At-Once Implementation Respondent Results
Chart 12 provides results for each respondent (school, district, and county administrators) who indicated they preferred a gradual API implementation timeline.
Chart 12 – Gradual Implementation Respondent Results
8. Contact Information
The final question asked respondents if they were willing to participate in future discussions of college and career indicators in the API. Respondents who indicated yes were required to provide contact information (name, e-mail, and phone number). There were 1,650 respondents (93 percent of survey takers) who answered this question. Chart 13 provides the results of this question.
52
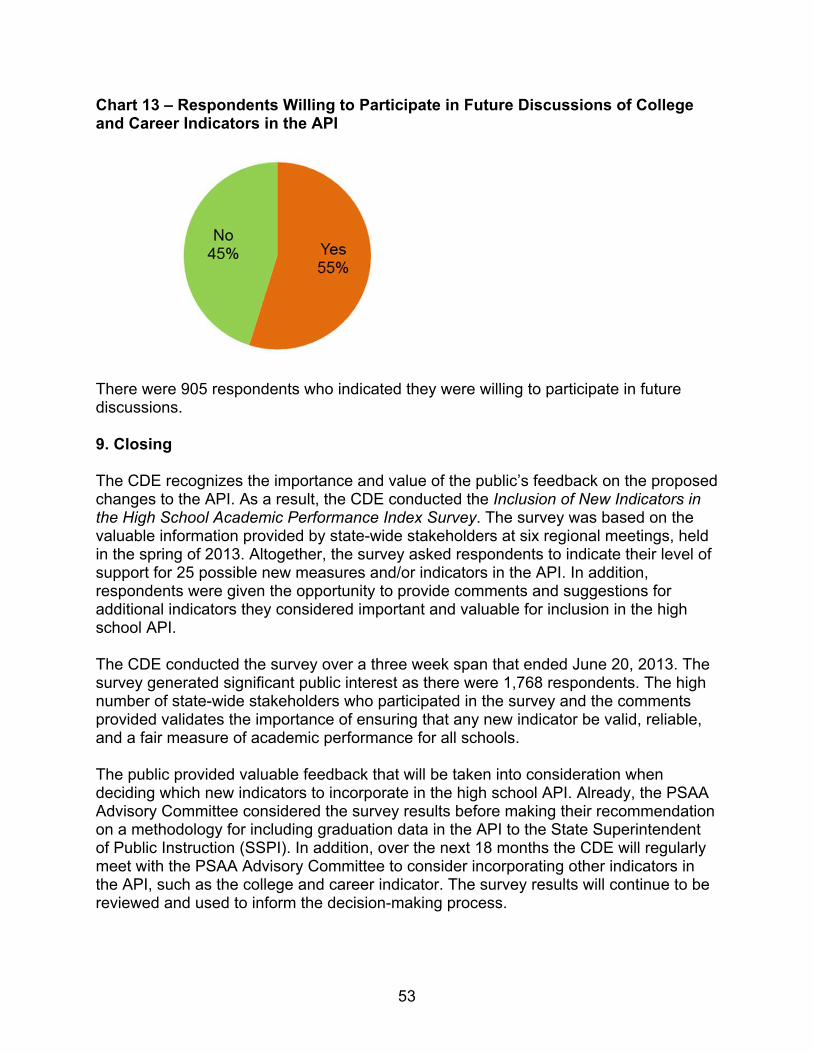
Chart 13 – Respondents Willing to Participate in Future Discussions of College and Career Indicators in the API
There were 905 respondents who indicated they were willing to participate in future discussions.
9. Closing
The CDE recognizes the importance and value of the public’s feedback on the proposed changes to the API. As a result, the CDE conducted the Inclusion of New Indicators in the High School Academic Performance Index Survey. The survey was based on the valuable information provided by state-wide stakeholders at six regional meetings, held in the spring of 2013. Altogether, the survey asked respondents to indicate their level of support for 25 possible new measures and/or indicators in the API. In addition, respondents were given the opportunity to provide comments and suggestions for additional indicators they considered important and valuable for inclusion in the high school API.
The CDE conducted the survey over a three week span that ended June 20, 2013. The survey generated significant public interest as there were 1,768 respondents. The high number of state-wide stakeholders who participated in the survey and the comments provided validates the importance of ensuring that any new indicator be valid, reliable, and a fair measure of academic performance for all schools.
The public provided valuable feedback that will be taken into consideration when deciding which new indicators to incorporate in the high school API. Already, the PSAA Advisory Committee considered the survey results before making their recommendation on a methodology for including graduation data in the API to the State Superintendent of Public Instruction (SSPI). In addition, over the next 18 months the CDE will regularly meet with the PSAA Advisory Committee to consider incorporating other indicators in the API, such as the college and career indicator. The survey results will continue to be reviewed and used to inform the decision-making process.
53