Embed Size (px)
Citation preview

Trinity UniversityDigital Commons @ Trinity
Understanding by Design: Complete Collection Understanding by Design
6-2019
Survey Says: Graphing and Data Analysis (3rdgrade)Shayna [email protected]
Courtney [email protected]
Follow this and additional works at: https://digitalcommons.trinity.edu/educ_understandings
Part of the Education Commons
This Instructional Material is brought to you for free and open access by the Understanding by Design at Digital Commons @ Trinity. For moreinformation about this unie, please contact the author(s): [email protected] [email protected]. For information about the series,including permissions, please contact the administrator: [email protected].
Repository CitationRosenthal, Shayna and Gold, Courtney, "Survey Says: Graphing and Data Analysis (3rd grade)" (2019). Understanding by Design:Complete Collection. 429.https://digitalcommons.trinity.edu/educ_understandings/429
Survey Says: Data Analysis
Stage 1 – Desired Results
Established Goals (e.g., standards)
3.8A
summarize a data set
with multiple
categories using a
frequency table, dot
plot, pictograph, or bar graph with scaled
intervals
3.8B solve one- and two-step problems
using categorical
data represented
with a frequency table, dot
plot, pictograph, or bar graph with scaled
intervals
Transfer
Students will independently use their learning to…
investigate a question or a real world problem using data.
Meaning
Understandings Students will understand that….
We can investigate problems and questions in our lives by collecting and interpreting data. Different graphical representations communicate information about individuals in a visual and simplistic way. With this data, we are able to draw conclusions about our world around us.
Essential Questions How does collecting and interpreting data help us better understand and address real world questions?
Acquisition
Knowledge Students will know…
● By collecting and organizing data into
categories you can investigate and understand information.
● Different types of data can be shown in many different types of graphs and tables to help inform readers.
● Graphical Representations: drawings or representations that show information. Used to compare amounts of things or numbers. Help people understand information better. ○ Dot plots: a graphical representation
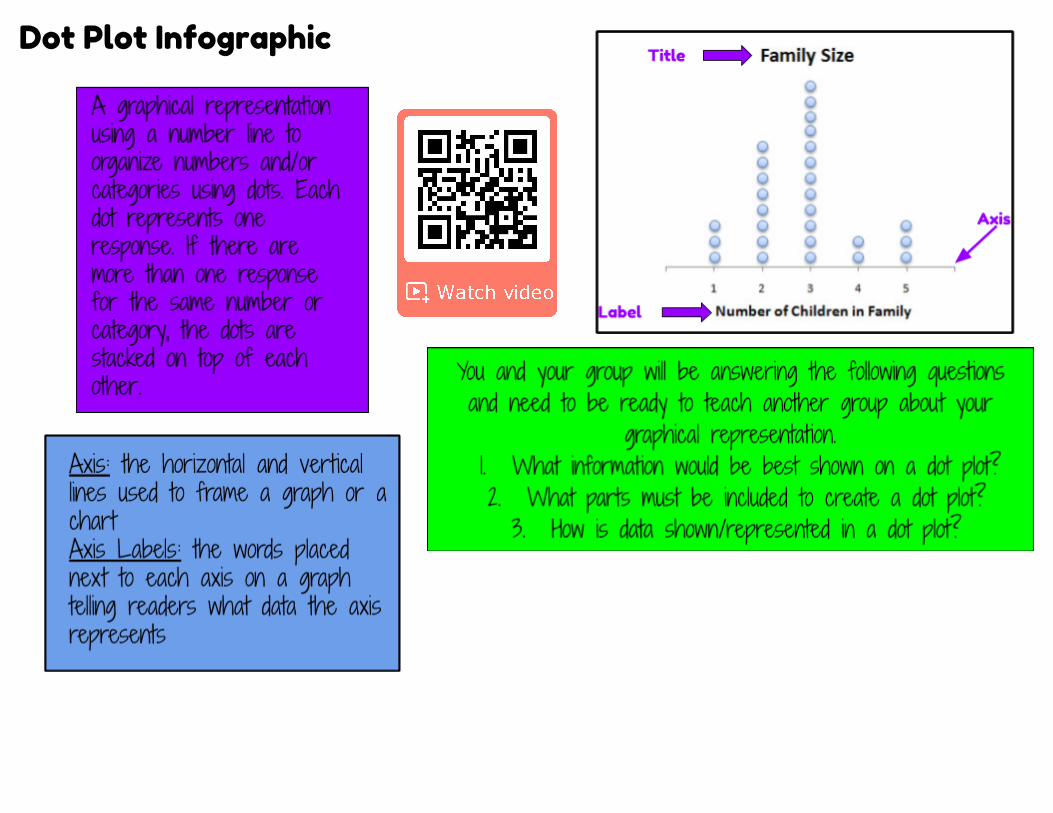
using a number line to organize numbers and/or categories using dots. Each dot represents one response. If there are more than one response for the same number or category, the dots are stacked on top of each other.
○ Bar graphs: a chart that uses bars to show data in different categories. Have vertical and horizontal axes.
Skills Students will be able to…
● Explain the information shown in a dot plot, frequency table, pictograph, or bar graph.
● Use the information shown in a dot plot, frequency table, pictograph, or bar graph to solve one- and two-step problems.
● Use math skills (addition, subtraction, multiplication, division, greater than/less than) to investigate questions by collecting, organizing, showing and explaining data.
● Be able to identify which graphical representation is best for showing specific data.
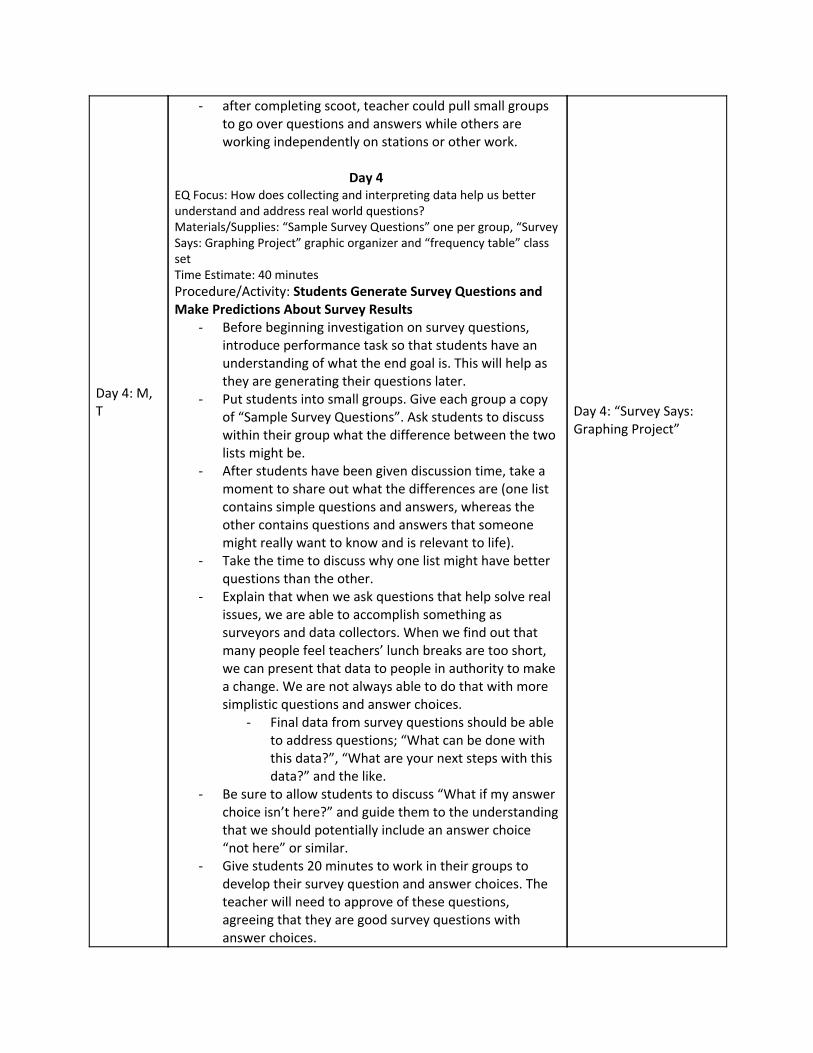
○ Pictographs: a way of showing information or data using pictures. Each picture stands for a specific number which is shown in a key. To understand information in a pictograph one must use math skills (addition or multiplication) to find the total in each row.
○ A frequency table: a table used to organize data as an ordered list of categories and their totals.
● Horizontal Line: a line that goes side to side
● Vertical Line: a line that goes up and down ● Survey: a list of questions used to gather
information about people or a group of people.
● Data: a collection of information gathered by observation, questioning, or measurement.
● Tally marks can be used to record data in different categories.
● Axis: the horizontal and vertical lines used to frame a graph or a chart. ○ Axis Labels: the words placed next to
each axis on a graph telling readers what data the axis represents
● On graphical representations, one axis is used to show categories. The other axis is used to show all of the possible totals.
Stage 2 – Evidence
CODE
(M or T) Evaluative
Criteria
(for rubric)
T
See Rubric
Performance Task(s) Survey Says: Graphing Project Students will demonstrate meaning-making and transfer by…
Goal: transfer understanding of why we conduct and analyze data through surveying to investigate a question or a real world problem. Role: Student as a surveyor Audience: Third grade students as survey respondents Situation: Group Project Performance:

“You and your group will identify one question or problem that you would like to learn more about through surveying. Think about things you might want to change about school, sports organizations, after school activities etc. You are going to have the opportunity to use this problem or question to create a survey for fellow third graders to respond to. You will be creating a survey question, possible answer choices, conducting the survey as well as explaining and representing the data you collect. Once you have gathered all of your data using a frequency table, you will show your results using one of the graphical representations we have learned about (dot plot, bar graph, or pictograph). In the end you will be responsible for presenting your data, your graphical representation and what you learned about your problem or question to the class.”
- students can be put in groups or can work as individuals based on classroom needs.
- in their groups, students will have the opportunity to identify a question or problem in their lives that they would like to investigate
- once they generate a survey question, students must identify between 5 and 7 possible responses (not including “other” or similar as one of the options).
- after listing their possible responses, students must create a frequency table to record their data.
- groups will conduct their survey throughout the classroom/grade level/or as appropriate (use teacher discretion) and record all data in their frequency table.
- once all data is collected, students will be responsible for identifying the graphic representation that is most appropriate for showing their specific data.
- the final graph will be displayed on poster board. The poster will include a title, the survey question, hypothesis of results, data, chosen graphical representation, and a short paragraph explaining why they chose the graphical representation that they did and what was learned about the data.
- as a final presentation students will present their final posters to the class and explain their survey as well as answer questions from the audience.
--------------------------------------------------------------------------------------------------
Stage 3 – Learning Plan
CODE
(A, M, T) Pre-Assessment
How will you check students’ prior knowledge, skill levels, and potential misconceptions?
Students will work in groups to complete the “Graphing and Data Analysis Pre-assessment”. Each group will have their own set of cards that they will be responsible for matching together. Cards will include graph type, image of graph, questions specific to
that graph, and other important vocabulary associated with the graph. groups will work together to find all of the cards that go in each group (dot plot, bar graph, pictograph).
Day 1: A
Learning Activities
Day 1
EQ Focus: How does collecting and interpreting data help us better understand and address real world questions and issues? Materials/Supplies: sticky notes one per student, “Graphing and Data Analysis Pre-Assessment” cards one per group Time Estimate: 20 minutes Procedure/Activity: Pre-Assessment / Data Collection &
Frequency Tables
- students will begin this first day by answering the question “Do you think students should be required to do homework every night?” on a sticky note. Give them the following options, “I guess so”, “no, we have too much homework already”, “yes! I would like more homework!” or “I don’t care I don’t do homework anyway”, and ask them to write their answer and then turn in their sticky note.
- after all students have answered the question on their sticky note and turned it in, put students in small groups for the pre-assessment
- Students will work in groups to complete the “Graphing and Data Analysis Pre-assessment”.
- Each group will have their own set of cards that they will be responsible for matching together. Cards will include graph type, image of graph, questions specific to that graph, and other important vocabulary associated with the graph.
- groups will work together to find all of the cards that go in each group (dot plot, bar graph, pictograph).
- this can be used to assess what prior graph and data analysis knowledge the students have
- lessons in days 2 and 3 can be adapted or skipped based on students knowledge.
- After pre-assessment, teacher should take the sticky-note responses and model to students how to make a frequency chart.
- As teacher models how to do this, explain making tallies if necessary based on student need.
- Once frequency chart is made, the teacher should then model how responses from frequency table are adapted into a bar graph.
- Sticky notes could even be stacked on top of each other to create a bar graph.
- Engage in discussion with students about what was just created.
Progress Monitoring (e.g., formative data) Day 1: watching students as they work through “Graphing and Data Analysis Pre-Assessment” matching activity.
Day 2: A
- Ask probing questions such as, “What could we do with this information?” and/or “Why would we want to know this kind of information?” etc. Introduce the question “How does collecting and interpreting data help us better understand and address real world questions?”
Day 2
EQ Focus: How does collecting and interpreting data help us better understand and address real world questions? Materials/Supplies: “Dot Plot Infographic”, “Pictograph Infographic”, “Bar Graph Infographic”, “Different Graphical Representations” Graphic Organizer one per student, QR code reading technology (at least one per group) Time Estimate: 35 minutes Procedure/Activity: Types of Graphical Representations Jigsaw
- Note: If pre-assessment shows that students maintain a good understanding of the vocabulary associated with graphing and data analysis, use teacher discretion to skip day 2 and allow an additional day for project creation, etc.
- before beginning Jigsaw, teacher should model how responses from prior survey will be adapted into a pictograph. Be sure to explain how a key is created and what each picture represents. Talk about how this was easier/more difficult for the question given. Introduce the idea that some graphs are better for specific information than others. Talk about what information we can see from the graph. Talk about if some things were easier to see in the bar graph or if they’re better displayed in the pictograph.
- split students into 3 groups. Each group will be responsible for becoming an expert on one of the three main types of graphical representations (dot plot, bar graph, pictograph).
- Give each student a copy of the “Different Graphical Representations” graphic organizer.
- Give each group their corresponding infographic (may want a couple copies per group).
- Each group will read through the information on the sheet, watch the video using the QR code, and answer the three questions given on their infographic. Students will record their answers on their graphic organizer. Each student in the group should have their own organizer complete with the answers.
- explain to students that they will be teaching fellow classmates the information that they just learned. They should be able to teach them without reading off the infographic.
Day 2: “Different Graphical Representations” Graphic Organizer

Day 3: A, M
- Allow enough time for each group to learn the information and fill out their graphic organizer.
- once all of the groups have finished, you will create new groups for the students. Each group should be made up of one student from each of the graphical representations.
- once students find their new groups, set a timer for 5 minutes and allow the first person to teach their peers about the graphical representation they became an expert on. Other students in the group should be recording answers in their organizer. Repeat until all 3 members of the group have finished.
- After all students have completed their organizers, hold a class discussion about the different types, answering the three questions for each.
Day 3
EQ Focus: How does collecting and interpreting data help us better understand and address real world questions? Materials/Supplies: ““Graphical Representation Scoot Cards”, clip boards, “Scoot Cards Recording Sheet” one per student, “Teacher Graph Example Page”
Time Estimate: 20 minutes Procedure/Activity: Analyzing Graphs Scoot
- before class begins tape up “Graphical Representation Scoot Cards” around the room. Be sure to spread them out.
- Like in day 1 and 2, before beginning the activity, take the survey data that was collected and generate a dot plot. Show students how it is created and talk about what can be learned from the graph.
- before beginning the scoot, teacher will model answering the types of questions that students will see. Go through the graphs and questions on “Teacher Graph Example Page” and talk through your thinking as you answer the corresponding questions. Allow for student questions and check for quick understanding before beginning scoot.
- distribute a copy of the “Scoot Cards Recording Sheet” to each student. Explain that they will be walking around the room with their recording sheet and answering the questions for each graphical representation. Answers on their recording sheet should correspond with the number on the scoot card (card #7 should correspond with question #7).
- You can set a timer that signals when students should rotate or allow students to rotate freely based on teacher discretion.
Day 3: “Scoot Cards Recording Sheet”
Day 4: M, T
- after completing scoot, teacher could pull small groups to go over questions and answers while others are working independently on stations or other work.
Day 4
EQ Focus: How does collecting and interpreting data help us better understand and address real world questions? Materials/Supplies: “Sample Survey Questions” one per group, “Survey Says: Graphing Project” graphic organizer and “frequency table” class set Time Estimate: 40 minutes Procedure/Activity: Students Generate Survey Questions and
Make Predictions About Survey Results
- Before beginning investigation on survey questions, introduce performance task so that students have an understanding of what the end goal is. This will help as they are generating their questions later.
- Put students into small groups. Give each group a copy of “Sample Survey Questions”. Ask students to discuss within their group what the difference between the two lists might be.
- After students have been given discussion time, take a moment to share out what the differences are (one list contains simple questions and answers, whereas the other contains questions and answers that someone might really want to know and is relevant to life).
- Take the time to discuss why one list might have better questions than the other.
- Explain that when we ask questions that help solve real issues, we are able to accomplish something as surveyors and data collectors. When we find out that many people feel teachers’ lunch breaks are too short, we can present that data to people in authority to make a change. We are not always able to do that with more simplistic questions and answer choices.
- Final data from survey questions should be able to address questions; “What can be done with this data?”, “What are your next steps with this data?” and the like.
- Be sure to allow students to discuss “What if my answer choice isn’t here?” and guide them to the understanding that we should potentially include an answer choice “not here” or similar.
- Give students 20 minutes to work in their groups to develop their survey question and answer choices. The teacher will need to approve of these questions, agreeing that they are good survey questions with answer choices.
Day 4: “Survey Says: Graphing Project”

Day 5: M, T Day 6: M,T
- After groups have created teacher approved survey questions, ask the groups to make a prediction on what they think will be the most popular answer selected.
Day 5
EQ Focus: How does collecting and interpreting data help us better understand and address real world questions? How does collecting and interpreting data help us better understand real world questions and issues? Materials/Supplies: “Survey Says: Graphing Project” graphic organizer and frequency table (filled out from previous day), clipboards class set Time Estimate: 60 minutes Procedure/Activity: Students Conduct Survey and Begin
Graphing - students will begin to survey their classmates/grade
level. (This can be determined by the teacher) - Allow groups to determine who will ask the question,
who will make the tally marks, and who will calculate the totals.
- In groups, have students begin to conduct survey around the classroom/grade level. How students conduct their surveys can be determined by the teacher based on need of classroom and grade level.
- Assist groups, as necessary. - As groups finish they can begin choosing a graphical
representation that they want to create and create a rough draft of their poster including the graph.
Day 6
EQ Focus: How does collecting and interpreting data help us better understand and address real world questions? How does collecting and interpreting data help us better understand real world questions and issues? Materials/Supplies: poster board (enough for each group to have 1), markers, pencils, “Graphing Project Checklist” one per group, “Survey Says: Graphing Project” graphic organizer and frequency table (complete with data collected) Time Estimate: 60 minutes Procedure/Activity: Create Final Posters
- Instruct groups that they will take this day solely to create their posters displaying their survey data.
- Display “Graphical Representation Checklist” and discuss with groups.
- Distribute “Graphical Representation Checklist” to groups.
- Distribute posters and monitor groups as they begin to display their data.
- Monitor graphical representation choice within groups and make suggestions as needed. Guide students
Day 5: “Frequency Table” with Data Collected Day 6: Final Poster

Day 7: T
towards making appropriate graphical representation and incremental choices.
Day 7
EQ Focus: How does collecting and interpreting data help us better understand and address real world questions? How does collecting and interpreting data help us better understand real world questions and issues? Materials/Supplies: completed group posters hung around the room, timer Time Estimate: 45 minutes Procedure/Activity: Gallery Walk
- students will participate in a gallery walk through the presentations
- you could adjust the presentations to allow for outsider visitors to come and participate in the gallery walk (parents, older or younger students, other 3rd graders, etc.)
- there will be 3 rounds (or as many as members in each group) . During each round one member of the group will remain at the poster in order to answer questions and explain the project. All other students will have the opportunity to walk around and look at the projects around the room and ask questions.
- before beginning, students will be given 5 minutes to meet with their group and decide which member will remain at their poster during which round. Students will also make sure that they are familiar with the information and able to answer questions.
- complete 3 rounds of the gallery walk. Allow enough time for students to look at all of the posters and ask questions in each round. The length of the round may vary based on students and number of groups.
- encourage students to ask questions at each project and learn as much as possible
- As a final reflection, students will be completing a self evaluation as well as an evaluation for their peers. Give each student enough reflection slips to complete one for each member of their group as well as themselves. Explain that the number ratings on the evaluation will directly influence their score on their rubric. Encourage students to be honest when evaluating their peers. They should consider what sort of contributions each member of the group made. They should also be honest in their own reflection and think about how they worked in the group.
Day 7: Final Poster and Presentation

Graphs and Data Analysis Pre-Assessment
Teacher Instructions:
1. Before students begin, you will need to make enough copies for each group to have one set of cards.
2. After making copies, cut all of the individual definitions, arrows, labels and pictures for all 3 graphical representations.
3. Mix up all the cards so that they are not organized by graph type anymore. 4. Put all of the pieces in a baggy and give one to each group. 5. Groups will work together to sort pieces based on graph type.
6. They should use the arrows and labels to identify parts of the graphs. 7. There may be some definitions that will belong to more than one graph.

Bar Graph
Pictograph

Dot Plot

Dot Plot Infographic

Bar Graph Infographic

Pictograph Infographic

Name:_____________ Date:_____________
Number:_____________
Different Types of Graphical Representations
Bar Graph:
1. ______________________________________________________________________
2. ______________________________________________________________________
3. ______________________________________________________________________

Dot Plot: 1. ______________________________________________________________________
2. ______________________________________________________________________
3. ______________________________________________________________________
Pictograph: 1. ______________________________________________________________________
2. ______________________________________________________________________
3. ______________________________________________________________________


Month
Number of Books in Desk
Number of Books
How many people had 5 books in their desk?
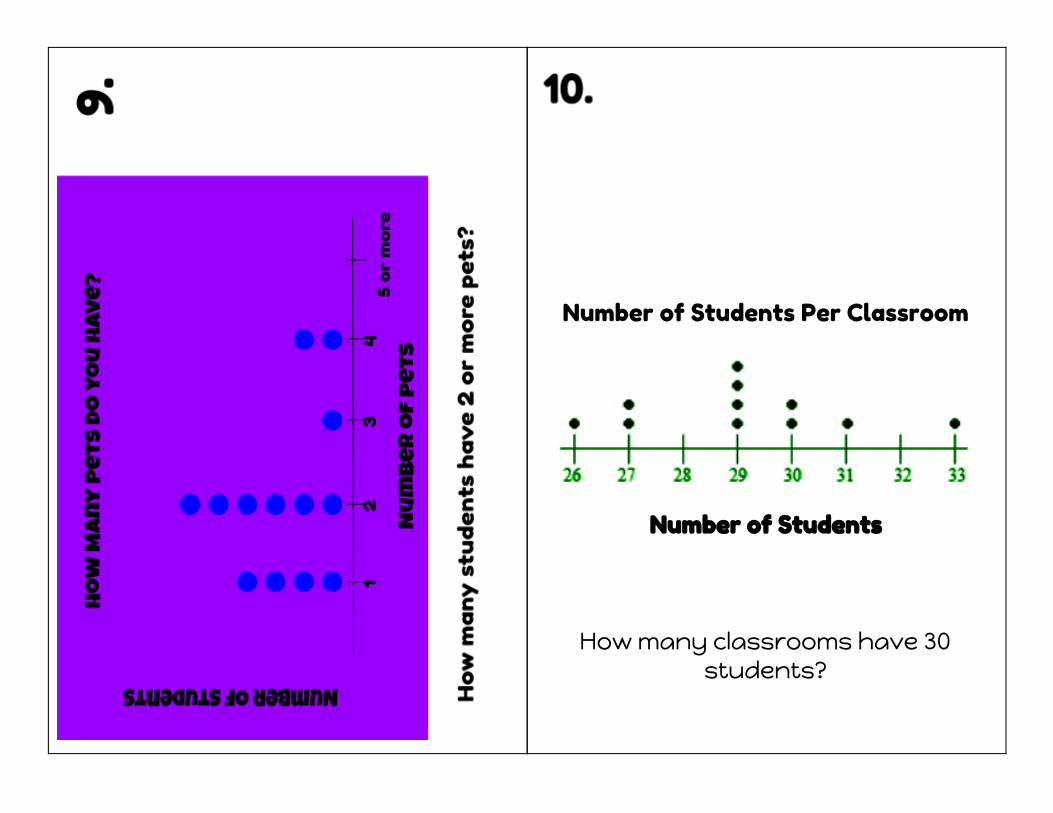
Number of Students Per Classroom
Number of Students
How many classrooms have 30 students?

Lunch
Types of Hit

Candy Bars Sales

Name: _________________
Date: _____________
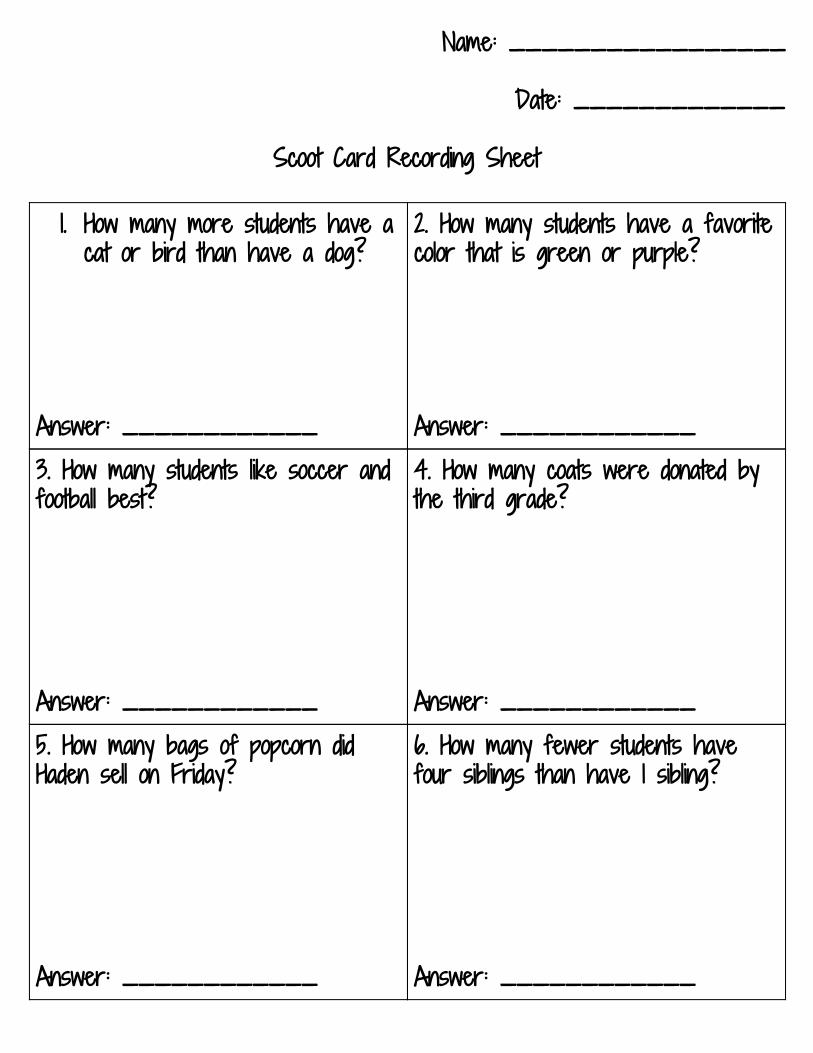
Scoot Card Recording Sheet
1. How many more students have a cat or bird than have a dog?
Answer: ____________
2. How many students have a favorite color that is green or purple? Answer: ____________
3. How many students like soccer and football best? Answer: ____________
4. How many coats were donated by the third grade? Answer: ____________
5. How many bags of popcorn did Haden sell on Friday? Answer: ____________
6. How many fewer students have four siblings than have 1 sibling? Answer: ____________
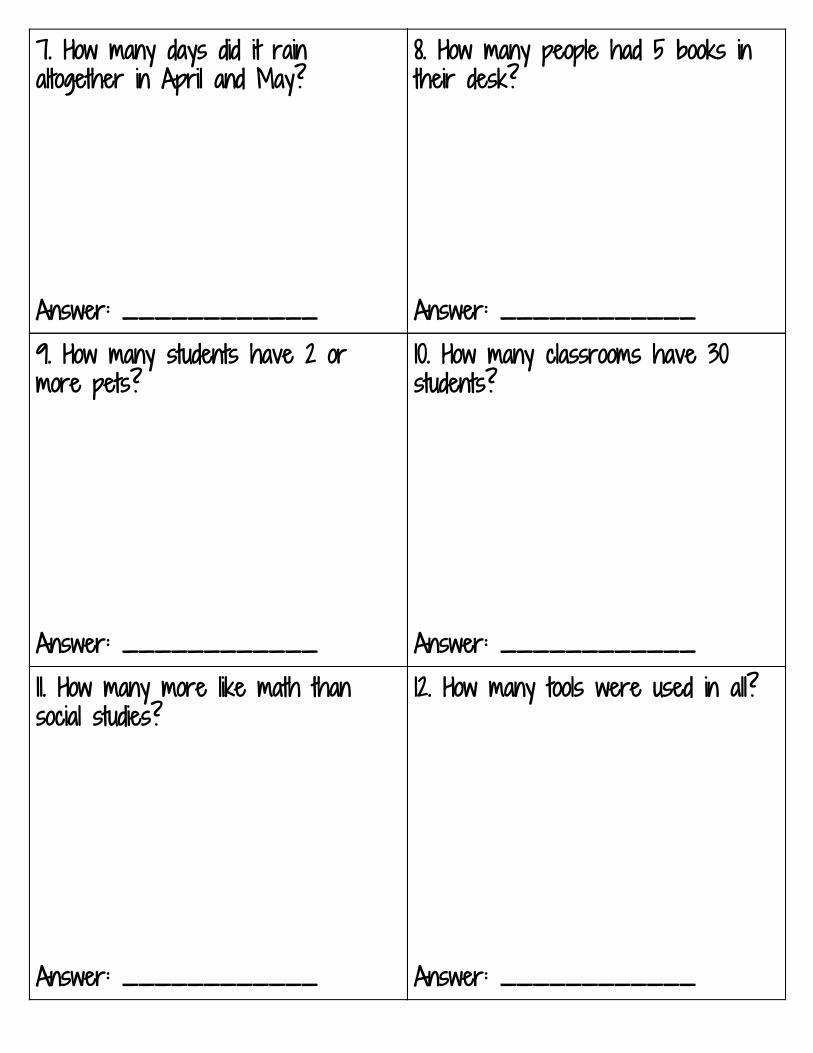
7. How many days did it rain altogether in April and May? Answer: ____________
8. How many people had 5 books in their desk? Answer: ____________
9. How many students have 2 or more pets? Answer: ____________
10. How many classrooms have 30 students? Answer: ____________
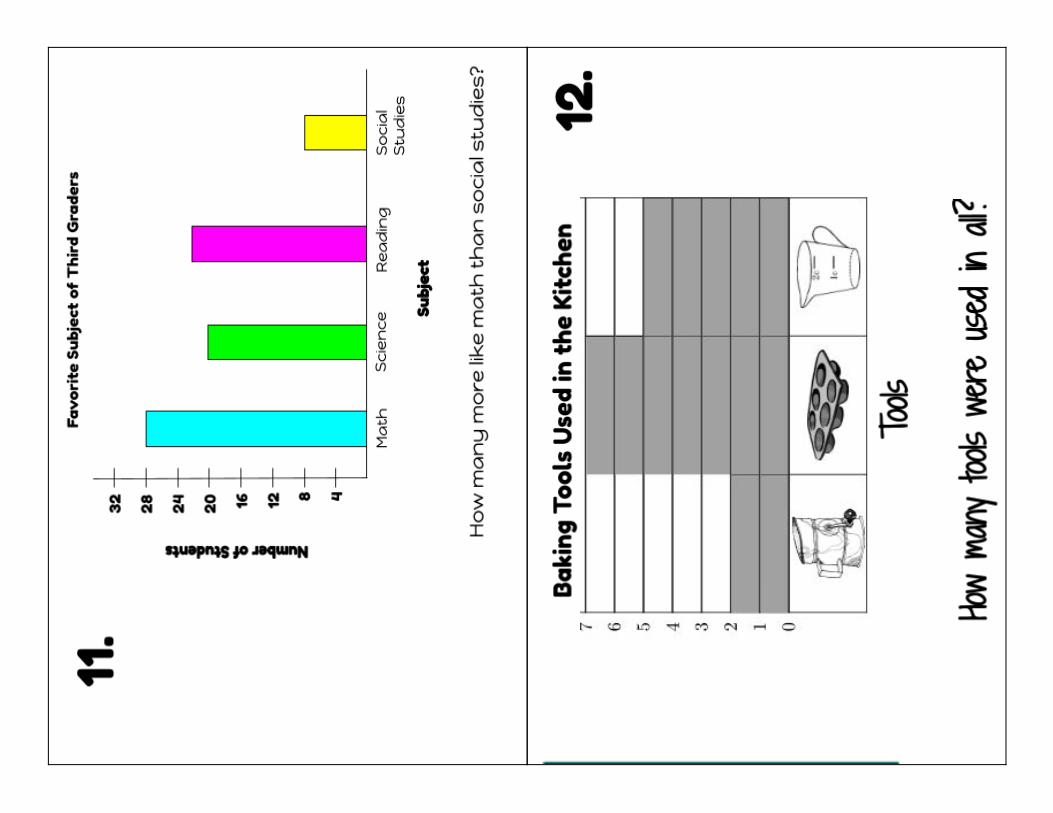
11. How many more like math than social studies? Answer: ____________
12. How many tools were used in all? Answer: ____________

13. How many students like hamburgers best? Answer: ____________
14. How many more hits did Joe make in June than in May? Answer: ____________
15. How many candy bars were sold by both grades in week one? Answer: ____________
16. Who was the teacher of the class that sold between 30 and 50 pies? Answer: ____________
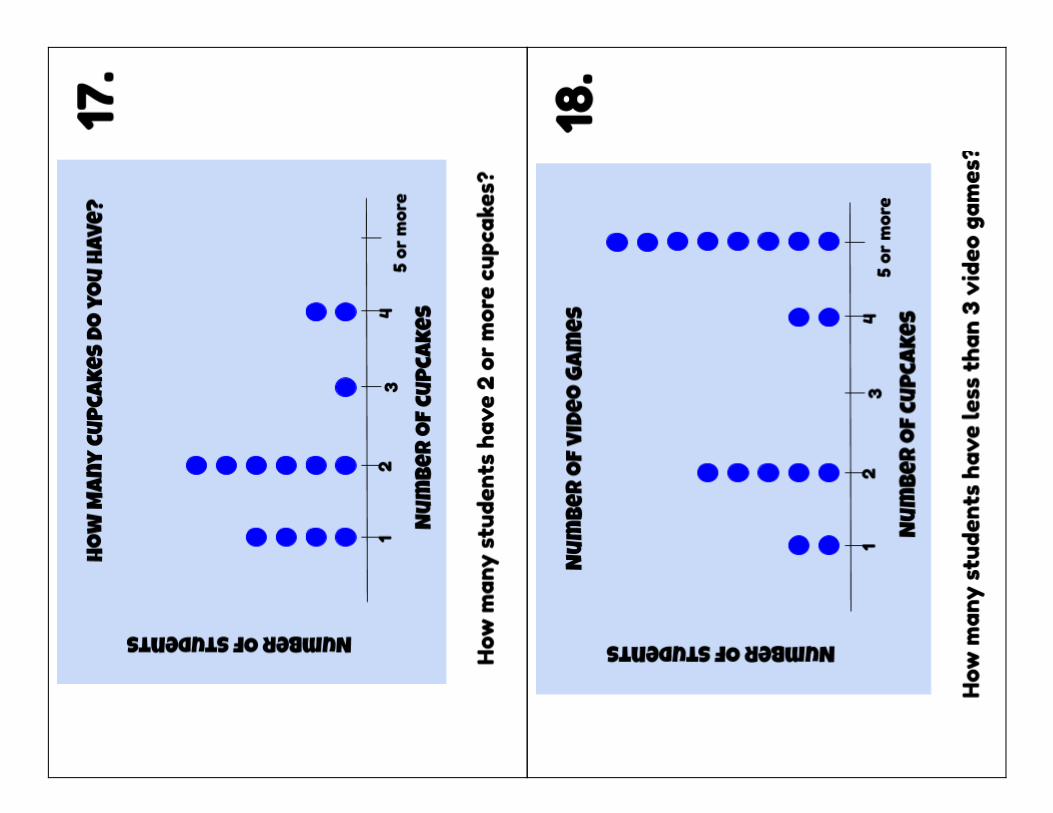
17. How many students have 2 or more cupcakes? Answer: ____________
18. How many students have less than 3 video games? Answer: ____________
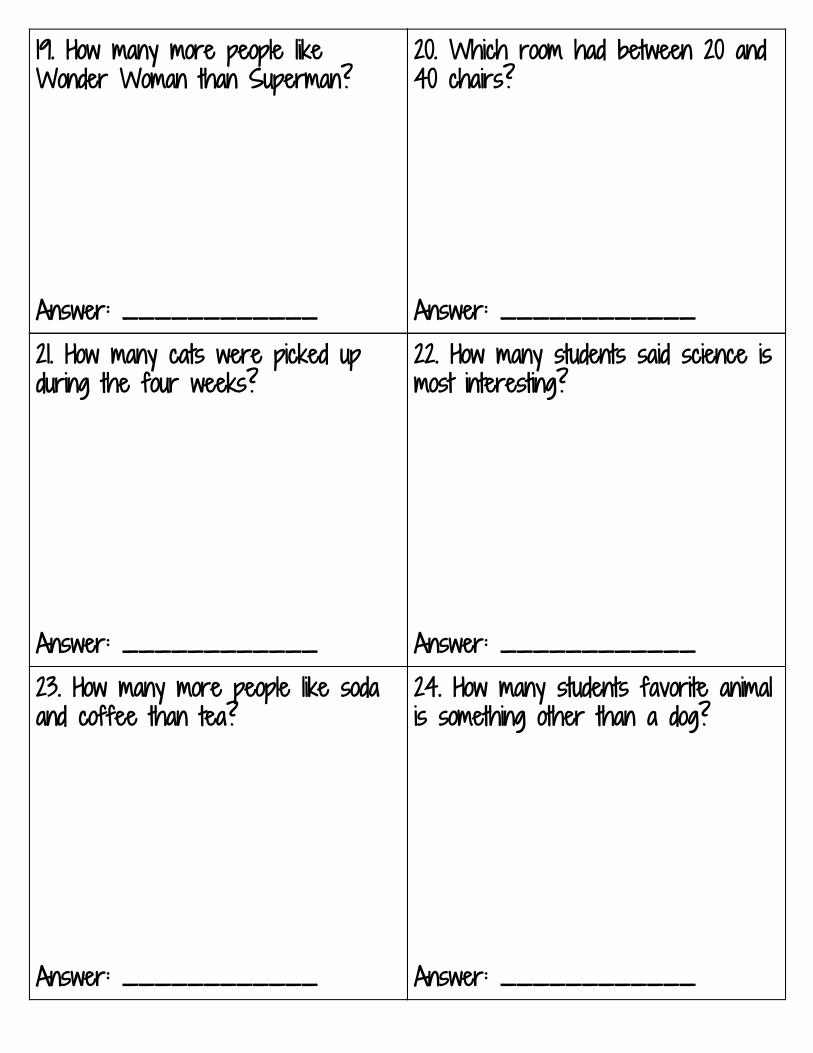
19. How many more people like Wonder Woman than Superman? Answer: ____________
20. Which room had between 20 and 40 chairs? Answer: ____________
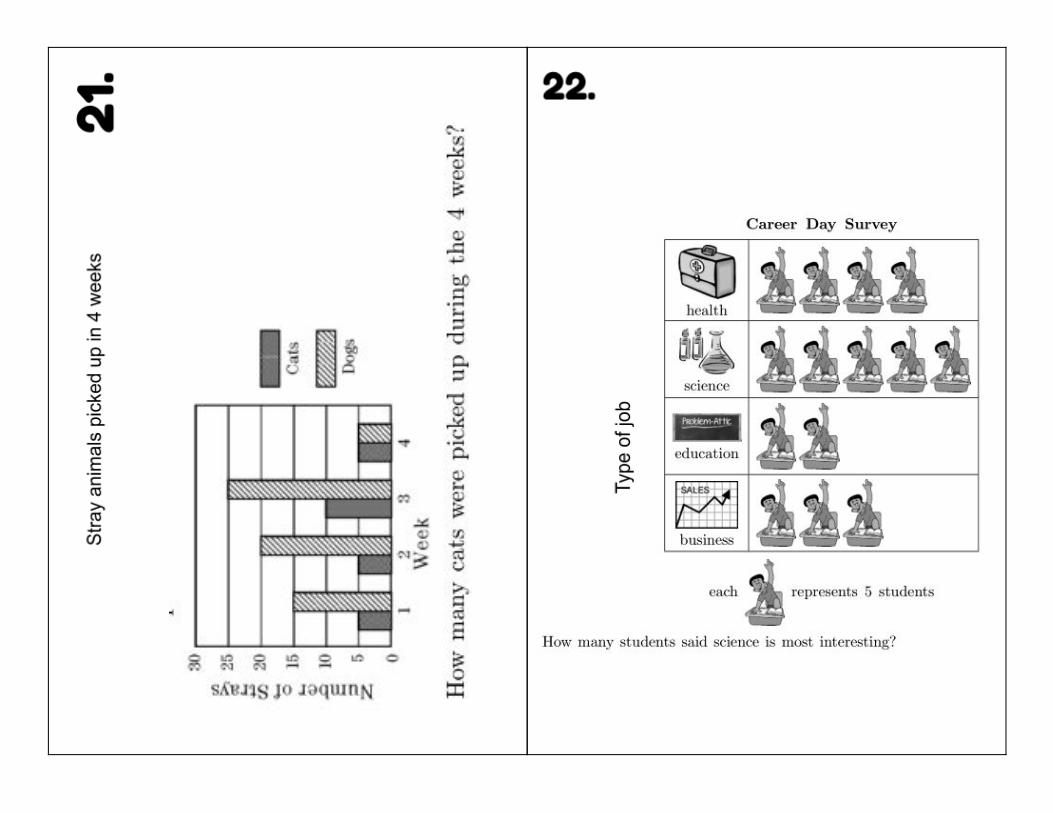
21. How many cats were picked up during the four weeks? Answer: ____________
22. How many students said science is most interesting? Answer: ____________
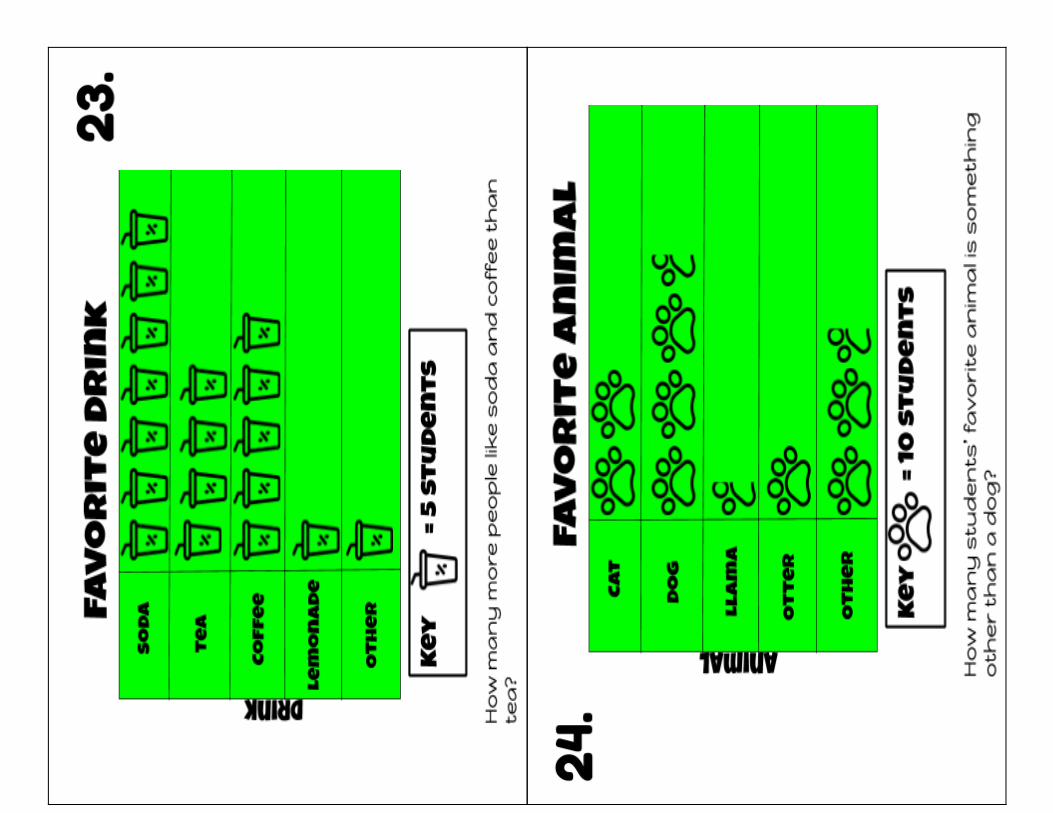
23. How many more people like soda and coffee than tea? Answer: ____________
24. How many students favorite animal is something other than a dog? Answer: ____________

Teacher Graph Example Page

Teacher Graph Example Page

Teacher Graph Example Page
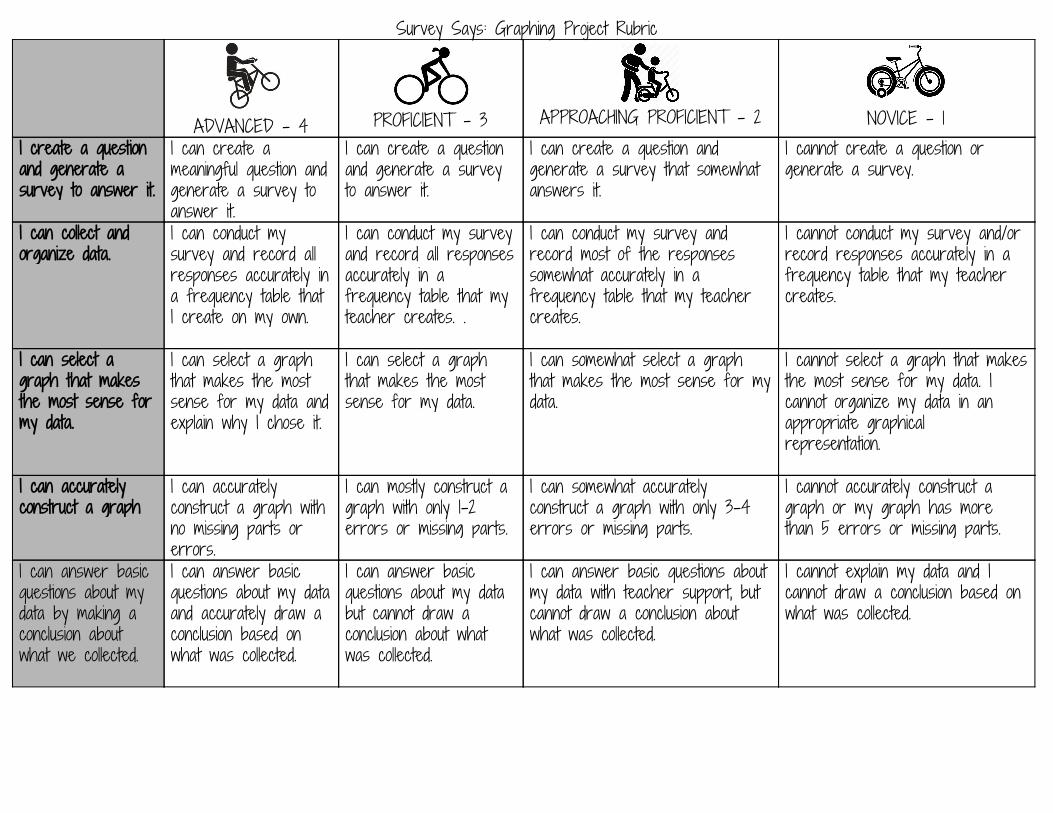
Survey Says: Graphing Project Rubric
ADVANCED - 4
PROFICIENT - 3
APPROACHING PROFICIENT - 2
NOVICE - 1
I create a question and generate a survey to answer it.
I can create a meaningful question and generate a survey to answer it.
I can create a question and generate a survey to answer it.
I can create a question and generate a survey that somewhat answers it.
I cannot create a question or generate a survey.
I can collect and organize data.
I can conduct my survey and record all responses accurately in a frequency table that I create on my own.
I can conduct my survey and record all responses accurately in a frequency table that my teacher creates. .
I can conduct my survey and record most of the responses somewhat accurately in a frequency table that my teacher creates.
I cannot conduct my survey and/or record responses accurately in a frequency table that my teacher creates.
I can select a graph that makes the most sense for my data.
I can select a graph that makes the most sense for my data and explain why I chose it.
I can select a graph that makes the most sense for my data.
I can somewhat select a graph that makes the most sense for my data.
I cannot select a graph that makes the most sense for my data. I cannot organize my data in an appropriate graphical representation.
I can accurately construct a graph
I can accurately construct a graph with no missing parts or errors.
I can mostly construct a graph with only 1-2 errors or missing parts.
I can somewhat accurately construct a graph with only 3-4 errors or missing parts.
I cannot accurately construct a graph or my graph has more than 5 errors or missing parts.
I can answer basic questions about my data by making a conclusion about what we collected.
I can answer basic questions about my data and accurately draw a conclusion based on what was collected.
I can answer basic questions about my data but cannot draw a conclusion about what was collected.
I can answer basic questions about my data with teacher support, but cannot draw a conclusion about what was collected.
I cannot explain my data and I cannot draw a conclusion based on what was collected.
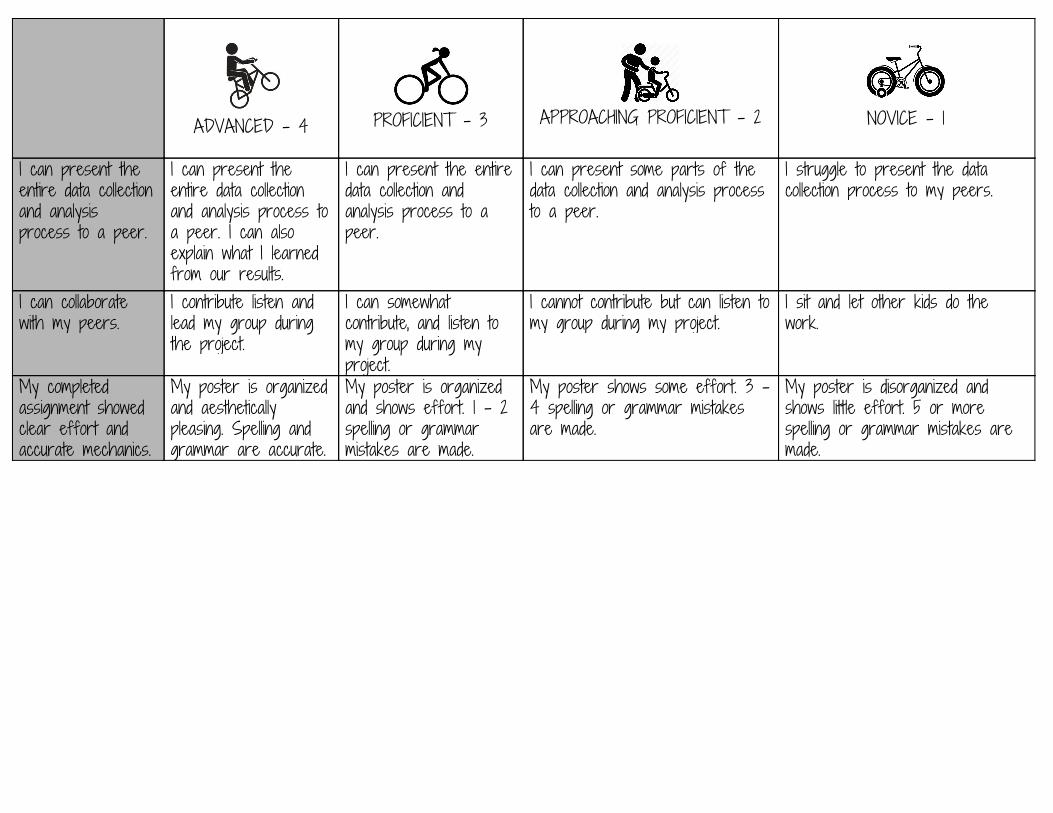
ADVANCED - 4
PROFICIENT - 3
APPROACHING PROFICIENT - 2
NOVICE - 1
I can present the entire data collection and analysis process to a peer.
I can present the entire data collection and analysis process to a peer. I can also explain what I learned from our results.
I can present the entire data collection and analysis process to a peer.
I can present some parts of the data collection and analysis process to a peer.
I struggle to present the data collection process to my peers.
I can collaborate with my peers.
I contribute listen and lead my group during the project.
I can somewhat contribute, and listen to my group during my project.
I cannot contribute but can listen to my group during my project.
I sit and let other kids do the work.
My completed assignment showed clear effort and accurate mechanics.
My poster is organized and aesthetically pleasing. Spelling and grammar are accurate.
My poster is organized and shows effort. 1 - 2 spelling or grammar mistakes are made.
My poster shows some effort. 3 - 4 spelling or grammar mistakes are made.
My poster is disorganized and shows little effort. 5 or more spelling or grammar mistakes are made.
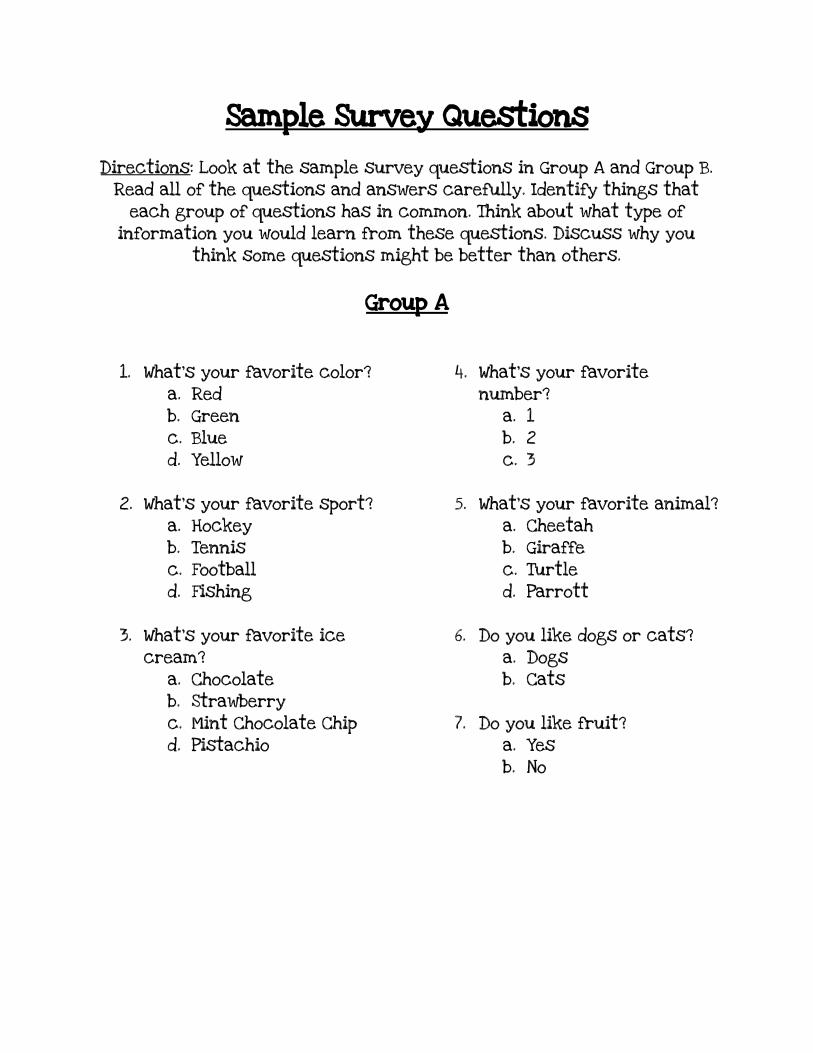
Sample Survey Questions
Directions: Look at the sample survey questions in Group A and Group B. Read all of the questions and answers carefully. Identify things that
each group of questions has in common. Think about what type of information you would learn from these questions. Discuss why you
think some questions might be better than others.
Group A
1. What’s your favorite color?
a. Red b. Green c. Blue d. Yellow
2. What’s your favorite sport?
a. Hockey b. Tennis c. Football d. Fishing
3. What’s your favorite ice
cream? a. Chocolate b. Strawberry c. Mint Chocolate Chip d. Pistachio
4. What’s your favorite number?
a. 1 b. 2 c. 3
5. What’s your favorite animal?
a. Cheetah b. Giraffe c. Turtle d. Parrott
6. Do you like dogs or cats?
a. Dogs b. Cats
7. Do you like fruit?
a. Yes b. No
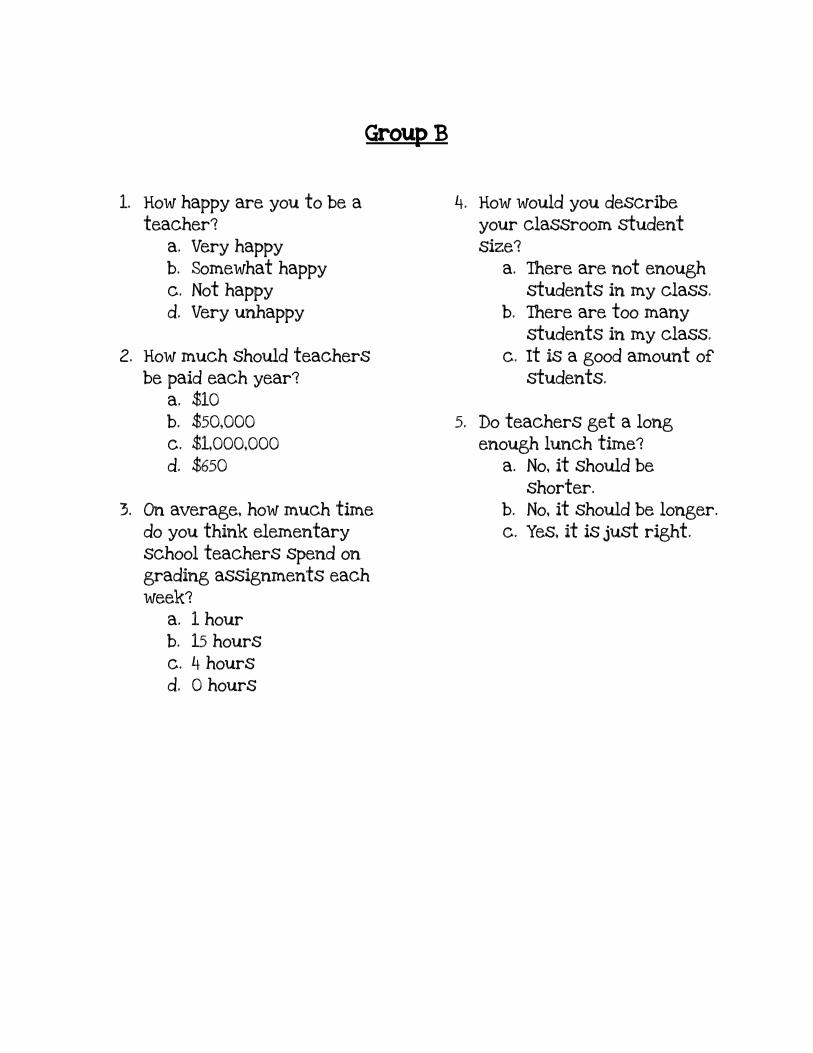
Group B
1. How happy are you to be a
teacher? a. Very happy b. Somewhat happy c. Not happy d. Very unhappy
2. How much should teachers
be paid each year? a. $10 b. $50,000 c. $1,000,000 d. $650
3. On average, how much time
do you think elementary school teachers spend on grading assignments each week?
a. 1 hour b. 15 hours c. 4 hours d. 0 hours
4. How would you describe your classroom student size?
a. There are not enough students in my class.
b. There are too many students in my class.
c. It is a good amount of students.
5. Do teachers get a long enough lunch time?
a. No, it should be shorter.
b. No, it should be longer. c. Yes, it is just right.
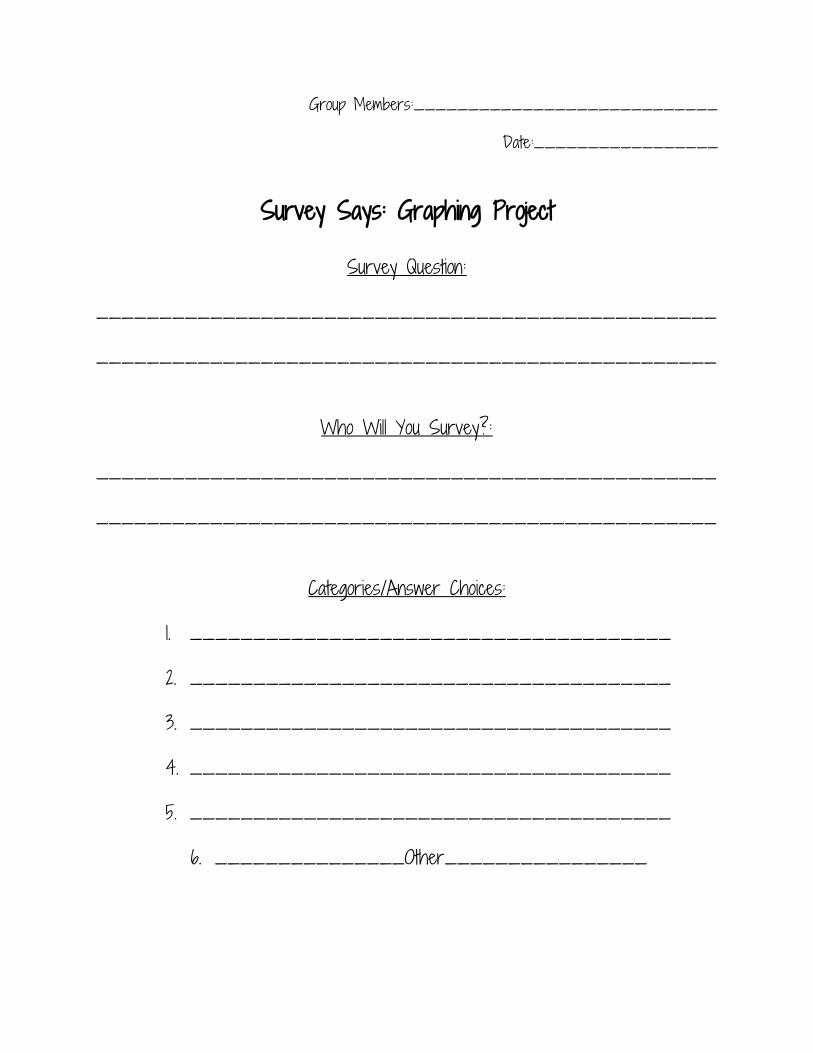
Group Members:____________________________
Date:_________________
Survey Says: Graphing Project
Survey Question:
_________________________________________________
_________________________________________________
Who Will You Survey?:
_________________________________________________
_________________________________________________
Categories/Answer Choices:
1. ______________________________________
2. ______________________________________
3. ______________________________________
4. ______________________________________
5. ______________________________________
6. _______________Other________________

Frequency Table:
Category Tallies Total
Other
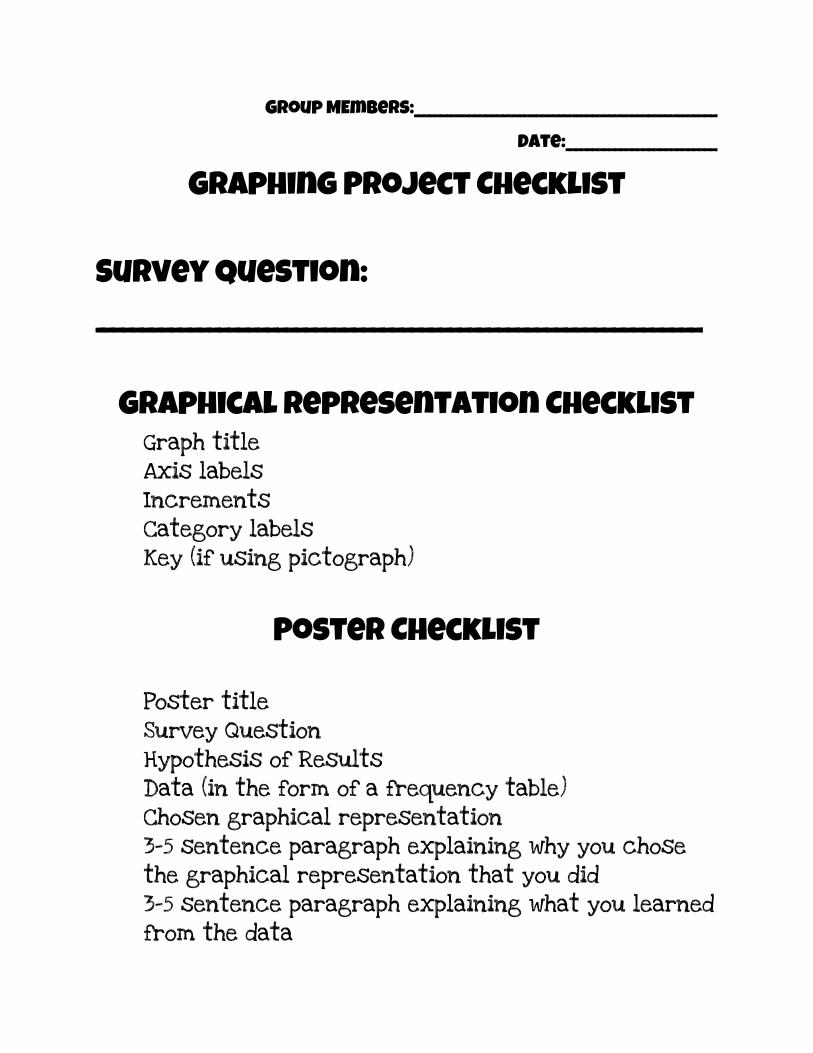
Group MEmbers:______________________________________________________
Date:___________________________
Graphing Project Checklist Survey Question: _______________________________________________________________
Graphical Representation Checklist Graph title Axis labels Increments Category labels Key (if using pictograph)
Poster Checklist
Poster title Survey Question Hypothesis of Results Data (in the form of a frequency table) Chosen graphical representation 3-5 sentence paragraph explaining why you chose the graphical representation that you did 3-5 sentence paragraph explaining what you learned from the data

My Name:_______________
Group Member I am Evaluating: _______________ Group Reflection and Evaluation
How did my groupmates do in collaboration? Read the following statements and respond honestly.
Circle One Emoji
This group member led the group during the project.
4 3 2 1
This group member contributed during the project.
4 3 2 1
This group member listened during the project.
4 3 2 1 How did this group member contribute to the project? __________________________________