Embed Size (px)
Citation preview
1
CENTRE FOR ENVIRONMENT, FISHERIES AND AQUACULTURE SCIENCE
SCIENCE SERIES TECHNICAL REPORTNumber 118
SURVEYING FISH POPULATIONS IN THE SOLENT AND ADJACENT HARBOURS
USING THE CEFAS BASS TRAWL
G.D. Pickett, M. Brown, B. Harley and M.R. Dunn
LOWESTOFT2002
2 3
This report should be cited as:Pickett, G.D., Brown, M., Harley, B. and Dunn, M.R. (2002).Surveying fish populations in the Solent and adjacent harbours using the CEFAS bass trawl.Sci. Ser. Tech Rep., CEFAS Lowestoft, 118: 16pp.
© Crown copyright, 2002
Requests for reproduction of material contained within this report should be addressed to CEFAS
2 3
CONTENTS Page
1. Introduction ....................................................................................................................................5
2. Methods ..........................................................................................................................................6 2.1 Survey gear............................................................................................................................6 2.2 Survey operational details......................................................................................................7 2.3 Data handling.........................................................................................................................9
3. Results and discussion.................................................................................................................9 3.1 Surveys completed to date ....................................................................................................9 3.2 Bass abundance ....................................................................................................................9 3.3 Other species.......................................................................................................................10 4. Acknowledgements .....................................................................................................................13
5. References....................................................................................................................................13
Appendix 1. Example of a completed cruise report..........................................................................14

4 5
4 5
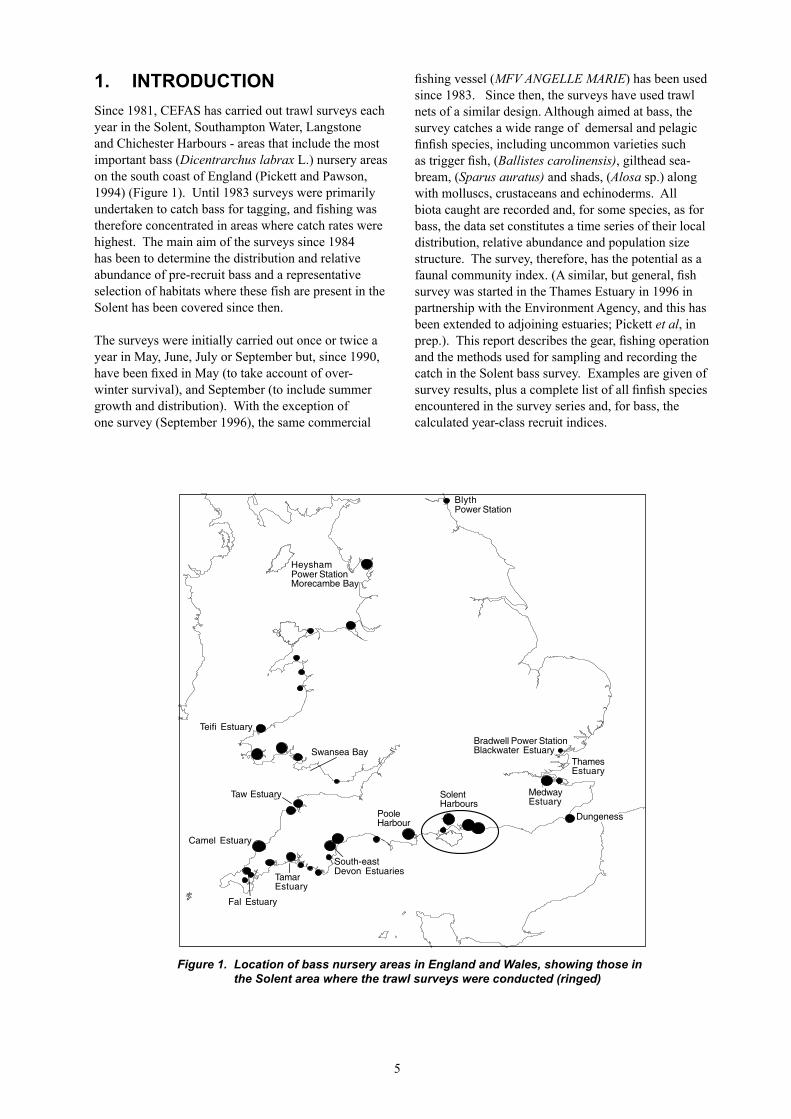
1. INTRODUCTION Since 1981, CEFAS has carried out trawl surveys each year in the Solent, Southampton Water, Langstone and Chichester Harbours - areas that include the most important bass (Dicentrarchus labrax L.) nursery areas on the south coast of England (Pickett and Pawson, 1994) (Figure 1). Until 1983 surveys were primarily undertaken to catch bass for tagging, and fishing was therefore concentrated in areas where catch rates were highest. The main aim of the surveys since 1984 has been to determine the distribution and relative abundance of pre-recruit bass and a representative selection of habitats where these fish are present in the Solent has been covered since then.
The surveys were initially carried out once or twice a year in May, June, July or September but, since 1990, have been fixed in May (to take account of over-winter survival), and September (to include summer growth and distribution). With the exception of one survey (September 1996), the same commercial
fishing vessel (MFV ANGELLE MARIE) has been used since 1983. Since then, the surveys have used trawl nets of a similar design. Although aimed at bass, the survey catches a wide range of demersal and pelagic finfish species, including uncommon varieties such as trigger fish, (Ballistes carolinensis), gilthead sea-bream, (Sparus auratus) and shads, (Alosa sp.) along with molluscs, crustaceans and echinoderms. All biota caught are recorded and, for some species, as for bass, the data set constitutes a time series of their local distribution, relative abundance and population size structure. The survey, therefore, has the potential as a faunal community index. (A similar, but general, fish survey was started in the Thames Estuary in 1996 in partnership with the Environment Agency, and this has been extended to adjoining estuaries; Pickett et al, in prep.). This report describes the gear, fishing operation and the methods used for sampling and recording the catch in the Solent bass survey. Examples are given of survey results, plus a complete list of all finfish species encountered in the survey series and, for bass, the calculated year-class recruit indices.
Figure 1. Location of bass nursery areas in England and Wales, showing those in the Solent area where the trawl surveys were conducted (ringed)
Heysham P.S.Morecambe
Bay
Swansea Bay
Taw Estuary
Camel Estuary
Fal Estuary
Tamar
Estuary
South-east
Devon Estuaries
Poole
Harbour
SolentHarbours
B radwell P.S.
B lackwater Estuary
Medway
E stuaryDungeness
Teifi Estuary
Blyth P.S.
Thames
Estuary
BlythPower Station
HeyshamPower StationMorecambe Bay
Teifi Estuary
Taw Estuary
Swansea Bay
Camel Estuary
TamarEstuary
Fal Estuary
South-eastDevon Estuaries
PooleHarbour
SolentHarbours
MedwayEstuary
Dungeness
ThamesEstuary
Bradwell Power StationBlackwater Estuary
6 7
2. METHODSThe survey method was developed by CEFAS in consultation with charter vessel skippers, who also advised on the initial design of the survey trawls, each of which has been specially made for these surveys. In setting up and carrying out such surveys, the detailed knowledge and advice of local skippers is essential to minimise risks, such as tide patterns, trawl ‘hangers’, shoal areas and location of static fishing gears such as fleets of nets or pots.
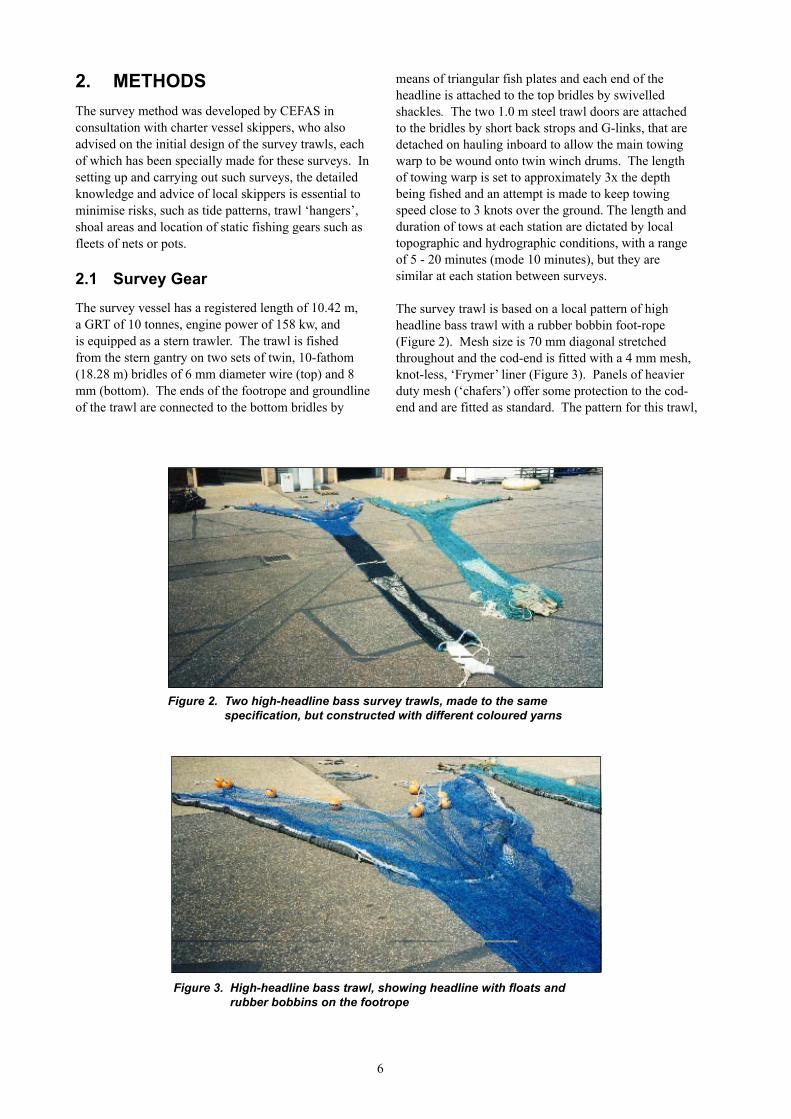
2.1 Survey GearThe survey vessel has a registered length of 10.42 m, a GRT of 10 tonnes, engine power of 158 kw, and is equipped as a stern trawler. The trawl is fished from the stern gantry on two sets of twin, 10-fathom (18.28 m) bridles of 6 mm diameter wire (top) and 8 mm (bottom). The ends of the footrope and groundline of the trawl are connected to the bottom bridles by
Figure 2. Two high-headline bass survey trawls, made to the same specification, but constructed with different coloured yarns
Figure 3. High-headline bass trawl, showing headline with floats and rubber bobbins on the footrope
means of triangular fish plates and each end of the headline is attached to the top bridles by swivelled shackles. The two 1.0 m steel trawl doors are attached to the bridles by short back strops and G-links, that are detached on hauling inboard to allow the main towing warp to be wound onto twin winch drums. The length of towing warp is set to approximately 3x the depth being fished and an attempt is made to keep towing speed close to 3 knots over the ground. The length and duration of tows at each station are dictated by local topographic and hydrographic conditions, with a range of 5 - 20 minutes (mode 10 minutes), but they are similar at each station between surveys.
The survey trawl is based on a local pattern of high headline bass trawl with a rubber bobbin foot-rope (Figure 2). Mesh size is 70 mm diagonal stretched throughout and the cod-end is fitted with a 4 mm mesh, knot-less, ‘Frymer’ liner (Figure 3). Panels of heavier duty mesh (‘chafers’) offer some protection to the cod-end and are fitted as standard. The pattern for this trawl,
6 7
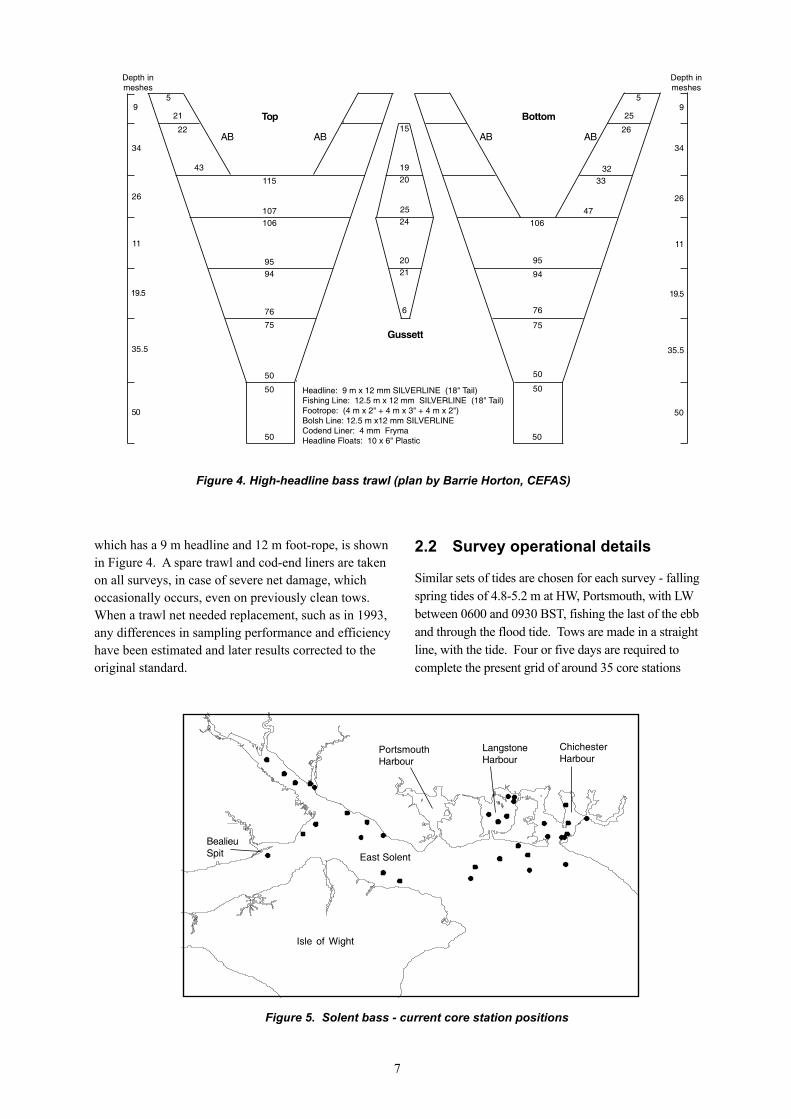
which has a 9 m headline and 12 m foot-rope, is shown in Figure 4. A spare trawl and cod-end liners are taken on all surveys, in case of severe net damage, which occasionally occurs, even on previously clean tows. When a trawl net needed replacement, such as in 1993, any differences in sampling performance and efficiency have been estimated and later results corrected to the original standard.
34
26
11
19.5
35.5
50
50
50
76
75
9594
106107
115
Headline: 9 m x 12 mm SILVERLINE (18" Tail)Fishing Line: 12.5 m x 12 mm SILVERLINE (18" Tail)Footrope: (4 m x 2" + 4 m x 3" + 4 m x 2")Bolsh Line: 12.5 m x12 mm SILVERLINECodend Liner: 4 mm FrymaHeadline Floats: 10 x 6" Plastic 50
10647
3332
5
26
25
50
Depth inmeshes
Depth inmeshes
95
43
22
21
AB15
AB
Top
25
2019
24
20
6
21
Gussett
ABAB
Bottom
94
75
76
50
50
95
34
26
11
19.5
35.5
50
9
Figure 4. High-headline bass trawl (plan by Barrie Horton, CEFAS)
2.2 Survey operational details
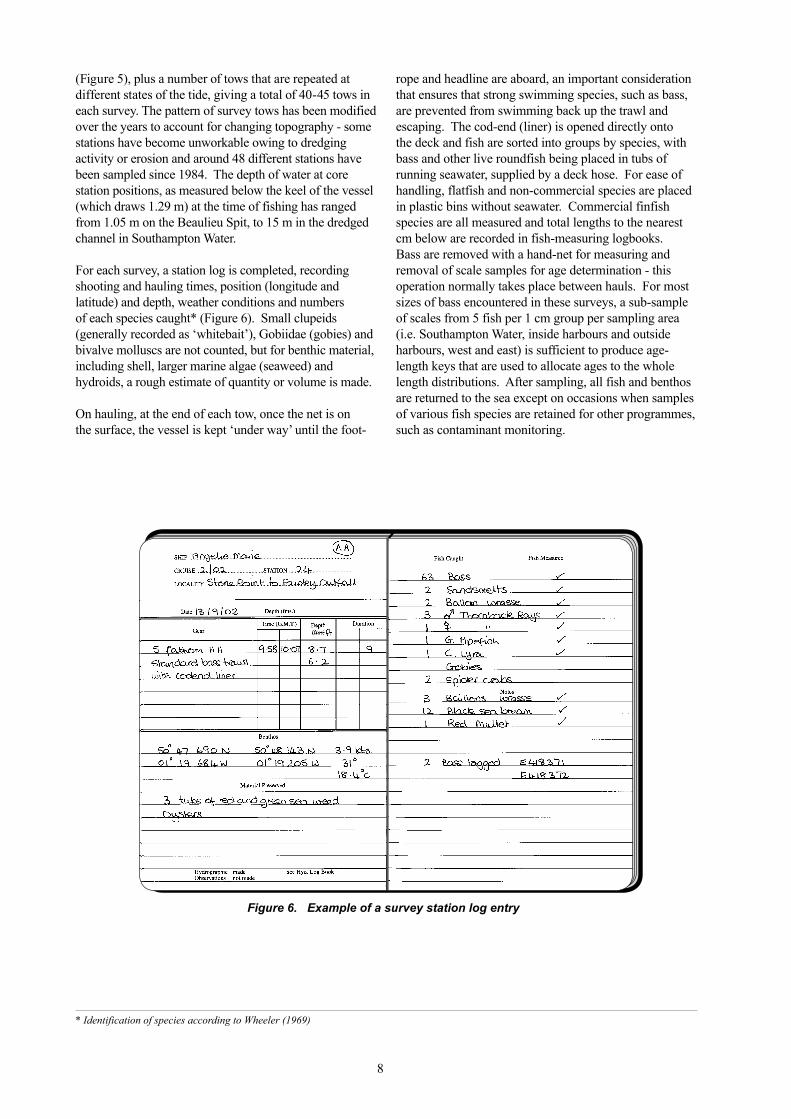
Similar sets of tides are chosen for each survey - falling spring tides of 4.8-5.2 m at HW, Portsmouth, with LW between 0600 and 0930 BST, fishing the last of the ebb and through the flood tide. Tows are made in a straight line, with the tide. Four or five days are required to complete the present grid of around 35 core stations
PortsmouthHarbour
LangstoneHarbour
ChichesterHarbour
East Solent
Isle of Wight
BealieuSpit
Figure 5. Solent bass - current core station positions
8 9
(Figure 5), plus a number of tows that are repeated at different states of the tide, giving a total of 40-45 tows in each survey. The pattern of survey tows has been modified over the years to account for changing topography - some stations have become unworkable owing to dredging activity or erosion and around 48 different stations have been sampled since 1984. The depth of water at core station positions, as measured below the keel of the vessel (which draws 1.29 m) at the time of fishing has ranged from 1.05 m on the Beaulieu Spit, to 15 m in the dredged channel in Southampton Water.
For each survey, a station log is completed, recording shooting and hauling times, position (longitude and latitude) and depth, weather conditions and numbers of each species caught* (Figure 6). Small clupeids (generally recorded as ‘whitebait’), Gobiidae (gobies) and bivalve molluscs are not counted, but for benthic material, including shell, larger marine algae (seaweed) and hydroids, a rough estimate of quantity or volume is made.
On hauling, at the end of each tow, once the net is on the surface, the vessel is kept ‘under way’ until the foot-
* Identification of species according to Wheeler (1969)
rope and headline are aboard, an important consideration that ensures that strong swimming species, such as bass, are prevented from swimming back up the trawl and escaping. The cod-end (liner) is opened directly onto the deck and fish are sorted into groups by species, with bass and other live roundfish being placed in tubs of running seawater, supplied by a deck hose. For ease of handling, flatfish and non-commercial species are placed in plastic bins without seawater. Commercial finfish species are all measured and total lengths to the nearest cm below are recorded in fish-measuring logbooks. Bass are removed with a hand-net for measuring and removal of scale samples for age determination - this operation normally takes place between hauls. For most sizes of bass encountered in these surveys, a sub-sample of scales from 5 fish per 1 cm group per sampling area (i.e. Southampton Water, inside harbours and outside harbours, west and east) is sufficient to produce age-length keys that are used to allocate ages to the whole length distributions. After sampling, all fish and benthos are returned to the sea except on occasions when samples of various fish species are retained for other programmes, such as contaminant monitoring.
Figure 6. Example of a survey station log entry
8 9
2.3 Data handlingData from each station log and measuring book are entered, by survey and for all identified organisms, onto the CEFAS Fish Survey System database.
Bass survey abundance indices are calculated on the basis of density per age-group at each core station, standardised to a 10-minute tow. These data are summed to provide mean abundance indices for spring/summer and autumn surveys separately, by individual age-groups 0-5, using the following method, adapted from Pawson (1992).
The relative mean abundance ( ) of y bass year-classes caught at age a in each survey s (May or September) is calculated using:
where xa,s,y is the survey mean catch/10 min of year-class y at age a, and ns,y is the number of years of the survey in which bass year-classes from 1977 onwards were sampled at age a.
The year-class relative abundance index or recruit index ( ), based on all surveys on each year-class, is calculated using the expression:
here na,s is the number of surveys and ages across which bass of year-class y have been sampled.
The processing of the bass survey data is now carried out by use of a suite of macros in Microsoft® EXCEL (Brown and Dunn, in prep.). Although calculated for bass only at present, survey abundance indices could be produced for any other species’ populations that are considered sufficiently well represented in such surveys.On completion of each survey, a cruise report is produced and sent to interested parties, including local Defra and Sea Fisheries Committee offices. These reports provide a narrative of the survey and a record of the total numbers and percentage of bass by age-class and overall catch rates of bass in the separate areas. The numbers of the other most abundant species are also given, along with details of any rare species. An example of a completed cruise report can be found in Appendix 1.
3. RESULTS AND DISCUSSION
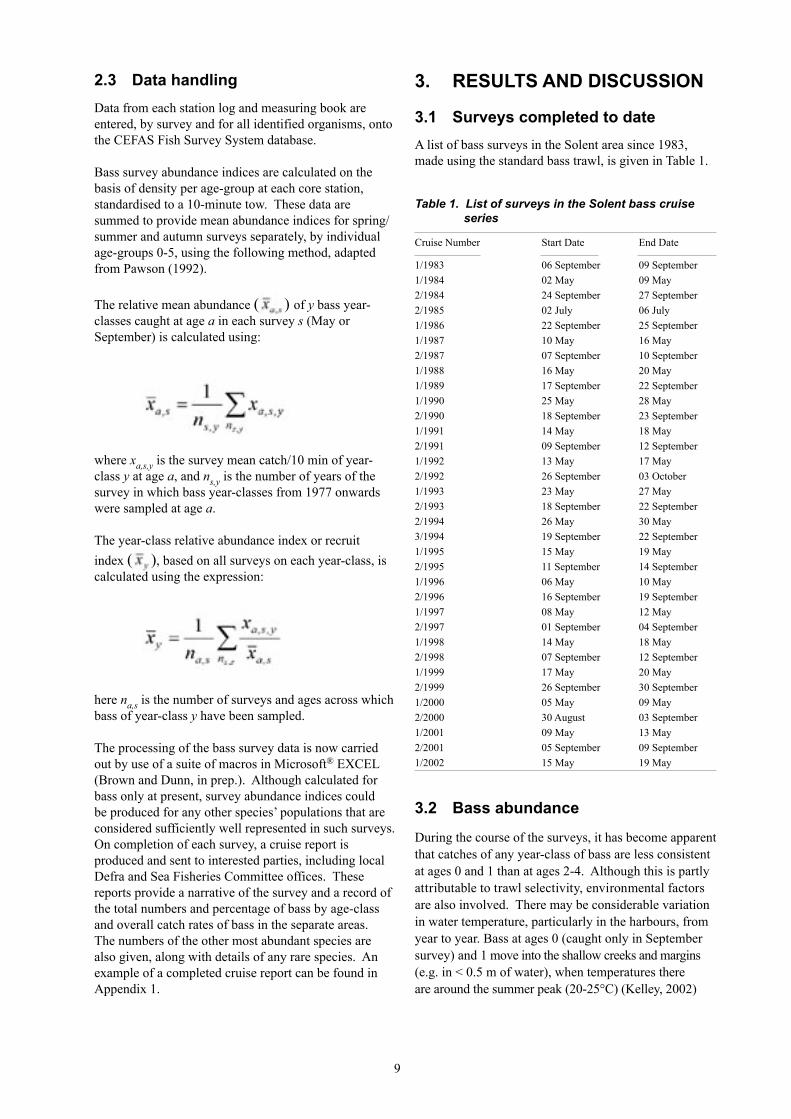
3.1 Surveys completed to dateA list of bass surveys in the Solent area since 1983, made using the standard bass trawl, is given in Table 1.
3.2 Bass abundanceDuring the course of the surveys, it has become apparent that catches of any year-class of bass are less consistent at ages 0 and 1 than at ages 2-4. Although this is partly attributable to trawl selectivity, environmental factors are also involved. There may be considerable variation in water temperature, particularly in the harbours, from year to year. Bass at ages 0 (caught only in September survey) and 1 move into the shallow creeks and margins (e.g. in < 0.5 m of water), when temperatures there are around the summer peak (20-25°C) (Kelley, 2002)
Table 1. List of surveys in the Solent bass cruise series
Cruise Number Start Date End Date
1/1983 06 September 09 September1/1984 02 May 09 May2/1984 24 September 27 September2/1985 02 July 06 July1/1986 22 September 25 September1/1987 10 May 16 May2/1987 07 September 10 September1/1988 16 May 20 May1/1989 17 September 22 September1/1990 25 May 28 May2/1990 18 September 23 September1/1991 14 May 18 May2/1991 09 September 12 September1/1992 13 May 17 May2/1992 26 September 03 October1/1993 23 May 27 May2/1993 18 September 22 September2/1994 26 May 30 May3/1994 19 September 22 September1/1995 15 May 19 May2/1995 11 September 14 September1/1996 06 May 10 May2/1996 16 September 19 September1/1997 08 May 12 May2/1997 01 September 04 September1/1998 14 May 18 May2/1998 07 September 12 September1/1999 17 May 20 May2/1999 26 September 30 September1/2000 05 May 09 May2/2000 30 August 03 September1/2001 09 May 13 May2/2001 05 September 09 September1/2002 15 May 19 May
10 11
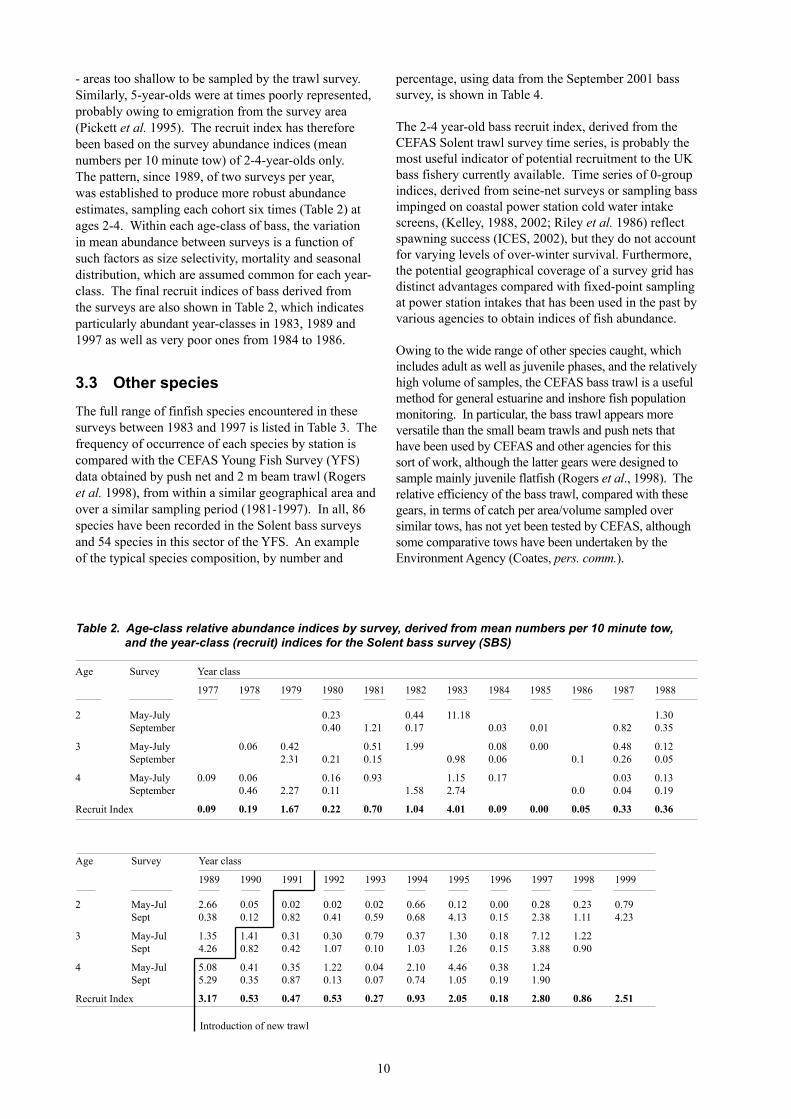
- areas too shallow to be sampled by the trawl survey. Similarly, 5-year-olds were at times poorly represented, probably owing to emigration from the survey area (Pickett et al. 1995). The recruit index has therefore been based on the survey abundance indices (mean numbers per 10 minute tow) of 2-4-year-olds only. The pattern, since 1989, of two surveys per year, was established to produce more robust abundance estimates, sampling each cohort six times (Table 2) at ages 2-4. Within each age-class of bass, the variation in mean abundance between surveys is a function of such factors as size selectivity, mortality and seasonal distribution, which are assumed common for each year-class. The final recruit indices of bass derived from the surveys are also shown in Table 2, which indicates particularly abundant year-classes in 1983, 1989 and 1997 as well as very poor ones from 1984 to 1986.
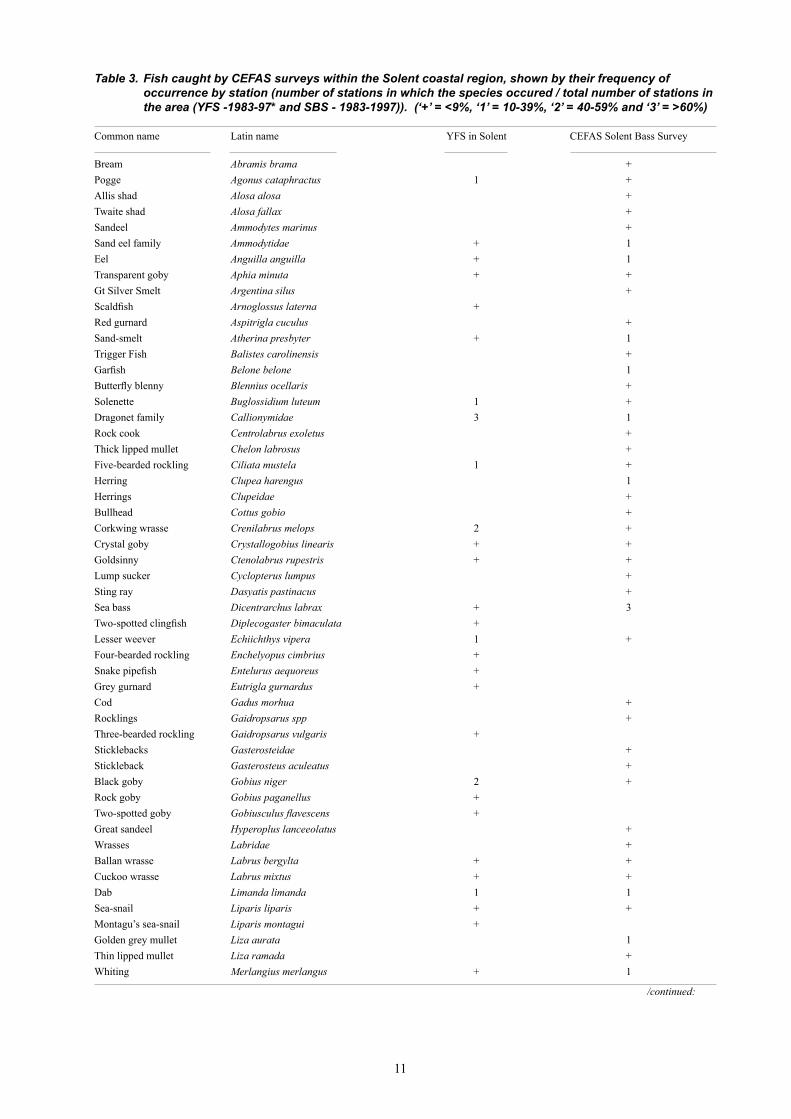
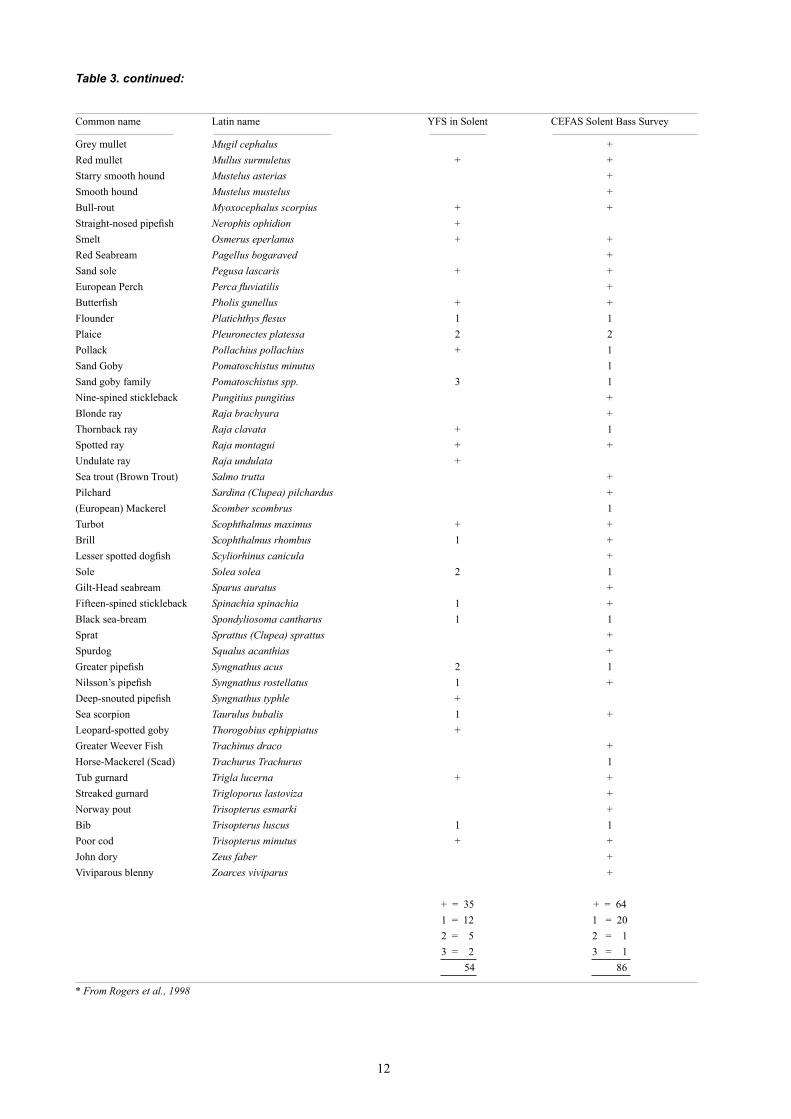
3.3 Other speciesThe full range of finfish species encountered in these surveys between 1983 and 1997 is listed in Table 3. The frequency of occurrence of each species by station is compared with the CEFAS Young Fish Survey (YFS) data obtained by push net and 2 m beam trawl (Rogers et al. 1998), from within a similar geographical area and over a similar sampling period (1981-1997). In all, 86 species have been recorded in the Solent bass surveys and 54 species in this sector of the YFS. An example of the typical species composition, by number and
percentage, using data from the September 2001 bass survey, is shown in Table 4.
The 2-4 year-old bass recruit index, derived from the CEFAS Solent trawl survey time series, is probably the most useful indicator of potential recruitment to the UK bass fishery currently available. Time series of 0-group indices, derived from seine-net surveys or sampling bass impinged on coastal power station cold water intake screens, (Kelley, 1988, 2002; Riley et al. 1986) reflect spawning success (ICES, 2002), but they do not account for varying levels of over-winter survival. Furthermore, the potential geographical coverage of a survey grid has distinct advantages compared with fixed-point sampling at power station intakes that has been used in the past by various agencies to obtain indices of fish abundance.
Owing to the wide range of other species caught, which includes adult as well as juvenile phases, and the relatively high volume of samples, the CEFAS bass trawl is a useful method for general estuarine and inshore fish population monitoring. In particular, the bass trawl appears more versatile than the small beam trawls and push nets that have been used by CEFAS and other agencies for this sort of work, although the latter gears were designed to sample mainly juvenile flatfish (Rogers et al., 1998). The relative efficiency of the bass trawl, compared with these gears, in terms of catch per area/volume sampled over similar tows, has not yet been tested by CEFAS, although some comparative tows have been undertaken by the Environment Agency (Coates, pers. comm.).
Age Survey Year class
1977 1978 1979 1980 1981 1982 1983 1984 1985 1986 1987 1988
2 May-July 0.23 0.44 11.18 1.30September 0.40 1.21 0.17 0.03 0.01 0.82 0.35
3 May-July 0.06 0.42 0.51 1.99 0.08 0.00 0.48 0.12September 2.31 0.21 0.15 0.98 0.06 0.1 0.26 0.05
4 May-July 0.09 0.06 0.16 0.93 1.15 0.17 0.03 0.13September 0.46 2.27 0.11 1.58 2.74 0.0 0.04 0.19
Recruit Index 0.09 0.19 1.67 0.22 0.70 1.04 4.01 0.09 0.00 0.05 0.33 0.36
Age Survey Year class
1989 1990 1991 1992 1993 1994 1995 1996 1997 1998 1999
2 May-Jul 2.66 0.05 0.02 0.02 0.02 0.66 0.12 0.00 0.28 0.23 0.79Sept 0.38 0.12 0.82 0.41 0.59 0.68 4.13 0.15 2.38 1.11 4.23
3 May-Jul 1.35 1.41 0.31 0.30 0.79 0.37 1.30 0.18 7.12 1.22Sept 4.26 0.82 0.42 1.07 0.10 1.03 1.26 0.15 3.88 0.90
4 May-Jul 5.08 0.41 0.35 1.22 0.04 2.10 4.46 0.38 1.24Sept 5.29 0.35 0.87 0.13 0.07 0.74 1.05 0.19 1.90
Recruit Index 3.17 0.53 0.47 0.53 0.27 0.93 2.05 0.18 2.80 0.86 2.51
Table 2. Age-class relative abundance indices by survey, derived from mean numbers per 10 minute tow, and the year-class (recruit) indices for the Solent bass survey (SBS)
Introduction of new trawl
10 11
Common name Latin name YFS in Solent CEFAS Solent Bass Survey
Bream Abramis brama +Pogge Agonus cataphractus 1 +Allis shad Alosa alosa +Twaite shad Alosa fallax +Sandeel Ammodytes marinus +Sand eel family Ammodytidae + 1Eel Anguilla anguilla + 1Transparent goby Aphia minuta + +Gt Silver Smelt Argentina silus +Scaldfish Arnoglossus laterna +Red gurnard Aspitrigla cuculus +Sand-smelt Atherina presbyter + 1Trigger Fish Balistes carolinensis +Garfish Belone belone 1Butterfly blenny Blennius ocellaris +Solenette Buglossidium luteum 1 +Dragonet family Callionymidae 3 1Rock cook Centrolabrus exoletus +Thick lipped mullet Chelon labrosus +Five-bearded rockling Ciliata mustela 1 +Herring Clupea harengus 1Herrings Clupeidae +Bullhead Cottus gobio +Corkwing wrasse Crenilabrus melops 2 +Crystal goby Crystallogobius linearis + +Goldsinny Ctenolabrus rupestris + +Lump sucker Cyclopterus lumpus +Sting ray Dasyatis pastinacus +Sea bass Dicentrarchus labrax + 3Two-spotted clingfish Diplecogaster bimaculata +Lesser weever Echiichthys vipera 1 +Four-bearded rockling Enchelyopus cimbrius +Snake pipefish Entelurus aequoreus +Grey gurnard Eutrigla gurnardus +Cod Gadus morhua +Rocklings Gaidropsarus spp +Three-bearded rockling Gaidropsarus vulgaris +Sticklebacks Gasterosteidae +Stickleback Gasterosteus aculeatus +Black goby Gobius niger 2 +Rock goby Gobius paganellus +Two-spotted goby Gobiusculus flavescens +Great sandeel Hyperoplus lanceeolatus +Wrasses Labridae +Ballan wrasse Labrus bergylta + +Cuckoo wrasse Labrus mixtus + +Dab Limanda limanda 1 1Sea-snail Liparis liparis + +Montagu’s sea-snail Liparis montagui +Golden grey mullet Liza aurata 1Thin lipped mullet Liza ramada +Whiting Merlangius merlangus + 1
Table 3. Fish caught by CEFAS surveys within the Solent coastal region, shown by their frequency of occurrence by station (number of stations in which the species occured / total number of stations in the area (YFS -1983-97* and SBS - 1983-1997)). (‘+’ = <9%, ‘1’ = 10-39%, ‘2’ = 40-59% and ‘3’ = >60%)
/continued:
12 13
Common name Latin name YFS in Solent CEFAS Solent Bass Survey
Grey mullet Mugil cephalus +Red mullet Mullus surmuletus + +Starry smooth hound Mustelus asterias +Smooth hound Mustelus mustelus +Bull-rout Myoxocephalus scorpius + +Straight-nosed pipefish Nerophis ophidion +Smelt Osmerus eperlanus + +Red Seabream Pagellus bogaraved +Sand sole Pegusa lascaris + +European Perch Perca fluviatilis +Butterfish Pholis gunellus + +Flounder Platichthys flesus 1 1Plaice Pleuronectes platessa 2 2Pollack Pollachius pollachius + 1Sand Goby Pomatoschistus minutus 1Sand goby family Pomatoschistus spp. 3 1Nine-spined stickleback Pungitius pungitius +Blonde ray Raja brachyura +Thornback ray Raja clavata + 1Spotted ray Raja montagui + +Undulate ray Raja undulata +Sea trout (Brown Trout) Salmo trutta +Pilchard Sardina (Clupea) pilchardus +(European) Mackerel Scomber scombrus 1Turbot Scophthalmus maximus + +Brill Scophthalmus rhombus 1 +Lesser spotted dogfish Scyliorhinus canicula +Sole Solea solea 2 1Gilt-Head seabream Sparus auratus +Fifteen-spined stickleback Spinachia spinachia 1 +Black sea-bream Spondyliosoma cantharus 1 1Sprat Sprattus (Clupea) sprattus +Spurdog Squalus acanthias +Greater pipefish Syngnathus acus 2 1Nilsson’s pipefish Syngnathus rostellatus 1 +Deep-snouted pipefish Syngnathus typhle +Sea scorpion Taurulus bubalis 1 +Leopard-spotted goby Thorogobius ephippiatus +Greater Weever Fish Trachinus draco +Horse-Mackerel (Scad) Trachurus Trachurus 1Tub gurnard Trigla lucerna + +Streaked gurnard Trigloporus lastoviza +Norway pout Trisopterus esmarki +Bib Trisopterus luscus 1 1Poor cod Trisopterus minutus + +John dory Zeus faber +Viviparous blenny Zoarces viviparus +
+ = 35 + = 641 = 12 1 = 202 = 5 2 = 13 = 2 3 = 1 54 86
* From Rogers et al., 1998
Table 3. continued:
13
4. ACKNOWLEDGEMENTSWe thank Alec and Dave Baldacchino, owners and successive skippers of the MFV ANGELLE MARIE, for their detailed local knowledge and invaluable help and patience over the years, for the original trawl design, skilful repairs to damaged gear and endless cups of tea and sandwiches.
5. REFERENCESBROWN, M., AND DUNN, M., (IN PREP.). Changes in
abundance and distribution of pre-recruit bass (Dicentrarchus labrax L.) in the Solent and adjoining harbours as shown by trawl surveys 1983-2002.
ICES, 2002. Report of the Study Group on Sea Bass, Brest, France 11-15 March 2002. Advisory Committee on Fishery Management. International Council for the Exploration of the Sea, ICES CM 2002/ACFM: 11 Ref. G. 59pp.
KELLEY, D.F., 1988. The importance of estuaries for sea-bass, Dicentrarchus labrax (L.). J. Fish Biol., 33 (Supplement A): 25-33.
KELLEY, D.F., 2002. Abundance, growth and first winter survival of young bass in nurseries of south-west England. J. Mar. Biol. Ass. UK, 82: 307-319.
PAWSON, M.G., 1992. Climatic influences on the spawning success, growth, and recruitment of bass (Dicentrarchus labrax L.) in British waters. ICES Mar. Sci. Symp., 195: 388-392
PICKETT, G.D., BROWN, M. AND HARLEY, B., (IN PREP.). Surveying fish populations in the Thames Estuary and adjoining tidal waters, using high-headline bass trawls.
PICKETT, G.D., EATON, D.R., CUNNINGHAM, S., DUNN, M.R., POTTEN, S.D. AND WHITMARSH, D. 1995. An appraisal of the UK bass fishery and its management. Lab Leafl., MAFF Direct. Fish. Res., Lowestoft, 75: 47pp
PICKETT, G.D. AND PAWSON, M.G., 1994. Sea Bass,
biology, exploitation and conservation. Chapman and Hall, London. 337pp.
RILEY, J.D., ANDREWS, M.J., APRAHAMIAN, M.W. AND
CLARIDGE, P.N., 1986. Bass (Dicentrarchus labrax) year-class strength size variation as shown by sampling the 0 group on power station cooling water intake screens, English coast 1972-83. Annales biologiques, 40: 181.
ROGERS, S.I., MILLNER, R.S., AND MEAD, T.A., 1998. The distribution and abundance of young fish on the east-south coast of England (1981 to1997). Sci. Ser. Tech. Rep., CEFAS, Lowestoft., 108: 130pp
WHEELER, A., 1969. The Fishes of the British Isles and North-West Europe. Macmillan. 613pp.
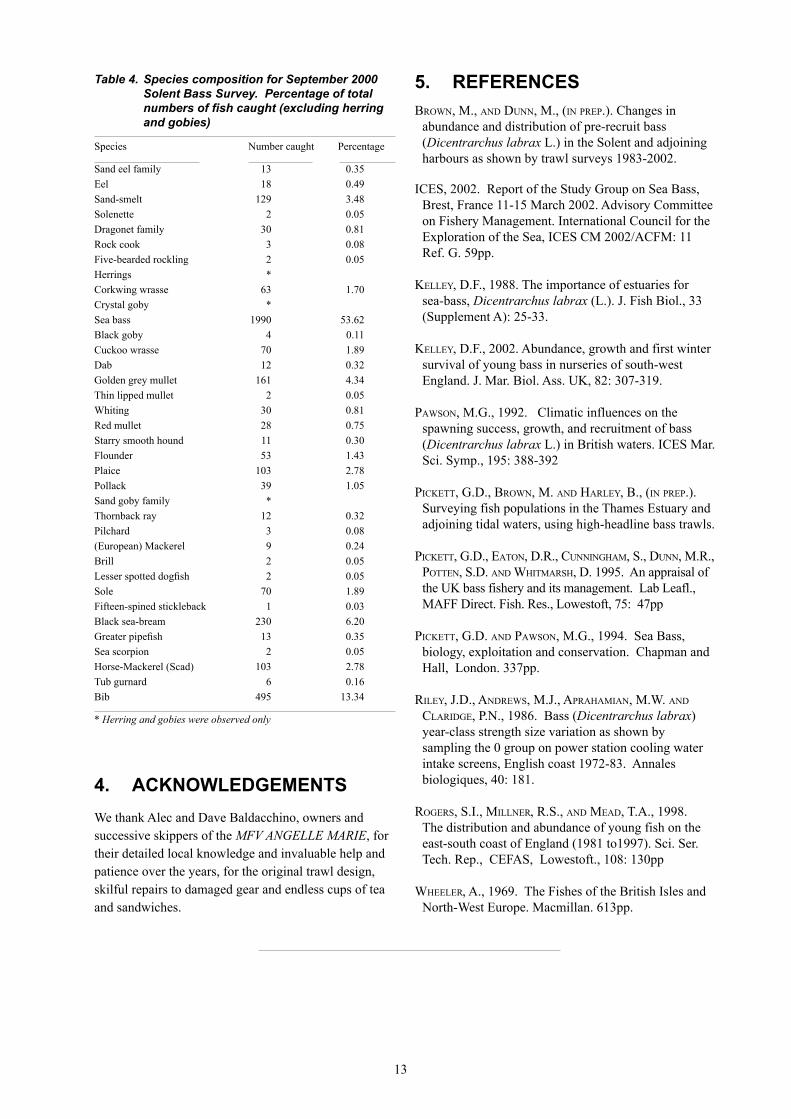
Table 4. Species composition for September 2000 Solent Bass Survey. Percentage of total numbers of fish caught (excluding herring and gobies)
Species Number caught Percentage
Sand eel family 13 0.35Eel 18 0.49Sand-smelt 129 3.48Solenette 2 0.05Dragonet family 30 0.81Rock cook 3 0.08Five-bearded rockling 2 0.05Herrings *Corkwing wrasse 63 1.70Crystal goby *Sea bass 1990 53.62Black goby 4 0.11Cuckoo wrasse 70 1.89Dab 12 0.32Golden grey mullet 161 4.34Thin lipped mullet 2 0.05Whiting 30 0.81Red mullet 28 0.75Starry smooth hound 11 0.30Flounder 53 1.43Plaice 103 2.78Pollack 39 1.05Sand goby family *Thornback ray 12 0.32Pilchard 3 0.08(European) Mackerel 9 0.24Brill 2 0.05Lesser spotted dogfi sh 2 0.05Sole 70 1.89Fifteen-spined stickleback 1 0.03Black sea-bream 230 6.20Greater pipefi sh 13 0.35Sea scorpion 2 0.05Horse-Mackerel (Scad) 103 2.78Tub gurnard 6 0.16Bib 495 13.34
* Herring and gobies were observed only
14 15
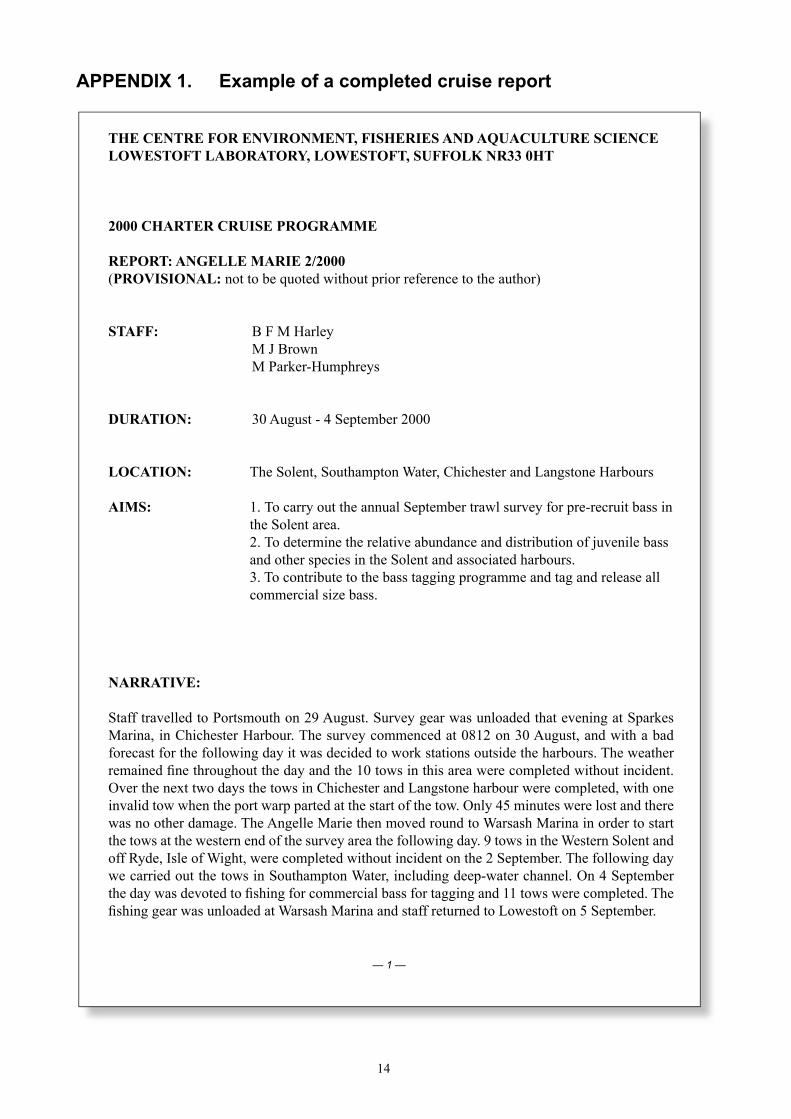
APPENDIX 1. Example of a completed cruise report
THE CENTRE FOR ENVIRONMENT, FISHERIES AND AQUACULTURE SCIENCE LOWESTOFT LABORATORY, LOWESTOFT, SUFFOLK NR33 0HT
2000 CHARTER CRUISE PROGRAMME
REPORT: ANGELLE MARIE 2/2000(PROVISIONAL: not to be quoted without prior reference to the author)
STAFF: B F M Harley M J Brown M Parker-Humphreys
DURATION: 30 August - 4 September 2000
LOCATION: The Solent, Southampton Water, Chichester and Langstone Harbours
AIMS: 1. To carry out the annual September trawl survey for pre-recruit bass in the Solent area.
2. To determine the relative abundance and distribution of juvenile bass and other species in the Solent and associated harbours.
3. To contribute to the bass tagging programme and tag and release all commercial size bass.
NARRATIVE:
Staff travelled to Portsmouth on 29 August. Survey gear was unloaded that evening at Sparkes Marina, in Chichester Harbour. The survey commenced at 0812 on 30 August, and with a bad forecast for the following day it was decided to work stations outside the harbours. The weather remained fi ne throughout the day and the 10 tows in this area were completed without incident. Over the next two days the tows in Chichester and Langstone harbour were completed, with one invalid tow when the port warp parted at the start of the tow. Only 45 minutes were lost and there was no other damage. The Angelle Marie then moved round to Warsash Marina in order to start the tows at the western end of the survey area the following day. 9 tows in the Western Solent and off Ryde, Isle of Wight, were completed without incident on the 2 September. The following day we carried out the tows in Southampton Water, including deep-water channel. On 4 September the day was devoted to fi shing for commercial bass for tagging and 11 tows were completed. The fi shing gear was unloaded at Warsash Marina and staff returned to Lowestoft on 5 September.
— 1 —
14 15
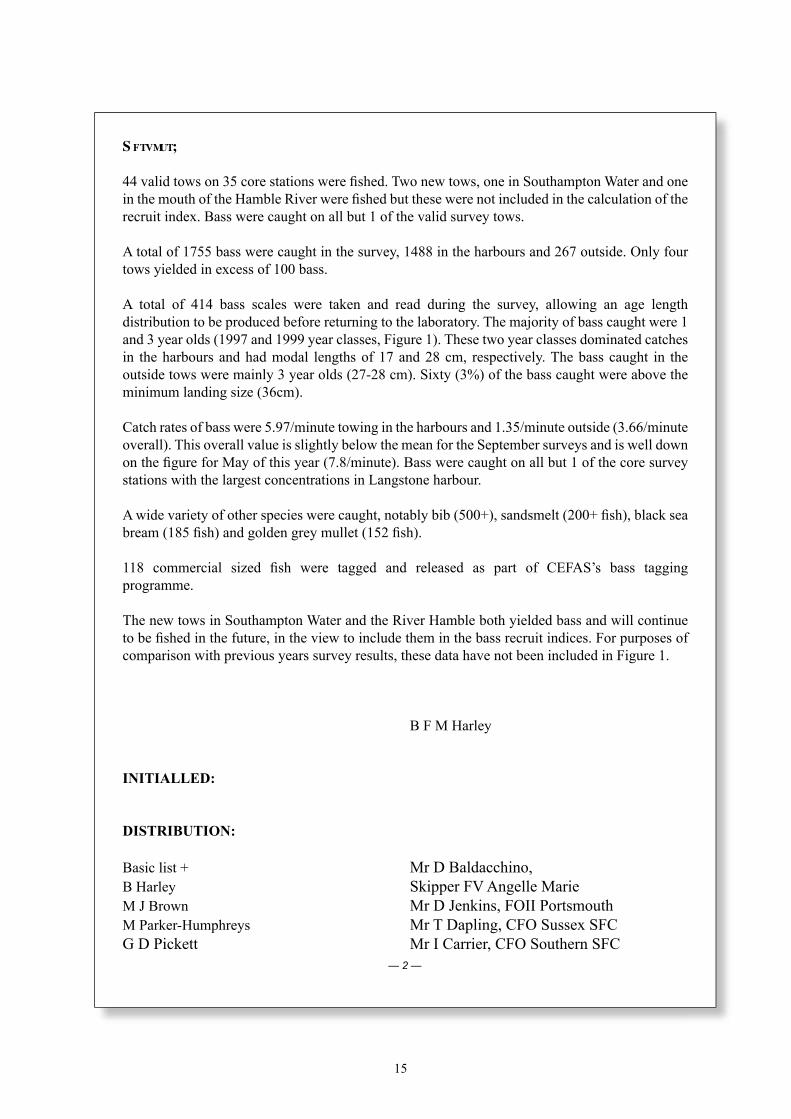
S FTVMUT;
44 valid tows on 35 core stations were fi shed. Two new tows, one in Southampton Water and one in the mouth of the Hamble River were fi shed but these were not included in the calculation of the recruit index. Bass were caught on all but 1 of the valid survey tows.
A total of 1755 bass were caught in the survey, 1488 in the harbours and 267 outside. Only four tows yielded in excess of 100 bass.
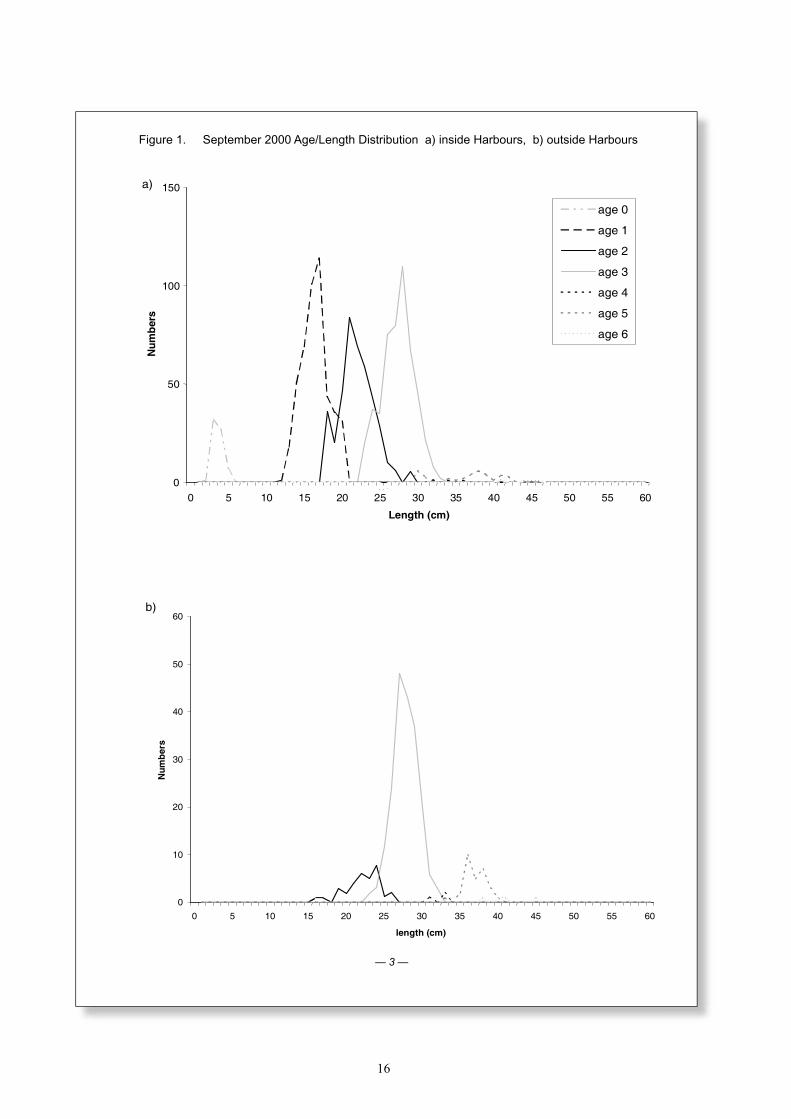
A total of 414 bass scales were taken and read during the survey, allowing an age length distribution to be produced before returning to the laboratory. The majority of bass caught were 1 and 3 year olds (1997 and 1999 year classes, Figure 1). These two year classes dominated catches in the harbours and had modal lengths of 17 and 28 cm, respectively. The bass caught in the outside tows were mainly 3 year olds (27-28 cm). Sixty (3%) of the bass caught were above the minimum landing size (36cm).
Catch rates of bass were 5.97/minute towing in the harbours and 1.35/minute outside (3.66/minute overall). This overall value is slightly below the mean for the September surveys and is well down on the fi gure for May of this year (7.8/minute). Bass were caught on all but 1 of the core survey stations with the largest concentrations in Langstone harbour. A wide variety of other species were caught, notably bib (500+), sandsmelt (200+ fi sh), black sea bream (185 fi sh) and golden grey mullet (152 fi sh).
118 commercial sized fi sh were tagged and released as part of CEFAS’s bass tagging programme.
The new tows in Southampton Water and the River Hamble both yielded bass and will continue to be fi shed in the future, in the view to include them in the bass recruit indices. For purposes of comparison with previous years survey results, these data have not been included in Figure 1.
B F M Harley
INITIALLED:
DISTRIBUTION:
Basic list + Mr D Baldacchino, B Harley Skipper FV Angelle MarieM J Brown Mr D Jenkins, FOII PortsmouthM Parker-Humphreys Mr T Dapling, CFO Sussex SFCG D Pickett Mr I Carrier, CFO Southern SFC
— 2 —
16
Figure 1. September 2000 Age/Length Distribution a) inside Harbours, b) outside harbours
0
50
100
150
0 5 10 15 20 25 30 35 40 45 50 55 60
Length (cm)
Num
bers
age 0
age 1
age 2
age 3
age 4
age 5
age 6
0
10
20
30
40
50
60
0 5 10 15 20 25 30 35 40 45 50 55 60
length (cm)
Num
bers
a)
b)
Figure 1. September 2000 Age/Length Distribution a) inside Harbours, b) outside Harbours
— 3 —