Embed Size (px)
Citation preview
The global magazine for hydrographywww.hydro-international.com
Volume 25 | issue 1 | 2021
Automatic Shipwreck Detection in Bathymetry Data
Open-source Software and Hydrographic Survey Data
Surveying the Arctic by Sailboat
Bathymetric Mapping of the High Arctic for Ocean Modelling and Charting
01_cover.indd 1 18-03-21 13:55

Never lose track of your AUV.
Omnidirectional tracking of subsea vehicles and towfish
200°
From extremely shallow waters
NEW GAPS M5 USBL SYSTEMGaps M5 offers an export-free, pre-calibrated positioning and communication solution for the tracking of subsea vehicles and towfish. Its telemetry feature allows for AUV control & command, INS recalibration, as well as efficient data retrieval.
To medium water depth(995 m)
NEW

Hydro INTERNATIONAL | ISSUE 1 2021 | 3
CONTENTS
P. 5 Editorial P. 6 Headlines P. 23 GEBCO/IHO
The global magazine for hydrographywww.hydro-international.com
Volume 25 | issue 1 | 2021
Automatic Shipwreck Detection in Bathymetry Data
Open-source Software and Hydrographic Survey Data
Surveying the Arctic by Sailboat
Bathymetric Mapping of the High Arctic for Ocean Modelling and Charting
01_cover.indd 1 18-03-21 13:55
Hydro International is an independent international magazine published six times a year by Geomares. The magazine and related e-newsletter inform worldwide professional, industrial and governmental readers of the latest news and developments in the hydrographic, surveying, marine cartographic and geomatics world. Hydro International encompasses all aspects, activities and equipment related to the acquisition, processing, presentation, control and management of hydrographic and surveying-related activities.
GeomaresP.O. Box 112, 8530 AC Lemmer, The NetherlandsPhone: +31 (0) 514 56 18 54E-mail: [email protected] Website: www.geomares-marketing.com
No material may be reproduced in whole or in part without written permission from Geomares. Copyright © 2021, Geomares, The NetherlandsAll rights reserved. ISSN 1385-4569
Director Strategy & Business Development: Durk HaarsmaFinancial Director: Meine van der BijlEditorial Board: Huibert-Jan Lekkerkerk, Mark Pronk, BSc, Marck Smit, Auke van der WerfContent Manager: Wim van Wegen Copy Editors: Serena Lyon and Claire KoersMarketing Advisor: Feline van HettemaCirculation Manager: Adrian HollandDesign: ZeeDesign, Witmarsum, www.zeedesign.nl
AdvertisementsInformation about advertising and deadlines are available in the Media Planner. For more information please contact our marketing advisor ([email protected]) or go to www.geomares-marketing.com.
SubscriptionHydro International is available bi-monthly on a subscription basis. You can subscribe at any time via https://www.hydro-international.com/subscribe. Subscriptions will be automatically renewed upon expiry, unless Geomares receives written notification of cancellation at least 60 days before the expiry date.
Editorial ContributionsAll material submitted to the publisher (Geomares) and relating to Hydro International will be treated as unconditionally assigned for publication under copyright subject to the Editor’s unrestricted right to edit and offer editorial comment. Geomares assumes no responsibility for unsolicited material or for the accuracy of information thus received. In addition, Geomares assumes no obligation for return postage of material if not explicitly requested. Contributions must be sent to the content manager [email protected].
Cover StoryThe front cover of this edition of Hydro International shows a bathymetric
map of offshore northern California, revealing seafl oor features and
submarine canyons. (Image courtesy: Jenna Hill USGS Pacifi c Coastal
and Marine Science Center)
P. 10 Automatic Shipwreck Detection in Bathymetry Data Machine learning, AI and other computerized methods of analysing imagery
have made incredible strides possible in many research areas. Algorithms
have been devised to locate everything from buildings, roads and people to
more specifi c objects like aeroplanes, ships and animals. Archaeologists, too,
have begun using AI to locate ancient settlements. Recent research shows
how the use of such automated methods can help reveal a seascape of
human history sunk at the bottom of the ocean.
P. 14 Surveying the Arctic by Sailboat Bathymetric soundings in the Canadian Arctic are sparse, especially in the
High Arctic (>75°N), where large sections of coast and the continental shelf
are completely uncharted. The lack of accurate bathymetry severely limits
the accuracy of ocean circulation models and the understanding of how
marine-terminating glaciers in the region will respond to a rapidly changing
ocean climate.
P. 18 What is GNSS Spoofi ng? The survey and mapping industry has been benefi ting for years from GPS/
GNSS precise positioning technology. While GNSS spoofi ng is recognized as
a real threat for unmanned aerial vehicles (UAVs or ‘drones’), its infl uence on
survey and mapping equipment is still underestimated. Reliable data capture
is important across various mapping use cases, from man-based surveying
and mobile mapping all the way to UAV photogrammetry.
P. 21 Open-source Software and Hydrographic Survey Data In this present age of data collection and technological refi nement,
hydrographers and data processors are expected to produce high-quality
deliverables with a swift turnaround. However, the cost of proprietary
commercial software processing programmes has excluded many smaller
contractors in the past. Such programmes incorporate fi nely tuned tool suites
and nested algorithms that have been distilled and polished over the years.
However, the fi nancial hurdles are not as high as the passion and love that
these individuals carry for this explorative industry and, thankfully,
open-source resources and collective intelligence are changing the game.
P. 24 The Titanic Disaster and Its Aftermath In the night of 14 April 1912, the unthinkable happened. The mightiest ship
afl oat, the brand-new White Star Line ship Titanic, was on its maiden voyage
from Southampton, England, to New York. The ship was advertised as
unsinkable. And, if unsinkable, why should there be adequate lifeboats for all
of the passengers and crew? The Titanic departed from Southampton on 10
April. Less than fi ve days later, it was at the bottom of the Atlantic Ocean.
More than 1,500 people perished within three hours of striking an iceberg,
which ripped the bottom out of the ship.
03_contents.indd 3 18-03-21 14:38
TRUST YOUR POSITION
Solutions for Hydrographic Survey and Marine Applications [email protected]
SWiFT CTD
Visit valeport.co.uk to find out more+44 (0) 1803 869292 [email protected]
Measured CTD, with all the benefits of the SWiFTCTD & Environmental • Current • Echosounders & Bathymetry • Sound Velocity • Tide and WaveA U V R O V & A S V H Y D R O G R A P H Y H Y D R O M E T R Y M E T R O L O G Y & P O S I T I O N I N G O C E A N O G R A P H Y P O R T S , H A R B O U R S & D R E D G I N G R E N E W A B L E E N E R G Y
_04_Hydro_1-2021_LIJNTJE.indd 6 16-03-21 09:15

Hydro INTERNATIONAL | ISSUE 1 2021 | 5
EDITORIAL
Applanix 4Blueprint 7Evologics 28
iXblue 2RIEGL 9Saab Seaeye 27
SBG Systems 16Valeport 4Teledyne 16
The Democratization of Remote SensingIt must have been more than 20 years ago that I entered into a fi erce argument with a colleague. The basis of that argument was partially semantic, but also due to a fundamental issue. The terms in question were ‘GIS’ and ‘remote sensing’. As to the former, I argued that every hydrographic package is in fact a GIS package. It may not have all the functionality, but when I started doing ‘real’ GIS my previous experience helped me tremendously… however, I did not win that argument (that day).
As to remote sensing, I suggested that hydrography is one of the oldest types of remote sensing in the world, and was laughed at. The reason given was that remote sensing involves planes and satellites. My counterargument was that if we look at the semantics, it is actually defi ned as sensing something without touching it, which is what geodesy does with angles and distances. In hydrography, the echo sounder gave us remote sensing as early as the 1920s. I didn’t want to mention lead and line, but that was quite remote too of course.
Aerial photography was even earlier and can be traced back to the mid-1900s. It became fully fl edged in the early 1900s, right alongside the echo sounder in hydrography. And it is not ‘just’ the depths; we also collect intensity information (backscatter) and process that to learn about the materials. What is the difference with a satellite observing the return strength for a part of the light spectrum? This becomes obvious when we teach students about systems such as the multibeam echo sounder, scanning profi ler and Lidar. Disregarding the energy source, the acquisition and processing are very similar. So, in my book, every hydrographic surveyor is engaged in remote sensing.
However, even in hydrography we have one subject that does not require any semantic discussion at all: bathymetric Lidar. In fact, we could start a new discussion because terrestrial Lidar has gone deep as well. In the offshore world, the use of ‘underwater Lidar’ is increasingly customary for precise engineering surveys, replacing traditional techniques such as the scanning profi ler for short distance measurements. However, that is not the Lidar I’m referring to.
Bathymetric Lidar bridges the gap between terrestrial Lidar and underwater Lidar. Just like a regular Lidar system, it uses light, and it measures depths from above the water. It is therefore the only system that penetrates the water surface to obtain measurements. Deployed
from an aircraft (helicopter, aeroplane or even a UAV), it emits a single green laser beam which, using a rotating mirror, it sweeps across a swath. Depending on the system, the fi rst return is used to determine the water level and the deepest return the bottom, and the difference between the two gives the raw depth range. Alternatively, a separate red laser beam is used to track the water level. This data then needs to be converted to chart datum using an RTK system or tidal measurements. Sounds familiar? Yes, just like the scanning profi ler…
Bathymetric Lidar is popular in areas where the water is clear. In more turbid waters, the range is limited to a few times the ‘Secchi’ depth. For a long time, a dedicated aircraft was needed to conduct bathymetric Lidar. However, Lidar units have become smaller over the years. The newer models weigh less than 5kg and have their own internal battery to sustain them for up to one hour of measurements, assuming that the UAV can last that long on its own battery. Attaching the Lidar units to a UAV makes it much easier to deploy them, although the UAVs are quite large and therefore require specifi c licences to operate (if allowed at all in an area).
Want to reduce the cost of your surveys? Get a camera-equipped UAV and start doing photogrammetry (yes, we are going full circle here) of the water bottom. Over the past few years, camera-equipped UAVs have become much smaller and cheaper and the cameras much better. Slightly lagging behind is the processing software, which is still mainly geared towards terrestrial photogrammetry. But we are getting there. Where terrestrial Lidar is concerned, software such as OpenDroneMap means that anyone with a few hundred euros to spare can start making 3D models of their surroundings (provided there are no fl ight restrictions). Perhaps, in a few years, the same will be possible for our shallow (and clear) waters?
Huibert-Jan Lekkerkerk, technical editor info@hydrografi e.info
ADVERTISERS
Huibert-Jan Lekkerkerk.
05_editorial.indd 5 18-03-21 14:38

| Issue 1 2021 | Hydro InternatIonal6
Headlines
Airborne Lidar Survey to Create 3D Map of Northern Ireland’s Coastline
Bluesky International will use
aircraft-mounted Lidar sensors to
create a highly detailed 3D map of
the whole of the Northern Ireland
coastline. The Bluesky data will form
part of the wider Northern Ireland
3D Coastal Survey; extending
into the marine environment with
a satellite-derived bathymetric
survey and a pilot bathymetric
Lidar survey. In combination, these surveys will inform the development of
future coastal management policies. Working on behalf of the Department of
Agriculture, Environment and Rural Affairs (DAERA), the Lidar survey will be
used to create the first-ever complete baseline, which it is hoped will underpin
recording of coastal change and help to identify the rate at which the coastline
is changing as a result of climate change. In addition to the Lidar data, Bluesky
will simultaneously capture highly detailed aerial photography which will be
processed to produce a fully orthorectified, ten-centimetre-resolution database.
https://bit.ly/3sWeD9u
Ocean Infinity Acquires MMT Ocean Infinity
and MMT have
announced an
acquisition that
brings together
MMT’s deep
expertise and
established
track record as
a distinguished
marine survey
and data analytics
provider and Ocean Infinity’s renowned robotic technology and operational
expertise. The combined force will maximize the potential of Ocean Infinity’s
fleet of autonomous underwater vehicles (AUVs) and the soon-to-be-launched
Armada fleet of uncrewed, low-emission robotic ships. The company will
be premium placed to support its international clients’ data acquisition
requirements, working across multiple sectors including energy, subsea cables,
government and defence. Following the acquisition by Ocean Infinity, MMT
will continue to operate under the MMT brand. The enlarged group will have a
headcount of over 300 people and will operate from an expanded geographical
footprint with offices in the US, Sweden, UK, Singapore and Norway.
https://bit.ly/2OxRhYG
NOAA Begins Transition Exclusively to Electronic Navigational Charts
NOAA will begin to implement its
sunset plan for paper nautical
charts this month, starting with
the current paper chart 18665 of
Lake Tahoe. After August,
NOAA’s electronic navigational
chart will be the only NOAA
nautical chart of the area. This is
the first traditional paper chart to
be fully supplanted by an
electronic chart as part of NOAA’s
Office of Coast Survey Raster
Sunset Plan, which includes a new process to notify mariners of the transition
from individual paper charts to electronic charts. These charts are easier to
update and maintain, keeping mariners safer with up-to-date information on
marine hazards. NOAA announced the start of a five-year process to end
traditional paper nautical chart production in late 2019 via a Federal Register
Notice. While NOAA is sunsetting its traditional nautical chart products, it is
undertaking a major effort to improve the data consistency and provide larger
scale coverage within its electronic navigational chart product suite.
https://bit.ly/30ktRsrBuilding National Hydrographic Capabilities in Albania
Modern official electronic
nautical charts of the entire
coast and main ports of
Albania have been produced
and made accessible to
professional shipping. The
United Nations Convention
for the Safety of Life at Sea
(SOLAS), Chapter 5,
Regulation 9, describes the
obligations for a coastal state with regards to providing hydrographic services
to mariners. In order to facilitate safe and effective international (and national)
transport of people and goods by sea, coastal states must map their waters
and issue updated nautical charts and publications in a way that provides
easy and secure access for the mariners that need them. Out of more than
150 countries with a coastline, less than half are capable of meeting
international obligations for official nautical charts themselves. In many cases,
a primary charting authority such as the United Kingdom or France fulfils
these obligations on their behalf. Since 2014, the Norwegian Mapping
Authority has been involved in supporting Albania to establish a fully
operational hydrographic office.
https://bit.ly/3cfaTsK
Lidar imagery of the coastline south of Belfast.
The online NOAA Custom Chart tool enables users to create their own paper and PDF charts from the latest NOAA ENC data.
Digital terrain model of Romano Port, Albania.
Ocean Infinity recently launched its new pioneering marine robots, the Armada fleet.
06-07-08-09_headlines.indd 6 18-03-21 14:05
Hydro InternatIonal | Issue 1 2021 | 7
MORE HEADLINES WWW.HYDRO-INTERNATIONAL.COM
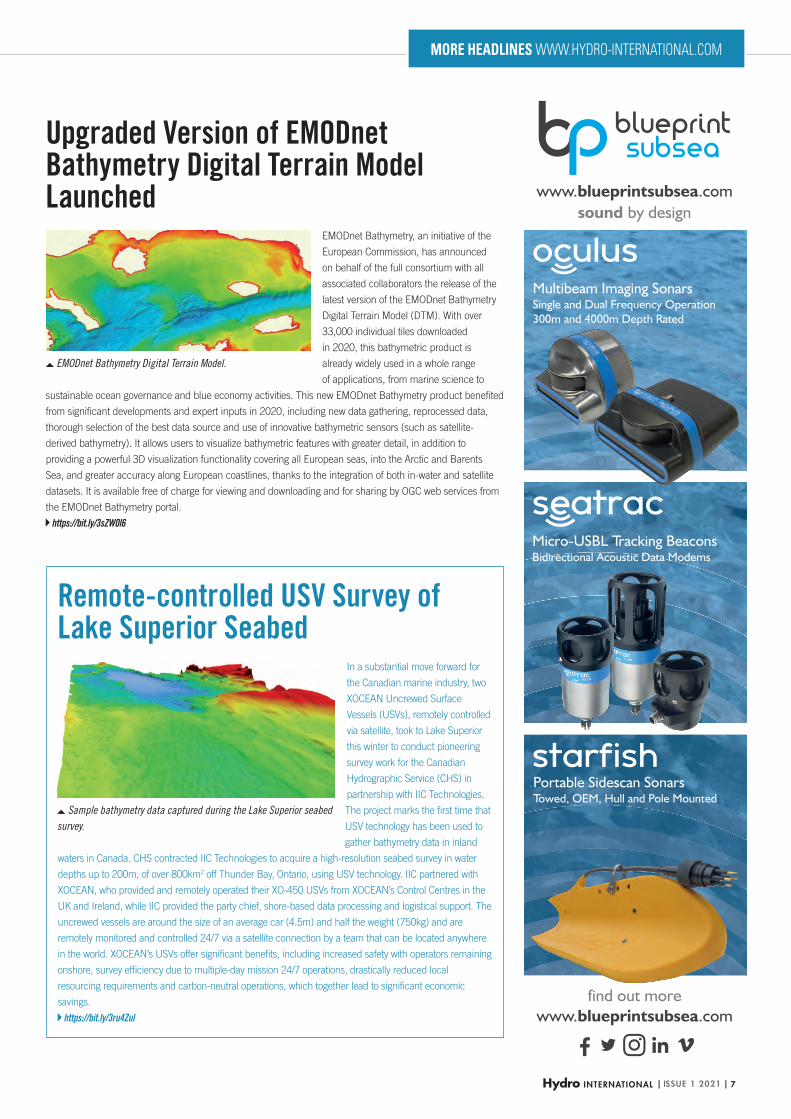
Remote-controlled USV Survey of Lake Superior Seabed
In a substantial move forward for
the Canadian marine industry, two
XOCEAN Uncrewed Surface
Vessels (USVs), remotely controlled
via satellite, took to Lake Superior
this winter to conduct pioneering
survey work for the Canadian
Hydrographic Service (CHS) in
partnership with IIC Technologies.
The project marks the fi rst time that
USV technology has been used to
gather bathymetry data in inland
waters in Canada. CHS contracted IIC Technologies to acquire a high-resolution seabed survey in water
depths up to 200m, of over 800km2 off Thunder Bay, Ontario, using USV technology. IIC partnered with
XOCEAN, who provided and remotely operated their XO-450 USVs from XOCEAN’s Control Centres in the
UK and Ireland, while IIC provided the party chief, shore-based data processing and logistical support. The
uncrewed vessels are around the size of an average car (4.5m) and half the weight (750kg) and are
remotely monitored and controlled 24/7 via a satellite connection by a team that can be located anywhere
in the world. XOCEAN’s USVs offer signifi cant benefi ts, including increased safety with operators remaining
onshore, survey effi ciency due to multiple-day mission 24/7 operations, drastically reduced local
resourcing requirements and carbon-neutral operations, which together lead to signifi cant economic
savings.
https://bit.ly/3ru4Zul
Sample bathymetry data captured during the Lake Superior seabed survey.
sound by design
www.blueprintsubsea.com
Multibeam Imaging SonarsSingle and Dual Frequency Operation300m and 4000m Depth Rated
Portable Sidescan SonarsTowed, OEM, Hull and Pole Mounted
Micro-USBL Tracking Beacons Bidirectional Acoustic Data Modems
find out morewww.blueprintsubsea.com
BlueprintSubsea HydroInternational ThirdPage-Vert Advert 2018-03 (CMYK, 300dpi)
21 March 2018 15:56:53
Upgraded Version of EMODnet Bathymetry Digital Terrain Model Launched
EMODnet Bathymetry, an initiative of the
European Commission, has announced
on behalf of the full consortium with all
associated collaborators the release of the
latest version of the EMODnet Bathymetry
Digital Terrain Model (DTM). With over
33,000 individual tiles downloaded
in 2020, this bathymetric product is
already widely used in a whole range
of applications, from marine science to
sustainable ocean governance and blue economy activities. This new EMODnet Bathymetry product benefi ted
from signifi cant developments and expert inputs in 2020, including new data gathering, reprocessed data,
thorough selection of the best data source and use of innovative bathymetric sensors (such as satellite-
derived bathymetry). It allows users to visualize bathymetric features with greater detail, in addition to
providing a powerful 3D visualization functionality covering all European seas, into the Arctic and Barents
Sea, and greater accuracy along European coastlines, thanks to the integration of both in-water and satellite
datasets. It is available free of charge for viewing and downloading and for sharing by OGC web services from
the EMODnet Bathymetry portal.
https://bit.ly/3sZW0l6
EMODnet Bathymetry Digital Terrain Model.
06-07-08-09_headlines.indd 7 18-03-21 14:05

| Issue 1 2021 | Hydro InternatIonal8
Headlines
Lebanon Newest Member of IHO
Lebanon has joined the
International Hydrographic
Organization. By becoming
its 94th Member State,
Lebanon will benefit
from the organization’s
resources and expertise in
order to improve safety of
navigation and contribute
to the development of its
maritime activities. Beirut
harbour is very important
for this coastal state, as
a strategic gateway for
trade and the provision
of goods. After the explosion which rocked the capital on 4 August 2020,
the seabed around the port was altered. A team of Lebanese hydrographers
resurveyed the port to reopen and enable ships carrying supplies and materials
for reconstruction to safely enter.
https://bit.ly/3bsrcDH
EU and China Enter Marine Data Partnership
This month, EU-China
collaborations on marine data
and knowledge sharing have
taken a new step forward with
the signing of a Memorandum
of Understanding (MoU)
between the European
Marine Observation and
Data Network (EMODnet)
and the National Marine
Data and Information Service
(NMDIS) of China. The
agreement consolidates the operational, technical and scientific collaboration
which is already well underway, by providing a clear framework to advance the
joint efforts through the EMOD-PACE and CEMDNET projects on three specific
areas of collaboration: (i) the sharing of available in situ, earth observation
and modelled marine data, (ii) the exchange of knowledge and best practices
related to marine data and information product R&D and associated technology,
and (iii) the development and implementation of common work plans between
NMDIS and EMODnet in relation to ocean reanalysis, seabed habitat mapping,
ecological vulnerability and coastal zone adaptation.
https://bit.ly/3vcxDmf
Kongsberg Maritime to Launch Next-generation HUGIN Endurance AUV
Kongsberg Maritime
has announced the
next generation of its
advanced HUGIN
Autonomous
Underwater Vehicle
(AUV). Named
HUGIN Endurance,
the new AUV boosts
operational duration
to approximately 15
days, enabling
extended survey and inspection missions far from shore. This longevity allows
HUGIN Endurance to undertake extensive missions without the support of a
mother ship. Shore-to-shore operations offer the opportunity to reduce the
carbon footprint for commercial activities and yet retain unrivalled data
resolution and accuracy. With this in mind, Kongsberg has added its Maritime
Broadband Radio (MBR) communications system to HUGIN Endurance’s
payload, allowing it to surface and share large quantities of data swiftly with
any suitably equipped installation, such as another vessel, a shore station or a
wind turbine fitted with an MBR antenna.
https://bit.ly/3efRhHT
GeoAcoustics Returns to Independent Ownership
GeoAcoustics has
returned to
independent ownership
following divestment
from the Norwegian
multinational
Kongsberg Maritime
AS. Kongsberg
originally acquired the
company in 2008 and
it has been a part of the
Sensors & Robotics business area. Based in Great Yarmouth in the United
Kingdom, GeoAcoustics has been manufacturing marine survey equipment
for more than 42 years, and it is a world-leading manufacturer of sonar survey
systems for engineering, geophysics and naval survey applications. Principle
product lines are swath bathymetry systems for shallow waters, side-scan
sonars and sub-bottom profilers. GeoAcoustics’ general manager Dr Richard
Dowdeswell commented: “This is an exciting chapter in the history of
GeoAcoustics and we are looking forward to expanding our global reach
through the introduction of new channel partners as well as bringing new
products to market”.
https://bit.ly/2Of8PJk
Lebanon’s recently established hydrographic office resurveyed Beirut port following the explosion in August 2020. (Courtesy: Lebanese Navy Hydrographic Service)
Kongsberg Maritime’s new HUGIN Endurance AUV can map up to 1,100 square kilometres on a single mission.
GeoAcoustics GeoPulse sub-bottom profiler.
Xiang Wenxi (NMDIS) and Jan-Bart Calewaert (EMODnet) signing the EU-China MoU.
06-07-08-09_headlines.indd 8 18-03-21 14:05
Hydro InternatIonal | Issue 1 2021 | 9
MORE HEADLINES WWW.HYDRO-INTERNATIONAL.COM
EFFICIENT HIGH RESOLUTION UAV COASTLINE or SHALLOW WATER SURVEYING
Austria | USA | Japan | China | RIEGL WORLDWIDE | Australia | Canada | United Kingdom
newsroom.riegl.international
Explore the full portfolio of proven RIEGL LiDAR sensors and systems www.riegl.com
TOPO-BATHYMETRIC UAV LASER SCANNER
• ideally suited for integration on UAVs and helicopters
• green laser providing more than 2 Secchi depths water penetration
• measurement rate 50 kHz - 200 kHz
• integrated inertial navigation system and digital camera
The RIEGL VQ-840-G Airborne Laser Scanner for Topo-Bathymetric Surveying!
WATCH OUR VIDEO
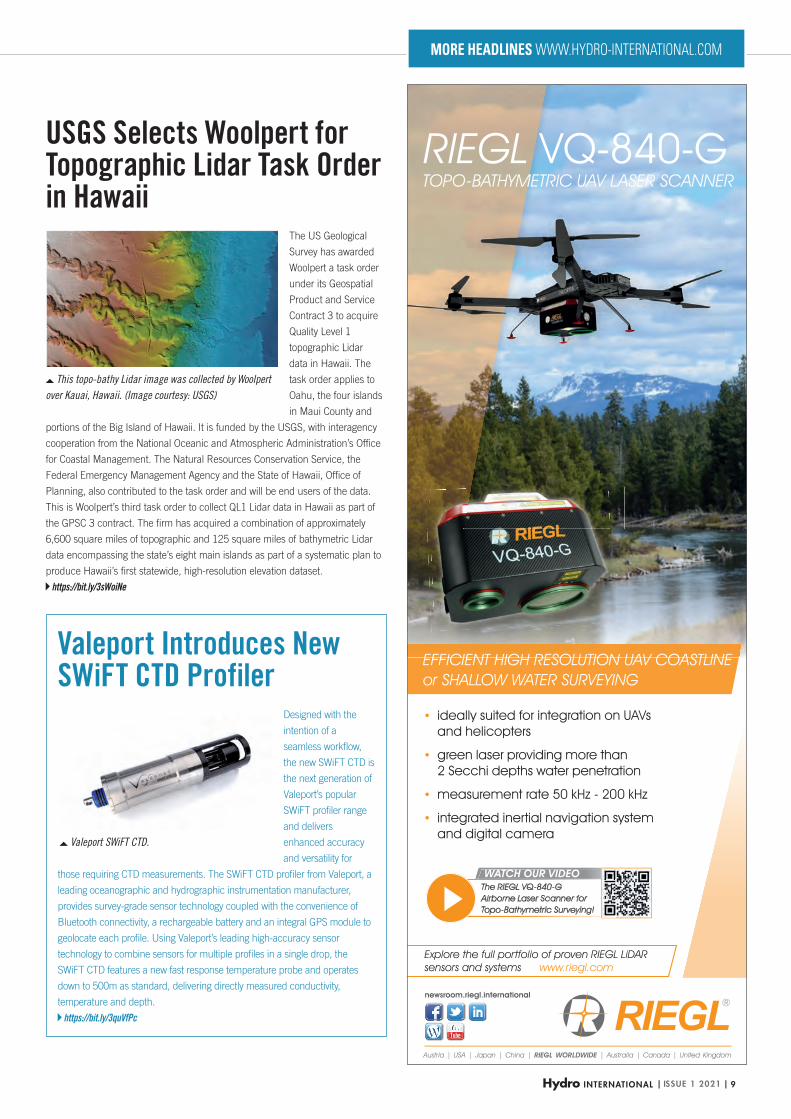
USGS Selects Woolpert for Topographic Lidar Task Order in Hawaii
The US Geological
Survey has awarded
Woolpert a task order
under its Geospatial
Product and Service
Contract 3 to acquire
Quality Level 1
topographic Lidar
data in Hawaii. The
task order applies to
Oahu, the four islands
in Maui County and
portions of the Big Island of Hawaii. It is funded by the USGS, with interagency
cooperation from the National Oceanic and Atmospheric Administration’s Offi ce
for Coastal Management. The Natural Resources Conservation Service, the
Federal Emergency Management Agency and the State of Hawaii, Offi ce of
Planning, also contributed to the task order and will be end users of the data.
This is Woolpert’s third task order to collect QL1 Lidar data in Hawaii as part of
the GPSC 3 contract. The fi rm has acquired a combination of approximately
6,600 square miles of topographic and 125 square miles of bathymetric Lidar
data encompassing the state’s eight main islands as part of a systematic plan to
produce Hawaii’s fi rst statewide, high-resolution elevation dataset.
https://bit.ly/3sWoiNe
Valeport Introduces New SWiFT CTD Profiler
Designed with the
intention of a
seamless workfl ow,
the new SWiFT CTD is
the next generation of
Valeport’s popular
SWiFT profi ler range
and delivers
enhanced accuracy
and versatility for
those requiring CTD measurements. The SWiFT CTD profi ler from Valeport, a
leading oceanographic and hydrographic instrumentation manufacturer,
provides survey-grade sensor technology coupled with the convenience of
Bluetooth connectivity, a rechargeable battery and an integral GPS module to
geolocate each profi le. Using Valeport’s leading high-accuracy sensor
technology to combine sensors for multiple profi les in a single drop, the
SWiFT CTD features a new fast response temperature probe and operates
down to 500m as standard, delivering directly measured conductivity,
temperature and depth.
https://bit.ly/3quVfPc
Valeport SWiFT CTD.
This topo-bathy Lidar image was collected by Woolpert over Kauai, Hawaii. (Image courtesy: USGS)
06-07-08-09_headlines.indd 9 18-03-21 14:05

| Issue 1 2021 | Hydro InternatIonal10
Machine learning, AI and other computerized
methods of analysing imagery have made
incredible strides possible in many research
areas. Algorithms have been devised to locate
everything from buildings, roads and people to
more specific objects like aeroplanes, ships and
animals. Archaeologists, too, have begun using
AI to locate ancient settlements. Recent
research shows how the use of such automated
methods can help reveal a seascape of human
history sunk at the bottom of the ocean.
Bathymetry and Shipwreck archaeologyResearchers have used bathymetric datasets to
locate everything from ancient Roman and
Greek vessels to World War II aircraft carriers.
Technical studies of specific bathymetric data
types have shown that shipwrecks can be
identified in high-resolution imagery, but smaller
or highly damaged wrecks are not as easy to
locate. While most shipwreck archaeology has
used bathymetric datasets produced by sonar
and radar instruments, which are collected from
boats or submerged vessels, some researchers
have utilized bathymetric datasets collected
from the air, specifically Lidar.
Lidar (light detection and ranging) data,
collected using pulses of light to record 3D
surfaces, has made headlines within
archaeology for its ability to detect cities hidden
under jungle and forest canopies. However,
there are actually two kinds of Lidar data:
topographic Lidar (which is used to locate
features on land), and bathymetric Lidar (which
can penetrate water and map shallow ocean
floors). Archaeologists have used bathymetric
Lidar to detect shipwrecks in shallow waters
around the world. One limitation of Lidar,
however, is that the water must be calm and
clear for proper data collection.
the ‘Big data’ proBlem and Underwater archaeologyThe use of 3D data like bathymetry and
topography has improved researchers’ ability to
detect objects in image datasets. Shipwrecks,
which appear as mounds at the ocean’s bottom,
can therefore be identified based on their depth
compared to the surrounding ocean floor.
Archaeologists have long been interested in shipwrecks. These sites can tell us about ancient transportation and trading
routes, technological innovations and cultural exchanges over thousands of years. Documenting shipwrecks can be a
difficult task, however. With breakthroughs in remote sensing technology (specifically sonar and radar), researchers have
been able to acquire highly resolved maps of ocean floors. Consequently, we can also locate cultural objects – like
shipwrecks – sitting on the bottom of oceans, lakes and other bodies of water.
Automatic Shipwreck Detection in Bathymetry Data
Hydrological Algorithms Help to Uncover Sunken History
Figure 1: Shipwrecks visible in bathymetric data from the National Oceanic and Atmospheric Administration in the United States. Arrows highlight some of the larger visible shipwrecks. (Credit: Dylan Davis, Danielle Buffa & Amy Wrobleski (2020). Source: https://doi.org/10.3390/heritage3020022.)
Feature | dylan daviS, dani BUffa, amy wroBleSki
10-11-13_featuredavis.indd 10 18-03-21 14:26

Hydro international | issue 1 2021 | 11
However, the ocean is vast, and recording
shipwrecks and other features by hand is
extremely time-consuming and expensive. To
this end, there are many different methods that
can be used to automatically extract information
from images.
The use of AI and machine learning methods
have become increasingly popular as they can
be extremely precise, but these methods are
also very complicated and require high levels of
processing power to implement. There are also
other methods of pattern recognition that use a
variety of object characteristics to create
expectations for a computer to locate new
objects. These can include colour, shape,
texture, size and height, to name just a few.
Generally speaking, the greater the number of
characteristics considered in a detection
algorithm or model, the more accurate the
detection becomes. This is particularly true if
the features of interest are complex and highly
variable. Different methods have had varying
levels of success in detecting a range of feature
types. Within archaeology, for example,
automated techniques have successfully
located urban complexes in Central America,
Native American constructions in the United
States, and tens of thousands of archaeological
burial mounds and tombs across Europe and
parts of Asia. Among marine archaeologists,
however, these methods have not yet been
extensively adopted.
For automated methods like machine learning
and AI to work, image data must be at a fine
enough resolution to detect patterns related to
the target of interest. For example, to locate a
sunken cruise liner, your data resolution can be
lower than if you are looking for a canoe or
kayak. For a cruise liner, your data resolution
can be lower because the object is large and
easy to spot, even if the imagery is not highly
detailed. In contrast, something small, like a
canoe or kayak, needs finely grained data to
keep it from blending into the noise of
coarser-grained datasets. In several countries
around the world, including the United States
and the United Kingdom, high-resolution
bathymetric data (like sonar, radar and Lidar) is
widely available. This data can allow researchers
to develop automated methods for locating
shipwrecks, many of which can have historical
or archaeological significance (Figure 1).
Sinkhole algorithmS and Ship-wreck detectionBecause intact shipwrecks show up as mounds
or lumps on the ocean floor, one particularly
simple way to try and automate their detection is
to use sinkhole extraction algorithms. These
methods were originally developed by
hydrographers to locate watersheds, sinkholes
and other concave topographic features. In
some of our recent research, we used a
sinkhole extraction algorithm developed by
geographers to detect shipwrecks located in up
to 50m of water. To use these methods to locate
‘mounded’ features, you just need to invert the
bathymetric data to turn ‘mounds’ into ‘sinks’
(Figure 2). In this way, shipwrecks become
sinkholes that the algorithm can identify (Figure
3).
Using this inversed sinkhole method,
shipwrecks can be systematically identified in
vast bathymetric datasets. Because the method
is reproducible, researchers can use it on any
dataset from any location and different
researchers will produce identical results. This
also helps to make research more reliable by
limiting potential errors introduced by individual
analysts. Especially considering the vastness of
submerged areas around the world, a
time-effective, reproducible method is important
for underwater investigations. This is especially
relevant for underwater archaeological work
because submerged cultural heritage must be
recorded before it is destroyed by natural and
human events.
how USefUl are aUtomated methodS?Because of their complexity and often imperfect
results, some may wonder if using these
methods is worth it. After all, if you can scan
Generally speaking, the greater the number of characteristics considered in a detection algorithm or model, the more accurate the detection becomes
Figure 2: Illustration of how inverting bathymetric data works for detecting shipwrecks. The original dataset is flipped so that a mounded wreck becomes a hollow depression. The algorithm can then ‘fill’ that depression to detect a shipwreck as if it was a sinkhole or topographic depression. (Credit: Dylan Davis.)
10-11-13_featuredavis.indd 11 18-03-21 14:26

Surveying in all watersStay informed with Hydro International
The worldwide information source with insightsand developments on hydrographic and oceanographic surveying in the industry.
www.hydro-international.com
Sign up for your free subscription to the online magazine and weekly newsletter today!

Hydro international | issue 1 2021 | 13
Dylan Davis is a PhD candidate in the Department of Anthropology at The Pennsylvania State University, USA. He earned his MA and BS in Anthropology and BA in Geography from Binghamton
University, USA.
Dani Buffa is a dual-title PhD student in the Anthropology and Climate Science programmes at The Pennsylvania State University, USA. She earned her MSc in Osteoarchaeology
from the University of Sheffield, UK, and her BA in Anthropology from the University of Maryland, USA.
Amy Wrobleski is a third-year graduate student in the Ecology programme at The Pennsylvania State University working in the Human Environmental Dynamics (HEnDy) lab. She is interested
in humans within ecological networks and is working in both Australia and the United States to examine these dynamics.
Further Reading1. Davis, D. S., Buffa, D. C., & Wrobleski, A. C. (2020).
Assessing the utility of open-access bathymetric data for shipwreck detection in the United States. Heritage, 3(2), 364-383. https://doi.org/10.3390/heritage3020022
2. Zhu, B., Wang, X., Chu, Z., Yang, Y., & Shi, J. (2019). Active learning for recognition of shipwreck target in side-scan sonar image. Remote Sensing, 11(3), 243. https://doi.org/10.3390/rs11030243
3. Janowski, L., Kubacka, M., Pydyn, A., Popek, M., & Gajewski, L. (2021). From acoustics to underwater archaeology: Deep investigation of a shallow lake using high-resolution hydroacoustics—The case of Lake Lednica, Poland. Archaeometry, arcm.12663. https://doi.org/10.1111/arcm.12663
through data and pick out shipwrecks perfectly
in a couple of hours, why take all that time to
train a model? Without a doubt, for researchers
focusing on a limited study area, automation
may not represent great use of their limited
time. However, if the scale of a research project
is larger – perhaps ocean-wide, or regional
covering thousands of miles of coastline and
open water – then the speed at which
automated methods can conduct a preliminary
evaluation of the data makes them worth the
effort.
In an automated study of shipwreck detection
conducted in the United States, we found that a
sinkhole extraction algorithm could detect
approximately 75% of known shipwrecks within
the study region. Certainly imperfect, but a
pretty good initial attempt. What was more
impressive was that the method could locate
shipwrecks exponentially faster than human
analysis (requiring only about 3 minutes to
detect over 200 shipwreck sites). When doing
this by hand, it took us nearly 10 hours to
record that many shipwrecks. So, even though
the algorithm may have missed some
shipwrecks, it saved us hours of time, and this
is just for a small study area of about 20km2.
ConClusionRecent research has demonstrated the potential
for the automated detection of shipwrecks using
mathematical models. This work promises to
rapidly expand the capacity of researchers to
investigate the ocean floor for remnants of
human history. The archaeological record is
fragile and, once lost, this information can never
be recovered. For submerged capsules of
human history, improving our ability to detect
and monitor these sites is an important
undertaking, and one which computer
automation is well suited to assist in.
For those interested in using automated
methods for shipwreck (or other object)
detection, there are many tools available within
GIS systems (including open source platforms
like QGIS, WhiteBox GAT and SAGA, among
others), as well as some online tutorials using
ArcGIS Pro and deep learning.
Figure 3: Example of detected shipwreck locations in the United States using sinkhole extraction algorithms. Credit: Dylan Davis, Danielle Buffa & Amy Wrobleski (2020). (Source: https://doi.org/10.3390/heritage3020022.)
The method could locate shipwrecks exponentially faster than human analysis (3 minutes to detect over 200 shipwreck sites)
10-11-13_featuredavis.indd 13 18-03-21 14:26

| Issue 1 2021 | Hydro InternatIonal14
The Canadian High Arctic is undergoing some
of the most rapid climate forcing on the planet,
with regional air temperatures increasing at
twice the global average. Accelerated melting of
the extensive ice fields and glaciers of the
Canadian Arctic Archipelago (CAA) has led it to
be the largest contributor to global sea-level rise
outside of Greenland and Antarctica. Climate
forcing by atmospheric warming, however, is
only one part of the equation. Glacier mass loss
by calving of icebergs and submarine melting
driven by warm ocean water is another key
factor, yet these glacier-ocean interactions
remain largely unstudied in the CAA.
Marine-terminating glaciers also change ocean
properties by reducing water temperatures and
releasing fresh water into the ocean, altering
ocean stratification and circulation.
Understanding these feedback mechanisms is
critical to the prediction of future glacial
contributions to sea-level rise and the ocean’s
response to climate forcing. However, the
accuracy of predictions is fundamentally limited
by knowledge of the geometry of the problem.
GEOMETRICAL CONSTRAINTSThe geometrical constraints on glacier-ocean
interactions are numerous:
1) the height and topography of the submerged
portion of the glacier face determine the area
subject to submarine melting;
2) the depth of the seabed at the glacier
grounding line defines the depth of freshwater
discharge into a fjord and buoyancy-driven fjord
circulation as well as the properties of ocean
water in contact with the ice (water temperatures
generally increase with depth in the Arctic);
3) the bathymetry of the receiving fjord
influences the vertical distribution of water
masses that can propagate to the glacier termini
through the presence of sills and shoals; and
4) the topography of the continental shelf
determines regional ocean circulation patterns
and the properties of ambient waters present at
fjord mouths via deep troughs that cut across
the continental shelf.
At present, most fjords and vast sections of the
continental shelf in the CAA remain uncharted,
owing largely to the region’s harsh climate and
inaccessible ice-covered seas. Therefore, existing
bathymetric grids of the CAA underlying
state-of-the-art ocean circulation models are based
on interpolations between very sparse soundings.
The models then fail to capture the complexities of
seabed topography and its influence on ocean
circulation, water mass transformation and
glacier-ocean interactions. There is a strong need
to develop new cost-effective mapping
programmes in the High Arctic to improve data
coverage, particularly in the shallow uncharted
nearshore areas that larger vessels with deep draft
are unable to access safely.
INNOvATIvE RESEARCh PROGRAMMEIn 2019, the Canadian Glacier-Ocean-Iceberg
Dynamics in a Changing Canadian Arctic
(GO-Ice) project began with the goal of better
understanding glacier-ocean interactions in the
CAA. A key objective of the project is to survey
previously uncharted coastal regions,
particularly the glacial fjords and coastline of
south-east Ellesmere Island and north-east
Bathymetric soundings in the Canadian Arctic are sparse, especially in the High Arctic (>75°N), where large sections of
coast and the continental shelf are completely uncharted. The lack of accurate bathymetry severely limits the accuracy of
ocean circulation models and the understanding of how marine-terminating glaciers in the region will respond to a rapidly
changing ocean climate.
Surveying the Arctic by SailboatBathymetric Mapping of the High Arctic for Ocean Modelling and Charting
Feature | By ANdREw K. hAMILTON and GAbRIEL JOyAL, Canada
Photo 1: A marine-terminating glacier on Ellesmere Island in the Canadian High Arctic (G. Joyal).
14-15-17_featurehamilton.indd 14 18-03-21 14:06

Hydro international | issue 1 2021 | 15
Devon Island (Nunavut, Canada), where
numerous marine-terminating glaciers drain into
northern Baffin Bay and Jones Sound. To
accomplish this objective, the research team
partnered with a crew of experienced Arctic
sailors aboard the 47-foot (15.3-metre) polar
sailing yacht the Vagabond. The team has spent
two seasons conducting oceanographic
research and hydrographic surveys in the CAA
from this novel platform, with the surveys
serving the dual purposes of improving ocean
model bathymetry and providing valuable data
to the Canadian Hydrographic Service (CHS) to
update nautical charts. The project has
developed as a transdisciplinary collaboration
between academics, industrial partners,
government and northern communities, and
aims to contribute to the Seabed 2030 project to
see the global ocean fully mapped by 2030.
Given the remoteness of the area and the
unknown seabed topography, the research team
chose to utilize a portable, low-power multibeam
echo sounder with a large dynamic range, the
Sonic 2026, generously provided in-kind by
industrial partner R2Sonic Inc (Texas, USA). Using
this Sonic 2026, the Vagabond mapped more
than 3,500km2 of previously uncharted waters
during the 2019 and 2020 cruises, in depths
ranging from 5m to 750m, including mapping the
vertical walls of marine-terminating glaciers.
Surveying in this remote polar environment
presents numerous challenges: a robust
pole-mounted system had to be fabricated to
withstand operation in ice-covered seas; static and
dynamic calibration of all sensors had to occur at
sea (there are no dry docks in the Canadian
Arctic); navigation data required careful
post-processing because satellite coverage is poor
at these high latitudes; numerous sound velocity
profiles were required for refraction corrections
due to highly stratified waters near glacial
meltwater plumes; and the vessel had to safely
navigate in uncharted and iceberg-strewn waters.
GLACIAL GEOMORPhOLOGyThe multibeam survey has shown impressive
early results. In an unnamed bay on south-east
Ellesmere Island, the terminus of a glacier and
adjacent seabed topography was mapped. The
data show a vertical ice face that is grounded
between 40m and 100m below sea level,
punctuated by a large subglacial channel where
fresh meltwater is discharged into the fjord at
depth. The seabed in front of the terminus
shows high relief: a submerged esker (winding
ridge of glacially deposited sediment) rises 60m
above the surrounding seafloor, and recessional
moraines (narrow ridges parallel to the ice face)
and iceberg scours mark the bed. This snapshot
provides a remarkable window into the complex
geometry of the glacier-ocean intersection that
greatly informs our understanding of the physical
processes at work in driving patterns of glacial
retreat. A repeat survey planned in 2021 will
reveal even further insight into the dynamic
nature of this complex system.
ChART PROduCTION ANd uPdATESThe utility of the survey goes beyond glacier-ocean
research and numerical modelling. The cruise
track is planned in collaboration with the CHS in
order to map high-priority uncharted waters at IHO
standards, such as those in active shipping lanes.
This collaboration is crucial to ensure safe
navigation in the ecologically sensitive High Arctic,
Photo 2: The SY Vagabond surveys iceberg waters in the Canadian High Arctic (A. Hamilton).
Photo 3: Pole-mounted Sonic 2026 installed on the polar sailboat Vagabond for surveying the uncharted waters of the Canadian High Arctic (E. Brossier). (Inset) Map of the 2019 and 2020 cruises showing multibeam surveys in red.
14-15-17_featurehamilton.indd 15 18-03-21 14:06

State-of-the-art Motion& Navigation Solution
Navsight Marine Solution Qinertia
The Next Generation INS/GNSS Post-processing Software
Cour
tesy
of C
adde
n
Making Hydrographers’ Tasks Easier
www.sbg-systems.com
CZMIL SuperNova is the next generation bathymetric/topographic lidar mapping solution from Teledyne Optech and Teledyne CARIS. Equipped with the most powerful green laser on the market, SuperNova delivers like no other.
• Best penetration of deep and turbid waters.
• Full waveform capture in multiple channels.
• Field programmable multi-mode operation for maximum performance in different environments.
• Double the point density with SmartSpacing points distribution as compared to the CZMIL Nova.
• Powered by CARIS processing and sensor fusion software.
• Comprehensive data management, visualization, analysis and information product extraction.
• Exceptional performance in coral reefs, inland waterways, beaches and deep water marine.
For more information contact sales at www.teledyneoptech.com
Teledyne OPTECH / CZMIL SuperNovaHydro International / March Issue
189 mm x 125.5 mm deep (1/2 page horizontal) / ColorFriday, February 26, 2021
Teledyne DALSA, 605 McMurray Road, Waterloo, Ontario, Canada N2V [email protected]
The choice is clear, even when the water is not: CZMIL SuperNova
Introducing the latest in bathy-topo mapping innovation from Teledyne Optech and Teledyne CARIS
_20_Hydro_1-2021_LIJNTJE.indd 6 18-03-21 11:14

Hydro international | issue 1 2021 | 17
Andrew K. Hamilton is a postdoctoral fellow at the University of Alberta studying glacier-ocean interactions in the Canadian Arctic. He holds a PhD in environmental fluid mechanics from the
University of British Columbia, has been conducting glacier-ocean field work in the High Arctic for 14 years, and is lead scientist on the GO-Ice Vagabond research cruise. [email protected]
Gabriel Joyal is a geomatics researcher at the Centre de géomatique du Québec, a college R&D and technology transfer centre. He holds an MSc in physical geography form Université
Laval. He has been working in the Canadian Arctic for over seven years, mapping lake and sea beds as part of various research programmes including Cape Bounty Arctic Watershed Observatory (2013), ArcticNet CCGS Amundsen cruises (2014-2018) and GO-Ice (2019-2020). [email protected]
About the GO-Ice projectGlacier-Ocean-Iceberg Dynamics in a Changing Canadian Arctic is a collaborative research project led by Dr Luke Copland at the University of Ottawa and supported by ArcticNet, a Network of Centres of Excellence of Canada, to investigate the state of glaciers and oceans in the Canadian High Arctic. It aims to provide the most up-to-date monitoring of changes in glacier mass balance and ocean circulation, to better understand the atmospheric and oceanic drivers of glacier change and the impact of meltwater and a warming Arctic on ocean circulation. An interdisciplinary team of researchers utilizes an array of methodologies to address these questions, ranging from extensive field programmes at various sites across the High Arctic, to analysis of remote sensing data, numerical modelling and partnership with northern communities.
especially as marine traffic is increasing as sea ice
cover retreats. Northern communities in the CAA
are extremely dependent on annual resupply by
ship, so our efforts help, in a small part, to ensure
the safe passage of critical goods to these remote
communities.
COnClusIOns Surveying polar regions is challenging and
expensive. However, the need to map the Arctic is
critical, given the rapid changes occurring in the
polar regions and their global impacts. By
collaborating across various sectors of marine-
stakeholder communities, the Vagabond research
cruises have demonstrated how hydrographic-
quality multibeam data can be collected in remote
areas at relatively low cost through trusted
crowdsourced partners. The survey products
benefit basic climate research, improve the
capacity of federal hydrographic programmes to
map territorial waters, and contribute to the world’s
efforts to completely map the ocean floor.
Seemingly lofty goals perhaps, so why not aim for
a more sustainable world at the same time, and do
it all from a sailboat?*
*The authors readily acknowledge that the vast
majority of surveying during the Vagabond
cruises was done under engine power; however,
a few surveys were conducted under sail alone.
ACknOwledGementsThe authors are indebted to support from each
of the following individuals and organizations:
the SY Vagabond crew Eric, France, Léonie and
Aurore; Jimmy Qaapik; George Schlagintweit
(CHS); Luke Copland (UOttawa); Paul Myers
(UAlberta); Maya Bhatia (UAlberta); Jochen
Halfar (UToronto); the community of Grise Fiord,
Nunavut; the community of Arctic Bay,
Nunavut; R2Sonic Inc.; QPS; the Polar
Continental Shelf Project; National Science and
Engineering Research Council of Canada;
ArcticNet, a Network of Centres of Excellence of
Canada; and the Canadian Hydrographic
Service.
Photo 4: High-resolution multibeam data of a glacial fjord on Ellesmere Island, Canada, showing the vertical glacier wall and the complex seabed near the terminus. Improved underwater topography such as this vastly enhances efforts to accurately model glacier-ocean interactions.
Photo 5: Surveying the remote coasts of the Canadian High Arctic is a significant logistical challenge, but the data acquired by the SY Vagabond benefits fundamental research and federal charting agencies (G. Joyal).
14-15-17_featurehamilton.indd 17 18-03-21 14:06

| Issue 1 2021 | Hydro InternatIonal18
The survey and mapping industry has been
benefiting for years from GPS/GNSS precise
positioning technology. While GNSS spoofing is
recognized as a real threat for unmanned aerial
vehicles (UAVs or ‘drones’), its influence on
survey and mapping equipment is still
underestimated. Reliable data capture is
important across various mapping use cases,
from man-based surveying and mobile mapping
all the way to UAV photogrammetry. Ensuring
dependable positioning requires the use of
robust equipment, designed in such a way that
alleviates all possible vulnerabilities. The use of
GNSS receivers which are robust against
jamming and spoofing is key to trustworthy data
capture anytime, anywhere.
GPS/GNSS SPoofiNG vS jammiNGBoth jamming and spoofing are a type of GNSS
radio interference that happens when weak
GNSS signals are overpowered by stronger radio
signals on the same frequency. Jamming is a
kind of ‘white noise’ interference, causing loss of
accuracy and potentially loss of positioning. This
type of interference can come from adjacent
electronic devices or external sources such as
radio amateurs in the area. Spoofing is an
intelligent form of interference which fools the
user into thinking that he/she is in a false
location. During a spoofing attack, a radio
transmitter located nearby sends fake GPS
signals into the target receiver. For example,
even a cheap software-defined radio (SDR) can
make a smartphone believe it’s on Mount
Everest (see Figure 1)!
GNSS users are experiencing ever-more cases
of jamming, and spoofing events are on the rise
too – especially in recent years since it has
become easier and more affordable to create
malicious spoofing systems. There are plenty of
examples, from Finland – which experienced a
week-long spoofing attack in 2019 – to China
where multiple vessels have been the target of a
spoofing attack. Hence, jamming and spoofing
protection is no longer a ‘nice to have’ feature
but a critical component of a GNSS receiver.
SPoofiNG iNcideNtS are oN the riSeC4ADS, an NGO conducting data-driven analysis
of conflict and security matters, concluded that
Russia has been extensively using spoofing to
divert aerial drones from entering airspace in the
vicinity of governmental figures, airports and
ports. And some of the most enthusiastic
spoofers are fans of the augmented reality mobile
game ‘Pokémon Go’, who use SDRs to spoof
their GPS position and catch elusive Pokémon
without having to leave their rooms.
Such attacks usually target a specific receiver.
However, the spoofing transmission will actually
affect all GPS receivers in the vicinity. For
example, an SDR can affect all GPS receivers
within a 1km radius of the spoofing source, and
the signal can be amplified for further
propagation. This means that survey or
mapping jobs in densely populated areas are at
a higher risk of such ‘indirect’ spoofing attacks.
how to SPoof-Proof a receiverA spoofer can either rebroadcast GNSS signals
recorded at another place and time, or generate
and transmit modified satellite signals.
Therefore, to combat spoofing, GNSS receivers
need to be able to distinguish spoofed signals
from authentic signals. Once a satellite signal is
flagged as spoofed, it can be excluded from
positioning calculations.
There are various levels of spoofing protection
that a receiver can offer. Using the analogy of a
home intrusion detection system, it can be based
on a simple entry alarm system or a more
complex movement detection system. For added
security, the home owner could decide to install
video image recognition, breaking-glass sound
detection or a combination of the above. An
unprotected GNSS receiver is like a house with
an unlocked door; it is vulnerable to even the
simplest forms of spoofing. Secured receivers, on
the other hand, can detect spoofing by looking
for signal anomalies or by using signals designed
to prevent spoofing, such as Galileo OSNMA and
E6 or the GPS military code.
Advanced interference mitigation technologies,
such as the Septentrio AIM+, use sophisticated
With spoofing attacks on the rise, survey-grade GNSS receivers need to be protected by interference mitigation
technology utilizing the latest security techniques to ensure reliable positioning.
What is GNSS Spoofing?How Spoofing Affects Survey and Mapping
Figure 1: Even a cheap SDR can overpower GNSS signals and spoof a single-frequency smartphone GPS into believing it is on Mount Everest.
Feature | By GuStavo LoPez and maria SimSky, Septentrio
18-19_featuresimsky.indd 18 18-03-21 14:06

Hydro international | issue 1 2021 | 19
signal-processing algorithms to mitigate
jamming and flag spoofing. For spoofing
detection, AIM+ checks for various anomalies in
the GNSS signal, such as unusually high signal
power. It also works together with RAIM+
integrity algorithms to ensure range (distance to
satellite) validity by comparing range information
from various satellites. AIM+ won’t even be
fooled by an advanced GNSS signal generator,
Spirent GSS9000. Even with realistic power
levels and actual navigation data within the
signal, it can still identify it as a ‘non-authentic’
signal. Other advanced anti-spoofing techniques
such as using a dual-polarized antenna are
currently being researched.
SateLLite NaviGatioN data autheNticatioNVarious countries are investing in spoofing
resilience by building security directly into their
GNSS satellites. With Open Service Navigation
Message Authentication (OSNMA), the
European Galileo is the first satellite system to
introduce an anti-spoofing service directly on a
civil GNSS signal.
OSNMA is a free service on the Galileo E1
frequency that enables authentication of the
navigation data on Galileo. Such navigation
data carries information about satellite location
and, if altered, will result in wrong receiver
positioning computation. As a close partner of
ESA, the European GNSS manufacturer
Septentrio has been contributing to the design
and testing of the Galileo system since its
inception. Today, as the OSNMA system is
entering its testing phase, Septentrio receivers
have successfully been used to test the OSNMA
signals. The US GPS system is also
experimenting with satellite based anti-spoofing
for civil users with its recent authentication
system called Chimera.
advaNced iNterfereNce mitiGa-tioN techNoLoGyOSNMA is a part of the puzzle comprising the
AIM+ interference defence system. The
anti-jamming component suppresses the widest
variety of interferers, from simple, continuous
narrow-band signals to the most complex,
wideband and pulsed transmissions. The
anti-spoofing component consists of signal
anomaly detection, OSNMA, RAIM+ as well as
other algorithms.
future-Proof GNSS receiverSInterference mitigation technology such as AIM+
protects accurate positioning today. To ensure the
best protection for tomorrow too, GNSS
manufacturers are offering future-proof
technology which allows users to take advantage
of new GNSS security services like ONSMA and
Chimera as soon as they become available.
Utilizing future-proof GNSS receivers in survey,
mapping and UAV equipment enables integrators
to reduce their time to market with resilient
products. Secured GNSS means trustworthy
precise positioning and peace of mind for
everyone who relies on this technology.
Figure 2: GNSS spoofing could be used to manipulate movement of aerial drones.
Figure 3: European Galileo satellites provide an open authentication service on the E1 signal and a commercial authentication service on the E6 signal. (Image courtesy: European Space Agency)
Gustavo Lopez is senior market access manager at Septentrio. With over 18 years of experience working with GNSS technology, he is a senior expert with in-depth knowledge of various GNSS
applications and use cases. He is at the forefront of the latest developments in geodetic-grade positioning solutions for various markets including survey, mapping and UAV.
Maria Simsky is a technical writer in marketing and communication at Septentrio. She has an engineering background with in-depth experience of GNSS technologies and software. She is
inspired by cutting-edge technology that helps to make the world a better place. [email protected]
further readinghttps://www.septentrio.com/en/advanced-interference-monitoring-mitigation-aimhttps://septentrio-my.sharepoint.com/:b:/p/marketing/EU99N82bWyZPsvd4Dp9g5lwBEwqQLgeT8i7wtW64TEk-tw?e=S0fGFD https://www.nbcnews.com/news/vladimir-putin/russia-spoofing-gps-vast-scale-stop-drones-approaching-putin-report-n987376
18-19_featuresimsky.indd 19 18-03-21 14:06

Search and compare Get insights Connect
Your Product Platform for Surveying, Positioning and
Machine Guidance

Hydro international | issue 1 2021 | 21
Very often, clients provide large datasets with
requests for end product fly throughs or refined
visualizations of smoothed and processed
bathymetry, along with short deadlines and
restricted budgets. Open-source software suites
such as CloudCompare and the plug-in
extension Cloth Simulation Filter (CSF) help to
fulfil such expectations. This gives smaller firms
the ability to process data in a similar way to that
of the powerhouses in the industry, with their
unrestricted budgets.
File FormatsOriginally designed to perform swift cloud and
mesh comparisons on large datasets,
CloudCompare currently exists as an open-
source 3D point cloud editing and processing
software. It boasts a suite of tools for extraction,
analysis and end product creation. With a
multitude of users, an active forum (GitHub),
online tutorials and plenty of documentation,
navigation is effortless. Integrating this tool into
an already existing workflow is simple, since it
can ingest and export a heap of file formats with
drag and drop functionality. Examples are .csv,
.ascii, .pts, .txt, .vtk, .dxf, .las, .laz, raster grids,
Esri’s .shp, image files, and so on. The
programme saves each project and associated
files in a proprietary file format of a .bin file. It is
a best use case for visualizing scenes, creating
aesthetically pleasing presentations, and for
quick fixes to an already existing workflow when
it comes to bathymetric processing. The
cross-section functionality after running the
point cloud through another useful tool for
insight.
CSF, a plug-in designed by Wuming Zhang et al.
from Beijing Normal University, China, quickly
extracts ground points from a point cloud.
Originally used for separating ground and
non-ground measurements from Lidar (light
detection and ranging), this tool can be just as
applicable for quick seafloor extraction analysis
and visualizations.
Point Cloud extraCtionThe plug-in is based on cloth simulation and
modelling and is derived from a 3D computer
graphics algorithm used to simulate cloth in
computer programmes. The point cloud is
In this present age of data collection and technological refinement, hydrographers and data processors are expected to
produce high-quality deliverables with a swift turnaround. However, the cost of proprietary commercial software
processing programmes has excluded many smaller contractors in the past. Such programmes incorporate finely tuned
tool suites and nested algorithms that have been distilled and polished over the years. However, the financial hurdles are
not as high as the passion and love that these individuals carry for this explorative industry and, thankfully, open-source
resources and collective intelligence are changing the game.
Open-source Software and Hydrographic Survey Data
3D Point Cloud Editing for Quick Seafloor Extraction Analysis and Visualization
Feature | raChel BoBiCh, RMB GEO, UnitEd StatES
Dataset from the Fort Pierce Inlet, 2019. Delivered as one large point cloud to process, it was originally two merged point clouds from both a multibeam survey and Teledyne BlueView laser scan of the pilings and bridge structure.
Fort Pierce Inlet, Florida. Inlet Mouth. View into the West.
21-22_featurebobich.indd 21 18-03-21 14:07

| Issue 1 2021 | Hydro InternatIonal22
inverted and a rigid cloth is laid on the inverted
surface. During the simulation, cloth is modelled
as a grid that consists of particles with mass
and interconnections, called a Mass-Spring
Model. By analysing the interactions between
the cloth nodes and the corresponding points,
the locations of the cloth nodes can be
determined to generate an approximation of
the ground surface. The ground points are
then extracted from the point cloud by
comparing the original points and the generated
surface [1].
This filtering method only requires a few
easy-to-set integer and Boolean parameters,
and takes less than a couple of minutes to
process. The accuracy stands up to other
toolsets and it has the functionality found in
proprietary commercial software. Benchmark
datasets provided by ISPRS (International
Society for Photogrammetry and Remote
Sensing) working Group III/3 were used to
validate the filtering method, and the
experimental results yielded an average total
error of 4.58%, which is comparable with most
state-of-the-art filtering algorithms [2].
ClassiFying Point CloudsParameters in the selection dialogue are split into
general parameters and advanced parameters.
General parameters allow the user to specify
whether the scene is relatively flat, contains
associated relief, or is steeply sloping, which
determines the rigidness of the cloth. Note that, for
steep slopes, this algorithm may yield relatively
large errors as the simulated cloth is above the
steep slopes and does not fit with such ground
measurements well due to internal constraints
among particles. This problem can be solved by
selecting the option for steep slopes. If there are no
steep slopes in the scene, this can be ignored.
Advanced parameter settings contain three
constraints to assist with the level of detail and
refinement.
The integers shown when the filter dialogue is
selected are standard and should be
appropriate for most datasets. Cloth resolution is
the grid size of cloth used to cover the terrain.
The bigger the cloth resolution integer set, the
coarser the DTM (Digital Terrain Model) that is
produced will be. Max. iterations refers to the
maximum iteration times of terrain simulation.
Classification threshold refers to a threshold to
classify the point clouds into ground and
non-ground parts, based on the distances
between points and the simulated terrain.
oPen-sourCe and maChine learningThis dataset is from the Fort Pierce Inlet in
2019. Delivered as one large point cloud to
process, it was originally two merged point
clouds from a multibeam survey and a Teledyne
BlueView laser scan of the pilings and bridge
structure. Since the separate bare earth and
structure files were not provided, the CSF was
ideal for this dataset. The client was concerned
about scour around the pilings, and desired to
see a quick visualization of the depth. As the
point cloud is inverted during extraction, the
depth of the scour could be shown in detail.
The extraction or refinement of coral heads and
boulder piles within the scour needed to be
manually performed with CloudCompare’s
segmentation tool or a separate tool process as
the surface is produced from inversion.
Retaining the same coordinate and height
values, despite the various tool processing
techniques applied, is a bonus for data integrity.
Another benefit of the CSF algorithm is that the
simulated cloth can be directly treated as the
final generated DTM for some circumstances,
which avoids the interpolation of ground points,
and can also recover areas of missing data [2].
The user can additionally check a box for a
separate meshed (Delaunay Triangulation 2.5D
XY plane) surface export once the filter has
extracted the ground points.
The use of insightful and synergistic
programmes such as CloudCompare,
open-source softwares, machine learning and
automation will continue to gain traction as
collaborative atmospheres continue to grow and
influence niche industries such as hydrographic
ventures. This allows for ease and
interoperability in future scientific
communities.
Rachel Bobich, owner of RMB GEO, is an independent contractor in the marine and geospatial data industries. She specializes in multibeam acquisition and processing, satellite
imagery analysis and open-source tool suites. Her career has taken her into the GEOINT division programme with the NGA, and she was previously GIS manager for the Department of Natural Resources, Marine Resource Division in South Carolina. She has worked closely with government agencies and private organizations such as NOAA and Mote Marine Laboratories. Navigating new solutions to existing workflows and optimizing organization and collaboration are her core values.
acknowledgmentCloud Compare, created by Daniel Girardeau-Montaut. https://www.danielgm.net/cc/
Citations1: http://www.cloudcompare.org/doc/wiki/index.php?title=CSF_(plugin)2: Zhang W, Qi J, Wan P, Wang H, Xie D, Wang X, Yan G. An Easy-to-Use Airborne Lidar Data Filtering Method used to test this method. Guangjian Yan helped to review this manuscript and give much advice.
Full dataset, view into the North. Pilings, view into the North. Post CSF application. Non-ground points.
21-22_featurebobich.indd 22 18-03-21 14:07
Hydro international | issue 1 2021 | 23
column |
Detailed bathymetry is the information that
helps us to determine what the seabed looks
like. Just as above water there are mountains,
hills and valleys, the same is true underwater.
The shape and texture of the seabed can
influence tides and currents, which guide the
movement of pollutants in the oceans and
seas, as well as determining the speed of
tremor and tsunami wave propagation. The
seabed provides habitats for marine species
and plays a role in spawning areas;
information which is useful for initiatives
aimed at protecting biodiversity. The seabed
also plays a role in ocean circulation, which in
turn has an impact on the climate and the
atmosphere. IHO Member States and other
GEBCO partners are collecting depth data,
which is becoming increasingly accurate
thanks to progress in technology, and which
can be used, for example, to refine and
improve the accuracy of climate change
impact models. A complete picture of the
seabed can help ensure that initiatives for the
sustainable use of the oceans are targeted
and effective.
Participants in GEBCO merge all of this
information, which is relevant for all ocean
stakeholders and can contribute to the
development of the blue economy. Knowledge
of the seabed, together with other
hydrographic data obtained during sea
surveys, is the basis of all marine activities
and has a wide variety of applications.
Information related to the topography of the
seabed or the strength and regularity of
currents can be used by operators to develop
marine renewable energy projects, while
industries like fishing and aquaculture can
benefit from information on environmental
factors like temperature, salinity and currents
– information that is recorded in detailed
digital charts.
GEBCO is an IHO & Intergovernmental
Oceanographic Commission of UNESCO joint
project to collect bathymetric data and map
the oceans. It was launched by Prince Albert I
of Monaco in 1903, and some of the initial
data was collected during his research
expeditions.
The IHO, an intergovernmental organization,
was created in 1921 and works with its 94
Member States to increase knowledge of the
ocean. It works to ensure that all of the
world’s seas, oceans and navigable waters are
surveyed and charted, and it coordinates the
activities of national hydrographic offices and
promotes uniformity in nautical charts and
documents. It also issues survey best
practices, provides guidelines to maximize the
use of hydrographic survey data, and
develops hydrographic capabilities in Member
States.
Hydrography focuses on the physical features
of oceans, such as the shape of the seabed,
depth, temperature, currents and sea level.
There is a lot of overlap with disciplines such
as oceanography, and much of the
information collected is relevant to the larger
discussions currently taking place on
increased knowledge and protection of the
ocean, such as the UN Decade of Ocean
Science for Sustainable Development and the
Sustainable Development Goals.
When people think of depth data, the first things that usually jump to mind are maps and navigation, even though the
implications for this work actually extend well beyond these areas. The shape and texture of the seabed are important for
a wide range of ocean processes, and can influence climate, pollution, biodiversity, and so on. The International
Hydrographic Organization (IHO), one of the General Bathymetric Chart of the Oceans (GEBCO) project’s parent
organizations, celebrates its 100th anniversary on 21 June 2021, and we felt it would be a good opportunity to look at
why depth data matters.
By Sarah JoneS Couture, PuBlic Relations and communication officeR, iHo
IHO & GEBCO: Providing Valuable Data to Care for Our Oceans
About The Nippon Foundation
The Nippon Foundation (founded in 1962) is a private, non-profit foundation that is jointly spearheading international efforts to map the entirety of the world’s ocean floor by the end of the next decade. More than 100 organizations are now contributing to the goal of producing a complete map, which is vital to exploration.
About GEBCO
The General Bathymetric Chart of the Oceans (GEBCO) partners with The Nippon Foundation in the Seabed 2030 Project. GEBCO is a joint project of the International Hydrographic Organization (IHO) and the Intergovernmental Oceanographic Commission (IOC) of UNESCO – the United Nations Educational Scientific and Cultural Organization. It is the only intergovernmental organization with a mandate to map the entire ocean floor.
23_gebcocolumn.indd 23 18-03-21 14:07
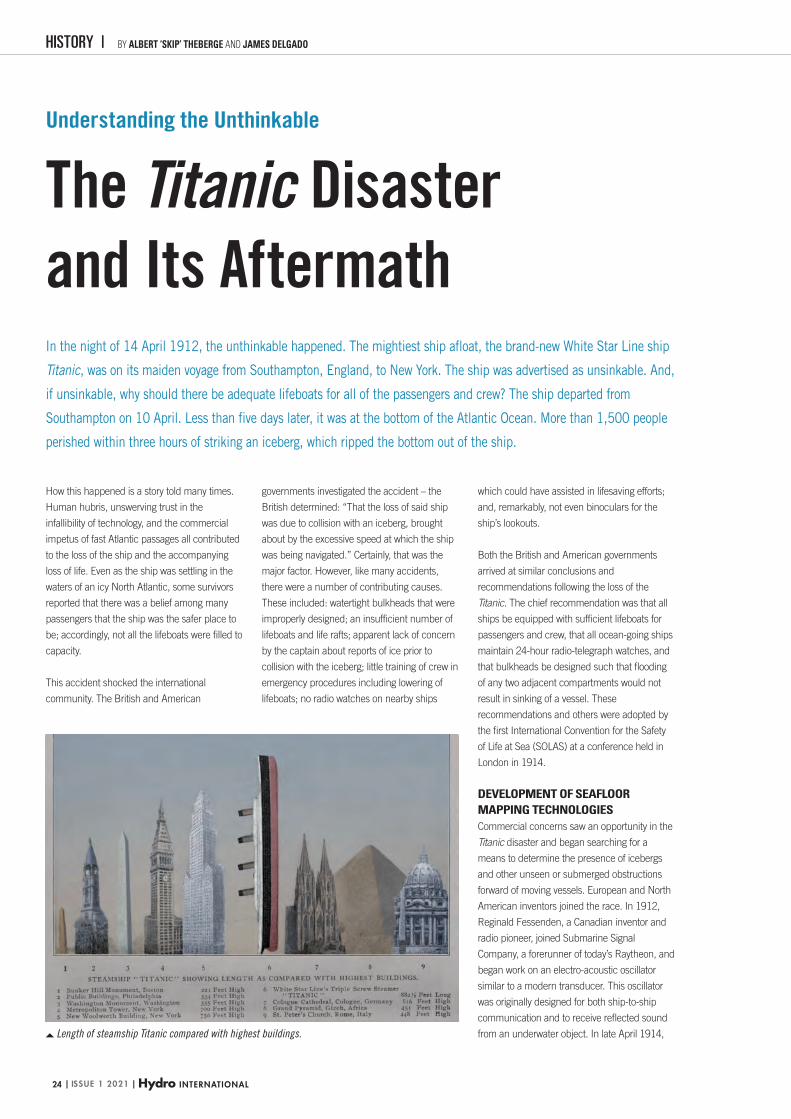
| Issue 1 2021 | Hydro InternatIonal24
How this happened is a story told many times.
Human hubris, unswerving trust in the
infallibility of technology, and the commercial
impetus of fast Atlantic passages all contributed
to the loss of the ship and the accompanying
loss of life. Even as the ship was settling in the
waters of an icy North Atlantic, some survivors
reported that there was a belief among many
passengers that the ship was the safer place to
be; accordingly, not all the lifeboats were filled to
capacity.
This accident shocked the international
community. The British and American
governments investigated the accident – the
British determined: “That the loss of said ship
was due to collision with an iceberg, brought
about by the excessive speed at which the ship
was being navigated.” Certainly, that was the
major factor. However, like many accidents,
there were a number of contributing causes.
These included: watertight bulkheads that were
improperly designed; an insufficient number of
lifeboats and life rafts; apparent lack of concern
by the captain about reports of ice prior to
collision with the iceberg; little training of crew in
emergency procedures including lowering of
lifeboats; no radio watches on nearby ships
which could have assisted in lifesaving efforts;
and, remarkably, not even binoculars for the
ship’s lookouts.
Both the British and American governments
arrived at similar conclusions and
recommendations following the loss of the
Titanic. The chief recommendation was that all
ships be equipped with sufficient lifeboats for
passengers and crew, that all ocean-going ships
maintain 24-hour radio-telegraph watches, and
that bulkheads be designed such that flooding
of any two adjacent compartments would not
result in sinking of a vessel. These
recommendations and others were adopted by
the first International Convention for the Safety
of Life at Sea (SOLAS) at a conference held in
London in 1914.
Development of Seafloor mapping technologieSCommercial concerns saw an opportunity in the
Titanic disaster and began searching for a
means to determine the presence of icebergs
and other unseen or submerged obstructions
forward of moving vessels. European and North
American inventors joined the race. In 1912,
Reginald Fessenden, a Canadian inventor and
radio pioneer, joined Submarine Signal
Company, a forerunner of today’s Raytheon, and
began work on an electro-acoustic oscillator
similar to a modern transducer. This oscillator
was originally designed for both ship-to-ship
communication and to receive reflected sound
from an underwater object. In late April 1914,
In the night of 14 April 1912, the unthinkable happened. The mightiest ship afloat, the brand-new White Star Line ship
Titanic, was on its maiden voyage from Southampton, England, to New York. The ship was advertised as unsinkable. And,
if unsinkable, why should there be adequate lifeboats for all of the passengers and crew? The ship departed from
Southampton on 10 April. Less than five days later, it was at the bottom of the Atlantic Ocean. More than 1,500 people
perished within three hours of striking an iceberg, which ripped the bottom out of the ship.
The Titanic Disaster and Its Aftermath
Understanding the Unthinkable
HISTORY | By albert ‘Skip’ theberge and JameS DelgaDo
Length of steamship Titanic compared with highest buildings.
24-25-26-27_history.indd 24 18-03-21 14:39

Hydro international | issue 1 2021 | 25
Fessenden tested this device off the Grand
Banks on the US Revenue Cutter Miami and
succeeded in reflecting sound off an iceberg at
a range of approximately two miles and hearing
the return echo. A second echo was heard that
was determined to be from the bottom.
Submarine warfare during World War I
accelerated research into the field of acoustics.
By the end of the war, the use of acoustics for
both detection of objects in the water and
measuring depth had been proven. In 1922, the
USS Stewart, equipped with a Hayes Sonic
Depth Finder that utilized a Fessenden
oscillator, ran a line of soundings across the
Atlantic Ocean taking over 900 individual
soundings. The profile obtained from these
soundings was published in the first issue of the
International Hydrographic Review. Piano-wire
sounding systems became obsolete overnight.
Although leadline sounding continued for a
number of years in shallow water, acoustic
sounding systems replaced the leadline for most
purposes within two decades.
World War II further accelerated the
development of directional sonar systems
(called Asdic in England). Although meant
originally for the detection of submarines, these
systems ultimately developed into modern
side-scan sonar systems. Underwater
photography equipment and magnetic anomaly
detection (MAD) instruments were in their
infancy during this period. MAD systems were
proved effective in detecting submarines. An
early use by hydrographers of the
complementary use of sonar, underwater
photography and MAD gear was in the charting
of ships torpedoed off the United States East
Coast. This was done by Coast and Geodetic
Survey (C&GS) officers working off the Coast
Guard buoy tender Gentian in 1944.
Following the war, there were further advances,
including the development of an early side-scan
sonar system called Shadowgraph in 1954 by
German scientist Julius Hagemann, who was
working at the United States Navy Mine Defense
Laboratory. This system remained classified for
many years, but civil use of side-scan began
developing shortly after this advance. In the
commercial sector, Harold Edgerton of the
Massachusetts Institute of Technology (MIT)
and Martin Klein, also of MIT, were early
pioneers. Edgerton turned a bottom-penetration
sonar on its side in 1963 and imaged a sunken
lightship from a C&GS vessel. Edgerton was a
founder of EG&G and discovered the Civil War
era USS Monitor off Cape Hatteras with an
EG&G commercial side-scan system. Martin
Klein began his career with EG&G but left to
found Klein Associates, a name synonymous
with side-scan technology.
Advances in depth measurement technology
paralleled the development of side-scan
technology. In April 1961, engineers at General
Instruments Corporation developed a proposal
for BOMAS, Bottom Mapping Sonar. Quoting
from the proposal: “BOMAS derives bottom
profile information from the intersection of the
ocean bottom with a vertical plane
perpendicular to the heading of a ship. The
sonar data is processed automatically and in
real time to provide a depth contour strip
map…. A sonar intensity map can be provided
simultaneously….” Multi-beam sounding with
its attendant bottom reflectivity mapping
capability was born. Two years later, the first
prototype multi-beam system was installed on
the USS Compass Island and subsequent units
installed on Navy survey ships. In the
meantime, the acronym had changed to SASS
(Sonar Array Sounding System). By the late
1970s, the technology had migrated to the civil
community and has since displaced single
beam sounding systems as the standard
seafloor mapping tool.
finDing titanic anD the after-math of the DiScoveryIn the immediate aftermath of the sinking,
proposals to locate the sunken Titanic were
discussed and ultimately dismissed because the
wreck lay well beyond the limits of technology at
that time. Through the decades, the
development of subsea technology finally
provided the means to locate the wreck and
subsequently to not only investigate it using
remote technology, but also to dive to the wreck
and conduct a series of investigations that
included surveys of the interior of the ship.
In July 1985, the final search began, with
Ifremer deploying their newly developed
side-scan sonar SAR vehicle on a mission led
by Jean-Louis Michel on the research vessel Le
Suroit. That survey covered 70% of a 150
In the early morning hours of 1 September, the unmistakable form of a boiler made it clear that Titanic’s final resting place had been found
Painting of the Titanic sinking by the bow, with people rowing a lifeboat in the foreground and other people in the water. Icebergs are visible in the background. (Engraving by Willy Stöwer: Der Untergang der Titanic)
24-25-26-27_history.indd 25 18-03-21 14:39

| Issue 1 2021 | Hydro InternatIonal26
square nautical mile survey box without locating
the Titanic. Picking up the search in August, the
WHOI team, led by Robert Ballard aboard the
research vessel Knorr, utilized the towed vehicle
Argo with a 100kHz side-scan sonar and three
low-light black and white video cameras.
Ballard’s team relied on the optical system to
locate the Titanic, and in the early morning
hours of 1 September, the unmistakable form of
a boiler made it clear that the search was over.
Titanic’s final resting place had been found.
Since the discovery in 1985, a series of
expeditions have visited the Titanic with a variety
of goals. Ballard and Woods Hole returned to
the wreck in July 1986 on the WHOI research
vessel Atlantis II, with the submersible Alvin and
the ROV Jason Jr. The 1986 expedition
photographed and filmed the wreck, focusing
on the largely intact bow section. Working from
the data collected from the 1985 Argo survey as
well as 1986 data, WHOI’s William Lange and
others assembled a preliminary site map of the
Titanic wreck site that delineated the site from
the bow to the stern section and plotted a wide
range of features scattered on the seabed. A
private venture funded and led by RMS Titanic,
Inc., the salvor-in-possession of the wreck
(RMST), and technically supported by Ifremer,
returned to the wreck in July 1987 and made
32 dives to recover some 1,800 artifacts from
the seabed, the first of a series of recovery dives
made by RMST until 2004, which ultimately
salvaged nearly 5,000 artifacts.
Dives made by documentary film crews and
James Cameron (whose first dives were in
1995), working with the P.P. Shirsov Institute,
captured dramatic images of the wreck as well
as additional technical information and a more
detailed view of aspects of the wreck site, using
Mir submersibles. In particular, Cameron’s
extensive documentation and penetration of the
interior of the bow with small ROVs known as
‘bots’ provided incredible insights into the
ongoing processes of environmental change
and preservation inside the ship, as well as
evidence of what had occurred during the
sinking of the Titanic. Cameron’s work has
arguably done more to share the Titanic as a
wreck site with a greater audience than anything
else.
The scientific products of the various
expeditions include a detailed analysis of the
microbiological corrosion of the ship’s steel (led
by Roy Cullimore), geological studies of the
sediments and current studies (by the Shirsov
Institute), a detailed sonar survey of the bow
where the Titanic struck the iceberg,
photomosaics of the bow section, and forensic
studies of the ship’s sinking sequence and
break-up. In addition, RMS Titanic, Inc.
commissioned the creation of an ‘archaeological
GIS’ map delineating where the 5,000 artifacts
had been recovered from between 1987 and
2004. That GIS, which is being completed by
RMST under contract by the Center for
Maritime & Underwater Resource Management
of Michigan, a private non-profit, is reported to
be nearly complete.
The National Oceanic & Atmospheric
Administration’s Office of Ocean Exploration
conducted two missions to the Titanic in 2003
and 2004. As the nation’s ocean agency, NOAA
has an interest in the scientific and cultural
aspects of the Titanic. NOAA’s focus is to build a
baseline of scientific information from which we
can measure the processes and deterioration of
the Titanic, and apply that knowledge to many
other deepwater shipwrecks and submerged
cultural resources. The 2003 mission, with the
Shirsov Institute, had several key goals, the first
being to catalogue any anthropogenic activities
currently impacting the wreck site, or evidence
of such activity since its discovery in 1985.
Digital imagery was obtained and a deck-view
mosaic of the bow section was created.
Additionally, ongoing bacteriological analysis
The ROV Hercules exploring the bow of the Titanic, 2004. (Courtesy: Institute for Exploration/University of Rhode Island/NOAA)
This composite image, released by RMS Titanic, Inc., and made from sonar and more than 100,000 photos taken in 2010 by unmanned, underwater robots, shows a small portion of a comprehensive map of the 3-by-5-mile debris field surrounding the bow of the Titanic on the bottom of the North Atlantic Ocean. (Courtesy: AP Photo/RMS Titanic, Inc.)
24-25-26-27_history.indd 26 18-03-21 14:39

Hydro international | issue 1 2021 | 27
more information• Robert D. Ballard and Michael Sweeney, Return to Titanic:
A New Look at the World’s Most Famous Lost Ship. National Geographic Society, Washington, D.C. 2004.
• Robert D. Ballard, ed. Archaeological Oceanography. Princeton University Press, Princeton & Oxford, 2008.
Albert E. ‘Skip’ Theberge graduated from the Colorado School of Mines in 1969 as a geological engineer and entered ESSA Corps, a descendant organization of the commissioned service of the United States Coast and Geodetic Survey. In 1970, this became NOAA Corps with the formation of the National Oceanic and Atmospheric Administration (NOAA) within the US Department of Commerce. He retired from NOAA Corps in late 1995. Since retiring from NOAA Corps, he has been affiliated with the NOAA Central Library where he is acting head of reference. In that capacity, he has built the NOAA Photo Library and NOAA History websites. He has written over 100 articles on the history of hydrography, oceanography and geodetic surveying over the past 20 years. Among awards he has received are the United States Department of Commerce Gold Medal and the NOAA Distinguished Career Award.
James Delgado is among the world’s leading experts in maritime archaeology and cultural heritage. Dr Delgado serves as senior vice president of SEARCH, the largest cultural resource management company in the United States. Prior to joining SEARCH, Dr Delgado served as the director of Maritime Heritage in the Office of National Marine Sanctuaries for NOAA for seven years. Previously, he served a four-year term as president and CEO of the Institute of Nautical Archaeology, the world’s leading scientific and educational organization dedicated to the understanding of humanity’s seafaring history through the excavation and scientific study of shipwrecks. Delgado is lecturer at the Archaeological Institute of America.
was conducted as well as basic oceanographic
research.
the 2004 miSSion, conDucteD onboarD the noaa reSearch veSSelRonald H. Brown, working with Robert Ballard
of the University of Rhode Island and the
Institute of Archaeological Oceanography,
utilized an ROV to continue the assessment of
the wreck’s ongoing environmental changes and
the bacteriological work of Roy Cullimore. One
other key achievement of the 2004 mission was
the completion of a topographic map of Titanic
Canyon and the surrounding area, including the
wreck of the Titanic, with a Seabeam 2112
multi-beam sonar system. The digital terrain
model of this large area of seabed places the
Titanic within a larger geological and
geographical context.
NOAA also participated, as did Woods Hole, the
National Park Service, the Institute of Nautical
Archaeology, the Waitt Institute and contracted
partners such as Phoenix International, Ltd., in
RMS Titanic, Inc.’s last (to date) expedition to
the wreck in August 2010. This mission, with a
non-recovery scientific focus, focused on
William Lange’s and the WHOI Advanced
Imaging and Visualization Laboratory’s work to
create a detailed 2D and 3D visual mosaic of
the site. To do so, it made a detailed survey
using the Waitt Institute’s REMUS 6000
autonomous underwater vehicles of an
approximately ten square nautical mile survey
zone around the wreck site, with a series of
closer, higher resolution surveys of the area
delineated in the 1986 WHOI map of the site
and even closer surveys of key features and
areas of the site. That project was successful in
generating the mapping data as well as
comprehensive visual coverage of the wreck,
including detailed photomosaics of a number of
features in the artifact scatter, which included
sections of the ship’s hull, machinery and
equipment and other artifacts.
What is clear from this brief overview is that the
last few decades have witnessed a revolutionary
expansion of humanity’s capacity to not only
locate deep-sea shipwrecks, but increasingly to
capture imagery and data that essentially
‘virtually raises’ these wrecks for ongoing
research as well as public education. In many
ways, the Titanic and the surrounding area are
likely to be the best-studied section of the deep
ocean floor. That status has come because of
the iconic nature of the wreck and the potential
for profit from the opportunity to connect to this
ship and its tragic loss either through a tour of
the recovered artifacts or a virtual tour on film or
in a photograph. At the same time, measurable
and important science has been conducted,
and in that, a way forward for not only this site
but others has been demonstrated, especially in
the adaptation and adoption of technology to
access and learn from sites once thought
unreachable.
The original version of this article appeared in a
previous issue of Hydro International several
years ago.
In many ways, the Titanic and the surrounding area are likely to be the best-studied section of the deep ocean floor
EMPOWERINGworld leader in electric underwater robotics
24-25-26-27_history.indd 27 18-03-21 14:39

[email protected] EvoLogics.de
SMART SUBSEA SOLUTIONSDelivering data in most adverse conditions: underwater acoustic modems with advanced communicationtechnology and networking
Accurate USBL and LBL positioning of underwater assets
Modem emulator and other cost-saving developer tools
Autonomous surface vehicle for bathymetry, monitoring and AUV support
SiNAPS 2.0UPGRADED ACOUSTIC
POSITIONING SOFTWARE
AVAILABLENOW