Embed Size (px)
Citation preview

IFC Bulletin No 30 113
Session 4
Surveys for the compilation of external sector statistics
Background note: Surveys for the compilation of external sector statistics Paul Van den Bergh, Bank for International Settlements
Case studies:
Buenos Aires Surveys for the compilation of external sector statistics: the experience of Banco de Portugal Paula Casimiro, Bank of Portugal
Vienna New collection system in Belgium for Balance of Payments BoP 2006 – use of surveys and direct reporting for BoP Daniel Desie, National Bank of Belgium
Country presentations:
Pune Surveys for compilation of external sector statistics in India Narender Singh Rawat, Reserve Bank of India
Overview on external data compilation Lui Kwee Ching, Central Bank of Malaysia
Buenos Aires External sector surveys Erika Chaves Ramirez, Central Bank of Costa Rica
Use of surveys to compile external statistics in the Central Bank of ChilePaulina Rodríguez, Central Bank of Chile
Challenges in data compilation of foreign direct investment in a free capital flows country – the Uruguayan case Ana María Ibarra, Luis Ipar and Mariana Taboada, Central Bank of Uruguay
Vienna Surveys as data sources for external sector statistics Endrita Xhaferaj, Bank of Albania
Foreign direct investment statistics: the case of the Czech Republic Rudolf Olšovský, Czech National Bank
Mobile phone traffic data and tourist services item in Balance of PaymentsMatjaž Jeran, Bank of Slovenia


IFC Bulletin No 30 115
Background note on surveys for the compilation of
external sector statistics
Paul Van den Bergh1
External sector statistics are key economic indicators for central banks and monetary authorities. They shed light on the size and composition of a country’s external trade in goods and services as well as its financial transactions with the rest of the world. They also provide information on the nation’s international asset and liability position, including its external liqudity and debt. All these are crucial variables in order to assess current and prospective developments in exchange rates and the country’s vulnerability to external shocks.
For all these reasons, it is not surprisingly that in many countries the central bank is responsible for the compilation of the external sector statistics, ie the balance of payments (current and financial accounts), the international investment position, and external debt statistics. Even where the central banks are not directly involved in the production of these statistics, they need to ensure that they are coherent and compatible with other statistics such as money and banking, national and financial accounts.
Innovation, deregulation and globalisation have resulted in a rapid growth, if not explosion, in cross-border economic and financial transactions in most countries around the world. This has posed a number of challenges to compilers and analysts of external statistics. Indeed, a number of high-profile discussions have taken place regarding the quality of external sector statistics, including the question of the asymmetry in global balance of payment statistics, the precise measurement of the external position of the United States and the lack of adequacy in external debt data for emerging market countries before the financial turmoil in the late 1990s.
A particular challenge has been posed by the relaxation of foreign exchange controls and the growing role of non-banks in international financial transactions. Indeed, as long as foreign exchange transactions require permission of some kind and as long as banks are the only institutions carrying out foreign exchange transactions for their own account and for that of their non-bank customers, a reporting system such as the International Transactions Reporting System (ITRS) is relatively easy to implement and maintain. As soon as foreign exchange controls are relaxed, however, or non-bank financial institution can start making cross-border payments, banks become more reluctant to continue to participate in such reporting systems, particularly if their international competitors are no longer subject to such requirements. Authorities obviously also do not want to see their domestic financial institutions at a competitive disadvantage. Even if reporting requirements are maintained, the quality of the reported data will gradually be reduced as banks will not voluntarily make best efforts to deliver quality information.
Over time other forms of data collection systems have been established, in particular the conduct of surveys. These were pioneered in the major Anglo-Saxon countries which were amongst the first to deregulate their external transactions (eg US, UK, Canada, Australia, New Zealand). Initially, surveys were introduced for the reporting of new types of
1 Monetary and Economic Department of the Bank for International Settlements.

116 IFC Bulletin No 30
transactions (such as M&A, income, IT services, travel, remittances, cross-border portfolio investment). In its 5th BOP Manual (1993), the IMF started to encourage new collection and compilation techniques. Gradually the surveys have started to replace established reporting systems. More recently, the introduction of surveys has been used by statisticians to more effectively capture the details of more complex cross-border transactions related to the development of new and more complex financial instruments (eg derivatives, securitisation).
A particular development has been the creation of a Monetary Union in Europe. Indeed, as part of the deregulation of capital movements, the European Commission in 2001 decided to free intra EU transactions below a threshold of 12.500 euros from reporting requirements in order to reduce the cost of cross-border transfers to that of domestic transfers.2 This put pressure on the European central banks to adapt their reporting systems.
Typology of reporting systems for external sector statistics
Given the gradual evolution from comprehensive reporting systems to the conduct of surveys of external transactions, different types of reporting schemes can currently be identified:
• full International Transactions Reporting Systems continue to be used in countries where foreign exchange controls remain in place, which have only recently removed such controls, or which have not had the possibility to adapt their reporting system;
• partial ITRS can be used, limited, for instance, to interest payments or portfolios transactions, or to capture only basic information such as name of the customer or the currency used, in order to populate a cross-border business register that can be used as a benchmark to update the survey population;
• general direct reporting by the largest companies above a certain threshold (eg in terms of specific cross-border financial transactions or export sales) which have to report all their international transactions, economic and financial – such a system can give more detailed and accurate results on several BOP items, including trade in services;
• specialised direct reports by selective sectors (such as insurance and transportation) that are not properly captured through ITRS, or by companies which have bank accounts abroad and which are asked to report the transactions settled through these accounts;
• ad-hoc reports by companies involved in direct investment transactions, which are identified in press reports or by some specialised commercial data providers;
• random panel surveys of travellers at the border, in ports, airports, rest areas on motorways or by mail/internet,
• surveys of companies being selected by sampling and stratification methods and whose results are extrapolated statistically – this can be used for specific transactions such as trade credits, but also as a substitute for ITRS as the main datasource for most of the BOP statistics;
• anecdotal surveys in countries having no institutional reporting system for cross-border business.
2 Discussions are ongoing on an increase in this threshold to 50.000 euros; some fear that this will significantly
compromise the quality of the ITRS data in countries of the euro area that are still using this collection method.

IFC Bulletin No 30 117
These various reporting or survey procedures can be used in various combinations depending on national specificities and evolving requirements. In France, for instance, the central bank uses ITRS for transactions above a threshold, direct reporting for large companies, partial direct reporting for small and medium companies holding accounts abroad above a certain amount, sample surveys for trade credit, and panel interviews for inbound and outbound travel. In Lithuania, the central bank has recently implemented a monthly survey, the first in Europe, with a sample of companies, which are selected through a stratification method based on the information on the full population which is surveyed quarterly by the Statistics Office for the compilation of the quarterly BOP. Finally, in Bulgaria, the central bank uses only a traditional ITRS but is planning to move partly to a general direct reporting system, once a proper cross-border business register is set up on the basis of the information currently available in the ITRS.
The table in Annex 1 compares a number of main features of ITRS, which is de facto a full census reporting, and the conduct of surveys. ITRS has a number of advantages in terms of frequency and timeliness as well as its potential use in day-to-day monetary policy since it allows the monitoring of external transactions on a continuous basis, and also relies on a limited number of banks and is easily automated. When exchange controls are lifted, the quality of the data reported by banks and other reporters can, however, deteriorate quickly. Surveys are seen to be better adapted to monitor short-term changes in cross-border transaction than comprehensive compilation systems. Their drawback is that information is available with a longer time lag and may have less detailed breakdowns. Moreover, the operation of surveys for external sector statistics requires the existence of an up-to-date business register which identifies the firms involved in cross-border transactions. For this a full reporting system (such as ITRS) is required as a benchmark – at least occasionally in order to update the system.
The growing recourse to statistical surveys does not only imply a change in culture in statistical agencies responsible for external sector statistics, which are typically the central banks, but may also have cost implications. Surveys are less costly, for banks but also for reporting businesses and households. In addition, surveys can now be carried out via the Internet, thereby alleviating the burden of physically contacting the respondents (business travel survey for instance). The reduced volume of data resulting from sample surveys should also facilitate cost savings. These savings have to be balanced against the loss of accuracy inherent in sampling (currency/country breakdowns for instance). Moreover, costs of data compilers may increase, as some of the surveys (travel at the border for instance) may have to be outsourced to private polling companies.
Central banks and external sector statistics
Only 5 out of 37 central banks that have reported on their data compilation exercises in preparation of the workshop are not involved at all in the collection of external sector statistics (Argentina, Canada, Hong Kong, Norway and Australia). A similar number seem to be only involved to a limited extent (Denmark, Finland, Iceland, India, Italy3, Turkey and the United States). More than two-thirds of the central banks are either responsible for the full BOP and IIP statistics or at least for the financial accounts of the BOP and the IIP (including external debt).
3 In Italy a separate specialised organisation, called the Ufficio dei Cambi, compiles the balance-of-payment
statistics. This organisation works in close cooperation with the central bank and there are plans to merge it formally with the central bank.
118 IFC Bulletin No 30
In terms of collection techniques used, ITRS or a variant of this method is used by the central bank in India, Israel, Latvia, Luxembourg, Macedonia, the Philippines, Portugal, Russia, Slovakia, Spain, and Thailand. Even in these countries, balance sheet data from banks or financial institutions are typically collected through a regular census or cut-off the tail reporting. Surveys are used to collect information on
• travel or tourism (Estonia, Germany, Greece, Italy, Mexico, Portugal, Russia,
• trade in services (Israel, the Philippines, Russia, Sweden),
• transfer payments (list countries: BIS, Data Bank Services),
• foreign direct investment (Austria, Chile, the Philippines, Sweden, Turkey),
• trade credit (Belgium, Chile, Czech Republic),
• corporate sector foreign assets and liabilities (India, the Philippines, Portugal, South Africa, Turkey),
• derivative transactions (Sweden), and,
• remittances (Israel).
It should be noted that the use of surveys varies significantly from country to country. From other material presented at IFC meetings, there seems to be a general trend towards an increased use of surveys in the compilation of external sector statistics. The extent to which surveys are used also depends on national contexts and on the institutional relationship and sharing of statistical competence between the statistical offices and the central banks.
Issues for discussion
1. What is the best way to update the reporting population in survey-based systems for external sector statistics? How is the population benchmark for this sector established?
2. What is the overall cost of a survey system in comparison with the ITRS?
3. Can survey-based systems improve the reliability, comprehensiveness and timeliness of external sector statistics?
4. What conditions need to be fulfilled in order to move away from a full reporting system (including ITRS) to a survey-based system for external sector statistics?

IFC Bulletin No 30 119
Annex 1: A comparison between ITRS and
surveys for BOP reporting systems
Statistical surveys ITRS
Use of external sector data for the day to day operation of monetary policy
No. The data are useful for the national accounts, but are not available timely enough to support monetary policy.
Yes. Timely reported cross-border transactions allow interpretation of their influence on the foreign exchange market.
Typical frequency of aggregate data availability
Quarterly Monthly (but daily data also available).
Typical timeliness 2–3 months after the end of the quarter
1–2 months after the end of the month
Reporters Mostly the corporate sector and the objective of quality and accuracy implies a large number of reporters.
Also banks (stock data on respective asset and liabilities positions).
Mostly a limited number of banks
Degree of detail, accuracy Standard components, with limited country and currency breakdown, but with more detailed economic information
Detailed country and currency breakdown based on customers’ accounts at banks
Drawbacks Requires an updated business register on cross-border transactions
Dependent on the correct coding by banks who may not have deep knowledge of their clients’ (corporate) business, contrary to direct responses to surveys by companies. Lifting of foreign exchange controls may relax the reporting banks’ commitment to provide quality data.
Costs Reduced for banks, more on reporting businesses. Surveys involve fewer reporters, can be shorter and be conducted over the Internet.
Mostly for banks
Adaptation to changes in external transactions
Survey design (eg questions) can be adapted to track changes in external transactions
More difficult to change reporting requirments

120 IFC Bulletin No 30
Annex 2: The move to surveys to estimate
travel in the German BOP
Until the end of 2001, data on the receipts from and expenditure on foreign travel were collected by the central bank indirectly, using information from banks and credit card companies, supplemented by reports from tour operators on their cross-border transfers. Data was also used from some European partner countries on the buying and selling of domestic currency (DM) banknotes in their respective home markets.
With the introduction of the Euro this reporting system became obsolete and was replaced by a direct survey of households on their travel expenditure.
Advantages:
• The sample survey brought better coverage, resulting in an 11% increase in estimated expenditure.
• The seasonal pattern of spending is more pronounced than was previously apparent.
• While estimates of spending levels in EU countries did not change, it became clear that expenditure in countries outside the EU was 38% higher than previously estimated, including 13% higher spending in the US.
• additional information on type of travel (business or private), duration of the trip, transport used, etc, is now available.
Disadvantages:
• The survey results are available after five months at the earliest.
• Sampling error increased (less important destinations are rarely captured by the sample survey, so reliable extrapolation is not possible) Results are therefore published only for major destination countries and regions.
Source: http://217.110.182.54/download/volkswirtschaft/mba/2003/200303_en_germanbalance.pdf.

IFC Bulletin No 30 121
Surveys for the compilation of external sector statistics:
the experience of Banco de Portugal
Paula Casimiro1
Overall view of the Portuguese b.o.p. and i.i.p. compilation system
The Banco de Portugal (BdP) has been responsible for compiling and producing the Portuguese balance of payments statistics since 1963. This task is recognized by the Bank’s Organic Law, Law No. 5/98 of 31 January 1998, which also empowers the Bank to require from any public or private body the direct supply of whatever information deems as necessary to its fulfillment. Further to the full liberalization of foreign exchange regulations, at the end of the 80’s, a new collection and statistical production system was introduced in 1993 mainly based on an International Transactions Reporting System (ITRS), complemented with direct reporting from companies. In order to comply with the main international methodological recommendations regarding the balance of payments (b.o.p.) and international investment position (i.i.p.) statistics, the Portuguese statistical production system has evolved from a system mainly based on settlements, as it was first implemented in 1993, to a system based in the aggregation of a growing number of different data sources. This system has been running, and evolving, on a monthly basis since 1999.
Resident banks must report on a monthly basis all external transactions carried out on their own account or on behalf of their customers. In the case of transactions related to their customers, a threshold of €12,500 applies, below which banks may be exempted from reporting that transaction (exemption threshold) or they may report it without the statistical classification but identifying the client and country of counterpart (simplification threshold). The report is done, generally, on a transaction-by-transaction basis via a text file with a predefined format which is sent to the BdP through an electronic channel.
Direct reporters may be of two kinds: “partial” direct reporters, that only report foreign transactions settled through foreign bank accounts or through compensation/clearing accounts with non-resident counterparts, and general direct reporters, that report all of their foreign transactions including those settled by a resident bank (a special codification procedure is implemented to avoid double counting). Direct reporters also report monthly on a transaction-by-transaction basis and the BdP provides free-of-charge – and for optional use – an application for data collection purposes. Paper forms are available but companies are not encouraged to use them.
In 1999 additional data sources were introduced into the system. ITRS and direct reporting (DR) maintain their importance as the major data source in the case of some b.o.p. items and are an important data source for quality control for others. Next section briefly describes some of the most relevant data sources.
1 Banco de Portugal, Statistics Department, Av. Almirante Reis, 71, 1150-012 Lisbon, Portugal; E-mail:

122 IFC Bulletin No 30
Current and capital accounts
In the case of goods, b.o.p. statistics make use of the external trade statistics that are compiled by the National Statistical Institute (INE), complemented by ITRS (e.g. goods procured in ports by carriers). Since there are no barriers imposed on trade among European Union (EU) countries, the INE collects Intra-EU trade via a specific system of direct reporting, named Intrastat, whereas Extra-EU trade is collected from customs. For b.o.p. purposes, BdP receives monthly data at approximately t+40 days (for Intra-EU trade this is a first estimate which will be revised in subsequent months).
For services ITRS and DR are the main data sources for most of the items, with the exception of merchandise freight and insurance (cif/fob margin estimates) and travel. For travel, ITRS and DR are complemented with information collected from exchange offices, from the financial entities engaged in the issuance and processing of credit and debit cards and from tourism activity indicators (like overnight stays and income from hotel occupancy) published by the INE. Estimation is made for euro-denominated banknotes carried by travellers, since euro banknotes issued by any Central Bank of the European Monetary Union (EMU) are legal tender in Portugal and this flow is no longer captured by the ITRS system.
Because of this drawback, a working group (WG) was established by the BdP and the INE in February 2002 to study the implementation of border surveys for collecting data on travel. Following the work of the WG, cooperation protocols were established between the BdP, the INE, and the Tourism General Directorate, in May 2004 and two surveys were launched, both covering airports and road borders (in the Portuguese case, rail and sea borders are of lesser importance). The first survey, the Travel Border Survey (IMPF), started in May 2004 with the objective of estimating the total number of incoming and outgoing travellers crossing the Portuguese borders, whereas the second, the Travel Expenditure Survey (IGTI), started later (at the end of 2004) and aimed at estimating the total expenditure for incoming and outgoing travellers crossing the Portuguese borders. Both surveys are also essential for the characterisation of travellers and respective trips.
For BdP these surveys were important in the context of the compilation of the travel item in the b.o.p. statistics, since they complement the existing data sources, allow the collection of additional information (e.g. to distinguish between personal and business travel) and improve its geographical breakdown. Concerning the overall results, the 2005 and 2006 surveys confirm the estimates made by BdP. For example, in 2006, published figures for both travel receipts and expenditures are marginally larger than the results obtained from the border surveys: by 1.4%, in the case of receipts, and by 0.4%, in the case of expenditures. As for the geographical allocation, the list of major countries of origin (in the case of receipts) or destination (in the case of expenditure) is broadly the same, but within it the ranking of countries change.
In the case of workers’ remittances, ITRS is the main data source for the credit side, whereas for the debit side it is complemented with data collected directly from several money transfer operators, like Western Union or Money Gram. This additional data source is also relevant for improving the geographical allocation for this item.
Financial account and related income
In the case of direct investment (DI), BdP has been carrying out specific annual surveys since 1997. The main objective of these surveys is to collect data on direct investment end-of-period positions and related income. They are also used to collect additional variables like foreign affiliates’ activity data – such as turnover, number of employees, value added, imports and exports – and they are an important complement to ITRS and DR. Due to
IFC Bulletin No 30 123
existing resources constraints, the lack of experience in conducting surveys directed at non-financial corporations and the timeliness and periodicity of the dissemination of statistics at that time, BdP decided to carry out the inward and outward surveys separately, in alternate years. The consistency and continuity of the time series was guaranteed by the request of information about the last two years in each questionnaire. For example, the first inward DI survey (QIDE) launched in 1997 covered both 1995 and 1996 data.
Another initial option concerned the link between the statistical concepts and definitions and the accounting books and rules of the companies to be surveyed. Whenever possible, namely in the case of the resident company data, we would indicate the relevant accounts to be used. Due to the existence of several accounting plans, this option made it necessary to develop three different forms: banks, insurance companies and non-financial corporations.
Aiming at reducing the response burden and speed up data collection, BdP developed and provided, free of charge, an application to be used on a voluntary basis. Although requiring the manual input of data, this tool can perform automatically some consistency checks, reducing the possibility of error and the need for further contacts, and generates an electronic file to be sent to the Bank. This latter facility releases human resources from the manual collection of data, indispensable in the case of paper forms, to its analysis and quality control. The usage of the application increased steadily over time, from a low of 25% up to 80%.
Direct investment surveys, as briefly described, haven’t changed significantly since 1997, with one major exception concerning the sampling procedure. Until 2001, BdP ran a census on all resident direct investment companies. The initial register was built upon the exchange control database, including all direct investment transactions up to end-1992, complemented with information from the balance of payments collection system, implemented in 1993. Every year, this register is updated, taking into account the results of the last survey (for e.g., companies that have stated to have ended the DI relationship), the new DI companies identified in the b.o.p. collection system, data from the Central Balance Sheet Database and other sources like the stock exchange database or the specialized press. On average, DI surveys were addressed to approximately 2500 and 1300 companies, for inward and outward DI respectively. In 2002, it was decided to launch the outward direct investment survey only to a sample of enterprises which accounted for over 95% of the last surveyed stock plus over 95% of the new DI transactions and including all majority-owned enterprises or enterprises with majority-owned foreign affiliates. Banks and insurance companies continued to be fully surveyed. This change resulted in a significant decrease in the number of enterprises surveyed (over 50% in the case of inward DI and over 70% in the case of outward DI), which allowed a better quality control of the reported data, namely because it is possible to monitor more closely each individual survey and respondent. The overall coverage of DI flows/positions is not significantly damaged since grossing-up methods were then introduced to estimate the remaining 5%.
In 2005, both questionnaires started to be launched simultaneously in order to take into account users’ need for more timely FDI data. In the former arrangement, each year the previous two years were surveyed, t–2 and t–1, and the final results were disseminated in February of t+1, along with other revisions to t–2 and t–1 b.o.p. and i.i.p. statistics. Especially in the case of t–2 final FDI statistics, this procedure meant that they would become available with a delay of 26 months.
Direct investment surveys have a first section concerning information on the resident company and as many annexes as the number of foreign investors/foreign affiliates. Collecting data on an investor-by-investor and affiliate-by-affiliate basis makes the questionnaires more robust to possible changes in the underlying methodology, allows for a more thorough quality control and gives the possibility to track investments over time.
In 2001, BdP implemented a new system for collecting data on securities’ transactions and holdings – Securities Statistics Integrated System (SIET) – which is an integrated data

124 IFC Bulletin No 30
collection system that serves the needs of external statistics (portfolio investment and related income), monetary and financial statistics and financial accounts. The system collects data for all types of securities except financial derivatives – shares and other equity and other short and long-term securities – mainly from the resident custodians – monetary financial institutions, brokers and dealers – who provide information on their account and on behalf of their customers. Other resident entities with securities held outside the resident financial sector must report these portfolios directly.
Monthly data on transactions and holdings is reported to the BdP electronically on a security-by-security and investor-by-investor basis. Individual securities are identified using the respective ISIN code. For securities with no ISIN code, reporters must provide some additional data: country and institutional sector of the issuer, type of security, currency of denomination and maturity. Resident investors are individually identified by their fiscal number, whereas for non-resident investors reporting agents provide information on their country of residency and institutional sector. Only data on households are aggregated under the ISO code of their country of residency. There is a simplification threshold of 500 million euros (applied to the monthly transactions and monthly outstanding amounts) below which reporting entities only provide information once a year and on a very simplified form. Finally, data is provided on both quantities and amounts traded or held. Transaction values and market values for positions are required. In the latter case, if there is no market price available, reporters can provide either the acquisition or the nominal value, indicating which one is being reported.
As for financial derivatives, data related to the monetary authority, general government and banking sectors are collected directly. In the case of banks, BdP implemented a specific monthly survey that collects not only data on their own account but also on transactions and end-of-period positions held on behalf of their customers (aggregated by institutional sector). Data is broken down by risk category (foreign exchange, single-currency interest rate, equity, commodities and other derivatives contracts) and by type of instrument (swaps, options, futures and other instruments) and it covers derivatives traded both in organized (stock exchange) or over-the-counter (OTC) markets.
For other investment several different data sources are used depending on the institutional sector. Therefore, data is collected from the Treasury (general government), BdP’s Accounting and Reserves Management Departments (monetary authority) and money and banking statistics (other monetary financial institutions). In the case of the other sectors, data is largely collected from ITRS and DR and complemented with other statistical data available, like the BIS International Banking Statistics (deposits and loans of the non-MFI sector).
Within other investment, trade credits are estimated based on information on imports and exports of goods and services (excluding travel) and on the average number of days in receivables from non-residents and in accounts payable to non-residents. This information is collected through a joint BdP/INE quarterly survey to non-financial enterprises which covers the major exporters and importers. Quarterly estimates are further revised based on annual data obtained from the Simplified Corporate Information (SCI). Through the SCI companies submit once a year, electronically, detailed information of accounting, fiscal and statistical natures that they usually have to remit to the Ministry of Justice, the Ministry of Finance, the INE and the BdP. A protocol established between the BdP, INE, Ministry of Justice and Ministry of Finance allow these entities to access annual data for the whole population of enterprises, both financial and non-financial.
Finally, reserve assets are collected directly from BdP’s Accounting and Reserves Management Departments.

IFC Bulletin No 30 125
The future of the Portuguese ITRS data collection system
The developing and deepening of the European integration poses some limitations and challenges to b.o.p. compilers. In 2004, the Regulation (CE) No. 2560/2001 of the European Parliament and the Council, concerning the cross-border payments in euro, imposed an exemption threshold of € 12,500 on the reporting of individual transactions carried out by banks on behalf of their customers. This threshold is expected to rise to € 50,000 in the beginning of 2009, implying a considerable loss of information in particular in the services account and, therefore, the need to find complementary sources to ITRS in this domain.
The studies carried out so far by the BdP showed that, in the Portuguese case, the population of enterprises involved in the import and export of services has a considerable concentration, with 16,5% of the enterprises being responsible for 90% of total services. Additionally, the diversity in the international trade in services is low: 91% of the exporters sell only one type of service, 80% of the importers purchase only one type of service and only 17% of the population are both exporters and importers. These characteristics, high concentration and low diversity, make direct reporting a better approach when compared to sample surveys. Consequently, in complement to ITRS, BdP is currently evaluating the change of the existing legal framework, namely making mandatory the figure of General Direct Reporter, as well as defining the criteria applicable in the selection of the most relevant enterprises in the context of external statistics.
In this regard, the major difficulty related to direct reporting, or sample survey, for b.o.p. is the high volatility of the relevant population. Although there is not an effective Business Register, BdP has, for the time being, a database with all entities involved in external transactions (built from ITRS and DR). In the future, there are possible ways to maintain and update this database on a yearly basis, such as asking the resident banks for the list of clients involved in foreign transactions or by the use of the Simplified Corporate Information.
Pros and cons of different compilation systems
Minimizing the response burden is one of the main objectives of modern statistical systems. The underlying idea is that it is possible to make better statistics with less effort and cost, for both the compilers and the respondents. Practical steps towards this objective are the optimization of samples, avoiding double questioning, promoting better coordination between offices in charge of data collection, increasing the use of administrative data, approximating (electronic) data collection templates of the respondents’ registers (formats and concepts) or defining simplification / exemption thresholds.
The choice of data collection methods and sources is an important strategic decision as it will impact a large number of aspects, including IT architecture, response burden imposed, data availability and implementation and running costs. The selection of the actual reporting scheme will depend on national specificities, like the size of the targeted population, the reporting practice and the institutional sector (e.g. a collection system designed for banks may not bring good results in the case of households). This section briefly discusses some advantages and constraints related to different features of data compilation systems.
When implementing a statistical compilation system, decisions have to be made about some of its specific features: type of data to collect (administrative vs. statistical data), the level of detail (aggregated vs. transaction-by-transaction), type of information (both stocks and flows vs. deriving flows from stocks or vice versa), collection method (census vs. sample survey) and reporting channel (indirect vs. direct reporting).
In general, administrative data has low costs and allows the reuse of an existing dataset – either as a direct input for statistics or as a tool for data quality control. However, for the

126 IFC Bulletin No 30
compiler, possible drawbacks may exist in terms of its coverage (targeted population), timeliness, frequency and lack of harmonization with existing statistical classifications and definitions. On the contrary, data collected specifically for a given statistical purpose will ensure adequate coverage and frequency, as well as compliance with statistical methodologies and concepts, but will imply a limited use of the data and potentially larger data collection costs. For respondents, the use of administrative data lowers their response burden and avoids the need to be aware of statistical methodologies and concepts.
Collecting aggregated data has the advantages for the compiler of reduced implementation and maintenance costs, resulting in a relatively small amount of data to keep. However, it also has the risk of potential miscalculation or the use of non-generalized aggregation procedures by the different reporting entities and it carries greater difficulties in cross-checking the data and in reconciling flows and stocks. Also for respondents, aggregate reporting usually means greater reporting burden in terms of details and breakdowns to be reported, the need to keep and maintain (in every respondent’s system) links between individual (business) records and aggregated (statistical) variables and the need to make adjustments in the reporting systems every time new or additional output requirements emerge.
On the other hand, transaction-by-transaction reporting ensures data accuracy and consistency, although meaning a shift of costs and work from the respondent to the compiler in terms of aggregation procedures and maintenance of individual transactions databases. The implementation of new requirements becomes more flexible and, in some cases, may not even imply the need to introduce changes in the respondents reporting systems. In the case of financial instruments, this type of system can be used to derive flows from high-frequency stock data, reducing the reporting burden for reporting agents and allowing for quality checks at a very detailed level. The reporting burden will also be reduced since the amount of detail (in terms of breakdowns) to be reported by respondents decreases. The main disadvantage of a transaction-by-transaction collection system is the higher cost of set up and maintenance.
Compared to sample surveys, census based data collection will guarantee full coverage of the population, with no need for estimation procedures or sampling techniques. However, it will also imply additional work for data control and a larger amount of data to store. For smaller respondents this will also impose uneven response burden.
Lastly, indirect settlement-based reporting (by resident banks) has the advantage of keeping the size of the reporting population relatively small while providing high-frequency timely data. It is easily adaptable to transaction-by-transaction reporting and carries fewer problems concerning double-counting. The main problems come from the existence of netting transactions between companies that prevent the collection of the gross figures and the need for complementary reporting (e.g. for settlements via accounts held abroad). Also pure stock statistics will have to be collected separately. Direct reporting can ensure the full reconciliation between flows and stocks and it is expected to provide better statistical classification. The major downside is the potentially large size of the reporting population (e.g. households). Also in the case of some specific sectors it may be difficult to receive timely and high-frequency data. The collection of individual transactions may be more difficult for sectors unfamiliar with this way of storing and reporting information and, finally, statistical principles and methodologies can differ from accounting principles used by a great number of respondents.

IFC Bulletin No 30 127
New collection system in Belgium for Balance of Payments BoP 2006 –
use of surveys and direct reporting for BoP
Daniel Desie1
Context of the new system
Before explaining the context of the new system, I believe it would be useful to describe first our previous system.
Until 2006, balance of payments statistics were produced using information provided via a settlement based system.
The majority of the information (± 96% in value) was delivered to the National Bank of Belgium via the payments registered on a daily basis by the commercial credit institutions in Belgium. They acted as intermediaries and played an important role in information gathering coding the nature of the underlying transactions made by their clients.
Besides that, information was delivered (± 4% in value) by a small number of companies (± 2.500) which directly declared their cross-border payments to the National Bank of Belgium. These were mainly direct declarants or companies with operational accounts abroad, companies with current account relations with abroad or companies participating in netting systems.
The choices we made in our new approach were mainly determined by the objectives of information collection.
The main objectives in changing our system were, on the one hand, quality improvement of the statistics by directly appealing to the information sources and, on the other hand, the reduction of the general administrative burden for the economic actors by limiting the number of declarants.
The underlying reasons were the assessment that payments registrations were not a good proxy anymore due to the diverging link between payment and transaction (as an answer to the growing complexity of the economic reality), the assessment of more differentiation in codes for direct declarants than for banks, and the decrease in differentiation in codes for some big companies over time (funnel effect). Of course also the discussions about the threshold of declaration (€ 50.000) played an important role in the decision making. The current prospect for the year 2011/2012 of the eventual implementation of a sunset clause (no statistical burden anymore) fully reinforce the choice we made and is a factor that may urge using similar processes.
Approach and practical aspects
A new dedicated team started in 2002 building up the new system by analysing first the data from the payments register via calculation of concentration, use of weights and creation of
1 Head of the Division International Trade in Services at the National Bank of Belgium (General Statistics
Department – External Statistics).

128 IFC Bulletin No 30
related time series and drawing conclusions in targeting populations: high concentration and stability over the years for the major items in services, breakdown of various components of services necessary, aim at exhaustiveness for the financial sector with a well known number of companies, recognising that exhaustiveness was not possible for the non-financial companies.
For assessing investment components, the former annual direct investment survey was fully upgraded by increasing the frequency and by expanding the content (adding other investments components).
The existing staff of the BoP unit mainly focused on the system regarding the portfolio investment components as well as some methodological aspects.
Main features of the new system
We directly contact the information source by maintaining direct contact with the companies and we no longer use information via the intermediation of the credit institutions.
As the new system replaces the previous system, this constitutes an abandon of the settlement based system.
The quantitative and descriptive analysis made, allowed us to conclude that we could subdivide the questionnaires into parts according to the sectors or economic activities we approach.
Where possible, we make use of existing sources (for instance: for the component goods, the intrastat data and customs data are used as the basic information).
We take activity code and size into account that results in a selective approach as regards the content of the surveys and population of declarants. This means that we try to get the information when and where it is most relevant.
As for definition of the desired information we refer to the bookkeeping, based on transactions instead of payments.
Declarations are to be submitted only electronically and of course the whole system is based on a legal obligation.
Briefly stated, our system is a modular system with different methods of treatment, different target populations, different company selection methods, different surveys and different frequencies of reporting in one and the same survey. We no longer have an exhaustive and rather rigid system with uniform treatment based on accounting methods and with an easy management, but instead, a selective system with different treatment, based on statistical methods (sampling, estimations, extrapolations, ...) with a more complex management but also with a higher level of flexibility.
External sources
The modular approach is also made possible due to the availability of different external data sources.
For the targeting of populations we use the following databases:
– VAT database: ±565.000 companies, targeting the population of general declarants, transport, construction, commercial services.
IFC Bulletin No 30 129
– Foreign trade database (16.000 companies): intrastat and customs declarations used for general merchandise, return of goods, diamonds, precious metals. Where required, methodological corrections have to be made. This is more problematic for merchant trade, goods for processing, goods procured in ports, repairs on goods.
– Structural business survey (36.000 companies): additional questions are asked, such as “turnover abroad of which services with abroad” and “purchases of commodities, raw and auxiliary materials, services and varia, of which services with abroad”.
– Annual balance sheets database (270.000 companies): used for selection of population for direct investment surveys via threshold on own funds, total equity, fixed financial assets; also used for selection of population for other investment surveys via threshold on total assets/liabilities, total amount receivable at more than 1 year, total amount payable at more than 1 year; also used for selection of population for portfolio data collection with non-financial companies via threshold on shares and bonds.
– National account database (750.000 companies) with useful variables such as Class size, Sector (CIS), Category, Annual account Type,...
– KBO (crossroad database enterprises, 1.250.000 companies): central database hosted at Ministry of Economic Affairs of enterprises (natural and legal persons in private and public law with an unique enterprise number and basic identification data such as name, address, activities, legal form, legal status, ...).
– International payment files: monthly list from banks with identification of operators with payments abroad with number of transactions, without transaction code, currency, country, amount.
– Other sources: credit card users, Household survey, Private consumption survey, Public services sources, social security, ...).
Sections of the new system: services
Already since 2002 the data of intrastat declarations and custom (extrastat) declarations were integrated in the balance of payments statistics instead of the data from the settlements registration system. So there was no interruption in the data for goods transactions when we abandoned the settlement based system in 2006. For services (and transfers) the data collection was completely new and based on surveys.
The survey system is built up as a set of sub-surveys that classify specific transactions such as transport, construction and industrial installation, insurance, business trips and seminars, activities performed by non-resident employees, other services (post, telecom, information services, computer services, accounting, advertising and legal services, technical and scientific services, audio-visual and personal services, culture and leisure, financial services, ...) and transfers. Besides type (nature) of transaction , ISO 4217 currency code, ISO 3166 country code and value of purchases and/or sales are asked. Depending on importance (along VAT data or other criteria) a differentiation is made for frequency (monthly or quarterly and for some specific financial subsector populations annual declarations).
The declarations contain an administrative part with metadata about the declarant (identification and contact) and the declaration (type, date) besides the effective transactions.
Beside activity code, for some surveys a VAT threshold is used (survey F01DGS: big companies and survey F03AVS: audiovisual media); for tour operators (survey F02TRA) a turnover threshold is used; for insurance brokers (survey F02BRO) a threshold on number of employees is used.

130 IFC Bulletin No 30
The other surveys are based on a random sampling approach (survey F03TRP: transport, surveys F13CON and F23CON: construction, survey F03CMS: specific services).
For the coordination centres (survey F01CDC) and for the financial sector (survey F01PKI: credit institutions, survey F02INS: insurance companies, survey F02RIN: reinsurance companies, survey F02PSF: pension funds, survey F02OPC: mutual funds, survey F02STB: stock exchange companies, survey F02INV: investment funds) official exhaustive lists are used for company selection.
For each of these surveys only one specific target population is identified and each individual company can only be part of one single specific population to be surveyed.
Besides the surveys on services a survey on foreign debts and receivables (S03CCR) is organised via random sampling and a survey on merchanting (F03MER) is organised for a selective group of companies to obtain triangular trade.
Sections of the new system: direct and other investments
In the past the Bank already used an annual survey of direct investments (outstanding amounts).
The flows were collected via the settlements data collection system. For the new system, the survey on direct investments was fully adjusted at the level of contents and frequency and integrated in our web application.
Selection was made on criteria based on balance sheet items (total equity, total assets/liabilities, total financial fixed assets). According to importance the target population was divided in three groups: major declarants (111 companies), medium declarants (289 companies) and small declarants (3.397 companies). Selected companies continue to be required to submit a declaration.
The basic principle for direct investment is that data are asked for each non-resident counterpart (bilateral) with a computerised identification of counterparties based on group structure and participation percentage of each group company (survey GRPFDI).
The application determines the non-resident counterparties which are relevant for the surveys on foreign direct investment.
Four types of data are asked for: transactions/changes during the period (survey F13FDI), outstanding amounts (survey S13FDI), results (survey R13FDI) and economic variables about subsidiaries/branch offices (survey S13FAT), with a breakdown by currency, but with different frequencies:
major (monthly flows and quarterly stocks), medium (monthly flows and yearly stocks), small (yearly flows and stocks).
For other investments new surveys were created.
These surveys concern, besides companies that were selected for direct investment, some other companies selected, based on additional criteria of balance sheet items (total assets/liabilities, total amount receivable at more than 1 year, total amount payable at more than 1 year). Two types of information are asked: transactions during the period (survey F13FOI) and outstanding balances (survey S13FOI), with a breakdown by country and by currency.
As well as for other investment surveys, there is a differentiation in frequency.

IFC Bulletin No 30 131
Sections of the new system: securities
Also for securities a set of surveys is created with end-investors (survey S10PKI: credit institutions, survey S10INS and S10RIN: insurance companies, survey S10PSF: pension funds, survey S10OPC: mutual funds, survey S10STB: stock broking companies and survey S10SNF: other large non-financial companies), custodians (credit institutions and stock broking companies) and issuers (all-end investors, government, listed companies, issuers of commercial paper and bonds) as target population.
The holdings of the household sector and of the smaller enterprises are covered as far as they are entrusted to resident custodians.
The choice was made to ask for stock data on a security by security basis on a monthly or quarterly basis with derivation of flow data.
Information technology
Declarations must be submitted electronically only. We therefore developed an internet application for declaration called CSSR: Central Server for Statistical Reporting. All statistical declarations are required to be delivered via this portal site.
The supply of communication channels had to be sufficient large in order to make the accessibility of the system for declarants as big as possible.
The different possibilities we have foreseen are:
– manual input of data via the electronic web form.
– uploading of a CSV file in the web form
– sending of a file in XML format by e-mail to a specific e-mail address
– secure uploading via FTP of an XML-file.
This electronic approach improves the automated treatment of data.
Conclusion
Now after 1 year of production of the concerned macro economic statistics on the basis of data from the new collection system, we observe a continuity at aggregated level for services but a rupture on detailed component level. We already believe data are of a higher quality than those obtained via the settlement basis system. But we are still dealing with several problems to resolve.
It is important to keep good contacts with companies and to have a good check on delivered data.
After analysis of the incoming data we already made some adaptations on companies selection and on the content of the surveys in order to improve quality.
Our selection methods are also influenced by external circumstances such as the implementation of VAT-units by federal law (which results in the fact that we have no longer information on micro-economic level of companies), the change of NACE classification for selection of companies, the future implementation of BPM6 methodology, etc.

132 IFC Bulletin No 30
Surveys for compilation of external sector statistics in India
Narender Singh Rawat1
Prologue With increasing globalization and developments, especially in trade, banking, financial and other sectors of economy, timely compilation of external sector statistics as per the international standards, has become extremely important from the point of monitoring and analysis of external sector vulnerability and taking appropriate informed decisions. Balance of Payments (BoP), External Debt, Foreign Investments (inflows), Non-resident Deposits and International Investment Position (IIP) are the major external sector statistics compiled and published by the Reserve Bank of India. The analytical framework, concepts, definitions, scope of data, accounting convention, nature of basic data sources, compilation practices, etc. are briefly summarized below for these external sector statistics. The various surveys being conducted by the Bank for collecting information, which are used to compile the external sector statistics, are mentioned along with these statistics.
I. Balance of payments
The BoP is a statistical statement that systematically summarizes, for a specific time period, the economic transactions of an economy with the rest of the world. Transactions between residents and non-residents consist of those involving goods, services, and income; involving financial claims on and liabilities to the rest of the world; and those classified as transfers, involving offsetting entries to balance one-sided transactions. In India, BoP transactions are recorded in accordance with the guidelines in the fifth edition of IMF’s Balance of Payments Manual (1993) [BPM5], with minor modifications to adapt to the specifics of the Indian situation.
The basic structure of the Balance of Payments (BOP) of India consists of:
• Current account: exports and imports of goods, services, income (both investment income and compensation of employees) and current transfers;
• Capital account: assets and liabilities on account of direct investment, portfolio investment, loans, banking capital and other capital;
• Statistical discrepancy; and
• International reserves and IMF transactions.
Data Sources: The data for compiling BoP statistics are received from the banking system as part of the Foreign Exchange Management Act (FEMA), 1999, and also through various returns and from other institutions like Director General of Commercial Intelligence and Statistics (DGCIS), the National Association of Software and Services Companies (NASSCOM), etc. Apart from this, Survey of Unclassified Receipts and Foreign Liabilities & Assets Survey are also used.
1 Director in the Forecasting Division of Department of Statistics and Information Management, Reserve Bank of
India. Views expressed are personal. He is thankful to Dr. A K Srimany, Director and Dr. Balwant Singh, Adviser for their support and guidance. Usual disclaimer applies
IFC Bulletin No 30 133
Data Dissemination: At present, BoP statistics are published in two formats viz., standard presentation with broad heads and detailed presentation with break-up of broad heads. The standard presentation with broad heads is compiled in accordance with the methodology set out in BPM5 and is published every quarter with a lag of three months as per IMF’s Special Data Dissemination Standards (SDDS) requirements. The disaggregated data on invisibles are finalized and published once the firm data on components become available. Invisibles are broadly classified under three heads viz., services, transfers and income. While services, comprise travel, transportation, insurance, government not included elsewhere (GNIE) and miscellaneous (i.e. other services); transfers constitute private transfers and official transfers and income includes investment income and compensation of employees.
Revisions Policy for India’s Balance of Payments Data: India’s BoP statistics are published as “preliminary”, “partially revised” and “revised” data. Preliminary data are quarterly and are released with a lag of three months from the reference date (i.e., data for the quarter ending March 2004 are available at the end of June 2004). Preliminary data are subjected to some revisions during the year and partially revised data are released with lags of six months, nine months and twelve months from the reference date, alongside preliminary data for the relevant quarter(s). Partial revisions in the annual data are carried out with a lag of eighteen months from the reference date. Thereafter, the data are “frozen” and final revisions are incorporated in the revised data, which are released within a lag of twenty-four months from the reference date. Extraordinary revisions may be undertaken within this cycle in the event of methodological changes in respect of data collection and compilation procedures and/or significant changes indicated by data sources that cause structural shifts in the data series. These extraordinary revisions are documented at the time of release. Preliminary, partially revised and revised data are clearly identified in the text and tables.
II. External debt
The definition of gross external debt adopted by India is based on the definition provided in 1988 by the International Working Group on External Debt Statistics (IWGEDS), which was set up jointly by the Bank for International Settlements (BIS), IMF, the Organization for Economic Cooperation and Development (OECD) and the World Bank. According to the core definition of external debt given by the IWGEDS “gross external debt is the amount, at any given time, of disbursed and outstanding contractual liabilities of residents of a country to non-residents to repay principal, with or without interest, or to pay interest, with or without principal”. The coverage of data is broadly consistent with the recommendations made in IMF’s “External Debt Statistics – Guide for Compilers and Users”, 1993. The external debt classification distinguishes between types of debtor/creditor, by maturity, i.e., long term and short term, by type of transactions, i.e., deposit or trade related and by element of concessionality.
The gross external debt of the country is classified under eight categories: (i) multilateral; (ii) bilateral; (iii) IMF; (iv) trade credits; (v) commercial borrowings; (vi) NRI deposits; (vii) rupee debt; and (viii) short-term debt of maturity up to one year. In contrast to the liabilities side of the international investment position (IIP), the external debt data do not include any financial liabilities arising from foreign direct investment (except loans obtained by FDI enterprises in India from their parent company abroad) and equity component of foreign portfolio investment.
At present various sources are used for obtaining information on various components of the external debt. The office of the Controller of Aid, Accounts and Audit Division, Ministry of Finance (MoF), Government of India (GoI) collects information on (i) multilateral and bilateral debt, excluding that part of multilateral/bilateral non-concessional debt to non-government

134 IFC Bulletin No 30
entities for which approval needs to be sought under the ECB route; (ii) bilateral component of trade credit.
The External Debt Management Unit (EDMU) of the Department of Economic Affairs, MoF, GoI, collects data on rupee debt and export credit component for defence purposes. Securities and Exchange Board of India (SEBI) is the source for data on FII investment in debt instruments. Information on all other components of debt, viz., commercial borrowings, NRI deposits and trade credits (both long and short term) is collected by the Reserve Bank of India through various returns.
External debt data are compiled and disseminated on original maturity basis and both in terms of US dollar and Indian rupees. The external debt figures are first compiled in terms of Indian rupees and then converted into US dollar at the spot exchange rate on the reference date. India’s external debt data are disseminated under two broad heads namely, long-term and short-term. Long-term debt is classified into multilateral, bilateral, IMF, export credit, commercial borrowings, rupee debt and NRI deposits. Short-term debt comprises NRI deposits and trade related credits.
The Reserve Bank of India compiles and publishes quarterly data on India’s external debt for quarters ending March and June and the Ministry of Finance, Government of India releases external debt data for quarters ending September and December. Further, India supplies the information on external debt as per the standard format prescribed under the Quarterly External Debt Database, jointly developed by the World Bank and the International Monetary Fund.
III. Foreign investment (inflows)
Foreign investment inflows can be broadly categorised as Foreign Direct Investment (FDI) and Foreign Portfolio Investment (FPI). FDI is the process whereby residents of one country (the home country) acquire ownership of assets for the purpose of controlling the production, distribution and other activities of a firm in another country (the host country). Following the IMF practice and in line with other country practices, India’s foreign investment data is published under two broad heads, i.e., FDI and FPI. FDI inflows include reinvested earnings and other direct capital flows, besides equity capital. Portfolio Investment includes investment in equity securities and debt securities in the form of bonds and notes, money market instruments and other instruments such as American Depository Receipts / Global Depository Receipts (ADR/GDR) that usually denotes ownership of equity.
Foreign Investment data is compiled and presented in terms of US dollar. The basic source for obtaining information on various components of foreign investment remains the Reserve Bank of India. Following the methodology prescribed in BPM5, data on fresh inflows of foreign direct investment are being captured through reporting of these transactions by the companies who receive these funds. The companies, who receive the foreign investment, send these receipts with full details to the Reserve Bank, which are then consolidated and used for compilation of direct investment data. Amount raised by the corporate through issuances of ADRs/GDRs are reported to the Reserve Bank. It also separately obtains from the custodians on weekly basis details of actual inflows/outflows into the accounts of the FIIs. Data on reinvested earnings and other capital is captured through annual surveys on FDI companies. These different components are then, finally compiled and consolidated to obtain the data on aggregate foreign investment in India.
In India, foreign investment data are compiled on a monthly basis by the RBI, using an international transactions reporting system (ITRS) as the principal source of information. The foreign investment data is published on a monthly basis in the RBI Bulletin, which provides component-wise details of direct investment and portfolio investment.

IFC Bulletin No 30 135
IV. Non-resident deposits
An Indian Citizen residing outside India and a Foreign Citizen of Indian origin residing outside India for employment / carrying on business or vocation outside India or staying abroad under circumstances indicating an intention for an uncertain duration of stay abroad are defined as Non-Resident Indians (NRIs). Persons posted in United Nations organizations and officials deputed abroad by Central/State Governments and public sector undertakings on temporary assignments are also treated as non-residents.
Foreign citizens of Indian origin are treated at par with NRIs for certain facilities under bank deposits and investments in India. “A person of Indian origin” means an individual (not being a citizen of Pakistan or Bangladesh or Sri Lanka), who at any time, held an Indian passport; or who or either of whose parents or whose grandparents were citizens of India by virtue of the Constitution of India or the Citizenship Act, 1955 (57 of 1955).
NRIs are allowed to open and maintain bank accounts in India under special deposit schemes – both rupee denominated and foreign currency denominated. Such deposits are termed NRI deposits. NRI deposits include deposits under Foreign Currency Non-resident (Banks) [FCNR(B)] and Non-resident (External) Rupee Account (NR(E)RA).
FCNR(B) deposits are designated in foreign currency. They are accepted in Pound Sterling, US Dollar, EURO, Japanese yen, Australian dollar and Canadian dollar. FCNR(B) deposits are accepted for the tenure of one year and above but less than two years, two years and above but less than three years and three years & above up to five years only. FCNR (B) deposits are compiled and disseminated in US dollar. For FCNR (B) deposits, conversion into a numeraire currency (US dollar) is done on the basis of average monthly exchange rate.
NR(E)RA, on the other hand, is a rupee denominated deposit schemes, where in NRIs can park their funds in both term deposits as well savings accounts. NRE deposits data are first compiled in terms of Indian rupees and then converted into US dollar. The stock data at the end of each month is calculated on the basis of end-period exchange rate for the respective month. For compilation of the monthly net flow figures, the average rupee–US dollar exchange rate for the month is used for conversion.
The basic source for obtaining information on various components of NRI deposits is the Reserve Bank of India. At present, the monthly outstanding balances under the existing Non-Resident Deposit schemes are compiled on the basis of fortnightly statement on external liabilities received by Reserve Bank of India (RBI) under Section 42(2) of the RBI Act. These data are supplemented by information received in the form of monthly statements submitted by ADs to the Reserve Bank for calculating the maturity structure and comparing the balances under various deposits.
The figures on NRI deposits are published in the Reserve Bank of India Bulletin on a monthly basis. It is also published every quarter in the table on Balance of Payments of the Bulletin.
V. International investment position
The conceptual framework of foreign investment position of a country was introduced in the form of International Investment Position (IIP) BPM5. The IIP is the balance sheet of the stock of external financial assets and liabilities of a country at the end of a specific period (quarter end or year end). As per BPM5(1993), international investments assets are broadly classified under five categories viz. direct investment, portfolio investment, financial derivatives, other investment and reserve assets where as international investment liabilities are classified under four categories viz. direct investment, portfolio investment, financial derivatives and other investment. Further, SDDS of IMF prescribes disseminating annual

136 IFC Bulletin No 30
data within two quarters after the end of the reference period. The SDDS encourages quarterly frequency and a one-quarter lag for publishing IIP statements.
The Reserve Bank started compiling IIP on annual (end-March) basis from 2002 onwards, as per SDDS of IMF. The annual IIP data of India for the period end March 1997 to end March 2002 was compiled and released on September 30, 2002 on RBI website. Since then, annual IIP of India, as on end March, is compiled and disseminated every year in conformity with the SDDS of IMF. With the gradual opening up of the Indian economy and increased globalization and considering the importance of IIP statistics, India has started compiling and publishing quarterly IIP from the quarter ended June 2006 onwards.
Surveys conducted for compilation of external sector statistics The Department of Statistics and Information Management (DSIM) conducts the following surveys, which are used as inputs for compilation of external sector statistics:
A. Survey of Unclassified Receipts B. Foreign Liabilities and Assets Survey C. Coordinated Portfolio Investment Survey The Survey of Unclassified Receipts is conducted for collecting the information from the banking sector in respect of invisible receipt transactions (other than exports) below Rs. 0.5 million. The basic objective of this survey is to estimate the distribution pattern of inward foreign exchange remittance transactions below Rs. 0.5 million. The AD branches are selected based on their volume, i.e., branches having total invisible receipt of Rs. 50 million and above from the individual transactions below the threshold limit (Rs. 0.5 million per transaction) during a year are selected for surveys, to be conducted in the year. Information is collected for two randomly selected dates in a fortnight. These random dates during a quarter are informed by the Reserve Bank to AD branches, who supply the information for a fortnight within 7 days from the end of the fortnight. Purpose, Country and Currency wise distributions are estimated based on the Quick Estimate figures (aggregate Value) for transactions below Rs. 0.5 million.
The Foreign Liabilities and Assets (FLA) Survey is conducted annually for Non-financial companies, Insurance companies (both life & non-life) and Mutual fund companies to collect the data on their foreign liabilities and assets in terms of direct investments, portfolio investments and other investments. The data collected is used for compiling assets of “Other Sectors” of IIP and also for reinvested earnings (inflow).
For FLA survey, purposive sampling technique is used to collect the data from non-financial companies whereas census is conducted to obtain the data from Insurance (both life & non-life) and Mutual fund companies. The response from insurance and mutual fund companies to FLA survey is cent percent, but the response from non-financial companies is not up to the satisfactory level. One of the reasons is that it is not mandatory for the companies to response to the survey as there is no statistical law in the country. Also sometimes, the data quality is poor due to conceptual misunderstanding by some of the companies.
For improving the data response and quality, DSIM conducts meetings and have regular interactions with the entities supplying the required information. Further, as an alternative to survey, the data items of the survey schedule have been incorporated in Foreign Collaborator General Purpose Reporting (FCGPR) form as a Part B. All Indian companies receiving foreign investments are required to submit FCGPR form under FEMA, 1999 and it has been made mandatory for them to submit the Part B (annual performance report), detailing the stock position of company’s external assets and liabilities as at end of the closing of books of the company. Similarly, to capture the foreign assets of an Indian company by investments abroad, a revised overseas direct investment information system (ODIIS) is being developed. Once these two systems get stabilized, the information on
IFC Bulletin No 30 137
foreign liabilities and assets of a company as end of their financial year (March) will be more reliable and accurate.
The Coordinated Portfolio Investment Survey (CPIS) was conducted first time in 1997 under the auspices of the IMF to improve upon the global asymmetries observed/reported in the BoP data, especially those in portfolio investments flows. There were 29 countries, which participated in CPIS in 1997. India started participating in CPIS since December 2004.
In India, CPIS is conducted on an annual basis (as at end-December) to improve the statistics of holding of portfolio investments assets in the form of equity, long-term and short-term debt securities and its geographical distribution. For compilation of CPIS statistics, purposive sampling technique is used to collect the data from banks and Non-financial companies whereas census is conducted to obtain the data from insurance (both life & non-life) and mutual fund companies. The response from banks, insurance and mutual fund companies to CPIS is 100 per cent, but the response from Non-financial companies is not up to the satisfactory level. One of the reasons for poor response is the absence of legal backing and also conceptual misunderstanding by some of the entities.
Epilogue In India, conceptual aspects, definitions, scope of data, accounting convention, nature of basic data sources, etc., for most of the external sector statistics, are based on IMF’s Balance of Payments Manual (5th Edition) and these statistics are compiled and disseminated as per the SDDS of IMF. Use of survey is not a major data source for compiling external sector statistics and for most of the statistics, it is based on the transactions reporting system. Although, survey of unclassified receipts, foreign liabilities and assets, coordinated portfolio investment survey, etc. are being used by the Reserve Bank for compiling for some of the items of the external sector statistics, but response is not up to the mark, especially from the non-financial corporate for FLA survey and CPIS. One major reason for non-response is not having a statistical law in the country and also conceptual misunderstanding by some of the entities.

138 IFC Bulletin No 30
Overview on external data compilation
Lui Kwee Ching1
I. Overview
1. The compilation of external data in Malaysia is managed by the Central Bank of Malaysia (BNM) and the Department of Statistics, Malaysia (DOSM). BNM is the official compiler of External Debt Statistics (EDS), Coordinated Portfolio Investment Statistics (CPIS) and Consolidated Banking Statistics (CBS), while DOSM is the official compiler of the Balance of Payments (BOP) Statistics and the International Investment Position (IIP).
2. Both agencies carry out their own roles and responsibilities within the legal confines where BNM collects the data under the Central Bank of Malaysia Act 1958 and DOSM collects the data under Statistics Act 1965. Nevertheless, both BNM and DOSM work closely to compile information on international transactions.
II. Sources and uses of external data
3. Data for the compilation of international transactions by BNM are sourced from compulsory reporting by all the banking institutions, resident companies that have been given exchange administration approval by the Foreign Exchange Administration Department of BNM as well as other government agencies. It is also supplemented from surveys on companies that have conducted financial transactions vis-à-vis non-residents.
4. On the other hand, DOSM sourced data from banking institutions, listed companies with equity holding by non-residents, companies that have obtained approval from the Malaysian Industrial Development Authority for foreign direct investment, data from other government agencies as well as supplementary data from BNM.
5. The compilation of external data encompasses economic entities with foreign assets and/or liabilities. In BNM, the data coverage includes the following:
(a) Data of Cash BOP flows that are effected through the banking system. The data is submitted by the banking institutions through a customised application system residing at the banking institutions on a daily or monthly basis;
(b) Data on international investment position is collected via quarterly surveys from the banking institutions and companies:
(i) Data on external assets and liabilities of banking institutions;
(ii) Data on external assets and liabilities of resident companies, which include credit facilities from non-residents, investment abroad and foreign investment in Malaysia; and
1 Manager in the Statistical Services Department at Central Bank of Malaysia (Bank Negara Malaysia).

IFC Bulletin No 30 139
(iii) Data on portfolio investments reported by custodians, which include holding of Malaysian securities by non-residents and portfolio investments of residents abroad.
(c) Data on external assets and liabilities of offshore entities in Labuan, compiled by the Labuan Offshore Financial Services Authority on a quarterly basis. The consolidated data is then forwarded to BNM and subsequently uploaded into the system; and
(d) Data on the government sector, obtained from the administrative records of the Treasury Department of the Ministry of Finance and the Economic Planning Unit of the Prime Minister Department.
6. The external data compiled is then consolidated into various reports for surveillance, policy assessment and formulation, research and analysis, as well as dissemination to international organisations and other publications.
III. Survey of external assets and liabilities
Selection of survey respondents 7. The quarterly survey on resident companies, which covers more than 2,000 companies
(both listed and unlisted) in Malaysia, has been conducted since 2005. Besides the banking institutions, the respondents were identified from companies with approvals for exchange administration, custodians of funds (companies act as custodian which hold or manage securities on behalf of investors), companies with foreign direct investment, companies with significant transactions effected through the banking system and news reported in the media as well as information provided by other sources. The selection criteria are reviewed quarterly to ensure the right survey respondents are included and the data collected are comprehensive and reflective of the economy.
Data submission 8. The selected respondents are required to submit the data within 20 days after the
reference period via an integrated online system. As the same set of data is being used to generate various reports including EDS, BOP, IIP, CPIS and CBS (for banking institutions only), the respondents are required to submit very detailed data. For example, respondents are required to provide data on a profile-by-profile basis for each of the instrument. In particular, for the reporting of portfolio investment, it is on a security-by-security approach.
9. In view of the voluminous amount of data required for submission, most of the banking institutions prepare their source data in a standard interface file format and upload it to the customised application system residing at their premise. The data is transmitted to BNM at the end of the day via a secure network. The banking institutions are also given an option to key in the data directly to the system.
10. For the non-bank respondents, the data can be submitted through the web-based online application or by a pre-formatted template which upon completion, can be uploaded by the respondents at the website to transmit the report online.
11. The submission rate of this survey has been remarkable. At the close of survey, ie 2 months after the reporting period, all banking institutions submitted their data and the submission rate is over 90% for the non-bank respondents.

140 IFC Bulletin No 30
Handling of non-submission 12. Although the submission rate is not an issue for BNM, the non-submission of reports
by existing companies may contribute to under-reporting of data. Hence, to avoid huge differences of the consolidated outstanding balance with the preceding reporting period, the position of such companies is rolled-over based on the last closing position.
Data quality 13. Various procedures on data quality checking have been implemented to ensure
credible data are disseminated to the users. Besides incorporating validation checks into the application system, particular focus has been on the major companies in view of their significant contribution to the data. Among the measures taken include:
(a) Incorporating validation rules into the application system to eliminate possible data discrepancies before submission to BNM. At BNM, the data received is validated to eliminate errors as well as to highlight possible errors made by the reporting entities;
(b) Conducting verification checks against approval databases on loans extension to non-residents, loans obtained from non-residents and investment abroad to ensure data submitted is correct;
(c) Conducting data trend analysis at macro and micro levels to identify outliers, especially the major companies; and
(d) Assessing consistency of data against other external data sources such as financial reporting by the banking institutions, portfolio investment and other published financial indicators.
14. The following activities were also carried out to complement the above procedures to improve the data quality:
(a) Scheduling regular meetings with the reporting entities to provide clarification on reporting requirements as well as addressing reporting issues;
(b) Conducting customised training programmes on reporting requirements at strategic locations within the country as well as providing hands-on training sessions for the reporting entities to familiarise themselves with the functionality of the online reporting system; and
(c) Conducting technical meetings with relevant officials from different departments/agencies before finalising and disseminating the data to identify possible data errors.
IV. Compilation challenges
15. The compilation of external data is very challenging considering the complex data requirements as well as difficulties in getting many data suppliers to provide data within the agreed timeline. In addition, the short reporting deadlines, limited time available for data quality checks as well as the constraint of available resources have also contributed to more demanding compilation jobs. At the moment, the survey of non-bank companies is being carried out by a team of 13 officers.
16. Amongst the challenges encountered during the compilation of data include:
(a) Determining an appropriate survey frame that is comprehensive;

IFC Bulletin No 30 141
(b) Reporting by survey respondents using the similar valuation basis (ie market value);
(c) Enforcing timeliness of submission by survey respondents due to their workload and availability of resources;
(d) Meeting increasing data demands of users;
(e) Reconciling the external data between flows and stock position; and
(f) Dealing with complaints or feedback from resident companies on reporting burden in view of the many reports required to be submitted to BNM and other government agencies.
V. Latest update
17. In carrying out the roles and responsibilities, there is some duplication of work between BNM and DOSM as well as duplication of reporting by some companies that submit similar data to both agencies. Adding to the burden, the data compiled by both agencies differ mainly due to differences in survey frame and some misinterpretation of data requirements by the reporting entities. This has given rise to a tedious and time consuming process to reconcile the data every quarter.
18. Since 2006, both BNM and DOSM have been working together to address the issues highlighted above to streamline compilation effort and improve operational efficiency. On such effort, beginning from the first quarter of 2008, the Survey of International Investment Position has been jointly conducted by both agencies. At the same time, the Survey of External Assets and Liabilities conducted by BNM and Quarterly Survey of International Investment and Services conducted by DOSM previously have been discontinued.
19. The collaborative initiative by BNM and DOSM has successfully reduced the reporting burden for more than 2,000 companies. Furthermore, it has also shortened the time lag for the publication of the Annual IIP to six months instead of nine months.
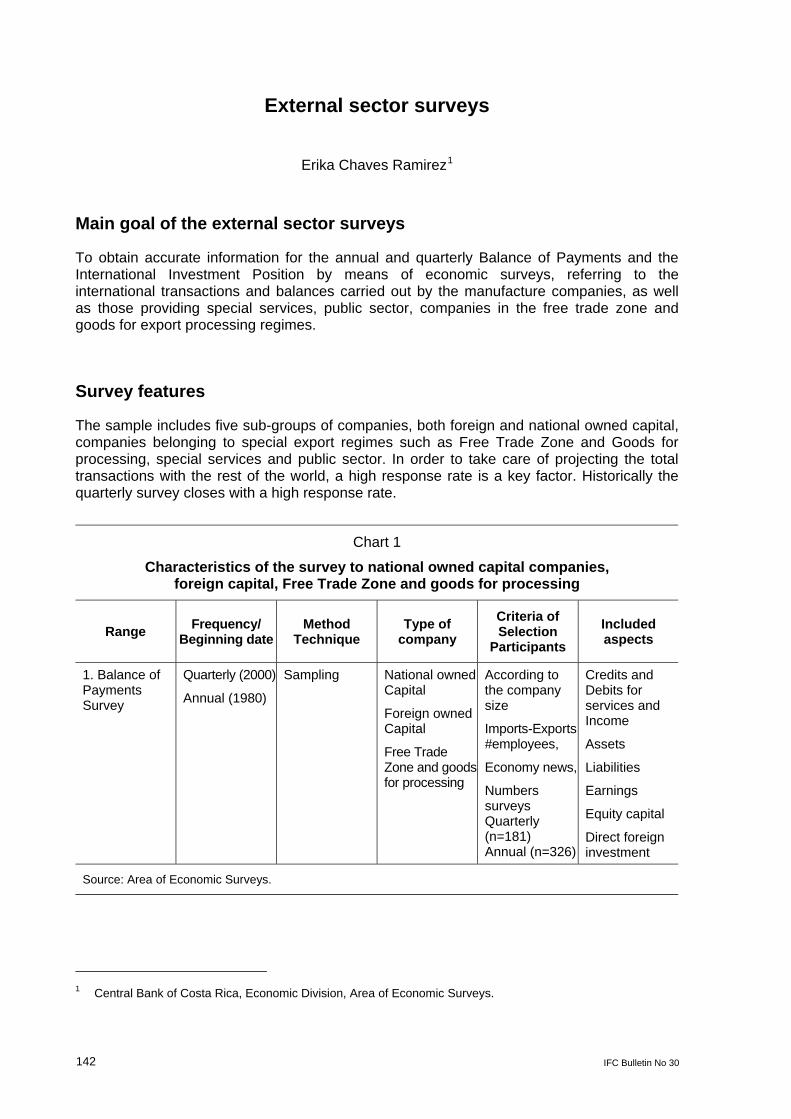
142 IFC Bulletin No 30
External sector surveys
Erika Chaves Ramirez1
Main goal of the external sector surveys
To obtain accurate information for the annual and quarterly Balance of Payments and the International Investment Position by means of economic surveys, referring to the international transactions and balances carried out by the manufacture companies, as well as those providing special services, public sector, companies in the free trade zone and goods for export processing regimes.
Survey features
The sample includes five sub-groups of companies, both foreign and national owned capital, companies belonging to special export regimes such as Free Trade Zone and Goods for processing, special services and public sector. In order to take care of projecting the total transactions with the rest of the world, a high response rate is a key factor. Historically the quarterly survey closes with a high response rate.
Chart 1
Characteristics of the survey to national owned capital companies, foreign capital, Free Trade Zone and goods for processing
Range Frequency/ Beginning date
Method Technique
Type of company
Criteria of Selection
Participants Included aspects
1. Balance of Payments Survey
Quarterly (2000)
Annual (1980)
Sampling National owned Capital
Foreign owned Capital
Free Trade Zone and goods for processing
According to the company size
Imports-Exports #employees,
Economy news,
Numbers surveys Quarterly (n=181) Annual (n=326)
Credits and Debits for services and Income
Assets
Liabilities
Earnings
Equity capital
Direct foreign investment
Source: Area of Economic Surveys.
1 Central Bank of Costa Rica, Economic Division, Area of Economic Surveys.

IFC Bulletin No 30 143
Chart 2
Characteristics of the survey to companies of special services
Range Frequency/ Beginning date
Method Technique
Type of company
Criteria of Selection
Participants Included aspects
2. Survey of Specific Services
Quarterly (2000)
Annual (1980)
Sampling • Airlines
• Shipping liner
• Ground transportation
• Courier
• TV-broadcast
• College
• Banks
• Insurance companies
• Software developing companies
• Call centers
• NGO’s
• Public sector
Size, # employees, trips, capacities, list of companies from different service chambers
Quarterly (n=90) Annual (n=45)
• Transportation
• Travel related services
• Communica-tion
• Financial services
• Insurance services
• Computer and information services
• Other business, professional and technical services
• Government services
Source: Area of Economic Surveys.
Chart 3
Characteristics of the survey to remittance companies, migrants and homes
Range Frequency/ Beginning date
Method Technique
Type of company
Criteria of Selection
Participants Included aspects
3. Survey of Workers’ Remittances
4. Investigation includes surveys to emigrants and immigrants1
Trimester (2001)
Triennial (2003–2005–2008)
Sampling Remittances companies
Banks
Immigrants
Emigrants
Homes
Size according to the amount of compromised remittances
Quarterly (n=30)
Annual (n=384)
It includes socioeconomic aspects related to the workers’ remittances
1 There is also a survey to emigrants through consulates.
Source: Area of Economic Surveys.

144 IFC Bulletin No 30
Methodological aspects
The quarterly and annual survey is carried out between April of year t and May of the year t+1.The first, second, third and fourth quarterly survey is asked for the first week of April, July, October and January respectively; It takes around 8 weeks from the date of request to receive, review and type the incoming information. On the other hand, the annual survey is requested on October for the companies of fiscal closing or in January for the companies of regular closing or what is the same end up on December.
The sample of the annual and quarterly survey conducted by the Area of Economic Surveys includes approximately 670 companies; of which 279 belong to special export regimes such as Free Trade Zone Goods for Processing, 130 special services, 125 companies of national owned capital and 134 of foreign owned capital.
The delivery is made via email to informants who have been part of previous samples; for the new companies, the form is delivered personally which is explained in an initial visit.
The survey tracking is made by calls, reminders via email and visits to the companies. The Area of Economic Surveys emphasizes in the personal and telephone communication with people in charge of providing the information, by means of explaining the importance of data, and make them realize its value, and to promote the use of numbers with statistical figures and in aggregate data. The information of each company is treated with total confidentiality.
Data collection it’s made via e-mail, telephone, fax and visits to companies. Once the most of the answers have been received, the missing ones are estimated and the projecting charts displayed to the compiler of the Balance of Payments are prepared. Typing is revised on an individual and added basis. A document is prepared for each survey when done to summarize the results, and disclosed in the internal site of the BCCR.
Main contributions of the survey
• The survey of BOP is a fundamental input for the compilation of the BOP and the IIP.
• It provides information to the national accounts.
• It is a base for other economic surveys.
• It provides information for economic research.

IFC Bulletin No 30 145
Use of surveys to compile external statistics in the Central Bank of Chile
Paulina Rodríguez1
1. Introduction
This document presents a general description of the use of surveys by the Central Bank of Chile (CBC) to compile external statistics of balance of payments (BOP), international investment position (IIP) and external debt. A mixed system is used to compile these statistics. This system combines indirect reporting (e.g., banks reporting data from third parties, usually known as International Transactional Reporting System (ITRS)), and direct reporting, such as surveys. The latter has increased its relevance due to new statistical requirements. Currently, there are thirteen surveys managed by the CBC and a specific area has been created to centralize data collection. These surveys cover a wide range of topics, mainly related to the Import and Export of Services of Current Account, Financial Account and Income. The next section presents the legal and institutional framework supporting data requirements. Section 3 describes the organization for data collection, sections 4 explains different data sources and characteristics of surveys used to compile main external statistics, while section 5 identifies challenges facing the CBC in the near future. Finally, some concluding remarks.
2. Legal and institutional framework
In its Basic Constitutional Act, The Central Bank of Chile is mandated to compile National Accounts, Balance of Payments (BOP), International Investment Position (IIP) and Monetary and Financial Statistics. Accordingly, the CBC is authorized to request information from public institutions. The Basic Constitutional Act empowers the CBC to require statistical data regarding foreign exchange transactions from those players undertaking these transactions. This information is used to compile BOP, IIP and external debt figures. A detailed list of transactions that have to be reported to the CBC is available in the Compendium of Foreign Exchange Regulation (http://www.bcentral.cl). Also, there is a broad cooperation of the private sector with the CBC in regard to the provision of statistical data.
3. Organization
The organizational structure of the CBC has evolved during the past several years. One major improvement has been the creation of the Statistics Division, which has two main areas. One is in charge of collecting information from different sources, and the other compiles and elaborates on macroeconomic statistics such as national account and external statistics. The mission to compile external accounts relies on the Department of Balance of Payments and External Debt. This department works in cooperation with two other departments: Data Base, and Statistic Information Collection, which are responsible for collecting data through
1 Financial Analyst, Information Collection Department.

146 IFC Bulletin No 30
different means. The role of the Data Base Department is to collect and administer large volumes of electronically provided information; for instance, by the National Customs Service and the Internal Revenue Service. On the other hand, the Department of Statistic Information Collection captures and validates the data from the direct reporter before it is used by the compiling area. There are two main ways to collect this data: mandatory surveys under the CBC’s legal right to require information on certain foreign exchange transactions, and voluntary surveys. The latter process requires close communication between the data providers and the CBC, for which the latter has defined three sub-groups in order to facilitate mutual interaction data verification. The first sub-group is the financial sector, which deals with the financial entities of the economy such as banks, stockbrokers, underwriters, trustees and institutional investors. The second corresponds to the non-financial sector, which deals with reporting entities from other sectors of the economy. Finally, there is a surveys sub-group, which is in charge of selecting the samples, updating directories and receiving voluntary surveys.
Figure 1 Organizational chart
4. Use of surveys to compile external statistics: BOP, IIP and external debt
There are two complementary sources for collecting information of external statistics: indirect and direct reporting. Examples of indirect reporting sources are: data from the National Customs, the Internal Revenue Service, and the International Transactional Reporting System. For direct reporting, the CBC uses surveys. Both sources complement each other. In addition, domestic public institutions are required to provide their data directly to the CBC.
Figure 2 Data sources of external statistics
Indirect Reporting: 1. Customs 2. Tax Services 3. ITRS 4. Others
Public National Institutions
Direct Reporting: 1. Mandatory Surveys 2. Non- Mandatory Surveys
Data Sources
External Statistics: 1. Balance of Payments 2. International Investment Position 3. External Debt
Statistics Division
Macroeconomic Statistics
Statistical Information
Balance of Payment and External Debt
National Accounts
Data Base
Collecting Statistical Information
Financial Entities
Non-Financial Entities
Statistics Surveys

IFC Bulletin No 30 147
As was previously mentioned, two types of surveys are used to compile information to prepare external statistics. In both cases, the information is used for current and financial accounts of the BOP and also for the IIP. In the case of the current account, the surveys are used to gather information about services such as insurance, sea and air transportation, audiovisual and related services. On the other hand, the financial account surveys have the purpose of obtaining information about assets such as direct and portfolio investment, liabilities such as portfolio investment in equities and commercial trade credits.
There are a total of thirteen surveys managed by the CBC. The sampling process used is mainly a minimum percentage of coverage (cut of the tail) which varies between 70% and 80%, although in some specific cases a census is used. The number of reporting entities is close to 2,200 companies from a total relevant estimated universe of 200,000 firms (companies that have undertaken some kind of international transaction), the periodicity of the surveys is set depending on the use that the data will have. Hence, it can be monthly, quarterly and annually. In table 1 there is a list with the main characteristics of these surveys.
Finally, it is worth mentioning that there are agreements between the CBC and the National Statistics Bureau, National Customs Service and the National Tourism Service, under which these institutions must undertake some surveys.
5. Main challenges
In order to improve its data collection process, the CBC is working on a range of statistical areas.
One of the biggest concerns is data quality. To improve it, the CBC is providing feedback to data providers, building capacity and reducing the burden for respondents, and constantly assessing costs and benefits of new data requirements.
A second improvement related with data reporting is the future implementation in Chile of the International Financing Reporting System (IFRS) and the use of Extensible Business Reporting Language (XBRL) as a communication language for financial information by the Superintendency of Securities and Insurance. The first group of firms is scheduled to start reporting through these applications in 2009. In this regard, a multifunctional task force has been established in the CBC in order to be prepared for the arrival of this new data.
Another challenge is to increase coordination with public national institutions (e.g., National Statistics Bureau; National Customs Service; Internal Revenue Service; Superintendencies of Banks, of Securities and Insurance, and of Pension Fund Administrators (AFPs). An example of this coordination exercise is the joint work with the National Statistics Bureau to develop a single and updated national directory of firms.
Finally, new statistics requirements always pose new challenges. In the short term, they are related to information useful for financial stability analysis (lack of standard reporting of balance sheets by small and medium firms and information on the household sector; International investment position and flows). Need for further breakdowns (by sector, currency, liquidity, counterparts) and access to micro data for detailed analysis Also, there is a need for improving national remittances statistics.
6. Final remarks
The Central Bank of Chile is continually working to improve its entire data collection systems, and provide strong support to the areas in charge. In the specific case of external statistics, a combined system to collect data is used. This is based as much in indirect reporting as in

148 IFC Bulletin No 30
direct reporting. However, in the past few years, data quality issues and new statistical requirements have increased the use of surveys as a method to collect information. Currently, some of these surveys are undertaken directly by the CBC, while some are run by other institutions. In addition, the burden on respondents is closely monitored by data collectors, as well as the use of any new request of information.
Nevertheless, some important challenges must be addressed as the arrival of ITRS and XBRL next year, and strengthening links with public institutions.
Table 1
List of surveys managed by the CBC
Characteristic
Component Survey N° Reporting Entities Sampling Periodicity
Telecommunications Service 32 Cut of tail Annual
Mail and courier 20 Cut of tail Annual
Sports activities 10 Cut of tail Biennial
International organizations and embassies 15 Census Annual
Export of professional services 188 Cut of tail Biennial
Import of audiovisual and related services 70 Cut of tail Biennial
Use of intellectual property 155 Cut of tail Annual
Direct insurance and reinsurance 50 Census Quarterly
Current Account
Sea and air transport 68 Census Quarterly
Trade credits 1300 Cut of tail Quarterly
Direct, portfolio and other Investments Abroad
350 Census and Cut of tail Depending of the institution
Monthly Quarterly Annual Depending of the institution
Direct investments from abroad 391 Cut of tail Annual
Financial Account and Income
Trustees 4 Census Annual

IFC Bulletin No 30 149
Challenges in data compilation of foreign direct investment in a free capital flows country –
the Uruguayan case
Ana María Ibarra1, Luis Ipar2 and Mariana Taboada3
Uruguay foreign capital flows compilation is subject to limiting factors coming up from financial movements economy policy guidelines, and basically from its liberal tradition regarding participants’ privacy concerning these movements. The absence of specific records of Foreign Direct Investment firms (FDI), as well as the lack of an international transactions reporting system (ITRS) in the country, sets difficulties to the flows estimation and FDI balances, either for its compilation from the Balance of Payments or for the International Investment Position statistics. The main objective of this paper is to explain, under the above conditions, the best possible methodology to compile and process the information used in the estimation of such financial movements.
The correct estimate of these flows turns out to be significant because of the strong capital entries in the last few years, adding up to U$S 879 million – according to preliminary figures for 2007-. This figure represents 4% of Uruguay’s Gross Domestic Product (GDP). This underscores the importance of the fact that the implementation of economic policies must be based on reliable and accurate statistics, which need to be continuously evaluated to analyse how robust these statistics are to represent the reality they try to measure and explain.
In Uruguay, the Central Bank (CBU) is responsible for inflows and balances estimation related to FDI. The legal framework provided by its Charter as well as by the National Statistics System (National Institute of Statistics and Census) enables the use of enterprise surveys as a compilation strategy, because there is a lack of administrative records and specific exchange records. The aforementioned legal framework ensures confidentiality protecting the information by means of statistical secrecy rules.
To calculate both the inflows and the FDI balances, information is collected from the four main areas where non residents typically invest: (a) Real Estate, (b) Non Financial Firms, (c) Financial Institutions, (d) Land Investment. Enterprise surveys are the primary source of information to compile FDI statistics, followed by balance sheets of financial sector and by some administrative records. These records derive from granted building authorizations in the main area receiving real state direct investment -Punta del Este beach and resort Area-. Land sales transactions by residents to non residents are recorded from National Institute of Colonization records (NIC).
The following chart summarizes the type of information used in the different areas considered for FDI calculation:
1 Financial Programming Department Head at the Central Bank of Uruguay. 2 International Consultant – Balance of Payments and International Investment Position Responsible at the
Central Bank of Uruguay. 3 Economic Analyst at the Central Bank of Uruguay.

150 IFC Bulletin No 30
Chart 1
Summary of areas analysed and sources of information
Source of information Areas
Type of information Organization Information analysed
Real Estate Holding Companies
Administrative records.
Interviews.
Municipal Government of Maldonado.
Construction companies.
Real State Holding Companies.
Square metres authorized.
Average value of square metres % of NR in the total sales.
Financial Institutions Balances sheets Financial institutions with foreign capital share
Income Statements.
Financial Condition Statements.
Non Financial Companies
Surveys Non Financial Companies
Specific survey
Land Administrative records National Institute of Colonization
Sales – hectares and value – between resident and non resident.
Uruguay does not use information provided by counterparty countries to compile FDI information, owing to possible methodological asymmetries that could cause duplications by the use of different techniques to collect such information. In regard to this matter, the country has decided to follow the Coordinated Survey on Direct Investment which will be carried out under the sponsorship of the International Monetary Fund (IMF) and which hopes to overcome these limitations.
The real estate investment calculation methodology takes into consideration the quantity of square meters yearly authorized to the construction of new residences – in Punta del Este – by the Municipal Government of Maldonado, prorated according to the works execution schedule so as to determine the actual supply of new real estate property every year. This supply of square meters is valued according to market prices taking as base an average value obtained in a study carried out among the main construction companies and real estate holding companies in 2004 updated with qualitative information from the main real estate operators.
A percentage is applied to the sum obtained. This percentage was also established by the aforementioned study about the participation of non residents in the total sale of new properties.4 As of 2001, an additional 10% is added as a means to estimate the value of household furnishing of the new properties.
To compile FDI in Non Financial firms, the Central Bank of Uruguay carries out enterprise surveys directly. The total number of companies surveyed is considered and no expansion data method is applied due to the heterogeneous nature of the different firms and the
4 Periodical adjustments have been made on non residents’ ownership percentages according to observed
variations, generally related to comparative advantages in relation to Argentina, country from which most investors come from. Adjustments have also been done based on press information on real estate market trends, so for some sectors the participation of non residents needs to be adjusted.

IFC Bulletin No 30 151
particular aspect of FDI inflows. Besides, the coverage of large companies is considered near universal. Within the FDI inflow, a calculation is applied to estimate capital contributions, profit reinvestments (calculated as the accrual profit minus the profit remittance transferred abroad by the FDI companies), and the net transactions between the parent company and subsidiaries or branches. The following debt instruments are used: Financial Loans, Commercial Credits and Debt Securities.
Reinvested profits are treated as FDI inflows, using the balance sheets (income statements and financial condition statements) as a source of information which financial companies with foreign capital participation submit to the Superintendence of Financial Intermediation Institutions.
As there has been a significant growth in foreign investment in land since 2003, as of that year such assets are regarded as direct investment, based on the information provided by the NIC records. The NIC maintains the records for all purchases of lands of more than 1000 hectares and these records provide a detailed description of each transaction, including information concerning the persons’ residences, except for limited liability companies. It also provides information on area, value and location of each sale. An estimation of Working Capital within the foreign investment is added to the total sum of land sales among residents and non residents, based on the land productivity conditions in accordance with the property location.
In summary, Uruguay FDI statistics are robust enough. They provide wide firms coverage. Supported by the strong legal framework, response rate for the surveys conducted by the BCU is close to a hundred percent. Statistical secrecy norms ensure complete confidentiality and enable BCU to impose fines. A continual new FDI investors identification procedure is applied at the compilation, allowing an updated enterprises directory. Particularly, since 2003 there have been continual improvements, incorporating land to real state estimations, extending the use of administrative records, including an additional proceeding to the firms involved in tax benefits granted by the Investment and Promotion Law, and updating the enterprise surveys with information on balance sheet variations, disaggregated according to its origin: (a) current transactions; (b) exchange variations or (c) changes on prices all in the case of stocks or other securities or bond owned or owed by the company.
The implementation of a closed (ITRS) should enable a better compilation auxiliary, providing faster and automatic information to make statistics controls easier. Notwithstanding, this system shows some disadvantages: (a) it only measures cash transactions (but many FDI are not cash, e.g. re-invested profit or capital participating in the form of machinery or debts between companies) (b) the concept of direct investment is difficult be explain in a general form for banking operations; and (c) the transactions using the national currency (pesos) or through non resident banks are difficult to measure, although this difficulty can be overcome by a suitable compilation procedure.

152 IFC Bulletin No 30
Surveys as data sources for external sector statistics
Endrita Xhaferaj1
1. Introduction
Albanian balance of payments statistics are compiled by the Balance of Payments Division of the Department of Statistics of the BOA. The data have been published since 1992. Since then, the coverage, detail, and sources have gradually been improved. The data are published quarterly about two months after the end of the referenced quarter. While data are published quarterly, the compilation system is partly from monthly data sources, namely bank reporting and trade data. There are a few items that are only collected in quarterly supplementary surveys, but monthly data could be produced by extrapolation and interpolation methods for the relatively few quarterly items, if required for policy reasons.
In practice, the problems of inadequate legal authority for the BoA to collect data from direct reporting, have been sidestepped by conducting supplementary surveys in coolaboration with the National Statistics Institute (INSTAT). These surveys cover travel, remittances, foreign direct investment, and foreign trade. INSTAT has survey expertise and adequate legal authority to undertake the surveys.
2. Travel services
The Albanian tourism now responds to the continuous demand for its growth and it has the adequate potential to attract visitors from other world regions as well. The Balance of Payments Division compiles revenues and expenditure of travel services. The assessments are made based on surveys conducted starting from year 1999 in co-operation with INSTAT. The survey is compiled and sponsored by the Bank of Albania while the onsite interviewing is carried out by the INSTAT on quarterly basis.
2.1 Main concepts
• “Travel” covers primarily the goods and services acquired from a country by travellers during visits of less than one year to that country.
• A traveller is an individual staying for less than one year in a country of which he or she is not a resident for any purpose. The one-year guideline does not apply to students or to patients receiving health care, who remain residents of their country of origin. They are considered travellers and their expenditure is included in travel services.
• An excursionist is a temporary visitor staying less than 24 hours.
• Travel services are broken down into business travel and personal travel. Business travel covers the acquisition of goods and services by business travellers, who are
1 Senior Economist in the Statistics Department at the Bank of Albania.

IFC Bulletin No 30 153
going abroad for all types of business activities, such as carrier crew stopping off or laying over, government employees on official travel, employees of international organizations on official business, and employees doing work for enterprises that are not resident in the economies in which the work occurs. They may visit a country for sales campaigns, market exploration, commercial negotiations, missions, meetings, production or installation work, or other business purposes on behalf of an enterprise resident in another country.
• Personal travel covers goods and services acquired by travellers going abroad for purposes other than business, such as holidays, participation in recreational and cultural activities, visits with friends and relations, pilgrimage, and education and health-related purposes.
• Travel services are broken down according to the type of expenditure:
– Expenditure on goods,
– Expenditure on accommodation and food and beverage serving services;
– And all other travel expenditure.
• The most common goods and services entered under travel are lodging, food, beverages, entertainment and transportation within the economy visited (all of which are consumed in the supplying economy) and gifts, souvenirs and other articles purchased for travellers’ own uses and which may be taken out of the country visited.
2.2 Purpose of the survey The primary purpose of this survey is to collect information on the duration of stay and the expenditure of resident and non-resident travellers during their travels in and out of Albania.
The survey relates to the characteristics of each interviewed category, with the travel purpose, the country of origin for non-residents visiting Albania and the destination for residents traveling abroad, etc.
2.3 Methodology
Defining the sample The survey is conducted on quarterly basis, with a sample volume of 1000 people per quarter. The selection of border checkpoints where the interviewing is made is based on the quarterly data made available by the Ministry of Internal Affairs. The data includes the number of entries and exits of Albanian and foreign tourists in the territory of the Republic of Albania. It is worth noting that not all border checkpoints are included in the survey. It covers those border checkpoints where there is a large movement of travellers. The survey covers two groups of travellers: resident travellers who return from their travel abroad, and non-residents who leave Albania. Resident travellers include residents of Albanian or foreign nationality who return from their travel abroad. The breakdown of non-residents of Albanian (Albanian emigrants) and foreign nationality is also applied in the category of non-resident travellers. In addition, these two main categories also distinguish between excursionists.
Instrument used to collect the information Based on the abovementioned categories, the Statistics Department has compiled two questionnaires, one in Albanian and one in English. Both questionnaires have seven questions, four qualitative and three quantitative questions.

154 IFC Bulletin No 30
(a) Traveller’s identification
(b) Country of residence
(c) Purpose of visit
(d) Place of accommodation
(e) Duration of stay
(f) Expenditure carried out during the travel
(g) Gifts or free services received during the travel
On-site interviewing 1000 people are interviewed every quarter. They are resident travellers interviewed while they return from abroad and non-resident travellers while they leave Albania. The interviewing is done by interviewers recruited by the INSTAT, who have been instructed by the Statistics Department specialists.
Information processing The data entry and processing is made by the Statistics Department. The data entry is made according to the border checkpoints and to the category of travellers. Prior to the data processing, the extreme values are removed and the average daily expenditure is converted into the euro. After the data processing we obtain the average duration of stay of a business or personal traveller for each border checkpoint. In addition, we measure the average expenditure of each business or personal traveller. These estimating coefficients are measured for the six categories of travellers: residents of Albanian and foreign nationality, non-residents of Albanian (emigrants) or foreign nationality and resident and non-resident excursionists.
The survey results are used for estimating the tourism expenditure and income in the balance of payments
The results obtained from the category of non-residents are used to estimate the income from tourism (credit), while those obtained from the category of residents are used to estimate the expenditure (debit). In the balance of payments, tourist income and expenditure are broken down into “business” and “personal”. It is for this reason that the results related to the duration of stay and the daily expenditure are applied separately. The following formula is used to estimate the credit and debit for tourism.
Export (Tourism services) = Average no. of NR* (duration of stay)* average (daily expenditure)
Import (Tourism services) = Average no. of R* (duration of stay)* average (daily expenditure)
Where: NR – refers to non-residents and R – refers to residents.
3. Remittances statistics
The importance of workers’ remittances in the Albanian economy is among the highest for any country. It is estimated that, approximately, a million Albanian nationals reside abroad or around one-third of the size of Albania’s resident population of approximately 3 million. As a result of the large number of nonresident Albanian nationals sending money home, remittances are a major driver of the economy and particular attention needs to be paid to their measurement.

IFC Bulletin No 30 155
3.1 Methodology on remittances for BOP compilation Some remittances are sent through the banks or Western Union and so are captured in the bank reporting system. However, anecdotally and from information on cash flows, a high proportion of remittances occurs through informal channels and in cash. To include these remittances workers’ remittances credits outside the bank reporting system in the balance of payments statistics, a method that uses a residual formula, based on the supply and use of money outside the banking system. Effectively, the value of trade and travel identified but not funded through the banking system is attributed to remittances. Of the remainder of foreign exchange cash outside the banking system, 90 percent is assumed to be derived from remittances and 10 percent by compensation of employees. The method is based on a model of the supply and demand for foreign exchange outside the banking system. As a result of this method, the transactions outside the banking system are in balance and do not contribute to net errors and omissions. It should be noted that it is not assumed that the recipients of remittances directly fund the imports; rather, the process is that the remittances are converted to lek to purchase local goods and services and the foreign exchange is acquired by importers through the foreign exchange bureaus.
This method has many limitations and weaknesses, the main one being that given the large scale of Albania’s informal economy, unaccounted inflows may be either money remitted by migrants abroad or any other type of flow coming from informal economic activities.
3.2 Survey on household A new, source of information on remittances is the household survey. The first survey was conducted by the Bank of Albania and carried out by national statistical office (INSTAT) during November 2006, covering remittances received by households during the calendar year 2005. INSTAT constructed the sampling frame and collected the information through face-to-face interviews methods,. The sample includes the Albanian households that receive remittances, having at least one member who has migrated. To construct the sample frame, INSTAT used the LSMS (Living Standards Measurement Study) 2002 results. The 2002 LSMS in Albania was conducted and managed by the World Bank. Using its results, INSTAT calculated the number of households to be surveyed, 1033 households.
Since the first quarter of 2007, this household survey is being conducted on a quarterly basis.
The questionnaire was designed and later improved by the Bank of Albania. A primary consideration in designing the questionnaire used to elicit information from beneficiary households is the inclusion of both quantitative and qualitative data. The questionnaire has 23 questions structured under 5 main categories to collect information on: (i) households’ composition and geographical location; (ii) households’ income; (iii) remittances and savings in Albania; (iv) savings and investment attitudes of beneficiary households; and (v) others.
The information is collected through the face-to face interviewing method. The interviewer has to visit a household more than once in order to complete the interview, in those cases where the information could not be collected at the first visit.
The field working team was selected by INSTAT and made-up of interviewers with previously experience in such a survey in the framework of the LSMS. The interviewers were also trained. In addition, they know the places were the survey was conducted since they had experience in the LSMS. Furthermore, the fieldwork had a direct supervision, appointed by INSTAT, to ensure the good quality of the information.
According to the first survey, 26 percent of resident households received remittances from abroad. Most recipients lived in urban areas, and average receipts varied significantly between cities and regions. The vast majority of remittances were received through informal channels rather than through banks and Money Transfer Operators. The first survey also

156 IFC Bulletin No 30
showed that remittances have become a critical source of income for households, reaching 33 percent of disposable income of an average recipient family and almost 40 percent in rural areas. Remittances are mostly used for imported consumer goods, services, and for the purchase or construction of houses. A very small share is saved or invested in businesses, mainly in agricultural sector.
Subsequent quarters showed similar results. The sample frame is constant, so the survey delivers relatively stable estimates for remittance receipts. However, they appear too low compared to other sources of information.
3.3 Weakness of the survey and further improvements Some of the reasons behind the fact that the household survey results are underestimated can be that the respondents may not wish to disclose the full amount of their income, including the part accounted by remittances.
Also, many Albanians live or work abroad illegally. In some cases, their activities are related to the informal sector in Albania. The family may not wish to acknowledge their receipts if they know the nature of their relatives’ work situation and income.
The LSMS results are to be reviewed with regard to the information it contains on remittances since many Albanian families have re-united abroad, leading to a changing demography of nonresident Albanians, from single workers sending money home to families with no immediate plans to return.
Taking all this into consideration, household survey data are not yet able to replace the residual estimation method for obtaining the official estimates of remittances. Before household survey data are adopted as the primary data source, a longer time series of survey data should be established and the survey results require further validation and adjustment for underreporting or remittance receipts by households.
4. Foreign direct investment statistics
For balance of payment purposes direct investment capital comprises investments involving nonresident investors’ equity of ten per cent or more in a company in the Albania. Direct investment enterprises are required to register with the national legal authorities, but there are limited official data on foreign direct investment in Albania. Flows of foreign direct investments, shown in BoP statistics, represent a rough estimation based on data reported from different state agencies for corresponding business fields that they are covering; only data on equity capital are reported.
Apart from the priority of drafting an institutional framework to encourage the foreign investments in Albania, their accurate measurement is a necessity. Even more so, for the calculation of the stock data needed for the compilation of the International Investment Position (IIP) of Albania, recently started. Therefore, the Bank of Albania in collaboration with the Statistics Institute organizes annual surveys in the enterprises with foreign capital participation.
Up to now there have been four annual surveys on FDI, the next one to be conducted during July 2008 concerning financial year 2007. The quality of the surveys’ results have been improving from one survey to the other.
The form used in the survey has been revised on the basis of the results of the previous surveys. The actual form is reasonably user-friendly and the rising response rate confirms this. The form identifies opening and closing positions, transactions, and other changes as well as instruments.
IFC Bulletin No 30 157
The questionnaire contains two main sections. The information requested in the first session consists of specifications and identifications elements of the enterprise, such as economic sector, number of employees, the percentage of foreign equity, origin country of inward FDI etc.
The second session contains financial information, obtained from main financial statements as balance sheet, the statement of income and expenditures and committed investment during the fiscal year. These financial statements give information of current fiscal year and of previous fiscal year. Enterprises that do not keep a balance sheet can give in specific area general information regarding their financial outcome.
4.1 Calculation of FDI stock and data coverage The calculation of Foreign Direct Investment Stock in Albania is comprised the following components:
• the share (contribution) in subscribed enterprise equity of foreign investor (in shares or in kind)
• the share in enterprise reserves of foreign investor (legally obliged reserves as well as other reserves held by the enterprise)
• the share in retained earnings (or loss) from previous year and reinvested of foreign investor.
• the share in current year earnings or loss of foreign investor.
The sample survey is selected from the population of foreign equity enterprise in Albania that results from the business register of INSTAT, as foreign or joint venture enterprises, settled everywhere in Albania. With the results from the surveys we are constructing a database of foreign investment enterprises, which is updated and cleared from closing enterprises.
4.2 Limitations and improvements The sample survey has still to be revised in order to cover all the population, and adjustments and estimations are to be made for the non surveyed enterprises.
This issue can be solved with the collaboration of INSTAT and BoA with the new entity established in Albania: the National Registration Center, which will function as a one stop shop for the registration of the enterprises, reducing to one day the time required to register new businesses, and combining all registration steps-including tax registration-in a single procedure.
Persistent efforts have been made to reduce the timelines of conducting the survey. The 2008 survey is to be undertaken in July rather than in October after the referenced period, as in previous years.
The survey provides useful data for the revision of financial account items. Therefore, the decision of the BoP division at the BOA is to continue to compile preliminary financial account data from bank reports and to rely on the investment survey for revisions to the financial account and for compilation of the IIP.

158 IFC Bulletin No 30
Foreign direct investment statistics: the case of the Czech Republic
Rudolf Olšovský1
Legislation framework
The legislative framework for the collection of data on foreign direct investment from companies is given by the Foreign Exchange Act 219/1995. The Act on the Czech National Bank 6/1993 allows data to be collected from financial institutions. The Czech National Bank (CNB) and the Czech Statistical Office (CZSO) can exchange individual data thanks to an amendment to the Act on the Czech National Bank passed in 2006. The National Statistical Law of the Czech Republic was amended in the same way. The structure of the data handed over to or received from the Statistical Office is covered by several agreements between the relevant (statistical) divisions. This is helpful with regard to quality for the compilation of statistics and in terms of reducing the statistical burden on respondents.
Data sources
Various data sources are used for the compilation of the FDI statistics. The most important sources are yearly surveys of inward and outward FDI statistics and the reporting obligation for cross-border FDI transactions for non-bank companies. The yearly survey contains detailed information on ownership structure, balance sheet items, including dividends payable and paid, and basic information on economic activities. In the past two decades, the income of the National Property Fund from abroad due to the privatisation process was an important source for the FDI statistics. This national institution, originally established by the Czech government in the early 1990s, was merged with the Ministry of Finance in 2006. The significant impact of privatisation income on FDI flows in some years is visible in the following graph.
FDI inflow to the Czech Republic In billions EUR
0
2
4
6
8
10
12
1997 1998 1999 2000 2001 2002 2003 2004 2005 2006 2007*
FDI except privatization Privatization Note: * preliminary data.
1 Balance of Payments Division at the Czech National Bank.

IFC Bulletin No 30 159
Direct investors register
The foreign direct investment register is maintained by the Czech National Bank. The register contains data on inward and outward direct investors and covers approximately 6,000 units, the most important players in the Czech economy. The data source for FDI statistics on financial institutions is a database maintained by the departments responsible for supervision of financial market institutions, which became an integral part of the Czech National Bank in April 2006. The register is updated based mainly on information from ongoing system reporting and on outputs obtained from a commercial provider derived from the business register.
Data collection system
A survey-based data collection system (ongoing reporting obligation) on flows was established in 1995. The first survey-based system on stocks was organised in 1997. A new Foreign Exchange Act was adopted in 1995 with a clear road map for the liberalisation of capital movements on the financial account. An ongoing system for the regulation and monitoring of capital flows was created in the 1990s. The liberalisation of capital movements was completed at the beginning of the new millennium before the accession of the Czech Republic to the European Union in May 2004. A threshold of 1 million CZK (equivalent to 40,000 EUR) for the reporting obligation has been in place since January 2004.
Components of FDI stock and flows
The components of the FDI stocks and flows statistics follow the requirements of the IMF Balance of Payments Manual, (5th edition) and the OECD Benchmark Definition of Foreign Direct Investment (3rd edition). For the presentation of stocks data, equity capital is valued on the basis of own funds at book value, and since 2005 the shares of foreign-owned companies quoted on the Prague Stock Exchange are also presented on the basis of market prices. The main composition of stock is equity capital, reinvested earnings (all types of reserves, and the net value of non-distributed profits and losses) and other capital based on the directional principle (inter-company loans within a group, and loans extended and received).
FDI liability position of the Czech Republic In billions EUR
0.0
10.0
20.0
30.0
40.0
50.0
60.0
70.0
80.0
1997 1998 1999 2000 2001 2002 2003 2004 2005 2006 2007
Equity capital Reinvested earnings Other capital

160 IFC Bulletin No 30
In accordance with the life-cycle theory of investment, the investment balance is becoming significantly affected by the decisions of foreign direct investors. At the beginning of the cycle, investment inflows had an impact on the trade balance deficit due to investment imports. After the successful establishment of new production facilities, the Czech Republic’s export-oriented capacities gradually increased. On the one hand, the trade balance switched from deficit to surplus in 2004. On the other hand, foreign firms started to create profits and pay dividends abroad or to reinvest earnings in the domestic economy. This is the main reason for the deterioration of the Czech Republic’s income balance deficit.
Inward FDI income balance In billions EUR
-12-11-10
-9-8-7-6-5-4-3-2-10
2001 2002 2003 2004 2005 2006 2007*Dividends Reinvested earnings Interests
Foreign direct investment outflows have also become a visible part of the international investment position over last two or three years, due to several acquisitions mainly in electricity supply utilities abroad.
FDI assets position of the Czech Republic In billions EUR
-1.0
0.0
1.0
2.0
3.0
4.0
5.0
6.0
1997 1998 1999 2000 2001 2002 2003 2004 2005 2006 2007
Equity capital Reinvested earnings Other capital

IFC Bulletin No 30 161
Foreign affiliates statistics
A by-product of the yearly FDI surveys is the Foreign Affiliates Statistics (FATS) for variables requested by Eurostat (turnover, number of employees, value added, export and import of goods and services). The CNB and the CZSO have agreed to collaborate to meet the new requirements based on EU Regulation 716/2007 on FATS. The Czech National Bank will be responsible for outward FATS and the Czech Statistical Office for inward FATS.
Data dissemination
FDI flows and stocks are disseminated monthly and quarterly as a sub-item of the balance of payments statistics and international investment position. A detailed geographical and economic activity breakdown is available quarterly for flows and annually for stocks. Detailed statistics and annual reports on foreign direct investment are available on the Czech National Bank website at http://www.cnb.cz/en/statistics/bop_stat/fdi/index.html.

162 IFC Bulletin No 30
Mobile phone traffic data and tourist services item in Balance of Payments
Matjaž Jeran1
“Hard” and “soft” items of Balance of Payments
The Balance of Payments consists of many items. The goods (export and import) can be registered at the country borders and can be cross checked with customs or accounting documents.
Some items of the Balance of Payments (e.g. services) do not have that “hard evidence” and are measured by indirect measurements of financial or other flows. One such area is tourism, where estimates of the consumption of the individual tourists can be done using indirect statistics of number of tourists and their consumption depending on statistical data that a country can collect.
Slovenia has controlled its borders and international payments since the declaration of its independence. The border police and customs officers were used also to provide statistical data on border traffic. When Slovenia entered the European Union and the Schengen area, first the customs officers and then police officers were removed from the borders of the countries in the EU and statistical data were to be collected only by automatic mechanisms. There are Slovenian Police and customs officers currently only at the EU border traffic control with Croatia.
The majority of tourists come to Slovenia by road. The following automatic or register based statistics are used to get indirect data on tourism in the country:
• Automatic counters of cars on the road border crossings managed by the Enterprise for country roads (Družba za državne ceste – DDC)
• Statistics obtained from the register of temporary stays from the police database where the number of registrations and the number of night stays are obtained from the suppliers of tourist facilities
• Inquiries about spending habits of tourists in Slovenia done by the Statistical office of Republic of the Slovenia (SURS) collected every three years
• Monthly statistics of mobile phone traffic obtained from the mobile phone operators through the Post and Electronic Communications Agency of the Republic of Slovenia (APEK)
Each of the data sources has some limitations.
• The automatic counter on the road can distinguish a car from a lorry or a bus, but it cannot distinguish domestic from a foreign vehicle. These devices cannot be used to count people in a vehicle. The number of cars can only be used to get an estimated number of passengers. To get the total number of passengers entering or exiting the country, other means of traffic (train, plane, ship) must be also accounted for.
1 Bank of Slovenia – Banka Slovenije. The text represents only personal opinion of the author and is in no way
binding for the Bank of Slovenia.

IFC Bulletin No 30 163
• The registration of temporary stays is generally quite an accurate way of counting tourists that stay in Slovenia for at least one night or more. The register does not include some minor share of those that evade tourist taxes, campers on the parking areas and in remote places etc. The register is not capable of detecting tourists that only pass through Slovenia in a single day.
• Inquiries about tourist spending are quite expensive and varying patterns depending on the tourist locations and time of the year.
Mobile phone traffic as a source for tourist services
Getting mobile phone traffic data also poses some problems and limitations.
• It is supposed that the customer of a phone operator is a resident of the same country as the operator. It is common practice that a person who stays in a foreign country for a longer time buys a prepaid temporary phone number of a guest operator instead of using more expensive roaming services. This temporary new residential prepaid phone subscriber reduces international phone traffic data. Lowering international prices would probably change customers’ reluctance to use services abroad more often.
• Mobile phone signals of operators of several countries are covered in the border areas. The persons in these areas can use the cheapest operator for them of any country of origin regardless on which territory they are located. The phone traffic data from border areas are not completely synchronised with the people migrating from and to the country border.
• It is important to arrange collection of mobile phone traffic statistics that is compliant with the personal data protection law, law of communications, lawful rights of the central bank and does not disclose telephone operator’s business data too widely. The personal data protection law and law of telecommunications in Slovenia strictly prohibit disclosure of any data that would allow tracing person’s location and behaviour. Any detail from a telephone exchange is a legally bound secret with very limited exemptions. The central bank does not have a right to get any data from the phone traffic of the operators. The bank can only get some access to financial data of the companies.
The solution suitable for the Balance of Payments, was to get a monthly sum of distinct person’s daily traffic activities aggregated by countries. The mobile phones operators compute the sums from their accounting data.
The data from the phone operators are gathered by the Post and electronic communications agency (APEK). The agency then computes sums aggregated by countries and sends the totals to the central bank.
This mechanism of data transfers protects disclosure of any personal details outside the mobile operator and also any phone operator business data outside the Post and electronic communications agency (APEK).
The general idea is to use the mobile phone data to estimate number of persons outside of their country of origin per daily basis. Any phone activity of a particular person within a particular date is registered as a fact that the person is located in that country on that date. For example: A member of an international conference from Slovenia is visiting Austria for three days in the middle of the month. He makes one SMS and receives two phone calls on the first day, later he makes one call on the second day. His phone traffic is registered as one person on the first day and one person of the second day making a total of two “person days” of Slovenians in Austria for that month. If a Belgian travels to Slovenia for a day and

164 IFC Bulletin No 30
makes ten phone calls, his mobile traffic is registered as one “person day” of a Belgian in Slovenia.
As shown in the example, the collected mobile phone traffic data consist of those from non-residents visiting Slovenia and also residents of Slovenia abroad. The central bank uses the mobile phone data of non-residents visiting Slovenia to get an estimate of the night stays in Slovenia by using a suitable statistical models. A generalized linear model (glm) with different parameters is used for Slovenia as a whole and also by tourists from different countries.
Mobile phone traffic from and to Slovenia
Amount of mobile phone communication depends on gender, age, cultural aspects and operator’s pricelist. The international mobile phone prices usually increase with the distance from the county of origin. Generally the domestic prices are lowest, followed by the prices for neighbour countries. The prices for the countries outside of Europe are generally most expensive.
Slovenia is a small country which can be crossed by car in a single day, and is surrounded by larger countries: Italy, Austria, Hungary and Croatia. Tourists from these neighbouring countries commonly visit Slovenia for just one day. In addition, people from nearby regions such as southern Germany (eg Bavaria) pass through the country on their way to the Adriatic coast in Croatia. While in Slovenia, these travellers generally use their mobile phones as if they were in their home country. As a result, foreign phone traffic increases but there is no increase in overnight stays in Slovenia. This adds noise to the supposedly linear relationship between mobile phone traffic and tourist data.
Comparison of tourism and mobile hosting in Slovenia
The best fit of the glm and number of stays is achieved for non-neighbour European countries such as the Netherlands. We surmise that the tourists from these countries cannot come to Slovenia without being registered their night stay.

IFC Bulletin No 30 165
Tourism and mobile hosting in Slovenia for NL
The fit achieved for all neighbour countries and Germany is less good. This can be accounted for by “noise” from one day trips and crossing of Slovenia to Croatia. The worst fit within Europe is achieved for undeveloped European countries, presumably reflecting less use of mobile communication because of relatively high prices.
Tourism and mobile hosting in Slovenia for AT
The worst fit of all countries is achieved for overseas countries, specially the ones with undeveloped mobile phone market penetration and/or problems with distant time zones.

166 IFC Bulletin No 30
Logically, there are smaller numbers of tourists from distant locations, high prices of communication, possible lack of triband phones and small time slots when phone calls are possible without waking up one of the partners in communication across the globe.
The phone traffic data of the residents of Slovenia abroad and the number of stays of tourists from Slovenia abroad can be obtained from statistical offices of some countries e.g. Croatia. These data can be used to calibrate the generalized linear model to estimate number of stays in the countries from which these data cannot be obtained. So mobile phone traffic can be used to break down the tourist expenses by countries.
The final item of tourist services in the Balance of Payments is obtained by multiplying the number of tourists by their spending. The accuracy of the product depends on the accuracy of their number and accurate knowledge of spending habits.
A three year periodic questionnaire for foreign tourists determines spending habits by gender, age, nationality, profession, living area, type of tourist resort in Slovenia, time spent in Slovenia, means of travel, use of mobile phones and internet facilities and about their opinion on tourism in Slovenia.
We are now considering implementation of the mobile phone traffic model to estimate the number of people on one day trips and in transfer across Slovenia. The details are still in development.
References
Bank of Slovenia http://www.bsi.si/.
DDC Consulting & Engineering Ltd. http://www.ddc.si/.
Traffic information centre for public roads http://www.promet.si/.
Traffic information centre for public roads – Cameras and counters http://www.promet.si/?id=25.
Post and Electronic Communications Agency of the Republic of Slovenia http://www.apek.si/.
Statistical office of the Republic of Slovenia http://www.stat.si/.
Statistical office of the Republic of Slovenia – Data on Tourism http://www.stat.si/eng/tema_ekonomsko_turizem.asp.

IFC Bulletin No 30 167
Questionnaire TU-ČAP (Slovenian) http://www.stat.si/doc/vprasalniki/TU_CAP-3_2006.pdf.
Methodological notes on questionnaire of foreign tourists (Slovenian) http://www.stat.si/doc/metod_pojasnila/21-137-mp.htm.
Republic of Croatia – Central bureau of Statistics http://www.dzs.hr/.
Generalized linear model http://en.wikipedia.org/wiki/Generalized_linear_model.
R Development Core Team (2008). R: A language and environment for statistical computing. R Foundation for Statistical Computing, Vienna, Austria. ISBN 3-900051-07-0, http://www.R-project.org.