Embed Size (px)
Citation preview

Survival Analysis in R
yuyi1227于怡 yuyi1227Ph.D. Candidate Of Mathematical Statistics,Fudan Univ.

Outline
� What is Survival Analysis
� An application using R: PBC Data
With Methods in Survival Analysis
Kaplan-Meier Estimator
Mantel-Haenzel Test (log-rank test)
Cox regression model (PH Model)
What is Survival Analysis
� Model time to event (esp. failure)
� Widely used in medicine, biology, actuary, finance, engineering, sociology, etc.sociology, etc.
� Able to account for censoring
� Able to compare between 2+ groups
� Able to access relationship between covariates and survival time


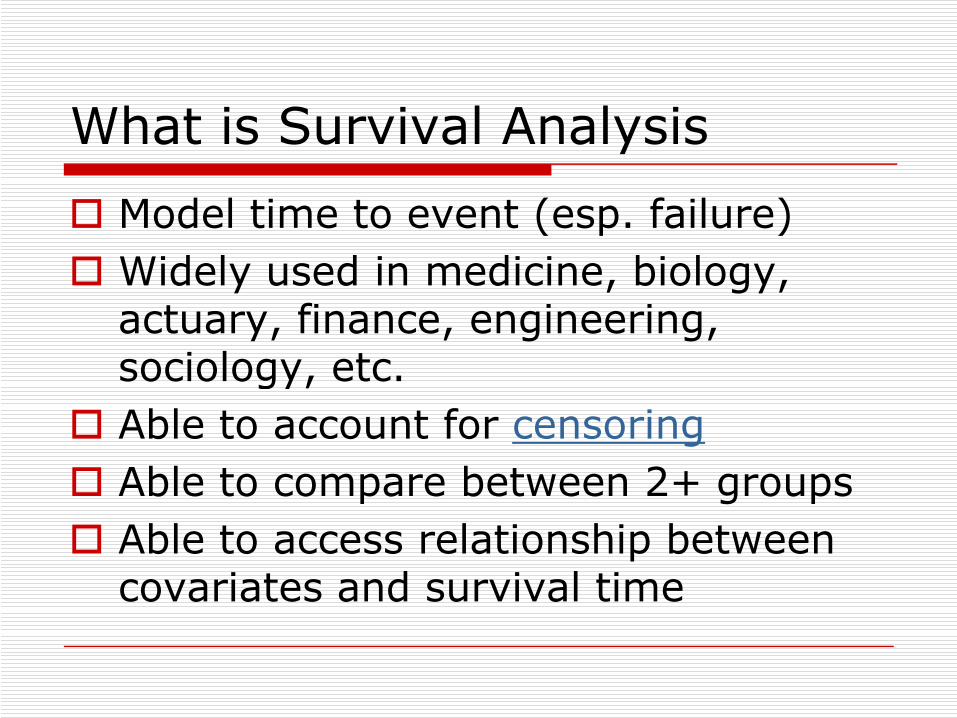
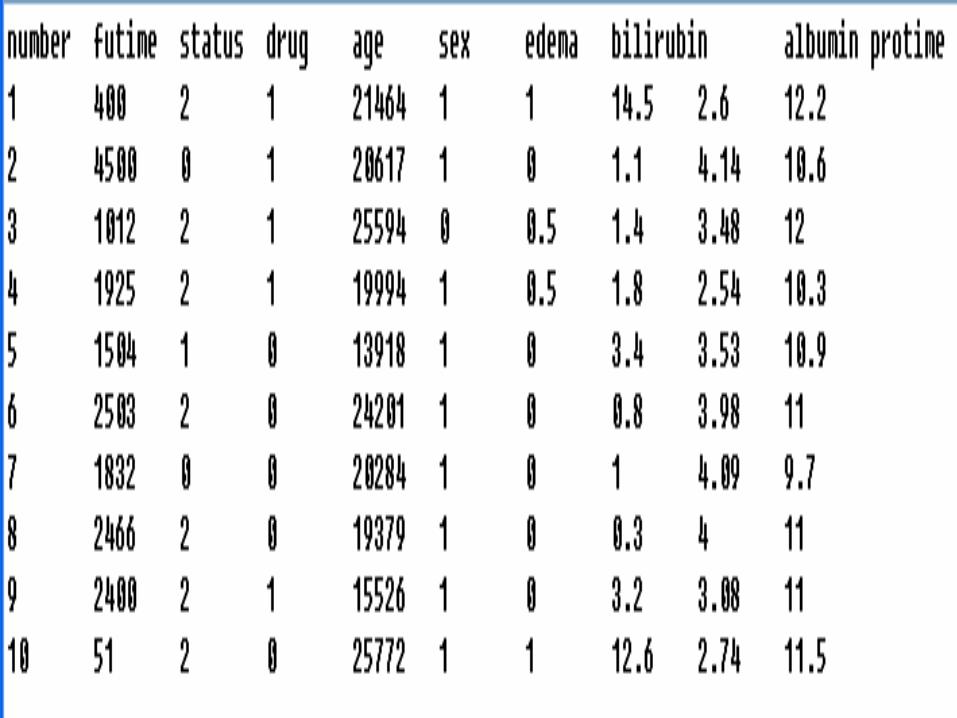
An application using R: PBC Data
Primary Biliary CirrhosisThe data is from the Mayo Clinic trial in primary biliary cirrhosis (PBC) of the liver conducted between 1974 and 1984. A total of 424 PBC patients, referred to Mayo Clinic during that ten-year interval, met eligibility criteria for the randomized placebo controlled trial of the drug D-penicillamine. The first 312 cases in the data set participated in the randomized trial and contain largely complete data. The additional 112 cases did not participate largely complete data. The additional 112 cases did not participate in the clinical trial, but consented to have basic measurements recorded and to be followed for survival. Six of those cases were lost to follow-up shortly after diagnosis, so the data here are on an additional 106 cases as well as the 312 randomized participants. Missing data items are denoted by a period.
>data(pbc, package = “survival")

Survival Analysis in R
� Package: survival
>library (survival)
� Create a survival subject: Surv
Kaplan-Meier Estimator: � Kaplan-Meier Estimator: survfit
� Mantel-Haenzel Test: survdiff
� Cox Model: coxph

Creating the survival object
� Created by Surv function
� Usage
>Surv (time, time2, event, type=c
('right', 'left', 'interval', ('right', 'left', 'interval',
'counting', 'interval2'), origin=0)
� In our example
>Surv (pbc$time, pbc$status==2)
� Reference
>help (Surv)

Creating the survival object
� >surdays<-with (pbc, Surv
(pbc$time, pbc$status==2))
>surdays

Kaplan-Meier Estimator
� Also known as product-limit estimator
� Just like the censoring version of empirical survival function
� Generate a stair-step curve� Generate a stair-step curve
� Variance estimated by Greenwood’s formula
� Does not account for effect of other covariates

Kaplan-Meier Estimator (Cont.)
� Computed by the function: survfit
� Usage
>survfit (formula, …)
� In our example

Mantel-Haenzel Test
� Also known as log-rank test
� Generated from a sequence of 2×2 tables
� Conditional independence � Conditional independence
� Efficient in comparing groups differed by categorical variables, but not continuous ones

Mantel-Haenzel Test (Cont.)
� Computed by the function: survdiff
� Usage
>survdiff (formula, data, subset,
na.action, rho=0)na.action, rho=0)
� In our example


Cox Model
� Also known as proportional hazard model
� Conveniently access the effect of continuous and categorical variablescontinuous and categorical variables
� Using partial likelihood to get inference even without knowledge of baseline hazard
� Assumption is quite strong…
Cox Model (Cont.)
� Computed by the function: coxph
� Usage:
>coxph (formula, data=, weights, subset, na. action, init, subset, na. action, init,
control, method=c
("efron","breslow","exact"),
singular. ok=TRUE, robust=FALSE,
model=FALSE, x=FALSE,
y=TRUE, ...)

Cox Model (Cont.)
� For Baseline
>pbc.null<-data.frame(age=rep(0,1),
edema=rep(0,1),bili=rep(1,1),albumin
=rep(1,1),protime=rep(1,1))=rep(1,1),protime=rep(1,1))
>plot(survfit(cfit,newdata=pbc.null),
lwd=2,ylim=c(.99,1),main='baseline
survivor‘,xlab ='Days',ylab=
'Survival',conf.int=T)


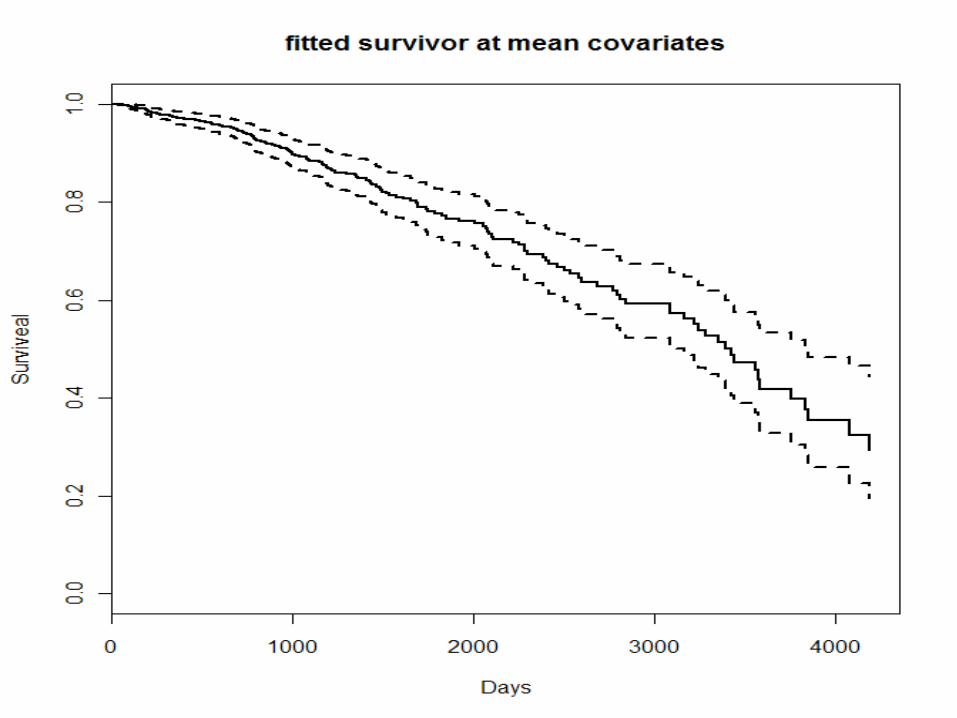
Cox Model (Cont.)
� For mean covariates
>plot(survfit(cfit),lwd=2,main=
'fitted survival function at
mean covariates‘, xlab='Days', mean covariates‘, xlab='Days',
ylab='Survival')

Diagnostic of Cox Model
� Cox model is amazing, but the assumption is really strong
� Schoenfeld residuals
� etc,.� etc,.
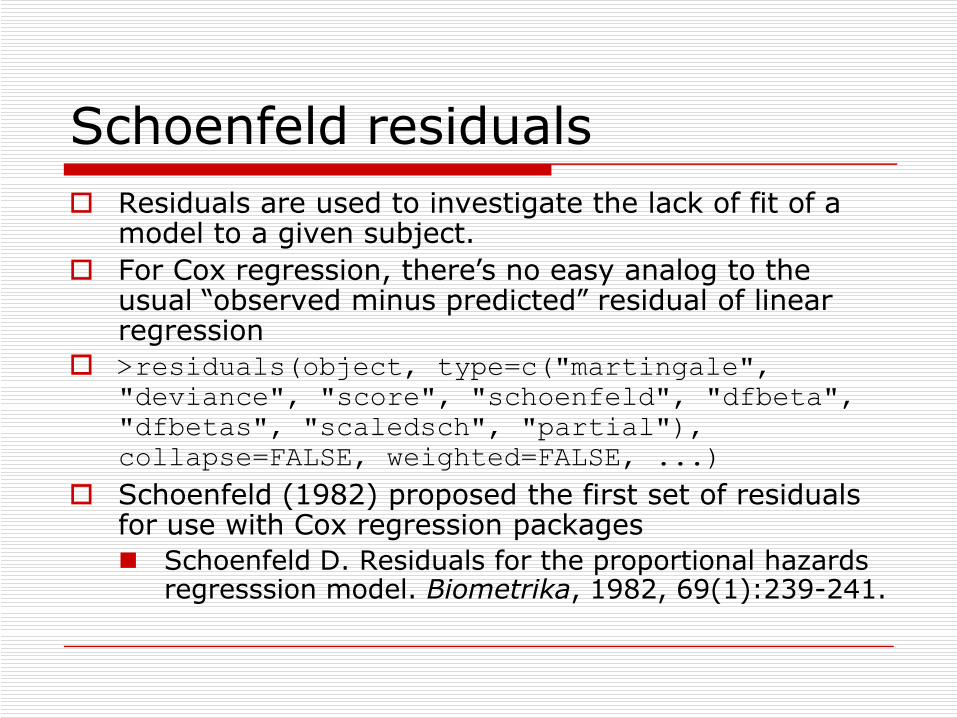
Schoenfeld residuals
� Residuals are used to investigate the lack of fit of a model to a given subject.
� For Cox regression, there’s no easy analog to the usual “observed minus predicted” residual of linear regression
� >residuals(object, type=c("martingale", � >residuals(object, type=c("martingale",
"deviance", "score", "schoenfeld", "dfbeta",
"dfbetas", "scaledsch", "partial"),
collapse=FALSE, weighted=FALSE, ...)
� Schoenfeld (1982) proposed the first set of residuals for use with Cox regression packages
� Schoenfeld D. Residuals for the proportional hazards regresssion model. Biometrika, 1982, 69(1):239-241.
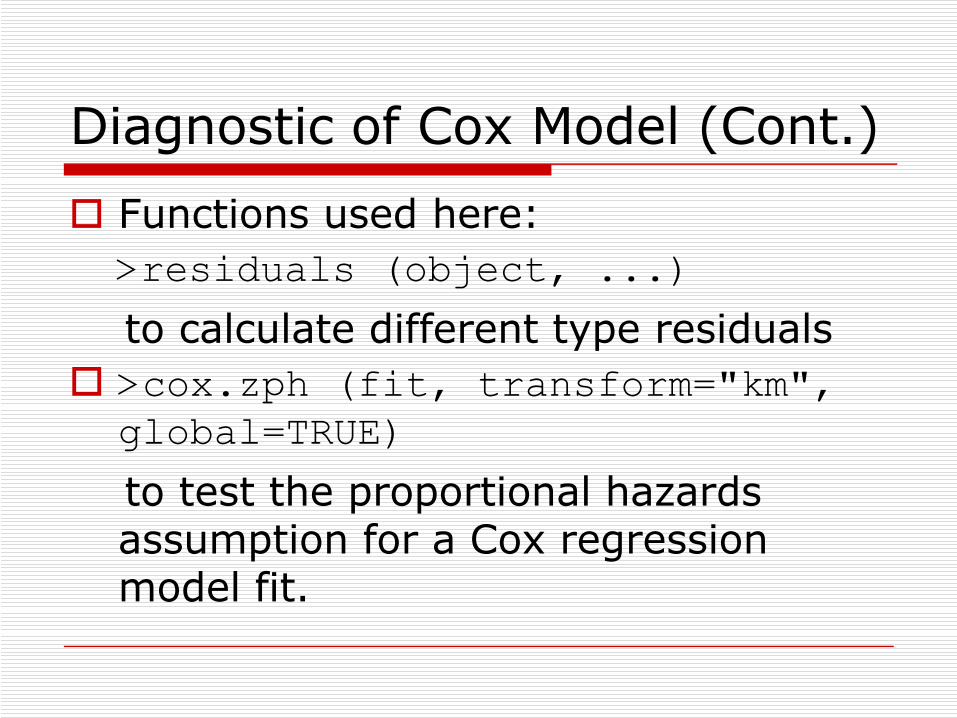
Diagnostic of Cox Model (Cont.)
� Functions used here:
>residuals (object, ...)
to calculate different type residuals
� >cox.zph (fit, transform="km",
global=TRUE)
to test the proportional hazards assumption for a Cox regression model fit.
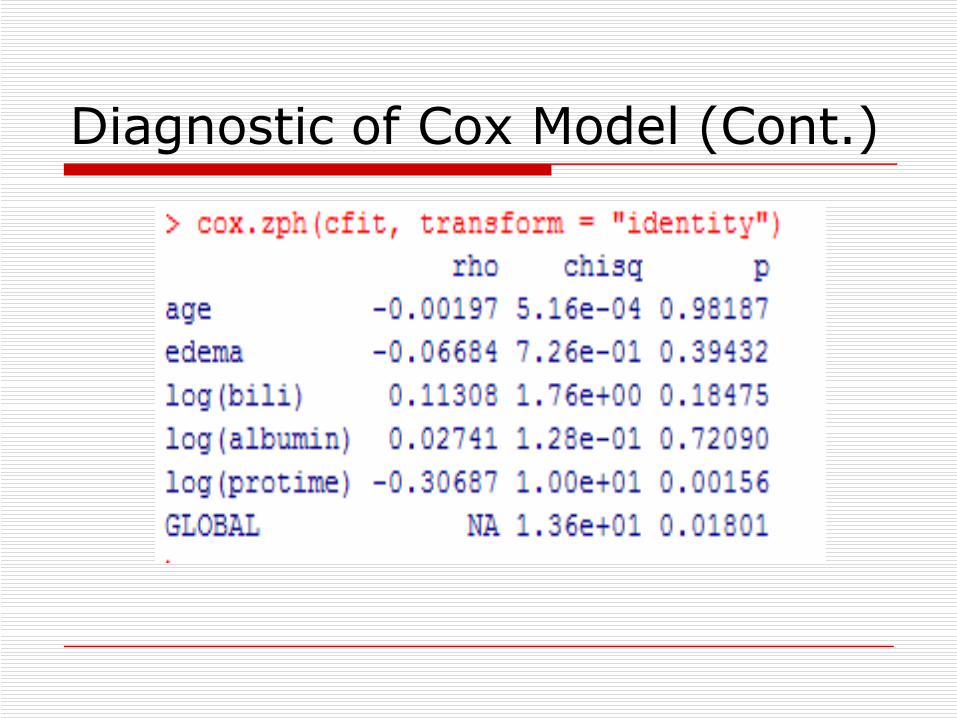
Diagnostic of Cox Model (Cont.)