Embed Size (px)
Citation preview
Finlaison House 15-17 Furnival Street London EC4A 1AB
TE
020 7211 2646 [email protected]
www.gov.uk/gad
David Kinder Workforce, Pay and Pensions HM Treasury 1 Horse Guards Road LONDON SW1A 2HQ
12 June 2014
Dear David
Subject: Survivor Benefit Review - Public service pension schemes
Your predecessor Richard Brown asked the Government Actuary’s Department to provide estimates of the expected additional cost for public service schemes if scheme benefits were retrospectively enhanced to equalise survivor benefits for past periods of accrual for different groups of potential survivor benefit recipients. The letter from HM Treasury commissioning the cost estimates (‘HMT specification’) is attached in Annex 1 (the different cost assessments required are set out under the heading ‘Main criteria for cost assessment’). Annex 7 contains a list of abbreviations and terms used in this letter.
The purpose of this letter is to provide HM Treasury with estimates of the costs of equalising the survivor benefits provided to different groups by the public service pension schemes.
The calculation approach relies on using data, assumptions and calculations that are part of the ongoing actuarial valuations (as at 31 March 2012 for all schemes, with the exception of LGPS which is 31 March 2013) of the public service pension schemes for which only a few have been finalised. Therefore future developments arising from the ongoing actuarial valuations may lead to different results from those outlined in this letter if the calculation approach was based on the finalised actuarial valuations (as opposed to the ongoing actuarial valuations). However, any future development is unlikely to change the order of magnitude of the estimates outlined below.
Additionally costs have been calculated as at the date of the actuarial valuation. These cost estimates could have been rolled forward to produce cost estimates as at a later date. However, this would require additional assumptions to be produced (such as how the profile of the membership will change between the two dates) and if this was to be undertaken it is highly unlikely to change the order of magnitude of the estimates outlined below.
This letter does not contain a full description of the methodology adopted and data used for every scheme but should provide sufficient information to meet your requirements. Given the constraints on time and available data it is difficult to produce more detailed analysis of the expected additional costs. Without undertaking an extensive data collection exercise which goes beyond investigating data pension scheme administrators usually obtain, further analysis is unlikely to change the order of magnitude of the estimates outlined below.
This letter has been prepared for the use of HM Treasury and on the understanding that it will be published, in whole, as part of the requirement under Section 16 of the Marriage (Same Sex Couples) Act 2013. It must not be reproduced, distributed or communicated in whole or in part to any other person without GAD’s prior written permission. Other than HM Treasury, no person or third party is entitled to place any reliance on the contents of this report, except to any extent explicitly stated herein, and GAD
GAD seeks to achieve a high standard in all our work. Please go to our website for details of the standards we apply.
2
has no liability to any person or third party for any act or omission taken, either in whole or part, on the basis of this letter.
Data
A summary of the data provided by government departments for the purposes of this review is set out in Annex 2. Where membership data has been provided, it is the same data that is being used as part of the ongoing actuarial valuations of the public service pension schemes (as mentioned above). As the data was extracted from administration systems for an alternative purpose, it does not identify all of the key components required to assess the costs for this review. For example, the period of accrual of the member’s pension is not available. This is necessary in order to determine the increase in the level of survivor benefits payable in the required scenarios. We have therefore needed to estimate this from the available data. Further details are given below.
Calculation approach
As set out in the HMT specification (under the heading ‘Types of survivor benefits within scope of the assessment’) the cost estimates include the potential increase in benefits payable to five types of individuals:
> Potential dependants of current active members of the schemes
> Potential dependants of current deferred pensioner members of the schemes
> Potential dependants of current pensioner members of the schemes
> Current dependants receiving survivor benefits from the schemes
> Dependants who are not currently receiving survivor benefits from the schemes but would qualify for an immediate pension if the benefits were equalised.
For the first three types of individuals, the estimate represents the cost of providing the additional pension from the date that the dependant’s pension is assumed to commence. For the last two types of individuals, the estimate represents two components:
> the cost of providing the additional pension in payment in future years, plus
> the cost of providing backdated payments of additional pension from the date the dependant’s pension commenced (or would have commenced if no pension is currently being paid).
Annex A sets out the main differences in the provision of survivor benefits for different categories of survivor within each of the main public service pension schemes1, which were provided by the departments responsible for the relevant schemes. This is in line with our broad understanding that the majority of the main public service pension schemes have equalised survivor benefits between the groups being assessed for periods of accrual after 1988 and therefore this cost assessment is largely concerned with member service before 1988 (as highlighted by the period of accrual tables shown below for the NHSPS, the majority of which is assumed to have accrued between 1978 and 1988).
However, during HM Treasury’s consultations with stakeholders they commented that, in the LGPS, survivor benefits were equalised for more male dependants who survive their female spouse members than is reflected in annex A. HM Treasury has instructed us to adjust our calculations to reflect the points raised as part of the consultation process. The revised survivor benefits assumed to be payable are outlined in Annex 1 and the additional adjustments required to the calculation approach are outlined in Annex 3.
The remaining benefit differences outlined in annex A are the only differences we have considered when producing the cost estimates. For the other sections of the main public service pension schemes not listed in annex A (for example PCSPS Premium, NHSPS 2008 section, etc) we have assumed that there
1 The public service pension schemes in Northern Ireland are excluded and therefore cost estimates for these schemes have not been produced.
3
are no equalisation costs because the relevant benefits are already equal. Again, this is consistent with our broad understanding of the benefit structures of the schemes.
The overarching approach adopted for our calculations has been to calculate cost estimates for the NHSPS 95 and to rate up those costs using the available data for the other public service schemes to calculate the cost estimates for the public service schemes as a whole. Given the significant uncertainties and complexities in producing cost estimates of this nature and the availability of data, we consider this to be a reasonable approach. If sufficient data were to be provided to produce the cost estimates for each of the public service pension schemes individually instead, we would not expect the order of magnitude of the results to be different from the cost estimates detailed in this letter.
The NHSPS 95 was chosen for producing the cost estimates due to the fact that it is one of the larger public service schemes and because the data required to produce the cost estimates was more readily available. The approach to rating up the individual scheme data varied by scheme to account for the differences in the data provided. A summary of the approach used for each scheme is outlined in Annex 3.
There are some differences in survivor benefits between the NHSPS 95 and some of the other public service schemes. Only benefit differences that are expected to have a significant impact on the cost estimates have been allowed for in the rating up approach.
NHSPS 95 calculation approach
For the NHSPS 95, the membership data was analysed to determine an approximate breakdown of accrued/current pension by period of accrual. The key data items were:
> For active members – date of joining and reckonable service
> For deferred pensioners – the number of years they were an active member of the scheme and date of leaving
> For current pensioners – date of joining and date of leaving
The reliability of the period of accrual estimates is dependent on the reliability of the data provided. Some of these data items are not considered to be material for a pension scheme valuation and therefore would not have been checked as part of the data cleansing process for the ongoing pension scheme valuation. Also some of the data items were not available for all members and therefore these members were excluded from the analysis. The data provided appears reasonable for the purpose of these calculations. However we have relied upon the general completeness and accuracy of the data provided.
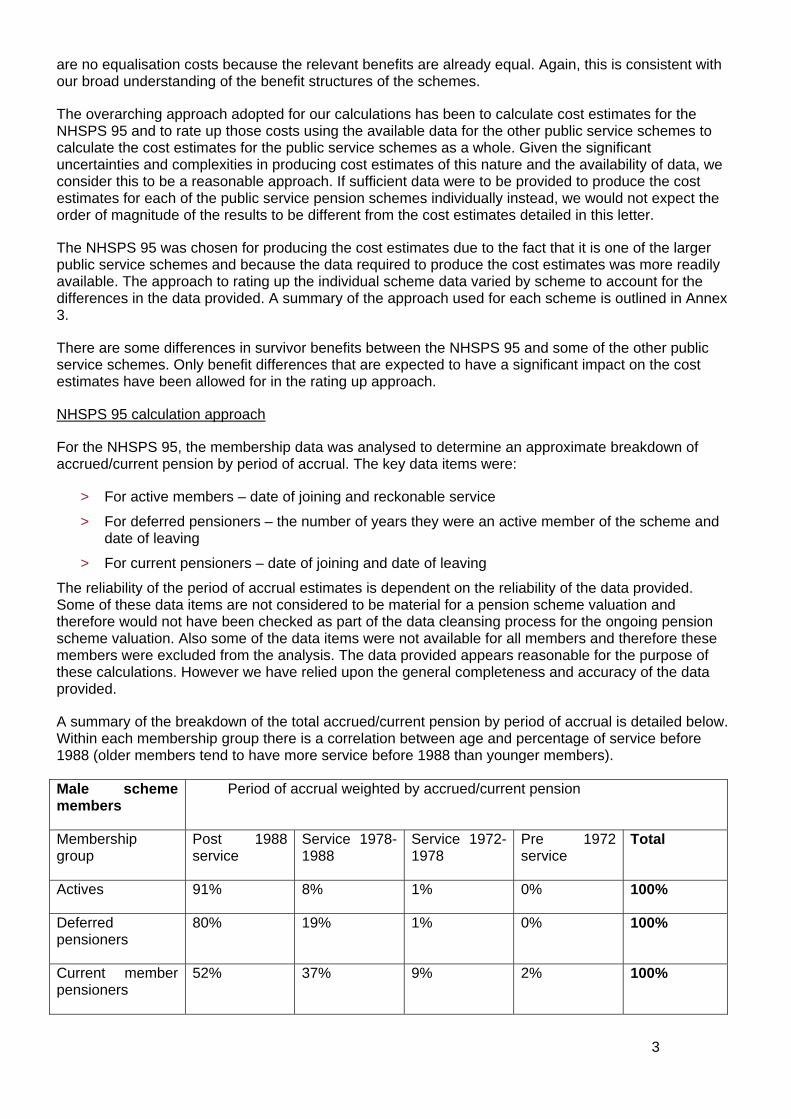
A summary of the breakdown of the total accrued/current pension by period of accrual is detailed below. Within each membership group there is a correlation between age and percentage of service before 1988 (older members tend to have more service before 1988 than younger members).
Male scheme members
Period of accrual weighted by accrued/current pension
Membership group
Post 1988 service
Service 1978-1988
Service 1972-1978
Pre 1972 service
Total
Actives 91% 8% 1% 0% 100%
Deferred pensioners
80% 19% 1% 0% 100%
Current member pensioners
52% 37% 9% 2% 100%

4
Female scheme members
Period of accrual weighted by accrued/current pension
Membership group
Post 1988 service
Service 1978-1988
Service 1972-1978
Pre 1972 service
Total
Actives 95% 4% 1% 0% 100%
Deferred pensioners
83% 16% 1% 0% 100%
Current member pensioners
71% 23% 5% 1% 100%
Suitable data to determine an approximate split of period of accrual for current dependants was not available. Therefore the estimated split for current pensioners has been used instead (i.e. for male dependants the split of service has been calculated by considering the split for current female member pensioners).
For example, assume a male dependant aged 75 (who was married to a female member of the scheme) has a current pension payable of £6,000 p.a. Then the dependant’s pension is based on the deceased female member’s post 1988 service and there is no reliable data available to determine the relevant pre 1988 service (if any). The approach adopted is therefore to assume that the service split for current female pensioner members aged 72 (assumptions on age differences are set out in Annex 4) is appropriate to apply to a current male dependant aged 75. Therefore, if the relevant service split was 60% post 1988 service and 40% between 1972 and 1988, then a dependant’s pension based on all periods of accrual would be assumed to be £10,000 p.a. (£6,000 / 0.6).
Once the approximate breakdown of pension accrual for each membership group by gender and age has been determined, this can be used to calculate the required cost estimates. The cost estimates for each assessment were determined by comparing liability estimates under two scenarios:
> dependants of members receiving survivor benefits in line with their current survivor benefit entitlement (i.e. no change to the survivor benefit entitlement), and
> dependants of members receiving survivor benefits in line with the greater of the two relevant survivor benefit entitlements (i.e. equalise survivor benefit entitlement).
For example, to calculate the cost of equalising opposite sex male survivor benefits to opposite sex female survivor benefits in the NHSPS 95, for a current female pensioner member (with an assumed service split of 60% post 1988 service and 40% between 1972 and 1988 and a current pension of £20,000 p.a.), two liability calculations would be produced:
> cost of providing a survivor’s pension of 50% of the member's pension based on service from 6 April 1988 only to male spouses of female members (i.e. the cost of providing a dependant’s pension of £6,000 p.a. (£20,000 x ½ x 60%)), and
> cost of providing a survivor’s pension of 50% of the member’s pension for service from 25 March 1972 and 1/3rd of the member’s pension for service prior to 25 March 1972 to male spouses of female members (i.e. the cost of providing a dependant’s pension of £10,000 p.a. (£20,000 x ½)).
The difference between these two liability calculations is the cost of equalisation for that group i.e. in this example the cost of providing an additional contingent dependant’s pension of £4,000 p.a. (£10,000 – £6,000).
5
Assumptions
The main assumptions adopted for our cost estimate are in line with the HMT specification (as outlined in Annex 1). As mentioned previously, the assumptions adopted were in line with the ongoing actuarial valuations of the public service pension schemes, i.e. the ‘Public Service Pensions (Valuations and Employer Cost Cap) Directions 2014’2 (‘Directions’) and the provisional scheme specific assumptions proposed for the actuarial valuations. The key further assumptions required for these calculations are outlined below (additional information on the assumptions used is provided in Annex 4):
> For active and deferred pensioner members there will be 20 surviving same sex dependants for every 1000 surviving opposite sex dependants
> For current pensioner members there will be 5 surviving same sex dependants for every 1000 surviving opposite sex dependants
> There are no current dependant members who were the same sex partner of a former member
> Members are assumed to be the same age as their partners for same sex couples
> The cost of providing current dependants with backdated pensions and providing new dependants who are not currently entitled to survivor benefits both backdated pension payments and future pension payments is approximately the same size as the cost for the increases in future pensions payable to current dependants.
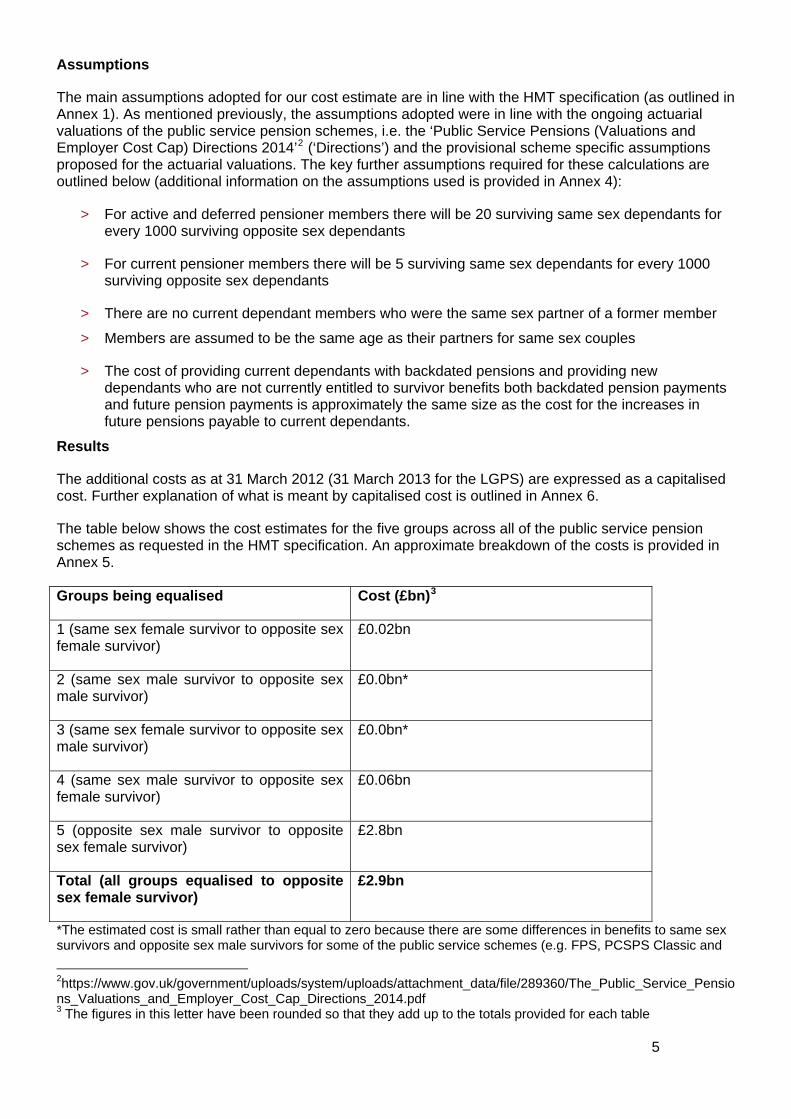
Results
The additional costs as at 31 March 2012 (31 March 2013 for the LGPS) are expressed as a capitalised cost. Further explanation of what is meant by capitalised cost is outlined in Annex 6.
The table below shows the cost estimates for the five groups across all of the public service pension schemes as requested in the HMT specification. An approximate breakdown of the costs is provided in Annex 5.
Groups being equalised Cost (£bn)3
1 (same sex female survivor to opposite sex female survivor)
£0.02bn
2 (same sex male survivor to opposite sex male survivor)
£0.0bn*
3 (same sex female survivor to opposite sex male survivor)
£0.0bn*
4 (same sex male survivor to opposite sex female survivor)
£0.06bn
5 (opposite sex male survivor to opposite sex female survivor)
£2.8bn
Total (all groups equalised to opposite sex female survivor)
£2.9bn
*The estimated cost is small rather than equal to zero because there are some differences in benefits to same sex survivors and opposite sex male survivors for some of the public service schemes (e.g. FPS, PCSPS Classic and
2https://www.gov.uk/government/uploads/system/uploads/attachment_data/file/289360/The_Public_Service_Pensions_Valuations_and_Employer_Cost_Cap_Directions_2014.pdf 3 The figures in this letter have been rounded so that they add up to the totals provided for each table

6
PPS). However, these costs are not estimated to be material in the context of this review.
7
Profile of the liability4
If the groups above were to be fully equalised then this would have an impact on the cashflows of the schemes. The narrative below should hopefully be sufficient to give an indication of what the cashflow impact (from 31 March 2012 (31 March 2013 for the LGPS)) is likely to be if all of the groups above were to be fully equalised (i.e. the cashflow impact of the £2.9bn cost). More detailed analysis of the cashflow impact is provided under the headings ‘Short term cashflow impacts’ and ‘Longer term cashflow impacts’ below.
For our calculations, we have assumed that the cost of backdating current dependants’ pensions and providing pensions to new dependants who are not currently entitled to survivor benefits is approximately the same size as the liability for increases in future pensions payable to current dependants. This is an approximate assumption as there is no firm data on which it can be based. However, based on this assumption, around £0.7bn (which is just under half of the costs associated to current dependant members of £1.6bn) would be payable immediately to dependants in the form of back-payments of benefits. The actual figure payable immediately is highly uncertain and could be significantly higher or lower than this estimate. It will depend significantly on factors such as: how many years of pension the dependants are being compensated for, how many dependants who are not currently drawing a pension are identified, whether any of these individuals have re-married, etc. It will also depend on factors such as whether interest (and if so what level) is paid on the back payments.
The remaining costs in respect of current dependants and new dependants who are not currently entitled to survivor benefits (around £0.9bn) would be spread by benefit payments to dependants over their remaining lives (assumed to be approximately 10 years on average5). The cashflow impact depends on the date the payments would commence. The later the payments commence the immediate cost of the back-payments of benefits will increase and the future term of the remaining costs would reduce.
The costs for actives, deferred pensioners and current pensioners (around £1.3bn) would begin to become payable in the form of benefits to a surviving dependant on the death of the member and would be spread over the lives of the dependant. Therefore these costs would not all start immediately and are expected to be spread over a significant period of time (over 50 years).
Short term cashflow impacts
HM Treasury has requested an approximate estimate of the cashflow impacts up to 2020 assuming that the additional payments to dependants began on 1 April 2015 (with all back-dated payments also paid on this date).
Assuming all the assumptions set out in this letter are borne out in practice, then the amount of back-dated payments payable as at 31 March 2015 would be around £1.0bn. Annual payments from 31 March 2015 until 31 March 2020 (the next 5 years) would be around £0.1bn p.a6.
As mentioned above, the cashflow impact is highly uncertain. In addition to the factors that impact on the estimate of the back-payments (for pensions payable before 31 March 2012 (31 March 2013 for the LGPS)), future payments also depend on factors such as the number of and profile (i.e. age, gender) of dependants who are not currently drawing a pension. As set out in Annex 4, we have assumed that the current male dependant membership represents around 85% of the male dependant membership that would exist if survivor benefits had been fully equalised from their inception. In this section we have assumed that the around 15% increase in the cost estimate of providing survivor benefits for these extra dependants corresponds to around a 15% increase in the annual pension payable. This therefore assumes that membership profile (e.g. ages of the dependants) of the extra dependants is the same as
4 A breakdown of the costs by types of individuals in the pension schemes are provided in Annex 5 and are referenced in this section. Annex 6 provides a high level explanation of the difference between what we have referred to as cost estimates and cashflows payments. 5 This has been estimated from life expectancies for current dependants in the NHSPS 95. 6 Cashflows have been presented in nominal terms
8
the current dependants, which is also highly uncertain. However, changing the percentage increase in the annual pension to say 5% or 25% would not change the figures outlined below (when rounded to £0.1bn).
Longer term cashflow impacts
In broad terms, the cashflows are expected to increase year on year in line with pension increases and as new dependant pensions come into payment, and decrease as dependants’ pensions cease to be paid (either because of the death of the dependant or other reasons for the pension being terminated, such as re-marriage). We would expect the cashflows to remain fairly level into the 2020s before reducing down to zero over around the next 50 years or longer.
Impact on employer contribution rates
To put the estimated increase in costs of equalising benefits into context, if an extra liability of around £3 billion were to be spread as additional contributions over a 15 year term7, based on a total annual pensionable pay of £100bn8, this would increase contributions by around 0.2% of pensionable pay during that period.
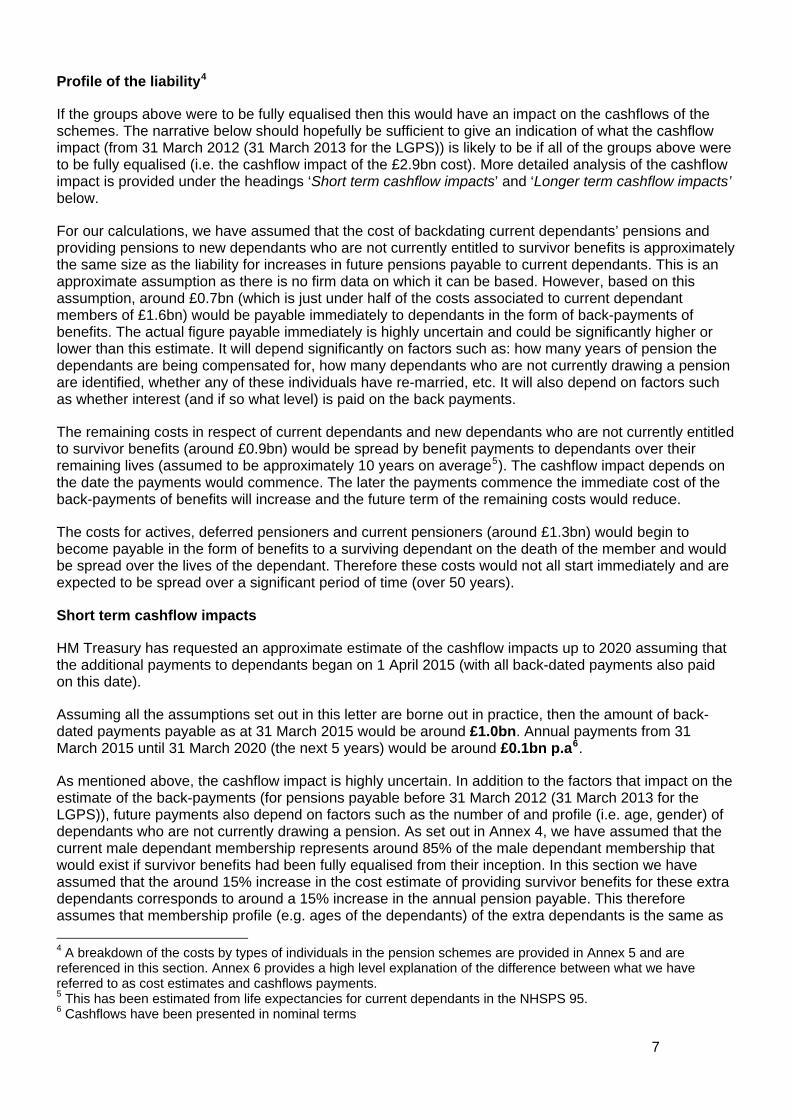
Sensitivities
The key assumptions for determining the cost estimate outlined above are:
> The proportion of member service that has been accrued before April 1988
> The number of dependant pensions that come into payment (which is influenced by the various assumptions including the number of members who have surviving same sex or opposite sex dependants).
The tables below show the approximate impact on the costs outlined above by making the following changes to the assumptions adopted. The tables show the impact of changing one assumption in isolation.
The proportion of member service that has been accrued before April 1988
The table below shows the approximate increase in the cost estimates if we were to assume that 10% extra/(less) of the accrued/current member pension has been accrued before April 19889. For example, the total cost of equalising all groups under these alternative assumptions would be £5.6bn (£2.9bn + £2.7bn) or £1.4bn (£2.9bn – £1.5bn).
Groups being equalised Increase (decrease) in the cost estimate
1 (same sex female survivor to opposite sex female survivor)
£0.02bn (£0.01bn)
4 (same sex male survivor to opposite sex female survivor)
£0.03bn (£0.03bn)
5 (opposite sex male survivor to opposite sex female survivor)
£2.7bn (£1.5bn)
7 This is consistent with the term for spreading deficits set out in the Directions 8 We are not aware of the total pensionable pay of the public service pension schemes. However the 31 March 2012 Whole of Government Accounts states that the salaries and wages (which will include non-pensionable salaries, staff who are not a member of one of the schemes and staff in Northern Ireland public service pension schemes) for permanently employed staff were £140bn. 9 This is with the exception of the AFPS 75 where the increase is a 10% increase/(decease) in the members who left service before 1987.

Total (all groups equalised to opposite sex female survivor)
£2.7bn (£1.5bn)
The number of dependant pensions that come into payment
The table below shows the approximate increase/(decrease) in the cost estimates if we were to assume a doubling/(halving) of the number of future dependant pensions to come into payment (e.g. doubling/(halving) the number of members who have surviving same sex or opposite sex dependants). For example, the total cost of equalising all groups under these alternative assumptions would be £4.2bn (£2.9bn + £1.3bn) or £2.3bn (£2.9bn - £0.6bn).
Groups being equalised Increase (decrease) in the cost estimate
1 (same sex female survivor to opposite sex female survivor)
£0.02bn (£0.01bn)
4 (same sex male survivor to opposite sex female survivor)
£0.06bn (£0.03bn)
5 (opposite sex male survivor to opposite sex female survivor)
£1.2bn (£0.6bn)
Total (all groups equalised to opposite sex female survivor)
£1.3bn (£0.6bn)
The tables above highlight that the cost estimates are highly sensitive to the assumptions adopted. Small changes in assumptions could change the costs significantly in absolute terms. However, we would not expect the order of magnitude of our cost estimates to change even if further data was available or if different assumptions were adopted. Additionally, as with any liability calculation the ultimate cost borne by the pension schemes is only known once all the pensions have been paid. Any estimate of cost depends on all of the assumptions adopted, including the discount rate, which is used to determine a present value for future cashflows. For example, changing the discount rate by 1% p.a. could change the cost estimates by around 15% to 25%.
Yours sincerely Stephen Humphrey FIA
Chief Actuary, Advice to Government, GAD
9
ANNEX 1 – HMT specification The letter dated 17 April from HM Treasury commissioning the cost estimates is reproduced below:
Richard Brown
Deputy Director, Workforce Pay and Pensions Tel: 020 7270 6040
1 Horse Guards RoadLondon
SW1A 2HQ
Stephen Humphrey Chief Actuary Government Actuary’s Department Finlaison House 15-17 Furnival Street London EC4A 1AB
• 17 April 2014
Dear Stephen MARRIAGE (SAME SEX COUPLES) ACT 2013 – REVIEW OF SURVIVOR BENEFITS IN OCCUPATIONAL PENSION SCHEMES As you know under Section 16 of the Marriage (Same Sex Couples) Act 2013 the Government is required to carry out a review of differences in survivor benefits provided under occupational pension schemes and the costs, and other effects, of securing that relevant differences in survivor benefits are eliminated.The Treasury is leading on this review in respect of survivor benefits provided under public service pension schemes. The Treasury requires an estimate of the costs of equalising the survivor benefits provided to different groups by the public service pension schemes. Treasury officials have been working closely with officials in the departments responsible for the public service schemes on a specification for this cost analysis. I am now writing to formally commission the cost analysis from the Government Actuary’s Department. I have attached to this letter the detailed specification for analysis. This includes information on the key differences in survivor benefits, provided by departments responsible for each public service scheme and sets out other requirements for the cost analysis.
10

Yours sincerely
Richard Brown
11

12
Review of survivor benefits in occupational pension schemes – Cost estimate specification for the public service pension schemes.
For the review of survivor benefits in occupational pension schemes, provided for under section 16 of the Marriage (Same Sex Couples) Act 2013, HMT requests estimated costs of providing additional survivor benefits in public service pension schemes as per the following specification. Main criteria for cost assessment 1. What is the cost of providing survivor benefits in public service pension schemes to
surviving female civil partners and female survivors of a marriage between a same sex couple which are identical (for all periods of accrual) to those provided to females who survive their male spouse?
2. What is the cost of providing survivor benefits in public service pension schemes to surviving male civil partners and male survivors of a marriage between a same sex couple which are identical (for all periods of accrual) to those provided to males who survive their female spouse?
3. What is the cost of providing survivor benefits in public service pension schemes to surviving female civil partners and female survivors of a marriage between a same sex couple, which are identical (for all periods of accrual) to those provided to males who survive their female spouse?
4. What is the cost of providing survivor benefits in public service pension schemes to surviving male civil partners and male survivors of a marriage between a same sex couple, which are identical (for all periods of accrual) to those provided to females who survive their male spouse?
5. What is the cost of providing survivor benefits in public service pension schemes to males who survive their female spouse which are identical (for all periods of accrual) to those provided to females who survive their male spouse?
Types of survivor benefits within scope of the assessment The above estimates should be split by the following groups of individuals: 1. contingent survivor benefits arising from past service of existing actives
2. contingent survivor benefits attached to existing deferred pensioners
3. contingent survivor benefits attached to existing pensions in payment
4. survivor benefits in payment (including backdating of payments),
5. survivor benefits not in payment, because all service was before the relevant survivor
benefit existed (including backdating of payments) Differences in survivor benefits within scope of the assessment

13
Annex A sets out the main differences in the provision of survivor benefits for different categories of survivor within each of the main public service pension schemes. This table was appended to the original letter of 17 April from HM Treasury to the Government Actuary’s Department and was used as the basis for the cost assessment. Public service schemes within scope of the assessment For the purpose of the cost assessment the schemes listed below should be assessed. • Armed Forces Pension Scheme 1975 • Firefighters’ Pension Scheme 1992 • Firefighters’ Pension Scheme 1992 (Wales) • Firefighters’ Pension Scheme 1992 (Scotland) • Local Government Pension Scheme • Local Government Pension Scheme (Scotland) • NHS Pension Scheme 1995 Section • NHS Pension Scheme 1995 Section (Scotland) • PCSPS Classic • PCSPS Classic plus • Police Pension Scheme 1987 • Police Pension Scheme (Scotland) • Teachers’ Pension Scheme (NPA 60) • Teachers’ Pension Scheme (Scotland) (NPA 60)
Other public service schemes An estimate should also be made of the costs to other public service schemes, not listed below, but included in the Whole of Government Accounts (e.g. the UKAEA and Research Councils Pension Schemes), of providing additional survivor benefits. We do not require a detailed analysis for these schemes, however, we require a broad brush estimate of the cost impact for these schemes. Data, methodology and assumptions for the purpose of the assessment For the purpose of the cost assessment, the cost is defined as the present value of the future cashflows (‘capitalised cost’). The data, methodology and assumptions should be consistent with the approach for an actuarial valuation on a SCAPE basis. Further assumptions will be required to complete the cost assessment that would not be required for an actuarial valuation. These assumptions should be set as best estimate and consistently across the public service schemes.
14
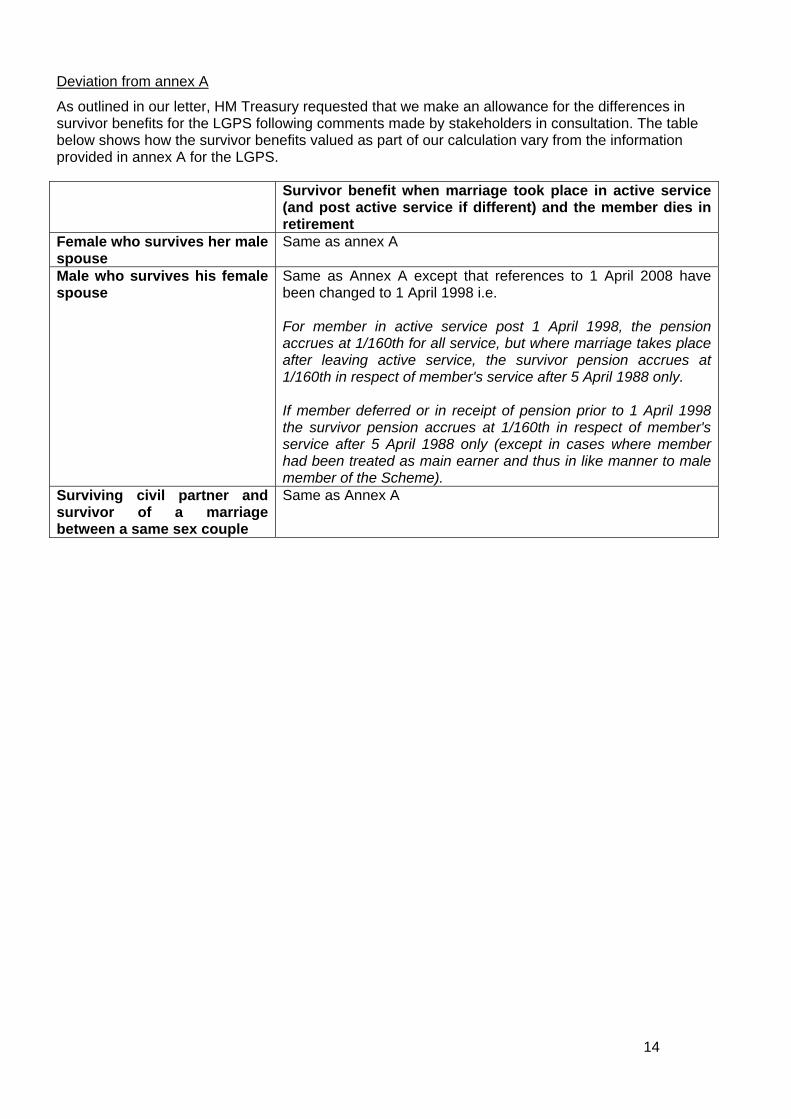
Deviation from annex A
As outlined in our letter, HM Treasury requested that we make an allowance for the differences in survivor benefits for the LGPS following comments made by stakeholders in consultation. The table below shows how the survivor benefits valued as part of our calculation vary from the information provided in annex A for the LGPS.
Survivor benefit when marriage took place in active service (and post active service if different) and the member dies in retirement
Female who survives her male spouse
Same as annex A
Male who survives his female spouse
Same as Annex A except that references to 1 April 2008 have been changed to 1 April 1998 i.e. For member in active service post 1 April 1998, the pension accrues at 1/160th for all service, but where marriage takes place after leaving active service, the survivor pension accrues at 1/160th in respect of member's service after 5 April 1988 only. If member deferred or in receipt of pension prior to 1 April 1998 the survivor pension accrues at 1/160th in respect of member's service after 5 April 1988 only (except in cases where member had been treated as main earner and thus in like manner to male member of the Scheme).
Surviving civil partner and survivor of a marriage between a same sex couple
Same as Annex A
15
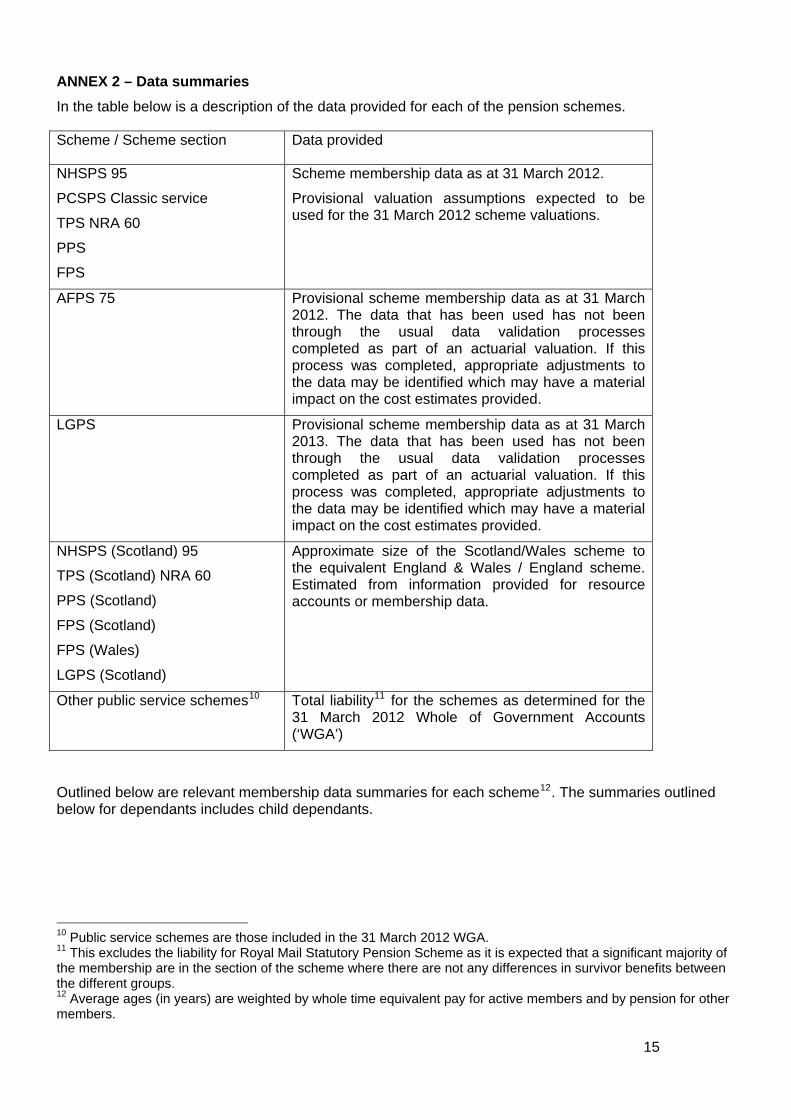
ANNEX 2 – Data summaries In the table below is a description of the data provided for each of the pension schemes.
Scheme / Scheme section Data provided
NHSPS 95
PCSPS Classic service
TPS NRA 60
PPS
FPS
Scheme membership data as at 31 March 2012.
Provisional valuation assumptions expected to be used for the 31 March 2012 scheme valuations.
AFPS 75 Provisional scheme membership data as at 31 March 2012. The data that has been used has not been through the usual data validation processes completed as part of an actuarial valuation. If this process was completed, appropriate adjustments to the data may be identified which may have a material impact on the cost estimates provided.
LGPS Provisional scheme membership data as at 31 March 2013. The data that has been used has not been through the usual data validation processes completed as part of an actuarial valuation. If this process was completed, appropriate adjustments to the data may be identified which may have a material impact on the cost estimates provided.
NHSPS (Scotland) 95
TPS (Scotland) NRA 60
PPS (Scotland)
FPS (Scotland)
FPS (Wales)
LGPS (Scotland)
Approximate size of the Scotland/Wales scheme to the equivalent England & Wales / England scheme. Estimated from information provided for resource accounts or membership data.
Other public service schemes10 Total liability11 for the schemes as determined for the 31 March 2012 Whole of Government Accounts (‘WGA’)
Outlined below are relevant membership data summaries for each scheme12. The summaries outlined below for dependants includes child dependants.
10 Public service schemes are those included in the 31 March 2012 WGA. 11 This excludes the liability for Royal Mail Statutory Pension Scheme as it is expected that a significant majority of the membership are in the section of the scheme where there are not any differences in survivor benefits between the different groups. 12 Average ages (in years) are weighted by whole time equivalent pay for active members and by pension for other members.
16
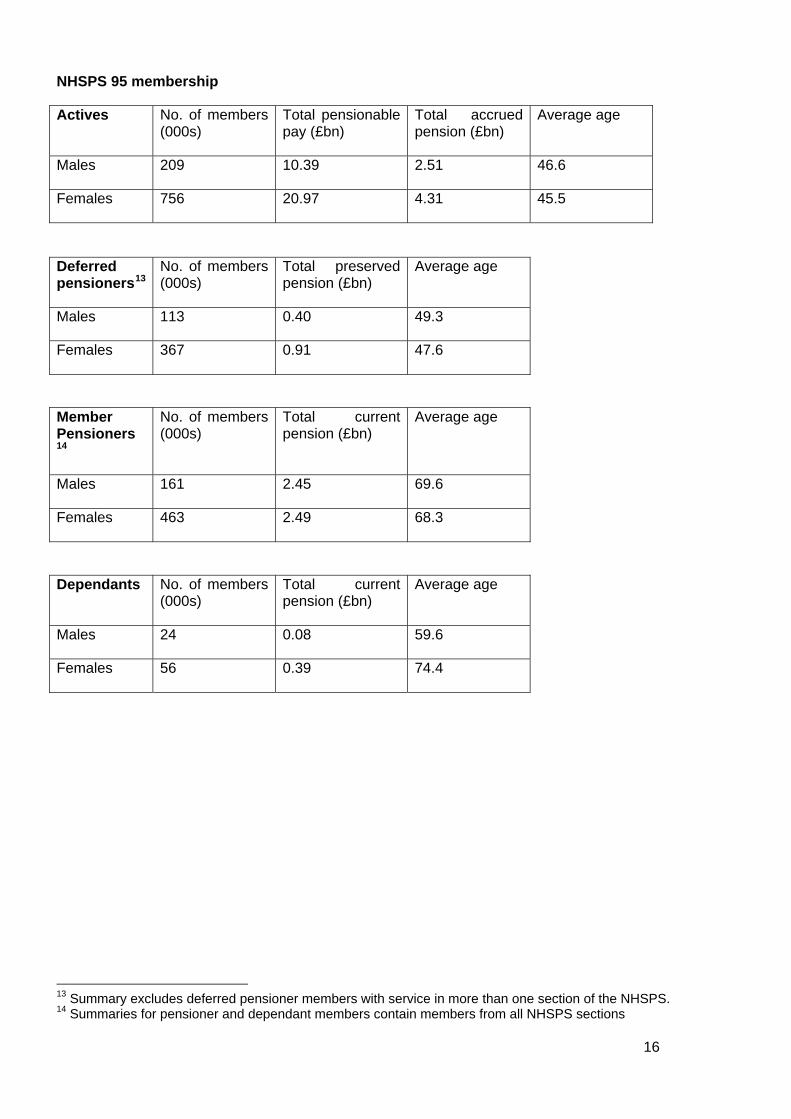
NHSPS 95 membership
Actives No. of members (000s)
Total pensionable pay (£bn)
Total accrued pension (£bn)
Average age
Males 209 10.39 2.51 46.6
Females 756 20.97 4.31 45.5
Deferred pensioners13
No. of members (000s)
Total preserved pension (£bn)
Average age
Males 113 0.40 49.3
Females 367 0.91 47.6
Member Pensioners14
No. of members (000s)
Total current pension (£bn)
Average age
Males 161 2.45 69.6
Females 463 2.49 68.3
Dependants No. of members (000s)
Total current pension (£bn)
Average age
Males 24 0.08 59.6
Females 56 0.39 74.4
13 Summary excludes deferred pensioner members with service in more than one section of the NHSPS. 14 Summaries for pensioner and dependant members contain members from all NHSPS sections
17
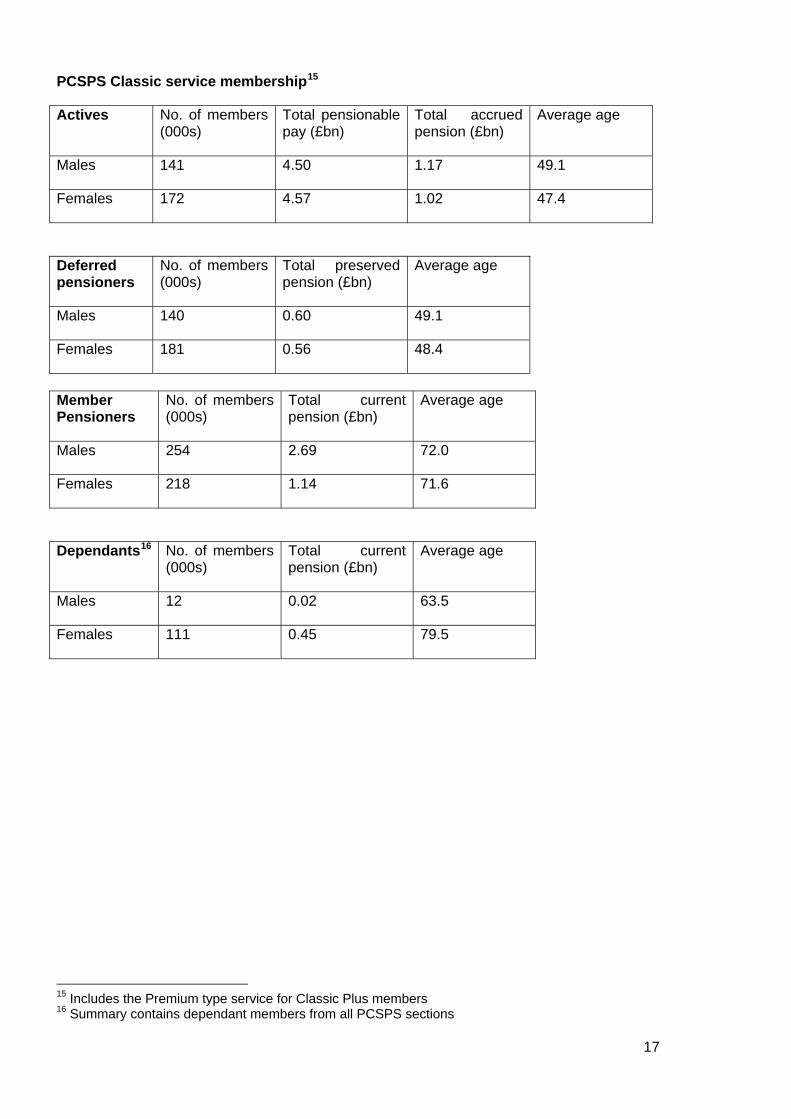
PCSPS Classic service membership15
Actives No. of members (000s)
Total pensionable pay (£bn)
Total accrued pension (£bn)
Average age
Males 141 4.50 1.17 49.1
Females 172 4.57 1.02 47.4
Deferred pensioners
No. of members (000s)
Total preserved pension (£bn)
Average age
Males 140 0.60 49.1
Females 181 0.56 48.4
Member Pensioners
No. of members (000s)
Total current pension (£bn)
Average age
Males 254 2.69 72.0
Females 218 1.14 71.6
Dependants16 No. of members (000s)
Total current pension (£bn)
Average age
Males 12 0.02 63.5
Females 111 0.45 79.5
15 Includes the Premium type service for Classic Plus members 16 Summary contains dependant members from all PCSPS sections

18
TPS NRA 60 membership
Actives17 No. of members (000s)
Total pensionable pay (£bn)
Total accrued pension (£bn)
Average age
Males 140 6.35 1.37 47.3
Females 338 13.90 2.53 45.7
Deferred pensioners
No. of members (000s)
Total preserved pension (£bn)
Average age
Males 84 0.31 51.4
Females 197 0.59 49.5
Member Pensioners18
No. of members (000s)
Total current pension (£bn)
Average age
Males 209 2.86 69.8
Females 347 3.31 69.6
Dependants No. of members (000s)
Total current pension (£bn)
Average age
Males 13 0.03 63.1
Females 49 0.20 75.1
17 Summaries excludes members with mixed service (active and deferred pensioner members with service in more than one section of the TPS) 18 Summaries for pensioner and dependant members contain members from all TPS sections
19
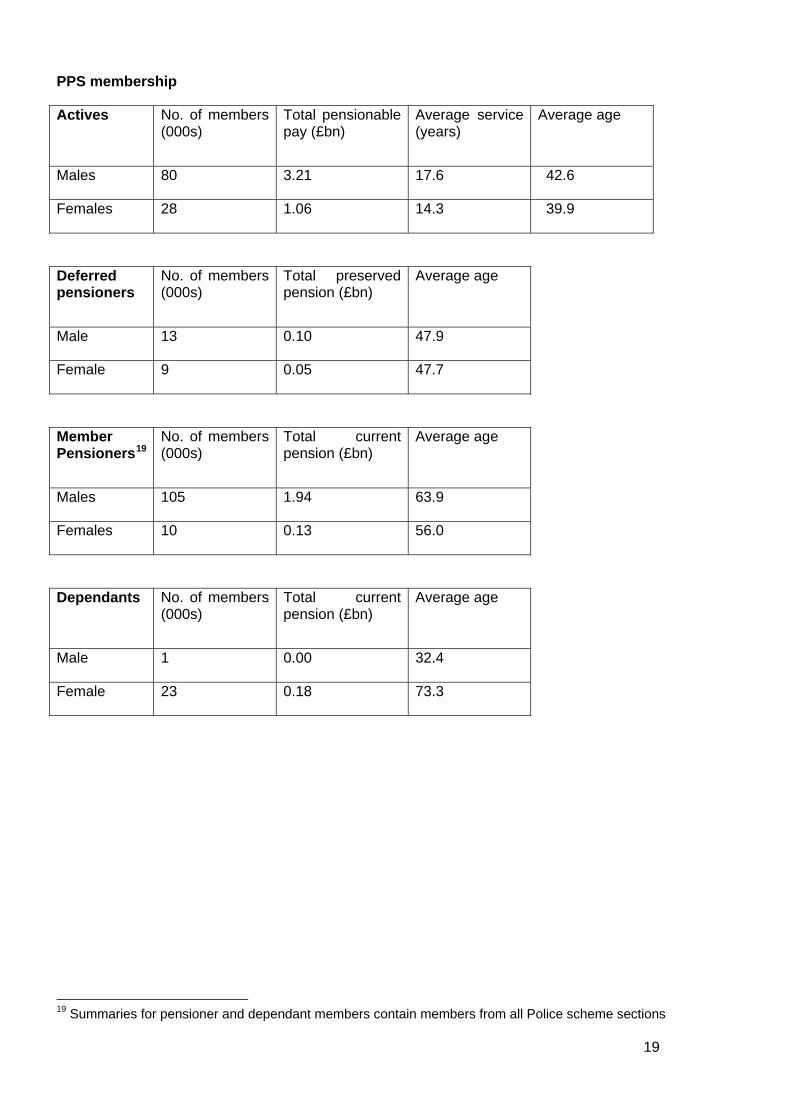
PPS membership
Actives No. of members (000s)
Total pensionable pay (£bn)
Average service (years)
Average age
Males 80 3.21 17.6 42.6
Females 28 1.06 14.3 39.9
Deferred pensioners
No. of members (000s)
Total preserved pension (£bn)
Average age
Male 13 0.10 47.9
Female 9 0.05 47.7
Member Pensioners19
No. of members (000s)
Total current pension (£bn)
Average age
Males 105 1.94 63.9
Females 10 0.13 56.0
Dependants No. of members (000s)
Total current pension (£bn)
Average age
Male 1 0.00 32.4
Female 23 0.18 73.3
19 Summaries for pensioner and dependant members contain members from all Police scheme sections
20
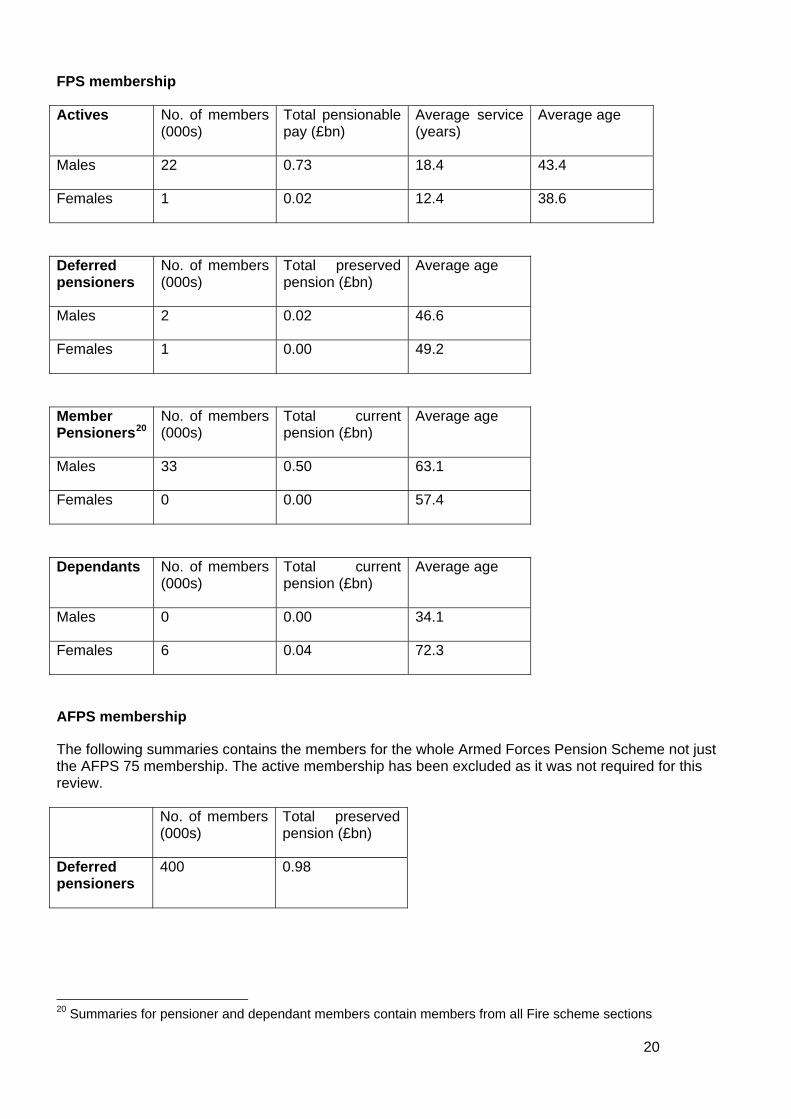
FPS membership
Actives No. of members (000s)
Total pensionable pay (£bn)
Average service (years)
Average age
Males 22 0.73 18.4 43.4
Females 1 0.02 12.4 38.6
Deferred pensioners
No. of members (000s)
Total preserved pension (£bn)
Average age
Males 2 0.02 46.6
Females 1 0.00 49.2
Member Pensioners20
No. of members (000s)
Total current pension (£bn)
Average age
Males 33 0.50 63.1
Females 0 0.00 57.4
Dependants No. of members (000s)
Total current pension (£bn)
Average age
Males 0 0.00 34.1
Females 6 0.04 72.3
AFPS membership
The following summaries contains the members for the whole Armed Forces Pension Scheme not just the AFPS 75 membership. The active membership has been excluded as it was not required for this review.
No. of members (000s)
Total preserved pension (£bn)
Deferred pensioners
400 0.98
20 Summaries for pensioner and dependant members contain members from all Fire scheme sections

21
No. of members
(000s) Total current pension (£bn)
Member pensioners
333 3.07
No. of members (000s)
Total current pension (£bn)
Dependants 73 0.15
LGPS membership
Active members
No. of members (000s)
Total pensionable pay (£bn)
Males 455 11.05
Females 1,254 18.84
Deferred pensioners
No. of members (000s)
Total preserved pension (£bn)
Males 470 0.93
Females 1,270 1.37
Pensioners (including dependants)
No. of members (000s)
Total current pension (£bn)
Males 550 3.78
Females 861 2.90
Scotland / Wales schemes
All Scotland schemes are assumed to be 10% the size of the corresponding England & Wales scheme.
Fire Scotland and Fire Wales collectively are assumed to be 10% the size of Fire England. However, this is not expected to be material assumption.
Other public service schemes
All other public service schemes in aggregate are assumed to be 20% the size of NHSPS (England & Wales scheme).
22
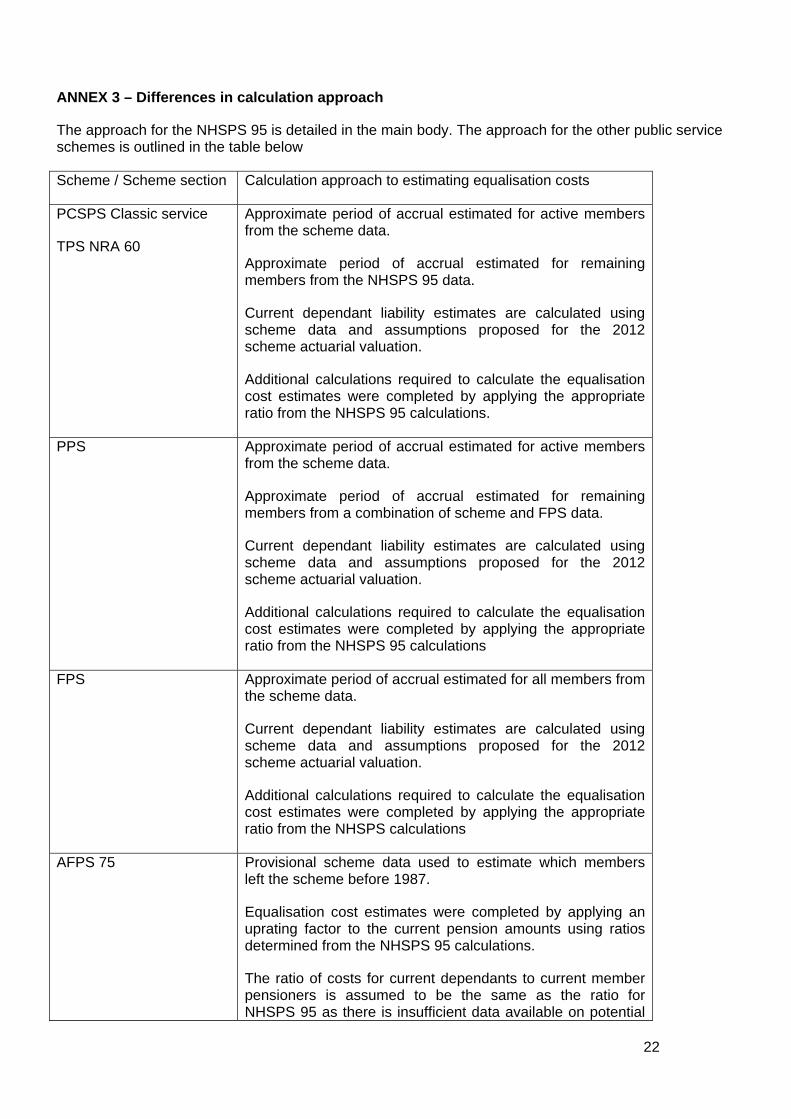
ANNEX 3 – Differences in calculation approach
The approach for the NHSPS 95 is detailed in the main body. The approach for the other public service schemes is outlined in the table below
Scheme / Scheme section Calculation approach to estimating equalisation costs
PCSPS Classic service
TPS NRA 60
Approximate period of accrual estimated for active members from the scheme data.
Approximate period of accrual estimated for remaining members from the NHSPS 95 data.
Current dependant liability estimates are calculated using scheme data and assumptions proposed for the 2012 scheme actuarial valuation.
Additional calculations required to calculate the equalisation cost estimates were completed by applying the appropriate ratio from the NHSPS 95 calculations.
PPS Approximate period of accrual estimated for active members from the scheme data.
Approximate period of accrual estimated for remaining members from a combination of scheme and FPS data.
Current dependant liability estimates are calculated using scheme data and assumptions proposed for the 2012 scheme actuarial valuation.
Additional calculations required to calculate the equalisation cost estimates were completed by applying the appropriate ratio from the NHSPS 95 calculations
FPS Approximate period of accrual estimated for all members from the scheme data.
Current dependant liability estimates are calculated using scheme data and assumptions proposed for the 2012 scheme actuarial valuation.
Additional calculations required to calculate the equalisation cost estimates were completed by applying the appropriate ratio from the NHSPS calculations
AFPS 75 Provisional scheme data used to estimate which members left the scheme before 1987.
Equalisation cost estimates were completed by applying an uprating factor to the current pension amounts using ratios determined from the NHSPS 95 calculations.
The ratio of costs for current dependants to current member pensioners is assumed to be the same as the ratio for NHSPS 95 as there is insufficient data available on potential
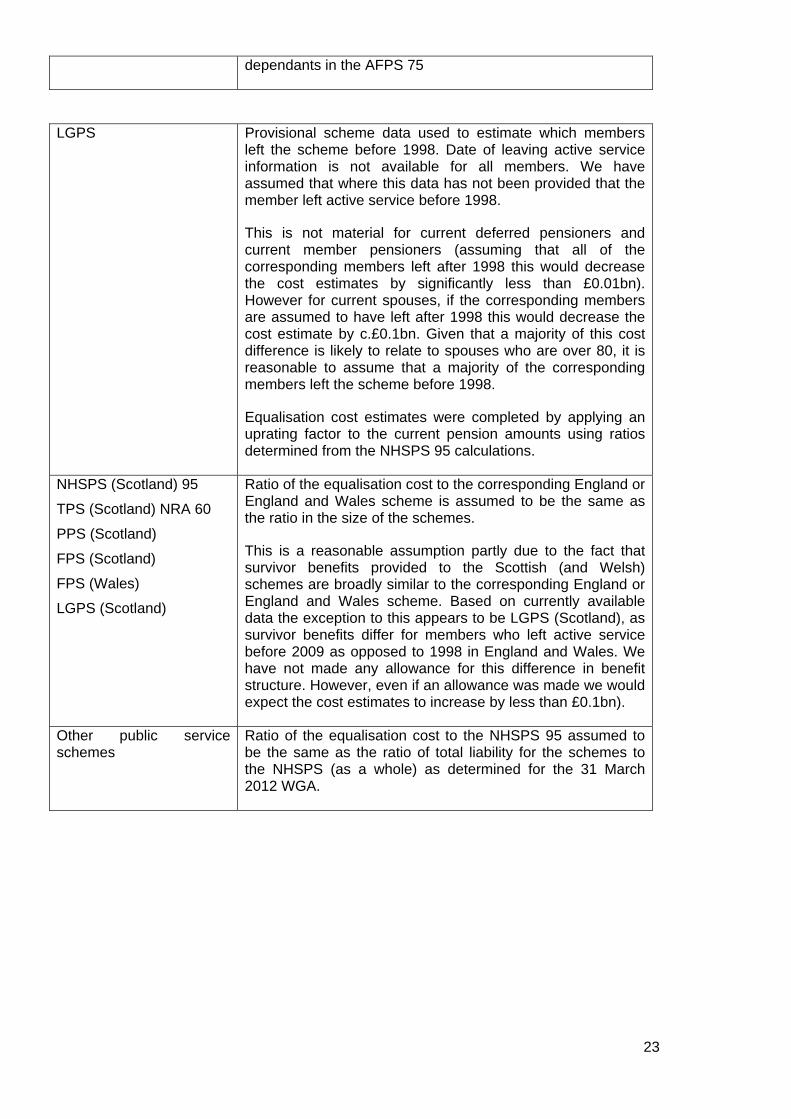
23
dependants in the AFPS 75
LGPS Provisional scheme data used to estimate which members
left the scheme before 1998. Date of leaving active service information is not available for all members. We have assumed that where this data has not been provided that the member left active service before 1998.
This is not material for current deferred pensioners and current member pensioners (assuming that all of the corresponding members left after 1998 this would decrease the cost estimates by significantly less than £0.01bn). However for current spouses, if the corresponding members are assumed to have left after 1998 this would decrease the cost estimate by c.£0.1bn. Given that a majority of this cost difference is likely to relate to spouses who are over 80, it is reasonable to assume that a majority of the corresponding members left the scheme before 1998.
Equalisation cost estimates were completed by applying an uprating factor to the current pension amounts using ratios determined from the NHSPS 95 calculations.
NHSPS (Scotland) 95
TPS (Scotland) NRA 60
PPS (Scotland)
FPS (Scotland)
FPS (Wales)
LGPS (Scotland)
Ratio of the equalisation cost to the corresponding England or England and Wales scheme is assumed to be the same as the ratio in the size of the schemes.
This is a reasonable assumption partly due to the fact that survivor benefits provided to the Scottish (and Welsh) schemes are broadly similar to the corresponding England or England and Wales scheme. Based on currently available data the exception to this appears to be LGPS (Scotland), as survivor benefits differ for members who left active service before 2009 as opposed to 1998 in England and Wales. We have not made any allowance for this difference in benefit structure. However, even if an allowance was made we would expect the cost estimates to increase by less than £0.1bn).
Other public service schemes
Ratio of the equalisation cost to the NHSPS 95 assumed to be the same as the ratio of total liability for the schemes to the NHSPS (as a whole) as determined for the 31 March 2012 WGA.
24
ANNEX 4 – Assumptions The assumptions adopted for this cost estimate are consistent with the valuation process set out in the Directions. For example:
> Net discount rate = 3% p.a. (net of CPI)
> Long term pension increase = CPI = 2% p.a.
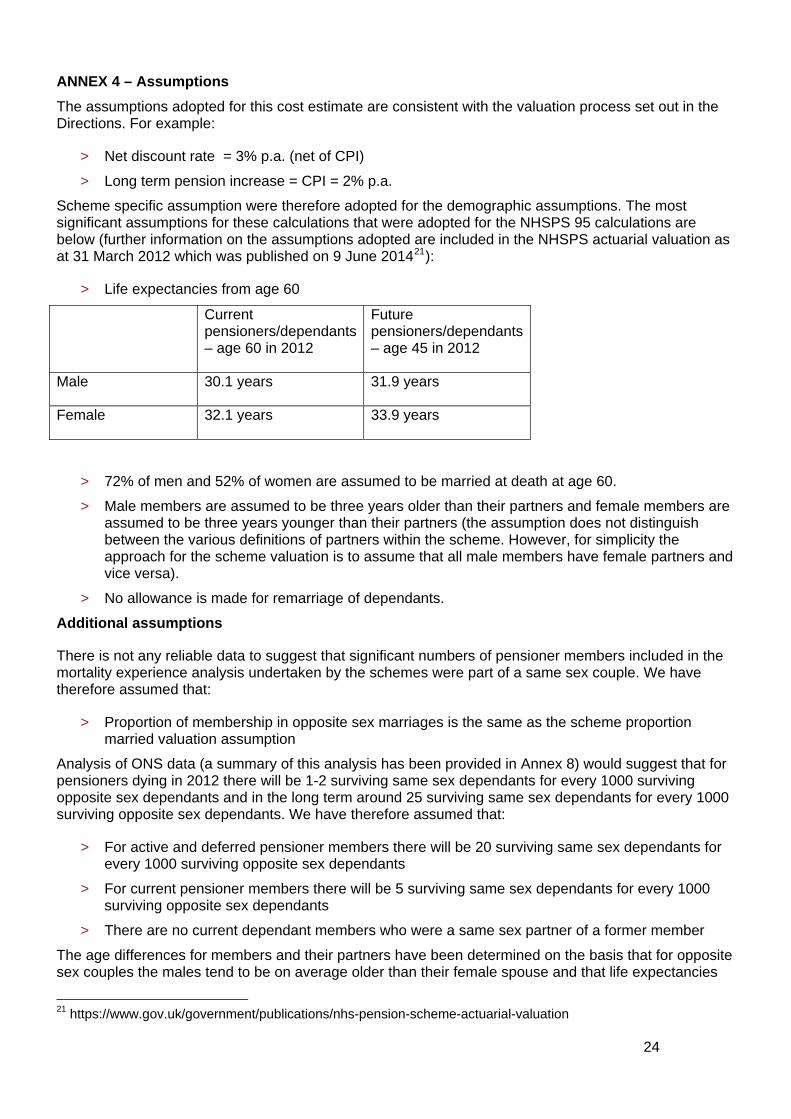
Scheme specific assumption were therefore adopted for the demographic assumptions. The most significant assumptions for these calculations that were adopted for the NHSPS 95 calculations are below (further information on the assumptions adopted are included in the NHSPS actuarial valuation as at 31 March 2012 which was published on 9 June 201421):
> Life expectancies from age 60
Current pensioners/dependants – age 60 in 2012
Future pensioners/dependants – age 45 in 2012
Male 30.1 years 31.9 years
Female 32.1 years 33.9 years
> 72% of men and 52% of women are assumed to be married at death at age 60.
> Male members are assumed to be three years older than their partners and female members are assumed to be three years younger than their partners (the assumption does not distinguish between the various definitions of partners within the scheme. However, for simplicity the approach for the scheme valuation is to assume that all male members have female partners and vice versa).
> No allowance is made for remarriage of dependants.
Additional assumptions
There is not any reliable data to suggest that significant numbers of pensioner members included in the mortality experience analysis undertaken by the schemes were part of a same sex couple. We have therefore assumed that:
> Proportion of membership in opposite sex marriages is the same as the scheme proportion married valuation assumption
Analysis of ONS data (a summary of this analysis has been provided in Annex 8) would suggest that for pensioners dying in 2012 there will be 1-2 surviving same sex dependants for every 1000 surviving opposite sex dependants and in the long term around 25 surviving same sex dependants for every 1000 surviving opposite sex dependants. We have therefore assumed that:
> For active and deferred pensioner members there will be 20 surviving same sex dependants for every 1000 surviving opposite sex dependants
> For current pensioner members there will be 5 surviving same sex dependants for every 1000 surviving opposite sex dependants
> There are no current dependant members who were a same sex partner of a former member
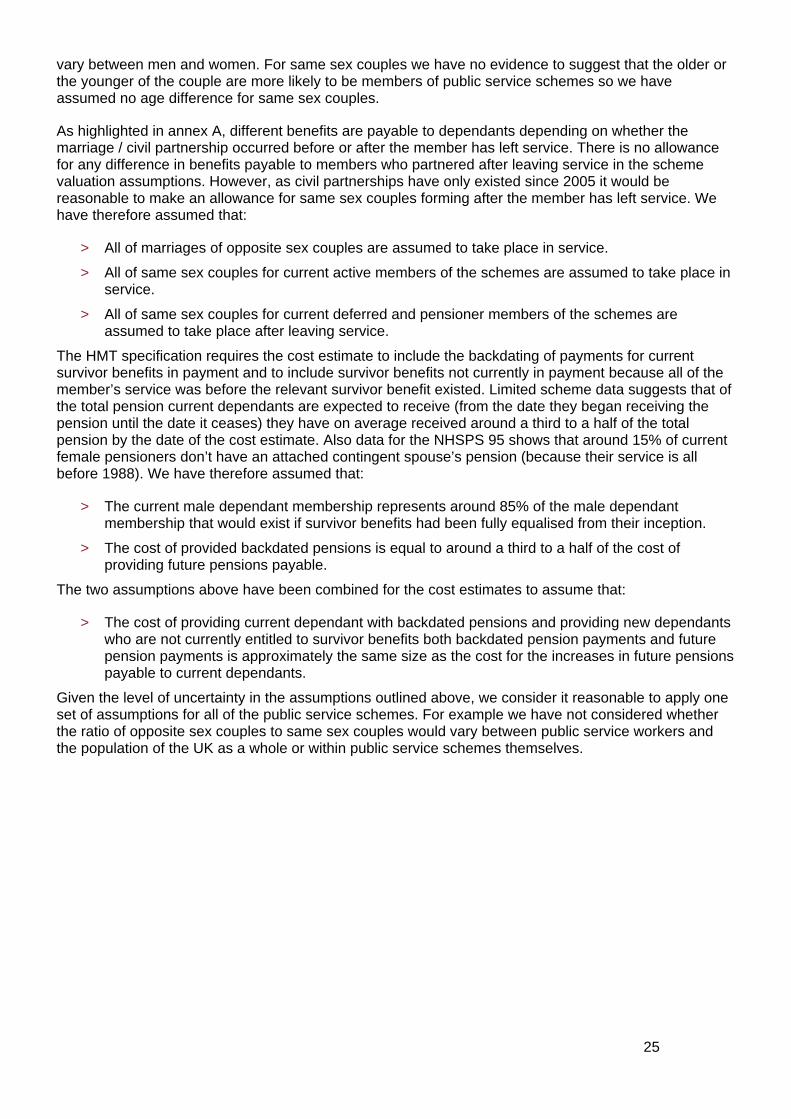
The age differences for members and their partners have been determined on the basis that for opposite sex couples the males tend to be on average older than their female spouse and that life expectancies
21 https://www.gov.uk/government/publications/nhs-pension-scheme-actuarial-valuation
25
vary between men and women. For same sex couples we have no evidence to suggest that the older or the younger of the couple are more likely to be members of public service schemes so we have assumed no age difference for same sex couples.
As highlighted in annex A, different benefits are payable to dependants depending on whether the marriage / civil partnership occurred before or after the member has left service. There is no allowance for any difference in benefits payable to members who partnered after leaving service in the scheme valuation assumptions. However, as civil partnerships have only existed since 2005 it would be reasonable to make an allowance for same sex couples forming after the member has left service. We have therefore assumed that:
> All of marriages of opposite sex couples are assumed to take place in service.
> All of same sex couples for current active members of the schemes are assumed to take place in service.
> All of same sex couples for current deferred and pensioner members of the schemes are assumed to take place after leaving service.
The HMT specification requires the cost estimate to include the backdating of payments for current survivor benefits in payment and to include survivor benefits not currently in payment because all of the member’s service was before the relevant survivor benefit existed. Limited scheme data suggests that of the total pension current dependants are expected to receive (from the date they began receiving the pension until the date it ceases) they have on average received around a third to a half of the total pension by the date of the cost estimate. Also data for the NHSPS 95 shows that around 15% of current female pensioners don’t have an attached contingent spouse’s pension (because their service is all before 1988). We have therefore assumed that:
> The current male dependant membership represents around 85% of the male dependant membership that would exist if survivor benefits had been fully equalised from their inception.
> The cost of provided backdated pensions is equal to around a third to a half of the cost of providing future pensions payable.
The two assumptions above have been combined for the cost estimates to assume that:
> The cost of providing current dependant with backdated pensions and providing new dependants who are not currently entitled to survivor benefits both backdated pension payments and future pension payments is approximately the same size as the cost for the increases in future pensions payable to current dependants.
Given the level of uncertainty in the assumptions outlined above, we consider it reasonable to apply one set of assumptions for all of the public service schemes. For example we have not considered whether the ratio of opposite sex couples to same sex couples would vary between public service workers and the population of the UK as a whole or within public service schemes themselves.

26
ANNEX 5 – Breakdown of result
As outlined in Annex 4, assumptions have been made which apply to the public service schemes as a whole and were not determined scheme by scheme. Therefore the breakdown provided below is only an indicative breakdown of the total cost by scheme.
1 (same sex female survivor to opposite sex female survivor)
4 (same sex male survivor to opposite sex female survivor)
5 (opposite sex male survivor to opposite sex female survivor)
NHSPS 95 26% 17% 28%
PCSPS Classic service 17% 17% 14%
TPS NRA 60 21% 16% 22%
PPS 3% 11% 3%
FPS immaterial 3% immaterial
AFPS 75 1% 14% 1%
LGPS 20% 13% 19%
NHSPS (Scotland) 95
TPS (Scotland) NRA 60
PPS (Scotland)
FPS (Scotland)
FPS (Wales)
LGPS (Scotland)
7% 6% 7%
Other public service schemes
5% 3% 6%
Total 100% (£0.02bn) 100% (£0.06bn) 100% (£2.8bn)
Below is a breakdown of the cost estimates by groups of individuals (numbers correspond to the groups of individuals identified in the HMT specification).
1 (same sex female survivor to opposite sex female survivor)
4 (same sex male survivor to opposite sex female survivor)
5 (opposite sex male survivor to opposite sex female survivor)
1 – Active members £0.005bn £0.02bn £0.2bn
2 – Deferred members £0.009bn £0.01bn £0.3bn
3 – Pensioner members £0.004bn £0.03bn £0.7bn
4&5 – Dependants £0bn* £0bn* £1.6bn
Total £0.02bn £0.06bn £2.8bn

27
*Due to the assumption that no current dependants are same sex partners. If this is not the case then the cost would be non-zero.

28
ANNEX 6 – Background
Determining costs for public service schemes
The actual liability (i.e. the pension payments) would consist of a series of future cashflows. Some payments would be due immediately (to current partners), whereas the cashflows relating to future partners would emerge over a lengthy period (in excess of 70 years). There are different approaches that can be taken when referring to cost. The figures in this note are expressed as a capitalised cost. This essentially means that it is the amount of money needed now to pay a series of cashflows in the future (a discounted value of the cashflows). As you would expect to be able to invest the money in assets until the money was needed, you would expect to be able to gain a rate of return on those assets. Therefore, if you needed to pay someone £100 in a year’s time, you would need less than £100 now with the exact amount depending on the return you would expect to get on your assets (known as the discount rate).
For private sector schemes it is common to select a discount rate when determining capitalised costs with reference to the expected return on the assets held by the scheme. However, with the exception of the LGPS, most public service schemes are unfunded (i.e. no assets are held to pay future liabilities). Therefore the common approach for determining cost for public service schemes is to use a discount rate in line with the SCAPE discount rate which is set by HM Treasury. The SCAPE methodology creates the concept of a notional fund which enables schemes to set the employer contribution rate which not only allows for the cost of future accrual of benefits but can also be adjusted to allow for past over/under payment of contributions.
As the scheme is unfunded and ultimately benefits are paid out of general taxation, the employer contribution rate is an estimate of the contribution required with ultimate cost falling onto the taxpayer.

29
ANNEX 7 – Abbreviations and other terms used
Abbreviations used for the sections of the public service pension schemes Armed Forces Pension Scheme 1975 (‘AFPS 75’) Fire Fighters Pension Scheme (England) 1992 Section (‘FPS’) Fire Fighters Pension Scheme (Scotland) 1992 Section (‘FPS (Scotland)’) Fire Fighters Pension Scheme (Wales) 1992 Section (‘FPS (Wales)’) Local Government Pension Scheme (England and Wales) (‘LGPS’) Local Government Pension Scheme (Scotland) (‘LGPS (Scotland)’) NHS Pension Scheme (England and Wales) 1995 Section (‘NHSPS 95’) NHS Pension Scheme (Scotland) 1995 Section (‘NHSPS (Scotland) 95’) PCSPS (GB) Classic and PCSPS (GB) Classic Plus (‘PCSPS Classic service’) Police Pension Scheme (England and Wales) 1997 Section (‘PPS’) Police Pension Scheme (Scotland) 1997 Section (‘PPS (Scotland)’) Teacher’s Pension Scheme (England and Wales) NPA 60 Section (‘TPS NRA 60’) Teacher’s Pension Scheme (Scotland) NPA 60 Section (‘TPS (Scotland) NRA 60’) Other terms used Throughout this letter I have used the terms: ‘Same sex partner/couples’ to refer to individuals who are either in / assumed to be in a civil partnership or a marriage of a same sex couple. ‘Opposite sex partner/couples’ to refer to individuals who are either in / assumed to be in a marriage of an opposite sex couple. ‘Same sex female survivor’ to refer to females who survive their civil partner or same sex spouse ‘Same sex male survivor’ to refer to males who survive their civil partner or same sex spouse ‘Opposite sex female survivor’ to refer to females who survive their opposite sex spouse ‘Opposite sex male survivor’ to refer to males who survive their opposite sex spouse

30
ANNEX 8 – Analysis of ONS data
The ONS data below shows the current ratio of the number of people dying with a surviving same sex partner compared to a surviving opposite sex partner. It also shows that the ratio is greater for people dying at younger ages.
Deaths registered in England and Wales in 201222
Males Females
Age Opposite sex couples
Same sex couples Ratio
Opposite sex couples
Same sex couples Ratio
15-39 984 15 1.52% 863 4 0.46%
40-44 1,067 7 0.66% 919 10 1.09%
45-49 1,840 21 1.14% 1,640 20 1.22%
50-54 2,925 25 0.85% 2,411 12 0.50%
55-59 4,835 21 0.43% 3,649 12 0.33%
60-64 8,339 23 0.28% 5,793 12 0.21%
65-69 12,663 46 0.36% 8,016 8 0.10%
70-74 16,330 38 0.23% 8,876 15 0.17%
75-79 21,377 32 0.15% 10,482 10 0.10%
80-84 24,190 26 0.11% 10,575 5 0.05%
85-89 18,753 26 0.14% 7,488 6 0.08%
90-94 8,412 1 0.01% 2,935 3 0.10%
95-110 1,583 1 0.06% 466 0 0.00%
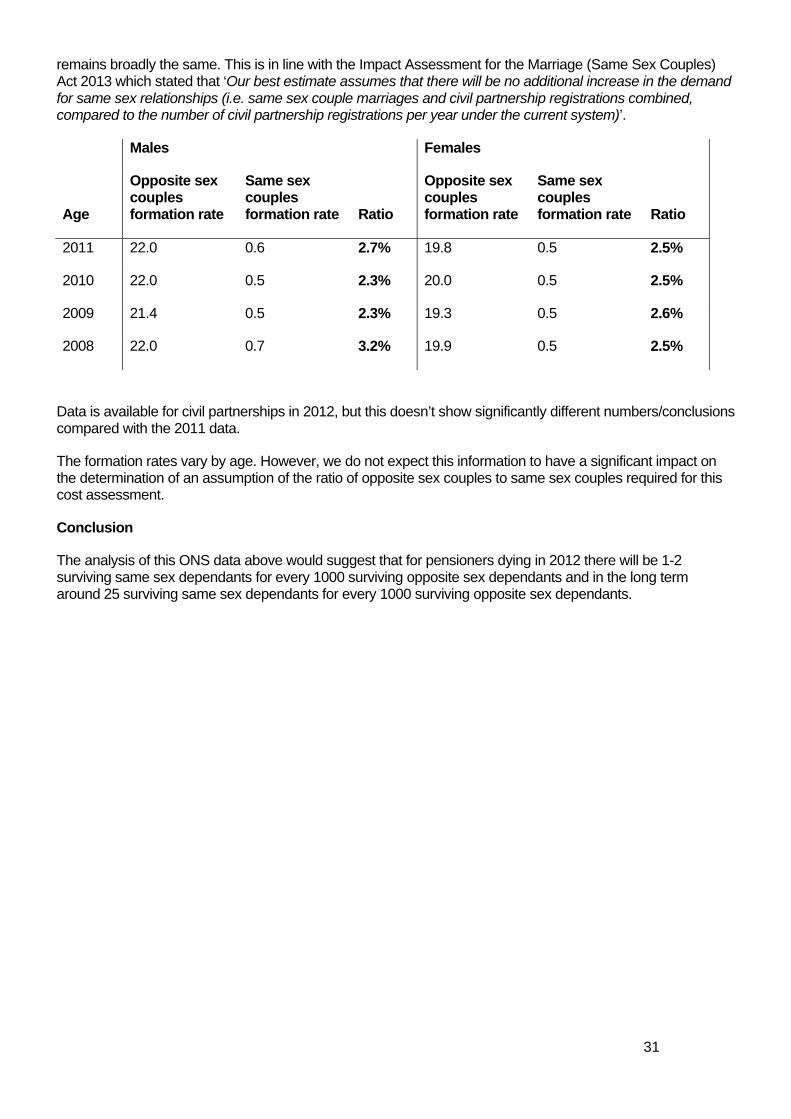
Marriage and civil partnership formation rates
The ONS data23 below shows the rate of persons forming an opposite sex couple / same sex couple per 1,000 unmarried male/female population aged 16 and over in England and Wales in any given year. This is then used to calculate the corresponding ratio of same sex couple to opposite sex couple formation. Assuming current rates represent the long term trend and that the rate of civil partnership dissolution is not significantly different from divorce rates it would be reasonable to assume that in the long term, the ratio of same sex couple and opposite sex couple formation rates is broadly equivalent to the ratio of surviving same sex partners compared to a surviving opposite sex partners. This is assuming that after the introduction of marriages of same sex couples they effectively replace civil partnerships and the overall formation rate
22 www.ons.gov.uk/ons/rel/vsob1/mortality-statistics--deaths-registered-in-england-and-wales--series-dr-/2012/dr-tables-2012.xls 23 http://www.ons.gov.uk/ons/rel/vsob1/vital-statistics--population-and-health-reference-tables/winter-2013-update/annual-table.xls
31
remains broadly the same. This is in line with the Impact Assessment for the Marriage (Same Sex Couples) Act 2013 which stated that ‘Our best estimate assumes that there will be no additional increase in the demand for same sex relationships (i.e. same sex couple marriages and civil partnership registrations combined, compared to the number of civil partnership registrations per year under the current system)’.
Males Females
Age
Opposite sex couples formation rate
Same sex couples formation rate Ratio
Opposite sex couples formation rate
Same sex couples formation rate Ratio
2011 22.0 0.6 2.7% 19.8 0.5 2.5%
2010 22.0 0.5 2.3% 20.0 0.5 2.5%
2009 21.4 0.5 2.3% 19.3 0.5 2.6%
2008 22.0 0.7 3.2% 19.9 0.5 2.5%
Data is available for civil partnerships in 2012, but this doesn’t show significantly different numbers/conclusions compared with the 2011 data.
The formation rates vary by age. However, we do not expect this information to have a significant impact on the determination of an assumption of the ratio of opposite sex couples to same sex couples required for this cost assessment.
Conclusion
The analysis of this ONS data above would suggest that for pensioners dying in 2012 there will be 1-2 surviving same sex dependants for every 1000 surviving opposite sex dependants and in the long term around 25 surviving same sex dependants for every 1000 surviving opposite sex dependants.