Embed Size (px)
Citation preview
1
1
SUSCEPTIBILITY OF SOURCE WATER TO COMMUNITY AND NONCOMMUNITY SURFACE-WATER SUPPLIES AND RELATED WELLS IN NEW JERSEY TO DISINFECTION BYPRODUCT PRECURSORS Summary
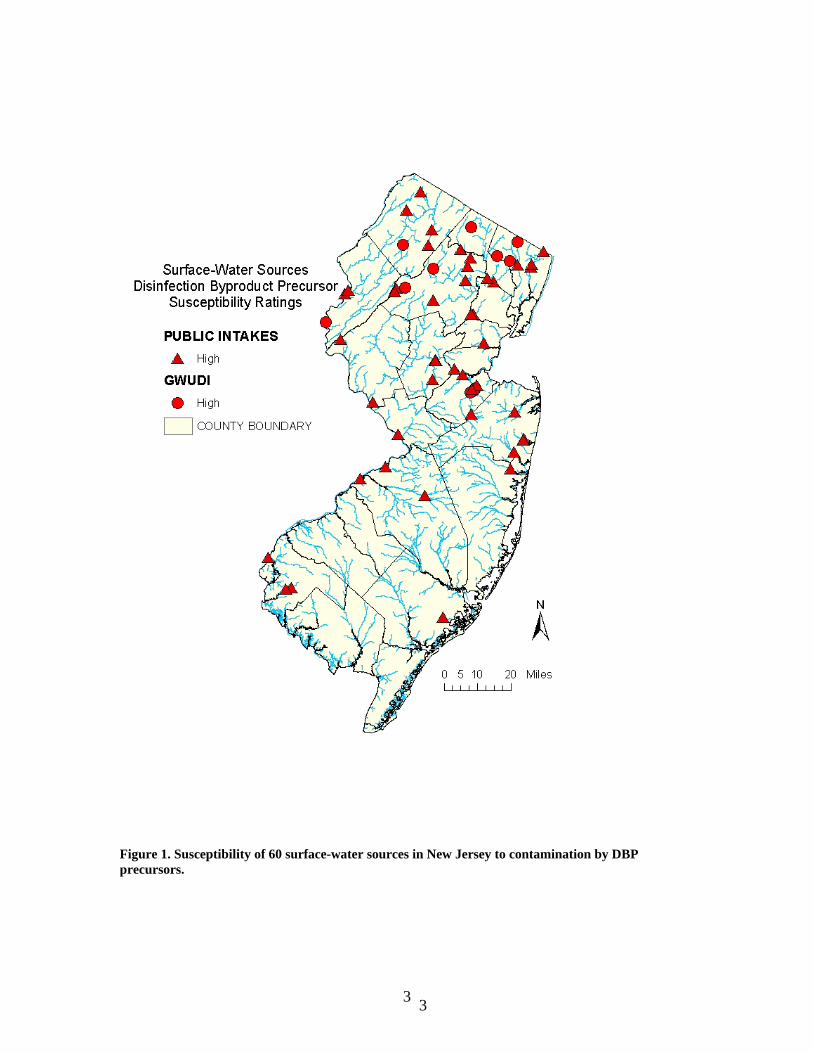
A susceptibility assessment model was developed to predict the susceptibility of source water to 49 surface-water-supply intakes and 11 ground-water sources under the direct influence (GWUDI) of surface water in New Jersey to disinfection byproduct (DBP) precursors. Trihalomethanes (THMs) are byproducts of chlorine disinfection and are one species of DBP. Susceptibility is defined by the variables that describe hydrogeologic sensitivity and potential contaminant-use intensity within the area contributing water to a surface-water source. The model was developed using water-quality data from surface-water samples collected and analyzed by the U.S. Geological Survey (USGS). Specific ultraviolet absorbance (SUVA) was used as an indicator for the presence of DBP precursor material. SUVA is a calculated value defined as ultraviolet absorbance divided by the concentration of dissolved organic carbon (DOC) in a water sample. SUVA was calculated for 140 USGS surface-water-quality sites and ranged from 0.019 to 0.131 L/mg-cm. The contaminant-use intensity variable selected for the model was distance to wetlands in 1995 and the hydrologic sensitivity variable selected for the model was average percent soil organic matter. Both variables are conceptual variables. Susceptibility to DBP precursors was high for all 11 GWUDI (figs. 1 and 2). Susceptibility to DBP precursors was high for all 49 surface-water-supply intakes. Rating scores determined by the susceptibility assessment model could be useful in further evaluating the relative effects of DBP precursors. Introduction
The 1996 Amendments to the Federal Safe Drinking Water Act require all states to establish a Source Water Assessment Program (SWAP). New Jersey Department of Environmental Protection (NJDEP) elected to evaluate the susceptibility of public water systems to contamination by inorganic constituents, nutrients, volatile organic and synthetic organic compounds, pesticides, disinfection byproduct precursors, pathogens, and radionuclides. Susceptibility to contamination in surface water is a function of many factors, including contaminant presence or use in or near the water source, natural occurrence in geologic material, changes in ambient conditions related to human activities, and location of the source within the flow system. The New Jersey SWAP includes four steps: (1) delineate the source water assessment area of each ground- and surface-water source used for public drinking water, (2) inventory the potential
1
2
2
contaminant sources within the source water assessment area, (3) determine the public water system’s susceptibility to contaminants, and (4) incorporate public participation and education (www.state.nj.us/dep/swap). Susceptibility assessment models were developed to rate each public surface-water source as low, medium, or high susceptibility for groups of constituents. This report (1) describes methods used to develop the susceptibility assessment model for DBP precursors, (2) presents results of application of the susceptibility model to estimate the susceptibility of source water to water-supply intakes and ground-water sources under the direct influence of surface water to these constituents, and (3) documents the distribution of these constituents in surface water in New Jersey. The models are intended to be screening tools to guide monitoring of public water supplies in New Jersey.
2
3
3
Figure 1. Susceptibility of 60 surface-water sources in New Jersey to contamination by DBP precursors.
3
4
4
11
49
0
10
20
30
40
50
60
HIGH HIGH
GWUDI INTAKE
SURFACE-WATER SUSCEPTIBILITY RATING FOR DBP PRECURSORS
NU
MB
ER O
F SO
UR
CE
WA
TER
ASS
ESSM
ENT
AR
EAS
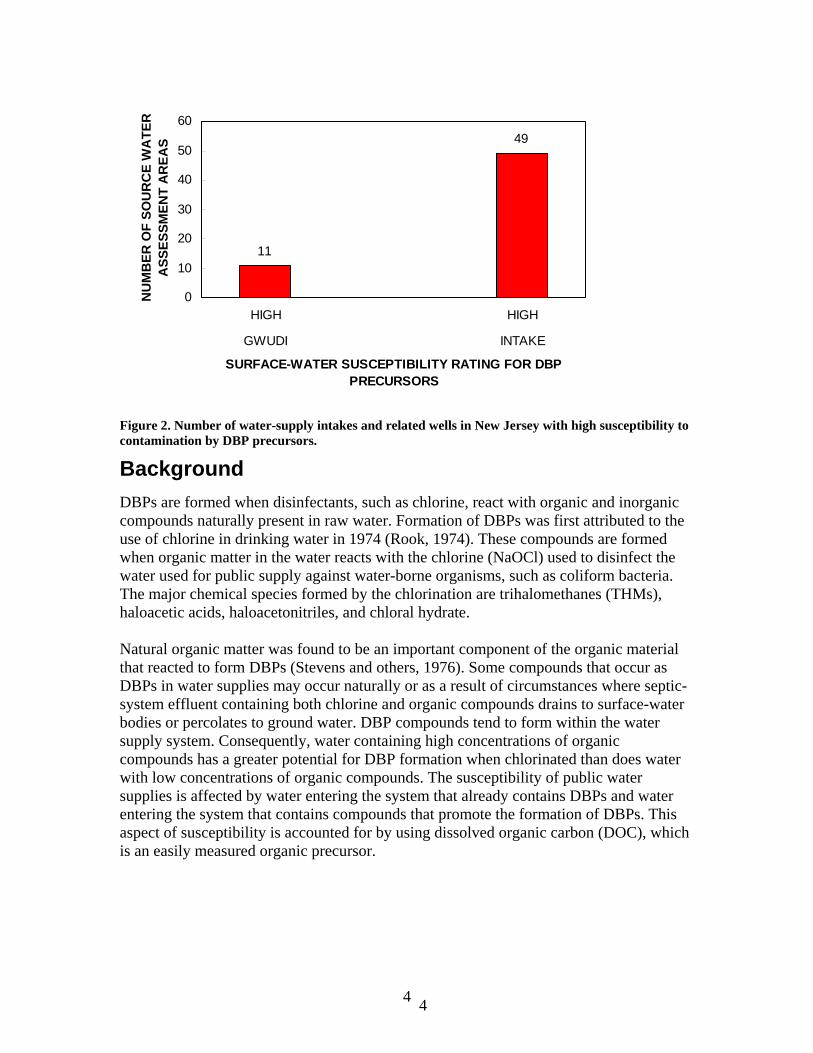
Figure 2. Number of water-supply intakes and related wells in New Jersey with high susceptibility to contamination by DBP precursors.
Background DBPs are formed when disinfectants, such as chlorine, react with organic and inorganic compounds naturally present in raw water. Formation of DBPs was first attributed to the use of chlorine in drinking water in 1974 (Rook, 1974). These compounds are formed when organic matter in the water reacts with the chlorine (NaOCl) used to disinfect the water used for public supply against water-borne organisms, such as coliform bacteria. The major chemical species formed by the chlorination are trihalomethanes (THMs), haloacetic acids, haloacetonitriles, and chloral hydrate. Natural organic matter was found to be an important component of the organic material that reacted to form DBPs (Stevens and others, 1976). Some compounds that occur as DBPs in water supplies may occur naturally or as a result of circumstances where septic-system effluent containing both chlorine and organic compounds drains to surface-water bodies or percolates to ground water. DBP compounds tend to form within the water supply system. Consequently, water containing high concentrations of organic compounds has a greater potential for DBP formation when chlorinated than does water with low concentrations of organic compounds. The susceptibility of public water supplies is affected by water entering the system that already contains DBPs and water entering the system that contains compounds that promote the formation of DBPs. This aspect of susceptibility is accounted for by using dissolved organic carbon (DOC), which is an easily measured organic precursor.
4
5
5
DBP precursors include DOC and bromide. The precursor DOC contains several different forms of carbon. When DOC is fractionated, its components hydrophobic acid (HPOA) and hydrophilic acid (HPIA) are isolated. HPOA is composed of humic and fulvic acids; these contain aromatic compounds that are thought to be the primary contributing factor to the formation of THMs (Amy and others, 1990; Reckhow and others, 1990; Owen and others, 1993). The HPIA fraction contains fewer aromatic compounds than does the HPOA fraction (Fujii and others, 1998). Organic substances absorb ultraviolet radiation, and thus ultraviolet absorbance measurements at 254 nanometers (UV-254) can show a relation to concentrations of organic compounds. UV-254 measurements tend to increase as the aromaticity of DOC increases, and thus UV-254 is an indicator of the potential for precursor DOC to form DBPs. Specific UV-254 (SUVA) is UV-254 normalized (divided by the DOC concentration) and is used to estimate the fraction of aromatic content of DOC (Rook, 1974, Reckhow and others, 1990)
New regulations adopted by the United States Environmental Protection Agency (USEPA), with respect to the Disinfection By-Products Rule (DBPR), increased the requirements for water purveyors to collect detailed information on both source waters and treated waters. The DBPR, which sets maximum contaminant levels (MCLs) for trihalomethanes (THMs), haloacetic acids (HAAs), bromate, and chlorite, and maximum residual disinfection concentrations for chlorine, chloramines, and chlorine dioxide, was established in 1994 (U.S. Environmental Protection Agency, 1998). For Stage 1 of the DBPR the USEPA lowered the MCL for THMs from 100 µg/L (micrograms per liter) to 80 µg/L and established the MCL for HAAs at 60 µg/L. Large surface-water systems were required to comply by January 2002, and small surface-water systems were required to comply by January 2004.
The DBPs investigated for this study were the THMs. Water- quality and treatment factors are known to increase the formation of THMs in drinking water. These factors include increased contact time, higher temperatures, higher pH values, greater quantities of precursors, higher free chlorine residuals, and higher concentrations of bromide (
www.se.gov.sk.ca/environment/protection/water/epb 211b trihalomethanes thms.pdf). The MCL for total trihalomethanes (TTHMs) is 80 µg/L. This is calculated as a running annual average of quarterly samples. The constituent TTHM is defined as the sum of concentrations of the individual THMs bromodichloromethane, bromoform, dibromochloromethane, and chloroform.
Definition of Susceptibility
The susceptibility of a public water supply to contamination by various constituents is defined by variables that describe the hydrogeologic sensitivity of the potential contaminant-use intensity in, the area that contributes water to that source. The
5
6
6
susceptibility assessment models were developed based on the equation whereby the susceptibility of the source water is equal to the sum of the values assigned to the variables that describe hydrogeologic sensitivity plus the sum of the values assigned to the variables that describe potential contaminant-use intensity within the area contributing water to a surface-water source.
Susceptibility = Hydrogeologic Sensitivity + Potential Contaminant-Use Intensity
The 1999 NJDEP SWAP Plan postulated that all surface-water sources would be considered highly sensitive, but that premise has been redefined for some constituents through modeling. In some cases, documented research from previous studies and statistical methods of this study show that a sensitivity variable has a significant relation to contaminant concentrations.
The susceptibility models are intended to be a screening tool and are based on water-quality data in the USGS National Water Information System (NWIS) database. The objective is to rate community and noncommunity water supplies as low, medium, or high susceptibility to contamination for groups of constituents using as guidance the thresholds developed by NJDEP for use in the models. In general, the low-susceptibility category includes surface water sources for which constituent values are not likely to equal or exceed one-tenth of the New Jersey’s drinking water maximum contaminant level (MCL). The medium-susceptibility category includes surface-water sources for which constituent values are not likely to equal or exceed one-half of the MCL, and the high-susceptibility category includes surface-water sources for which constituent values equal or exceed one-half of the MCL. The susceptibility assessment ratings for the DBP group are based on a constituent susceptibility assessment model that uses SUVA values in relation to distance to wetlands in 1995 and average percent soil organic matter to determine the rating categories.
Susceptibility Model Development
The development of the susceptibility assessment model involved several steps (Hopple and others, U.S. Geological Survey, written commun., 2003): (1) development of source water assessment areas to community and noncommunity water supplies; (2) building of geographic information system (GIS) and water-quality data sets; (3) exploratory data analysis using univariate and multivariate statistical techniques, and graphical procedures; (4) development of a coding scheme for each variable used in the models; (5) assessment of relations of the constituents to model variables; and (6) use of NJDEP Bureau of Safe Drinking Water TTHM data to support the model. Multiple lines of evidence were used to select the final variables used in the model. Some of the components of the analysis were subjective, especially the coding scheme of the model ratings. The susceptibility rating represents a combination of both sensitivity and
6
7
7
intensity and, in some cases, may be inconsistent with the results of water-quality analyses.
Development of Source Water Assessment Areas
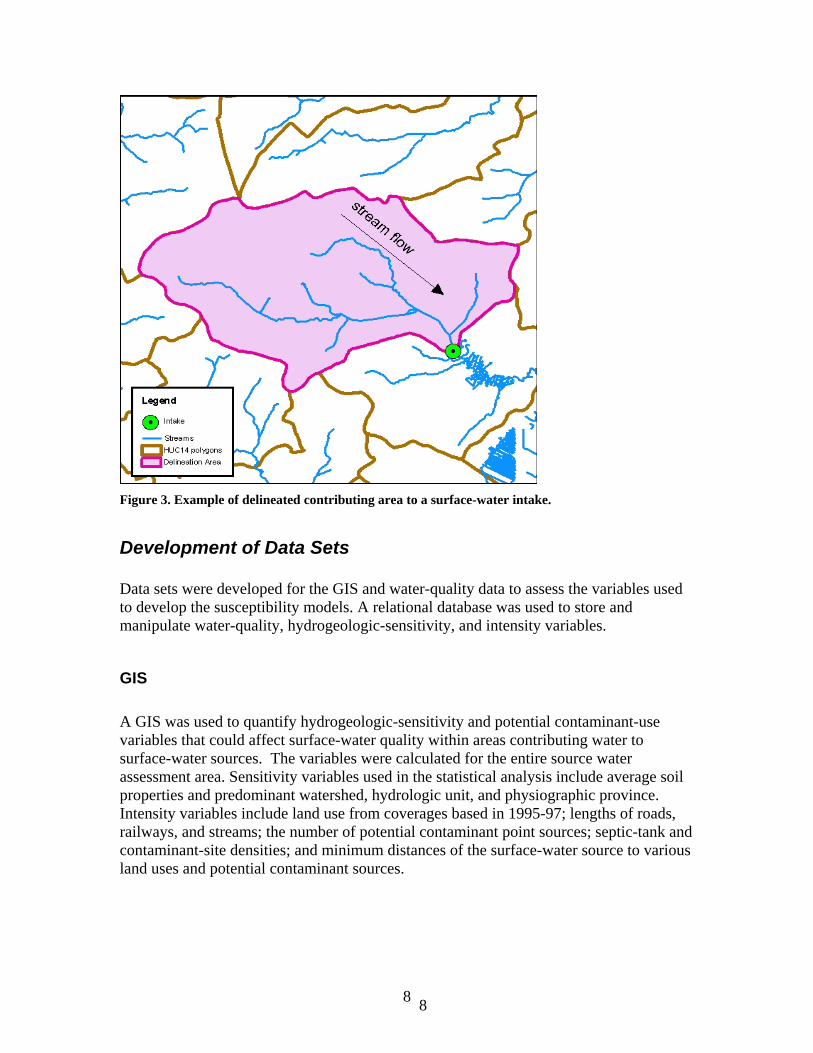
NJDEP estimated 60 areas contributing water to surface-water sources used for drinking water in New Jersey (fig. 3); 49 are associated with surface-water intakes and 11 are associated with sources using ground water under the direct influence of surface water. For most surface-water sources, the source water assessment area includes the entire drainage area that contributes to the water that flows past the intake or source. These source water assessment areas include the headwaters and tributaries and are based on the USGS 14-digit hydrologic unit code (HUC 14) (Ellis and Price, 1995) (http://www.state.nj.us/dep/swap). For intakes or sources with extremely large contributing areas, the source water assessment area is based on the time of travel to the intake or source.
NJDEP has classified approximately 55 wells as sources using ground water under the direct influence of surface water (GWUDI). Water from wells that are classified as GWUDI wells must meet specific water-quality criteria and is treated in a manner similar to water from surface-water intakes. To determine the susceptibility rating for these wells, NJDEP performed an integrated delineation combining the ground-water assessment area with the surface-water assessment area. The ground-water assessment area was delineated using the Combined Model/Calculated Fixed Radius Method (www.state.nj.us/dep/dsr/whpadel.pdf). The surface-water assessment area was delineated as the entire drainage area that contributes water to the well, with the 2-year time-of-travel demarcation of the ground-water assessment area determining the downstream boundary. A few GWUDI wells do not have an associated surface-water assessment area because no surface-water body is present within the 2-year ground-water time-of-travel area. In these instances, only the ground-water assessment area was used. Both the ground- and surface-water models were applied to these areas, and the higher of the two ratings was selected as the susceptibility rating for that well. The USGS estimated areas contributing water to 388 surface-water-quality sites in New Jersey for model development and verification. Drainage areas contributing water to a surface-water-quality site were delineated using a GIS macro language program that determines basin area from a digital elevation model (DEM) based on a 1:24,000 scale and 30-meter resolution to contour intervals (L.J. Kauffman, U.S. Geological Survey, written commun., 2002).
7
8
8
Figure 3. Example of delineated contributing area to a surface-water intake.
Development of Data Sets
Data sets were developed for the GIS and water-quality data to assess the variables used to develop the susceptibility models. A relational database was used to store and manipulate water-quality, hydrogeologic-sensitivity, and intensity variables.
GIS
A GIS was used to quantify hydrogeologic-sensitivity and potential contaminant-use variables that could affect surface-water quality within areas contributing water to surface-water sources. The variables were calculated for the entire source water assessment area. Sensitivity variables used in the statistical analysis include average soil properties and predominant watershed, hydrologic unit, and physiographic province. Intensity variables include land use from coverages based in 1995-97; lengths of roads, railways, and streams; the number of potential contaminant point sources; septic-tank and contaminant-site densities; and minimum distances of the surface-water source to various land uses and potential contaminant sources.
8
9
9
Water-Quality Data
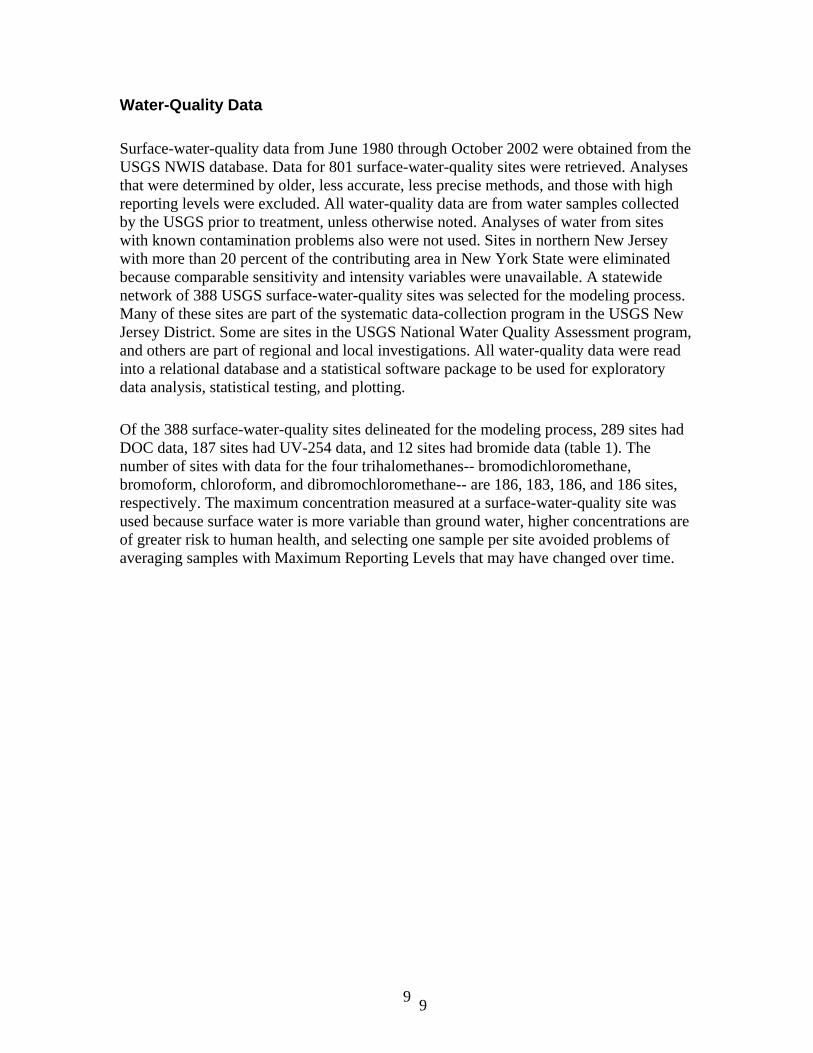
Surface-water-quality data from June 1980 through October 2002 were obtained from the USGS NWIS database. Data for 801 surface-water-quality sites were retrieved. Analyses that were determined by older, less accurate, less precise methods, and those with high reporting levels were excluded. All water-quality data are from water samples collected by the USGS prior to treatment, unless otherwise noted. Analyses of water from sites with known contamination problems also were not used. Sites in northern New Jersey with more than 20 percent of the contributing area in New York State were eliminated because comparable sensitivity and intensity variables were unavailable. A statewide network of 388 USGS surface-water-quality sites was selected for the modeling process. Many of these sites are part of the systematic data-collection program in the USGS New Jersey District. Some are sites in the USGS National Water Quality Assessment program, and others are part of regional and local investigations. All water-quality data were read into a relational database and a statistical software package to be used for exploratory data analysis, statistical testing, and plotting.
Of the 388 surface-water-quality sites delineated for the modeling process, 289 sites had DOC data, 187 sites had UV-254 data, and 12 sites had bromide data (table 1). The number of sites with data for the four trihalomethanes-- bromodichloromethane, bromoform, chloroform, and dibromochloromethane-- are 186, 183, 186, and 186 sites, respectively. The maximum concentration measured at a surface-water-quality site was used because surface water is more variable than ground water, higher concentrations are of greater risk to human health, and selecting one sample per site avoided problems of averaging samples with Maximum Reporting Levels that may have changed over time.
9
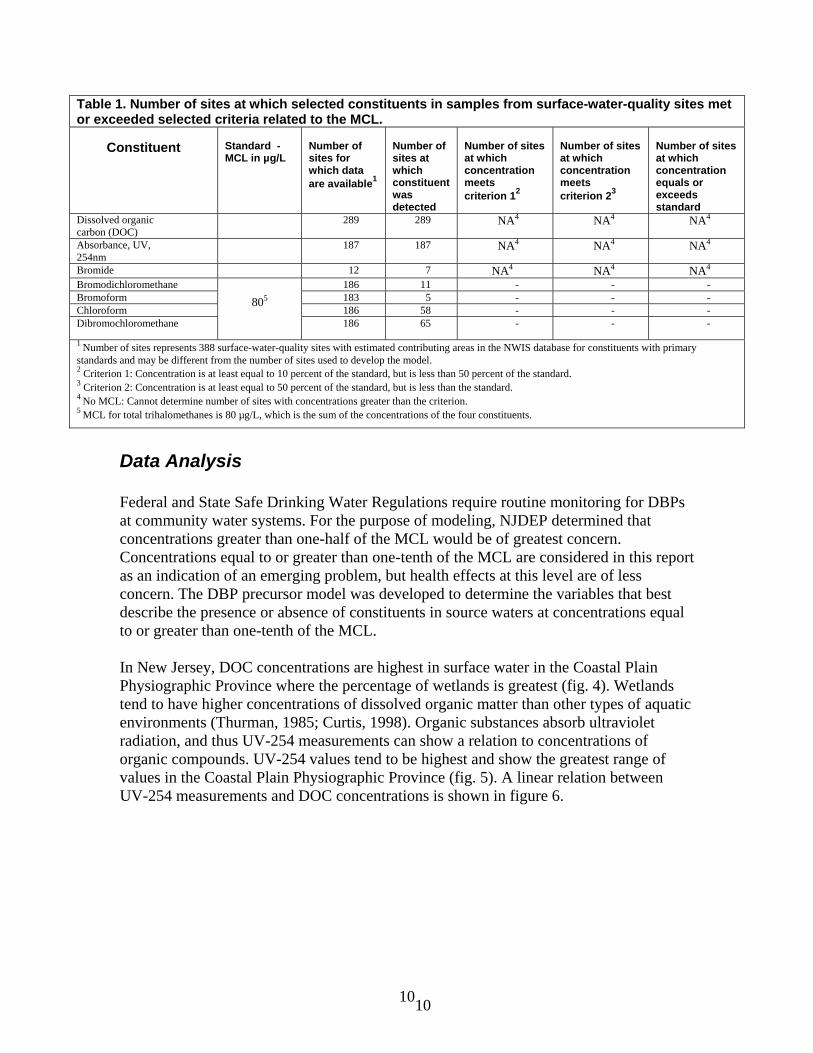
10 Table 1. Number of sites at which selected constituents in samples from surface-water-quality sites met
or exceeded selected criteria related to the MCL.
10
Constituent
Standard - MCL in µg/L
Number of sites for which data are available1
Number of sites at which constituent was detected
Number of sites at which concentration meets criterion 12
Number of sites at which concentration meets criterion 23
Number of sites at which concentration equals or exceeds standard
Dissolved organic carbon (DOC)
289 289 NA4 NA4 NA4
Absorbance, UV, 254nm
187 187 NA4 NA4 NA4
Bromide 12 7 NA4 NA4 NA4
Bromodichloromethane 186 11 - - - Bromoform 183 5 - - - Chloroform 186 58 - - - Dibromochloromethane
805
186 65 - - -
1 Number of sites represents 388 surface-water-quality sites with estimated contributing areas in the NWIS database for constituents with primary standards and may be different from the number of sites used to develop the model. 2 Criterion 1: Concentration is at least equal to 10 percent of the standard, but is less than 50 percent of the standard. 3 Criterion 2: Concentration is at least equal to 50 percent of the standard, but is less than the standard. 4 No MCL: Cannot determine number of sites with concentrations greater than the criterion. 5 MCL for total trihalomethanes is 80 µg/L, which is the sum of the concentrations of the four constituents.
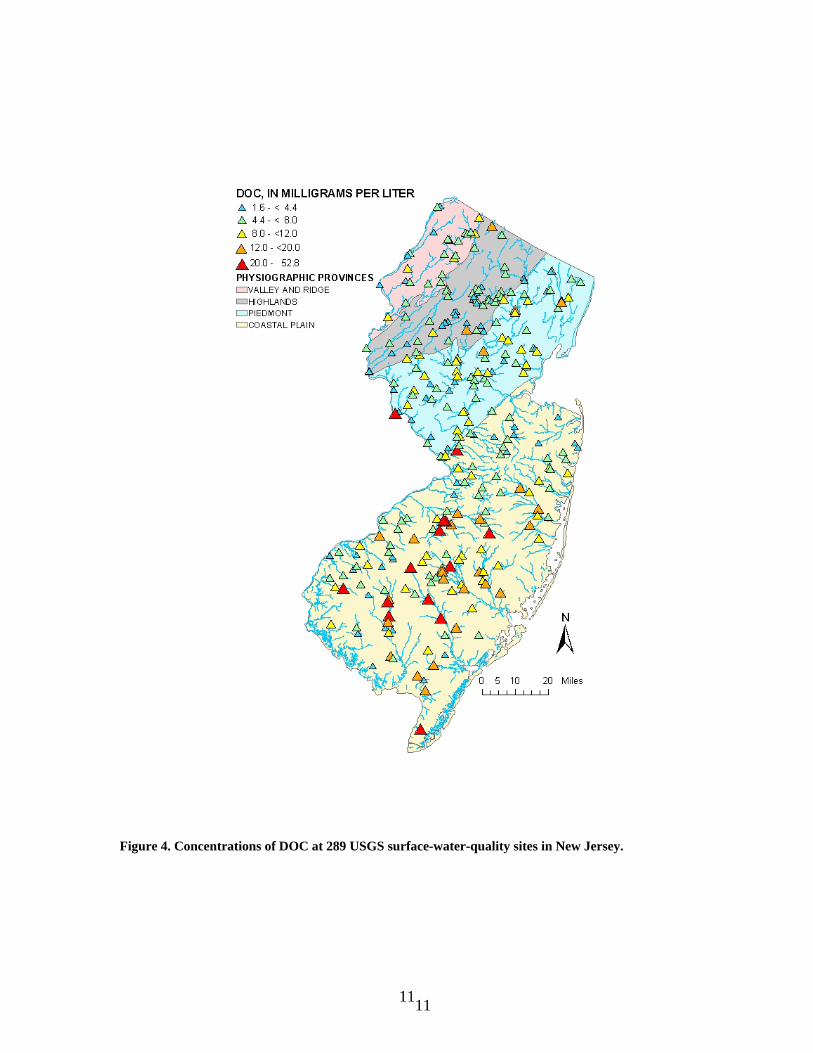
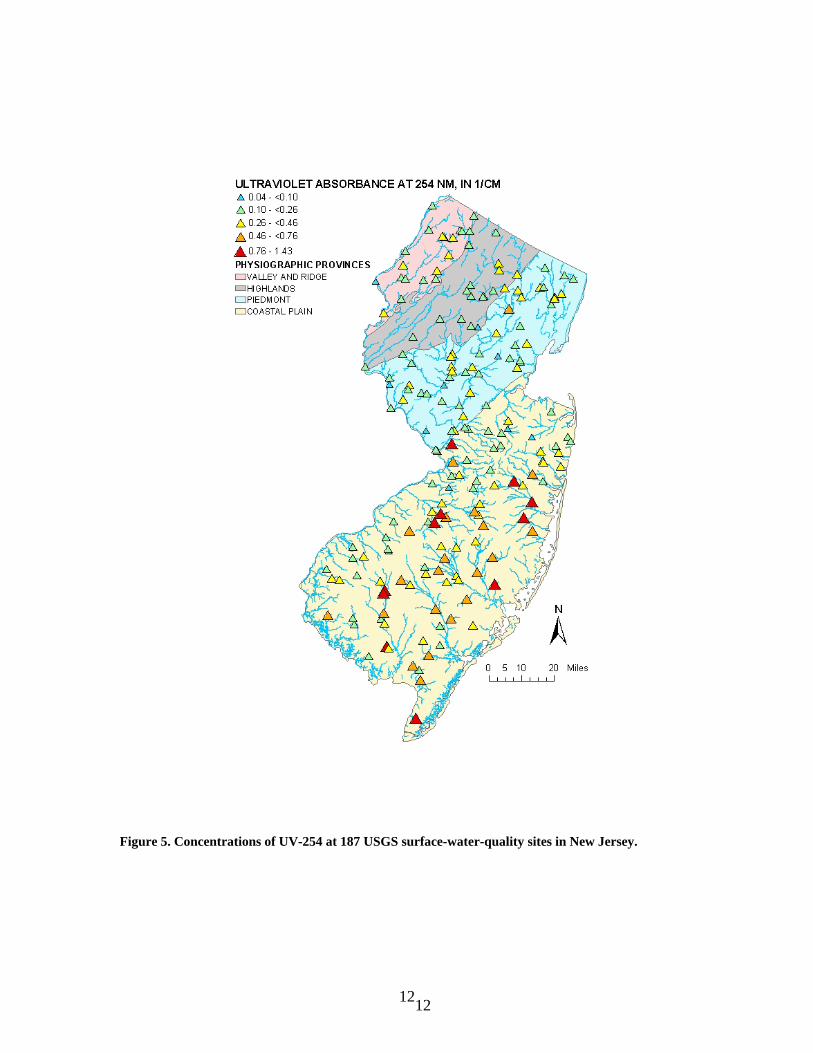
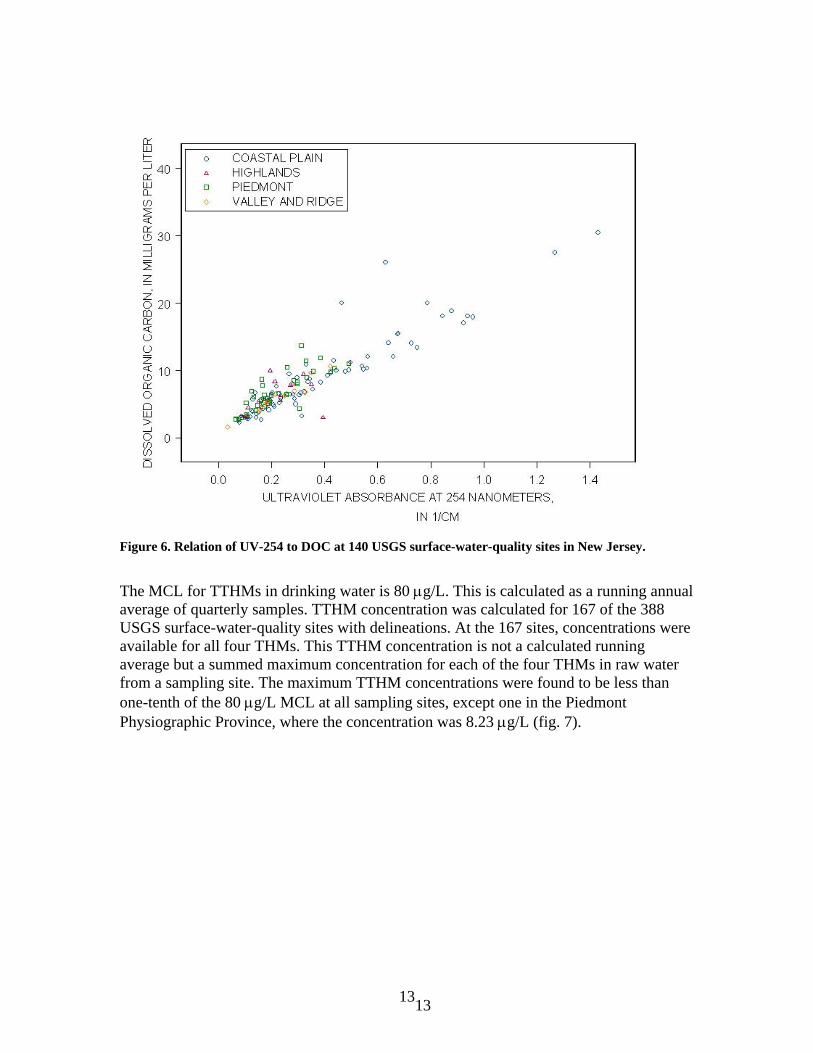
Data Analysis Federal and State Safe Drinking Water Regulations require routine monitoring for DBPs at community water systems. For the purpose of modeling, NJDEP determined that concentrations greater than one-half of the MCL would be of greatest concern. Concentrations equal to or greater than one-tenth of the MCL are considered in this report as an indication of an emerging problem, but health effects at this level are of less concern. The DBP precursor model was developed to determine the variables that best describe the presence or absence of constituents in source waters at concentrations equal to or greater than one-tenth of the MCL. In New Jersey, DOC concentrations are highest in surface water in the Coastal Plain Physiographic Province where the percentage of wetlands is greatest (fig. 4). Wetlands tend to have higher concentrations of dissolved organic matter than other types of aquatic environments (Thurman, 1985; Curtis, 1998). Organic substances absorb ultraviolet radiation, and thus UV-254 measurements can show a relation to concentrations of organic compounds. UV-254 values tend to be highest and show the greatest range of values in the Coastal Plain Physiographic Province (fig. 5). A linear relation between UV-254 measurements and DOC concentrations is shown in figure 6.
10
11
11
Figure 4. Concentrations of DOC at 289 USGS surface-water-quality sites in New Jersey.
11
12
12
Figure 5. Concentrations of UV-254 at 187 USGS surface-water-quality sites in New Jersey.
12
13
13
Figure 6. Relation of UV-254 to DOC at 140 USGS surface-water-quality sites in New Jersey.
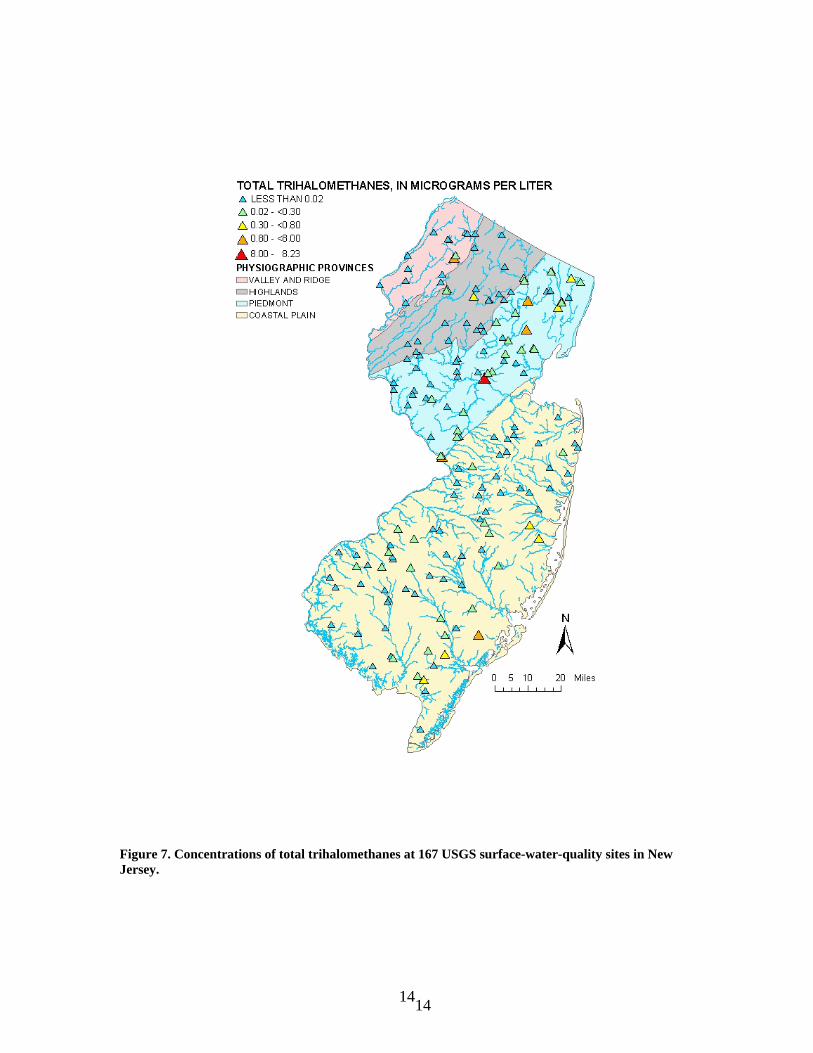
The MCL for TTHMs in drinking water is 80 µg/L. This is calculated as a running annual average of quarterly samples. TTHM concentration was calculated for 167 of the 388 USGS surface-water-quality sites with delineations. At the 167 sites, concentrations were available for all four THMs. This TTHM concentration is not a calculated running average but a summed maximum concentration for each of the four THMs in raw water from a sampling site. The maximum TTHM concentrations were found to be less than one-tenth of the 80 µg/L MCL at all sampling sites, except one in the Piedmont Physiographic Province, where the concentration was 8.23 µg/L (fig. 7).
13
14
14
Figure 7. Concentrations of total trihalomethanes at 167 USGS surface-water-quality sites in New Jersey.
14
15
15
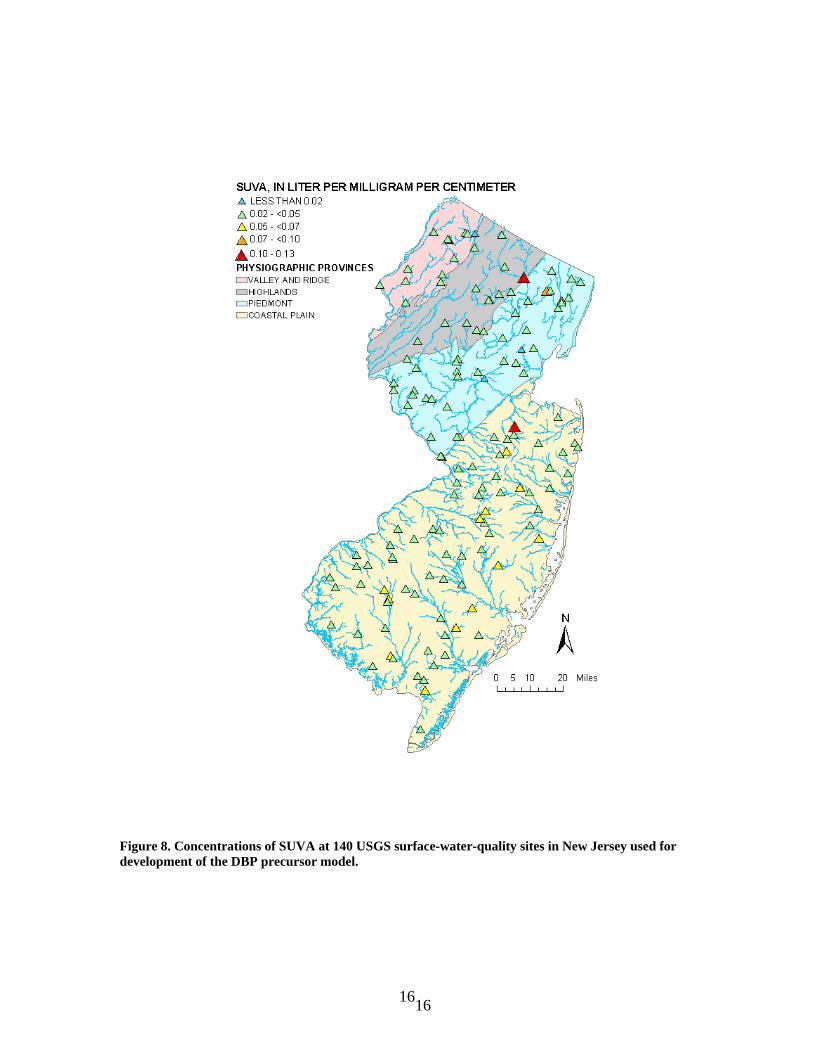
In this study SUVA was calculated by dividing maximum UV-254 values by maximum DOC concentrations at each surface-water monitoring site, not from a single water-quality sample at the site. The resulting units of SUVA are in liters per milligram per centimeter (L/mg-cm). USEPA has set an alternative compliance criteria for SUVA in source water prior to treatment and in treated water of less than or equal to 0.02 L/mg-cm (U.S. Environmental Protection Agency, 1998). UV absorbance and DOC monitoring are used to determine whether a system can meet the alternative compliance criteria for either source-water SUVA or treated water SUVA. SUVA was calculated for 140 of the 388 USGS surface-water-quality sites with delineations. The range in SUVA was 0.019 to 0.131 L/mg-cm. This range in SUVA for all of New Jersey indicates a large variability in the composition of the DOC; it also indicates that the DOC originates from different types of sources. Generally, surface water of the Coastal Plain contains higher values of SUVA than surface water in other physiographic provinces (fig. 8)
15
16
16
Figure 8. Concentrations of SUVA at 140 USGS surface-water-quality sites in New Jersey used for development of the DBP precursor model.
16
17
17
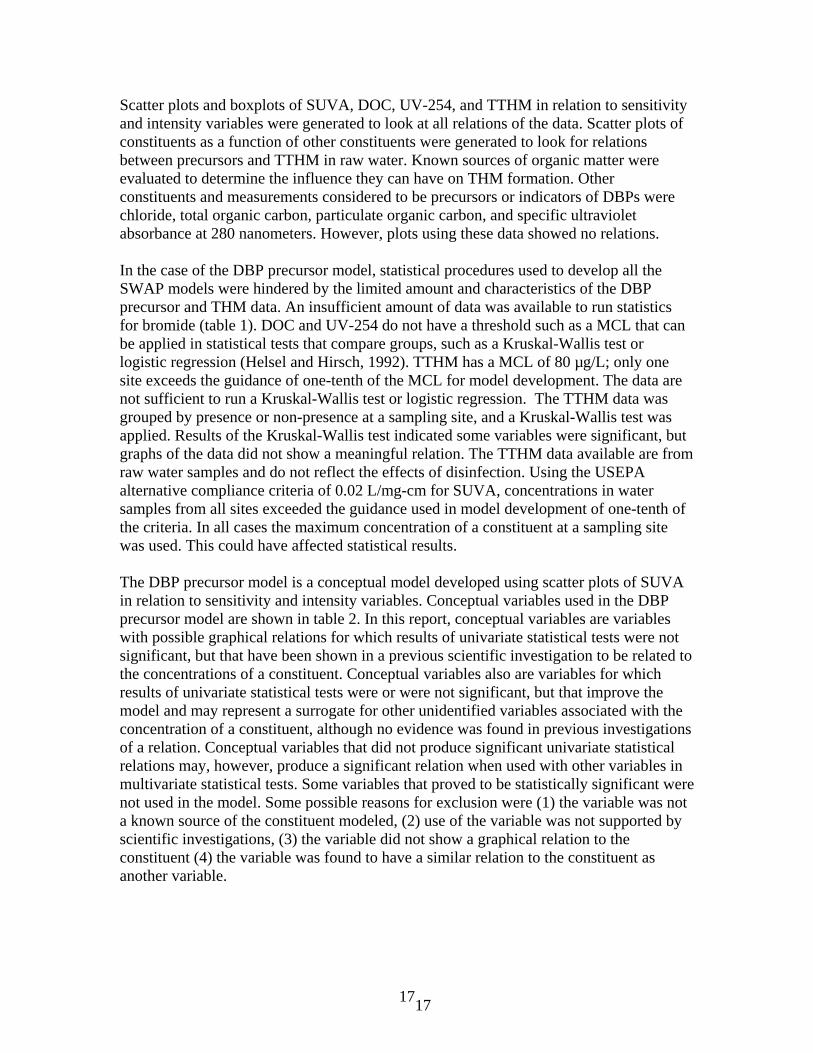
Scatter plots and boxplots of SUVA, DOC, UV-254, and TTHM in relation to sensitivity and intensity variables were generated to look at all relations of the data. Scatter plots of constituents as a function of other constituents were generated to look for relations between precursors and TTHM in raw water. Known sources of organic matter were evaluated to determine the influence they can have on THM formation. Other constituents and measurements considered to be precursors or indicators of DBPs were chloride, total organic carbon, particulate organic carbon, and specific ultraviolet absorbance at 280 nanometers. However, plots using these data showed no relations.
In the case of the DBP precursor model, statistical procedures used to develop all the SWAP models were hindered by the limited amount and characteristics of the DBP precursor and THM data. An insufficient amount of data was available to run statistics for bromide (table 1). DOC and UV-254 do not have a threshold such as a MCL that can be applied in statistical tests that compare groups, such as a Kruskal-Wallis test or logistic regression (Helsel and Hirsch, 1992). TTHM has a MCL of 80 µg/L; only one site exceeds the guidance of one-tenth of the MCL for model development. The data are not sufficient to run a Kruskal-Wallis test or logistic regression. The TTHM data was grouped by presence or non-presence at a sampling site, and a Kruskal-Wallis test was applied. Results of the Kruskal-Wallis test indicated some variables were significant, but graphs of the data did not show a meaningful relation. The TTHM data available are from raw water samples and do not reflect the effects of disinfection. Using the USEPA alternative compliance criteria of 0.02 L/mg-cm for SUVA, concentrations in water samples from all sites exceeded the guidance used in model development of one-tenth of the criteria. In all cases the maximum concentration of a constituent at a sampling site was used. This could have affected statistical results.
The DBP precursor model is a conceptual model developed using scatter plots of SUVA in relation to sensitivity and intensity variables. Conceptual variables used in the DBP precursor model are shown in table 2. In this report, conceptual variables are variables with possible graphical relations for which results of univariate statistical tests were not significant, but that have been shown in a previous scientific investigation to be related to the concentrations of a constituent. Conceptual variables also are variables for which results of univariate statistical tests were or were not significant, but that improve the model and may represent a surrogate for other unidentified variables associated with the concentration of a constituent, although no evidence was found in previous investigations of a relation. Conceptual variables that did not produce significant univariate statistical relations may, however, produce a significant relation when used with other variables in multivariate statistical tests. Some variables that proved to be statistically significant were not used in the model. Some possible reasons for exclusion were (1) the variable was not a known source of the constituent modeled, (2) use of the variable was not supported by scientific investigations, (3) the variable did not show a graphical relation to the constituent (4) the variable was found to have a similar relation to the constituent as another variable.
17
18
18
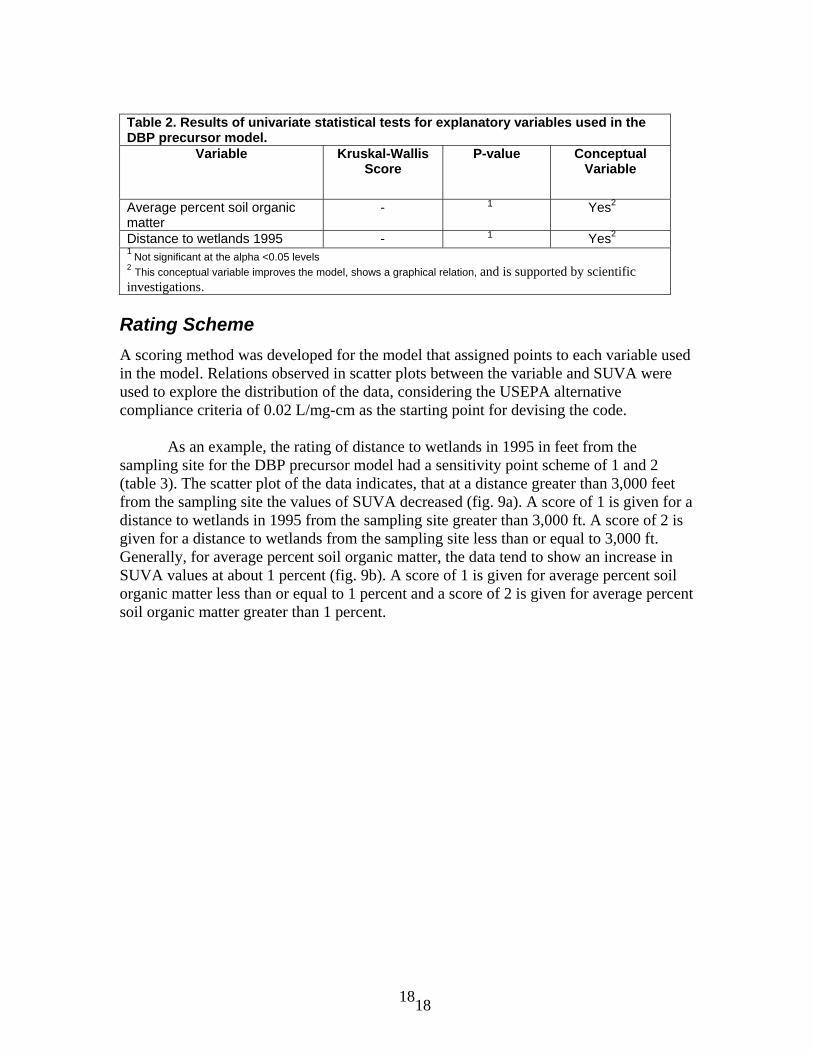
Table 2. Results of univariate statistical tests for explanatory variables used in the DBP precursor model.
Variable Kruskal-Wallis Score
P-value Conceptual Variable
Average percent soil organic matter
- 1 Yes2
Distance to wetlands 1995 - 1 Yes2
1 Not significant at the alpha <0.05 levels 2 This conceptual variable improves the model, shows a graphical relation, and is supported by scientific investigations.
Rating Scheme
A scoring method was developed for the model that assigned points to each variable used in the model. Relations observed in scatter plots between the variable and SUVA were used to explore the distribution of the data, considering the USEPA alternative compliance criteria of 0.02 L/mg-cm as the starting point for devising the code. As an example, the rating of distance to wetlands in 1995 in feet from the sampling site for the DBP precursor model had a sensitivity point scheme of 1 and 2 (table 3). The scatter plot of the data indicates, that at a distance greater than 3,000 feet from the sampling site the values of SUVA decreased (fig. 9a). A score of 1 is given for a distance to wetlands in 1995 from the sampling site greater than 3,000 ft. A score of 2 is given for a distance to wetlands from the sampling site less than or equal to 3,000 ft. Generally, for average percent soil organic matter, the data tend to show an increase in SUVA values at about 1 percent (fig. 9b). A score of 1 is given for average percent soil organic matter less than or equal to 1 percent and a score of 2 is given for average percent soil organic matter greater than 1 percent.
18
19
19
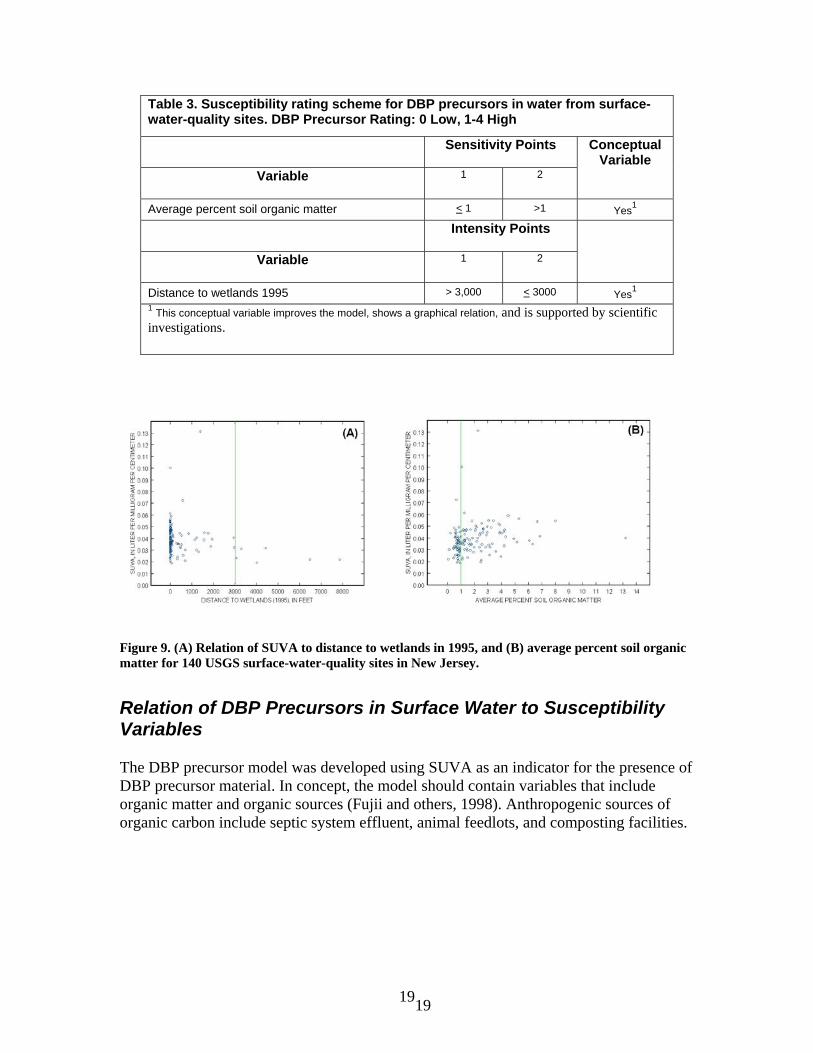
Table 3. Susceptibility rating scheme for DBP precursors in water from surface-water-quality sites. DBP Precursor Rating: 0 Low, 1-4 High
Sensitivity Points
Variable 1 2
Conceptual Variable
Average percent soil organic matter < 1 >1 Yes1
Intensity Points
Variable 1 2
Distance to wetlands 1995 > 3,000 < 3000 Yes1
1 This conceptual variable improves the model, shows a graphical relation, and is supported by scientific investigations.
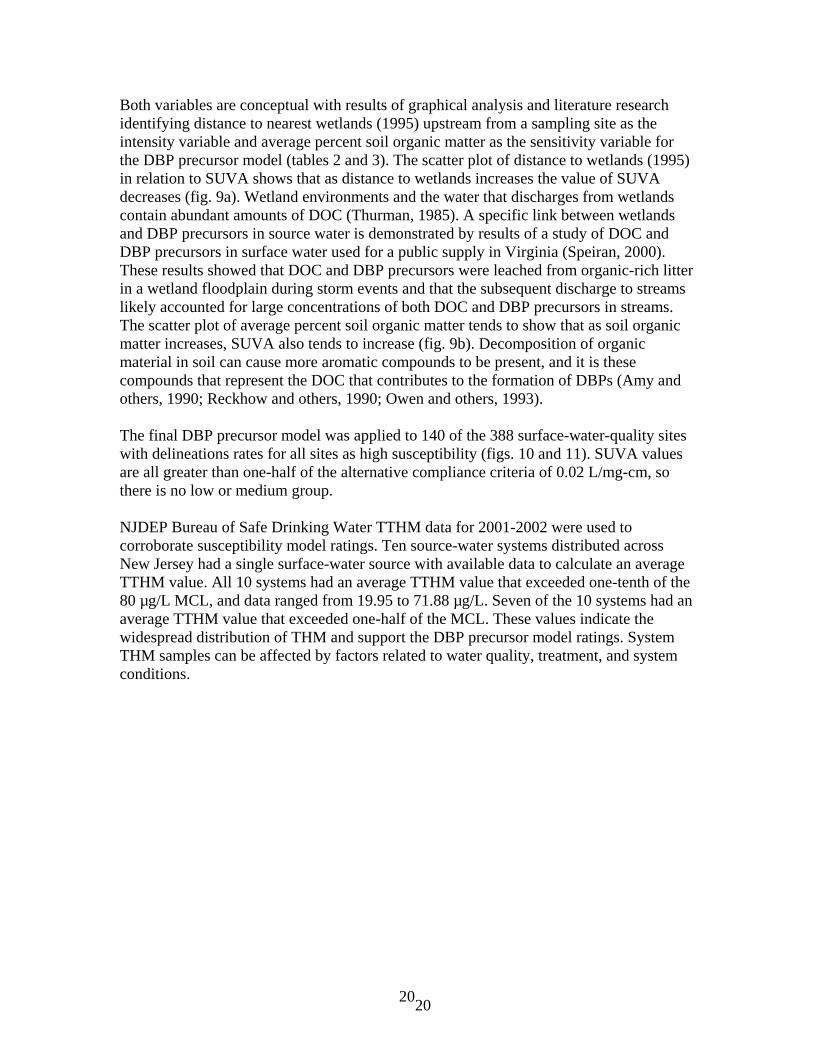
Figure 9. (A) Relation of SUVA to distance to wetlands in 1995, and (B) average percent soil organic matter for 140 USGS surface-water-quality sites in New Jersey.
Relation of DBP Precursors in Surface Water to Susceptibility Variables The DBP precursor model was developed using SUVA as an indicator for the presence of DBP precursor material. In concept, the model should contain variables that include organic matter and organic sources (Fujii and others, 1998). Anthropogenic sources of organic carbon include septic system effluent, animal feedlots, and composting facilities.
19
20
20
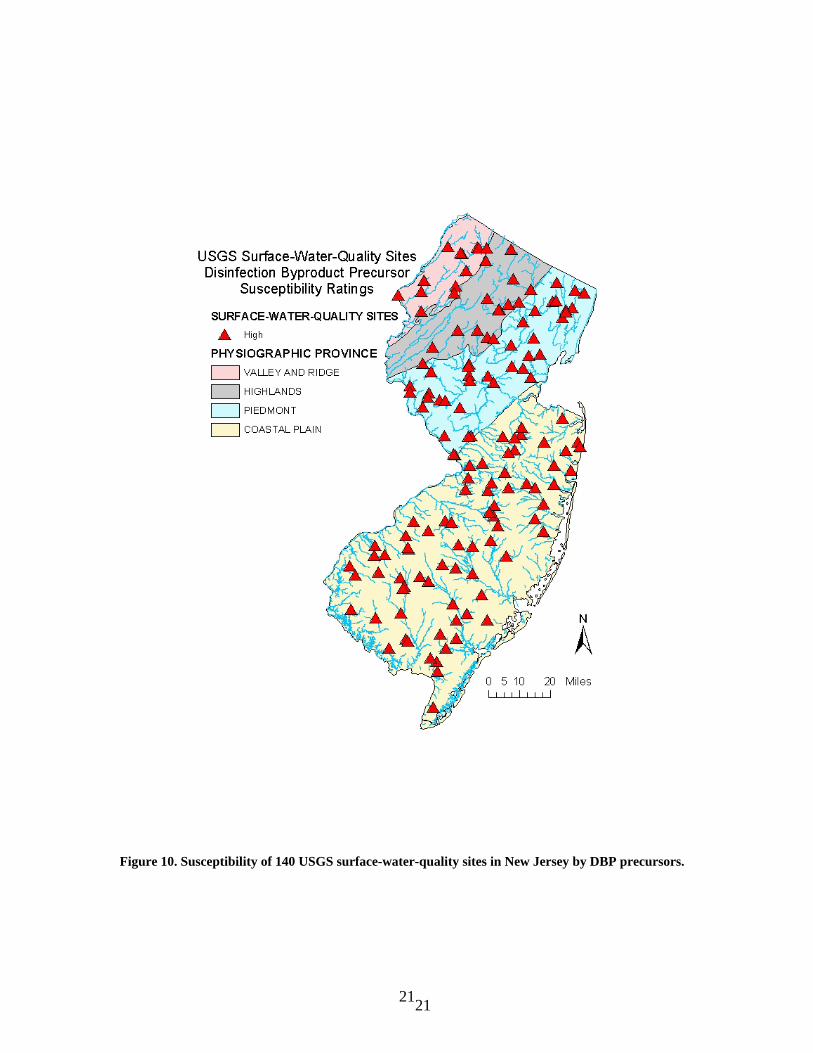
Both variables are conceptual with results of graphical analysis and literature research identifying distance to nearest wetlands (1995) upstream from a sampling site as the intensity variable and average percent soil organic matter as the sensitivity variable for the DBP precursor model (tables 2 and 3). The scatter plot of distance to wetlands (1995) in relation to SUVA shows that as distance to wetlands increases the value of SUVA decreases (fig. 9a). Wetland environments and the water that discharges from wetlands contain abundant amounts of DOC (Thurman, 1985). A specific link between wetlands and DBP precursors in source water is demonstrated by results of a study of DOC and DBP precursors in surface water used for a public supply in Virginia (Speiran, 2000). These results showed that DOC and DBP precursors were leached from organic-rich litter in a wetland floodplain during storm events and that the subsequent discharge to streams likely accounted for large concentrations of both DOC and DBP precursors in streams. The scatter plot of average percent soil organic matter tends to show that as soil organic matter increases, SUVA also tends to increase (fig. 9b). Decomposition of organic material in soil can cause more aromatic compounds to be present, and it is these compounds that represent the DOC that contributes to the formation of DBPs (Amy and others, 1990; Reckhow and others, 1990; Owen and others, 1993). The final DBP precursor model was applied to 140 of the 388 surface-water-quality sites with delineations rates for all sites as high susceptibility (figs. 10 and 11). SUVA values are all greater than one-half of the alternative compliance criteria of 0.02 L/mg-cm, so there is no low or medium group.
NJDEP Bureau of Safe Drinking Water TTHM data for 2001-2002 were used to corroborate susceptibility model ratings. Ten source-water systems distributed across New Jersey had a single surface-water source with available data to calculate an average TTHM value. All 10 systems had an average TTHM value that exceeded one-tenth of the 80 µg/L MCL, and data ranged from 19.95 to 71.88 µg/L. Seven of the 10 systems had an average TTHM value that exceeded one-half of the MCL. These values indicate the widespread distribution of THM and support the DBP precursor model ratings. System THM samples can be affected by factors related to water quality, treatment, and system conditions.
20
21
21
Figure 10. Susceptibility of 140 USGS surface-water-quality sites in New Jersey by DBP precursors.
21
22
22
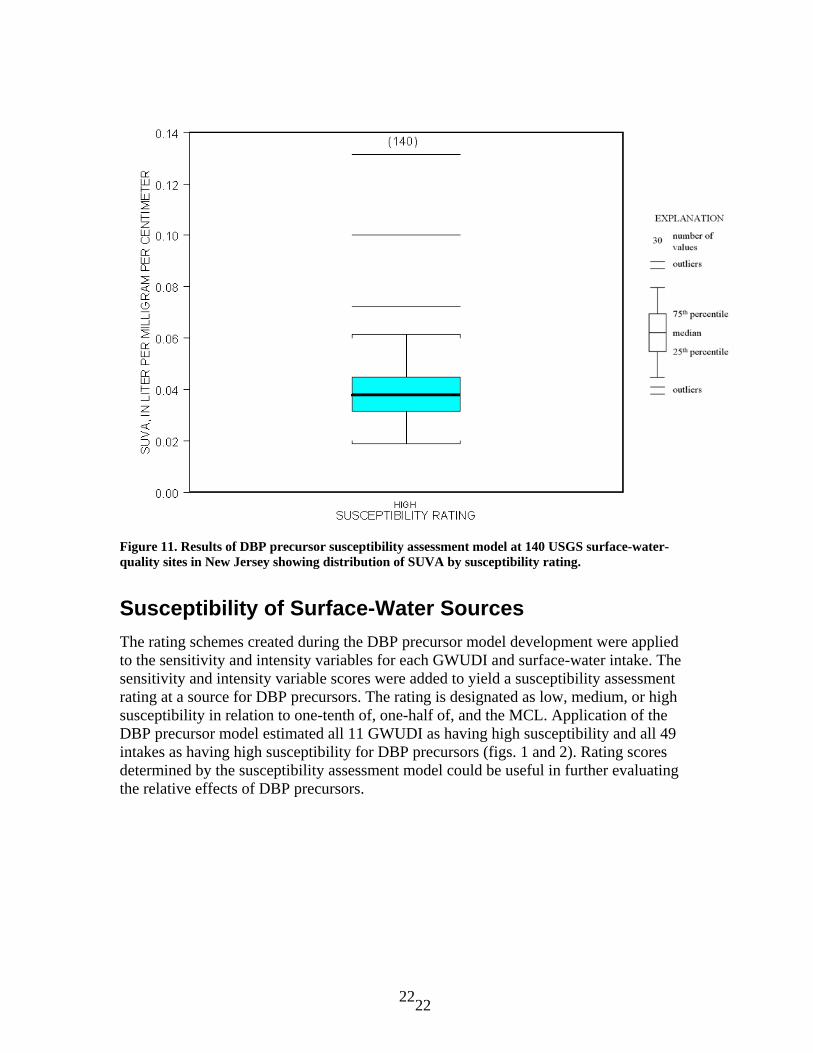
Figure 11. Results of DBP precursor susceptibility assessment model at 140 USGS surface-water-quality sites in New Jersey showing distribution of SUVA by susceptibility rating.
Susceptibility of Surface-Water Sources The rating schemes created during the DBP precursor model development were applied to the sensitivity and intensity variables for each GWUDI and surface-water intake. The sensitivity and intensity variable scores were added to yield a susceptibility assessment rating at a source for DBP precursors. The rating is designated as low, medium, or high susceptibility in relation to one-tenth of, one-half of, and the MCL. Application of the DBP precursor model estimated all 11 GWUDI as having high susceptibility and all 49 intakes as having high susceptibility for DBP precursors (figs. 1 and 2). Rating scores determined by the susceptibility assessment model could be useful in further evaluating the relative effects of DBP precursors.
22
23
23
Discussion
There are several limitations to the susceptibility assessment models. These models should be used only as screening tools to assess the potential susceptibility of a surface-water source to contamination from regulated constituents. The maximum concentrations in samples from a surface-water site were used in the analysis to develop models and do not take into account fluctuations in concentrations that may occur. Some of the components of the analysis were subjective, especially the coding scheme used for the susceptibility assessment model. Problems may exist in the interpretation of data at a local scale and projecting to statewide scales. Using different scales for various GIS layers could bias statistical results and land-use changes could cause spurious relations. The method used to determine source water assessment areas for intakes with large contributing areas that represent times of travel of water to the intake is inexact, and produces only estimates of the areas that may affect the water quality at the intake.
DBPs are affected by seasonal and temporal changes. To obtain a true indication of DBP formation in a system, SUVA should be compared to TTHMs in water samples after chlorination. USEPA requires water suppliers to analyze samples for DOC and UV-254 at the same time and for the same location to determine SUVA. SUVA values determined for the model based on maximum DOC concentration and UV-254 measurements in samples collected from the same location, but not necessarily at the same time.
Significant susceptibility factors can change with time and additional water-quality data can be used in the future to update the models.
The susceptibility rating represents a combination of both sensitivity and intensity and, in some cases, may be inconsistent with the results of water-quality analyses. For example, a source may be highly susceptible to contamination and have no detections in the samples if the constituent does not originate from human activities or natural sources within the assessment area. The database, GIS coverages, statistical analysis, and susceptibility assessment models can provide guidance to scientists and managers when they determine effects of hydrogeology and land use on the quality of public water supplies. The relations between water quality and susceptibility variables shown in figures, graphs, and tables can be useful in determining monitoring requirements for water purveyors to ensure public health.
Amy, G.L., Thompson, J.M., Tan, L., Davis, M.K., and Drasner, S.W., 1990, Evaluation of THM precursor contributions from agricultural drains: Research and Technology, v. 82, no. 1, p. 57-64.
References Cited
23
24
24
Ellis, W.H., Jr., and Price, C.V., 1995, Development of a 14-digit hydrologic coding scheme and boundary data set for New Jersey: U.S. Geological Survey Water-Resources Investigations Report 95-4134, 1 sheet.
Curtis, P.J., 1998, Climate and hydrologic control of DOM concentration and quality in lakes, in Aquatic Humic Substances, Ecology and Biochemistry, Hessen, D.O., and Tranvik, L.J., (eds) New York, Springer, p. 93-105.
Fujii, R., Ranalli, A.J., Aiken, G.R., and Bergamaschi, B.A., 1998, Dissolved organic carbon concentrations and compositions, and trihalomethane formation potentials in waters from agricultural peat soils, Sacramento-San Joaquin Delta, California: Implications for Drinking Water Quality: U.S. Geological Survey Water-Resources Investigations Report 98-4147, p. 28.
Owen, D.M., Amy, G.L., and Chowdhury, Z.K., 1993, Characterization of natural organic matter and its relationship to treatability: Denver, Colo., American Water Works Association Research Foundation and American Water Works Association, 250 p.
Helsel, D.R., and Hirsch, R.M., 2002, Hydrologic analysis and interpretation, in Statistical methods in water resources, U.S. Geological Survey Techniques of Water Resources Investigations, book 4, Chap. A3, 510 p.
New Jersey Department of Environmental Protection Source Water Assessment Program (SWAP) manual http://www.state.nj.us/dep/watersupply/swap2.htm
Reckhow, D.A., Singer, P.C., and Malcolm, R.L., 1990, Chlorination of humic materials: Byproduct formation and chemical interpretations: Environmental Science and Technology, v. 24, p. 1655-1664.
Rook, J.J., 1974, Haloforms in drinking water: Journal of American Water Works
Association, v.68, p. 168.
Speiran, G.K., 2000, Dissolved organic carbon and disinfection by-product precursors in waters of the Chickahominy River Basin, Virginia, and implications for public supply: U.S. Geological Survey Water-Resources Investigations Report 00-4175, 60 p.
Stevens, A.A., Slocum, C.J., Seeger, D.P., and Roebeck, G.G., 1976, Chlorination of organics in drinking water: Journal of the American Water Works Association, v. 68, p. 615.
Thurman, E.M., 1985, Organic chemistry of natural waters, USA: Hingham, Mass., Kluwer Academic Publishers, 497 p.
United States Environmental Protection Agency, 1998, National primary drinking water regulations: disinfectants and disinfection byproducts; final rule: Federal Register, v. 63, no. 241, p. 69390-69476.
24

25
25
25