Embed Size (px)
Citation preview
Suspension of High Concentration Slurry in Agitated Vessels
A Thesis Submitted
for the Degree of Master of Engineering
by
(Steven) Jianke Wang
School of Civil, Environmental and Chemical Engineering
RMIT University
Melbourne
March, 2010

ii
DECLARATION
I certify that except where due acknowledgement has been made, the work is that of the
author alone; the work has not been submitted previously, in whole or in part, to qualify for
any other academic award; the content of the thesis is the result of work which has been
carried out since the official commencement date of the approved research program; any
editorial work, paid or unpaid, carried out by a third party is acknowledged; and, ethics
procedures and guidelines have been followed.
( )
Jianke Steven WANG
15/03/10
iii
ACKNOWLEDGMENTS
I gratefully acknowledge Dr Rajarathinam Parthasarathy for his constant assistance and
would like to express my sincere gratitude for his advice and guidance during this research.
As my primary supervisor, he has always provided helpful and valuable advice.
Appreciation is also extended to Professor Paul Slatter and Dr Jie Wu, my second
supervisor and my industrial supervisor, for their valuable suggestions and comments while
doing my research.
I also wish to acknowledge the technical and engineering support of Bon Nguyen and Dean
Harris, Division of Process Science and Engineering, Commonwealth Scientific and
Industrial Research Organisation, Australia. The research was supported financially by
Fluids Engineering Group, CSIRO.

iv
Publications Arising from this Thesis
Wang, S., Parthasarathy, R., Slatter, P. & Wu, J., “Suspension of Agitated High Concentration Slurry ”, 19th International Congress of Chemical and Process Engineering and 7th European Congress of Chemical Engineering, Prague, Czech Republic, 28th August – 1st September, 2010, (abstract accepted).
Wang, S., Parthasarathy, R., Slatter, P. & Wu, J., “Suspension of Agitated High Concentration Slurry in Transitional Regime”, Chemeca 2010, Adelaide, 26th – 29th September, 2010, (abstract submitted).
Wu J., Wang, S., Graham, L. & Parthasarathy, R., “High Solids Concentration Agitation for Minerals Process Intensification, submitted to 2nd Chinese Mixing and Agitation Conference, Shanghai,11st-13rd April, 2010, (paper accepted).
Wu J., Graham, L., Wang, S., Parthasarathy, R. & Pullum, L., “Energy Efficient Slurry Holding and Transport”, Minerals Engineering, 2010, (paper accepted for publication).

v
SUMMARY
Mechanically agitated vessels are used widely for solid-liquid mixing operations in
processing plants. With increase in the concentration of slurries, the stirrer speed and
consequently the energy required to suspend the solids off the tank bottom increase
significantly. Most of previous studies are limited to low solids concentrations. However,
there has always been a need to determine the best possible impeller and tank geometries,
and optimum operating conditions for tanks handling high concentration slurries, such as
those found in mineral processing plants.
Experiments were carried out in a small perspex tank. The critical impeller speed required
to suspend spherical glass particles off the tank bottom was determined by visual
observation of sedimentation height at the tank bottom. Water and aqueous glycerol
solution were used as the liquid phases. Various impellers were used in this study. Impeller
power consumption was determined by measuring the torque in the impeller shaft using a
torque transducer.
The optimum solid concentration at which (Pjs/Ms) is the minimum is found to vary
between 20 and 35% (v/v) depending on the impeller type and baffled conditions. Higher
power number radial impellers are found to be more energy efficient than lower power
number axial impellers for suspending fine particles in the unbaffled condition. For radial
impellers, the effect of baffle removal is more pronounced when smaller particles are used
which is opposite of what is found for axial impellers. It is shown that agitator energy
efficiency at very high solids loading can be improved by removing baffles for all impeller
types.
Improvement in energy efficiency can be accomplished by installing multiple impellers for
high solids concentration. It also appears that at high solids concentration, Cv=0.4 v/v, a
dual radial impeller system is most sensitive to baffle removal.
It is suggested that for slowly reacting slurry systems, typical in mineral processing
operations, the agitator design based on just-off-bottom solids suspension should be used. It
is also shown that slurry stratification in tanks can be used to boost either solids residence
time or slurry through flow. Basic equations are presented for guidance towards minerals
process intensification.

vi
TABLE OF CONTENTS
DECLARATION .................................................................................................................II
ACKNOWLEDGMENTS................................................................................................. III
PUBLICATIONS ARISING FROM THE TEHSIS........................................................IV
SUMMARY.......................................................................................................................... V
TABLE OF CONTENTS ...................................................................................................VI
LIST OF FIGURES........................................................................................................ VIII
LIST OF TABLES..............................................................................................................XI
NOMENCLATURE .........................................................................................................XII
CHAPTER 1 INTRODUCTION.........................................................................................1
1.1. INTRODUCTION TO FIELD OF STUDY.........................................................................2 1.2. OBJECTIVES OF THIS STUDY.....................................................................................3 1.3. ORGANISATION OF THE THESIS.................................................................................3
CHAPTER 2 LITERATURE REVIEW.............................................................................6
2.1 INTRODUCTION.........................................................................................................7 2.2 HYDRODYNAMIC OF PARTICLE SUSPENSION..............................................................7 2.3 CRITICAL IMPELLER SPEED........................................................................................9 2.4 NJS DETERMINATION: VISUAL METHODS AND NON-VISUAL MEHTODS ....................10
2.4.1.Visual methods..............................................................................................10 2.4.2.Other methods (non-visual). .........................................................................11
2.5 EFFFECT OF SOLIDS CONCENTRATION ON POWER CONSUMPTION............................12 2.6 EFFECT OF BAFFLE REMOVAL ON POWER CONSUMPTION.........................................13 2.7 EFFFECT OF TYPE OF IMPELLER ON POWER CONSUMPTION......................................14 2.8 EFFECT OF PARTICLE SIZE ON POWER CONSUMPTION..............................................15 2.9 EFFFECT OF GEOMETRICAL SETUP ON POWER CONSUMPTION..................................15 2.10 EFFECT OF MULTIPLE IMPLLERS ON POWER CONSUMPTION...................................16 2.11 EFFFECT OF VISCOSITY ON POWER CONSUMPTION.................................................17 2.12 IMPELLER POWER CONSUMPTION..........................................................................17 2.13 SUMMMARY ..........................................................................................................19
CHAPTER 3 EXPERIMENTAL ......................................................................................24
3.1. EXPERIMENTAL SET-UP..........................................................................................32 3.2.SLURRY PROPERTIES...............................................................................................30 3.3.MEASURMENT TECHNIQUES AND PROCEDURES.......................................................33
3.3.1. Critical impeller speed ................................................................................33 3.3.2. Impeller power draw measurement .............................................................35 3.3.3. Specific power consumption ........................................................................37
CHAPTER 4 OPTIMUM SOIDS CONCENTRATION FOR PARTICLE SUSPENSION IN MECHANICALLY AGITATED VESSELS....................................38
4.1 INTRODUCTION.......................................................................................................39 4.2 RESULTS.................................................................................................................40
4.2.1. Effect of solids concentration on specific power .........................................40
vii
4.2.2. Effect of impeller type on specific power.....................................................42 4.2.3. Effect of baffle removal on specific power ..................................................45 4.2.4. Effect of impeller diemension on specific power .........................................46 4.2.5. Effect of multiple impellers on specific power.............................................48 4.2.6. Effect of paritlce size on specific power ......................................................49 4.2.7. Optimum Solids Concentration....................................................................52 4.2.8.Theoretical prediciton ..................................................................................53
4.3 DISUCSSION............................................................................................................57 4.4 CONSLUSIONS.........................................................................................................59
CHAPTER 5 SUSPENSION OF HIGH CONCENTRATION SLURRY.....................61
5.1 INTRODUCTION.......................................................................................................62 5.2 RESULTS.................................................................................................................64
5.2.1. Effect of impeller type..................................................................................64 5.2.2. Effect of impeller blade angle and number of blades ..................................66 5.2.3. Effect of multiple impellers..........................................................................69 5.2.4. Effect of baffle removal................................................................................71 5.2.5. Effect of particle size ...................................................................................73 5.2.6. Effect of viscosity .........................................................................................75
5.3 DISUCSSION............................................................................................................77 5.4 CONSLUSIONS.........................................................................................................80
CHAPTER 6 MIXING OF SUSPENSIONS WITH HIGH SOLDS CONCENTRATION FOR MINERALS PROCESS INTENSIFICAITON .................81
6.1 INTRODUCTION.......................................................................................................81 6.2 THEORETICAL ANALYSIS: MIXING INTENSIFICATION AT HIGH SOLDS LOADING.......83 6.3 RESULTS AND DICUSSION........................................................................................85
6.3.1.Method 1: Increased solids concentration: Upper limit of solids concentration ................................................................................................85
6.3.2.Method 2: Increased soilds retention time: Stratification............................87 6.3.3.Improved energy efficiency for suspending high solids concentration ........89 6.3.4.Side effect of removal of bafflles...................................................................91
6.4 INTENSIFICATION CASE EXAMPLE...........................................................................93 6.5 CONSLUSIONS.........................................................................................................94
CHAPTER 7 CONCLUSIONS AND RECOMMENDATIONS....................................96
5.1. CONCLUSIONS........................................................................................................97 5.2. RECOMMENDATIONS FOR FUTURE STUDIES............................................................99
REFERENCES .................................................................................................................100
viii
LIST OF FIGURES
Figure 2.1 Sudden pickup of particles by turbulent burst (Cleaver and Yates, 1973)...............................................................................................................8
Figure 2.2 Various states of suspension proposed by Kraume (1992).............................8
Figure 2.3 Impeller power correlations cruve................................................................17
Figure 2.4 Varition of power required to suspend solids fully off the tank bottom with relative solids concentration.....................................................17
Figure 3.1 Schematic diagram of experimental set-up...................................................23
Figure 3.2 3-D schematic drawings of impeller used in this study................................26
Figure 3.3a Schmeatic drawings of impeller used in this study ......................................27
Figure 3.3b Impeller geometry definition: radial disc turbines and pitch-bladed turbines .........................................................................................................28
Figure 3.4 Schematic diagram of a dual impeller system ..............................................29
Figure 3.5 Bohlin CVO-50 controlled stress rheometer used in this study ...................31
Figure 3.6 Visual method that was used to determine Njs .............................................32
Figure 3.7 Solids bed height as a function of impeller speed for axial flow impeleler (A310) at different solids concentrations.....................................33
Figure 3.8 Ono Sokki torque detector, SS series for rotating and stationary shafts .............................................................................................................34
Figure 3.9 TS-3200 torque converter used in the experiment........................................35
Figure 4.1 Pjs/V vs. solids concentration: glass particles of d = 0.12 mm, fluid: water. Impeller: 30PBT6. D = 0.160 m. Tank configured in the baffled condition...........................................................................................39
Figure 4.2 Effect of solids concentration on εjs, solids: glass particles of d = 0.12mm, fluid: tap water. Impeller: 30PBT6. D=0.160 m. Tank configured in the baffled condition...............................................................40
Figure 4.3 Effect of impeller type on εjs, solids: glass particles of d = 0.12 mm, fluid: tap water. D = 0.160 m. Tank configured in the baffled condition. ......................................................................................................42
Figure 4.4 Effect of impeller type on εjs, solids: glass particles of d = 0.12 mm, fluid: tap water. D = 0.160 m. Tank configured in the unbaffled condition .......................................................................................................42

ix
Figure 4.5 Specific power enhancement factor Rε vs. solids concentration, at just-off-bottom suspension condition. Solids: partiles of d = 0.12 mm. fluid: tap water......................................................................................44
Figure 4.6 Effect of impeller diameter on εjs, solids: glass particles of d = 0.12mm, fluid: tap water. Impeller: A310. Tank configured in the baffled condition. ..........................................................................................45
Figure 4.7 Effect of impeller diameter on εjs, solids: glass particles of d = 0.12mm, fluid: tap water. Impeller: A310. Tank configured in the unbaffled condition. ......................................................................................45
Figure 4.8 Effect of dual impellers on εjs, solids: glass particles of d = 0.12mm, fluid: tap water. D = 0.160 m. Impeller:A310. Tank configured in the unbaffled condition.. .....................................................................................46
Figure 4.9 Effect of particle size on εjs for radial flow impeller (DT6), fluid: tap water. D = 0.160m. Impeller: DT6. Tank configured in the unbaffled condition ......................................................................................................48
Figure 4.10 Effect of particle size on εjs for mixed flow impeller (45PBT4), fluid: tap water. D = 0.160m. Impeller: 45PBT4. Tank configured in the unbaffled condition.......................................................................................48
Figure 4.11 Effect of particle size on εjs for axial flow impeller (A310), fluid: tap water. D = 0.160m. Impeller: A310. Tank configured in the unbaffled condition.......................................................................................49
Figure 4.12 Minimum power consumption, optimum solids concentration vs. particle size, at just-off-bottom suspension condition under unbaffled condition, fluid: tap water.............................................................................50
Figure 4.13 Prediciton values of specific power vs. solids conecntration based on equation (7), a = 0.13; S factor = 4.39. For values of power number Np and k, refer to table 4.3............................................................................54
Figure 5.1 High concentraion solids in the agitation tank (Cv = 0.40 v/v), impelle speed N = 0 rpm...............................................................................61
Figure 5.2a Variation of εjs with solids loading for rushton disc turbines and pitch-blade turbines. Tank configured in the baffled condition ...................63
Figure 5.2b Variation of εjs with solids loading for Rushton and pitch-blade turbines. Tank configured in the unbaffled condition ..................................63
Figure 5.3 Variation of εjs with impeller blade angle at constant particle loading (Cv = 0.40 v/v) for pitch-bladed impellers. Tank configured in the baffled condition...........................................................................................65
Figure 5.4 Variation of εjs with impeller blade angle at constant particle loading (Cv = 0.40 v/v) for pitch-bladed impellers. Tank configured in the unbaffled condition.......................................................................................65

x
Figure 5.5 Variation of εjs with number of impeller blades at constant particle loading (Cv = 0.40 v/v). Tank configured in the baffled condition .............66
Figure 5.6 Variation of εjs with number of impeller blades at constant particle loading (Cv = 0.40 v/v. Tank configured in the unbaffled condition............66
Figure 5.7 Effect of dual impellers on εjs, solids: glass particles of d=0.12mm. Cv = 0.40 v/v. Tank configured in the baffled condition.. ............................68
Figure 5.8 Effect of dual impellers on εjs, solids: glass particles of d=0.12mm. Cv = 0.40 v/v. Tank configured in the unbaffled condition ..........................68
Figure 5.9 Effect of particle size on εjs for Rushton disc turbines and pitch-bladed impellers at Cv = 0.40 v/v. Tank configured in the baffled condition .......................................................................................................72
Figure 5.10 Effect of particle size on εjs for Rushton disc turbines and pitch-bladed impellers at Cv = 0.40 v/v. Tank configured in the unbaffled condition .......................................................................................................72
Figure 5.11 Effect of viscosity on εjs, solids: glass particles of d = 0.12 mm. Cv = 0.40 v/v. Tank configured in the baffled condition ......................................74
Figure 5.12 Effect of viscosity on εjs, solids: glass particles of d = 0.12 mm. Cv = 0.40 v/v. Tank configured in the unbaffled condition ..................................74
Figure 6.1 An aerial view of an alumina refinery in Western Australia, extracted from the company website (Jan 2010)..........................................................81
Figure 6.2 The slurry vessels (connnected in series) that are ued for minerals processing can be 20 – 30 m in diameter, 10-15 m in height and the number of agiattion tanks can be up to10 or more .......................................82
Figure 6.3 Power consumption (Pjs/V) vs. normalized solids concentration, at just-off-bottom solids suspension condition, mixing tank diameter 0.39 m, liquid height 0.390 m, solids: glass particles of d = 0.12 mm, fluids: tap water. Turbine: 30 PBT6. Impeller diameter 0.160m, blade width 1/5 of diameter, 4 x baffles, with 1/12 tank diameter width. ............................................................................................................84
Figure 6.4 Solids suspension in tanks, with stratification, and formation of a clarified layer at the top ................................................................................85
Figure 6.5a Suspension height vs. impeller speed, Impellers: DT6, 45PBT4, A310 .............................................................................................................86
Figure 6.5b Suspension height vs. impeller speed, Impeller: pitch-bladed turbines, number of blades 3 – 6 (Wu et al. 2009b). ....................................86
Figure 6.6a Specific power at the just-off-bottom solids suspension condition at a solids loading of 0.40 (v/v). Under baffled condition. .................................88
xi
Figure 6.6b Specific power at the just-off-bottom solids suspension condition at a solids loading of 0.40 (v/v). Under unbaffled condition. .............................88
Figure 6.7 Mixing time measurements: the effect of baffles. The agitator design with an A310 at the bottom, D/T=0.48, and an RTF4 at the top, baffles installed or removed; tank diameter T = 1.0 m, liquid height 1.15 m, solids loading 0.4 v/v (*Data from CSIRO-Fluid Engineering Group, private communication). ..............................................90

xii
LIST OF TABLES
Table 2.1 Literature review summary 1 (solids suspension) ................................................19
Table 2.2 Literature review summary 2 (solids suspension) ................................................20
Table 2.3 Literature review summary 3 (solids suspension) ................................................21
Table 3.1 Mixing vessel dimensions ....................................................................................24
Table 3.2 Impeller specifications (power number in water).................................................25
Table 3.3 Solids properties: glass bead, SG=2.5, density: 2500 kg/m3................................30
Table 3.4 Solids weight, mass concentration and volumetric concentraion.........................30
Table 3.5 Specifications of Ono Sokki torque detector........................................................34
Table 4.1 Optimum soilds concentration and corresponding minimum specific power consumption, under baffled condition ........................................................50
Table 4.2 Optimum soilds concentration and corresponding minimum specific power consumption, under unbaffled condition ....................................................51
Table 4.3 Predicted optimum soilds concentrations and experimetnal values; list of of power number Np and parameter k, which are used to calcualte the specific power number in Equation (7) for different impellers (Bubbico et al., 1998) .................54
Table 5.1 Effect of baffle removal for different impellers under low and high solids concentrations (list of enhancement factors) .........................................................70
Table 5.2 Effect of baffle removal for different impellers with the usage of different size of particles, Cv = 0.40 v/v (list of specific power enhancement factors) ..................70
Table 6.1 Case example of a full-scale mineral leaching tank, effect of process intensification ........................................................................................................91

xiii
NOMENCLATURE
B Baffle width, m
D Impeller diameter, m
C Impeller to tank bottom clearance, m
Cfeed Solids concentration in the feed pipe, v/v
CT Solids concentration in the mixing tank, v/v
Cvb Solids packing coefficient, v/v
H Liquid height, m
K Constant
L Impeller blade length, m
Ms Mass of solid particles in tank, kg
N Impeller speed, rpm
NP Power number, P/ρL N3D5
NRe Reynolds number, ρLND2/µ
P Power consumption, W
P/Ms Specific power consumption, W/kg
P/V Specific power consumption, W/m3
PBT Pitched blade downward pumping impeller
DT Disc turbine
T Tank diameter, m
t Bulk slurry flow residence time, sec
ts Solids residence time, sec
tm Mixing time, sec
V Volume, m3
W Impeller blade width, m
X Solid mass fraction
xiv
Subscripts
js Just suspended state under unaerated condition
L Liquid
Greek symbols
ρ Density, kg/m3
µ Viscosity, kg/m ⋅ s/ Pa.s
ε Specific power, W/kg

1
CHAPTER
1.0
Introduction

2
Chapter 1.0
Introduction
1.1 Introduction to the field of study
Process intensification in agitated vessels often requires that the production yield per unit
volume per unit time is to be increased without the need for major changes in the plant.
Process intensification can be achieved by increasing the throughput or yield through
improved physical processes such as efficient mixing since it is often impractical to reduce
the size or volume of existing agitated tanks (Wu et al., 2009a, b). In such instances, it is
beneficial to maintain the vessel volume and intensify the process by increasing the solids
throughput. When solid throughput is increased, it leads to an increase in the impeller speed
required to suspend the solids off the tank bottom which consequently increases the energy
input to the system. Therefore it is essential to determine suitable mixing vessel and
impeller configurations which can achieve “just suspended” condition for high
concentration slurries with minimum power input.
Information in relation to suspension of high-concentration slurries is extremely limited.
Behaviours of such suspensions are less predictable as the presence of a large amount of
solids exerts a strong impact on the fluid circulation, most probably the rheology (Drewer et
al., 1994). A critical issue with operating at a very high solids concentration is large
impeller power consumption. Excessively large power consumption is particularly
problematic for the minerals processing plants, where large-scale agitator meant using
extremely larger motor and gear-box equipment to increase the solids loadings.
Drewer et al. (2000) suggested that for chemical processes, except for some operations like
crystallization, suspension homogeneity is not important as long as the contact between
solids and the liquid phase is maintained by certain degrees of agitation. In general, it
should be noted that for processes involving chemical reactions, the kinetics could be either

3
diffusion-limited or non-diffusion-limited1. Diffusion control is more likely in solution
where diffusion of reactants is slower owing to greater number of collisions with solvent
molecules. In a diffusion-controlled reaction, the formation of products from the
‘transitional structure’ is much faster than the diffusion of reaction and thus the rate of
reaction is governed by diffusion. It is expected that in such case, more intensive agitation
will result in faster diffusion and thus the rate of reaction will increase (Atkins, 1998).
However, it is often sufficient to keep solids just suspended off the tank bottom for
non-diffusion-limited processes as the rate of reaction is not affected by the agitation once
the exposure of maximum surface area is achieved. This is the basis on which all the power
measurements and analyses are conducted in this thesis.
For the last five decades, there have been a number of studies on solids suspension in
mixing vessels and many of them focused on determining the optimum impeller and tank
geometry that will minimize the power input to the system. Most of these studies are
limited to low solid concentrations. However, there has always been a need to determine
the best possible impeller and tank geometry and optimum operating conditions for tanks
handling high concentration slurries, such as the ones in mineral processing plants.
1.2 Objectives of this study
• To determine the optimum solid concentration that can be used in mixing vessel
under baffled and unbaffled conditions using various impeller types
• To study the effects of design and operating conditions on the suspension
performance
• To improve the minerals treatment processes while maintaining as much as possible
the current design to minimize the operating costs
1.3 Organization of the thesis
This thesis is organized as follows:
1 The classical test for diffusion control is to observe whether the rate of reaction is influenced by stirring or agitation; if
reactor of reaction can be affected by agitation, the reaction is most likely diffusion controlled (Atkins, 1998).

4
Chapter 2: Literature Review
This chapter describes previous studies on solids suspension in mechanically
agitated vessels. It also covers various methods used in previous studies to
measure the critical impeller speed and power consumption in solid –liquid
mixing vessels.
Chapter 3: Experimental Apparatus and Procedure
This chapter describes the experimental equipment, procedures and materials
used in this study.
Chapter 4: An Optimum Solid Loading for Particle Suspension
The specific power required for the complete suspension of solids in a
mechanically agitated vessel is studied over a wide range of solids
concentrations and particle sizes. This chapter discusses the effect of impeller
type, impeller blade thickness, impeller diameter, multiple impellers and baffle
removal on the specific power consumption at just-suspended condition.
Optimum solids concentrations are presented and discussed for the
above-mentioned systems.
Chapter 5: Energy Efficiency Study for Suspension of High-Concentration Slurry
This chapter focuses on the agitation power required to suspend solids at a
very high concentration (Cv = 40% v/v) off-the bottom of tanks as a function
of a range of parameters including impeller type, particle size, fluid viscosity,
impeller geometry factors such as number of blades, angle of blades, and
baffle installation.
Chapter 6: High Solids Concentration for Minerals Process Intensification
This chapter discusses employing mixing intensification involving high solids
concentration as a means to achieve process intensification for the mineral

5
process industry. The benefits and issues relating to the operation of mixing
vessels at high solids concentrations are discussed.
Chapter 7: Conclusions and Recommendations
This chapter summarizes the findings and presents the conclusions from this
study. Recommendations are made for future work.

6
CHAPTER
2.0
Literature Review

7
Chapter 2
Literature Review
2.1 Introduction
The first part of this chapter critically reviews the literature and summarises various
experimental measurement techniques for critical impeller speed for off-bottom solids
suspension, Njs. The second part of this chapter represents a general review of studies on
the effect of system geometries, that is, impeller type, number of impellers, baffling
conditions, and solids properties on impeller power consumption. Tables summarizing
previous studies on solids suspension are presented at the end of the chapter.
Mechanically agitated vessels are widely used in industry for multi-phase operations, and
solid-liquid mixing is one of important unit operations in many processing plants. This
includes dispersion of solids, dissolution, crystallization, precipitation, adsorption,
desorption, ion exchange, solids-catalyzed reaction and suspension polymerization
(Nienow, 1994). Solids suspension is a result of flow field, sometimes turbulent with a low
viscosity, in which solid particles are lifted from the vessel bottom, and then dispersed and
distributed throughout the liquid phase. The degree of suspension or turbulent flow field is
to a large extent dependent on the mechanical energy input for a given vessel geometry. For
instance, more intensive agitator energy input can result in more / or stronger anisotropic
turbulent eddies, leading to a higher degree of suspension. Energy input is regarded as a
significant operating parameter in chemical processes and it is a function of agitation
conditions like Njs, solids concentration, and geometric parameters like impeller type and
geometry, baffle type and geometry.
2.2 Hydrodynamic of particle suspension
Particle suspension in a mechanically agitated vessel is achieved by a combination of the
drag and lift forces of the moving fluid on the solid particles and the bursts of turbulent
eddies (due to agitation) originating from the bulk flow. Atiemo-Obeng et al., (2004)
suggested that solids settled at the vessel base mostly swirl and roll round there, but
occasionally, particles are suddenly and intermittently lifted up as a tornado. Cleaver and
Yates (1973) illustrated the sudden pickup by turbulent bursts, as shown in Figure 2.1.

8
Figure 2.1 Sudden pickup of particles by turbulent burst (Cleaver and Yates, 1973).
Atiemo-Obeng et al., (2004) also suggested that small particles whose density is
approximately equal to the that of the liquid, just continue to move in the vessel once
suspension is accomplished. The suspension behaves like a single-phase liquid (at low Cv);
however, for bigger (or heavier) particles, Atiemo-Obeng et al., (2004) pointed out that the
drag force on the particles should be strong enough and it should be directed upward to
counteract the tendency of the particles to settle by the action of gravity.
In an agitated solids suspension, a dense solid particle has to accelerate to a steady-state
settling velocity, which has been defined as the free or still-fluid settling velocity. This
occurs when the drag force balances the buoyancy and gravitational force. The magnitude
of the free settling velocity can be used to characterize the solid suspension problems and it
can be described as shown in the following correlations:
For the stokes’s law (laminar) regime, Rep<0.3:
µρρ
18
)(2lspc
t
dgV
−=
For the Newton’s law (turbulent) regime, 1000<Rep<35×104:
2/1])(
[73.1l
lspct
dgV
ρρρ −
=
where CD (the drag coefficient) is a function of particle Reynolds number, Rep and particle
shape.
9
2.3 Critical impeller speed (Njs)
The effectiveness of the mixing vessel is attributed to the volume of fluid circulated by the
impeller and it must be sufficient to sweep out the entire tank in a reasonable duration. The
velocity of the stream leaving the impeller must be sufficient to carry the current to the
remotest parts of the tank. In addition to circulation rate, turbulence is also a great
contributor to the overall energy consumption as turbulence in the moving stream often
governs the effectiveness of the process. Turbulence is a consequence of the properly
directed currents and large velocity gradients in the liquid.
Operating the impeller at critical impeller speed or just-suspended speed in solid-liquid
systems is significant because of the maximized interfacial area of the solids for chemical
reaction. Nienow et al. (1968) found that maximized surface area at just-suspended
condition can rapidly enhance the effectiveness of the process due to an increased rate of
heat and mass transfer. Much of the work in the literature pertaining to particle suspension
is related to the just-suspended speed, Njs. Therefore, it is important to study the influence
of various parameters on this condition since it will be beneficial to heat and mass transfer,
and chemical reactions.
To understand the two-phase hydrodynamics at just-suspended condition, it is important to
understand the suspension behaviour with respect to various stirrer speeds in an agitated
vessel. Kraume (1992) and Bujlaski et al. (1999) visually identified different states of
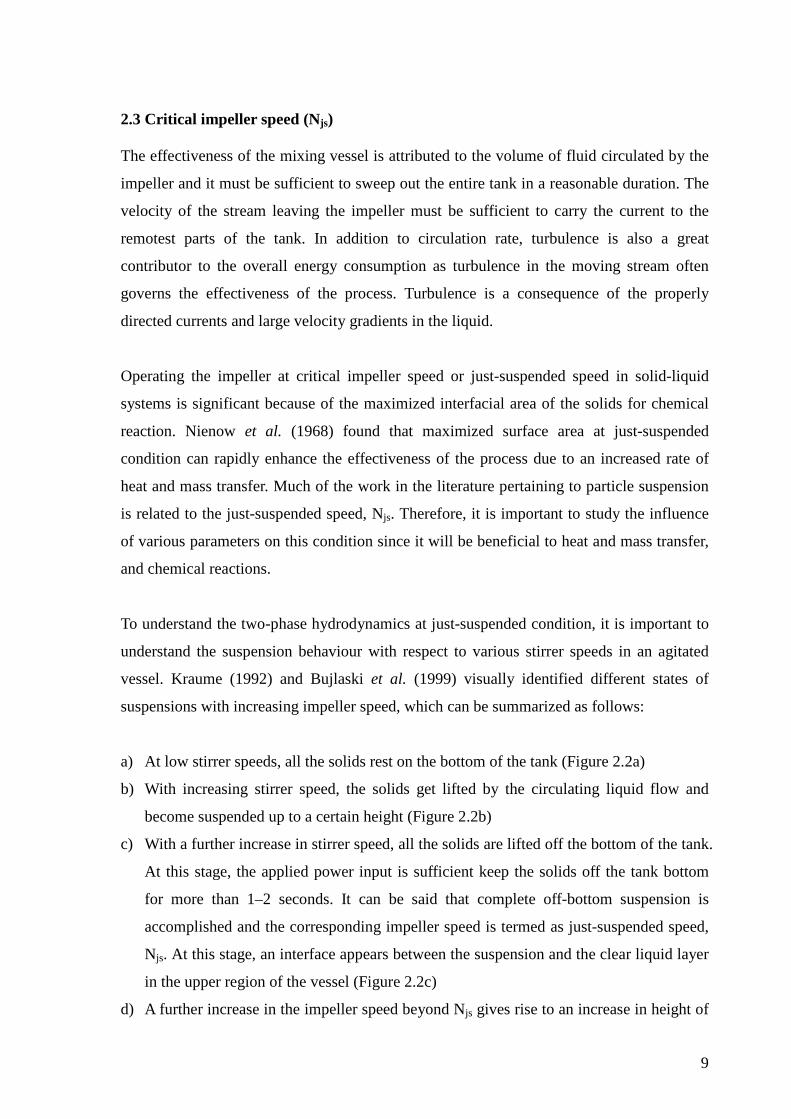
suspensions with increasing impeller speed, which can be summarized as follows:
a) At low stirrer speeds, all the solids rest on the bottom of the tank (Figure 2.2a)
b) With increasing stirrer speed, the solids get lifted by the circulating liquid flow and
become suspended up to a certain height (Figure 2.2b)
c) With a further increase in stirrer speed, all the solids are lifted off the bottom of the tank.
At this stage, the applied power input is sufficient keep the solids off the tank bottom
for more than 1–2 seconds. It can be said that complete off-bottom suspension is
accomplished and the corresponding impeller speed is termed as just-suspended speed,
Njs. At this stage, an interface appears between the suspension and the clear liquid layer
in the upper region of the vessel (Figure 2.2c)
d) A further increase in the impeller speed beyond Njs gives rise to an increase in height of
10
the interface of the solid-liquid suspension from the vessel bottom.
e) Figure 2.2e represents a homogenous suspension in a solid-liquid system; homogenous
suspension is fulfilled when particles are distributed throughout the tank volume (Figure
2.2e).
Figure 2.2 Various states of suspension with increasing stirrer speed proposed by Kraume (1992).
2.4 Njs determination: visual methods and non-visual methods
2.4.1 Visual methods
Zwietering (1958) introduced the visual observation method to determine Njs. He defined
Njs as the speed at which no solid is visually observed to remain at rest on the tank bottom
for more than 1–2 seconds. This complete off-bottom suspension criterion (CBS) is
frequently used as the measure of the required suspension condition (Drewer et al., 2000;
Bujalski et al., 1999). A drawback of using Zwietering’s CBS, as pointed out by Kasat and
Pandit (2005), is the excessive energy required to lift solids from relatively stagnant regions,
for example, around the periphery of the vessel bottom near the baffles or at the centre of
the vessel bottom, where the liquid circulation is not strong as compared to that in the bulk
of the vessel. Kasat and Pandit also mentioned that from a practical point of view these
fillets are generally insignificant and impeller speed is increased up to 20 – 50% above Njs
to suspend a small amount of particles. Wu et al., (2009a, b) also pointed out that this
method is practically problematic since a single particle (or a small quantity) stationary in a
corner may not be suspended even at a very high stirring speed, and that it is meaningless
and unreliable to rely on the status of a small amount of particles to determine the
just-off-bottom suspension condition.
Einenkel and Mersmann (1977) introduced another visual method based on the visual
observation of the height of the interface between the slurry and the clear liquid. They
defined Njs as the speed at which the height of the interface (from vessel base) is 90% of the

11
total liquid height. Kraume (1992) and Kasat et al. (2005) commented that Njs measured by
this method is 20 – 25% higher than that predicted by Zwietering’s method due to the fact
that small particles could be suspended at the top of the tank prior to the last particles being
lifted off the tank bottom.
In this work, a method recommended by Wu et al., (2002), and Wu et al., (2009a, b) was
used in the experiments. This method was based on the experimental technique proposed by
Hicks et al., (1997). In this method, sedimentation bed height (HB) was measured with
various agitation speeds, and Njs was defined as the speed at which the height of the settled
bed is zero (i.e. HB=0) and a further reduction in the impeller speed will give rise to a
visible solids bed (i.e. HB>0). The bed height, recorded as an average height of the fillet
along the tank wall, was typically measured at a point in the middle of two consecutive
baffles1. The repeatability of the Njs measurement used in this method was found to be
within ±2%. This method has been demonstrated to be more reliable when investigating
suspension behaviour under a high solids concentration condition (Wu et al., 2002; 2009a;
2009b).
2.4.2 Other methods (non-visual)
In addition to the visual measurements mentioned above, other techniques have been
proposed to measure the Njs where the visual observation is not feasible. One of the
methods was introduced by Rewatkar et al. (1991). They defined Njs as the speed beyond
which the power number remains constant with an increase in the impeller speed. A
comparison between the power consumption method (PCM) and traditional visual method
showed that PCM is quite a reliable method to determine the values of Njs, with a marginal
difference of< 5%.
Another non-visual method relates to the measurement of mixing time with respect to the
impeller speed (N) in the solid-liquid system. Njs can be determined by measuring the
mixing time with respect to the impeller speed and Njs is the speed at which the difference
between the mixing time in the presence and absence of solids reaches maximum. This
method can be used for opaque vessels and for large-scale installation due to its accuracy
(<5%) and non-visual requirement (Kasat et al., 2005).
1 Note this sedimentation height refers to the sedimentation at the wall; this measurement approach works for agitator systems where sedimentation starts at the tank fillet region.

12
Micale et al. (2002) determined Njs by means of a pressure gauge which measures the
pressure at the bank bottom. This technique is related to the fact that the slurry density will
be higher than that for pure liquid once suspension is attained. If the static pressure is
measured at the tank base, a higher degree of suspension will lead to higher pressure
measured by the gauge located at the bottom of tank. The increase in the static head owing
to solids suspension can be correlated as a function of mass of the suspended solids as
follows:
b
ss
A
gMp L
)/1( ρρ−=∆
where Ms is the mass of suspended solids, ρs is the solids density (kg/m3), pL is liquid
density (kg/m3), and Ab is tank bottom area (m2), p∆ is the increase in the static head due
to solids suspension (in Pa). Selima et al. (2008) found the agreement between their work
based on pressure measurement method and predictions by Zwietering’s correlation with
maximum difference not exceeding 17%.
Other non-visual methods that have been proposed are radioactive tracer technique
(Rewatkar et al., 1991), conductivity technique (Musil and Vlk, 1978) and solids sampling
technique (Bourne and Sharma, 1974; Musil, 1976). Since these methods are less popular,
they are not discussed in detail here.
2.5 Effect of solids concentration on power consumption
Solids concentration is a significant factor that influences the energy input in solid-liquid
mixing vessels. It is always of interest to increase the solids concentration in the agitation
vessel since throughput can be increased subsequently and tank infrastructure can be
efficiently employed. However, a higher solids loading (such as 0.20 – 050 v/v) could result
in more intensive energy input. Bubbico et al. (1998) explained that extra energy input with
high solids loading is due to the extra energy required to compensate the energy loss in
solid-liquid friction, particle-particle collision and particle-equipment collisions. Bubbico et
al. (1998) and Raghava Rao et al. (1988) all agreed that the amount of energy loss due to
this mechanism is ignorable at low solids concentration (< 0.04 v/v) and becomes
appreciable when high solids loading is present. Drewer et al. (1994) indicated that there is
a critical or maximum solids concentration where suspension is unattainable. Wu et al.

13
(2002) suggested that the maximum solids concentration at which slurry suspension can be
maintained in an agitated vessel given by the following relationship:
90.0≈vb
v
C
C
where Cv (v/v) is the solids concentration, Cvb (v/v) is the solids volume-packing
coefficient. It is challenging to operate the slurry mixing tank at an extremely high
concentration since the power input at the just-off-bottom solids suspension condition (i.e.
Pjs) increases exponentially as the concentration approaches the solids volume-packing
coefficient Cvb (Drewer et al, 1994, 2000; Wu et al, 2002); an upper limit of Cv, that is
practically achievable, was found to be between 0.50 – 0.55 for a typical packing
coefficient ranging from 0.55 to 0.60 (Wu et al, 2009b). Wu et al. (2002) also pointed out
that in the region of Cv/Cvb>0.9, bogging of the agitator would eventually occur due to the
excessively high power consumption.
It is also well known that concentrated suspensions exhibit non-Newtonian properties
leading to complex circulation behind the blades of impellers. Slurries with viscous
non-Newtonian characteristics are problematic due to poor mixing and reduced heat and
mass transfer rates (Kasat and Pandit, 2005).
2.6 Effect of baffle removal on power consumption
The effect of baffle installation cannot be ignored in the optimization of mechanically
agitated vessels. The role of baffles in mechanically agitated vessels is to prevent swirling
and vortexing of liquid (Lu et al., 1997). With the installation of baffles, it is generally
agreed that enhanced mixing occurs which consequently increases mass- and heat transfer.
However, excessive or insufficient baffling may result in the reduction of mass flow and
localizing circulation in the agitation system (Nishikawa et al., 1979). Nishikawa et al.
(1979) also indicated that if the width of the baffle is larger than 0.1T, the fully baffled
condition will be obtained with 3 baffles or more. Lu et al. (1997) also studied the effects of
width and number of baffles in mechanically agitated vessels with standard Rushton turbine
impellers in the agitation systems with and without the presence of gas, and concluded that
the insertion of the appropriate number of baffles obviously results in improvement in the
extent of liquid mixing. Nevertheless, excessive baffling would interrupt liquid mixing and
lengthen the mixing time. A consequence of lengthening of the mixing time is the reduction
in the efficiency of the agitation system (Lu et al., 1997).

14
Unbaffled agitated vessels or weakly baffled tanks were found to be more energy efficient
than those with full baffles for single phase system. This is based on studies that are
associated with radial impellers and axial impellers conducted by Markopoulos et al. (2004)
and Markopoulos et al. (2005) respectively. Although, the removal of baffles leads to an
increase in mixing time, it is also a very effective way to drastically reduce the specific
energy for suspending solids particles off the tank bottom (Wu et al., 2009a). Wu et al.
pointed out that the increased mixing time is not usually a problem since the time scale for
reaction and the slurry residence time in some mineral processes can be much longer than
the mixing time. Typically, for example, in gold leaching processes, residence time
requirements in practice vary from a few hours to several days, which is an order of
magnitude longer than the mixing time, which is typically in minutes (Marsden & House,
2006; Wu et al., 2009a). Wu et al. (2009b) concluded that a superior way to improve
energy efficiency is to remove the baffles for those tanks if the mixing rate is not critical in
cases such as slurry-holding tanks or reactors where chemical reactions are slow.
2.7 Effect of type of impeller on power consumption
There is a wealth of information on the effect of impeller type on power consumption in
solid-liquid agitated vessels. The choice of a proper impeller to satisfy suspension
requirements is critical since different impellers generate different flow patterns leading to
different hydrodynamics, thus affecting the energy efficiency of the system. Extensive
studies have been conducted previously using low to medium solids concentrations, and it
was generally agreed that the pitched-blade impellers perform more efficiently than disc
turbines, and the pitched turbine downflow types consume less energy than pitched turbine
upflow impellers (Ibrahim and Nienow, 1996; Frijlink et al., 1990).
Raghavo Rao et al. (1998) concluded that three factors are responsible for the poor mixing
efficiency of a disc turbine. These are: (a) only partial energy delivered by the circulation
loop is available for solids suspension; (b) liquid-phase turbulence is created at the impeller
tip but it decays along the path of liquid flow; (c) energy is lost during the two changes of
the flow directions, first near the wall opposite of the impeller and then at the corner of the
base and wall. However, Wu et al. (2002) did some work on extremely high solids
concentration (Cv = 0.49 v/v) and concluded that based on power efficiency at high solids
loading, radial impellers are superior to the axial flow impellers to suspend solids. This is
contrary to what is generally noticed at low solids loading. However, information regarding

15
the effect of impeller type on solids suspension at high solids concentration cannot be
considered to be complete.
2.8 Effect of particle size on power consumption
According to Kasat and Pandit (2005), solids suspension is quite sensitive to loaded solids
due to their impact on impeller performance in such a way that suspension viscosity, local
slurry density or vortex structure in the vicinity of blades are modified. It is expected that
an increase in particle size will require an increase in turbulence or liquid circulation to
compensate the increased gravitational force. Thus, higher energy dissipation rate is
required to satisfy the just-off-bottom requirement for larger particles as reported by
Drewer et al. (1994).
Bubbico et al. (1998) proposed that when large particles are suspended in a liquid, the solid
phase itself is responsible for the dissipation of some of the energy supplied. The amount of
energy lost in solid-solid, solid-liquid, and solid-equipment contacts will become
pronounced when employing larger particles, according to Bubbico et al. (1998). However,
studies associated with particle size impact on energy input, particularly under high solids
concentration, are still limited.
2.9 Effect of geometrical setup (D/T, C/T) on power consumption
A major limitation of previous studies on solid-liquid agitated vessels is that they deal
almost exclusively with the “just-suspended” speed, Njs. Nienow (1968, 1985) and
Chapman (1983a, 1983b) investigated the effect of impeller diameter on critical speed
associated with just-off-bottom suspension and concluded that Njs decreases with the
increasing impeller diameter for a given tank diameter. Zwietering (1958), Nienow (1968),
and Raghava Rao et al. (1988) evaluated the relationship between the impeller off-bottom
clearance and Njs and found that a significant reduction in Njs can be achieved by
decreasing the off-bottom impeller clearance. However, no conclusive consensus has yet
been reached about the impact of impeller diameter on Njs (Kasat and Pandit, 2005).
Nevertheless, for a given agitation system, it is generally expected that the critical speed for
suspension will decrease with increasing impeller size. Chapman et al. (1983b) suggested
the relationship between Njs and impeller diameter D in the baffled tank can be shown as
Njs∝ D-2.45.

16
Reporting the impeller speed, rather than the power draw at Njs, has two drawbacks: 1) it is
not possible to compare the energy efficiency or power consumption of a given system with
other work, and 2) estimates of the power draw using Njs and impeller power number can
be inaccurate by up to 20% because power number at Njs can be a function of solids
concentration (Drewer et al., 1994; Bubbico et al., 1998).
Ibrahim and Nienow (1996) investigated the relative effectiveness of a wide range of new
impellers that have been on market and claimed that the most efficient configuration
requiring the least specific power in a flat-bottom tank is a downward-pumping impeller of
0.35 and 0.4 times the vessel diameter with impeller clearance of the base of 1/4 of the
vessel height. Ibrahim and Nienow also claimed that the minimum specific energy
dissipation rate associated with the downward-pumping impellers such as HE3 hydrofoils
could be further reduced by a factor of 4 to 5 by modifying the tank base to fill in the zones
at the periphery and the centre where solids collect. Nevertheless, the above study focused
only low solids concentrations (0.01 ~ 0.20 v/v).
2.10 Effect of multiple impellers on power consumption
Most industrial agitated vessels are installed with multiple impellers, aiming to introduce
even distribution of shear and energy dissipation rates. Typically, most of the industrial
reactors, fermenters and stirred tanks are equipped with multiple impellers to satisfy a
variety of mixing requirements such as blending, improvement of multiphase mass transfer,
or enhancement of the mixing related to a chemical reaction in addition to solids
suspension. Armenante and Li (1993) have reported that the lower impeller in
multiple-impeller arrangement is mainly responsible for solids suspension. However, their
results also showed that any interference in the flow pattern generated by the lower
impeller, owing to the presence of an additional impeller, leads to higher energy
requirement to achieve the same state of solids suspension. Similar findings have been
reported by Nocentini et al. (1988) and Dutta and Pangarkar (1995). Bakker et al. (1998)
reported that the difference between the energy requirement for single and dual axial
impeller systems is marginal (<5%). It is generally agreed that an additional impeller would
result in an extra energy requirement to satisfy the just-off-bottom solids suspension
condition. However, information associated with solids suspension in two-phase stirred
vessels equipped with a multiple impeller system for high concentration slurry is extremely
limited (Tatterson, 1994; Dutta & Pangarkar, 1995; Kasat & Pandit, 2005).

17
2.11 Effect of viscosity on power consumption
Viscous mixing is widely applied in many industrial applications like the manufacturing of
pastes, putties, chewing gum, soap, grease, pulp and paper (Paul et al., 2004). Zwietering
(1958) was among the first to evaluate the effect of viscosity on Njs, and he covered a range
of viscosities up to about 10 mPa.s. However, in general, the effect of viscosity on Njs and
power consumption has been broadly neglected. Hirkeskorn and Miller (1953) worked in
the laminar flow regime using highly viscous liquids from 8 to 80 Pa s and without baffles.
They clearly established that solids particles could be suspended in the laminar flow region.
Ibrahim et al. (1999) suggested that axial impellers might become less efficient for solids
suspension in the transitional regime due to the changes in flow pattern at a lower Reynolds
number (<3000).
Ibrahim and Nienow (1999) studied the effect of viscosity on the mixing pattern and solids
suspension in stirred vessels. They observed that the predictions of Zwietering’s equation
for the “just-suspended” speed had errors of up to 90% for high viscosity liquids indicating
that the phenomenon is far more complicated than commonly accepted. Compared to the
turbulent system, Ibrahim and Nienow also found that there is less random particle
movement across the base prior to suspension at high viscosity. In addition to this, Ibrahim
et al. suggested that suspension at high viscosity can be achieved with a lower mean
specific energy dissipation rate, εjs, when using large D/T impellers whether of the radial or
axial type. It should be noted that the study conducted by Ibrahim and Nienow (1999)
focused on low solids concentration, that is, 0.5% w/w.
2.12 Impeller power consumption
Nienow and Elson (1988) suggested that an accurate measure of impeller power is
extremely important for the accurate assessment of mixing efficiency, scale-up rules and
theoretical concepts of mixing with sufficient sensitivity. It is essential to determine the
agitator power consumption in two-phase reactors, because it is an indication of energy
efficiency for any given system. Operational costs can be reduced due to improved energy
efficiency.
Power number Np (sometimes also refer to Newton number) is a commonly-used
dimensionless number relating the resistance force to the inertia force. The power number
in an agitation system is defined as:
18
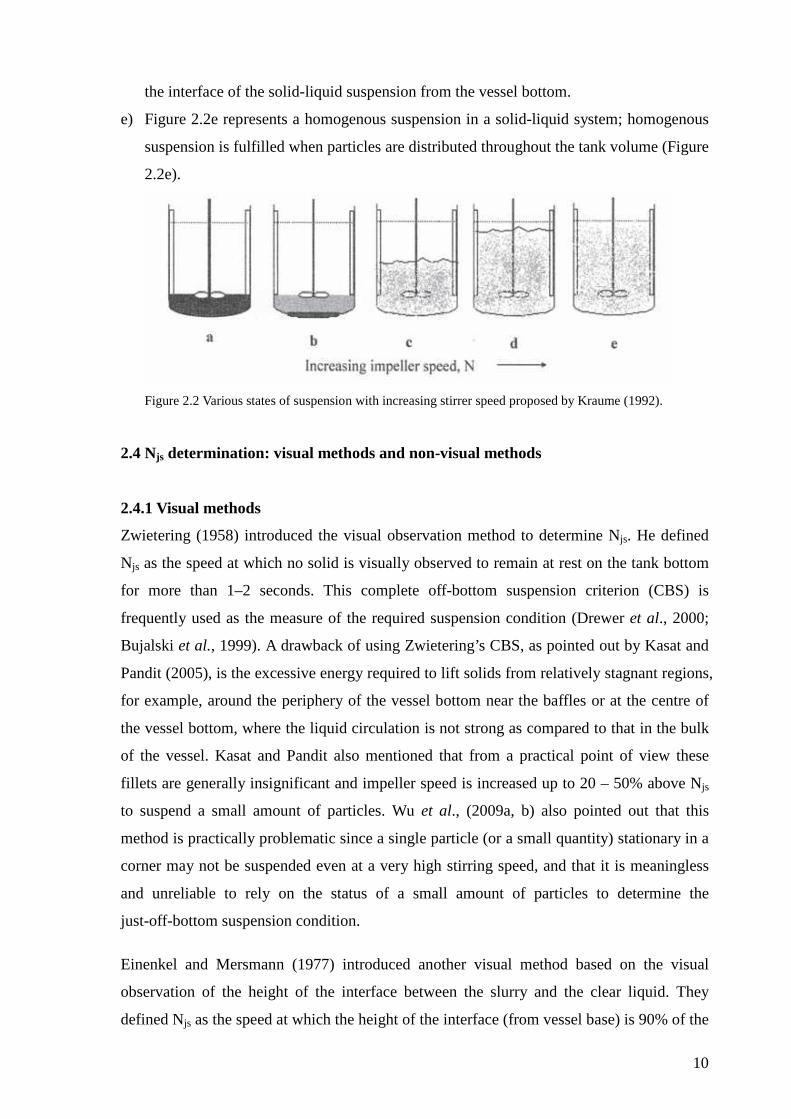
53DN
PN p ρ
=
The power number, Np is a function of Reynolds number, impeller blade width, number of
blades, blade angle, D/T, baffle configuration and impeller elevation (Hemrajani &
Tatterson, 2004). Hemrajnie & Tatteson suggested that the power number can be considered
similar to a drag coefficient and the functionally between Np and Re can be described as
flows:
o 1Re−∝pN in the laminar regime and power relies on viscosity
o Np = constant, in the turbulent regime (Re>10 000) and is not affected by viscosity
o Np varies slightly in the transitional regime (100 < Re <10 000).
o Np changes with blade width, number of blades and blade angle as follows:
45.1)/( DWN p ∝ , for a six-bladed Rushton turbine
65.0)/( DWN p ∝ , for a four-bladed 45° pitched blade turbine
45.1)/( DWN p ∝ , for a six-bladed Rushton turbine
65.0)/( DWN p ∝ , for a four-bladed 45° pitched blade turbine
8.0)/( DnN p ∝ , for three to six bladed turbine
7.0)/( DnN p ∝ , for six to twelve bladed turbine
6.2)(sinθ∝pN , for pitched blade turbines, with blade angleθ
Power consumption in liquids can be affected by a number of factors such as fluid density
(ρ), fluid viscosity (µ), rotation speed (N) and impeller diameter. Figure 2.3 shows typical
impeller power number Np versus impeller Reynolds number NRe correlation lines for
frequently used agitators operating in Newtonian fluids in baffled cylindrical vessels.
Figure 2.4 shows a typical example of the agitation power per unit slurry volume (Pjs/V)
required to just suspend solid particles off the tank bottom, as a function of reduced solid
volume concentration Cv normalized with the settled bed concentration Cvb. Most of the
previous studies considered the impeller power input in solid-liquid system on the basis of
the volume of vessel or reactor (Chaudcek, 1984; Drewer et al., 1994; and Wu et al., 2002).

19
Figure 2.3 Impeller power correlations: curve 1, six-blade turbine, D/W = 5, four baffles, each T/12; curve 2, vertical blade, open turbine with six straight blades, D/W = 8, four baffles each T/12; curve 3, six-blade 45o pitched-blade turbine, D/Wi = 8, four baffles, each T/12; curve 4, propeller, pitch equal to 2D, four baffles, each 0.1T, also same propeller in angular off-centre position with no baffles; curve 5, propeller, pitch equal to D, four baffles each 0.1T, also same propeller in angular off-centre position with no baffles. (Perry & Green, 1997)
However, power measurements in this study are linked to the mass of solids suspended due
to fact that the rate of dissolution and reaction can to a great extent be related to the surface
area or amount of solids, but not affected by the volume of the vessel or agitation once
complete suspension is achieved.
Figure 2.4 Variation of power required to suspend solids fully off the tank bottom plotted as function of the relative solid concentration. Tank dia. T=0.39, impeller 30PBT6 pumping downward, impeller dia. D = 0.16m, C/T = 1/5, H/T = 1.08. Solid particles: glass AE with d50=105µm, SG=2.52. Fluid: water. (Wu et al., 2002)
2.13 Summary
From the above literature review, it can be concluded that information on the suspension of
high concentration slurry is extremely limited. The behavior of high concentration
suspension is difficult to predict because the presence of a large amount of solids exerts a
20
strong impact on the fluid circulation and also on the rheology. The effects of various
variables on impeller power consumption in a solid-liquid system are still not established,
particularly for the high solids concentration condition. Therefore, in this study, the
investigation focuses on the suspension of high-concentration slurry and specific power
input to evaluate the solid-suspension operation in mixing vessels.

21
Table 2.1 Literature review summary1 (solids suspension)
Authors Zwietering Nienow Baldi et al. Chapman et al. Raghava Rao et al. Drewer et al. Year 1958 1968 1978 1983a 1988 1994
Tank Specification Diameter (T), m 0.154–0.6 0.14 0.122, 0.19 & 0.229 0.29–1.83 0.3–1.5 0.2 Liquid Depth (L), m =T =T =T =T =T =T
Base flat, dished and
conical flat Flat flat flat Flat No. of Baffles 4 4 4 4 4 4 Baffled/Unbaffled Baffled Baffled Baffled Baffled Baffled Baffled
Impeller Specification
Type Paddles, Disks,
Propellers RT RT various RT, PTD & PTU RT, MP No. of Blades 2, 3 & 6 6 6 3, 4 & 6 6 6
Diameter (D), m 0.06–0.224 0.0364, 0.049 &
0.073 0.32, 0.40 & 0.48 various 0.1– 0.5 Various Clearance (C), m various various T/3, T/5 T/4 various T/3
Solid Phase
Type sand and sodium
chloride ballotini Glasses various quartz Glass ballotini
Shape irregular spherical spherical spherical, flat and
irregular granular Spherical Size range (µm) 125–850 153–600 50–545 180–2800 100–2000 63–710 Density (kg/m3) 2600 & 2160 1480 2650 1050–2900 2520 2470
Load (%) Cw<20% w/w various 2–20 kg/m3 - (0 - 50) w/w Cv=4.3–48.5%
v/v Liquid Phase
Type water, acetone, oil
etc. water water/MgSO4 water water water Density (kg/m3) 790–1600 1000 1000 1000 1000 1000 Viscosity (Pas) 0.00031–0.0111 0.001 0.001 0.001 0.001 0.001
Measurement Technique
Power Consumption (P) - not mentioned - torque meter frictionless torque
table torque meter Critical Impeller Speed (Njs) visually visually visually visually visually visually

22
Table 2.2 Literature review summary2 (solids suspension)
Authors Ibrahim et al. Hicks et al. Bubbico et al. Ibrahim et al. Drewer et al. Selima et al. Year 1996 1997 1998 1999 2000 2008
Tank Specification Diameter (T), m 0.29 0.289 0.3 0.29 0.2, 0.4 0.97 Liquid Depth (L), m =T =T = 0.4T =T =T 1.34 Base Flat Flat elliptical Flat Flat Conical No. of Baffles 4 4 4 4 4 4 Baffled/Unbaffled Baffled Baffled Baffled Baffled Baffled Baffled
Impeller Specification
Type RT, 6MFU, 6MFD
etc. P-4, HE-3 various RT, 6MFU, 6MFD RT, PTD & Propeller PBT No. of Blades 3–6 3-4 3 & 6 3–6 3, 4 & 6 4 Diameter (D), m D/T=0.33–0.60 D/T=0.35 0.1 -0.15 D/T=0.33–0.60 0.33T 0.3 Clearance (C), m T/3, T/4 & T/6 T/4 0.15 T/3, T/4 & T/6 T/3 0.22T & 0.4T
Solid Phase
Type Glass ballotini &
bronze shot Sand, resin etc sand Glass ballotini Glass ballotini
Phosphate particles &
sands Shape irregular Spheres granular irregular spheres granular/spheres Size range (µm) 500–710 780-2950 1180–1400 600–710 63–710 74–300 Density (kg/m3) 2950–8450 1053-2590 2580 2470 2520 2650 Load (%) Cw<0.5% w/w Cw=10% w/w - Cw=0.5% w/w < 50% v/v 6–10% w/w
Liquid Phase Type Distilled water Water/Salt water water corn syrup Water water Density (kg/m3) 1000 1000 1000 / 1000 1000 Viscosity (Pas) 0.001 0.001 0.001 0.01–0.1 0.001 0.001
Measurement Technique
Power Consumption (P) torque meter strain gauge stroboscope & torque meter torque meter torque meter -
Critical Impeller Speed (Njs) visually visually visually visually visually pressure
23
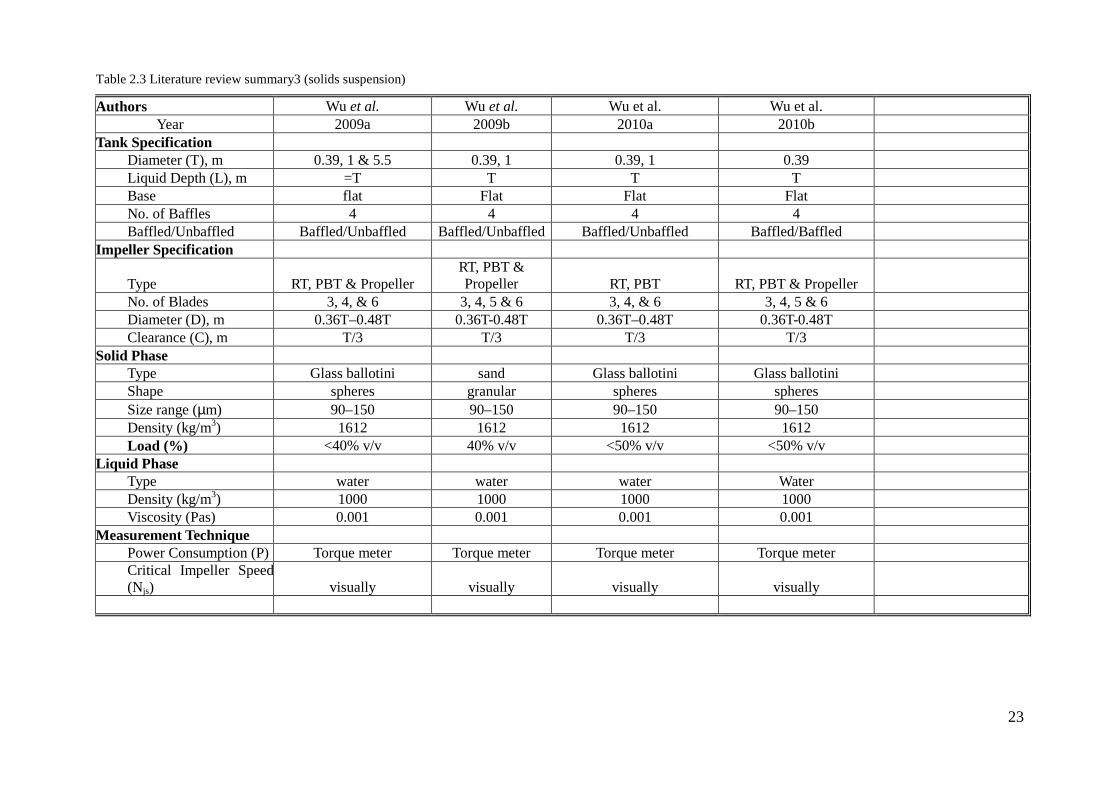
Table 2.3 Literature review summary3 (solids suspension)
Authors Wu et al. Wu et al. Wu et al. Wu et al. Year 2009a 2009b 2010a 2010b
Tank Specification Diameter (T), m 0.39, 1 & 5.5 0.39, 1 0.39, 1 0.39 Liquid Depth (L), m =T T T T Base flat Flat Flat Flat No. of Baffles 4 4 4 4 Baffled/Unbaffled Baffled/Unbaffled Baffled/Unbaffled Baffled/Unbaffled Baffled/Baffled
Impeller Specification
Type RT, PBT & Propeller RT, PBT & Propeller RT, PBT RT, PBT & Propeller
No. of Blades 3, 4, & 6 3, 4, 5 & 6 3, 4, & 6 3, 4, 5 & 6 Diameter (D), m 0.36T–0.48T 0.36T-0.48T 0.36T–0.48T 0.36T-0.48T Clearance (C), m T/3 T/3 T/3 T/3
Solid Phase Type Glass ballotini sand Glass ballotini Glass ballotini Shape spheres granular spheres spheres Size range (µm) 90–150 90–150 90–150 90–150 Density (kg/m3) 1612 1612 1612 1612 Load (%) <40% v/v 40% v/v <50% v/v <50% v/v
Liquid Phase Type water water water Water Density (kg/m3) 1000 1000 1000 1000 Viscosity (Pas) 0.001 0.001 0.001 0.001
Measurement Technique Power Consumption (P) Torque meter Torque meter Torque meter Torque meter Critical Impeller Speed (Njs) visually visually visually visually

24
CHAPTER
3.0
Experimental
25
Chapter 3
Experimental
This chapter describes the experimental set-up, methods and techniques used in this study.
The basic parameters measured were sedimentation bed height, critical impeller speed and,
impeller power consumption. The variables were impeller type, particle size, impeller
geometry factors such as number of blades and angle of blades, and fluid viscosity.
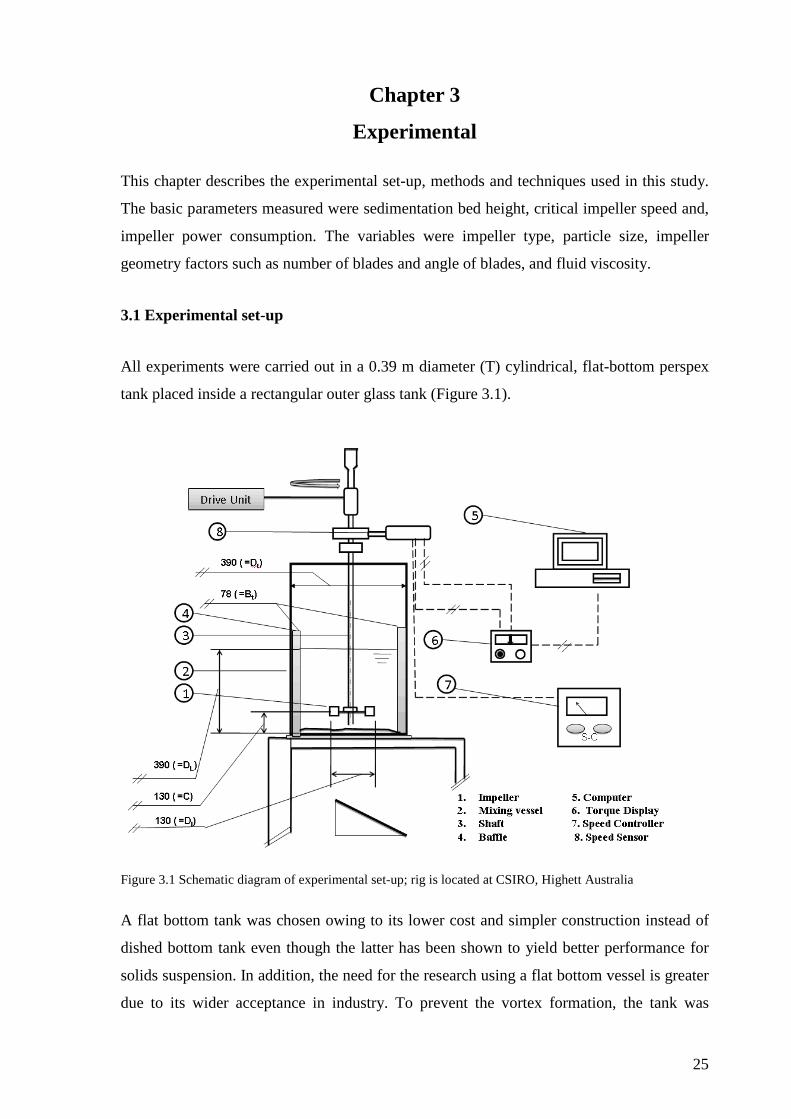
3.1 Experimental set-up
All experiments were carried out in a 0.39 m diameter (T) cylindrical, flat-bottom perspex
tank placed inside a rectangular outer glass tank (Figure 3.1).
Figure 3.1 Schematic diagram of experimental set-up; rig is located at CSIRO, Highett Australia
A flat bottom tank was chosen owing to its lower cost and simpler construction instead of
dished bottom tank even though the latter has been shown to yield better performance for
solids suspension. In addition, the need for the research using a flat bottom vessel is greater
due to its wider acceptance in industry. To prevent the vortex formation, the tank was

26
equipped with four full baffles (B/T=1/12) expanding all the way to the vessel bottom and
spaced 90o apart.
Table 3.1 Mixing vessel dimensions
Vessel description Dimension (m) Relation to tank diameter
Tank diameter, T 0.39 T
Baffle width, B 0.039 T/10
Liquid height, HL 0.39 T
Impeller clearance, C 0.13 T/3
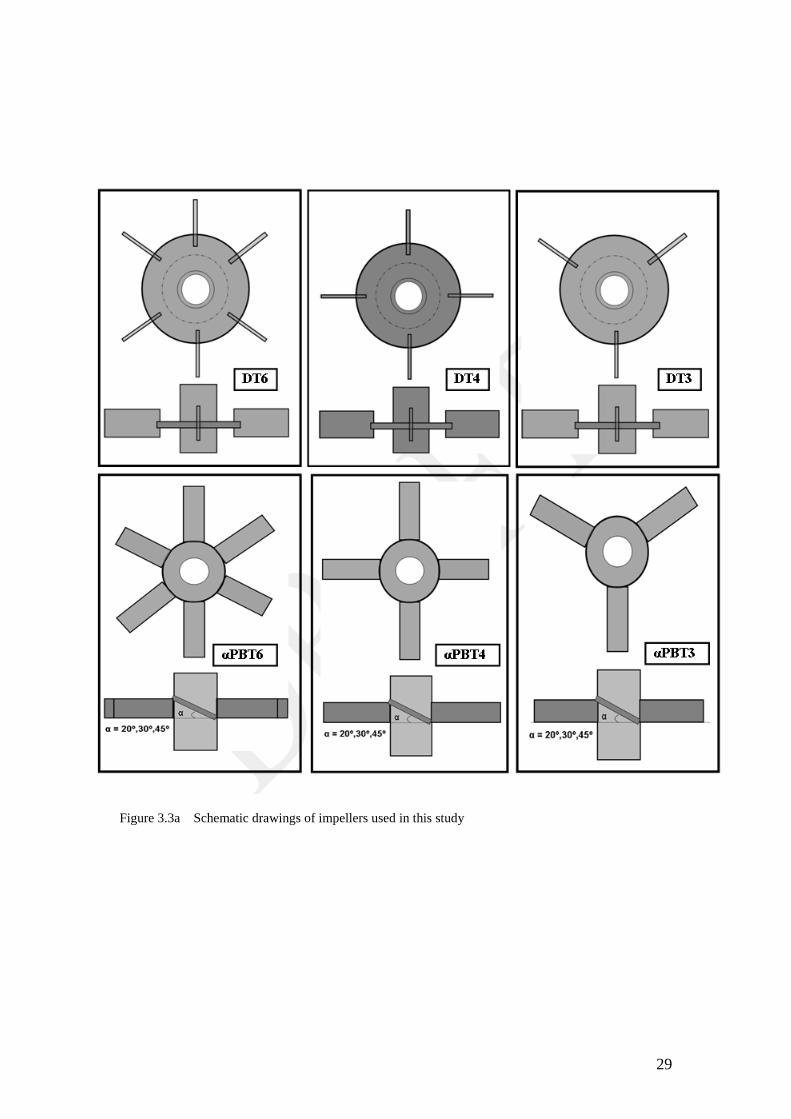
Particle suspension was studied using three types of impellers: Rushton disk turbine (DT),
pitch-bladed downward pumping turbine (PBT) and Lightnin impeller (A310). For
convenience, notations in the brackets will be used throughout the thesis to represent the
impellers. Specifications of the impellers are given in Table 3.2. Detailed drawings of three
representative impellers can be seen in Figure 3.2. Figures 3.3a and 3.3b show the impeller
geometry details. Impellers were mounted on a central shaft equipped with an Ono Sokki
torque transducer and speed detector. Agitation was provided by impeller(s) mounted on
the shaft driven by a motor. The speed of the shaft can be varied using a variable frequency
drive. The motor was capable of operating at a maximum speed of 1500 rpm. A mechanical
tachometer was used to confirm the accuracy of the impeller speed values.
Off-bottom impeller clearance C, the distance from the tank base to the impeller, was
maintained at T/3 for all experiments. C is an extremely important variable when
considering the interaction between suspended solids and the suspending fluid. Zwietering
et al. (1958) and Nienow et al. (1968) have indicated that Njs increases with an increase in
the off-bottom impeller clearance, leading to an increase in power consumption. The effect
of off-bottom clearance is not our concern in this study thus it was set at a constant value
(C=T/3).

27
Table 3.2 Impeller specifications (power number measured in water)
Impeller
ID
Full Name Flow Pattern
No. of
Blades
Blade to impeller diameter
ratio (t/W)
Impeller diameter to tank
diameter ratio (D/T)
Impeller Power No.
(Np)
DT6 6-bladed disc turbine Radial 6 0.125 0.41 5.598
DT4 4-bladed disc turbine Radial 4 0.125 0.41 4.140
DT3 3-bladed disc turbine Radial 3 0.125 0.41 3.172
30PBT6 30o pitched 6-bladed
turbine
Mixed 6 0.125 0.41 0.720
20PBT4 20o pitched 4-bladed
turbine
Mixed 4 0.125 0.41 0.267
30PBT4 30o pitched 4- bladed
turbine
Mixed 4 0.125 0.41 0.664
45PBT4 45o pitched 4- bladed
turbine
Mixed 4 0.125 0.41 1.220
30PBT3 30o pitched 3- bladed
turbine
Mixed 3 0.125 0.41 0.530
A310 hydrofoil Axial 3 0.125 0.41 0.530
A310 hydrofoil Axial 3 0.125 0.46 0.535

28
DT6 45PBT4 A310
Figure 3.2 Schematic drawings of impellers used in this study (DT6: Disc turbine; 45PBT4: pitch-bladed turbine; A310: hydrofoil)
29
Figure 3.3a Schematic drawings of impellers used in this study

30
Figure 3.3b Impeller geometry definition: radial disc turbines and pitch-bladed turbines

31
Nowadays, many industrial agitated vessels are usually equipped with multiple
impellers to provide even distribution of shear and energy dissipation rates. To look at
the effect of an additional impeller, experiments were carried out in this study with
such geometrical configuration. Previous studies indicated that variation in Njs with
number of impellers is significantly affected by the spacing between impellers, which
consequently affects the liquid phase (and slurry phase) flow pattern and energy
dissipated by the impellers. Since the effect of impeller spacing is not covered in our
study, the second impeller was always placed above the first impeller and the distance
between the two was maintained 160 mm. The dual impeller arrangement used in this
work is shown in Figure 3.4.
Figure 3.4 Schematic diagram of a dual impeller system
160
130
D=160
390
32
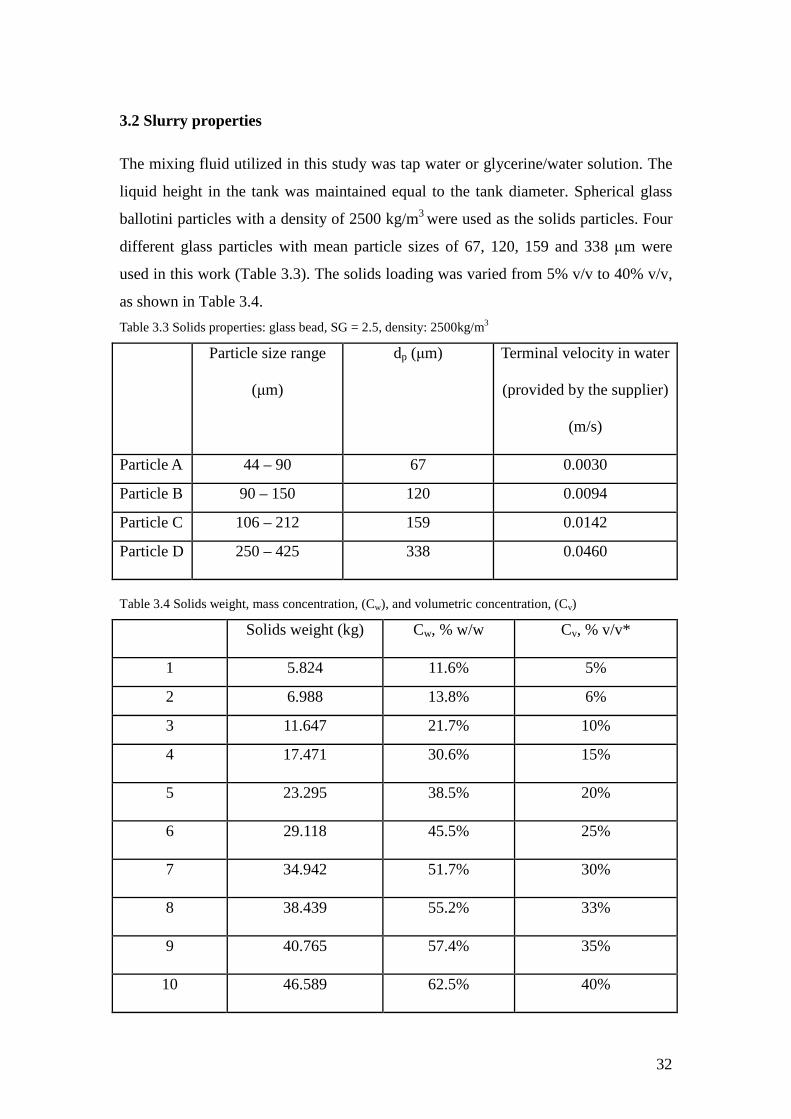
3.2 Slurry properties
The mixing fluid utilized in this study was tap water or glycerine/water solution. The
liquid height in the tank was maintained equal to the tank diameter. Spherical glass
ballotini particles with a density of 2500 kg/m3 were used as the solids particles. Four
different glass particles with mean particle sizes of 67, 120, 159 and 338 µm were
used in this work (Table 3.3). The solids loading was varied from 5% v/v to 40% v/v,
as shown in Table 3.4.
Table 3.3 Solids properties: glass bead, SG = 2.5, density: 2500kg/m3
Particle size range
(µm)
dp (µm) Terminal velocity in water
(provided by the supplier)
(m/s)
Particle A 44 – 90 67 0.0030
Particle B 90 – 150 120 0.0094
Particle C 106 – 212 159 0.0142
Particle D 250 – 425 338 0.0460
Table 3.4 Solids weight, mass concentration, (Cw), and volumetric concentration, (Cv)
Solids weight (kg) Cw, % w/w Cv, % v/v*
1 5.824 11.6% 5%
2 6.988 13.8% 6%
3 11.647 21.7% 10%
4 17.471 30.6% 15%
5 23.295 38.5% 20%
6 29.118 45.5% 25%
7 34.942 51.7% 30%
8 38.439 55.2% 33%
9 40.765 57.4% 35%
10 46.589 62.5% 40%
33
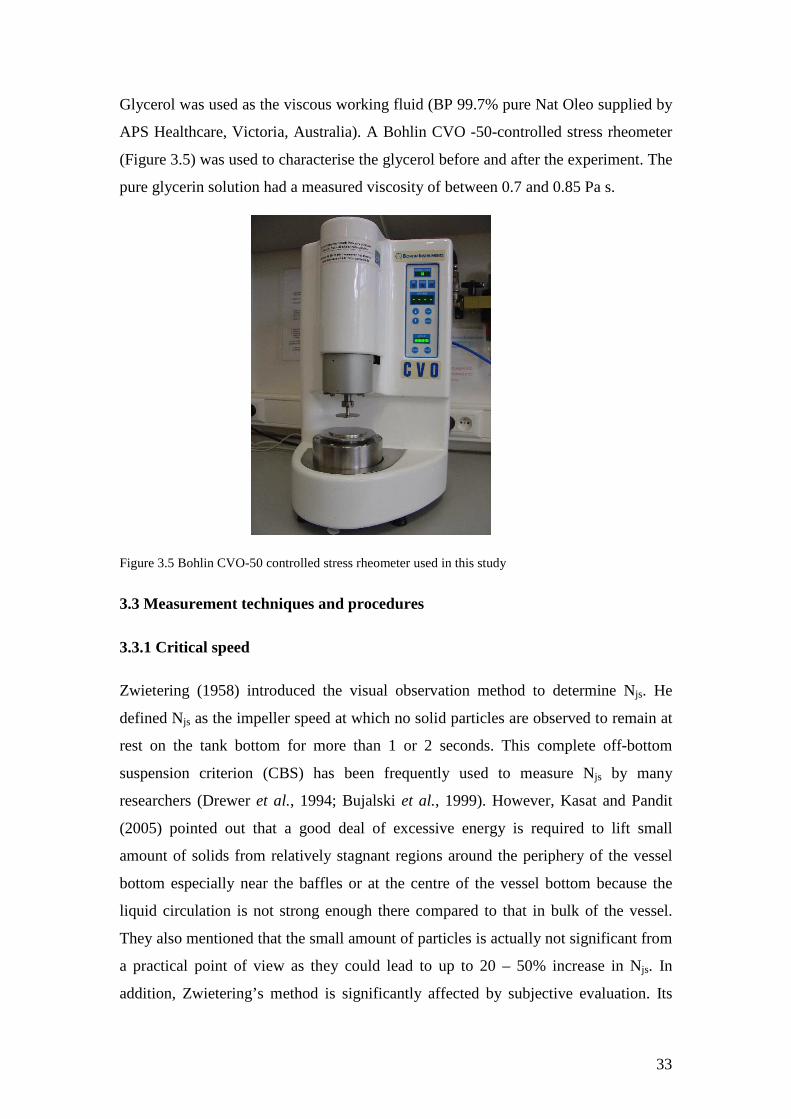
Glycerol was used as the viscous working fluid (BP 99.7% pure Nat Oleo supplied by
APS Healthcare, Victoria, Australia). A Bohlin CVO -50-controlled stress rheometer
(Figure 3.5) was used to characterise the glycerol before and after the experiment. The
pure glycerin solution had a measured viscosity of between 0.7 and 0.85 Pa s.
Figure 3.5 Bohlin CVO-50 controlled stress rheometer used in this study
3.3 Measurement techniques and procedures
3.3.1 Critical speed
Zwietering (1958) introduced the visual observation method to determine Njs. He
defined Njs as the impeller speed at which no solid particles are observed to remain at
rest on the tank bottom for more than 1 or 2 seconds. This complete off-bottom
suspension criterion (CBS) has been frequently used to measure Njs by many
researchers (Drewer et al., 1994; Bujalski et al., 1999). However, Kasat and Pandit
(2005) pointed out that a good deal of excessive energy is required to lift small
amount of solids from relatively stagnant regions around the periphery of the vessel
bottom especially near the baffles or at the centre of the vessel bottom because the
liquid circulation is not strong enough there compared to that in bulk of the vessel.
They also mentioned that the small amount of particles is actually not significant from
a practical point of view as they could lead to up to 20 – 50% increase in Njs. In
addition, Zwietering’s method is significantly affected by subjective evaluation. Its

34
repeatability is also low due to the complicated flow pattern in solid-liquid systems,
particularly under high solids loading conditions (20 ~ 40% v/v).
Figure 3.6 Visual method that was used to determine Njs
In this work, a method proposed by Hicks et al. (1997) was used to determine Njs. In
this method, the bed height of the solids settled at the tank bottom is used as a means
of determining Njs. To determine Njs according to this method, the impeller speed is
initially increased to a sufficiently high value so that no particles remain stationary at
the tank bottom. In this condition, all particles are moving freely within the liquid and
the suspension concentration is not necessarily uniform (Figure 3.6a). The impeller
speed is then decreased gradually until a thin layer of solid bed appears at the tank
bottom (Figure 3.6b). The impeller speed is then increased slightly until the settled
bed disappears. The speed at which the solid bed disappears is designated as Njs. The
impeller speed has to be varied up and down a few times before a consistent reading
for Njs is obtained. If the impeller speed is decreased below Njs, a visible solid bed
appears whose height is designated as Hb (Figures 3.6c and 3.6d). In this study, the
bed height recorded as an average sedimentation height using the fillet formed along
the tank wall was typically measured at a point in the middle of two consecutive
baffles1. The impeller speed was varied up and down around Njs to just check the
reproducibility of Njs values. Moreover, when the solid concentration is high,
measuring Njs by increasing the impeller speed from low to high will not lead to
accurate measurements due to particle packing effect which will influence the
suspension behaviour. The repeatability of Njs values measured using above method
was found to be within ± 2 rpm. The ratio of settled bed height (Hb) and total liquid
1 Note this sedimentation height refers to the sedimentation at the wall; this measurement approach works for agitator systems where sedimentation starts at the tank fillet region.
HB HB
NJS Nb Nc
Na
Na>NJS>Nb>Nc
(a) (b) (c) (d)

35
height (T) is plotted against the impeller speed in Figure 3.7 for a baffled tank
operated with different impellers to suspend solids at a concentration of 20% (v/v). It
can be seen that the normalized solids bed height (HB/T) is zero at Njs and it increases
with a decrease in impeller speed. This method of using settled solids height for
determining Njs has been demonstrated to be quite reliable for suspensions with high
solids concentrations (Wu et al., 2002; Wu et al., 2009a, b)
Figure 3.7 Solids bed height as a function of impeller speed for axial flow impeller (A310) at different solids concentrations. T = 0.39, D/T = 1/3. Arrows indicate just-off-bottom suspension speed.
3.3.2 Impeller power draw measurement The absolute torque Ta experienced by the impeller shaft was measured using the
torque transducer and determined according to the following equation:
rma TTT −= (1)
where Tm is the torque measured during the experiments and Tr represents the residual
torque due to mechanical friction in bearing, which is determined by operating the
impeller without the fluid and solid in the tank. The power consumption in the
agitation system can now be determined as:
)(22 rma TTNTNP −== ππ (2)

36
where P is the impeller power draw (W) and N is the impeller rotational speed in
revolutions per second (rps).
The impeller shaft torque was measured utilizing the Ono Sokki torque transducer. A
wide range of torques could be measured using a torque detector attached to the
impeller shaft. The torque detector used in this study is shown in Figure 3.8 and its
specifications are presented in Table 3.5
Figure 3.8 Ono Sokki torque detector, SS series for rotating and stationary shafts
Table 3.5 Specifications of Ono Sokki torque detector
Accuracy ± 0.2% ~± 0.5% full scale
Operating temperature 0oC to + 50oC
Measurement range 1 N.m
Minimum resolution 1 mN.m
Revolution range 0 to 6000 rpm
Moment of inertia 4.25 x 10⁻⁵ kgm2
Spring constant 8.24 x 10 Nm/rad

37
The output signal from the detector was monitored from the display, Ono Sokki
TS-2700, shown in Figure 3.9. The accuracy of measurement is within ± 0.5%.
Figure 3.9 TS-3200 Torque converter used in the experiment
3.3.3 Specific power consumption
Specific power consumption (power per solids mass) ε (W/kg) is defined here to
compare the energy efficiency in suspending solids for various designs and
operational conditions. A lower specific power input, represents less energy required
for suspending a given unit mass of solids in an agitation tank, hence it is more energy
efficient in the context of this study. The specific power consumption at
“just-suspended” condition is defined as follows:
s
rmjsJS M
TTN )(2 −=
πε (3)
where Ms (kg) is the mass of solids suspended in the agitation system.

38
CHAPTER
4.0
Optimum Solids Concentration for
Particle Suspension in Mechanically
Agitated Vessels

39
Chapter 4
Optimum Solids Concentration for Particle Suspension in
Mechanically Agitated Vessels
4.1 Introduction
Researchers have focused on determining various ways to minimise energy consumption in
slurry handling mixing tanks. One of them is to implement different tank geometries. Kasat
and Pandit (2005) suggested that the choice of a proper impeller to satisfy the requirement
of solids suspension with minimum power requirement is the key to successful and
economic solution to the process. Wu et al., (2009a) found that the removal of baffles can
play an effective role in drastically reducing the power draw for suspending the particles off
the tank bottom. They found that an energy saving of about 70% can be achieved under
high solids loading (>0.40 v/v) under unbaffled conditions. They also demonstrated that
under unbaffled conditions, axial impellers are more energy intensive than radial impellers,
which is contradictory to conventional findings (Zweitering, 1958). Despite these studies,
there is a lack of understanding on impeller power consumption for solids suspension in
agitated vessels especially for those handling high-concentration slurries (> 0.20 v/v). Most
of the previous studies have used a narrow range of solids concentrations (0.01–0.20 v/v)
(Wu et al., 2002).
Specific power input has been used to evaluate the solids-suspension operation in mixing
vessels but most of the previous work considered the impeller power input on the basis of
the volume of vessel or reactor (Drewer et al., 1994; Wu et al., 2002). However, Drewer et
al., (2000) suggested that, except for processes such as crystallization, which requires
suspension homogeneity, the rate of mass transfer or reaction is independent of agitation
and the vessel volume once the suspension of solids is achieved. They suggested that for
such processes, the reaction rate is controlled by solid surface area, and the volume of the
reactor does not play a critical role. Based on that consideration, they have used the specific
power input expressed on the basis of total mass of solids suspended (Pjs/Ms) to evaluate
their experimental data. They reported that when the specific power calculated in this way
is plotted against solids concentration, an optimum solids concentration exists around 30%

40
(v/v) at which the specific power input is a minimum. This finding was reported for all the
impeller types used by the authors. This result is quite consistent with the results reported
by Ragav Rao et al. (1998), who found that (Pjs/Ms) has a decreasing trend with an increase
in solids concentration. They found that less power input is required to suspend 6.6 wt%
solids compared to that for 0.34 wt% solids.
Expressing the impeller power draw at Njs on the basis of total solids mass as was done by
Drewer et al. (2000) is logical considering that in many processes such as leaching and
digestion, the rate of reaction is largely influenced by the specific surface area of the solids.
Therefore, it is appropriate to use the specific power expressed on the basis of mass of
suspended solids to determine the optimum solids concentration to be used in reactors.
Since the attempt of Drewer et al., this approach to determine the optimum solids
concentration has not been used in many studies and therefore warrants further
investigation. Furthermore, Drewer et al.’s work focused mainly on solids suspension in
baffled tanks. Considering that removing baffles leads to a reduction in impeller power
draw for solids suspension as shown by Wu et al. (2009a), it will be interesting to
investigate the relationship between (Pjs/Ms) and solids concentration in unbaffled tanks. In
addition, it will be useful to investigate the effects of variables such as particle size,
impeller type and number of impellers on (Pjs/Ms). This chapter seeks to address the above-
mentioned goals by determining the effect of solids loading on (Pjs/Ms). In the rest of the
chapter and thesis, (Pjs/Ms) will be denoted by εjs for purpose of simplicity. The solids
concentration was varied from 0.05 to 0.45 (v/v). The results are applicable to the overall
goal of developing optimum industrial agitator designs to minimize the power consumption
for suspending unit mass of solid particles in tanks, where the off-bottom solids suspension
is a limiting factor.
4.2 Results
4.2.1 Effect of solids concentration on specific power
Wu et al. (2002) reported that the maximum solids concentration achievable in a mixing
tank should be less than the sedimentation bed concentration, Cvb. It was found that Cvb =
0.58 for spherical glass particles, measured immediately after solids were fully settled.
Figure 4.1 shows a typical example of a plot which shows the agitation power per unit
slurry volume (Pjs/Vol) required to just suspend spherical glass particles off the tank

41
bottom, as a function of solids concentration. The impeller used was a down-pumping 30o
pitched blade impeller. As is expected, the power required to suspend solids increases with
solids concentration. It can be seen that the (Pjs/V) increases gradually with increase in
concentration up to 0.3 v/v and thereafter it increases rapidly as the concentration
approaches 0.50 v/v, approaching the packing coefficient, 0.58 v/v estimated by Wu et al.,
(2002).
0.00
0.20
0.40
0.60
0.80
1.00
1.20
0 0.1 0.2 0.3 0.4 0.5Cv (v/v)
Pjs
/Vo
l (kW
/m3 )
Figure 4.1 Pjs/V vs. solids concentration, solids: glass particles of d = 0.12 mm, fluids: tap water. Impeller: 30PBT6. D = 0.160m. Tank configured in the baffled condition.
The extremely high power required at high Cv has been attributed to the high energy loss
due to particle-liquid frication, particle–particle collisions and particle-equipment collisions
at high-solids concentration (Bubbico et al., 1998).
Figure 4.2 shows the plot of experimental εjs (=Pjs/Ms) data as a function of the solids
concentration for down-pumping 30o pitched blade impeller. It is interesting to note that the
εjs does not increase with solids concentration as is usually expected. Instead, εjs decreases
with increase in solids concentration until a critical value of 0.25 v/v is reached. Beyond the
critical value, it begins to increase again.
It is also interesting to see that specific power εjs at 0.05 v/v is three times greater than that
at the critical solids concentration, 0.25 v/v. This suggests that operating the process at a
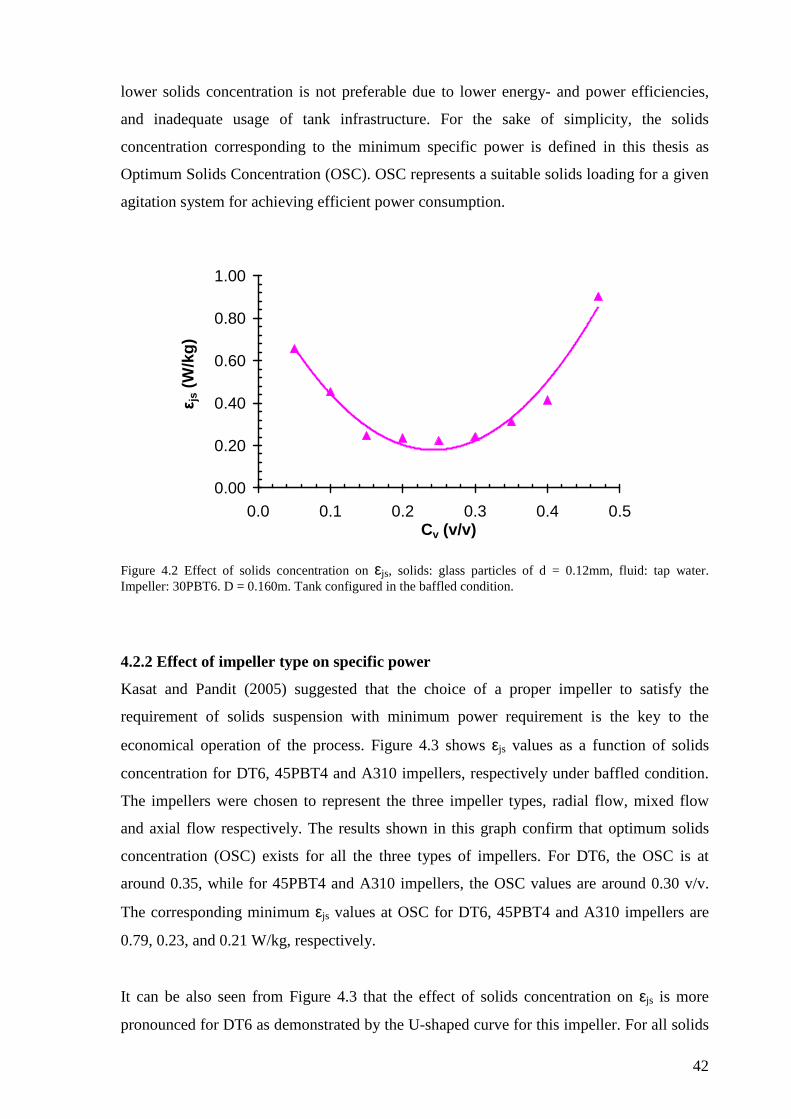
42
lower solids concentration is not preferable due to lower energy- and power efficiencies,
and inadequate usage of tank infrastructure. For the sake of simplicity, the solids
concentration corresponding to the minimum specific power is defined in this thesis as
Optimum Solids Concentration (OSC). OSC represents a suitable solids loading for a given
agitation system for achieving efficient power consumption.
0.00
0.20
0.40
0.60
0.80
1.00
0.0 0.1 0.2 0.3 0.4 0.5Cv (v/v)
εjs (
W/k
g)
Figure 4.2 Effect of solids concentration on εjs, solids: glass particles of d = 0.12mm, fluid: tap water. Impeller: 30PBT6. D = 0.160m. Tank configured in the baffled condition.
4.2.2 Effect of impeller type on specific power
Kasat and Pandit (2005) suggested that the choice of a proper impeller to satisfy the
requirement of solids suspension with minimum power requirement is the key to the
economical operation of the process. Figure 4.3 shows εjs values as a function of solids
concentration for DT6, 45PBT4 and A310 impellers, respectively under baffled condition.
The impellers were chosen to represent the three impeller types, radial flow, mixed flow
and axial flow respectively. The results shown in this graph confirm that optimum solids
concentration (OSC) exists for all the three types of impellers. For DT6, the OSC is at
around 0.35, while for 45PBT4 and A310 impellers, the OSC values are around 0.30 v/v.
The corresponding minimum εjs values at OSC for DT6, 45PBT4 and A310 impellers are
0.79, 0.23, and 0.21 W/kg, respectively.
It can be also seen from Figure 4.3 that the effect of solids concentration on εjs is more
pronounced for DT6 as demonstrated by the U-shaped curve for this impeller. For all solids

43
concentration (0.05–0.4 v/v), εjs values are the highest for DT6 followed by those for
45PBT4. A310 has the lowest εjs values. A relatively flat curve observed for A310 suggests
that the effect of solids concentration on εjs is not as significant for this impeller as those for
the other two impellers.
Figure 4.4 shows εjs values as a function of solids concentration for the three impellers
under unbaffled condition. These results also confirm that OSC exists for the three
impellers under unbaffled condition. However, it is interesting to see that the six-bladed
turbine DT6 (Np = 5.6) is more energy efficient than the four-bladed turbine 45PBT4 (Np =
1.220) and three-bladed hydrofoil impeller A310 (Np=0.32) irrespective of the solids
concentration. While the difference in εjs values for the impellers is obvious at low-solids
concentrations (<0.2 v/v), the difference becomes marginal as Cv approaches 0.4 v/v. At Cv
= 0.4 v/v, the three impellers consume approximately the same amount of power.

44
0.00
0.50
1.00
1.50
0.0 0.1 0.2 0.3 0.4 0.5Cv (v/v)
εjs
(W
/kg
)DT6, D/T=0.4145PBT4, D/T=0.41A310, D/T=0.41
Figure 4.3 Effect of impeller type on εjs, solids: glass particles of d = 0.12mm, fluid: tap water. D = 0.160m. Tank configured in the baffled condition.
0.00
0.50
1.00
1.50
0.0 0.1 0.2 0.3 0.4 0.5Cv (v/v)
εjs (
W/k
g)
DT6, D/T=0.4145PBT4, D/T=0.41A310, D/T=0.41
Figure 4.4 Effect of impeller type on εjs, solids: glass particles of d = 0.12mm, fluid: tap water. D = 0.160m. Tank configured in the unbaffled condition.
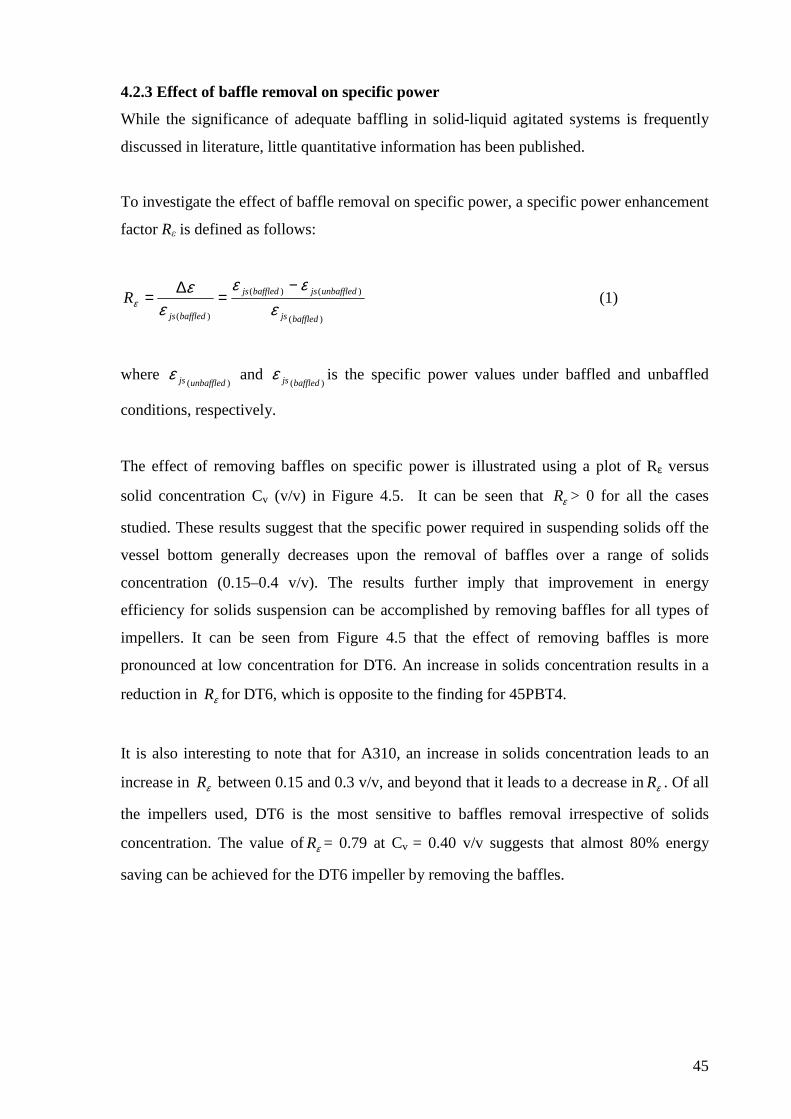
45
4.2.3 Effect of baffle removal on specific power
While the significance of adequate baffling in solid-liquid agitated systems is frequently
discussed in literature, little quantitative information has been published.
To investigate the effect of baffle removal on specific power, a specific power enhancement
factor Rε is defined as follows:
)(
)()(
)( baffledjs
unbaffledjsbaffledjs
baffledjs
Rε
εεε
εε
−=∆= (1)
where )(unbaffledjsε and
)(baffledjsε is the specific power values under baffled and unbaffled
conditions, respectively.
The effect of removing baffles on specific power is illustrated using a plot of Rε versus
solid concentration Cv (v/v) in Figure 4.5. It can be seen that εR > 0 for all the cases
studied. These results suggest that the specific power required in suspending solids off the
vessel bottom generally decreases upon the removal of baffles over a range of solids
concentration (0.15–0.4 v/v). The results further imply that improvement in energy
efficiency for solids suspension can be accomplished by removing baffles for all types of
impellers. It can be seen from Figure 4.5 that the effect of removing baffles is more
pronounced at low concentration for DT6. An increase in solids concentration results in a
reduction in εR for DT6, which is opposite to the finding for 45PBT4.
It is also interesting to note that for A310, an increase in solids concentration leads to an
increase in εR between 0.15 and 0.3 v/v, and beyond that it leads to a decrease inεR . Of all
the impellers used, DT6 is the most sensitive to baffles removal irrespective of solids
concentration. The value ofεR = 0.79 at Cv = 0.40 v/v suggests that almost 80% energy
saving can be achieved for the DT6 impeller by removing the baffles.

46
0
0.2
0.4
0.6
0.8
1
0.0 0.1 0.2 0.3 0.4 0.5Cv (v/v)
Rε
DT645PBT4A310
Figure 4.5 Specific power enhancement factor Rε vs. solids concentration, at just-off-bottom solids suspension condition. Solids: glass particles of d = 0.12 mm, fluid: tap water.
4.2.4 Effect of impeller dimension (D/T) on specific power
The solids suspension in agitated vessels relies on both liquid flow and turbulence. It is
expected that the turbulence intensity decays along the length of the flow path. An increase
in the impeller diameter results in less decay in the turbulence owing to a reduction in path
length. On the other hand, a decrease in impeller diameter will result in the reduction of
liquid velocity. Raghava Rao et al. (1988) suggested that the overall effect of increased
impeller diameter is the increased liquid velocity and the lesser decay in turbulence.
Figures 4.6 and 4.7 show the effect of impeller diameter on εjs under baffled and unbaffled
conditions, respectively for two Lightnin A310 impellers with diameters of 0.16 and 0.18
m. Experiments were conducted at solids concentrations ranging from 0.1 to 0.4 v/v. Under
baffled condition, that the effect of impeller diameter is insignificant on εjs at relatively high
solids concentrations (Cv > 0.30). This is consistent with previous results reported by Wu et
al. (2009b). However, at lower solids concentration, it can be seen that εjs required for the
smaller diameter impeller is lower.
Under unbaffled condition (Figure 4.7), an increase in impeller diameter leads to a
reduction ( %3≈ ) in εjs over a wide range of solids concentrations. The parallel curves

47
indicate that the ratio of power consumption for two impellers with different diameters is
fairly constant with increase in solids concentration under unbaffled condition.
0.00
0.10
0.20
0.30
0.40
0.50
0 0.1 0.2 0.3 0.4 0.5Cv (v/v)
εjs (
W/k
g)
A310 (D/T=0.46)
A310 (D/T=0.41)
Figure 4.6 Effect of impeller diameter on εjs, solids: glass particles of d = 0.12mm, fluid: tap water. Impeller: A310. Tank configured in the baffled condition.
0.00
0.10
0.20
0.30
0.40
0.50
0.0 0.1 0.2 0.3 0.4 0.5Cv (v/v)
εjs
(W
/kg
)
A310(D/T=0.46)
A310(D/T=0.41)
Figure 4.7 Effect of impeller diameter on εjs, solids: glass particles of d = 0.12mm, fluid: tap water. Impeller: A310. Tank configured in the unbaffled condition.

48
4.2.5 Effect of multiple impellers on specific power
Many industrial-agitated vessels are equipped with multiple impellers mainly to ensure
even distribution of shear and energy dissipation rates. The specific power data for dual
Lightnin A310 impellers (D/T=0.41) and one single A310 (D/T=0.41) are shown in Figure
4.8 as a function of Cv (v/v) under unbaffled condition. It is interesting to note that the
optimum value for dual A310 is also 0.33 (v/v), which is identical to that of single A310
impeller with same diameter. It can be seen that concentrations below 0.3 v/v (< 0.3 v/v),
the presence of an additional impeller results in more power input due to the interference of
flow patterns generated by both impellers (Armenate and Li, 1993; Nocentiti,1988; Dutata
and Pangakar, 1994). However, results in this study show that, at optimum solids
concentration of 0.33 v/v, εjs can be reduced using an additional impeller. The mechanism
behind this result is not clear. It could be attributed to experimental error or torque
fluctuation. However, it can be said that the increase in power due to the presence of an
additional impeller is marginal (< 3%) at high solids concentration. This finding has to be,
however, verified for other impeller types under baffled condition as well. Details with
respect to the effect of dual impellers on specific power at high solids concentration under
baffled and unbaffled conditions are shown in Chapter 5.
0.0
0.1
0.2
0.3
0.4
0.5
0.6
0.7
0.0 0.1 0.2 0.3 0.4 0.5Cv (v/v)
εjs
(W
/kg
)
A310, D/T=0.41
Dual A310, D/T=0.41
Figure 4.8 Effect of dual impellers on εjs, solids: glass particles of d = 0.12 mm, fluids: tap water. Impeller: A310.. Tank configured in the unbaffled condition.
49
4.2.6 Effect of particle size on specific power
With an increase in particle size, the settling velocity of the particle increases. Therefore it
can be expected that a higher degree of agitation (i.e. power), resulting in a higher average
liquid velocity or higher degree of turbulence is required to suspend the particles. Under
unbaffled condition, the influence of particle size on εjs for the three impellers is shown in
Figures 4.9, 4.10 and 4.11. From these results, it can be concluded that an increase in
particle size results in an increase in power consumption, irrespective of the impeller type
and solids concentration. This is because larger particles settle faster and more power is
required to create stronger upward fluid velocity to keep the particles circulating.
Figure 4.12 summarizes the influence of particle size on optimum solids concentration and
the corresponding specific power. Experimental results obtained in this study imply that
optimum solids concentration is not affected by the impeller type for a given dp under
unbaffled condition. It can be seen that optimum solids concentration decreases with an
increase in particle size, irrespective of the impeller used. Also, the specific power
increases dramatically with an increase in particle size.
Drewer et al. (2000) evaluated the effect of particle size on specific power in a baffled tank
and they reported that optimum solids concentration is not affected by particle size. They
also found that an increase in particle size result in higher power consumption at the just-
suspended condition.

50
0.00
0.20
0.40
0.60
0.80
1.00
0.0 0.1 0.2 0.3 0.4 0.5Cv (v/v)
εjs
(W
/kg
)dp=120 µmdp=159 µmdp=337.5 µm
Figure 4.9 Effect of particle size on εjs for radial flow impeller (DT6), solids: glass particles, fluid: tap water. Impeller: DT6. D = 0.160 m. Tank configured in the unbaffled condition.
0.00
0.20
0.40
0.60
0.80
1.00
0.0 0.1 0.2 0.3 0.4 0.5Cv (v/v)
εjs
(W
/Kg
)
dp=120 µmdp=159 µmdp=337.5 µm
Figure 4.10 Effect of particle size on εjs for mixed flow impeller (45PBT4), solids: glass particles, fluid: tap water. Impeller: 45PBT4. D = 0.160 m. Tank configured in the unbaffled condition.

51
0.00
0.20
0.40
0.60
0.80
1.00
0.0 0.1 0.2 0.3 0.4 0.5Cv (v/v)
εjs
(W
/kg
)
dp=120 µmdp=159 µmdp=337.5 µm
Figure 4.11 Effect of particle size on εjs for axial flow impeller (A310), solids: glass particles, fluid: tap water. Impeller: A310. D = 0.160 m. Tank configured in the unbaffled condition.
0.00
0.20
0.40
0.60
0.80
1.00
120 159 337.5Particle Size (µm)
εjs (
W/k
g)
0.0
0.2
0.4
0.6
0.8
1.0
Op
tim
um
So
lid C
on
cen
trat
ion
DT6, Pjs/M45PBT4, Pjs/MA310, Pjs/MOptimum Solid Concentration
Figure 4.12 Minimum power consumption, optimum solids concentration vs. particle size, at just-off-bottom solids suspension condition under unbaffled condition , fluid: tap water.
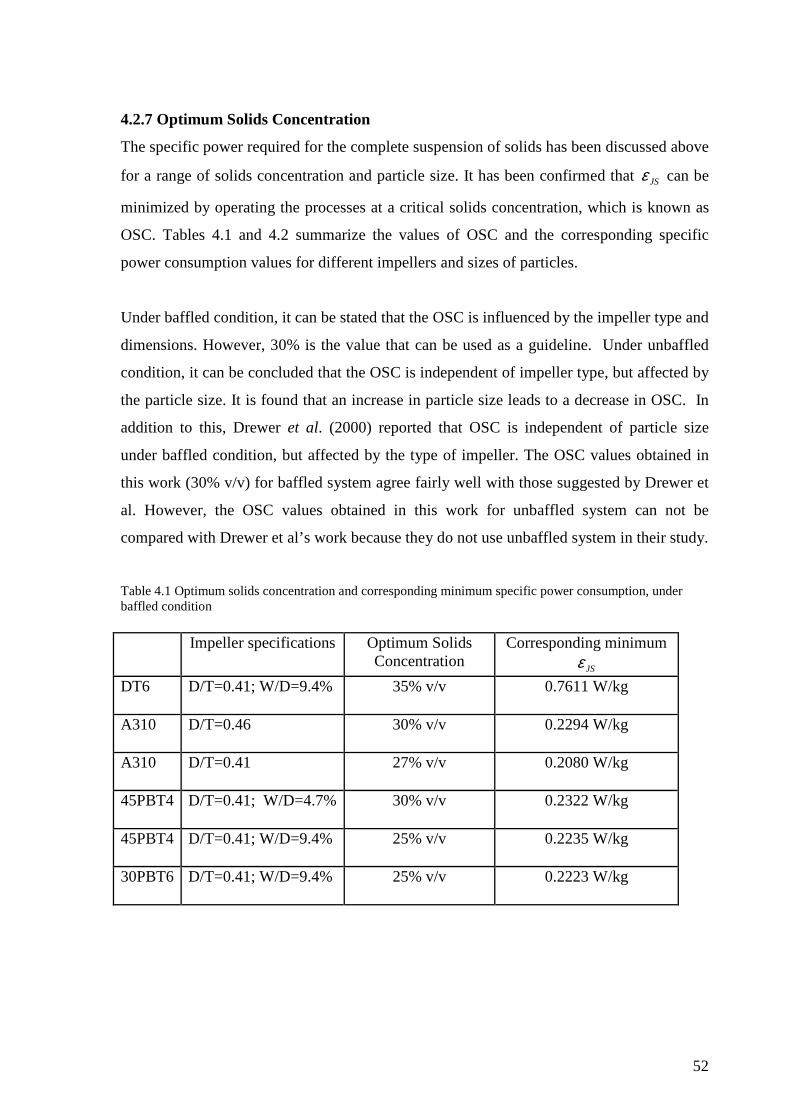
52
4.2.7 Optimum Solids Concentration
The specific power required for the complete suspension of solids has been discussed above
for a range of solids concentration and particle size. It has been confirmed that JSε can be
minimized by operating the processes at a critical solids concentration, which is known as
OSC. Tables 4.1 and 4.2 summarize the values of OSC and the corresponding specific
power consumption values for different impellers and sizes of particles.
Under baffled condition, it can be stated that the OSC is influenced by the impeller type and
dimensions. However, 30% is the value that can be used as a guideline. Under unbaffled
condition, it can be concluded that the OSC is independent of impeller type, but affected by
the particle size. It is found that an increase in particle size leads to a decrease in OSC. In
addition to this, Drewer et al. (2000) reported that OSC is independent of particle size
under baffled condition, but affected by the type of impeller. The OSC values obtained in
this work (30% v/v) for baffled system agree fairly well with those suggested by Drewer et
al. However, the OSC values obtained in this work for unbaffled system can not be
compared with Drewer et al’s work because they do not use unbaffled system in their study.
Table 4.1 Optimum solids concentration and corresponding minimum specific power consumption, under baffled condition Impeller specifications Optimum Solids
Concentration Corresponding minimum
JSε
DT6
D/T=0.41; W/D=9.4% 35% v/v 0.7611 W/kg
A310
D/T=0.46 30% v/v 0.2294 W/kg
A310
D/T=0.41 27% v/v 0.2080 W/kg
45PBT4
D/T=0.41; W/D=4.7% 30% v/v 0.2322 W/kg
45PBT4
D/T=0.41; W/D=9.4% 25% v/v 0.2235 W/kg
30PBT6
D/T=0.41; W/D=9.4% 25% v/v 0.2223 W/kg

53
Table 4.2 Optimum solids concentration and corresponding minimum specific power consumption, under unbaffled condition
Impeller specification
dp
Optimum Solids Concentration
Corresponding minimum
JSε
DT6 D/T=0.41; W/D=9.4%
120 µm 33% v/v 0.1280 W/kg
DT6 D/T=041; W/D=9.4%
159 µm 25% v/v 0.1412 W/kg
DT6 D/T=0.41; W/D=9.4%
338 µm 20% v/v 0.4356 W/kg
A310 D/T=0.41 120 µm 33% v/v 0.1824 W/kg
A310 D/T=0.46 120 µm 33% v/v 0.1669 W/kg
Dual A310
D/T=0.41 120 µm 33% v/v 0.1718 W/kg
A310 D/T=0.41 159 µm 25% v/v 0.2339 W/kg
A310 D/T=0.41 338 µm 20% v/v 0.6206 W/kg
45PBT4 D/T=0.41; W/D=9.4%
120 µm 33% v/v 0.1258 W/kg
45PBT4 D/T=0.41; W/D=9.4%
159 µm 25% v/v 0.1740 W/kg
45PBT4 D/T=0.41; W/D=9.4%
338 µm 20% v/v 0.5232 W/kg
4.2.8 Theoretical prediction
A number of experiments were conducted in this study to evaluate the impact of different
parameters on optimum solids concentration. It is of interest here to develop a simple
mathematical model to predict the optimum solids concentration considering different
operating conditions.
The presence of solids can be expected to influence the impeller performance by modifying
the suspension viscosity, local density or vortex structure in the vicinity of the impeller
blades (Kasat and Pandit, 2005). At higher solids loadings, the effect of solids particles on
the impeller hydrodynamics becomes more significant, and thus it influences the impeller
power consumption. Taking this into account, an empirical correlation between power
consumption and volumetric solids concentration was proposed by Bubbico et al. (1998),
which is shown below:
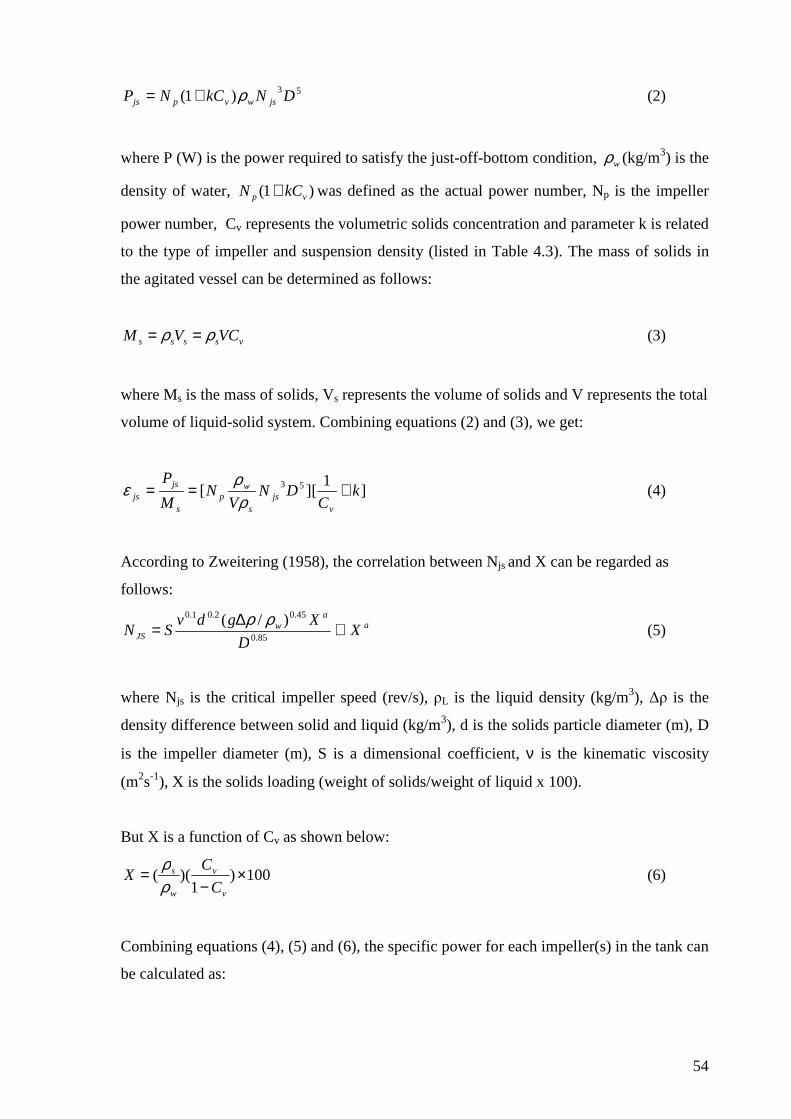
54
53)1( DNkCNP jswvpjs ρ+= (2)
where P (W) is the power required to satisfy the just-off-bottom condition, wρ (kg/m3) is the
density of water, )1( vp kCN + was defined as the actual power number, Np is the impeller
power number, Cv represents the volumetric solids concentration and parameter k is related
to the type of impeller and suspension density (listed in Table 4.3). The mass of solids in
the agitated vessel can be determined as follows:
vssss VCVM ρρ == (3)
where Ms is the mass of solids, Vs represents the volume of solids and V represents the total
volume of liquid-solid system. Combining equations (2) and (3), we get:
]1
][[ 53 kC
DNV
NM
P
vjs
s
wp
s
jsjs +==
ρρε (4)
According to Zweitering (1958), the correlation between Njs and X can be regarded as
follows:
aa
wJS X
D
XgdvSN ∝∆=
85.0
45.02.01.0 )/( ρρ (5)
where Njs is the critical impeller speed (rev/s), ρL is the liquid density (kg/m3), ∆ρ is the
density difference between solid and liquid (kg/m3), d is the solids particle diameter (m), D
is the impeller diameter (m), S is a dimensional coefficient, ν is the kinematic viscosity
(m2s-1), X is the solids loading (weight of solids/weight of liquid x 100).
But X is a function of Cv as shown below:
100)1
)(( ×−
=v
v
w
s
C
CX
ρρ
(6)
Combining equations (4), (5) and (6), the specific power for each impeller(s) in the tank can
be calculated as:

55
)1
())1(
100(
))/(
)(1
()1
100(
3
53
85.0
45.02.01.03
kCC
CG
V
DN
D
gdSvk
CC
C
M
P
v
a
wv
sv
s
wpL
v
a
w
s
v
v
sJS
+−
=
∆+×−
==
ρρ
ρρρρ
ρρε
(7)
Based on equation (7), the specific power can be regarded as a function of Cv and impeller
geometry due to the fact that the parameter k is associated with the impeller type and
particle size (Bubbico et al., 1998). The change in viscosity with solids concentration is
neglected here, thus parameter G is regarded as a constant.
The exponent ‘a’ for low to medium solids concentrations (0.09 – 0.20 v/v) is
approximately equal to 0.13, according to Zweitering (1958). It is assumed that a≈ 0.13
here from low to high solids concentration although it was found by Wu et al. (2002) that
‘a’ is higher than 0.13 for suspending high concentration solids (0.4 ~ 0.52 v/v). It is also
assumed that S = 4.32 when calculating the specific power in equation (7). Further
improvement for the mathematical modeling can be achieved by choosing more appropriate
factors a and S1 because they both vary from impeller to impeller.
Figures 4.13 shows the specific power values predicted using equation (7) as a function of
Cv for different impellers. For the sake of comparison, experimental values of εjs for DT6
and 30PBT6 are also shown in Figure 4.13. Predicted values shown in this figure confirm
that an optimum solids concentration exists at which the specific power consumption is
minimal, regardless of type of impeller. However, the predicted values exhibit a flat curve
at higher solids loading (0.40 v/v ~ 0.60v/v) indicating they are not valid in that region.
This finding suggests that Zweitering’s correlation has got limitations and is not valid in the
high-solids loadings (>0.4 v/v). The predicted values show that the optimum solids
concentration for three types of impeller is in the range of 0.25 ~ 0.4 v/v, as listed in Table
4.3. It can be seen that the predicted values do not match the experimental results closely.
However, the model predicts the presence of OSC for most of the impellers used. The
model, on the other hand, needs further refinement to make its predictions agreed well with
experimental data.
1 Literature does not provide information regarding these (Bubbico et al., 1998).
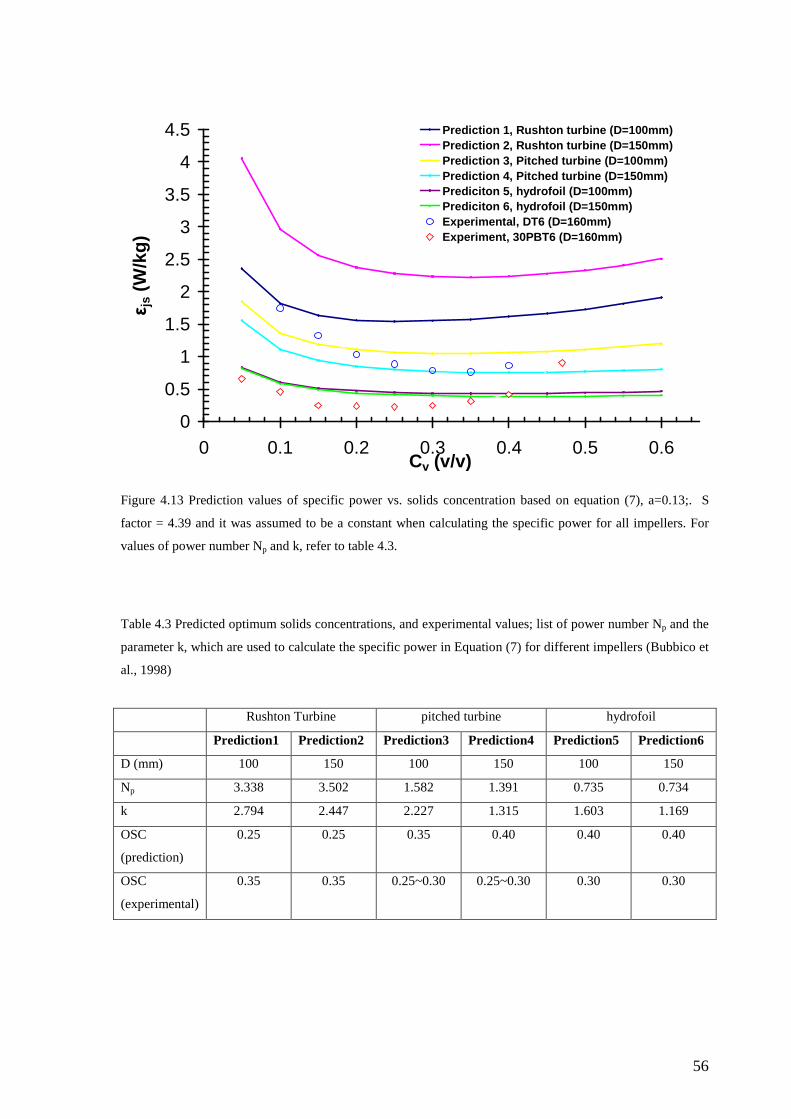
56
0
0.5
1
1.5
2
2.5
3
3.5
4
4.5
0 0.1 0.2 0.3 0.4 0.5 0.6Cv (v/v)
εjs
(W
/kg
)Prediction 1, Rushton turbine (D=100mm)Prediction 2, Rushton turbine (D=150mm)Prediction 3, Pitched turbine (D=100mm)Prediction 4, Pitched turbine (D=150mm)Prediciton 5, hydrofoil (D=100mm)Prediciton 6, hydrofoil (D=150mm) Experimental, DT6 (D=160mm) Experiment, 30PBT6 (D=160mm)
Figure 4.13 Prediction values of specific power vs. solids concentration based on equation (7), a=0.13;. S
factor = 4.39 and it was assumed to be a constant when calculating the specific power for all impellers. For
values of power number Np and k, refer to table 4.3.
Table 4.3 Predicted optimum solids concentrations, and experimental values; list of power number Np and the
parameter k, which are used to calculate the specific power in Equation (7) for different impellers (Bubbico et
al., 1998)
Rushton Turbine pitched turbine hydrofoil
Prediction1 Prediction2 Prediction3 Prediction4 Prediction5 Prediction6
D (mm) 100 150 100 150 100 150
Np 3.338 3.502 1.582 1.391 0.735 0.734
k 2.794 2.447 2.227 1.315 1.603 1.169
OSC
(prediction)
0.25 0.25 0.35 0.40 0.40 0.40
OSC
(experimental)
0.35 0.35 0.25~0.30 0.25~0.30 0.30 0.30

57
4.3 Discussion
It has been observed above that specific power εjs decreases with increase in solid
concentration, reaches a minimum and increases thereafter for all impeller types. A likely
explanation for the reduction in the specific power with increase in solids concentration is
that a low solids concentration or a relatively dilute condition leads to a lower Ms in the
denominator of the equation εjs = Pjs/Ms, which in turn would maximize the value of εjs.
One can assume that infinite εjs will be required to suspend a very small amount of solids,
due to the infinitely small value for Ms in the equation above. It can also be said that it is
extremely inefficient to operate the vessel with the solids concentration far less than the
optimum loading, because most of the energy will be consumed for blending the liquid
phase rather than for suspending the solids. However, in the range of 0.3 – 0.4 v/v, the
magnitude of increase in solids mass is much less than the magnitude of increase in power
required especially the concentration approaches the packing coefficient, which leads to
high εjs values.
The presence of a minimum εjs in εjs versus Cv graph suggests that there are some
advantages in operating the mixing tank at solids concentrations higher than that is
generally used at present. In the design of a new plant, an increase in solids concentration
would result in a reduction in size of the required vessel and the impeller, for a given mass
throughput. Capital costs can, thus, be reduced as a consequence of reduced size of the
reactor and impeller. The optimum solids concentration point, corresponding to the
minimum specific power, has practical implications too. For example, any mixing vessel
for solids suspension can be designed based on the above criteria as it will lead to an
operating condition with optimum energy/power efficiency.
A dilute or relatively low solids concentration condition is certainly not beneficial to
industry from a practical point of view because it will increase the operating costs largely
due to insufficient usage of existing infrastructure. Also, it hinders mixing intensification,
which is a means to increase the yield per unit volume per unit time (Wu et al., 2009a, b).
The benefits of operating the process at the optimum solids concentration (20–35% v/v) are
yet to be fully justified. However, the energy efficiency in suspending solids in a mixing
tank can be improved by optimizing the impeller design and many other methods (Wu et al.

58
2006, 2010). Significant benefits in terms of reducing energy consumption can be achieved
by removing baffles, which are usually found in most conventional slurry tanks. According
to Wu et al. (2009b), the side effect due to the removal of baffles is the increased mixing
time. This is usually not a problem in the mining/mineral processing industry, where the
time scale for reactions, and the slurry residence time are typically an order of magnitude
larger than the mixing time. Mixing is not required in some tanks, for example, in slurry-
holding tanks where the slurries are held to smooth out the fluctuations in the slurry flow
rate, occurring due to variation of throughput in other unit operation equipment in a
continuous process circuit. In addition to baffles removal, further optimization can be
achieved by changing the impeller diameter and type of impeller, as discussed in previous
sections in this chapter.
Under baffled condition, the liquid flow generated by the axial flow impeller is directed
directly towards the vessel base. Therefore it is not surprising that it is superior to other two
impellers in terms of energy efficiency in solid suspension. (Raghava Rao et al., 1988)
Significant energy improvement observed for Rushton turbines (radial impellers) due to the
removal of baffles is mainly attributed to less energy that is dissipated at the vessel walls
due to the absence of baffles. In a fully baffled vessel, the impeller jet stream impinges
directly on the tank wall and base leading to an essential reduction in its energy. Tangential
motion in an unbaffled tank allows the circulation to deflect off the tank wall at minimized
angles leading to a reduction in energy dissipation. Drewer et al. (1994) commented that
the lack of baffles in the lower portion of the tank vessel generates an inward-spiralling
flow pattern on the vessel base, which sweeps any settled solids towards the centre from
where less intense vortex under the impeller sucks them into suspension.
It is not surprising at low-solids concentrations, the dual impeller system consumes more
power. In such cases, the lower impeller is mainly responsible for solids suspension as
reported by Armenante and Li (1993). It is generally agreed by researchers that an
additional impeller would lead to an extra energy requirement to satisfy the just-off-bottom
condition. At higher solid concentration, it is assumed that the additional impeller would
also contribute to solids suspension because of the enhanced pumping in the upper region
of the tank which ensures solid particles are evenly distributed in the tank. Agitation by the
59
second impeller might also result in power saving at high solids concentrations as discussed
in Chapter 5.
It can be said that it is more energy efficient to suspend a large number of small particles
than a small number of large particles for the same amount of solids mass. This is a useful
result with a practical implication. For example, in the mineral industry it is known that it
requires increasingly more energy to grind ore into fine particles. However, the benefit of
reduced power requirement in suspending fine particles in mixing tanks could partially
compensate for the higher energy consumption required in grinding ore into fine particles.
4.4 Conclusions
The specific power required for the complete suspension of solids has been studied over a
range of solids concentration and particle size. It is accepted that the specific power
required for just-off-bottom suspension increases rapidly with the solids concentration for
Cv > 0.3v/v when the power is determined on the basis of total volume of the suspension.
Nevertheless, when the power input is considered in terms of the mass of solids suspended
in the agitation vessel, the specific power decreases with solids concentration until a critical
value is reached and increases thereafter. This observation is confirmed for radial, mixed
and axial flow impellers under baffled and unbaffled conditions.
It is also found that the specific power can be minimized by operating the vessel at a
suitable solids concentration in the range of 0.20–0.35v/v for the impeller types and
baffling conditions used in this study. Under baffled condition, it can be stated that the
optimum solids concentration (OSC) can be affected by the impeller type and impeller
dimension. Under unbaffled condition, it can be concluded that the OSC is independent of
impeller type but it decreases with increasing particle size.
Higher power number radial impellers are found to be more energy efficient than lower
power number axial impellers for suspending fine particles in the unbaffled condition. It
appears that the effect of removing baffles is more significant at low concentration for
radial flow impeller (DT6) because it leads to significant reduction in its specific power. At
higher solids concentration also, there is a reduction in specific power of DT6 due to the
removal of baffles but the magnitude of reduction is not as significant as that at low solids
concentration. Of all the impellers used, the radial flow impeller (DT6) is the most

60
sensitive to the removal of baffles irrespective of the solids concentration. These results
imply that DT6 is the most energy efficient under unbaffled condition compared to axial
and mixed flow impellers.
A simple mathematical model based on Zweitering’s correlation for Njs is found to predict
the optimum solid concentration satisfactorily.

61
CHAPTER
5.0
Suspension of High Concentration Slurry
62
Chapter 5
Suspension of High Concentration Slurry
5.1 Introduction As discussed previously in Chapter 2, to achieve low capital and operating costs in solid-
liquid mixing tanks where the impeller is used to establish complete solids suspension, two
main strategies can be employed. They are minimizing the size of the mixing vessel and/or
maximizing outputs from existing equipment (Chowdry et al., 1995). In many cases, the
first option is not feasible especially for an existing plant. The second option is feasible but
it might involve upgrading the stirrer drives because the impeller speed and the
corresponding power draw required to suspend high concentration slurry off the tank
bottom is relatively high. However as compared to the first option, this one might be a
feasible action for industries seeking to increase vessel throughput. In some cases, the
existing stirrer drives may be able to deliver the power required to suspend high
concentration slurries thus making the motor upgrade unnecessary. It is always preferable
to increase the productivity (i.e. solids concentration) in such ways rather than scaling up
the existing infrastructure due to the high costs involved in such strategy. It is difficult to
choose between these options at present because there is a significant lack of information in
the literature on high concentration solids suspension (Drewer et al., 1994). Therefore it is
difficult to quantitatively evaluate the advantages of operating the solid-liquid processes at
high solids concentrations. Such information will be highly valuable when taking decisions
on process intensification.
This chapter describes an investigation in which the impeller power required to suspend
very high concentration slurry (Cv=0.4 v/v) is studied as a function of a range of parameters
including impeller type, particle size, impeller geometry factors such as number of blades,
angle of blades and baffle installation. The results are compared with the specific power
that was obtained with low concentration slurry (Cv=0.06 v/v) using similar geometrical
and operating parameters. The results presented in this chapter are useful in achieving the
overall goal of developing optimum industrial agitator designs to minimise the power
consumption for suspending high concentration slurry, especially when off-bottom solids
suspension is a limiting factor. Based on the results and discussion presented in Chapter 4,

63
the impeller specific power data is expressed in this chapter on the basis of the total mass of
solids suspended in the mixing vessel.
The results presented in Chapter 4 indicate that the average optimum solids concentration
determined based on specific impeller power per unit total solids mass for different impeller
type is about 0.3 v/v. Based on this finding it may be concluded that, if the productivity of
an industrial slurry reactor is to be maximised, the reactor should be operated either at or
above 0.3 v/v solids concentration. Based on this reasoning, solids suspension experiments
were carried out with a solids concentration of 0.4 v/v which is slightly higher than the
optimum concentration. The picture of the mixing tank filled with 0.4 v/v solids is shown in
Figure 5.1. Red dye was mixed with water used in this experiment to enable easy
visualization of “just-suspended” condition.
Figure 5.1 High concentration solids in the agitation tank. (Cv=0.4 v/v), impeller speed N = 0 rpm.
HB=252mm
HL=390mm
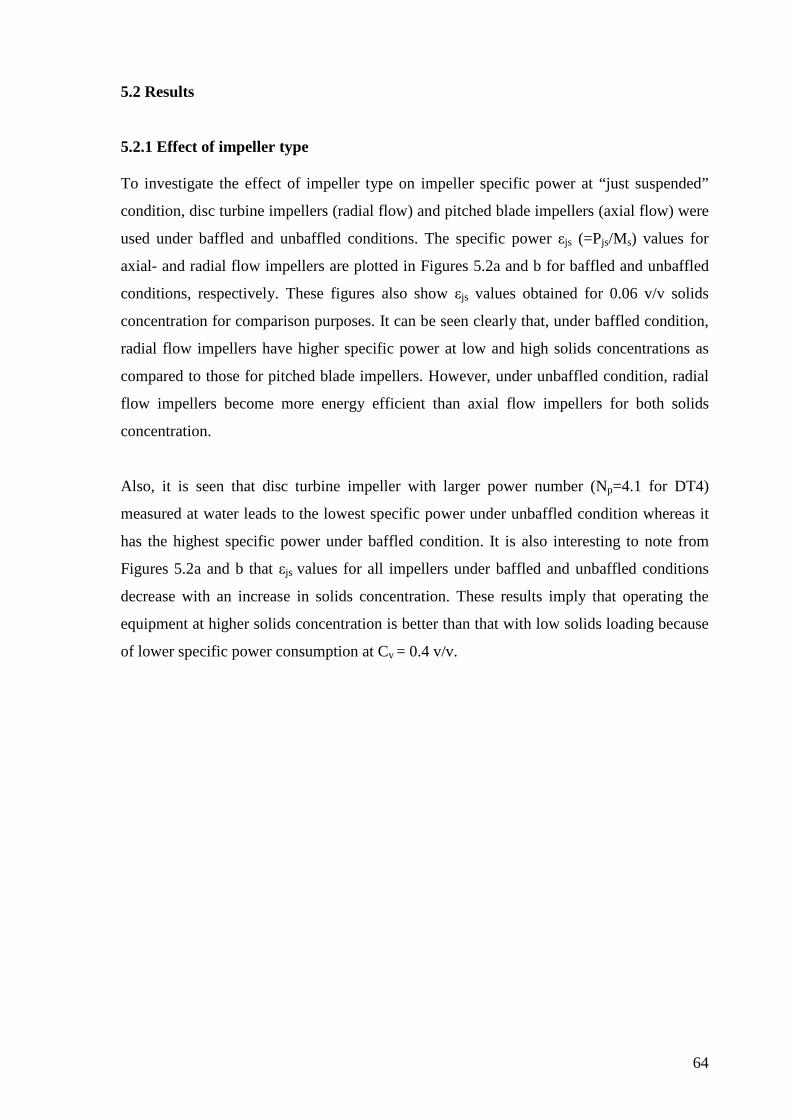
64
5.2 Results 5.2.1 Effect of impeller type To investigate the effect of impeller type on impeller specific power at “just suspended”
condition, disc turbine impellers (radial flow) and pitched blade impellers (axial flow) were
used under baffled and unbaffled conditions. The specific power εjs (=Pjs/Ms) values for
axial- and radial flow impellers are plotted in Figures 5.2a and b for baffled and unbaffled
conditions, respectively. These figures also show εjs values obtained for 0.06 v/v solids
concentration for comparison purposes. It can be seen clearly that, under baffled condition,
radial flow impellers have higher specific power at low and high solids concentrations as
compared to those for pitched blade impellers. However, under unbaffled condition, radial
flow impellers become more energy efficient than axial flow impellers for both solids
concentration.
Also, it is seen that disc turbine impeller with larger power number (Np=4.1 for DT4)
measured at water leads to the lowest specific power under unbaffled condition whereas it
has the highest specific power under baffled condition. It is also interesting to note from
Figures 5.2a and b that εjs values for all impellers under baffled and unbaffled conditions
decrease with an increase in solids concentration. These results imply that operating the
equipment at higher solids concentration is better than that with low solids loading because
of lower specific power consumption at Cv = 0.4 v/v.
65
0.00
1.00
2.00
3.00
4.00
DT4 DT3 30PBT4 30PBT3
Impeller Type
εjs (
W/k
g)
Low concentration, Cv=0.06 v/v
High concentration, Cv=0.4 v/v
(a)
0.00
1.00
2.00
3.00
4.00
DT4 DT3 30PBT4 30PBT3
Impeller Type
εjs (
W/k
g)
Low concentration, Cv=0.06 v/v
High concentration, Cv=0.4 v/v
(b)
Figure 5.2 Variation of εjs with impeller type in the 0.39 m diameter tank. (a) Tank configured in the baffled condition. (b) Tank configured in the unbaffled condition.
66
5.2.2 Effect of impeller blade angle and number of blades To determine the optimum number of blades for radial and axial flow impellers used in this
study, experiments were carried out with impellers with different number of blades. Also
for axial flow pitched blade impellers, the blade angle was varied to determine the best
blade angle for solids suspension under high solids concentration (0.4 v/v). These
experiments were carried out for both baffled and unbaffled conditions.
Figure 5.3 shows the εjs values obtained with pitched blade impellers with different blade
angles. The blade angle was varied from 20o to 90o. The impeller with the blade angle of
90o is actually a radial turbine with 4 blades. In all these experiments, average glass particle
size was kept constant at dp = 105 µm. The specific power value decreases with increase in
blade angle up to 45o and increase thereafter. At a high pitch angle of 90o, the disc turbine
with 4 blades leads to substantially higher εjs value than the pitch-blade, down-pumping
axial impellers. In the case of unbaffled condition, εjs values decrease continuously with
increase in blade angle as shown in Figure 5.4.
The effect of the number of blades on εjs for axial and radial flow impellers is illustrated in
Figure 5.5 for baffled condition. The εjs values decrease with increasing number of blades,
regardless of the impeller type (radial or axial). However, the decrease in the εjs values with
an increase in the number of blades for the axial impellers is rather marginal. Also it is
interesting to note that the difference between εjs values for axial and radial flow impellers
decrease as the number of blades increase. Under unbaffled condition also, the εjs values
decrease with increase in the number of impeller blades for both axial and radial flow
impellers (Figure 5.6). However, it is interesting to not that radial impellers are more
efficient than axial impellers, regardless of the number of blades.

67
0.00
0.25
0.50
0.75
1.00
0 20 40 60 80 100Impeller Blade Angle (o)
εjs (
W/k
g)
20PBT4
DT4
Figure 5.3 Variation of εjs with impeller blade angle at constant particle loading (Cv = 0.4 v/v) for pitch-bladed impellers. Tank configured in the baffled condition.
0.00
0.05
0.10
0.15
0.20
0 20 40 60 80 100Impeller Blade Angle (o)
εjs
(W
/kg
)
DT4
20PBT4
Figure 5.4 Variation of εjs with impeller blade angle at constant particle loading (Cv = 0.4 v/v) for pitch-bladed impellers. Tank configured in the unbaffled condition.

68
0.00
0.25
0.50
0.75
1.00
2 3 4 5 6 7
No. of Impeller Blades
εjs
(W
/kg
)Radial Impeller (DTX)
Axial Impeller (30PBTX)
Figure 5.5 Variation of εjs with number of impeller blades at constant particle loading (Cv = 0.4 v/v). Tank configured in the baffled condition.
0.00
0.05
0.10
0.15
0.20
2 3 4 5 6 7No. of Impeller Blades
εjs
(W
/kg
)
Radial Impeller (DTX)
Axial Impeller (30PBTX)
Figure 5.6 Variation of εjs with number of impeller blades at constant particle loading (Cv = 0.4 v/v). Tank configured in the unbaffled condition.
69
5.2.3 Effect of multiple impellers
Many industrial agitators are equipped with multiple impellers mainly to achieve even
distribution of shear and energy dissipation rates. Typically, stirred vessels employed as
industrial reactors and fermenters are usually provided with multiple impellers to satisfy a
variety of mixing requirements such as blending, improvement of multiphase mass transfer,
enhancement of the mixing related to a chemical reaction, heat transfer, and solids
suspension. Although there have been several studies on solids suspension in stirred vessels
with multiple impellers, very little is known about the specific power requirement at a high
solids concentration for the dual impeller arrangement (Kasat and Pandit, 2005). This work
attempted to examine the effect of multiple impellers on the specific power required for
suspending the solids off the tank bottom at a solids concentration Cv = 0.4 v/v.
The effect of number of impellers on εjs values are shown in Figures 5.7 and 5.8 for baffled
and unbaffled conditions, respectively. The dual impeller arrangement was used for various
types of impellers. In all cases, similar impellers were used for the dual impeller
arrangement. The distance between the impellers was maintained equal to impeller
diameter. It is interesting to note that the dual impeller arrangement using 45o pitched blade
impeller (45PBT4) under baffled condition leads to lower specific power as compared to
those of a single impeller. The εjs values for dual 45PBT4 is about 80% ~93% of that
dissipated by a single impeller. Similar power trend can be observed for the 30o pitched
blade impeller as it is found that the additional impeller results in a reduction in specific
power consumption for 30PBT6, based on Figure 5.7. However, for the radial flow impeller
(DT6), the dual impeller arrangement leads to higher values as compared to that for a single
impeller (Figure 5.7).
In the case of unbaffled condition, the εjs values for radial impellers DT4 and DT6 are
lower under dual impeller arrangement as compared to that for single impeller system
(Figure 5.8). In their cases, up to ~ 30% decrease in specific power can be achieved by
using dual impeller arrangement. Nevertheless, in the case of axial impellers (30PBT6 and
45PBT4), the additional impeller leads to an increase in εjs.

70
0.00
0.50
1.00
1.50
30PBT6 30PBT4 DT4Impeller type
εjs
(W/k
g)
1 X impeller2 X impeller
Figure 5.7 Effect of dual impellers on εjs, solids: glass particles of d = 0.12 mm. Cv=0.4 v/v. Tank configured in the baffled condition.
0.00
0.50
1.00
1.50
45PBT4 30PBT6 DT4 DT6Impeller Type
εjs
(W
/kg
)
1 X Impeller2 X Impeller
Figure 5.8 Effect of dual impellers on εjs, solids: glass particles of d = 0.12 mm. Cv=0.4 v/v. Tank configured in the unbaffled condition.
71
5.2.4 Effect of baffle removal While the significance of adequate baffling in solids suspension or other mixing operating
is frequently discussed in the literature, little quantitative information has been published.
Zwietering (1958) contributed significantly to studies on solids suspension in a fully baffled
tank, but mentioned that this configuration may not be the best for solids suspension. The
limitations associated with previous studies on baffle effect on solids suspension are that
they have used only few impeller types and low concentration (<5% v/v).
To determine the effect of baffles on εjs value, an enhancement factor that called Rε is
defined in this work as shown in equation 1 (also refer to Chapter 4).
100(%))(
)()(
)(
×=∆= −
baffledjs
unbaffledjsbaffledjs
baffledjs
Rε
εεε
εε (1)
where εjs(unbaffled) and εjs(baffled) are the specific power required to suspend solids off the tank
bottom under unbaffled and baffled conditions, respectively.
The Rε values calculated using the equation 1 for various impeller types using 0.06 v/v and
0.4 v/v solid loadings are shown in Table 5.1. From these data, it can be stated that Rε >0
for all the cases tested which suggests that εjs generally decreases on removal of the baffles
in the range of low to high solids concentration studied in this work. These data also show
that improvement of energy efficiency for solids suspension can be achieved by all single
and dual impeller systems by removing baffles. It can be seen that the effect of baffle
removal is more significant at low solids concentration in the cases of Rushton turbines
(DT6 and DT3). However, Rε values for Rushton turbines decrease with an increase in
solids concentration, which is opposite to the findings observed for pitch-bladed impellers.
Of all the impellers, dual DT4 impellers were the most sensitive to baffle removal with a Rε
= 91%. This suggests that power dissipated by the dual impellers (2 x DT4) under baffled
condition is 11 times higher than that under unbaffled condition.
The Rε values for particles of different size are shown in Table 5.2 for solids concentration
of 0.4 v/v. It can be seen that the effect of baffle removal is more pronounced for smaller
particles in the case of the disc turbines (DT6 and DT4), which contradicts the findings
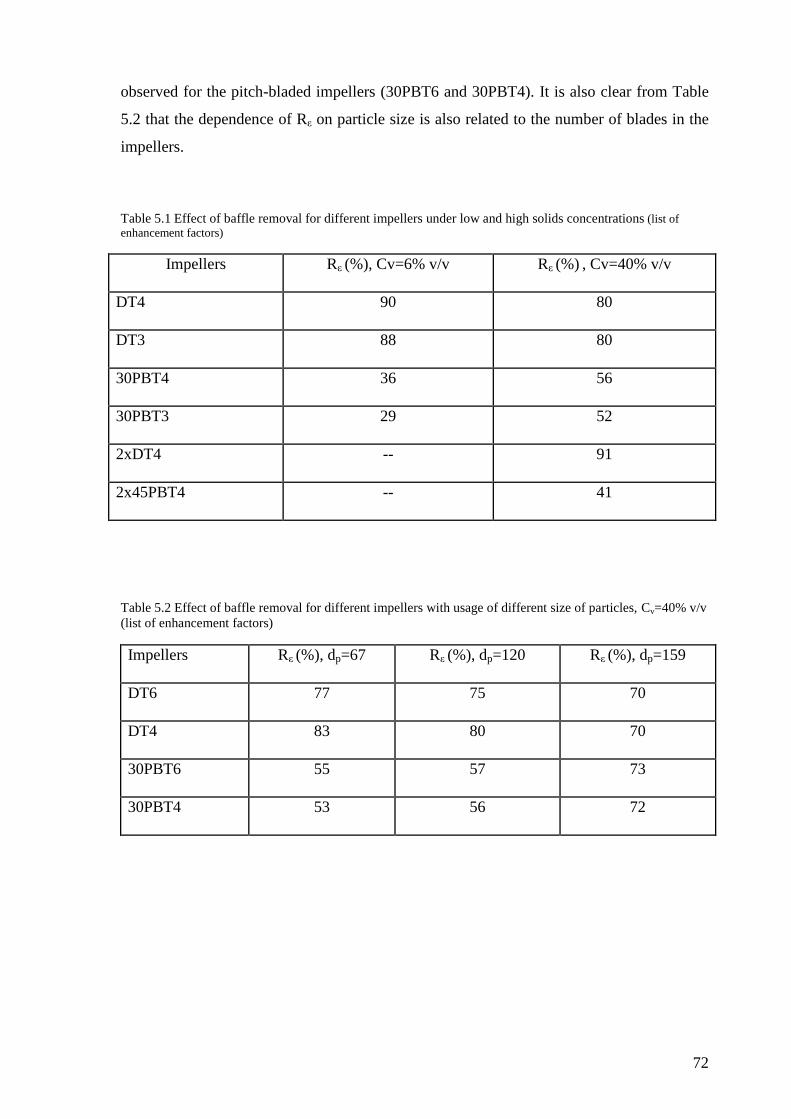
72
observed for the pitch-bladed impellers (30PBT6 and 30PBT4). It is also clear from Table
5.2 that the dependence of Rε on particle size is also related to the number of blades in the
impellers.
Table 5.1 Effect of baffle removal for different impellers under low and high solids concentrations (list of enhancement factors)
Impellers Rε (%), Cv=6% v/v Rε (%) , Cv=40% v/v
DT4 90 80
DT3 88 80
30PBT4 36 56
30PBT3 29 52
2xDT4 -- 91
2x45PBT4 -- 41
Table 5.2 Effect of baffle removal for different impellers with usage of different size of particles, Cv=40% v/v (list of enhancement factors)
Impellers Rε (%), dp=67 Rε (%), dp=120 Rε (%), dp=159
DT6 77 75 70
DT4 83 80 70
30PBT6 55 57 73
30PBT4 53 56 72

73
5.2.5 Effect of particle size
The effect of particle size on εjs for disc turbine and pitch-bladed down-pumping turbines,
under baffled and unbaffled conditions is shown in Figure 5.9 and 5.10, respectively for a
solids concentration of 0.4 v/v. For all impellers, an increase in particle size leads to an
increase in εjs even though the mass of solids is the same. It is also clear from Figure 5.9
that under baffled condition, disc turbines lead to higher εjs values as compared to pitched
blade turbines. For example, the εjs value for DT6 is twice that of 30PBT6 when they are
used to suspend 67 µm particles. However this difference in εjs values for these impellers
decreases when larger particles are suspended. For example, εjs value for DT6 is 1.2 only
times higher than that of 30PBT6 for 159 µm particles. It is also clear that pitch-bladed
turbines are more sensitive to change in particle size than radial impellers at this solids
concentration.
Under unbaffled condition also the specific power εjs required to suspend the particles off
the tank bottom increases with an increase in particle size regardless of the impeller type
used (Figure 5.10). The dependence of specific power εjs on particle size is almost the same
for all radial and axial impellers under unbaffled condition at this high solids concentration.
The difference in εjs values for disc turbines and pitched blade turbines is not that
significant under unbaffled condition. The εjs values for disc turbines are nearly the same as
those for axial flow impellers. It is also interesting to note that the εjs values for disc
turbines are much lower than those under baffled condition for all particle sizes. This
finding was also confirmed by the results shown in Figure 5.6. As particle size increases, it
can be seen that radial impellers require more power than axial impellers for suspending
solids. It can be assumed that there might be a critical particle size point beyond which
axial impellers would perform better than the radial impellers under unbaffled condition.

74
0.00
0.20
0.40
0.60
0.80
1.00
0 50 100 150 200Particle Size (µm)
εjs
(W
/kg
)DT6 DT4
30PBT6 30PBT4
Figure 5.9 Effect of particle size on εjs for Rushton disc turbines and pitch-bladed impellers at Cv = 0.4 v/v. Tank configured in the baffled condition.
0.00
0.20
0.40
0.60
0.80
1.00
0 50 100 150 200Particle Size (µm)
εjs (
W/k
g)
DT6 DT4
30PBT6 30PBT4
Figure 5.10 Effect of particle size on εjs for Rushton disc turbines and pitch-bladed
impellers at Cv = 0.4 v/v. Tank configured in the unbaffled condition.

75
5.2.6 Effect of viscosity
Solids suspension in viscous liquids mixing is carried out in many industrial applications
like the manufacturing of pastes, paints, and pulp and paper (Paul et al., 2004). Ibrahim and
Nienow (1999) studied the effect of viscosity on mixing patterns and solids suspension in
agitated vessels. They observed that Zwietering’s (1958) equation for Njs has errors up to
90% at high viscosity indicating that the phenomenon of solids suspension in viscous
liquids is far more complicated than commonly accepted. Ibrahim and Nienow’s work is
limited to low concentration of solids. Information on suspension of high-concentration
slurries in viscous liquids is very limited. Behaviours of such suspensions are less
predictable because the presence of solids exerts a strong influence on the fluid circulation,
especially the rheology. The present work aims to investigate the influence of liquid
viscosity on specific power based on suspended solids mass especially when high
concentration of solids (0.4 v/v) is used.
The tests for evaluating the effect of viscosity were conducted using aqueous glycerol
solutions (µ = 0.015 Pa.s and µ = 0.023 Pa.s). The εjs values obtained for these liquids are
compared in Figures 5.11 and Figure 5.12 for baffled and unbaffled conditions,
respectively. It is evident that an increase in viscosity gives rise to an increase in specific
power irrespective of the impeller type and baffling condition. From the results shown in
these figures, it can be concluded that the effect of viscosity is more significant for radial
impellers DT6 and DT4 as compared to axial impellers. Under baffled condition, as
viscosity increases from 0.001 to 0.023 Pa.s, εjs values increase by 73%, 56%, 9% and 16%
for DT6, DT4, 30PBT6 and 30PBT4 respectively. Under unbaffled condition, as viscosity
goes up from 0.001 to 0.0023 Pa.s, εjs value increase by 178%, 177%, 60% and 67% for
DT6, DT4, 30PBT6 and 30PBT4 respectively. These results also suggest that more power
is required to generate enough liquid circulation in the lower region of tank because it is
mainly responsible for the just-off-bottom condition.
Figures 5.11 and 5.12 reinforce that a high power number impeller (of same type, radial or
axial) is more energy efficient than a low power number impeller at high solids
concentration, in turbulent regime (4500<Re<5500). However, as viscosity goes up, disc
turbines become less efficient than pitch-bladed impellers in the unbaffled condition

76
(Figure 5.12). Previous findings suggest that it is more efficient to use disc turbines in
water (refer to Chapter 4).
0.00
0.50
1.00
1.50
2.00
DT6 DT4 30PBT6 30PBT4Impeller Type
εjs
(W
/kg
)
µ=0.001 Pa.s, Cv=0.40 v/vµ=0.015 Pa.s, Cv=0.40 v/vµ=0.023 Pa.s, Cv=0.40 v/v
Figure 5.11 Effect of viscosity on εjs, solids: glass particles of d = 0.12 mm. Cv=0.4 v/v. Tank configured in the baffled condition.
0.00
0.50
1.00
1.50
2.00
DT6 DT4 30PBT6 30PBT4Impeller Type
εjs
(W/k
g)
µ=0.001Pa.s, Cv=0.40 v/v µ=0.015Pa.s, Cv=0.40 v/vµ=0.023Pa.s, Cv=0.40 v/v
Figure 5.12 Effect of viscosity on εjs, solids: glass particles of d = 0.12 mm. Cv = 0.4 v/v. Tank configured in the unbaffled condition.

77
5.3 Discussion
It is often sufficient to keep solids just suspended off the tank bottom for non-diffusion
limited processes. Additional power input, which tends to increase suspension
homogeneity, does not lead to any increased reaction rates, and so is wasteful. Thus, it is
sufficient to consider the specific power input into the system at the just-off-bottom solids
suspension condition. This is the basis on which all the power measurements and analyses
were conducted in this study.
It must be pointed out that the concentration of 0.4 (v/v) presented in this study is rather
high, and there is limited study at this high concentration in the literature. Operating the
process at this high concentration can easily damage the motor due to a sharp rise in power
consumption owing to solids-packing effect (Drewer et al., 1994). Burning-out of motor
can be a consequence of running some mineral processes beyond the limit of 0.3 v/v.
Drewer et al. (1994) also commented that at a high solids concentration, the sudden change
of effective slurry viscosity gives rise to significant change in suspension behaviour,
leading to complex liquid circulations in the agitated vessel. On the other hand, a dilute or
relatively low solids concentration condition is certainly not beneficial to industry from a
practical point of view because operating costs can be high largely due to insufficient usage
of existing infrastructure. Also, low solids concentration in the feed slurry to a mixing tank
is against the purpose of mixing intensification, which be can be defined as a means to
significantly increase the yield per unit volume and per unit time.
Data shown in Figures 5.2a and b reinforce that it is advantageous to operate the agitated
vessel at high solids concentrations irrespective of the impeller type. The new power
assessment method in which the specific power is expressed on the basis of total mass of
solids suggests that operating the mixing process at high solids concentration (0.4 v/v)
seems more energy efficient as compared to that at low concentration (0.06 v/v), regardless
of the baffling arrangement. Furthermore, this method provides a basis for reducing both
the capital and operational costs, by operating the processes at solids concentrations higher
than those commonly used at present. For a given mass throughout, size of reactor, baffles
and the impeller can be minimized by increasing the solids concentration in processes that
require complete suspension of solids or maximum exposure of surface area of particles to
liquid.
78
It is commonly accepted that higher power number impellers consume more energy in
particle suspension. Under baffled condition, it appears that larger power number axial flow
impellers consume less energy than lower power ones at Njs for Cv=0.4 v/v, based on
results shown in Figures 5.4 and 5.6. For baffled condition, it can be also said that radial
impellers are less efficient than axial impellers, which has been also reported by Drewer et
al. (1994). Three factors can be identified to be responsible for the poor energy efficiency
of radial turbines: (a) only partial energy delivered by the circulation loop is available for
solids suspension; (b) liquid-phase turbulence is created at the impeller tip but it decays
along the path of liquid flow; (c) energy is lost during the two changes in the flow
directions, first near the wall opposite the impeller and then at a corner of the base and wall
(Raghavo Rao et al., 1998). However, Wu et al. (2002) suggested that radial flow impellers
are more energy efficient than axial impellers at a higher solids concentration, Cv = 0.49
v/v. The reason for the difference between their finding and that of this work might be due
to the change in rheological behaviour of the suspension in the presence of a greater amount
of solids in their system. Further studies are required to investigate the effect of solids
concentration on suspension rheology and its influence on specific power. At present, it can
be only assumed that there might be a critical solids concentration beyond which radial
impellers are more energy efficient than axial impellers for a given particle size in the
baffled condition.
Under unbaffled condition, it still appears that impellers with larger power numbers (axial
or radial) are more efficient than those with lower power numbers for just-off-bottom
suspension at a high solids loading. This study also observed that radial impellers perform
relatively better compared to axial impellers at just-off-bottom condition, when smaller
particles are used at high solids concentration. Wu et al. (2009) stated that this might be due
to the fact that turbulence is suppressed at high solids concentration and lower power
number impellers such as axial flow impellers have reduced impeller pumping efficiency
because of their low solidity. Significant energy improvement observed for Rushton disc
turbines under unbaffled condition is mainly attributed to less energy that is dissipated
against the vessels walls in the absence of baffles.
Drewer et al. (1994) commented that the lack of baffles in the low portion of the tank
vessel introduces an inward-spiralling flow pattern developing on the vessel base, which
79
sweeps any settle solids towards the centre where less intense vortex under the impeller
sucks them into suspension. In addition to Drewer et al.’s statement, an assumption is made
here that the secondary circulation loop (above the Rushton impeller) is also responsible for
the solids suspension at such high solids concentration. The assumption is based on the
observation that slurry height (Hs) at the just-off-bottom condition for Rushton turbines was
always higher than those for the axial impellers. Solids suspension at high concentrations is
dependent on particle pick-up at the tank bottom and continuous circulation of fresh liquid
from the supernatant into the suspended swarm (Geisler et al., 1991). The latter is most
essential in the suspension of high-concentration slurries. We can assume that at high
concentrations, the extra circulation loop (for Rushton turbines) contributes significantly to
the entrainment of supernatant in the upper region of the vessel, leading to higher degree of
agitation (i.e. high Hs) and improved energy efficiency (i.e. low εjs). This characteristic was
confirmed in our experiments from our observations of slurry height at just-off-bottom
condition for different impellers (not shown here due to space limitations).
Another new finding in this work is the reduction in power consumption when multiple
impellers are employed at a high solids concentration. Improvement of energy efficiency
can be accomplished by using dual axial impeller arrangement in the vessel under unbaffled
condition and using dual radial impeller arrangement in the tank under unbaffled condition.
It is unusual for an additional impeller to give rise to reduced power consumption (Kasat
and Pandit, 2005). A likely explanation for the reduction is that this geometrical
configuration generates a significant amount of bulk flow in the system, thus helping with
the solid suspension with reduced power consumption. The mechanism could be similar to
that using the Rushton turbine; secondary loop above the top impeller is responsible for the
entrainment of supernatant in the upper region of the tank, which is essential for solids
suspension at such high solids concentration. Thus, it can be said that the additional
impeller contributes to a significant amount of energy for solids suspension, and overall
power consumption in the system can be reduced by the dual impeller arrangement.
The effect of particle size is consistent with the results reported in Chapter 4. For all
impellers, an increase in particle size leads to an increase in εjs even though the mass of
solids is the same. Since larger particles settle faster than smaller one, more agitation
energy/power is required to generate stronger fluid flow (i.e. upward velocity) to suspend
the particles. Further investigation should be conducted to investigate the reduced power
80
requirement for fine particles and how it partially compensates for the additional energy
required to grind ore into smaller particles.
The difficulty associated with solids suspension in a viscous environment is obtaining a
uniform mixture because there are fewer or no turbulent eddies generated in the system.
The results presented in this chapter imply that more agitation power is required in viscous
liquids to create a fluid flow that will ensure the just-off-bottom condition.
5.4 Conclusions
Off-bottom suspension of concentrated solid-liquid system was investigated in a
mechanically agitated vessel equipped with radial and axial flow impellers. Experimental
results show that operating the process at high solids concentration is superior to that with
low solids loading owing to relatively low specific power consumption at a solids
concentration of Cv = 0.4 v/v, regardless of the impeller type and baffling condition.
Improvement in energy efficiency can be accomplished by installing multiple impellers for
high solids concentration. It is concluded that the specific power enhancement factor Rε > 0
in all the cases tested, suggesting the specific power to suspend solids from the vessel
bottom generally decreases on removal of baffles in the range of low to high solids
concentrations (0.06 - 0.4 v/v). It also appears that at high solids concentration, Cv=0.4 v/v,
a dual radial impeller system is most sensitive to baffle removal and significant power
saving can be achieved by removing baffles for this impeller arrangement.

81
CHAPTER
6.0
Mixing of Suspensions with High Solids Concentration for Process Intensification
in Minerals Processing
82
Chapter 6
Mixing of Suspensions with High Solids Concentration for
Process Intensification in Minerals Processing
6.1 Introduction
Modern minerals processing practice uses hydrometallurgical processes to extract metal
from ores. Typically, a large volume of ore slurry is treated in mixing tanks in a mineral
processing plant for leaching, digestion, precipitation and other chemical processing to
obtain pure metals The slurry vessels used for minerals processing are typically large with
dimensions of 20–30 m in height and 10–15 m diameter (Figure 6.1). It is not uncommon
that a large number of these slurry tanks are used in a series or in parallel for continuous
reaction. The use of large tanks is essential in delivering multi-million tons per year of
refined metal or concentrated ore products continuously, even though the reactions might be
slow, with reaction time varying from a few hours to a few days such as that in the gold
leaching process.
It is not always practical to reduce the physical size of reactors to achieve process
intensification in a full-scale mineral processing plant because of the large volume of
materials that is to be processed. Also it is not practical to build more reactors to increase
the plant throughput, owing to the high capital cost involved in building such a large
refinery. Thus, it is desirable to increase the throughput using the existing mixing tanks to
accomplish improved economic return. This concept is known as ‘process intensification’
which was first introduced by ICI in the early 1980s (Ramshaw, 1985), as a way to reduce
the capital and operating costs in a chemical production system. Wu et al. (2009a) further
claimed that process intensification could be defined as a means to drastically increase
production yield per unit volume, per unit time. Process intensification in mixing vessels or
mixing intensification is an attractive approach to enhance the productivity of mixing tanks,
based on the fact that a large volume of ore slurries in refineries are mostly held in mixing
tanks.
This chapter focuses on studies on increasing the slurry solids loading, so as to accomplish
increased solids residence time and thus, maximize the extraction throughput.

83
Figure 6.1 An aerial view of an alumina refinery in Western Australia, extracted from the company’s website (Jan, 2010),
6.2 Theoretical analysis: mixing intensification at high solids loading
Methods to increase yield
Multiple tanks are frequently used in a series to provide agitation in mineral processing
plants and extract metals from ore slurries (Figure 6.2). In the design of chemical reactors,
the residence time1 is regarded as the average processing time for the feed in one reactor
volume measured at specific conditions. With in a reasonable residence time, reactions
proceed with the highest efficiency towards the desired output, producing a maximum
amount of product while probably requiring the least amount of energy input.
Underestimated residence time might lead to a wastage of raw materials and catalysts,
while overestimated residence time will reduce the throughout per unit time. Therefore, it is
highly desirable to maintain the residence time at a reasonable level. The residence time, in
practice, can vary from a few minutes to a few days, depending on the reaction rate.
1 Residence time is mainly related to reaction kinetics or reaction rate.
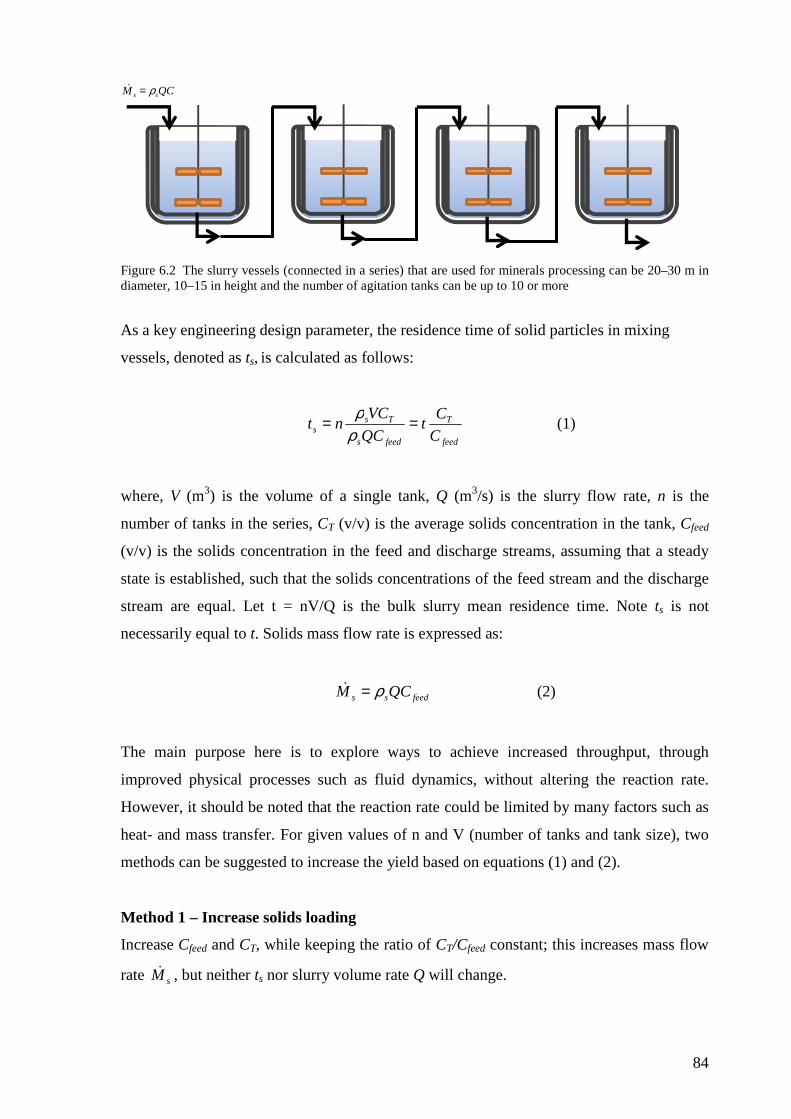
84
Figure 6.2 The slurry vessels (connected in a series) that are used for minerals processing can be 20–30 m in diameter, 10–15 in height and the number of agitation tanks can be up to 10 or more
As a key engineering design parameter, the residence time of solid particles in mixing
vessels, denoted as ts, is calculated as follows:
feed
T
feeds
Tss C
Ct
QC
VCnt ==
ρρ
(1)
where, V (m3) is the volume of a single tank, Q (m3/s) is the slurry flow rate, n is the
number of tanks in the series, CT (v/v) is the average solids concentration in the tank, Cfeed
(v/v) is the solids concentration in the feed and discharge streams, assuming that a steady
state is established, such that the solids concentrations of the feed stream and the discharge
stream are equal. Let t = nV/Q is the bulk slurry mean residence time. Note ts is not
necessarily equal to t. Solids mass flow rate is expressed as:
feedss QCM ρ=& (2)
The main purpose here is to explore ways to achieve increased throughput, through
improved physical processes such as fluid dynamics, without altering the reaction rate.
However, it should be noted that the reaction rate could be limited by many factors such as
heat- and mass transfer. For given values of n and V (number of tanks and tank size), two
methods can be suggested to increase the yield based on equations (1) and (2).
Method 1 – Increase solids loading
Increase Cfeed and CT, while keeping the ratio of CT/Cfeed constant; this increases mass flow
rate sM& , but neither ts nor slurry volume rate Q will change.
QCM ss ρ=&

85
Method 2 – Increase solids retention time
Increase the solids concentration in tanks to be higher value than that in the feed which will
increase the solids loading ratio CT/Cfeed. The slurry flow rate Q can also be increased
proportionally with the solids loading ratio so as to maintain the solids residence time ts (eq.
1). This method essentially involves boosting the bulk slurry flow rate, without reducing
the required solids residence time ts, which is made longer than the superficial residence
time t, due to solids stratification in the tanks.
This approach can be expressed as:
tts > for CT/Cfeed>1 (3)
To maximize the yield (mass flow rate), the slurry volume flow rate can be increased while
maintaining the same solids residence time. On the other hand, the solids residence time ts
can be increased proportionally to improve metal recovery for certain processes, while
maintaining the same slurry flow rate Q.
Either of these two approaches can be explored depending on the process conditions to
increase the yield, thus achieving intensification of the process.
6.3 Results and discussion:
6.3.1 Method 1: Increased solids concentration: Upper limit of solids concentration
To achieve the purpose of intensification using higher solids loading, it is important to
investigate the operational characteristics associated with the greater amount of solids.
Based on equation (2), an increase in Cfeed and CT leads to an increase in mass flow rate of
solids, but its residence time remains unchanged.

86
0
200
400
600
800
1000
1200
0.00 0.20 0.40 0.60 0.80 1.00
Cv/Cvb
Pjs
/V (
W/m
3)
Maximum attaineable solids Cv=0.90 Cvb
Figure 6.3 Power consumption (Pjs/V) vs. normalized solids concentration, at just-off-bottom solids suspension condition, mixing tank diameter 0.39 m, liquid height 0.390 m, solids: glass particles of d = 0.12 mm, fluids: tap water. Turbine: 30 PBT6. Impeller diameter 0.160 m, blade width 1/5 of diameter, 4 x baffles, with 1/12 tank diameter width. (Cvb=0.58 v/v)
Figure 6.3 shows experimental results of impeller power per unit slurry volume (Pjs/V)
required to ‘just suspend’ solid particles off the tank bottom, as a function of solid volume
concentration Cv (v/v). The impeller used was a downward pumping 30º-pitch-bladed
impeller, with six blades, operating in the water/glass slurry. It can be seen that the specific
power increases rapidly as the concentration approaches Cv= 0.50 - 0.52, or approximately
85 – 90% of Cvb=0.582. It is practically impossible to go far beyond this value, due to a
drastic increase in the motor power requirement. Similar results have been reported by Wu
et al. (2002, 2009a).
It is, therefore, prudent to use 90.0≈bv
v
C
C as the upper limit of the solids concentration for
practical applications. It must be pointed out that the study mentioned above is mainly
focused on baffled condition. Studies associated with an unbaffled condition should be
investigated further.
2 Cvb is usually referred to as the bed-packing coefficient.
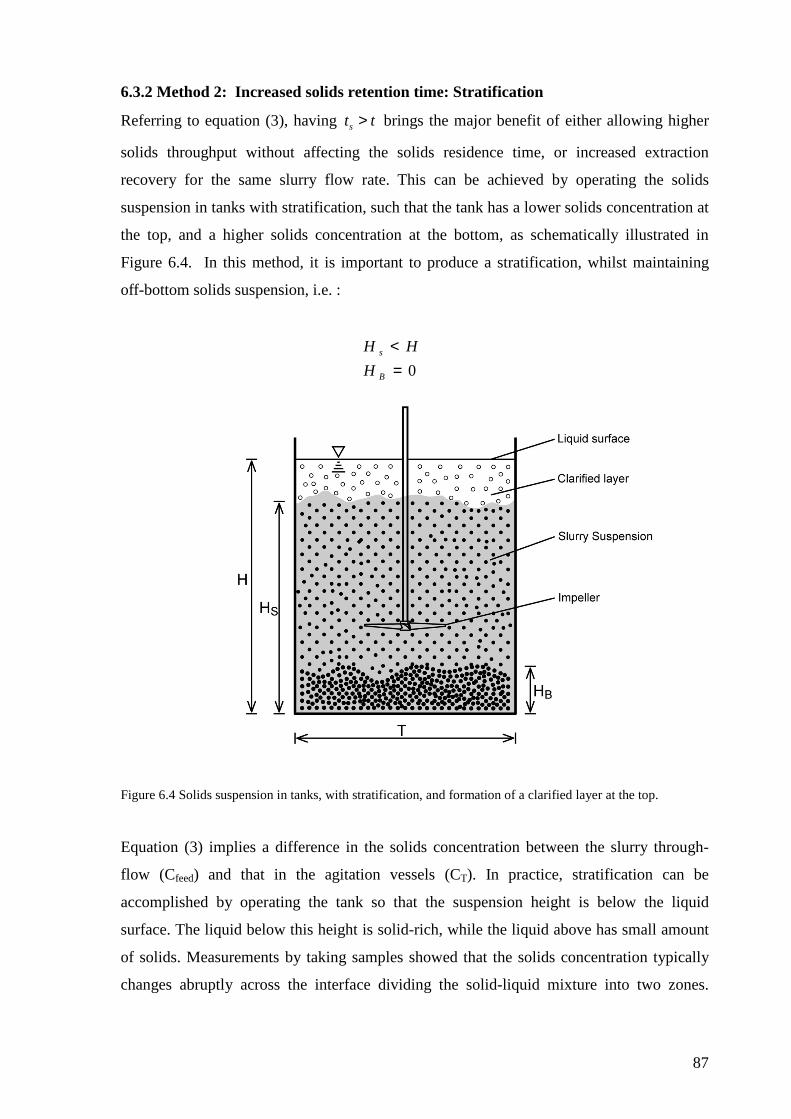
87
6.3.2 Method 2: Increased solids retention time: Stratification
Referring to equation (3), having tts > brings the major benefit of either allowing higher
solids throughput without affecting the solids residence time, or increased extraction
recovery for the same slurry flow rate. This can be achieved by operating the solids
suspension in tanks with stratification, such that the tank has a lower solids concentration at
the top, and a higher solids concentration at the bottom, as schematically illustrated in
Figure 6.4. In this method, it is important to produce a stratification, whilst maintaining
off-bottom solids suspension, i.e. :
0=<
B
s
H
HH
Figure 6.4 Solids suspension in tanks, with stratification, and formation of a clarified layer at the top.
Equation (3) implies a difference in the solids concentration between the slurry through-
flow (Cfeed) and that in the agitation vessels (CT). In practice, stratification can be
accomplished by operating the tank so that the suspension height is below the liquid
surface. The liquid below this height is solid-rich, while the liquid above has small amount
of solids. Measurements by taking samples showed that the solids concentration typically
changes abruptly across the interface dividing the solid-liquid mixture into two zones.

88
However, the solids concentrations within both zones are found to be practically constant
(a low value in the upper zone and a high value in the lower zone).
0.00
0.10
0.20
0.30
0.40
0.50
0 100 200 300 400N (rpm)
HB/H
0.00
0.20
0.40
0.60
0.80
1.00
1.20
Hs/
H
Hb/T: DT6Hb/T: 45PBT4Hb/T: A310Hs/T: DT6Hs/T: 45PBT4Hs/T: A310
Njs Njs Njs
DT6 A31045PBT4
Hs
HB
(a)
(b)
Figure 6.5 (a) Suspension height vs. impeller speed & sedimentation bed height vs. impeller speed, impellers: DT6, 45PBT4, A310; (b) suspension height vs. impeller speed, impeller: 30PBTα, number of blades 2–6 (Wu et al. 2009a). Impeller diameter 160mm; 130mm to tank bottom, tank diameter 390mm, liquid height 420mm. Solid particle d50=105µm, SG=2.5, concentration = 0.2 v/v. Fluid: water. T here refers to liquid height.
0
0.2
0.4
0.6
0.8
1
1.2
1.4
1.6
0 100 200 300 400 500 600
N (rpm)
Hs/
T No.blade=2 =3 =4 =5 =6
fully suspended & stratified
Njs Njs
30PBT6 30PBT2
Hs/T<1

89
A set of suspension experiments was conducted to evaluate the feasibility of operating the
tank with stratification. Figures 6.5a represents the suspension height as a function of speed
for the three representative impellers, radial flow impeller (DT6), axial flow impeller
(A310) and mixed flow impeller (45PBT4). Wu et al. (2009a) reported that suspension
height is dependent on the impeller speed, and a decrease in impeller speed leads to a
reduction in slurry height, for the case of pitched-bladed impellers (refer to Figure 6.5b).
Similar results can be seen in Figure 6.5a based on the three representative impellers. It is
vital to maintain the slurry height Hs less than the liquid height, at the just-off-bottom
condition, as suggested by equation (3).
Figures 6.5 (b) suggest that within the range of 280–500 rpm, solids are being suspended
under baffled conditions by all the pitch-bladed impellers, while keeping the suspension
height lower than the liquid level (Wu et al., 2009a). However, it can be seen from Figure
6.5(a) that at/above the ‘just-suspended speed’, there is an exception in the case of Rushton
turbine(DT6), where stratification as a method to increase the solids retention time seems
infeasible due to the homogeneous solids distribution in the whole vessel (Hs/H=1).
Fiugre 6.5(a) and (b) suggest that it is possible to select an impeller speed range to achieve
both off-bottom suspension and stratification in the tank. To achieve stratification, other
strategies such as increasing the liquid level and installing horizontally oriented baffles
could be used. Wu et al. (2009a) pointed out that stratification is likely to decrease the
mixing rate. However, for slowly reacting slurry systems which are typical in mineral
processing operations, where reaction kinetics are not diffusion limited (i.e., the chemical
reaction rate is significantly lower than the physical diffusion rate which is influenced by
the fluid mechanics), it is sufficient to design the agitation based on off-bottom solids
suspension. Such chemical reactions can be maintained as long as there is sufficient contact
between the solids and the liquid phase. Thus, stratification is not problematic in the
context of minerals engineering because the mixing rate is often an order of magnitude
higher than that of the reaction rate. As long as the suspension height can be maintained at
an appropriate level, the reaction can still take place to a reasonable degree.
6.3.3 Improved energy efficiency for suspending high solids concentration
Figures 6.6 (a) and (b) compare the specific power values for different types of impellers at
a solid loading of 0.4 v/v under baffled and unbaffled conditions, respectively. It can be

90
seen that, under baffled condition, it is more energy efficient to use axial flow impellers
than radial impellers to suspend solids (Figure 6.6a). It is also interesting to see that the
four-bladed turbines DT4 (Np= 4.1) and 30PBT4 (Np=0.66) are more energy efficient than
the three-bladed turbines DT3 (Np= 3.2) and 30PBT3 (Np= 0.53). This is consistent with the
earlier results (refer to Chapter 4 and Chapter 5) that a high power number impeller is more
energy efficient than a low power number impeller at high solids concentration.
0.00
0.20
0.40
0.60
0.80
1.00
DT4 DT3 30PBT4 30PBT3
Impeller Type
εjs (
W/k
g)
High concentration, Cv=0.4 v/v,with baffles
(a)
0.00
0.20
0.40
0.60
0.80
1.00
DT4 DT3 30PBT4 30PBT3
Impeller Type
εjs (
W/k
g)
High concentration, Cv=0.4 v/v,without baffles
(b)

91
Figure 6.6 Specific power at the just-off-bottom solids suspension condition at a solids loading of 0.40 (v/v). Impeller diameter D = 0.16m, C/T = 1/3, H/T = 1, T = 0.39 m. Fluid: water. Glass particles. water slurry, particle size 0.12mm, SG=2.5. (a)baffled condition; (b) unbaffled condition.
Under unbaffled condition, a dramatic reduction in power is achieved for all impeller types
as is evident from Figure 6.6 (b). It is also interesting to note that the difference between
radial and axial flow impeller in terms of specific power is marginal under this condition
(without installation of baffles). Without installation of baffles, it also appears that a higher
number of blades leads to reduced specific power suggesting that energy efficiency is
higher for higher power number impellers when operating at high solids concentration.
Figure 6.6 (b) reinforces a feature mentioned earlier (Figure 4.4), that radial flow impellers
are more efficient than axial flow impellers and mixed flow impellers, when baffles are
removed.
Tthe removal of baffles is shown in this thesis as an effective way to drastically reduce the
specific power for suspending solid particles off the tank bottom, even at a very high solids
concentration. This method can be utilized to significantly improve the energy efficiency of
slurry mixing tanks.
Obviously, operating at solids loading << 0.2 (v/v) is wasteful due to lower energy
efficiency and lower utilization of tank facilities. Unfortunately, it is still not uncommon to
see slurry tanks operating at such low solids loadings in the mineral industry.
6.3.4 Side effect of removal of baffles
The mixing rate can be quantified by measuring the time required to homogenize the liquid
phase, i.e. the mixing time tm. This was carried out by injecting a salt tracer solution into the
tank through a dip tube submerged below the liquid surface, and recording the salt
concentration with time using conductivity probes placed at multiple locations in the tank.
The effect of removal of baffles on the mixing time is shown in Figure 6.7* as an example.
The time started at the moment the tracer salt solution was injected; and the salt
concentration as recorded by a conductivity probe increased and approached to an
asymptotic level, after a period of time defined as the mixing time. It can be seen that from
Figure 6.7 that the mixing time increased from tm≈20 sec with baffles installed to

92
approximately tm≈32 sec, after the baffles were removed. Wu et al. (2009 a,b) suggested
that removal of baffles would result in a reduction in mixing rate (or increased mixing
time) due to an apparent whole body rotation of the slurry. However, Wu et al. also
mentioned that sufficient mixing (homogenous mixing) can be still achieved after a longer
period of time upon removing the baffles, compared with that with baffles installed.
A side effect with baffles removed is increased mixing time. This is usually not a problem
in the mineral processing industry, where the slurry residence time are typically an order of
magnitude larger than the mixing time. For example, for a gold leaching process, 20~40
hours leaching residence time is not uncommon, whilst the mixing time is an order of 5~10
minutes (Marsden and House, 2006).
0
40
80
120
160
200
0 50 100 150 200 250 300 Time (Sec)
Sal
t C
on
cen
trat
ion
(p
pm
)
No Baffles
4x Baffles
t=t m , (mixing time)
Figure 6.7 Mixing time measurements: the effect of baffles. The agitator design with an A310 at the bottom,
D/T=0.48, and an RTF4 at the top, baffles installed or removed; tank diameter T = 1.0 m, liquid height 1.15
m, solids loading 0.4 v/v (*Data from CSIRO-Fluid Engineering Group, private communication).

93
6.4 Intensification case example
To illustrate the benefits of process intensification by operating the mixing vessel with a
higher solids concentration, a case example based on a full-scale tank in a mineral
processing plant is shown in Table 6.1*.
Table 6.1 Case example of a full-scale mineral leaching tank, effect of process intensification
Parameters Existing Design New Design
No. of tanks 3 3
Tank diameter 9.5 m 9.5 m
Tank liquid height 26 m 26 m
Baffles 4 vertical Removed
Agitator 2 × 45PBT4 2 × 45PBT4
Optimum Cv for the
agitator
30% v/v 33% v/v
Agitator diameter 3.8 m 3.8 m
Agitator speed 22.0 rpm 25.2 rpm
Speed margin above Njs +10% +10%
Agitator power 118 kW 114 kW
Liquid density 1000 kg/m3 1000 kg/m3
Solids density 2820 kg/m3 2820 kg/m3
Particle size d80 70 µm 70 µm
Solids concentration (CT) 0.16 v/v 0.33 v/v
Slurry bulk flow 160 m3/hr 293 m3/hr
Product solids throughput 72 ton/hr 293 ton/hr
Solids residence time 23.88 hr 23.93 hr
Bulk flow residence time 23.88 hr 11.58 hr
* Data from CSIRO Fluids Engineering group (private communication)

94
The above case study was based on an existing design. Three slurry tanks of 9.5 m diameter
and 26 m in height connected in a series were employed for a continuous leaching operation
to produce a solids mass throughput of 96 ton/hr at a design residence time of 23.8 hours,
which is required for the completion of a full metal extraction.
A modified design was developed with baffle removal and the agitator speed was increased.
The tank was operated at a higher solids concentration of 0.33 v/v, which is significantly
higher than that used in the original design (0.16 v/v). It can be seen from Table 6.1 that the
agitator power with the new design is even less than that of the original design, even with a
substantial increase in the shaft speed, owing to the removal of baffles.
It can be seen that operating at higher solids loading, an increase in product solids flow rate
from 72 to 149 ton/hr is accomplished with the new design. This represents a massive
+107% increase in yield with minimum design changes which involves the removal of
baffles. This change also minimise the capital input that will be required for a gear box
retrofitting for a speed upgrade. The agitation system, based on the new design, can
therefore be regarded as operating at its most energy-efficient condition, with an optimum
loading of solids. In Chapter 4, it was reported that for the 45PBT4 impeller, the best solids
suspension agitation energy efficiency is achieved at a solids concentration of 0.33 v/v
under unbaffled condition.
The benefits of process intensification by operating with an increased solids concentration
in a full-scale tank can be thus summarized as follows: a) preservation (or even reduction)
of power consumption; b) increase in yield; c) improvement in energy efficiency.
6.5 Conclusion
In this chapter, the concepts and relationships for using high solids concentration for
process intensification are outlined. It can be stated that high solids concentration and
stratification in tanks lead to increased yield. For slowly reacting slurry systems in mineral
processing operations, it is sufficient to design the agitation based on off-bottom solids
suspension.
95
Improved energy efficiency is critical for operating at high solids concentration. This can
be achieved by using large power number impellers, and the removal of baffles. The
feasibility of producing stratification whilst maintaining off-bottom solids suspension is
demonstrated. The benefits of process intensification is illustrated by a case study based on
a full-scale design, which showed +107% increase in the throughput with a relatively
simple design change and consuming same amount of power.

96
CHAPTER
7.0
Conclusions and Recommendations
97
Chapter 7
CONCLUSIONS AND RECOMMENDATIONS
7.1 Conclusion
The present study, through extensive experimentation and mathematical evaluation,
systematically investigates the effects of various variables such as solids concentration,
impeller type and baffling conditions on specific power consumption in solid-liquid
mechanically agitated vessels.
Power measurements in this study are linked to the mass of solids suspended in the
agitation system based on the consideration that the rates of dissolution and reaction can to
a great extent be related to the exposure of maximum surface area to liquid or amount of
solids, but actually not be affected by the volume of the system or agitation once complete
suspension is achieved.
Experimental results indicate that power per unit solids mass generally decreases with
solids concentration, reaches a minimum value and thereafter increases, for all impeller
types used. It is found that, therefore, the specific power can be minimized by operating at
an optimum solids concentration, in the range of 20 – 35% (v/v) for the slurry properties,
impeller types and baffling conditions considered in this paper. These results also suggest
that operating the process at higher solids concentration is superior to that with low solids
loading owing to relatively low specific power input required for operating the tanks with
greater amount of solids.
Predictions of a mathematical equation based on previous correlations (Zwietering, 1958;
Bubbico et al., 1998; Wu et al., 2002) demonstrate that all suspensions have an optimum
solids concentration where the power per unit mass of solids is at a minimum. However, the
actual model predictions need further refinement to better simulate the power data over a
range of solid concentration.
An enhancement factor Rε is defined to determine the savings in specific power input due
to the removal of baffles. It is concluded that εR < 1 in all the cases tested, suggesting that
the specific power required to suspend solids from a vessel bottom generally decreases on
98
removal of the baffles in the range of solids concentration used in this work (6 – 40% v/v).
It also appears that at high solids concentration, Cv= 40% v/v, a dual radial impeller
geometry is most sensitive to baffle removal of all the impellers tested and significant
energy saving can be achieved by removing the baffles for this impeller arrangement too.
It can be stated that high solids concentration and stratification in tanks lead to increased
yield. For slowly reacting slurry systems in mineral processing operations, it is preferable to
design the agitation based on off-bottom solids suspension.
Improved energy efficiency is critical for operating the solid-liquid agitated vessels at high
solids concentration. This can be achieved by using large power number impellers and the
removal of baffles.

99
7.2 Recommendations for future studies
The present study used a tank with a diameter of 0.390 m for all the tests. Further
investigations are required using relatively larger tanks to determine the effect of scale on
specific power consumption. Optimum solids concentration could vary with a change in
tank diameter.
In this study, the maximum glycerol concentration used was 70% w/w. It was found that
specific power increases with increasing glycerine concentration. Further studies using
higher glycerol concentration are recommended.
100
References
Armenante, P.M. & Li, T., “Minimum Agitation Speed for Off-Bottom Suspension of
Solids in Agitated Vessels Provided with Multiple Flat-Blade Impellers,” AIChE Symp. Ser.
Part II 89, 105–111 (1993).
Atkins, P., “Physical chemistry,” 6th Edi., New York: Freeman, 825-828 (1998).
Baldi, G., Conti, R. & Alaria, E., “ Complete Suspension of Particles in Mechanically
Agitated Vessels,” Chem. Eng. Sci. 76, 21-25 (1978).
Bakker A., Fasano, J.B. & Myers, K.J., “Effect of Flow Pattern on Solids Distribution in a
Stirred Tank,” The Online CFM Book (1998).
Bubbico, R., Di Cave, S. & Mazzarotta, B., “Agitation Power for Solid-Liquid Suspensions
Containing Large Particles,” Canadian Journal of Chemical Engineering 76 (1998).
Bujalski, W., Takenaka, K., Paolilni, S., Jahoda, M., Paglianti, A., Takahashi, A., Nienow,
A.W.& Etchells, A.W., “Suspensions and Liquid Homogenisation in High Solids
Concentration Stirred Chemical Reactors,” Trans. IchemE. 77, 241-247 (1999)
Bourne, J.R. & Sharma, R.N., “ Homogenous Particle Suspension in Propeller-Agitated
Flat Bottom Tanks,” Chem. Eng. J. 8, 243-250 (1974)
Chapman, C.M., Nienow, A.W., Cook, M. & Middleton, J.C., “Particle-Gas-Liquid Mixing
in Stirred Vessels. Part I: Particle-Liquid Mixing,” Chem. Eng. Res. Des. 61, 71-81
(1983a).
Chapman, C.M., Nienow, A.W., Cook, M. & Middleton, J.C., “Particle-Gas-Liquid Mixing
in Stirred Vessels. Part III: Three Phase Mixing,” Chem. Eng. Res. Des. 61, 167-181
(1983b).

101
Chowdry, N.H., Penney, W.R., Myers, K.J. & Raasano, J.B., “An Experimental
Investigation of Solids Suspension at High Solids Loadings in Mechanically Agitated
Vessels, Industrial Mixing Fundamental with Applications,” AIChE Symp. Ser. 305, 91,
131–138 (1995).
Drewer, G.R., Ahmed, N. & Jameson, G.J., “Suspension of High Concentration Solids in
Mechanically Stirred Vessels,” IChemE Symp. Ser. 136, 41 (1994).
Drewer, G.R., Ahmed, N. & Jameson, G.J., “An Optimum Concentration for the
Suspension of Solids in Stirred Vessels,” Mixing and Crystallization, (2000).
Dutta, N.N. & Pangarkar, V.G., “Critical Impeller Speed for Solid Suspension in Multi-
Impeller Agitated Contactors: Solid-Liquid System,” Chem. Eng. Comm. 137, 135–146
(1995).
Einenkel, W.D. & Mersmann, A., “ Erforderliche Drekzaken zum Suspension ia
Riihrerben,” Verfahrenstechnik, 11, 90-94 (1977)
Frijlink, J.J., Bakker, A. & Smith, J.M., “Suspension of Solid Particles with Gasses
Impellers,” Chem. Eng. Sci. 45, 1703–1718 (1990).
Geisler, R.K., Buurman, C. & Mersmsann, A.B., “ Proc. 7th European Conf. on Mixing,”
Brugge, BHRA, Cranfiled, 451-459 (1991).
Harnby, N., Edwards, M.F. & Niewnow, A.W., Mixing in the Process Industries,
Butterworths, London, U.K. (1985).
Hicks, M.T., Myers, K.J. and Bakker, A.., “Cloud Height in Solids Suspension
Agitation,”Chem. Engg. Comm. 160, 137-155 (1997).
Ibrahim S. & Nienow, A.W., “Particle Suspension in the Turbulent Regime: The Effect of
Impeller Type and Impeller/Vessel Configuration,” Trans IChemE 74, Part A (1996).

102
Ibrahim S. & Nienow, A.W., “Comparing Impeller Performance for Solid-Suspension in
the Transitional Flow Regime with Newtonian Fluids,” Trans IChemE 77, Part A (1999).
Kasat, G.R. & Pandit, A., “Review on Mixing Characteristics in Solid-Liquid and Solid-
Liquid-Gas Reactor Vessel,” Canadian Journal of Chemical Engineering 83 (2005).
Kraume, M., “Mixing Time in Stirred Suspension,” Chem. Eng. Tech. 15, 313-318 (1992).
Lu, W.M., Wu, H.Z. & Ju, M.Y., “Effect of Baffle Design on the Liquid Mixing in an
Aerated Stirred Tank with Standard Rushton Turbine Impellers,” Chem. Eng. Sci. 52,
3843–3851 (1997).
Markopoulos, J., Babalona, E. & Tsiliopoulou E., “Power Consumption in Agitated Vessels
with Dual Rushton Turubines: Baffle Length and Impeller Spacing Effects,” Chem. Eng.
Technol. 27, 11 (2004).
Markopoulos, J., Babalona, E., Tsiliopoulou, E. & Tasopoulou, K., “Power Consumption in
Agitated Vessels with Dual Pitched Blade Turbines: Baffle Length and Impeller Spacing
Effects,” Chem. Eng. Technol. 28, 9 (2005).
Marsden, J.O. & House, C.I., “Leaching,” The Chemistry of Gold Extraction, the Society
for Mining, Metallurgy, and Exploration, Inc, USA (2006).
Micale, G., Grisafi, T. & Brucato, A., “Assessment of Particle Suspension Conditions in
Stirred Vessels by Means of Pressure Gauge Technique,” Chemical Engineering Research
and Design, 80 (8), 893-902 (2002).
Musil, L.,” Hydrodynamics of Mixed Crystallizers.” Collection of Czechoslovak Chemical
Commun. 41 (3), 839-852 (1976).
Musil, L. & Vlk, J., “Suspending Solid Particles in an Agitated Conical-bottom Tank,”
Chem. Eng. Sci. 33, 1123-1131 (1978).

103
Nishikawa, M., Ashiwake, K., Hashimoto, N. & Nagata, S., “Agitation Power and Mixing
Time in Off-Centering Mixing,” Int. Chem. Eng. 19(1), 153–159 (1979).
Nienow, A. W., ‘Suspension of Solid Particles in Turbine Agitated Baffled Vessel’ Chem.
Eng. Sci. 23, 1453-1459 (1968).
Nienow, A. W. and Elson, T. P., ‘Aspects of Mixing in Rheologically Complex Fluids’
Chem. Eng. Res. Des. 66, 5-15 (1988).
Nienow, A.W., “The Suspension of Solid Particles” in “Mixing in the Process Industries,”
2nd ed., N. Harnby, M.F. Edwards and A.W. Nienow, Eds. Butterworths, London, U.K.,
364-393 (1994)
Nocentini, M.F., Magelli, F. & Pasquali, G., “On the Modeling of the Gas Behaviour of
Gas-Liquid Vessels Stirred with Multiple Impellers,” 6th European Conference on Mixing,
Pavia, Italy (1988).
Paul, E.L., Atiemo-Obeng, V.A. & Kresta, A.M., Handbook of Industrial Mixing, Wiley-
Interscience, Hobokken, NJ, USA (2004).
Perry, R. H., Green, D. W. and Maloney, J. O, Perry’s Chemical Engineers’ Handbook, 7th
edition, McGraw-Hill, New York (1997).
Pour, S.B., Fradette, L. & Tanguy, P.A., “Laminar and Slurry Blending Characteristics of a
Dual Shaft Impeller System,” Trans IChemE, 85(A9), 1305–1313 (2007).
Raghavo Rao, K.S.M.S., Rewatkar, V.B. & Joshi, J.B., “Critical Impeller Speed for Solid
Suspension in Mechanically Agitated Contactors,” AIChE, 34, 1332–1340 (1998).
Ramshaw, C., “Process Intensification: a Game for n Players,” The Chemical Engineer,
July/Aug, 30-33 (1985).
Rewatkar, V.B., Raghava Rao, K.S.M.S & Joshi, J.B., “Critical Impeller Speed for Solid
Suspension in Mechanically Agitated Three-Phase Reactors. 1. Experimental Part,” Ind.
Eng. Chem. Res. 30, 1770-1784 (1991).

104
Selima, Y.S., Fangary, Y.S. & Mahmound, N.A., “ Determination of Minimum Speed
required for Solids Suspension in Stirried Vessels using Pressure Measurments,” the
Canadian Journal of Chemical Engineering, 86 (4), 661-668 (2008).
Tatterson, G.B., “Scaleup and Design of Industrial Mixing Processes,” McGraw-Hill, Inc.,
New York (1994).
Wu, J., Zhu, Y. & Pullum, L., “Impeller Geometry Effect on Velocity and Solids
Suspension,” Trans IChemE 79, Part A (2001).
Wu, J., Zhu, Y.G. & Pullum, L., “Suspension of High Concentration Slurry,” AIChE, 48, 6
(2002).
Wu, J., Nguyen, B. & Graham, L., “Energy Efficient High Solids Loading Agitation for the
Mineral Industry,” Canadian Journal of Chemical Engineering, In Press (2009a).
Wu, J., Nguyen, B. & Graham, L., “Mixing Intensification for the Mineral Industry,”
Canadian Journal of Chemical Engineering, In Press (2009b).
Zwietering, T.N., “Suspending of Solid Particles in Liquid by Agitators,” Chemical
Engineering Science 8, 244–253 (1958).

Appendix
Impeller Solids concentration (v/v
%)
Particle size (µm) Baffling condition
Viscosity (Pa.s) Njs (RPM) Specific power (W/kg)
DT6 (tk)1 10 120 Baffled 0.001 195 1.747 DT6 (tk) 15 120 Baffled 0.001 200 1.325 DT6 (tk) 20 120 Baffled 0.001 198 1.031 DT6 (tk) 25 120 Baffled 0.001 200 0.881 DT6 (tk) 30 120 Baffled 0.001 199 0.785 DT6 (tk) 35 120 Baffled 0.001 205 0.761 DT6 (tk) 40 120 Baffled 0.001 217 0.859 45PBT4 10 120 Baffled 0.001 201 0.339 45PBT4 15 120 Baffled 0.001 208 0.274 45PBT4 20 120 Baffled 0.001 217 0.245 45PBT4 25 120 Baffled 0.001 219 0.224 45PBT4 30 120 Baffled 0.001 249 0.283 45PBT4 35 120 Baffled 0.001 276 0.341 45PBT4 (tk) 16 120 Baffled 0.001 204 0.321 45PBT4 (tk) 23 120 Baffled 0.001 211 0.262 45PBT4 (tk) 27 120 Baffled 0.001 215 0.247 45PBT4 (tk) 30 120 Baffled 0.001 217 0.230 45PBT4 (tk) 33 120 Baffled 0.001 233 0.250 45PBT4 (tk) 40 120 Baffled 0.001 290 0.443 A310 (L)2 10 120 Baffled 0.001 264 0.441 A310 (L) 15 120 Baffled 0.001 269 0.333
1 tk means thicker blade, t/w=0.125; 2 L means larger blade, D/T=0.46; otherwise D/T=0.41

A310 (L) 20 120 Baffled 0.001 268 0.261 A310 (L) 25 120 Baffled 0.001 268 0.237 A310 (L) 30 120 Baffled 0.001 281 0.230 A310 (L) 35 120 Baffled 0.001 297 0.235 A310 (L) 40 120 Baffled 0.001 310 0.248 A310 (S) 16 120 Baffled 0.001 263 0.231 A310 (S) 23 120 Baffled 0.001 277 0.213 A310 (S) 27 120 Baffled 0.001 293 0.208 A310 (S) 30 120 Baffled 0.001 312 0.232 A310 (S) 33 120 Baffled 0.001 328 0.238 A310 (S) 40 120 Baffled 0.001 347 0.250 DT6 (tk) 6 120 Unbaffled 0.001 150 0.271 DT6 (tk) 16 120 Unbaffled 0.001 152 0.147 DT6 (tk) 26 120 Unbaffled 0.001 158 0.133 DT6 (tk) 31 120 Unbaffled 0.001 165 0.131 DT6 (tk) 33 120 Unbaffled 0.001 169 0.128 DT6 (tk) 37 120 Unbaffled 0.001 181 0.148 DT6 (tk) 40 120 Unbaffled 0.001 198 0.180 45PBT4 (tk) 6 120 Unbaffled 0.001 210 0.369 45PBT4 (tk) 16 120 Unbaffled 0.001 196 0.237 45PBT4 (tk) 26 120 Unbaffled 0.001 205 0.156 45PBT4 (tk) 31 120 Unbaffled 0.001 210 0.136 45PBT4 (tk) 33 120 Unbaffled 0.001 217 0.126 45PBT4 (tk) 37 120 Unbaffled 0.001 239 0.162 45PBT4 (tk) 40 120 Unbaffled 0.001 264 0.194 A310 6 120 Unbaffled 0.001 329 0.457 A310 16 120 Unbaffled 0.001 321 0.345 A310 26 120 Unbaffled 0.001 325 0.217 A310 31 120 Unbaffled 0.001 336 0.196

A310 33 120 Unbaffled 0.001 340 0.183 A310 37 120 Unbaffled 0.001 364 0.199 A310 (S) 40 120 Unbaffled 0.001 387 0.219 2 × A310 6 120 Unbaffled 0.001 305 0.550 2 × A310 16 120 Unbaffled 0.001 293 0.427 2 × A310 26 120 Unbaffled 0.001 297 0.242 2 × A310 31 120 Unbaffled 0.001 301 0.242 2 × A310 33 120 Unbaffled 0.001 308 0.172 2 × A310 37 120 Unbaffled 0.001 331 0.172 2 × A310 40 120 Unbaffled 0.001 359 0.198 A310 16 120 Unbaffled 0.001 273 0.321 A310 26 120 Unbaffled 0.001 275 0.184 A310 31 120 Unbaffled 0.001 280 0.175 A310 33 120 Unbaffled 0.001 289 0.167 A310 37 120 Unbaffled 0.001 301 0.170 A310 40 120 Unbaffled 0.001 331 0.204 DT6 20 159 Unbaffled 0.001 162 0.155 DT6 25 159 Unbaffled 0.001 165 0.141 DT6 30 159 Unbaffled 0.001 184 0.163 DT6 33 159 Unbaffled 0.001 196 0.183 DT6 37 159 Unbaffled 0.001 208 0.205 45PBT4 20 159 Unbaffled 0.001 225 0.200 45PBT4 25 159 Unbaffled 0.001 227 0.174 45PBT4 30 159 Unbaffled 0.001 245 0.183 45PBT4 33 159 Unbaffled 0.001 256 0.199 45PBT4 37 159 Unbaffled 0.001 267 0.215 A310 20 159 Unbaffled 0.001 352 0.252 A310 25 159 Unbaffled 0.001 356 0.234 A310 30 159 Unbaffled 0.001 380 0.246

A310 33 159 Unbaffled 0.001 401 0.270 A310 37 159 Unbaffled 0.001 422 0.297 DT6 10 337 Unbaffled 0.001 196 0.510 DT6 15 337 Unbaffled 0.001 204 0.475 DT6 20 337 Unbaffled 0.001 212 0.436 DT6 25 337 Unbaffled 0.001 228 0.477 DT6 30 337 Unbaffled 0.001 244 0.523 45PBT4 10 337 Unbaffled 0.001 264 0.616 45PBT4 15 337 Unbaffled 0.001 280 0.562 45PBT4 20 337 Unbaffled 0.001 289 0.523 45PBT4 25 337 Unbaffled 0.001 311 0.546 45PBT4 30 337 Unbaffled 0.001 333 0.570 A310 10 337 Unbaffled 0.001 415 0.845 A310 15 337 Unbaffled 0.001 427 0.723 A310 20 337 Unbaffled 0.001 440 0.621 A310 25 337 Unbaffled 0.001 453 0.658 A310 30 337 Unbaffled 0.001 466 0.697 30PBT6 5 120 Baffled 0.001 220 0.656 30PBT6 10 120 Baffled 0.001 228 0.453 30PBT6 15 120 Baffled 0.001 201 0.247 30PBT6 20 120 Baffled 0.001 213 0.236 30PBT6 25 120 Baffled 0.001 220 0.222 30PBT6 30 120 Baffled 0.001 236 0.242 30PBT6 35 120 Baffled 0.001 269 0.312 30PBT6 40 120 Baffled 0.001 303 0.415 30PBT6 47 120 Baffled 0.001 420 0.905 DT4 6 120 Baffled 0.001 215 3.073 DT3 6 120 Baffled 0.001 235 2.680 30PBT6 6 120 Baffled 0.001 225 0.756

30PBT4 6 120 Baffled 0.001 237 0.756 30PBT3 6 120 Baffled 0.001 265 0.742 DT6 40 120 Baffled 0.001 191 0.564 DT4 40 120 Baffled 0.001 230 0.718 DT3 40 120 Baffled 0.001 257 0.814 30PBT6 40 120 Baffled 0.001 287 0.344 30PBT4 40 120 Baffled 0.001 325 0.353 30PBT3 40 120 Baffled 0.001 377 0.376 2 × DT4 40 120 Baffled 0.001 226 1.158 2 × 30PBT6 40 120 Baffled 0.001 246 0.320 2 × 45PBT4 40 120 Baffled 0.001 216 0.277 20PBT4 6 120 Baffled 0.001 313 0.732 20PBT4 40 120 Baffled 0.001 421 0.369 DT6 6 120 Unbaffled 0.001 143 0.271 DT4 6 120 Unbaffled 0.001 157 0.311 DT3 6 120 Unbaffled 0.001 157 0.313 30PBT6 6 120 Unbaffled 0.001 218 0.461 30PBT4 6 120 Unbaffled 0.001 233 0.475 30PBT3 6 120 Unbaffled 0.001 265 0.524 2 × DT4 6 120 Unbaffled 0.001 151 0.314 DT6 40 120 Unbaffled 0.001 161 0.114 DT4 40 120 Unbaffled 0.001 193 0.147 DT3 40 120 Unbaffled 0.001 200 0.160 30PBT6 40 120 Unbaffled 0.001 244 0.147 30PBT4 40 120 Unbaffled 0.001 259 0.155 30PBT3 40 120 Unbaffled 0.001 304 0.180 20PBT4 40 120 Unbaffled 0.001 340 0.183 45PBT4 6 120 Unbaffled 0.001 213 0.464 45PBT4 40 120 Unbaffled 0.001 248 0.149

2 × DT6 40 120 Unbaffled 0.001 168 0.098 2 × DT4 40 120 Unbaffled 0.001 165 0.103 2 × 45PBT4 40 120 Unbaffled 0.001 239 0.164 DT6 40 159 Baffled 0.001 214 0.774 DT4 40 159 Baffled 0.001 240 0.824 30PBT6 40 159 Baffled 0.001 366 0.716 30PBT4 40 159 Baffled 0.001 402 0.770 DT6 40 159 Unbaffled 0.001 212 0.235 DT4 40 159 Unbaffled 0.001 220 0.244 30PBT6 40 159 Unbaffled 0.001 268 0.191 30PBT4 40 159 Unbaffled 0.001 292 0.218 DT6 40 67 Unbaffled 0.001 181 0.110 DT4 40 67 Unbaffled 0.001 193 0.113 30PBT6 40 67 Unbaffled 0.001 249 0.114 30PBT4 40 67 Unbaffled 0.001 256 0.116 DT6 40 67 Baffled 0.001 184 0.489 DT4 40 67 Baffled 0.001 206 0.557 30PBT6 40 67 Baffled 0.001 278 0.251 30PBT4 40 67 Baffled 0.001 284 0.265 DT6 40 337 Unbaffled 0.001 268 0.591 DT4 40 337 Unbaffled 0.001 292 0.640 30PBT6 40 337 Unbaffled 0.001 346 0.500 30PBT4 40 337 Unbaffled 0.001 377 0.542 DT6 10 120 Baffled 0.023 208 2.322 DT6 15 120 Baffled 0.023 211 1.642 DT6 20 120 Baffled 0.023 221 1.479 DT6 25 120 Baffled 0.023 228 1.324 DT6 30 120 Baffled 0.023 235 1.187 DT6 35 120 Baffled 0.023 242 1.177

DT6 40 120 Baffled 0.023 261 1.278 30PBT6 5 120 Baffled 0.023 223 0.834 30PBT6 10 120 Baffled 0.023 228 0.561 30PBT6 15 120 Baffled 0.023 239 0.399 30PBT6 20 120 Baffled 0.023 246 0.348 30PBT6 25 120 Baffled 0.023 248 0.324 30PBT6 30 120 Baffled 0.023 261 0.339 30PBT6 40 120 Baffled 0.023 286 0.385 DT4 40 120 Baffled 0.023 272 1.120 30PBT4 40 120 Baffled 0.023 326 0.409 DT4 40 120 Unbaffled 0.023 234 0.408 30PBT4 40 120 Unbaffled 0.023 292 0.261 DT6 40 120 Unbaffled 0.023 219 0.392 30PBT6 40 120 Unbaffled 0.023 261 0.236