Embed Size (px)
Citation preview

Susquehanna Area Regional Airport Authority
Independent Auditor’s Report and Financial Statements
December 31, 2019 and 2018

Susquehanna Area Regional Airport Authority December 31, 2019 and 2018
Contents
Independent Auditor’s Report ............................................................................................... 1
Management’s Discussion and Analysis ............................................................................. 3
Financial Statements
Statements of Net Position ............................................................................................................... 16
Statements of Revenues, Expenses and Changes in Net Position .................................................... 18
Statements of Cash Flows ................................................................................................................ 19
Notes to Financial Statements .......................................................................................................... 21
Supplementary Information
Schedules of Capital and Noncapital Revenues and Expenses ........................................................ 39
Schedules of Airline and Non-Airline Revenues.............................................................................. 40
Independent Auditor’s Report Board of Directors Susquehanna Area Regional Airport Authority Middletown, Pennsylvania We have audited the accompanying financial statements of Susquehanna Area Regional Airport Authority (SARAA), as of and for the years ended December 31, 2019 and 2018, and the related notes to the financial statements, which collectively comprise SARAA’s basic financial statement as listed in the table of contents.
Management’s Responsibility for the Financial Statements
Management is responsible for the preparation and fair presentation of these financial statements in accordance with accounting principles generally accepted in the United States of America; this includes the design, implementation and maintenance of internal control relevant to the preparation and fair presentation of financial statements that are free from material misstatement, whether due to fraud or error.
Auditor’s Responsibility
Our responsibility is to express an opinion on these financial statements based on our audits. We conducted our audits in accordance with auditing standards generally accepted in the United States of America. Those standards require that we plan and perform the audit to obtain reasonable assurance about whether the financial statements are free from material misstatement.
An audit involves performing procedures to obtain audit evidence about the amounts and disclosures in the financial statements. The procedures selected depend on the auditor’s judgment, including the assessment of the risks of material misstatement of the financial statements, whether due to fraud or error. In making those risk assessments, the auditor considers internal control relevant to the entity’s preparation and fair presentation of the financial statements in order to design audit procedures that are appropriate in the circumstances, but not for the purpose of expressing an opinion on the effectiveness of the entity’s internal control. Accordingly, we express no such opinion. An audit also includes evaluating the appropriateness of accounting policies used and the reasonableness of significant accounting estimates made by management, as well as evaluating the overall presentation of the financial statements.
We believe that the audit evidence we have obtained is sufficient and appropriate to provide a basis for our audit opinion.

2
Opinion
In our opinion, the financial statements referred to above present fairly, in all material respects, the financial position of Susquehanna Area Regional Airport Authority as of December 31, 2019 and 2018, and the changes in its financial position and its cash flows for the years then ended in accordance with accounting principles generally accepted in the United States of America.
Other Matters
Required Supplementary Information
Accounting principles generally accepted in the United States of America require that the management’s discussion and analysis, as listed in the table of contents, be presented to supplement the basic financial statements. Such information, although not a part of the basic financial statements, is required by the Governmental Accounting Standards Board, who considers it to be an essential part of financial reporting for placing the basic financial statements in an appropriate operational, economic or historical context. We have applied certain limited procedures to the required supplementary information in accordance with auditing standards generally accepted in the United States of America, which consisted of inquiries of management about the methods of preparing the information and comparing the information for consistency with management’s responses to our inquiries, the basic financial statements and other knowledge we obtained during our audits of the basic financial statements. We do not express an opinion or provide any assurance on the information because the limited procedures do not provide us with sufficient evidence to express an opinion or provide any assurance.
Supplementary Information
Our audits were conducted for the purpose of forming an opinion on the financial statements that collectively comprise SARAA’s basic financial statements. The supplementary information, as listed in the table of contents, is presented for purposes of additional analysis and is not a required part of the basic financial statements. The supplementary information is the responsibility of management and was derived from and relates directly to the underlying accounting and other records used to prepare the basic financial statements. Such information has been subjected to the auditing procedures applied in the audit of the basic financial statements and certain additional procedures, including comparing and reconciling such information directly to the underlying accounting and other records used to prepare the basic financial statements or to the basic financial statements themselves, and other additional procedures in accordance with auditing standards generally accepted in the United States of America. In our opinion, the supplementary information is fairly stated, in all material respects, in relation to the basic financial statements as a whole.
Indianapolis, Indiana April 24, 2020

3
Susquehanna Area Regional Airport Authority Management’s Discussion and Analysis
December 31, 2019 and 2018 (Unaudited)
Management’s Discussion & Analysis (MD&A) of the financial performance and activity of the Susquehanna Area Regional Airport Authority (SARAA) is to provide the reader with an introduction to SARAA’s basic financial statements as of and for the years ended December 31, 2019 and 2018. The information contained in the basic financial statements, including the notes, is essential to a full understanding of the financial statement data.
SARAA is a joint municipal authority created in 1997 under the Pennsylvania Municipality Authorities Act. SARAA is governed by representatives from the counties of Dauphin, Cumberland and York, the cities of Harrisburg and York and the townships of Lower Swatara (Dauphin County) and Fairview (York County). SARAA is an independent entity governed by a board of directors who are not compensated. Each of the municipalities appoints representatives to serve for 5-year terms on the board that consists of 15 directors. Each county appoints three board members; each city appoints two board members; each of the two townships appoints one board member. The board members cannot be recalled during their term. After their term expires, they continue to serve until their sponsoring county, city or township replaces them or until they resign.
SARAA owns and operates four airports: 1) Harrisburg International Airport (HIA), primarily located in Lower Swatara Township, Dauphin County, Pennsylvania (Harrisburg International Airport is known as the MDT airport code. The airport is adjacent to the Borough of Middletown, PA) 2) Capital City Airport (CXY), located in Fairview Township, York County, Pennsylvania 3) the Franklin County Regional Airport (FCRA), located near Chambersburg, Pennsylvania, and 4) the Gettysburg Regional Airport (GRA), located near Gettysburg, Pennsylvania.
SARAA and the Harrisburg International Airport have no financial ties with the City of Harrisburg or any of the other appointing counties, cities or townships.
This MD&A is a section of the annual report required by Governmental Accounting Standards Board Statement (GASB) No. 34, Basic Financial Statements - and Management’s Discussion and Analysis - for State and Local Governments (GASB 34).
Industry Headlines and SARAA’s Activities and Highlights
The U.S. Department of Transportation’s Bureau of Transportation Statistics (BTS) reported Calendar Year (CY) 2019 U.S. total domestic revenue passenger miles flown increased by 4.4% when compared to PY 2018. Domestic scheduled capacity, measured by available seat-miles, increased 3.7% as well resulting in a load factor of 82.7%, increased from 2018’s 81.7%.
In January 2020, BTS reported the 3rd quarter 2019 domestic average roundtrip fare (the most recent quarter for which data is available) was $345, down from a $349 average fare during the third quarter of 2018.

4
At HIA, 2019 set a passenger traffic record as 1,512,515 passengers used the airport, up 16.8% when compared to 2018. The airlines enplaned a total of 761,842 passengers in 2019, up 16.8% from 2018. American (+18.2%), Delta (+5.8%), United (+4.9%), Allegiant (+38.7%) and Frontier (+142.5) all enplaned more passengers in 2019 when compared to 2018.
American increased capacity to Charlotte, Chicago and Philadelphia and began daily nonstop service to Dallas/Ft. Worth in June. Allegiant increase capacity to Orlando-Sanford, Punta Gorda and St. Petersburg/Clearwater and began new twice weekly service to Sarasota in April and Nashville in June.
Total 2019 departing seat capacity at HIA increased 10.6% compared to 2018. American (+11.1%), Delta (+0.4%), United (+0.8%), Allegiant (+43.3%) and Frontier (+118.0%) all added seats when compared to 2018. The airports average 2019 annual departing load factor increased 4.4 points setting a new record of 86.2%.
A total of 55,268 tons of cargo were flown into and out of Harrisburg International Airport in 2019 representing an 3.6% decrease compared to 2018. UPS tonnage increased 2.8%, FedEx tonnage decreased 8.9% while commercial airline belly cargo increased 56.8%. The Federal Aviation Administration (FAA) reported there were 47,412 total 2019 airport operations at HIA, a decrease of 7.4% compared to 2018.
The following table shows the 2019 percentage fluctuation from 2018 for change in seats, change in enplanement passengers and passenger market share: (List ranked by 2019 passenger market share):
Change inChange in Enplaned Market
Seats Passengers Share
American Airlines 11.1% 18.2% 41.5%Delta Air Lines 0.4% 5.8% 21.5%United Airlines 0.8% 4.9% 17.1%Allegiant 43.3% 38.7% 14.7%Frontier 118.0% 142.5% 5.0%Charters n/a 41.9% 0.2%
Total Passenger Airlines 10.6% 16.7% 100.0%
The following table shows a summary of various activities at HIA:
2019 2018 % Change
Enplanements 761,842 652,301 16.8%Air carrier operations 27,968 28,244 -1.0%Landed weight (passenger airlines only) 822,931,668 765,012,656 7.6%Cargo tons 55,268 57,303 -3.6%Parking revenue $ 9,149,860 $ 8,058,216 13.5%

5
Financial Highlights
The Authority passed a balanced $33.5 million revenue and expense budget for 2019 to meet all maintenance and operations, capital and debt service obligations. 2019 enplanements were forecast for about 665,000, 8% above budgeted 2018 levels. Actual 2019 enplanements were 14.6% better than expected. Improved performance, primarily in non-airline revenues, produced a better than expected year, as Net Operating Revenue (excluding depreciation) was 8.6% ahead of the budgeted expectations.
Operating revenues were 9.4% ahead of the 2019 budget and 10.6% better than 2018. Operating expenses (excluding depreciation) were 5.5% more than budget and were 5.2% more than 2018.
SARAA owed the airlines for revenue sharing under the Airline Operating Agreement. For 2019, the liability was for $1.7 million. These payments are deducted 50% each from Facilities Revenue and Landing Fee revenue.
The required bond coverage ratio was met and maintained for 2019. More information is available in the Long-Term Debt section of the Management’s Discussion and Analysis.
All monthly debt service payments required by the bond trustee were made.
Overview of Financial Statements
SARAA only engages in business-type activities. These are activities that are intended to recover all or a significant portion of their costs through user fee charges to external parties for goods or services. SARAA reports its business-type activities in a single enterprise fund, meaning that its activities are operated and reported like a private-sector business.
SARAA’s financial report includes Statements of Net Position, Statements of Revenues, Expenses and Changes in Net Position and Statements of Cash Flows. Comparative financial statements with fiscal year 2018 are presented.
The net position of SARAA is comprised of these categories:
Net investment in capital assets - reflects SARAA’s investment in capital assets (e.g. land, buildings, machinery and equipment), less any related debt used to acquire those assets that is still outstanding. SARAA uses these capital assets to provide services to the public; consequently, these assets are not available for future spending.
Restricted - represents resources that are subject to external restrictions on how they may be used.
Unrestricted - represents resources that may be used to meet SARAA’s ongoing obligations to the public and creditors.
6
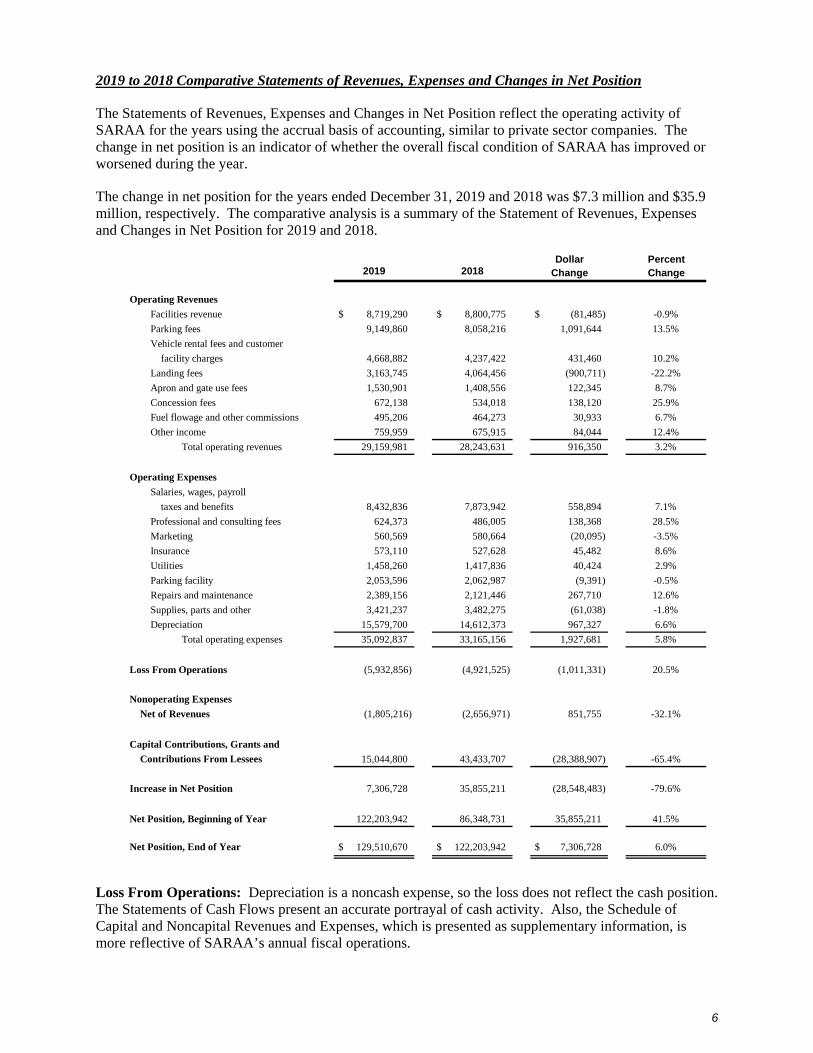
2019 to 2018 Comparative Statements of Revenues, Expenses and Changes in Net Position
The Statements of Revenues, Expenses and Changes in Net Position reflect the operating activity of SARAA for the years using the accrual basis of accounting, similar to private sector companies. The change in net position is an indicator of whether the overall fiscal condition of SARAA has improved or worsened during the year.
The change in net position for the years ended December 31, 2019 and 2018 was $7.3 million and $35.9 million, respectively. The comparative analysis is a summary of the Statement of Revenues, Expenses and Changes in Net Position for 2019 and 2018.
Dollar Percent2019 2018 Change Change
Operating Revenues
Facilities revenue $ 8,719,290 $ 8,800,775 $ (81,485) -0.9%
Parking fees 9,149,860 8,058,216 1,091,644 13.5%
Vehicle rental fees and customer
facility charges 4,668,882 4,237,422 431,460 10.2%
Landing fees 3,163,745 4,064,456 (900,711) -22.2%
Apron and gate use fees 1,530,901 1,408,556 122,345 8.7%
Concession fees 672,138 534,018 138,120 25.9%
Fuel flowage and other commissions 495,206 464,273 30,933 6.7%
Other income 759,959 675,915 84,044 12.4%
Total operating revenues 29,159,981 28,243,631 916,350 3.2%
Operating Expenses
Salaries, wages, payroll
taxes and benefits 8,432,836 7,873,942 558,894 7.1%
Professional and consulting fees 624,373 486,005 138,368 28.5%
Marketing 560,569 580,664 (20,095) -3.5%
Insurance 573,110 527,628 45,482 8.6%
Utilities 1,458,260 1,417,836 40,424 2.9%
Parking facility 2,053,596 2,062,987 (9,391) -0.5%
Repairs and maintenance 2,389,156 2,121,446 267,710 12.6%
Supplies, parts and other 3,421,237 3,482,275 (61,038) -1.8%
Depreciation 15,579,700 14,612,373 967,327 6.6%
Total operating expenses 35,092,837 33,165,156 1,927,681 5.8%
Loss From Operations (5,932,856) (4,921,525) (1,011,331) 20.5%
Nonoperating Expenses
Net of Revenues (1,805,216) (2,656,971) 851,755 -32.1%
Capital Contributions, Grants and
Contributions From Lessees 15,044,800 43,433,707 (28,388,907) -65.4%
Increase in Net Position 7,306,728 35,855,211 (28,548,483) -79.6%
Net Position, Beginning of Year 122,203,942 86,348,731 35,855,211 41.5%
Net Position, End of Year $ 129,510,670 $ 122,203,942 $ 7,306,728 6.0%
Loss From Operations: Depreciation is a noncash expense, so the loss does not reflect the cash position. The Statements of Cash Flows present an accurate portrayal of cash activity. Also, the Schedule of Capital and Noncapital Revenues and Expenses, which is presented as supplementary information, is more reflective of SARAA’s annual fiscal operations.

7
Significant Variances for 2019 to 2018
Operating Revenues: In 2019, the Total Operating Revenues increased 3.2%. The increase of enplanements drove a substantial increase in Parking fees and Vehicle rental fees and customer facility charges. Despite a 7.6% increase in landed weight, Landing fees decreased 22.2%. This was caused by a decrease in the Landing fee rate from $3.71 to $3.17. Apron and gate use fees and Concession fees increased due to increased flight and enplanement activity respectively.
Operating Expenses (other than depreciation): The operating expenses increased 5.2% or $960,000.
o New full-time positions were added to handle increased security demands, operations and ongoing maintenance concerns.
o Consulting fees increased as we renegotiated our airline operating agreement and rental car agreement.
o Repairs and maintenance increased due to the construction of temporary PFAS water treatment facility adjacent to one of the airport wells.
Operating Expenses (depreciation): Depreciation increased 6.6% or $967,000.
o HIA has a single large runway that is undergoing a three year rehabilitation process, 2017-2019. The previous rehabilitation occurred in 1997. Depreciation recorded in 2019 for the ’17, ’18 & ’19 phases is $1,311,000 vs. $718,000 recorded in 2018.
o Commercial development constructed by tenants at HIA totaled $26.3 million. It included a hotel, two hangars and two other buildings. 2019 depreciation recorded for these assets totaled $524,000 vs. $381,000 recorded in 2018.
Nonoperating Expenses Net of Revenue:
o Passenger Facility Charges (PFC) increased 17.2%, or $467,000, as a byproduct of our increased enplanements.
o Investment income increased 49% with the more attractive market rates prevalent in 2019.
o Interest expense decreased $179,000 on schedule in 2019. As a result of the refinancing of the 2008A bonds with the 2017 bonds, annual interest savings are approximately $891,000 per year, 2018 through 2032.
Capital Contributions and Grants:
o The amounts recorded vary year-to-year with the level of construction activity at SARAA’s four airports. When there is more construction or other capital activity, there are more grant dollars reimbursing those costs. In 2019, construction dollar volume was less than 2018 ($15.0 million vs. $17.2 million).
o Commercial development constructed by tenants at HIA totaled $26.3 million in 2018. It included a hotel, two hangars and two other buildings.

8
2018 to 2017 Comparative Statements of Revenues, Expenses and Changes in Net Position
The Statements of Revenues, Expenses and Changes in Net Position reflect the operating activity of SARAA for the years using the accrual basis of accounting, similar to private sector companies. The change in net position is an indicator of whether the overall fiscal condition of SARAA has improved or worsened during the year.
The change in net position for the years ended December 31, 2018 and 2017 was $35.9 million and $6.2 million, respectively. The comparative analysis is a summary of the Statement of Revenues, Expenses and Changes in Net Position for 2018 and 2017.
Dollar Percent2018 2017 Change Change
Operating Revenues
Facilities revenue $ 8,800,775 $ 8,988,686 $ (187,911) -2.1%
Parking fees 8,058,216 7,528,151 530,065 7.0%
Vehicle rental fees and customer
facility charges 4,237,422 4,033,805 203,617 5.0%
Landing fees 4,064,456 3,828,610 235,846 6.2%
Apron and gate use fees 1,408,556 1,325,342 83,214 6.3%
Concession fees 534,018 499,803 34,215 6.8%
Fuel flowage and other commissions 464,273 432,568 31,705 7.3%
Other income 675,915 657,151 18,764 2.9%
Total operating revenues 28,243,631 27,294,116 949,515 3.5%
Operating Expenses
Salaries, wages, payroll
taxes and benefits 7,873,942 7,332,038 541,904 7.4%
Professional and consulting fees 486,005 532,976 (46,971) -8.8%
Marketing 580,664 452,626 128,038 28.3%
Insurance 527,628 569,174 (41,546) -7.3%
Utilities 1,417,836 1,493,561 (75,725) -5.1%
Parking facility 2,062,987 2,316,605 (253,618) -10.9%
Repairs and maintenance 2,121,446 1,508,281 613,165 40.7%
Supplies, parts and other 3,482,275 2,689,511 792,764 29.5%
Depreciation 14,612,373 13,877,413 734,960 5.3%
Total operating expenses 33,165,156 30,772,185 2,392,971 7.8%
Loss From Operations (4,921,525) (3,478,069) (1,443,456) -41.5%
Nonoperating Expenses
Net of Revenues (2,656,971) (2,967,383) 310,412 -10.5%
Capital Contributions and Grants 43,433,707 12,666,762 30,766,945 242.9%
Increase in Net Position 35,855,211 6,221,310 29,633,901 -476.3%
Net Position, Beginning of Year 86,348,731 80,127,421 6,221,310 7.8%
Net Position, End of Year $ 122,203,942 $ 86,348,731 $ 35,855,211 41.5%
Loss From Operations: Depreciation is a noncash expense, so the loss does not reflect the cash position. The Statements of Cash Flows present an accurate portrayal of cash activity. Also, the Schedule of Capital and Noncapital Revenues and Expenses, which is presented as supplementary information, is more reflective of SARAA’s annual fiscal operations.

9
Significant Variances for 2018 to 2017
Operating Revenues: In 2018, the Total Operating Revenues increased 3.5%. The increase of enplanements drove a substantial increase in Parking fees and Vehicle rental fees and customer facility charges. Also, Apron and gate use fees increased for two reasons: 1) additional exclusive cargo ramp rented by UPS and, 2) Avflight, the only general aviation Fixed Base Operator, built a new facility west of the terminal and was charged for the use of the ramp.
Operating Expenses (other than depreciation): The operating expenses increased 9.8% or $1.6 million.
o Three new full time positions and a part time position were added to handle increased security demands and ongoing maintenance concerns. SARAA’s retirement contributions increased from a 4% match to a 6% match.
o Paving repairs were made to a road and gate area at HIA.
o Building automation system software was updated for the terminal at HIA.
o More was spent on deicing and other winter materials for the airfield than the prior year or what was programmed in the budget due to enable weather preparedness.
o The loading bridge repair project escalated to full scale and more repair materials were purchased.
o Safety gear for the fire department was replaced for HIA.
o Airfield signs and lighting, LED lighting upgrades, radios and water leak detection equipment were purchased.
Operating Expenses (depreciation): Depreciation increased 5.3% or $735,000.
o HIA has a single large runway that is undergoing a three year rehabilitation process, 2017-2019. The previous rehabilitation occurred in 1997. Depreciation recorded in 2018 for the ’17 & ’18 phases is $718,000.
o Commercial development constructed by tenants at HIA totaled $26.3 million. It included a hotel, two hangars and two other buildings. 2018 depreciation recorded for these assets totaled $381,000.
Nonoperating Expenses Net of Revenue:
o Overall interest expense decreased after a temporary increase in 2017 to a more normal level in 2018. As a result of the refinancing of the 2008A bonds with the 2017 bonds, annual interest savings are approximately $891,000 per year, 2018 through 2032.
Capital Contributions and Grants:
o The amounts recorded vary year-to-year with the level of construction activity at SARAA’s four airports. When there is more construction or other capital activity, there are more grant dollars reimbursing those costs. In 2018, construction activity was much more than 2017 ($17.2 million vs. $12.7 million). The eastern end of the lone runway at HIA was rehabilitated.
o Commercial development constructed by tenants at HIA totaled $26.3 million. It included a hotel, two hangars and two other buildings.

10
Statements of Net Position Summary
A condensed summary of SARAA’s statements of net position at year-end is shown below:
2019 2018 2017
AssetsCurrent assets $ 22,105,943 $ 23,683,814 $ 22,543,960 Noncurrent restricted cash and investments 14,679,109 14,562,988 14,695,099 Noncurrent other assets 760,727 801,668 410,619 Capital assets, net 242,141,779 240,052,545 210,050,949
Total assets $ 279,687,558 $ 279,101,015 $ 247,700,627
LiabilitiesCurrent liabilities $ 14,306,251 $ 15,495,414 $ 14,911,245 Long-term liabilities 135,870,637 141,401,659 146,440,651
Total liabilities 150,176,888 156,897,073 161,351,896
Net PositionNet investment in capital assets 111,728,266 102,463,474 66,372,842 Restricted 8,663,174 8,211,914 8,138,973 Unrestricted 9,119,230 11,528,554 11,836,916
Total net position 129,510,670 122,203,942 86,348,731
Total liabilities and net position 279,687,558$ 279,101,015$ 247,700,627$
Statements of Net Position Discussion - 2019 vs. 2018
Current assets: Overall, current assets decreased $1.6 million. The cash balance increased from 2018 year end. Grants receivable decreased $686,000 from 2018 as the runway rehabilitation project is more up to date in grant activity than it was a year ago. Investments decreased $1.3 million as the capital improvement investment account decreased. It was used to fund the paving of Airport Drive at HIA ($1.7 million) and three other capital projects ($.6 million). The Authority received $1.0 million from the Transportation Security Administration’s second year of reimbursement of the Electronic Baggage Screening Program. Restricted cash and investments increased as prescribed on the bond debt service schedule.
Noncurrent cash and investments: The Debt Service Reserve funds (DSRF) were maintained, decreasing slightly by $34,000. The Renewal and Replacement Reserve fund was increased $71,000 and the Maintenance and Operation Reserve fund was increased $80,000. These funds are required to be maintained at certain prescribed levels to be in compliance with the bond indenture.
Capital assets, net of accumulated depreciation increased $2.1 million:
Work in Progress inventory increased $3.0 million. Substantial projects in the balance include the HIA Cargo Apron, Flood Dike, Flight Information Displays (FIDS), GRA’s South Parking Apron and FCRA’s Parallel Taxiway.
Current liabilities decreased by $1.2 million. The dollar volume of capital construction activity decreased by $1,900,000 from 2018 to 2019. The liability to the airlines for the revenue sharing required by the Airline Operating Agreement increased from $1,115,000 to $1,704,000.

11
Noncurrent Liabilities:
The $5.5 million decrease in noncurrent liabilities was caused by the annual routine reduction of bond principal ($4.9 million) and the annual offsetting of bond premiums to interest expense ($671,000).
Note 8, Bonds Payable, provides complete details.
Net position serves as a useful indicator of SARAA’s financial position. SARAA’s total assets exceeded total liabilities by $130 million at December 31, 2019. This is an increase from the prior year of $122 million. Assets increased only slightly but liabilities decreased by the scheduled payment of bond debt primarily.
The largest component of SARAA’s net position (86.3% as of December 31, 2019) is invested in capital assets (e.g., land, infrastructure, buildings, improvements and equipment), net of the related debt outstanding used to acquire those capital assets. Although SARAA’s investment in its capital assets is reported net of related debt, it should be noted that the resources required to repay this debt must be provided annually from operations since it is unlikely that the capital assets themselves will be liquidated to pay liabilities.
The components of restricted net position are limited to their use by external sources as described below:
Bond resolution requires funds be put aside to ensure the continued operation of the airports.
The FAA requires the use of passenger facility charges (PFC’s) collected from passengers by the airlines only for approved capital projects including debt service thereon.
Unrestricted net position may be used for any lawful airport system purpose.
Statements of Net Position Discussion - 2018 vs. 2017
Current assets: Overall, current assets increased $1.1 million. The cash balance increased from 2017 year end. Grants receivable decreased $1.2 million from 2017 as the runway rehabilitation project is more to date in grant activity than it was a year ago. Investments increased $470,000 as the capital improvement investment account increased with the Transportation Security Administration’s first year of reimbursement of the Electronic Baggage Screening Program. Restricted cash and investments increased as funds set aside in the debt service funds bond principal and interest returned to a normal level after the 2008A bond refunding the prior year.
Noncurrent cash and investments: The Debt Service Reserve funds (DSRF) were maintained, increasing slightly by $67,500. The Renewal and Replacement Reserve fund was decreased $329,000 and the Maintenance and Operation Reserve fund was increased $157,000. These funds are required to be maintained at certain prescribed levels to be in compliance with the bond indenture.
Capital assets, net of accumulated depreciation increased $30 million:
Commercial development constructed by tenants at HIA totaled $26.3 million. It included a hotel, two hangars and two other buildings.
The eastern end of the lone runway at HIA was rehabilitated with a project cost of $16 million.
Current liabilities increased to $15.5 million. The liability to the airlines for the revenue sharing required by the Airline Operating Agreement increased by $600,000 to $1,115,000.

12
Noncurrent Liabilities:
The $5 million decrease in noncurrent liabilities was caused by the annual routine reduction of bond principal ($4.6 million) and the annual offsetting of bond premiums to interest expense ($721,000).
Note 8, Bonds Payable, provides complete details.
Net position serves as a useful indicator of SARAA’s financial position. SARAA’s total assets exceeded total liabilities by $122 million at December 31, 2018. This is an increase from the prior year of $36 million. A primary reason assets increased was the tenants’ commercial development at HIA and the rehabilitation of the eastern end of HIA’s runway. The primary reason liabilities decreased was the scheduled payment of bond debt.
The largest component of SARAA’s net position (83.8% as of December 31, 2018) is invested in capital assets (e.g., land, infrastructure, buildings, improvements and equipment), net of the related debt outstanding used to acquire those capital assets. Although SARAA’s investment in its capital assets is reported net of related debt, it should be noted that the resources required to repay this debt must be provided annually from operations since it is unlikely that the capital assets themselves will be liquidated to pay liabilities.
The components of restricted net position are limited to their use by external sources as described below:
Bond resolution requires funds be put aside to ensure the continued operation of the airports.
The FAA requires the use of passenger facility charges (PFC’s) collected from passengers by the airlines only for approved capital projects including debt service thereon.
Unrestricted net position may be used for any lawful airport system purpose.
Cash and Investment Management
2019 2018 2017
Cash and cash equivalents $ 1,294,584 $ 1,075,872 $ 676,181 Maintenance and operations reserve 3,106,379 3,026,804 2,869,403 Renewal and replacement reserve 243,366 172,849 501,379 Coverage account 2,023,395 2,122,678 2,501,167 Capital improvement account 4,491,053 5,704,620 4,856,417 Passenger facility charge 230,920 201,651 24,904 Accrued interest 63,483 115,920 144,354
$ 11,453,180 $ 12,420,394 $ 11,573,805
The above funds are invested according to the Commonwealth of Pennsylvania Municipal Authorities Act Section 5611 as described in Note 4, Deposits and Investments, of the financial statements. All funds are secure as they are insured by the FDIC or collateralized by the respective financial institution as permitted by Act 72 of the 1971 session of the Pennsylvania General Assembly for the protection of public depositors.

13
The Maintenance and Operations Reserve is set by the Master Trust Indenture for the 2008, 2012 and 2017 Bonds at one sixth of the current year’s operating budget.
The Renewal and Replacement Reserve is set by the Master Trust Indenture at a $500,000 maximum. The payback shall be made in the year following the use of the Renewal and Replacement Reserve. In 2019, a shuttle bus and three maintenance trucks were replaced, for which the reserve was used.
The Coverage Account has a beneficial effect in calculating the bond covenant’s debt service coverage.
Capital Improvement Account represents remaining revenues to be used by SARAA for any lawful aviation purpose. The Capital Improvement Account decreased as it was used to fund the paving of Airport Drive at HIA ($1.7 M) and three other capital projects ($.6 M). The Authority received $1.0 M from the Transportation Security Administration’s second year of reimbursement of the Electronic Baggage Screening Program. Further details may be found in Note 5, Restricted and Unrestricted Cash and Investments, of the financial statements.
SARAA’s restricted debt service funds at December 31 were as follows:
2019 2018 2017
Debt service funds $ 7,991,627 $ 7,882,553 $ 7,068,576 Debt service reserve funds 11,265,881 11,247,415 11,179,963
$ 19,257,508 $ 19,129,968 $ 18,248,539
The trustee, Manufacturers Traders and Trust Co., holds the above funds. They are invested under direction of SARAA according to Section 4.07(h) in the applicable Supplemental Trust Indenture with respect to SARAA’s Senior Bonds and Section 4.04(g) in the Third Supplemental Subordinate Trust Indenture with respect to SARAA’s Subordinate Bonds. Permitted investments are defined in the Senior Master Indenture and in the Fourth Supplemental Trust Indenture.
In 2018, both the debt service and debt service reserve funds increased as a result of the refinancing of the 2008A bonds with the 2017 bonds in November 2017.
Capital Asset Activity
The following are projects underway or were completed in 2019:
Phase 5 of the runway 13/31 rehabilitation was completed at HIA. It involved upgrades to airfield lighting among other improvements.
Airport Drive, the main artery that runs the length of HIA was rehabilitated and repaved.
Work began for the multi-year project to develop the South Parking Apron at GRA.
The FIDS for HIA was completed at year end with only security furnishings to be added.
A new Parallel Taxiway was begun at FCRA with completion scheduled for 2020.
Eight new vehicles, a loader and a shuttle bus were acquired for HIA
A parking lot for the PA Air National Guard was constructed at HIA.
A new plow truck with a spreader was acquired for CXY.

14
Cash paid for capital projects was $19.5 million. SARAA received $15.7 million in capital grants toward the capital additions. See Note 6, Capital Assets, to the financial statements for a summary of capital asset activity.
Long-Term Debt
Capital acquisitions are funded using a variety of financing mechanisms, including federal and state grants, passenger facility charges (PFC), public debt issues, the renewal and replacement account, capital improvement account and airport operating revenue.
The use of PFC’s is fully explained in Note 2, Passenger Facility Charges, of the financial statements. Currently, all PFC’s are assigned as an offset to the debt service requirements of the 2017, 2008B, 2012A and 2012B bonds through 2019. SARAA’s management fully intends to continue to use the PFCs to offset bond debt service requirements into the foreseeable future.
SARAA’s annual debt service for their four bond issues is scheduled at approximately $11.1 million annually through 2032. In 2033 through 2037, debt service decreases to $9.3 million annually. Principal payments beginning in 2018 are focused on the 2012A bonds. No new bond issues except possible refundings are anticipated in the immediate future.
SARAA, through its Master Trust Indentures, has covenants to maintain a debt service coverage ratio of not less than 1.25 for senior lien debt and 1.10 for senior and subordinate debt. Debt service coverage is calculated based on a formula included in the bond indentures and the airline agreements. Historically, the Authority has maintained a coverage ratio higher than its requirement. Starting in 2017, only senior lien debt is outstanding.
The debt service coverage calculation follows on the next page.

15
2019 2018
Total operating revenues $ 29,159,981 $ 28,243,631 Additions:
Revenue sharing to airlines 1,691,275 1,115,004 Investment income 610,627 406,487
Total revenues 31,461,883 29,765,122 Less: Management and operating expenses (19,513,137) (18,552,783)
Airport System net revenues 11,948,746 11,212,339
Add: Coverage account balances 1 2,005,613 2,101,834 Net revenues plus coverage account balances 13,954,359 13,314,173
Annual Senior Bonds debt service 11,117,450 11,123,950 Less: PFC Revenues (3,095,000) (2,657,700)Less: Escrow Earnings - (58,915)
Net Senior Bonds debt service 8,022,450 8,407,335
Senior Bonds Debt Service Coverage 2 1.74 1.58
Adjusted Senior Bonds Debt Service Coverage 3 1.35 1.25
3 Calculated as Net Revenues plus PFC Revenues divided by Senior Debt Service.
1 Limited to 25% of net Senior Bond debt service.2 Coverage calculated as required by the Indenture, which incorporates the coverage account
balance (which can total up to a maximum of 25% of Senior Debt Service) as part of the numerator and accounts for PFC revenue as an offset to debt service in the denominator. Minimum debt service coverage requirement for Bonds per the Indenture is 1.25.
Requests for Information
This financial report is designed to provide a general overview of SARAA’s finances for all those interested. Questions concerning any of the information provided in this report or requests for additional information should be addressed in writing to the Deputy Director, Finance & Administration, Harrisburg International Airport, One Terminal Drive, Suite 300, Middletown, PA 17057 or via SARAA’s website www.flyhia.com.

See Notes to Financial Statements 16
Susquehanna Area Regional Airport Authority Statements of Net Position
December 31, 2019 and 2018
2019 2018
AssetsCurrent Assets
Unrestricted AssetsCash and cash equivalents $ 1,294,584 $ 1,075,872 Accounts receivable, net of allowance of $70,000 1,369,883 1,456,235 Grants receivable 2,723,594 3,409,680 Tenant improvement allowance 40,942 40,132 Prepaids and other assets 725,552 541,311 Inventory 992,286 1,074,050 Investments 6,514,448 7,827,298
Total unrestricted current assets 13,661,289 15,424,578
Restricted AssetsCash and investments 8,222,547 8,084,204 Passenger facility charge receivables 222,107 175,032
Total restricted current assets 8,444,654 8,259,236 Total current assets 22,105,943 23,683,814
Noncurrent AssetsCash and investments, restricted 14,679,109 14,562,988 Tenant improvement allowance 760,727 801,668 Capital assets
Nondepreciable capital assets 28,015,289 24,898,155 Depreciable capital assets 214,126,490 215,154,390
Net capital assets 242,141,779 240,052,545 Total noncurrent assets 257,581,615 255,417,201
Total assets 279,687,558$ 279,101,015$

17
2019 2018
Liabilities and Net PositionCurrent Liabilities
Accounts payable $ 3,170,168 $ 2,483,290 Accounts payable - construction 1,810,083 3,757,611 Accrued interest payable 3,131,225 3,246,975 Accrued expenses 969,983 1,000,165 Unearned revenue 303,607 306,704 Current portion of notes payable 66,185 70,669 Current portion of bonds payable 4,855,000 4,630,000
Total current liabilities 14,306,251 15,495,414
Noncurrent LiabilitiesEstimated costs of remediation 920,000 850,000 Bond and other deposits 57,359 65,733 Notes payable, less current portion 750,599 816,779 Bonds payable, less current portion 134,142,679 139,669,147
Total noncurrent liabilities 135,870,637 141,401,659 Total liabilities 150,176,888 156,897,073
Net PositionNet investment in capital assets 111,728,266 102,463,474 Restricted 8,663,174 8,211,914 Unrestricted 9,119,230 11,528,554
Total net position 129,510,670 122,203,942
Total liabilities and net position 279,687,558$ 279,101,015$

See Notes to Financial Statements 18
Susquehanna Area Regional Airport Authority Statements of Revenues, Expenses and Changes in Net Position
Years Ended December 31, 2019 and 2018
2019 2018
Operating RevenuesFacilities revenue $ 8,719,290 $ 8,800,775 Parking fees 9,149,860 8,058,216 Vehicle rental fees and customer facility charges 4,668,882 4,237,422 Landing fees 3,163,745 4,064,456 Apron and gate use fees 1,530,901 1,408,556 Concession fees 672,138 534,018 Fuel flowage and other commissions 495,206 464,273 Other income 759,959 675,915
Total operating revenues 29,159,981 28,243,631
Operating Expenses Salaries, wages, payroll taxes and benefits 8,432,836 7,873,942 Professional and consulting fees 624,373 486,005 Marketing 560,569 580,664 Insurance 573,110 527,628 Utilities 1,458,260 1,417,836 Parking facility 2,053,596 2,062,987 Repairs and maintenance 2,389,156 2,121,446 Supplies, parts and other 3,421,237 3,482,275
Total operating expenses before depreciation 19,513,137 18,552,783
Income From Operations Before Depreciation 9,646,844 9,690,848 Depreciation expense 15,579,700 14,612,373
Loss From Operations (5,932,856) (4,921,525)
Nonoperating Revenues (Expenses)Passenger facility charges 3,171,344 2,704,443 Investment income 610,627 409,049 Interest expense (5,608,581) (5,787,130)Gain on disposal of capital assets and sale of easements 21,394 16,667
Total nonoperating expenses (1,805,216) (2,656,971)
Decrease in Net Position Before Capital Contributions and Grants (7,738,072) (7,578,496)
Capital Contributions and Grants Federal, state and local grants 15,044,800 17,174,415 Contributions from lessees - 26,259,292
Increase in Net Position 7,306,728 35,855,211
Net Position, Beginning of Year 122,203,942 86,348,731
Net Position, End of Year $ 129,510,670 $ 122,203,942

See Notes to Financial Statements 19
Susquehanna Area Regional Airport Authority Statements of Cash Flows
Years Ended December 31, 2019 and 2018
2019 2018
Cash Flows From Operating ActivitiesCash received from customers $ 29,243,236 $ 27,720,575 Cash paid to employees for services (8,471,392) (7,810,236)Cash paid to suppliers for goods and services (10,495,900) (10,224,176)
Net cash provided by operating activities 10,275,944 9,686,163
Cash Flows From Capital and Related Financing ActivitiesPrincipal paid on long-term debt (4,630,000) (4,405,000)Interest paid (6,395,800) (5,891,619)Principal payment on loans (70,663) (55,383)Proceeds from notes payable - 443,855 Tenant improvement allowance 40,131 (431,181)Passenger facility charges received 3,124,269 2,834,378 Acquisition and construction of capital assets (19,546,462) (19,235,778)Proceeds from sale of easements 6,667 3,333 Proceeds from sale of capital assets 14,727 13,334 Capital grants received 15,730,886 18,356,867
Net cash used in capital and related financing activities (11,726,245) (8,367,194)
Cash Flows From Investing ActivitiesInvestment income 610,627 409,049 Purchase of investment securities (23,654,963) (19,700,269)Proceeds from sales of investment securities 24,713,349 18,371,942
Net cash provided by (used in) investing activities 1,669,013 (919,278)
Net Increase in Cash and Cash Equivalents 218,712 399,691
Cash and Cash Equivalents, Beginning of Year 1,075,872 676,181
Cash and Cash Equivalents, End of Year $ 1,294,584 $ 1,075,872

See Notes to Financial Statements 20
Susquehanna Area Regional Airport Authority Statements of Cash Flows (Continued)
Years Ended December 31, 2019 and 2018
2019 2018
Reconciliation of Loss From Operations to Net Cash Provided by Operating Activities
Loss from operations $ (5,932,856) $ (4,921,525)Item not requiring cash
Depreciation of capital assets 15,579,700 14,612,373 Change in assets and liabilities
Accounts receivable 86,352 (459,256)Inventory 81,764 (78,998)Prepaids and other assets (184,241) (13,726)Unearned revenue (3,097) (63,800)Bond and other deposits (8,374) (28,411)Accounts payable and accrued expenses 656,696 639,506
Net cash provided by operating activities $ 10,275,944 $ 9,686,163
Noncash Capital and Related Financing ActivitiesCapital assets included in accounts payable at end of year $ 1,810,083 $ 3,757,611 Contributions from lessees - 26,259,292

21
Susquehanna Area Regional Airport Authority Notes to Financial Statements December 31, 2019 and 2018
Note 1: Reporting Entity
On January 2, 1998, the Commonwealth of Pennsylvania (Commonwealth), acting through the Pennsylvania Department of Transportation (PennDOT), transferred operation and ownership of the Harrisburg International Airport (HIA), primarily located in Lower Swatara Township, Dauphin County, Pennsylvania and Capital City Airport (CXY), located in Fairview Township, York County, Pennsylvania (Airports), to the Susquehanna Area Regional Airport Authority (SARAA), a joint municipal authority duly created under the Pennsylvania Municipality Authorities Act. The assets and obligations of the Airports, as well as the assignment of all leases, agreements, permits and approvals, were transferred to SARAA in consideration of a one-dollar payment to the Commonwealth.
SARAA is organized under the Municipal Authorities Act (Act) as a joint authority by the Counties of Dauphin, Cumberland and York; the Cities of Harrisburg and York; and the Townships of Fairview and Lower Swatara. Under the Act, SARAA is an independent entity governed by a board of directors. Each of the municipalities appoints representatives to serve for 5-year terms on the board that consists of 15 directors. Each county appoints three board members, each city appoints two board members, while each of the two townships appoints one board member. An Executive Director of Aviation and a Deputy Executive Director of Aviation are employed to act on behalf of the board in connection with administration of the operational responsibilities retained by SARAA.
SARAA also owns and operates the Franklin County Regional Airport (FCRA), located near Chambersburg, Pennsylvania and the Gettysburg Regional Airport (GRA), located near Gettysburg, Pennsylvania.
Note 2: Summary of Significant Accounting Policies
Basis of Accounting and Measurement Focus
The financial statements of SARAA have been prepared using the accrual basis of accounting and economic resources measurement focus. Under the accrual basis of accounting, revenues are recorded when earned and expenses are recorded when a liability is incurred, regardless of the timing of the related cash flows.
SARAA follows the reporting requirements for special-purpose governments involved in business-type activities, which provide an entity-wide perspective in the financial statement presentation. These standards require presentation of management’s discussion and analysis, as required supplementary information and financial statements consisting of the statements of net position, statements of revenues, expenses and changes in net position using a specified format that distinguishes between operating and nonoperating revenues and expenses and statements of cash flows using the direct method.

22
Susquehanna Area Regional Airport Authority Notes to Financial Statements December 31, 2019 and 2018
Management of SARAA has made a number of estimates and assumptions relating to the reporting of assets and liabilities, recognition of revenue and expenses and the disclosure of contingent assets and liabilities to prepare these financial statements in conformity with accounting principles generally accepted in the United States of America. Actual results could differ from the estimates.
Revenue Recognition
Revenue is recognized on an accrual basis with the establishment of corresponding accounts receivable. The allowance method for accounts receivable is used to measure bad debts. The allowance for doubtful accounts is determined based upon management’s historical analysis and estimation of collectability of such accounts.
Cash and Cash Equivalents
SARAA considers all highly liquid investments (including restricted investments) with a maturity of three months or less when purchased to be cash equivalents. Cash equivalents consist primarily of money market accounts.
Investments
Investments are stated at fair value based on estimates from external investment managers and quoted market prices.
Inventories
Inventories of supplies are stated at the lower of cost or market. Cost is determined using the first-in, first-out (FIFO) method.
Restricted Assets
Proceeds from debt and funds set aside for payment of debt are classified as restricted assets since their use is limited by applicable debt agreements. It is SARAA’s policy to first apply restricted resources when a cost is incurred for which both restricted and unrestricted net position are available.

23
Susquehanna Area Regional Airport Authority Notes to Financial Statements December 31, 2019 and 2018
Capital Assets
Capital assets, such as land, buildings, equipment and infrastructure assets are stated at cost (or estimated historical cost). Donated capital assets are measured at acquisition value, which is the price that would be paid to acquire an asset with equivalent service potential in an orderly market transaction at the acquisition date or the amount at which a liability could be liquidated with the counterparty at the acquisition date. SARAA capitalizes assets with an expected useful life of more than one year and a cost greater than $10,000. Depreciation is computed using the straight-line method over the estimated useful lives of the assets as follows:
Years
Buildings, including parking facility 3 to 35Land improvements 5 to 25Runways, taxiways and aprons 3 to 30Utilities and sewers 10 to 50Roads and parking areas 4 to 20Heavy equipment, furniture and fixtures 3 to 25Vehicles 3 to 15Facility planning, design and other studies 5 to 20
Expenditures for capital assets and for major renewals and betterments that extend the estimated useful life of the assets are capitalized, while routine maintenance and repairs are charged to expense as incurred. At the time capital assets are sold, retired, or disposed of, the costs of such assets and related accumulated depreciation are removed and any gain or loss on disposal is reflected as nonoperating activity. All costs relating to the construction of property and equipment are capitalized.
Donated capital assets are measured at acquisition value, which is the price that would be paid to acquire an asset with equivalent service potential in an orderly market transaction at the acquisition date or the amount at which a liability could be liquidated with the counterparty at the acquisition date.
Lessee-Financed Improvements
Certain leases include provisions whereby lessee-financed improvements become the property of SARAA. Prior to the adoption of GASB Statement No. 33, Accounting and Financial Reporting for Nonexchange Transactions, SARAA recorded lessee-financed improvements only upon leasehold reversion or lease termination, at which time the improvements were capitalized at acquisition value and recorded as a capital contribution. With the adoption of GASB Statement No. 33, SARAA now recognizes lessee-financed improvements upon completion of construction, or upon the asset being placed in service, whichever occurs first. However, lessee-financed improvements placed in service prior to the adoption of GASB Statement No. 33 continue to be recognized only upon leasehold reversion or lease termination.

24
Susquehanna Area Regional Airport Authority Notes to Financial Statements December 31, 2019 and 2018
Net Position
Net position is categorized into three components: net investment in capital assets, restricted and unrestricted. Net investment in capital assets consists of capital assets, net of accumulated depreciation reduced by outstanding balances for bonds, notes and other debt that are attributed to the acquisition, construction or improvement of those assets. Restricted net position represents resources that are subject to external restrictions on how they may be used. Unrestricted net position consists of net position that does not meet the definition of the two preceding categories.
Federal and State Grants
Outlays for airport capital improvements and certain airport operating expenses, primarily those relating to airport security, are subject to reimbursement from federal grant programs. Funds are also received for airport development from the Commonwealth. Funding provided from government grants is considered earned as the related approved capital outlays or expenses are incurred. Costs claimed for reimbursement are subject to audit and acceptance by the granting agency. Capital funding is recorded as capital contributions and earned as allowable capital expenditures are incurred, whereas funding for the Noise Relocation Project is recorded as nonoperating revenues as related expenses are incurred.
Rental Income
All leases wherein SARAA is the lessor are accounted for as operating leases. Rental income is generally recognized as it becomes receivable over the respective lease terms.
Operating Versus Nonoperating and Net Position Recognition
The policy of SARAA is to report as operating revenues and expenses items that result from providing services in connection with the principal ongoing activities of the airport. All revenues and expenses not meeting this definition are reported as nonoperating revenues and expenses or capital contributions.
Passenger Facility Charges
Passenger facility charges (PFCs) are fees imposed on enplaned passengers by airports (and collected by airlines) for the purpose of generating revenue for airport projects that increase capacity, increase safety, or mitigate noise impacts. PFCs are restricted for use in the acquisition of real estate, construction of certain airport improvements (including payment of debt service) and other costs, as approved by the FAA.

25
Susquehanna Area Regional Airport Authority Notes to Financial Statements December 31, 2019 and 2018
SARAA has received approval from the Federal Aviation Administration (FAA) to impose and use a passenger facility charge of $4.50 per eligible enplaned passenger up to approximately $129 million. Among the projects to be financed by SARAA’s PFCs are portions of the construction of the new terminal building, terminal loop road, terminal aprons, navaids and runway lighting and parallel taxiway and related work. PFCs are deposited on a pro-rata basis monthly to pay debt service on the 2008B, 2012A, 2012B and 2017.
SARAA’s PFCs are recognized as earned as nonoperating revenues and amounted to $3,171,344 and $2,704,443 for 2019 and 2018, respectively.
Customer Facility Charges
SARAA collects a customer facility charge (CFC) from all rental car concessionaires that operate facilities on the airport. The CFC is $3.75 per rental car transaction per day. CFC’s may be used in the following priority: (1) payment of annual debt service on the Airport System Revenue Bonds used to fund the design and construction of the multi-modal transportation center/ground transportation center; and (2) payment of operating and maintenance costs for the rental car portions of the multi-modal transportation center/ground transportation center. CFC revenue totaled $2,013,964 and $1,809,259 for 2019 and 2018, respectively, and is included in operating revenues on the statements of revenues, expenses and changes in net position.
Note 3: Major Customers
Major customers of SARAA represent the following percentages in SARAA operating revenues and passengers:
Number of Number ofRevenues Passengers Revenues Passengers
Delta Airlines 8% 22% 9% 24%American Airlines 12% 42% 13% 42%United Airlines 7% 17% 8% 19%
2019 2018

26
Susquehanna Area Regional Airport Authority Notes to Financial Statements December 31, 2019 and 2018
Note 4: Deposits and Investments
The fair values of deposits and investment securities by type of investment are:
OperatingCash and Restricted
Cash Cash and UnrestrictedEquivalents Investments Investments Total
Cash and cash equivalents $ 1,294,584 $ 2,008,113 $ 4,594,113 $ 7,896,810 Money market funds - 8,378,211 - 8,378,211 Certificates of deposit - 11,872,726 1,920,335 13,793,061 U.S. Government-
sponsored enterprises - 579,123 - 579,123 Accrued investment income - 63,483 - 63,483
$ 1,294,584 $ 22,901,656 $ 6,514,448 $ 30,710,688
2019
OperatingCash and Restricted
Cash Cash and UnrestrictedEquivalents Investments Investments Total
Cash and cash equivalents $ 1,075,872 $ 952,083 $ 2,962,298 $ 4,990,253 Money market funds - 11,588,900 - 11,588,900 Certificates of deposit - 9,864,120 4,865,000 14,729,120 U.S Government-
sponsored enterprises - 126,169 - 126,169 Accrued investment income - 115,920 - 115,920
$ 1,075,872 $ 22,647,192 $ 7,827,298 $ 31,550,362
2018
Deposits
Commonwealth of Pennsylvania law requires that SARAA’s deposits be placed in savings accounts, time deposits, or share accounts of institutions insured by the Federal Deposit Insurance Corporation, the Federal Savings and Loan Insurance Corporation, or the National Credit Union Insurance Fund. To the extent that such accounts are so insured, and for any amounts above the insured maximum, the approved collateral as provided by law shall be pledged by the depository.

27
Susquehanna Area Regional Airport Authority Notes to Financial Statements December 31, 2019 and 2018
At December 31, 2019 and 2018, the carrying value and the bank balances of SARAA’s deposits were as follows:
Carrying Bank Carrying BankValue Balance Value Balance
Cash and cash equivalents $ 7,896,810 $ 8,731,224 $ 4,990,253 $ 5,381,673 Certificates of deposit 13,793,061 13,793,061 14,729,120 14,729,120
2019 2018
Of the bank balances in 2019, $1 million was insured by the Federal Deposit Insurance Corporation (FDIC) and the remaining balances were collateralized by financial institutions via single collateral pool arrangements as permitted by Act No. 72 of the 1971 session of the Pennsylvania General Assembly for the protection of public depositors.
Investments
SARAA’s practice is to follow Section 5611 of the Commonwealth of Pennsylvania Municipality Authorities Act. In accordance with their investment policy, SARAA is authorized to invest in (1) U.S. Treasury bills; (2) short-term obligations of the U.S. government or its agencies or instrumentalities; (3) obligations of the United States of America or any of its agencies or instrumentalities backed by the full faith and credit of the United States of America, the Commonwealth or any of its agencies or instrumentalities backed by the full faith and credit of the Commonwealth, or any political subdivision of the Commonwealth or any of its agencies or instrumentalities backed by the full faith and credit of the political subdivision; and (4) shares of an investment company registered under the Investment Company Act of 1940 whose shares are registered under the Securities Act of 1933 if the only investments of that company are in the authorized investments for authority funds listed (1) through (3) above.
SARAA had the following investments and maturities as of December 31, 2019 and 2018:
Moody’s CarryingRating Value Less than 1 1 to 5
Money market funds Aaa-mf $ 8,378,211 $ 8,373,182 $ 5,029 Certificates of deposit Not Rated 13,793,061 7,681,331 6,111,730 U.S. Government-sponsored enterprises Aaa 579,123 579,123 - Accrued investment income n/a 63,483 63,483 -
$ 22,813,878 $ 16,697,119 $ 6,116,759
2019Investment Maturity (in years)

28
Susquehanna Area Regional Airport Authority Notes to Financial Statements December 31, 2019 and 2018
Moody’s CarryingRating Value Less than 1 1 to 5
Money market funds Aaa-mf $ 11,588,900 $ 11,588,900 $ - Certificates of deposit Not Rated 14,729,120 10,653,711 4,075,409 U.S. Government-sponsored enterprises Aaa 126,169 126,169 - Accrued investment income n/a 115,920 115,920 -
$ 26,560,109 $ 22,484,700 $ 4,075,409
2018Investment Maturity (in years)
Interest Rate Risk: The risk that changes in interest rates of debt securities will adversely affect the value of an investment. SARAA does not have an investment policy that manages exposure to fair value losses arising from increasing interest rates.
Credit Risk: The risk that an issuer or other counterparty to an investment will not fulfill its obligations. The ratings of SARAA’s various investment securities is presented in the previous table.
Custodial Credit Risk: For an investment, custodial credit risk is the risk that, in the event of the failure of the counterparty, SARAA will not be able to recover the value of its investments or collateral securities that are in the possession of an outside party. At December 31, 2019, SARAA’s investments were not exposed to custodial credit risk. The U.S. Government-sponsored enterprise securities are not collateralized. The municipal obligations and U.S. Government-sponsored enterprise securities are held in SARAA’s name by M&T Investment Group, the trustee. Certificates of deposit were insured by FDIC or collateralized.
Concentration of Credit Risk: SARAA’s investment policy does not address the concentration of credit risk. As of December 31, 2019 and 2018, SARAA had the following concentration in its investment portfolio:
2019 2018
Money market funds 37% 44%Certificates of deposit 60% 55%U.S. Government-sponsored enterprises 3% 1%
Percentage ofInvestment Portfolio
Foreign Currency Risk: This risk relates to adverse effects on the fair value of an investment from changes in exchange rates. SARAA’s investment policy prohibits investments in foreign investments.

29
Susquehanna Area Regional Airport Authority Notes to Financial Statements December 31, 2019 and 2018
Note 5: Restricted and Unrestricted Cash and Investments
Restricted Cash and Investments
SARAA is required to restrict assets for various purposes in accordance with the terms of airline use agreements, bond ordinances and other contractual agreements. A summary of the restricted assets consists of the following:
2019 2018
Maintenance and operating reserve account $ 3,106,379 $ 3,026,804 Renewal and replacement account 243,366 172,849 Passenger facility charges 230,920 201,651 Debt service fund 7,991,627 7,882,553 Debt service reserve 11,265,881 11,247,415
Total 22,838,173 22,531,272 Accrued income 63,483 115,920
Total restricted investments 22,901,656 22,647,192 Less current portion (8,222,547) (8,084,204)
Noncurrent portion $ 14,679,109 $ 14,562,988
The maintenance and operation reserve fund must be maintained at a balance at least equal to one-sixth of SARAA’s current operating and maintenance budget as a contingency reserve for payment of operation and maintenance expenses. Assets of the renewal and replacement fund must be maintained to pay for repairs or replacement of property not provided for by monies available in other funds including repairs and replacements done on an emergency basis. Passenger facility charges represent monies collected by SARAA not yet expended in accordance with the Federal Aviation Administration approval. The debt service fund is to pay principal and interest on the outstanding bonds. Amounts in the debt service reserve fund are available to pay debt service on the bonds if the amounts held in the debt service fund are insufficient to pay in full any principal and interest then due.
Unrestricted Investments
The following are unrestricted investments that are held by SARAA at December 31, 2019 and 2018. The capital improvement account represents all remaining revenues to be used by SARAA for any lawful aviation purposes. The coverage account can be used by SARAA to accumulate reserves of up to 25% of aggregate annual senior debt service.
2019 2018
Capital improvement account $ 4,491,053 $ 5,704,620 Coverage account 2,023,395 2,122,678
$ 6,514,448 $ 7,827,298

30
Susquehanna Area Regional Airport Authority Notes to Financial Statements December 31, 2019 and 2018
Note 6: Capital Assets
Capital assets consist of the following:
Balance BalanceDecember 31, December 31,
2018 Additions Transfers Disposals 2019
Capital assets not being depreciated:Land and improvements $ 22,222,547 $ 70,000 $ - $ - $ 22,292,547
Construction in progress 2,675,608 17,657,574 (14,547,700) (62,740) 5,722,742 Total capital assets not
being depreciated 24,898,155 17,727,574 (14,547,700) (62,740) 28,015,289
Capital assets being depreciated:Buildings, including parking facility 187,816,469 - 21,276 - 187,837,745 Land improvements 11,212,146 - 15,555 - 11,227,701 Runways, taxiways and aprons 144,407,403 102,818 7,442,693 (102,817) 151,850,097 Utilities and sewers 20,147,175 - - - 20,147,175 Roads and parking areas 22,751,249 - 3,971,227 - 26,722,476 Heavy equipment, furniture
and fixtures 32,344,813 - 208,389 (315,774) 32,237,428 Vehicles 10,620,401 40,000 793,497 (142,098) 11,311,800 Facility planning, design and
other studies 4,863,400 - - - 4,863,400 Tenant construction 26,259,292 14,623 2,095,063 (14,623) 28,354,355
Total capital assets being depreciated 460,422,348 157,441 14,547,700 (575,312) 474,552,177
Less accumulated depreciation for:Buildings, including parking facility 96,807,330 4,419,530 - - 101,226,860 Land improvements 7,750,645 464,898 - - 8,215,543 Runways, taxiways and aprons 71,899,418 7,137,531 - - 79,036,949 Utilities and sewers 9,954,857 352,451 - - 10,307,308 Roads and parking areas 20,173,920 503,069 - - 20,676,989 Heavy equipment, furniture
and fixtures 26,289,314 1,159,112 - (306,371) 27,142,055 Vehicles 8,655,841 438,625 - (135,355) 8,959,111 Facility planning, design and
other studies 3,347,928 227,782 - - 3,575,710 Tenant construction 388,705 896,457 - - 1,285,162
Total accumulated depreciation 245,267,958 15,599,455 - (441,726) 260,425,687 Total capital assets being
depreciated, net 215,154,390 (15,442,014) 14,547,700 (133,586) 214,126,490
Capital assets, net $ 240,052,545 $ 2,285,560 $ - $ (196,326) $ 242,141,779

31
Susquehanna Area Regional Airport Authority Notes to Financial Statements December 31, 2019 and 2018
Balance Balance
December 31, December 31,2017 Additions Transfers Disposals 2018
Capital assets not being depreciated:Land and improvements $ 22,222,547 $ - $ - $ - $ 22,222,547
Construction in progress 2,316,036 18,347,843 (17,988,271) - 2,675,608 Total capital assets not
being depreciated 24,538,583 18,347,843 (17,988,271) - 24,898,155
Capital assets being depreciated:Buildings, including parking facility 187,504,597 12,882 298,990 - 187,816,469 Land improvements 10,707,141 - 505,005 - 11,212,146 Runways, taxiways and aprons 128,335,399 - 16,072,004 - 144,407,403 Utilities and sewers 20,147,175 - - - 20,147,175 Roads and parking areas 22,751,249 - - - 22,751,249 Heavy equipment, furniture
and fixtures 31,927,030 - 417,783 - 32,344,813 Vehicles 10,318,452 - 439,015 (137,066) 10,620,401 Facility planning, design and
other studies 4,607,926 - 255,474 - 4,863,400 Tenant construction - 26,259,292 - - 26,259,292
Total capital assets being depreciated 416,298,969 26,272,174 17,988,271 (137,066) 460,422,348
Less accumulated depreciation for:Buildings, including parking facility 92,401,027 4,406,303 - - 96,807,330 Land improvements 7,318,229 432,416 - - 7,750,645 Runways, taxiways and aprons 65,477,384 6,422,034 - - 71,899,418 Utilities and sewers 9,602,403 352,454 - - 9,954,857 Roads and parking areas 19,687,400 486,520 - - 20,173,920 Heavy equipment, furniture
and fixtures 24,814,069 1,475,245 - - 26,289,314 Vehicles 8,353,174 436,733 - (134,066) 8,655,841 Facility planning, design and
other studies 3,132,917 215,011 - - 3,347,928 Tenant construction - 388,705 - - 388,705
Total accumulated depreciation 230,786,603 14,615,421 - (134,066) 245,267,958 Total capital assets being
depreciated, net 185,512,366 11,656,753 17,988,271 (3,000) 215,154,390
Capital assets, net $ 210,050,949 $ 30,004,596 $ - $ (3,000) $ 240,052,545
Note 7: Line of Credit
SARAA has a $1 million bank line of credit, the line of credit does not have a maturity date and any outstanding borrowings are due on demand. At December 31, 2019, there were no borrowings against this line. The line of credit is secured by a pledge of net revenues and is junior and subordinate to SARAA’s senior debt obligations. Interest varies with the bank’s prime rate, which was 4.75%, and is payable monthly.

32
Susquehanna Area Regional Airport Authority Notes to Financial Statements December 31, 2019 and 2018
Note 8: Bonds Payable
SARAA has issued the following debt instruments to provide funds for the construction of major capital facilities.
Senior and Subordinate Airport System Revenue Bonds
Bonds outstanding at December 31, 2019 and 2018 comprised the following:
2019 2018
Senior airport system revenue bonds:Series B of 2008. Consists of term bonds with an interest rate
of 9.875% with final maturity in 2034 $ 1,280,000 $ 1,280,000 Series A of 2012. Consists of serial bonds with an interest rate
of 5.000% and term bonds with a 5.000% interest rate withfinal maturity in 2027 44,340,000 48,970,000
Unamortized bond premium 1,717,933 2,194,268 Total Series A of 2012 46,057,933 51,164,268
Series B of 2012. Consists of term bonds with an interest rateof 4.000% with final maturity in 2033 49,520,000 49,520,000
Unamortized bond discount (402,547) (441,012)Total Series B of 2012 49,117,453 49,078,988
Series 2017. Consists of term bonds with an interest rateof 5.000% with final maturity in 2038 38,765,000 38,765,000
Unamortized bond premium 3,777,293 4,010,891 Total Series 2017 42,542,293 42,775,891
138,997,679 144,299,147 Current portion of long-term debt (4,855,000) (4,630,000)
$ 134,142,679 $ 139,669,147
The purpose of the Series 2008 Bonds was to provide funds to refinance certain variable rate bonds of SARAA, refinance an unsecured line of credit and to pay the costs of issuance of the bonds.
In December 2012, SARAA issued the 2012A, 2012B and 2012C Revenue Bonds (Series 2012 Bonds) in the amounts of $53,375,000, $49,520,000 and $16,090,000, respectively. The Series 2012 Bonds were issued as a current refunding of all of SARAA’s then outstanding 2003A, 2003B, and 2003D Revenue Bonds. As a result of the bond issue, all debt service reserve funds are cash funded.
In November 2017, SARAA issued the 2017 Revenue Bonds (Series 2017 Bonds) in the amount of $38,765,000, including an original issue premium of $4,273,690. The Series 2017 Bonds were issued as a current refunding of all of SARAA’s then outstanding Series 2008A Bonds. As a result of the bond issue, all debt service reserve funds are cash funded.

33
Susquehanna Area Regional Airport Authority Notes to Financial Statements December 31, 2019 and 2018
Annual Debt Service Requirements to Maturity
The annual requirements to pay principal and interest to maturity on the senior and subordinate airport revenue bonds outstanding at December 31, 2019 are summarized as follows:
Years Ending
December 31 Principal Interest Total
2020 $ 4,855,000 $ 6,262,450 $ 11,117,450 2021 5,100,000 6,019,700 11,119,700 2022 5,355,000 5,764,700 11,119,700 2023 5,620,000 5,496,950 11,116,950 2024 5,905,000 5,215,950 11,120,950
2025 - 2029 34,150,000 21,457,900 55,607,900 2030 - 2034 40,075,000 13,675,250 53,750,250 2035 - 2038 32,845,000 4,206,000 37,051,000
$ 133,905,000 $ 68,098,900 $ 202,003,900
Revenue BondsSenior Airport System
Covenants
Senior Bonds
Net revenues for each fiscal year shall be at least equal to the senior bonds debt service required to be funded by SARAA, plus required deposits to the debt service reserve funds and transfers to the maintenance and operations reserve fund and renewal and replacement fund. Net revenues together with the amount in the coverage account shall also equal 125% of senior bond’s debt service. In addition, SARAA has irrevocably committed to use a portion of the PFC receipts through 2019 for senior bond debt service.
Subordinate Bonds
Net revenues for each fiscal year shall be at least equal to the senior and subordinate bonds debt service required to be funded by SARAA, plus required deposits to the debt service reserve funds, maintenance and operations reserve fund and renewal and replacement fund. Net revenues together with the amount in the coverage account shall also equal 110% of senior and subordinate bonds debt service. At December 31, 2019, there were no subordinate bonds outstanding.

34
Susquehanna Area Regional Airport Authority Notes to Financial Statements December 31, 2019 and 2018
Changes in Long-Term Liabilities
Balance BalanceDecember 31, December 31, Current
2018 Additions Deductions 2019 Portion
Long-term debtSenior revenue bonds $ 138,535,000 $ - $ 4,630,000 $ 133,905,000 $ 4,855,000 Bond premium/(discount), net 5,764,147 - 671,468 5,092,679 -
Total long-term debt 144,299,147 - 5,301,468 138,997,679 4,855,000
Other long-term liabilitiesNotes payable 887,448 - 70,664 816,784 66,185 Estimated costs of remediation 850,000 70,000 - 920,000 - Unearned revenue 306,704 305,707 308,804 303,607 303,607 Security deposits 65,733 1,725 10,099 57,359 -
Total long-term liabilities $ 146,409,032 $ 377,432 $ 5,691,035 $ 141,095,429 $ 5,224,792
Balance BalanceDecember 31, December 31, Current
2017 Additions Deductions 2018 Portion
Long-term debtSenior revenue bonds $ 142,940,000 $ - $ 4,405,000 $ 138,535,000 $ 4,630,000 Bond premium/(discount), net 6,485,355 - 721,208 5,764,147 -
Total long-term debt 149,425,355 - 5,126,208 144,299,147 4,630,000
Other long-term liabilitiesNote payable 498,976 443,855 55,383 887,448 70,669 Estimated costs of remediation 850,000 - - 850,000 - Unearned revenue 370,504 246,489 310,289 306,704 306,704 Security deposits 94,144 11,350 39,761 65,733 -
Total long-term liabilities $ 151,238,979 $ 701,694 $ 5,531,641 $ 146,409,032 $ 5,007,373
Note 9: Operating Leases
Rental Income From Operating Leases
SARAA leases space at HIA, CXY, FCRA and GRA on a fixed fee as well as contingent rental basis. Six on-airport rental car companies at HIA guarantee minimum commissions for the term of their agreements through December 31, 2019. Many of the leases provide for a periodic review and redetermination of the rental amounts. Substantially all of SARAA’s capital assets are held for the purpose of rental or related use.

35
Susquehanna Area Regional Airport Authority Notes to Financial Statements December 31, 2019 and 2018
Minimum future rentals on noncancelable leases to be received in the future are as follows:
OtherLeases
2020 $ 5,085,746 2021 4,826,631 2022 4,524,138 2023 4,526,095 2024 4,500,398
2025 - 2029 5,261,959 2030 - 2034 3,771,196 2035 - 2039 2,696,734 2040 - 2044 2,156,590 2045 - 2048 802,475
$ 38,151,962
SARAA has entered into an Airline Operating Agreement and Terminal Building Lease (Airline Agreement) with certain passenger, charter and cargo airlines serving the airport (collectively, the Signatory Airlines). Other airlines operate under an airport use permit that generally has a term of no more than two years. The Airline Agreement’s hybrid residual rate-making features are designed to ensure that the Authority’s debt service and related coverage obligations, including the rate covenant, will be met. The Airline Agreement authorizes SARAA to implement new fees and charges as necessary. In the event of an airline bankruptcy, SARAA may adjust the rates and charges for all Signatory Airlines in the current rate period to recover the rates and charges due from the bankrupt carrier. However, there can be no assurance that such other airlines will be financially able to absorb the additional costs. Rental rates under these agreements are determined annually.
The Airline Agreement expired as of December 31, 2019. Subsequent to that date, the signatory airlines are operating under carryover provisions of the existing Airline Agreement.
Note 10: Retirement Benefits
SARAA has established a 457(b) defined-contribution plan for the benefit of all of its employees. This plan allows for employees to elect contributions either in a dollar amount or percentage not exceeding 15% of the employee’s total salary or wages. SARAA does not make any employer contributions to this plan.
SARAA has also established a 401(a) retirement plan (Plan) for its employees, which is entirely funded through SARAA contributions. All full-time employees are eligible to participate. Effective January 1, 2018, full-time employees have up to 6% of employee salaries and wages contributed as a match of the employees’ contributions to the 457(b) plan. SARAA’s contributions to the Plan amounted to $337,249 in 2019 and $315,792 in 2018. There are no employee contributions to the Plan.

36
Susquehanna Area Regional Airport Authority Notes to Financial Statements December 31, 2019 and 2018
Note 11: Risk Management
Risk management is the responsibility of SARAA. Operationally, SARAA is exposed to various risks of loss related to the theft of, damage to and destruction of assets, natural disasters as well as certain tort liabilities for which commercial insurance is carried. The commercial insurance policies carry deductibles ranging from $500 to $100,000. Insurance policies procured, including commercial general liability and commercial property damage, are inclusive of limited coverage for acts of terrorism. Coverage terms, limits and deductibles have each been benchmarked in comparison with those maintained at other comparable airports and found to be within the range of our peers. Although coverage limits are significant, no assurance can be given that such coverage will continue to be available at such amounts and/or at a reasonable cost.
There was no significant reduction of coverage in 2019, and there have been no settlements in excess of the described insurance coverage from 2016 - 2019.
Note 12: Pollution Remediation Obligation
SARAA has implemented GASB Statement No. 49, Accounting and Financial Reporting for Pollution Remediation Obligations. SARAA has identified pollution clean-up obligations relating to asbestos and PCB at its facilities and has recorded estimated costs of remediation of $920,000 and $850,000 as of December 31, 2019 and 2018, respectively. Clean-up costs are capitalized when they are incurred to prepare property for sale, prepare property for use when acquired with pollution obligations, or restore pollution-caused decline in service capacity; in all other cases, they are expensed. The accruals are not reduced by possible recoveries from federal and state grants. The measurement of environmental liabilities by SARAA is based on currently available facts, present laws and regulations and current technology. Such estimates take into consideration SARAA’s prior experience in site investigation and remediation, the data concerning cleanup costs available from other companies and regulatory authorities and the professional judgment of SARAA’s environmental experts in consultation with outside environmental specialists, when necessary.
On April 16, 1997, PennDOT, the Pennsylvania Department of Environmental Protection (DEP) and the U.S. Department of Environmental Protection entered into a Memo of Understanding (MOU) that required PennDOT to operate a water treatment facility and comply with other institutional controls. SARAA must operate the water plant and pump a minimum volume of ground water from several wells on airport property to control a plume of ground water contamination that exists on the property. Well water that is pumped is treated and subsequently sold to airport tenants as potable water.

37
Susquehanna Area Regional Airport Authority Notes to Financial Statements December 31, 2019 and 2018
Note 13: Disclosures About Fair Value of Assets and Liabilities
Fair value is the price that would be received to sell an asset or paid to transfer a liability in an orderly transaction between market participants at the measurement date. Fair value measurements must maximize the use of observable inputs and minimize the use of unobservable inputs. There is a hierarchy of three levels of inputs that may be used to measure fair value:
Level 1 Quoted prices in active markets for identical assets or liabilities
Level 2 Observable inputs other than Level 1 prices, such as quoted prices for similar assets or liabilities; quoted prices in markets that are not active; or other inputs that are observable or can be corroborated by observable market data for substantially the full term of the assets or liabilities
Level 3 Unobservable inputs supported by little or no market activity and are significant to the fair value of the assets or liabilities
Recurring Measurements
The following table presents the fair value measurements of assets recognized in the accompanying statements of net position measured at fair value on a recurring basis and the level within the fair value hierarchy in which the fair value measurements fall at December 31, 2019 and 2018:
Quoted Pricesin Active Significant
Markets for Other SignificantIdentical Observable Unobservable
Fair Assets Inputs InputsValue (Level 1) (Level 2) (Level 3)
December 31, 2019Investments
Money market funds 8,378,211$ 8,378,211$ -$ -$ U.S. Government-sponsored enterprises 579,123 - 579,123 -
December 31, 2018Investments
Money market funds 11,588,900$ 11,588,900$ -$ -$ U.S. Government-sponsored enterprises 126,169 - 126,169 -
Fair Value Measurements Using

38
Susquehanna Area Regional Airport Authority Notes to Financial Statements December 31, 2019 and 2018
Following is a description of the valuation methodologies and inputs used for assets measured at fair value on a recurring basis and recognized in the accompanying statements of net position, as well as the general classification of such assets pursuant to the valuation hierarchy. There have been no significant changes in the valuation techniques during the year ended December 31, 2019.
Investments
Where quoted market prices are available in an active market, securities are classified within Level 1 of the valuation hierarchy. If quoted market prices are not available, then fair values are estimated by using quoted prices of securities with similar characteristics or independent asset pricing services and pricing models, the inputs of which are market-based or independently sourced market parameters, including, but not limited to, yield curves, interest rates, volatilities, prepayments, defaults, cumulative loss projections and cash flows. Such securities are classified in Level 2 of the valuation hierarchy. In certain cases where Level 1 or Level 2 inputs are not available, securities are classified within Level 3 of the hierarchy.
Note 14: Commitments and Contingencies
Litigation
SARAA is subject to claims and lawsuits that arise primarily in the ordinary course of its activities. It is the opinion of management that the disposition or ultimate resolution of such claims and lawsuits will not have a material adverse effect on the financial position, change in net position and cash flows of SARAA. Events could occur that would change this estimate materially in the near term.
Investments
SARAA invests in various investment securities. Investment securities are exposed to various risks such as interest rate, market and credit risks. Due to the level of risk associated with certain investment securities, it is at least reasonably possible that changes in the values of investment securities will occur in the near term and that such changes could materially affect the amounts reported in the accompanying statements of net position.
Economic Volatility
As a result of the spread of the COVID-19 coronavirus, economic uncertainties have arisen which may negatively affect the financial position, results of operations and cash flows of SARAA, including significant declines in passenger traffic. The duration of these uncertainties and the ultimate financial effects cannot be reasonably estimated at this time.
In March 2020, the Coronavirus Aid, Relief, and Economic Security (CARES) Act was signed into law. The CARES Act includes $10 billion in funds to be awarded as economic relief to eligible U.S. airports affected by the prevention of, preparation for, and response to the COVID-19 pandemic. The CARES Act provides funds to increase the federal share to 100 percent for Airport Improvement Program and supplemental discretionary grants already planned for fiscal year 2020. Additionally, the CARES Act provides new funds distributed by various formulas for all airports that are part of the national airport system, including SARAA.

Supplementary Information

39
Susquehanna Area Regional Airport Authority Schedules of Capital and Noncapital Revenues and Expenses
Years Ended December 31, 2019 and 2018
2019 2018
Noncapital Related RevenuesFacilities revenue $ 8,719,290 $ 8,800,775 Parking fees 9,149,860 8,058,216 Vehicle rental fees and customer facility charges 4,668,882 4,237,422 Landing fees 3,163,745 4,064,456 Apron and gate use fees 1,530,901 1,408,556 Concession fees 672,138 534,018 Fuel flowage and other commissions 495,206 464,273 Other income 758,497 673,529 Investment income 54,081 52,326
Total noncapital related revenues 29,212,600 28,293,571
Noncapital Related Expenses, Net of Operating Grant RevenueSalaries, wages, payroll taxes and benefits 8,432,836 7,873,942 Professional and consulting fees 624,373 486,005 Marketing 560,569 580,664 Insurance 573,110 527,628 Utilities 1,458,260 1,417,836 Parking facility 2,053,596 2,062,987 Repairs and maintenance 2,389,156 2,121,446 Supplies, parts and other 3,421,237 3,482,275 Operating grant revenue (1,462) (2,386)
Total noncapital related expenses, net of operating grantrevenue 19,511,675 18,550,397
Excess of Noncapital Related Revenues Over Noncapital Related Expenses 9,700,925 9,743,174
Capital Related Revenues (Expenses)Restricted investment income 556,546 356,723 Passenger facility charges 3,171,344 2,704,443 Federal, state and local grants 15,044,800 17,174,415 Contributions from lessees - 26,259,292 Depreciation (15,579,700) (14,612,373)Interest expense (5,608,581) (5,787,130)Gain on disposal of capital assets and sale of easements 21,394 16,667
Deficit capital related revenues under capital related revenues (expenses) (2,394,197) 26,112,037
Increase in Net Position 7,306,728 35,855,211
Net Position, Beginning of Year 122,203,942 86,348,731
Net Position, End of Year $ 129,510,670 $ 122,203,942

40
Susquehanna Area Regional Airport Authority Schedules of Airline and Non-Airline Revenues
Years Ended December 31, 2019 and 2018
2019 2018
Passenger Airline RevenuesFacilities revenue $ 5,646,777 $ 5,756,024 Landing fees 1,927,741 2,471,775 Apron and gate use fees 1,026,623 949,160 Fuel flowage and other commissions 96,264 76,987
Total passenger airline revenues 8,697,405 9,253,946
Cargo Airline RevenuesLanding fees 1,038,393 1,392,624 Apron and gate use fees 434,678 413,508 Fuel flowage and other commissions 28,804 39,493
Total cargo airline revenues 1,501,875 1,845,625
Non-Airline RevenuesParking fees 9,149,860 8,058,216 Vehicle rental fees and customer facility charges 4,668,882 4,237,422 Facilities rental 3,072,513 3,044,751 Landing and apron fees - general aviation 267,211 245,945 Fuel flowage and other commissions 370,138 347,793 Concessions fees 672,138 534,018 Other income 759,959 675,915
Total non-airline revenues 18,960,701 17,144,060
Total Operating Revenues $ 29,159,981 $ 28,243,631