Embed Size (px)
Citation preview

Sustainability Assessment of Alluvial and Open Pit Mining Systems in
Colombia: Life Cycle Assessment, Exergy Analysis, and Emergy
Accounting
Natalia Andrea Cano Londoño
Universidad Nacional de Colombia
Facultad de Minas, Departamento de Geociencias y Medio Ambiente
Medellín, Colombia
2018

Evaluación de sostenibilidad de los sistemas de extracción aluvial y a cielo abierto en Colombia. Análisis Emergético, Exergético y Ciclo de
vida
Natalia Andrea Cano Londoño
Tesis como requisito parcial para optar al título de:
Doctor en Ingeniería: Recursos Hidráulicos
Director (a):
Ph.D. Héctor Iván Velásquez
Codirector:
Ph.D. Moisés Oswaldo Bustamante
Línea de Investigación:
Sostenibilidad
Grupo de Investigación:
Grupo de Investigación Bioprocesos y Flujos Reactivos - Instituto de Minerales CIMEX
Universidad Nacional de Colombia
Facultad de Minas, Departamento de Geociencias y Medio Ambiente
Medellín, Colombia
2018

“Leave the world better than you found it, take no more than
you need,
try not to harm life or the environment, make amends if you do”
Paul Hawken
To Him my creator who directs my path
To Her who my hand never let go
To my family and all those who contributed to this project
A Él mi creador quien dirige mi camino,
a Ella quien mi mano nunca soltó
A mi familia y a todos aquellos quienes contribuyeron al
presente

Acknowledgments
To my tutor and director Héctor Ivan Velásquez for his professionalism, advice,
enthusiastic and unconditional support to carry out this project.
To Moisés Oswaldo Bustamente, co-director, for giving me theoretical-practical
foundations of mining processes.
To Luis Felipe Castañeda for being my guide and support in the appropriation of alluvial
mining process
To Edwin Rafael Arango Gutierrez, Juan Pablo Valencia, Juan David Montoya, and
Andrea Gonzales for being my guide and support in the appropriation of open-pit mining
process basis. This doctoral thesis would not have been possible without their support.
To Jessi Osorio and Javier Alonso Ordoñez for their academic and personal support in
the development of processes and thermodynamics topics.
To Cristian Hasenstab for his valuable professional judgment and support in the
acquisition of the basis of Life Cycle Assessment.
To Santiago Cespedez Zuluaga for the support provided in thermodynamic topics
To Gustavo Alberto Moreno for his support in several topics of my research work
To John Posada Duque for giving me valuable academic support during my doctoral stay
at TU Delft (Delft University of Technology).
To the mining companies for the data provided and for allowing me to execute this
research project into their operational processes...
To professor Carmen Elena Sánchez Zapata, because without her academic and
personal support it would not have been possible to carry out my doctoral studies.
To professors Dario Gallego Suarez and Camilo Suarez for the research, academic and
personal basis provided in this academic process.
To Andrés Naranjo, for the occasional meetings that allowed to conceive the idea of
assessing the sustainability of mining projects in Colombia.
To Diego Salamanca for his professional tutoring.
To Andres Cano for his notions in the concept of public policies

To the evaluation committee this doctoral thesis for reviewing it for a scientific discussion.

Abstract VII
Abstract
In this doctoral thesis the sustainability of two mining systems in Colombia is evaluated;
open-pit and alluvial mining from cradle to gate, through the implementation of
environmental, social and / or economic indicators provided by Life Cycle Assessment
(LCA), Exergy Analysis, and Emergy Accounting. Stages of the process that generate
greater environmental impacts, exergy losses, and lower overall emergy efficiency in the
entire productive chain are identified to decide where to put efforts in order to optimize
systems in the most efficient way. Finally, complementarity or redundancy of results
obtained by the three methodologies is identified as a tool to inform decision making in
mining sector.
An integration methodology for sustainability assessment is proposed, in which a unified
performance metric (Integrated Sustainability Index) is obtained to evaluate Triple Bottom
Line - TBL throughout the mining production process, which can be implemented in other
production systems. This index presents a comprehensible hierarchical structure built by
support methodologies such as LCA, Emergy, and Exergy, which have regulatory and
academic validity. All of this with the aim of providing a useful analysis tool to policy
makers for the proposal of improvements, changes and key elements for the economic,
energy, and especially environmental optimization of the process.
LCA evaluates process sustainability based on the environmental impacts generated by
waste and emissions released to the environment; Emergy based on the use of the
necessary resources to carry out the process, and Exergy based on process efficiency.
Based on this, Open-pit mining presents higher values in human health damage category,
whereas alluvial mining causes more damage on ecosystem quality. In emergy terms,
both extractive systems present a high dependence on imported non-renewable
resources, which makes processes less sustainable in the long term. Exergetically, both
mining processes, especially Open-pit, are considered as anti-exergy, since there is a
decrease of exergy between the initial state of input and end of output, producing waste

with a high exergy content. However, the market price of gold is the one that internalizes
the externalities generated in the process, bearing exergy losses and, in turn, allowing to
recover the natural and human capital invested. Results of the proposed integration
method show that alluvial mining presents a better environmental and social behaviour,
while open-pit mining does it in the economic dimension.
Process sustainability can be improved by the efficient use of resources, optimization of
exergy efficiency and, decreasing the consumption of non-renewable resources,
replacing them with local renewable resources especially in tails and extraction stage in
open-pit mining, stripping and benefit stage in alluvial mining.
Keywords: Sustainability, mining sector, gold extraction, Life Cycle Assessment, Exergy
Analysis, Emergy Accounting

Content IX
Content
Page
Abstract.......................................................................................................................... VII
List of figures................................................................................................................ XIII
List of tables ................................................................................................................ XVI
List of symbols and abbreviations ........................................................................... XVIII
Introduction ..................................................................................................................... 1
Research problem ...................................................................................................... 9
Doctoral contribution .................................................................................................. 9
Justification .............................................................................................................. 11
Proposal ................................................................................................................... 17
Hypothesis ............................................................................................................... 18
Objectives ................................................................................................................ 18
1. Sustainability Assessment of Gold Mining by Life Cycle Assessment: Open-pit Mining VS Alluvial Mining ............................................................................................. 21
1.1 Introduction ........................................................................................................ 22
1.2 Description of gold mining system technology in Colombia: alluvial mining and open-pit mining ......................................................................................................... 27
1.2.1 Description of open-pit mining process ..................................................... 28
1.2.2 Description of alluvial mining process ....................................................... 33
1.3 Life cycle assessment (LCA).......................................................................... 37
1.3.1 Goal and Scope .................................................................................. 37
1.3.2 Allocation ............................................................................................ 38
1.3.3 LCA Assumptions and data ................................................................. 39
1.3.4 Life cycle inventory (LCI) ..................................................................... 41
1.3.5 Life cycle impact assessment (LCIA) ................................................... 44
1.3.6 Sensitivity analysis .............................................................................. 45
1.4 Results and discussion .................................................................................. 46
1.4.1 Non-renewable, renewable resources and energy inputs .................... 46
1.4.2 Environmental impact categories in open-pit vs alluvial mining technologies ...................................................................................................... 55
1.4.3 Sensitivity analysis open-pit vs alluvial mining technologies ................ 62
1.4.4 Environmental end-points indicators in open-pit and alluvial mining technology ......................................................................................................... 66
1.4.5 Contribution of dominant substances .................................................. 68
1.5 Conclusions ................................................................................................... 70

Content X
1.6 Acknowledgments .......................................................................................... 73
1.7 Disclaimer ...................................................................................................... 74
References ............................................................................................................... 74
2. Life Cycle Assessment of Exergy Indicators in Colombian Gold Mining Sector: Case Study in Open-Pit and Alluvial Mining Process ................................................. 79
2.1 Introduction .................................................................................................... 80
2.2 Exergy Analysis in mining sector ................................................................... 84
2.3 Case study: open-pit and alluvial mining technologies in Colombia................ 86
2.3.1 Open-Pit mining technology ...................................................................... 86
2.3.2 Alluvial mining technology ........................................................................ 89
2.4 Methodology .................................................................................................. 94
2.4.1 Energy / Exergy indicators for Life Cycle Assessment perspective ........... 95
2.4.2 Thermodynamic approach of Energy / Exergy indicators .......................... 96
2.5 Results and discussion ................................................................................ 102
2.5.1 Energy/Exergy indicators from life cycle assessment perspective .......... 102
2.5.2 Thermodynamic approach to Energy/Exergy indicators .......................... 116
2.6 Discussion and Conclusions ........................................................................ 138
2.7 Acknowledgments ........................................................................................ 142
2.8 Disclaimer .................................................................................................... 142
References ............................................................................................................. 143
3. Emergy synthesis and Life Cycle Assessment integration (Em-LCA) for evaluating the environmental sustainability of gold production ............................. 150
3.1 Introduction .................................................................................................. 151
3.2 Background ................................................................................................. 154
3.2.1. Emergy accounting ................................................................................ 154
3.2.2. Emergy "algebra" ................................................................................... 156
3.3 Methodology ................................................................................................ 157
3.3.1 Emergy accounting method .................................................................... 157
3.3.2 Traditional sustainable emergy indicators ............................................... 165
3.3.3 Improved sustainable emergy index ....................................................... 167
3.3.4 Sensitivity analysis ................................................................................. 171
3.4 Results ........................................................................................................ 172
3.4.1 Sustainability emergy-based traditional indicator results and analysis. ... 176
3.4.2 Improve sustainability emergy- indicator results and analysis. ................ 181
3.4.3 Sensitiviy analysis .................................................................................. 187
3.5 Conclusions ...................................................................................................... 189
3.6 Acknowledgments ............................................................................................ 190
3.7 Disclaimer ........................................................................................................ 191
References ............................................................................................................. 191
4. Exergy, emergy and life cycle sustainable indicators: Open-pit and alluvial mining .......................................................................................................................... 197
4.1 Introduction ...................................................................................................... 198
4.2 Methodology ..................................................................................................... 199
4.2.1 Life cycle assessment, exergy and emergy indicators to open-pit and alluvial mining .................................................................................................. 200
4.2.2 Critical stages of open-pit and alluvial mining process ............................ 201
4.2.3 Doctoral contribution ............................................................................... 201
4.3 Results ........................................................................................................ 203

Content XI
4.3.1 Life cycle assessment, exergy and emergy indicators to open-pit and alluvial mining .................................................................................................. 203
4.3.2 Complementarity or redundancy among analysis methodologies: LCA, ExA, EmA ........................................................................................................ 215
4.3.3 Limiting factors of each methodology ................................................ 221
4.4 Outlook ............................................................................................................. 229
4.5 Conclusiones .................................................................................................... 230
4.6 Acknowledgments ............................................................................................ 232
4.7 Disclaimer ........................................................................................................ 232
References ............................................................................................................. 232
5. Life Cycle Assessment, exergy analysis and emergy integration .................... 237
5.1 Introduction ...................................................................................................... 237
5.2 Background ...................................................................................................... 238
5.2.1 Sustainability .......................................................................................... 238
5.2.2 Definition of elements ............................................................................. 243
5.3 Integrated sustainability index methodology based on LCA, Exergy, and Emergy244
5.3.1 Aggregation indices into four categories and their contribution to sustainability dimensions ................................................................................. 244
5.3.2 Definition of categories ........................................................................... 245
5.3.3 Mathematical description of the methodology ......................................... 255
5.3.4 Category characteristics ......................................................................... 255
5.3.5 Reference value of the category ............................................................. 256
5.3.6 Analysis of results by category ............................................................... 256
5.3.7 Normalization with reference and redirection of categories ..................... 257
5.3.8 Aggregation categories into sustainability dimensions ............................ 258
5.3.9 Reference value of dimensions............................................................... 258
5.3.10 Normalization of dimensions using reference value .............................. 259
5.3.11 Sustainability index by Aggregation dimensions. .................................. 259
5.4 Results ............................................................................................................. 260
5.4.1 Case 1: Open-pit Vs Alluvial mining ........................................................ 261
5.4.1 Case 2: sensitivity for Weighted Average Sustainability Index (WASI) and Average Adjusted Sustainability Index (AASI) applied to open-pit and alluvial mining. .......................................................................................................... 269
5.5 Final Comments ............................................................................................... 272
5.6 Conclusiones .................................................................................................... 274
5.7 Acknowledgments ............................................................................................ 276
References ............................................................................................................. 276
6. Overall Conclusions ............................................................................................. 280
A. Appendix A. Chemicals compounds used in open-pit mining and alluvial technology ............................................................................................................. 287
B. Appendix B. Impact categories (mid-point) sensitivity analysis. Fossil energy consumption to open-pit mining technology. ........................................................... 291
C. Appendix C. Damaged categories (end-point) sensitivity analysis. Fossil energy consumption to open-pit mining technology. ........................................................... 295
D. Appendix D. Grassmann energy diagram open-pit mining by process. ........... 299

Content XII
E. Appendix E. The composition of the continental crust and value of chemical exergy ................................................................................................................. 302
F. Appendix F. Calculation of chemical exergy for chemical substances. Estimation of enthalpia, gibbs energy and training entropy .................................... 304
G. Appendix G. calculation of chemical exergy of biomass (vegetal cover) ........ 307
H. Appendix H. Energy, exergy and mass balance to open-pit mining technology308
I. Appendix I. Energy, Exergy and mass balance to open-pit mining technology318
J. Appendix J. Cumulative Exergy Demand (CEnD) category sensitivity analysis329
K. Appendix K ........................................................................................................... 333
L. Appendix L. open-pit and alluvial mining process, emergy calculations. ........ 337
M. Appendix M. Annual resources consumption to open-pit and alluvial mining process ................................................................................................................. 360
N. Appendix N. Supporting information ecological services and emergy equivalent loss to open-pit and alluvial mining process. ........................................................... 367
General references ...................................................................................................... 368

Content XIII
List of figures
Page
Figure 1-1: Flow diagram of open-pit mining process from stripping to casting and
moulding..........................................................................................................................32
Figure 1-2: Flow diagram of alluvial mining process from stripping to casting and
moulding..........................................................................................................................36
Figure 1-3: ReCiPe methodology framework with midpoint and endpoint indicators
(Goedkoop, M., Heijungs, R., Huijbregts, M., De Schryver, A., Struijs, J., Van Zelm, 2013).
........................................................................................................................................44
Figure 1-4: Energy consumption and loss for each stage of the process in open-pit
mining technology. ..........................................................................................................47
Figure 1-5: Energy consumption for each stage of the process in alluvial mining
technology. ......................................................................................................................49
Figure 1-6: Non-renewable (inert material removed) and renewable (water) consumption
in open-pit mining technology from cradle to gate. Non-renewable (inert material
removed) and renewable consumption is not specific. .....................................................51
Figure 1-7: Non-renewable (inert material removed) and renewable (water) consumption
in alluvial mining technology from cradle to gate. Non-renewable (inert material removed)
and renewable consumption is not specific. .....................................................................52
Figure 1-8: Water use in open-pit and alluvial mining technologies. ................................53
Figure 1-9: Comparison of midpoint impacts of different mining systems (total values, cut
at 20000). ........................................................................................................................57
Figure 1-10: Comparison of midpoint impacts of different mining systems (normalized
values, cut at 40). ............................................................................................................57
Figure 1-11: Environmental impact categories in open-pit mining technology by
processes. .......................................................................................................................59
Figure 1-12: Environmental impact categories (mid-point) in alluvial mining technology by
processes. .......................................................................................................................60
Figure 1-13: Environmental impact categories in open-pit and alluvial mining technologies
by phases. .......................................................................................................................61
Figure 1-14: Environmental impact categories in open-pit and alluvial mining technologies
by-products. ....................................................................................................................62
Figure 1-15: Sensitivity analysis in open-pit mining, impact categories (mid-point). ........63
Figure 1-16: Sensitivity analysis in alluvial mining, impact categories (mid-point). ..........63
Figure 1-17: Sensitivity analysis in open mining, damaged categories (end-point). ........64
Figure 1-18: Sensitivity analysis in open mining, damaged categories (end-point). ........65

Content XIV
Figura 1-19: End-point environmental indicators ecosystem quality, human health, and
resources in open-pit and alluvial mining technologies. ...................................................66
Figure 1-20: End-point environmental indicators per processes in open-pit mining
technology. ......................................................................................................................67
Figure 1-21: End-point environmental indicators by process in alluvial mining technology.
........................................................................................................................................68
Figure 1-22: Contribution of first 30 dominant substances in open-pit mining technology.
........................................................................................................................................69
Figure 1-23: Contribution of first 30 dominant substances in alluvial mining technology. 69
Figure 2-1: Description of open-pit mining technology. ...................................................88
Figure 2-2: Description of open-pit mining technology. ...................................................90
Figure 2-3: Cumulative Energy Demand (CEnD) for each stage of a) open-pit mining
process and b) alluvial mining process. ......................................................................... 103
Figure 2-4: Cumulative Exergy Demand (CExD) for each stage of a) open-pit mining
process and b) alluvial mining process. ......................................................................... 105
Figure 2-5: Comparison between CEnD and CExD for each stage of a) open-pit mining
process and b) alluvial mining process. ......................................................................... 107
Figure 2-6: CExD sensitivity analysis for a) open-pit mining technology b) alluvial mining
technology. .................................................................................................................... 113
Figure 2-7: CEnD sensitivity analysis for a) open-pit mining technology b) alluvial mining
technology. .................................................................................................................... 114
Figure 2-8: Grassmann exergy diagram open-pit mining by process. ........................... 125
Figure 2-9: Grassmann global exergy diagram open-pit mining by process. ................. 129
Figure 2-10: Grassmann exergy diagram alluvial mining by process. ........................... 130
Figure 2-11: Grassmann global exergy diagram open-pit mining by process. ............... 134
Figure 2-12: Sensitivity analysis alluvial mining a) exergy efficiency b) Sustainable index.
...................................................................................................................................... 135
Figure 2-13: Sensitivity analysis open-pit mining a) Exergy efficiency b) Sustainable
index. ............................................................................................................................ 137
Figure 3-1: System emergy diagram showing the interrelation of renewable (R),
nonrenewable (NR) and imported flows (F) of open pit mining process. ........................ 162
Figure 3-2: System emergy diagram showing the interrelation of renewable (R), non-
renewable (NR) and imported (F) flows of alluvial mining process. ................................ 163
Figure 3-3: Sensitivity analysis changing emergy efficiency a) open-pit mining b) alluvial
mining. .......................................................................................................................... 187
Figure 3-4: Sensitivity analysis changing emergy efficiency a) open-pit mining b) alluvial
mining. .......................................................................................................................... 188
Figure 4-1: End-point environmental indicators ecosystem quality, human health, and
resources in open-pit and alluvial mining technology. .................................................... 204
Figure 4-2: Relationships among Exergy Cumulative Demand, Efficiency and
Sustainability in open-pit and alluvial mining. ................................................................. 207
Figure 4-3: Sustainable ternary diagram in open-pit and alluvial mining. Renewable, non-
renewable and purchased resources. ............................................................................ 208

Content XV
Figure 4-4: Spider diagram to open-pit and alluvial mining process by a) each
methodology. ................................................................................................................. 210
Figure 4-5: CExD, CEnD, CemD and TEP to open-pit and alluvial mining processes. .. 212
Figure 4-6: Energy, Exergy and Emergy efficiency to open-pit and alluvial mining
process.......................................................................................................................... 213
Figure 5-1: Sustainability integration evaluation by Emergy Accounting, Exergy Analysis
and Life Cycle Assessment. (Modified Reza, Sadiq, & Hewage, 2014b)........................ 239
Figure 5-2: Challenges in the productive process to make it more sustainable. ............ 240
Figure 5-3: Pyramide methodology. .............................................................................. 244
Figure 5-4: Sustainable trilemma LCA, Emergy and Exergy. ........................................ 252
Figure 5-5: Structural model of sustainable development for the proposed methodology.
...................................................................................................................................... 254
Figure 5-6: Reference value of each dimension. ........................................................... 258
Figure 5-7: Environmental, social and economic dimensions to open-pit and alluvial
mining. .......................................................................................................................... 266
Figure 5-8: Spider diagram to open-pit and alluvial mining process to all selected
indicators. ...................................................................................................................... 267
Figure 5-9: Sustainable exergy/emergy/integrated index to open-pit and alluvial mining.
...................................................................................................................................... 268
Figure 5-10: WASI index montecarlo and lognormal fit resume for Open-pit and Alluvial
mining. .......................................................................................................................... 269
Figure 5-11: AASI index montecarlo and lognormal fit resume for Open-pit and Alluvial
mining. .......................................................................................................................... 270
Figure 5-12: Sustainability assessment framework. ...................................................... 273
.

Content XVI
List of tables
Page
Table 1-1: Phases and Subsystems for open-pit and alluvial (or placer) mining
technologies. ...................................................................................................................37
Table 1-2: Input/output description in open-pit and alluvial mining technologies. .............42
Table 1-3: Energy and water Consumption in others studies. .........................................50
Table 1-4: Comparison of gold processes impact categories for open-pit and alluvial
mining technologies, and ecoinvent 3.1. Database. .........................................................57
Table 2-1: Input / output description in open-pit and alluvial mining technology. .............92
Table 2-2: Cumulative energy demand (CEnD) of impact assessment method
implemented in Ecoinvent. Taken from (Hischier et al., 2010). ........................................95
Tabla 2-3: Cumulative exergy demand (CExD) of impact assessment method
implemented in Ecoinvent. Taken (Hischier et al., 2010). ................................................96
Table 2-4: Cumulative Energy (CEnD) / Exergy Demand (CExD ) for each stage in open-
pit mining process. ........................................................................................................ 109
Table 2-5: Cumulative Energy (CEnD) / Exergy Demand (CExD) for each stage in alluvial
mining process. ............................................................................................................. 111
Table 2-6: Energy and Exergy indicators (thermodynamic approach) to open-pit mining
technology. .................................................................................................................... 118
Table 2-7: Stream utility efficiency for each stage of the process in open-pit mining
technology. .................................................................................................................... 119
Table 2-8: Exergy indicators (thermodynamic approach) to alluvial mining technology. 122
Table 2-9: Stream utility efficiency for each stage of the process in open-pit mining
technology. .................................................................................................................... 123
Table 3-1: Open-pit and alluvial mining process. ........................................................... 158
Table 3-2: Traditional emergy index. ............................................................................. 165
Table 3-3: Acceptable according to Colombian regulations, (Ministry of Environment and
Sustainable Development, 2017, Ministry of Social Protection and Ministry of
Environment, Housing and Territorial Development, 2017). ........................................... 168
Table 3-4: Improved emergy indicators. ........................................................................ 170
Table 3-5: Emergy calculations from open-pit mining process, discretizing renewable,
nonrenewable, and imported resources. ........................................................................ 173
Table 3-6: Emergy calculations from alluvial mining process, discretizing renewable,
nonrenewable, and imported resources. ........................................................................ 174
Table 3-7: Emergy indices of the two mining systems. .................................................. 176
Table 3-8: Emergy equivalent loss and ecological services by waterborne pollution in
open-pit mining. ............................................................................................................. 183
Table 3-9: Emergy equivalent loss and ecological services by airborne pollution in open-
pit mining. ...................................................................................................................... 184
Table 3-10: Emergy equivalent loss and ecological services by waterborne pollution in
alluvial mining. ............................................................................................................... 184

Content XVII
Table 3-11: Emergy equivalent loss and ecological services by airborne pollution in
alluvial mining. ............................................................................................................... 185
Table 3-12: Solid wastes occupation on economy. ....................................................... 185
Table 3-13: Emergy traditional indicator vs emergy improved indicator to open-pit and
alluvial mining process. ................................................................................................. 186
Table 4-1: LCA indicators. Open-pit and alluvial mining. ............................................... 204
Table 4-2: Environmental impact categories allocation, Material deposit, silver, and gold
in open-pit mining. ......................................................................................................... 205
Table 4-3: Exergy indicators to open-pit and alluvial mining. ......................................... 206
Table 4-4: Exergy indicators to open-pit and alluvial mining. ......................................... 208
Table 4-5: Summary of differences and similarities between Life cycle Assessment,
Exergy Analysis and Emergy Accounting. ..................................................................... 226
Table 5-1: Summary of indicators calculated for each analysis methodology. ............... 240
Table 5-2: Aggregation methodology indicators in categories and dimension of analysis.
...................................................................................................................................... 253
Table 5-3: Reference value for each category............................................................... 256
Table 5-4: Summary of indicators from LCA, Exergy and Emergy Analysis for open-pit
and alluvial mining. ........................................................................................................ 262
Table 5-5: Impact categories for open-pit and alluvial mining. ....................................... 265
Table 5-6: Environmental, social and economic dimension for open-pit and alluvial
mining. .......................................................................................................................... 266
Table 5-7: Summary of statistics for SI, AASI and WASI indices. .................................. 272

Content XVIII
List of symbols and abbreviations
Symbols with Latin letters
Símbolo Término Unidad SI E Exergy destroyed kJ D Depletion Number Dimensionless Ii Relative irreversibility Fraction SI Sustainable Index Dimensionless H° Enthalpy kJ kg -1 E° Specific Exergy kJ kg -1 DH , Enthalpy of formation kJ kg -1 DG , Entropy of formation kJ kg -1 K -1
HHV Higher calorific power kJ kg -1 UEV Unit Emergy Value seJ/USD ELR Enviromental Loading Ratio Dimensionless EYR Emergy Yield Ratio Dimensionless ESI Emergy Sustainable Indices Dimensionless EIR Emergy Investment Ratio Dimensionless SEC Soil Emergy Cost % EER Emergy Exchange Ratio Dimensionless
PUEV Product Unit Emergy Value seJ/g EL Emergy equivalent loss seJ/yr
Symbols with greek letters
Symbol Term Unit SI ∆ ° Standard specific entropy kJ kg -1 K -1 ° Standard entropies kJ kg -1 K -1 𝜂 Efficiency of the first law Fraction 𝜏 Exergy efficiency Fraction Exergy efficiency of the product Fraction
Ecological efficiency Fraction Environmental exergy indicator Dimensionless 𝜖 ℎ Chemical exergy kJ

Content XIX
Subindex
Subindex Term
HH Human health EQ Ecological resources SW Solid waste
Environmental load Use of resources Damage to human health Human labor Quality of life Economic inversión 𝑌 Economic performance
Environmental weighting factor
Social weighting factor Economic weighting factor 𝐿 Environmental Changes in Line Base 𝐿 Social changes in line base 𝐿 Economic changes in line base
Environmental dimension Social dimension
Economic dimension
Abbreviations
Abbreviation Term LCA Life Cycle Assessment PST Total Suspended Particles AMD Acid Mine Drainage LCIA Life cycle impact assessment WSI Water Stress Index WDP Water Deprivation Potential ExLCA Exergy Analysis of the Life Cycle EM-LCA Emergy and Life Cycle Assessment NGO Non-Governmental Organization CExD Cumulated Exergy Demand CEnD Cumulative Energy Demand LCEA Life Cycle Exergy Assessment CIP Carbon In Pulp Circuit WTTP Waste Tailings Treatment Plant R Renewable NR Non-renewable F Imported PDF Potentially Disappeared Fraction DALY Disability Adjusted Life Years GDP Gross domestic product USD American dollar ELHH Emergy equivalent of human health loss

Content XX
Abbreviation Term
ELEQ Emergy equivalent of loss in support of local ecological resources
ELSW Emergy equivalent of natural loss due to discharge of solid waste on land
CEmD Cumulative Emergy Demand TEP Total Environmental Points ExA Exergy Analysis EmA Emergy Accounting OGC Ore Grade Cutoffs S-LCA Social and Socio-Economic LCA E-LCA Environmental LCA 𝐿 Environmental load category
Use of resources category Damage to human health category 𝐿 Human labor category 𝐿 Quality of life category
Economic inversión category 𝑌 Economic performance category AASI Average Adjusted Sustainability Index WASI Weighted average sustainability index ISI Integrate Sustainable Index EmSI Emergy Sustainable Index ExSI Exergy Sustainable Index GRI Global Reporting Initiative

Introduction
Mining companies face unprecedented social pressure to assume their commitment to
seek competitive advantages in the long term through responsible management of
environmental and social problems in response to the economic profits obtained (Botín &
Vergara, 2015). Sustainability is being used more and more to describe a paradigm that
supports the configuration of social and economic future of humanity (Kharrazi, Kraines,
Hoang, & Yarime, 2014)
There is a social conception that mining cannot be a sustainable activity, because
operations have a finite lifespan, and the dependence of humanity on non-renewable
resources cannot go on indefinitely (Sterman, 2012). In addition, non-renewable
resources that will be scarce one day are being extracted, and future generations will not
be able to make use of them, which brings significant negative environmental and social
impacts. (Kirsch, 2009; Whitmore, A., 2006; Young, J., Septoff, A., 2002). These are
some of the main controversial matters that opponents use to abort mining projects. In
other words, the main problem of mining projects today does not lie in the environmental
license, nor in the governmental operating license where the project will be executed; it
lies in obtaining social license, a situation that triggers social, energy, economic, and
environmental problems. This behaviour occurs mainly because there are no real,
tangible and quantifiable indicators through a measurable scientific base that provides
society with foundations and objective elements to make decisions (Molina & Restrepo,
2010). The social license / permit requires a scientific judgment tool. Achieving the social
license to operate is a key condition for successfully establishing and running a mining
project. The social license requires trust between the different actors, and trust requires
knowledge (Falck & Spangenberg, 2014).
Mining industry, as will be discussed throughout the document, can contribute to
sustainable development, in the sense that if it is managed properly it can provide long-
term opportunities for economic growth and social development with acceptable

2 Introduction
environmental impacts. (ICMM, 2012a). In particular, mining produces minerals, metals
and energy, which have been the central driver of development since before the industrial
age (ICMM, 2012c) as well as providing employment and training (Trigger, 2003), paying
taxes and royalties (Auty, R.M., Warhurst, A., 1993), providing vital infrastructure to local
communities (Günther, P., Naldu, T., Mey, 2008), and providing the materials needed for
a low carbon economy (ICMM, 2012b); that is, the decreasing natural capital of depleting
mineral resources is sufficiently replaced by increasing human capital, such as
knowledge, infrastructure and adequate substitutes (Henckens, Driessen, Ryngaert, &
Worrell, 2016). Despite the efforts made by mining companies to calculate integrated
indicators for sustainability assessment, the GRI (Global Reporting Initiative) has not
identified a standardized set of performance indicators. However, companies are
encouraged to develop an adequate list of integrated performance indicators and include
it in their reports as an attempt to contribute to further development in this area (Azapagic,
2004). However, as mentioned in Azapagic, 2004, the calculated indicators should be
taken as an example or basis to continue investigating the issue, instead of taking them
as a definitive list. So far, only environmental efficiency has interacted with economic
efficiency of the process, and economic performance with social welfare presented on a
GRI. Nevertheless, these correlations have not been developed under conclusive analysis
methodologies approved by the scientific community. Further development of these
results is necessary to allow the integration of the three sustainability dimensions
(Azapagic, 2004).
A holistic view of system sustainability is necessary to ensure a good management of
mining activities through an integrated approach able to assess processes from two
points of view: "user-side" and "donor-side". User-side analyzes final efficiency indicators
of the process (environmental impacts per unit of product generated, or energy / exergy
delivered per unit of energy /exergy inverted). Donor-side considers the work nature does
to provide resources for the production of a good or service, and in turn, to assimilate the
pollutant load released to the environment as an important component of sustainability
assessment. Accounting of the economic return in relation to the investment made cannot
be ignored; as well as the effects and welfare that project execution can bring to society
(Arbault, Rugani, Tiruta-Barna, & Benetto, 2014).

Introduction 3
To achieve this integration, Life Cycle Assessment (LCA), Exergy Analysis as User-side
approach, and Emergy Accounting as donor-side view are implemented in this project;
analysis techniques that account for sustainability indicators in environmental, economic
and / or social dimensions, which cannot provide an assessment under these three
dimensions in a robust way by themselves. Since some of them develop indicators that
others do not, it is necessary to implement them as a complement but not as
interchangeable techniques, providing additional information for decision making.
One of the meeting points of these analytical methods is that each one has exactly the
same methodological problems: joint production, commensuration, deliberation, limits
setting, and double counting. Another meeting point is that in recent years there has been
an increasing tendency to "integrate" different Environmental Accounting Methods to have
a more complete picture of impacts caused by the creation of a product or service
provision, instead of depending on a method that generally has a single criterion
perspective (Kharrazi et al., 2014).
Detractors of this integration argue that it is a reductionist approach which leads to an
assessment of the three sustainability dimensions through non-correlated factors
(Kharrazi et al., 2014). Although a holistic approach may result in the loss of information
about each individual dimension and the indicators that compose them, it is also true that
creating a holistic system-level image of the interactions between dimensions is critical for
quantifying sustainability. The challenge is then to build methodological tools that can be
integrated quantitatively into three dimensions.
It is worth noting that the aim of this doctoral thesis is not to assess or to question the
theoretical and scientific bases of each methodology. Its aim is to analyse the indicators
generated by each methodology implemented for this specific case study, and to
determine how complementary or redundant can be the results obtained for the two
mining systems assessed through decision making depending on the convergence or
divergence of results obtained for each method. This analysis results in the proposal of an
integrated sustainability analysis methodology, as will be shown throughout this
document. It does not mean that this integration constitutes a "super-method", since this
will surely be subject to improvements which will be developed gradually through joint
efforts of the entire scientific community. But it can be used as a precedent of integration,

4 Introduction
since to date the three mentioned methodologies have been implemented individually and
complementary but not in an integrated way that allows all numerical results to be
compared.
An integration method is proposed despite the fact that each method differs on its basis of
analysis and solve common methodological problems in a different way; LCA as an
ecological approach, Emergy as an ecological-economic approach, and Exergy regarding
thermodynamics. One of the advantages of implementing these standardized methods is
that all assessments using the same environmental accounting method can be validly
compared when exactly the same method is used; it is not recommended to compare
results between different environmental accounting methods (this is LCA and Emergy),
however, the comparison of these results can be used as a guide to corroborate that
decision making is made regarding process sustainability to be analyzed through a
comparison of similarities and differences between the implemented methods. The
challenge in this topic is to determine differences, similarities and points where the three
valuation methods implemented in this study complement each other. This will possibly
provide a more complete and nuanced picture of the environmental, economic and social
impacts of producing a product or service, and thus devise ways to overcome this 'divided
standardisation' between different Environmental Accounting methods. It should be noted
that all accounting methods must preserve their unique characteristics. Some of them
tend to be pragmatically driven by particular professional audiences, others are more
theoretical and some others are more responsive to particular types of research or politic
questions.
In order to achieve the above, this doctoral thesis comprises six chapters: Chapter One
addresses project justification that makes public the study problems and the need to
implement analysis methodologies, such as Life Cycle Assessment, Exergy Analysis, and
Emergy Accounting for sustainability assessment of two gold mining processes (Open-pit,
and alluvial mining) based on the sustainability indicators provided by each valuation
methodology, being this the general objective of this thesis.
Chapter two aims to develop the first specific objective of this doctoral thesis; to assess
the environmental sustainability of two gold extractive systems from cradle to gate: open-
pit and alluvial (placer) mining technologies by the application of Life Cycle Assessment

Introduction 5
(LCA), and to know what are the most critical stages of both, evaluated by impact
categories, and to understand the behaviour of sustainability of each mining process for
environmental decision making. Environmental impacts were classified and characterized
by (mid-point) impact categories and aggregated by end-point indicators assigned through
ReCiPe Methodology. The effectiveness of efficiency measures was evaluated by
comparing different scenarios of optimized electricity and fuel consumption in a sensitivity
analysis.
Chapter three aims to develop the second objective of this thesis through the
implementation of exergy analysis to assess the environmental load (environmental
impacts) by calculating exergy destroyed due to the use of renewable and non-renewable
resources along the entire productive chain. Although the only commitment was to
implement exergy analysis, it was necessary to complement it with LCA as an addition of
the last methodology to ExLCA(Exergy Analysis of the Life Cycle) as complementary and
not exchangeable tools for sustainability assessment of two gold mining systems in
Colombia; Open-pit and alluvial mining processes from cradle to gate, under two
perspectives: a) Exergy Analysis methods taken from a life-cycle perspective, quantifying
exergy life cycle efficiencies; Cumulative Energy/Exergy Demand distinguishing between
renewable and non-renewable resources used in the process, and b) thermodynamic
approach, quantifying Cumulative Energy/Exergy Demand, input/output Exergy,
destroyed Exergy, Relative Irreversibility, Product Exergy Efficiency, Exergy efficiency
and Sustainable Index (SI) for all stages of both mining processes. Additionally, a
sensitivity analysis was carried out to evaluate the effect of the invested work decrease on
exergy efficiency and Sustainable Index in thermodynamic approach, and the effect
improving electric and fossil energy consumption efficiency on Cumulative Energy/Exergy
Demand of renewable and non-renewable resources under LCA approach.
Chapter four aims to develop the third objective of this doctoral thesis. In this Chapter, the
work that nature had to provide to generate and concentrate renewable, non-renewable
and imported resources used for gold production was calculated in solar equivalents
joules by Emergy Accounting. Note that this analysis method does not quantify the loss of
natural and human capital as a consequence of airborne and waterborne emissions and
solid waste generation, nor the ecological services to dilute emissions generated in the
process. For this reason these topics were assessed in emergy terms using Emergy

6 Introduction
Accounting and Life Cycle Assessment, one as a complement to the other (Em-LCA),
although the combination of these two methodologies was beyond the scope of this study.
It finally leads to the sustainability assessment of open-pit and alluvial mining extraction
systems in Colombia using sustainable indicators provided by emergy accounting.
Finally, chapter five addresses in a conclusive way the last three objectives of this
doctoral thesis. In this chapter, a summary of sustainability indicators and environmental
impact categories showed by each analysis methodology is presented and compared; Life
Cycle Assessment, Exergy, and Emergy to open-pit and alluvial mining using ternary and
spider diagram. Stages of the process that generate greater environmental impacts,
exergy losses and lower overall emergy efficiency in the entire productive chain were
identified to decide where to put efforts to optimize systems in the most efficient way; this
combined approach helps to achieve a more sustainable development of production
systems and society in general. Finishing with the identification of complementarity or
redundancy of results obtained by the three methodologies as a tool to inform decision
making in the mining sector. It should be noted that as each of the valuation methods was
implemented, from macro (LCA) to micro (Emergy Accounting) through Exergy Analysis,
convergence and divergence points of these three methodologies were identified, which
allowed the formulation of an integration method.
Up to this point, the six specific objectives of this doctoral thesis are addressed. An
additional chapter was developed since LCA, Exergy and Emergy Analysis have been
addressed individually for sustainability assessment in mining projects and in a
complementary manner (not necessarily in the mining sector), but to date it has not been
addressed through an integration of methodologies, being this the conclusive subject of
this doctoral thesis presented in chapter 6. In this way, the objective of this paper is to
propose a sustainability assessment framework based on emergy accounting, Exergy
analysis, and LCA, to obtain a unified performance metric (Integrated Sustainability Index)
to assess Triple Bottom Line - TBL over life cycle of mining system that can be used in
other production systems. Some of the main problems faced by both designers and
decision makers are precision and uncertainty in the calculation of these integrated
indexes, this document presents step by step the proposed methodology to achieve the
desired clarity and transparency. Appendices supporting methodological calculations and
results of each chapter can be found at the end of the document.

Introduction 7
From chapter 2 to 6 items are the following: introduction, methodology, results, and
conclusions, also addressing limitations of the study and challenges that remain to be
addressed in Outlook.
At this point, it is important to make the following clarifications
This research work was focused mainly on the environmental dimension since it is
one of the meeting points between the three analysis methodologies, so each one of them
provides indicators on environmental burden and use of resources in this dimension.
Social and economic dimensions have indicators provided only by two methodologies, so
these two dimensions are not so robust. There is an awareness that mainly the social
dimension assessment requires more indicators that can reflect the negative impacts and
real benefits of the implementation of this type of project. Social evaluation has always
been one of the main controversy matters in sustainability assessment and therefore one
of the greatest challenges. There are analytical methodologies for the assessment of
social and economic sustainability such as Social and Socio-Economic Life Cycle
Assessment (S-LCA) (Jørgensen, Le Bocq, Nazarkina, & Hauschild, 2008;
UNEP/SETAC, 2009), thermoeconomic (Bejan, A., Tsatsaronis, G., Moran, 1996) and
thermoecology (Szargut, J. 2005); however, to date, there is no consensus on which
indicators are most suitable for making these type of assessments. These are relevant
topics whose implementation deserves the development of a magister or doctoral thesis
depending on their scope. Indicators developed within the integration method were those
provided by each methodology implemented for the sustainability assessment of two
mining processes in Colombia.
Methodology: The starting point for the implementation of each analysis
methodology was the definition of system boundaries, which are the same for both mining
processes. Followed by delimitation of a period of time to carry out the study and
collection, revision, and updating of environmental and socioeconomic data of the system
to be studied. Once the entire system and its subsystems have been delimited with
defined boundaries, a process flow diagram is built. Next step is to obtain thermodynamic
balances (matter, energy, and exergy) from the previously defined system. Finally, LCA,
Exergy, and Emergy methodologies are implemented in both gold mining systems. The
methodology for each tool is described in the corresponding chapters.
To achieve consistent results: the same set of data is used for the three analysis
methodologies in both gold mining systems (open-pit and alluvial mining), as well as the

8 Introduction
same system boundaries (cradle to gate). Data was associated with first-hand data on an
annual time scale by two mining technologies combined with material and energy
balances, no data was assumed. For alluvial mining, the inventory was built from nominal
values for a historical production of 6 years, while for open-pit mining it was built from
mass and energy balance assuming the average productivity over 11 years at extraction
stage.
It is noteworthy that the objective of this thesis is not to evaluate, neither to
question theoretical and scientific basis for each methodology, nor to determine which
sustainability assessment methodology is better with respect to the other, far less try to
solve the limitations of each analysis tool and biases that may be incurred under its
implementation. As any methodological evaluation has a subjective component, it is
important to be aware of it in order to make a better interpretation of results. So the
objective is to analyse indicators generated by each methodology implemented for this
specific case study and how complementary or redundant they can be, resulting in the
proposal of an integrated sustainability analysis methodology.
The aim of this doctoral thesis is not to create controversy in the mining sector. To
determine which process is more sustainable with respect to the other would be to make
a priori judgments, even though all sustainability analysis methodologies converge on the
same results. To make a choice on which mining process is most sustainable, other
factors not covered by the valuation methodologies implemented must be taken into
account: types of resources, availability, abundance, scarcity and depletion of affected
resources, location and access to land, ecological synergy, and resilience among other
determining factors. In this research work, the behaviour of sustainability is assessed
using three standardized analysis methodologies and an integrated valuation method
proposed. All this in order to be used as a basis for decision making to make the process
much more sustainable. It entails linking efforts between different stakeholders to make
the concept of sustainable development a reality; promoting economic growth limited to
an acceptable environmental burden whose ultimate objective is to provide social welfare,
not by having a range as limit (optimal score), but a continuous effort. Since sustainability
has no numerical boundaries and the aim is to make sure processes are increasingly
sustainable and subject to ecological, social, cultural, and political dynamism of the
surroundings where they are implemented.
At the end of this research work, it will be possible to answer questions such as,
What models and tools can be implemented to support decision making in the mining

Introduction 9
industry? Which stages of the supply chain should receive more attention from
professionals and researchers to make the mining process case study more sustainable?
How could the three dimensions of sustainability be addressed in an integrated way?
Research problem
All development projects, especially those that threaten environmental integrity, such as
exploitation of natural resources and mining processes, must be focused on being an
economic alternative that provides energy efficiency with an acceptable environmental
burden to satisfy current and future needs. Despite the importance that Colombian mining
sector has taken on, the debate about true economic, energy, environmental and social
benefits and costs of the activity has been intensified, mainly due to the ignorance and
lack of implementation of robust scientific methodological tools for an objective
sustainability assessment. As a consequence, different stakeholders and policymakers,
such as governmental authorities or other entities that exercise some type of control and
regulation, lack of solid bases and the aptitude to regulate, supervise and make decisions
regarding the mining activities developed throughout the national territory. Because of this
there may not be a law whose regulatory methodology is based on sustainable
development from the nature logic of that activity. It is necessary that each entity related
to mining activity exercises, in a conclusive way, the powers and functions established by
Constitutional and legal provisions, so that this control can be carried out in the light of
objectivity.
Doctoral contribution
The first contribution of this research work is to provide a holistic view of the sustainability
of two mining processes (open-pit and alluvial mining) through Life Cycle Assessment,
Exergy Analysis, and Emergy Accounting indicators; analysis methodologies widely used
in different economic sectors that encompass the environmental, social and economic
dimensions.
Although Life Cycle Assessment has been implemented in open-pit system (W. Chen et
al., 2018) from cradle to gate, it has not been used in alluvial system as described in
chapter 2 of this document, so it can be a good reference for future works where gold
mining sustainability by LCA (open-pit and alluvial mining) is to be valued.

10 Introduction
Exergy analysis has been discussed extensively with a wide variety of minerals from
earth's crust (Valero & Valero, 2010). However, it has not been implemented as a tool for
evaluating exergy cost of extractive process from cradle to gate in gold production, nor as
a methodology for sustainability assessment (sustainable indicator) in the production of
any mineral, but in other economic sectors (biofuels) (Ojeda, 2011). Therefore, the
document "Life Cycle Assessment of Exergy Indicators in Colombian Gold Mining Sector:
Case Study in Open-Pit and Alluvial Mining Process" presents a valuable contribution to
the topic, which also includes exergy indicators by LCA approach whose calculation basis
differs from that of thermodynamic approximation ( Szargut, J., Morris, DR, Steward,
1988, Szargut, 2005).
Emergy Accounting has been implemented in small-scale gold production in alluvial and
underground mining. However, in this study only emergy cost and process sustainability
are accounted based on the use of resources and does not consider ecological services
of airborne / waterborne dilution, emergy equivalent of natural loss due to discharge of
solid waste on land, nor emergy equivalent of human health and regional natural
resources due to emission, considerations of great importance in mining productivity. This
methodology has not been applied in open-pit mining process.
Initially, this doctoral work would end with the identification of complementarity or
redundancy of results obtained by the three methodologies as a tool to inform decision-
making in mining sector. However, it was decided to develop an approximation of an
integration model of the three methodologies for sustainability assessment, based on the
concept of sustainability as "the compatibility between energy, economics (maximum
performance) and environmental aspects" ((Redclift, 1987; Reza, Sadiq, & Hewage,
2014), all development projects especially those that threaten environmental integrity,
such as exploitation of natural resources and mining processes, should be focused on
being an economic use alternative that provides an energy yield with acceptable
environmental burden. These three analysis methodologies have been implemented
individually and complementarily but not in a comprehensive way.
The proposed integration method could be used as a helpful methodological tool for
sustainability assessment of mining practices in Colombia and other economic activities,
facilitating decision making to policy makers (government, environmental authorities,

Introduction 11
corporations, community, companies) in proposing improvements, changes and key
elements for the economic, energy and especially environmental optimization of the
process. The integration methodology is also suitable for sustainability reports according
to GRI (Global Reporting Initiative) guidelines, as well as for comparisons between
different companies and other economic sub-sectors.
Justification
Despite the great efforts that society has made to dematerialize, that is, to reduce the
amount of energy and materials required for an economic function, through reuse and
recycling of materials strategies (Ruiz-Mercado, Gonzalez, Smith, & Meyer, 2017), the
mining sector is growing since global projections estimate that primary metal production
will considerably increase in the future, due to aspects such as population growth
(Awuah-offei, 2016; T. Norgate & Haque, 2010). This economic sector in particular is
under increasing pressure to reduce the consumption of renewable, non-renewable and
energy resources (balance between the use of renewable and non-renewable) and the
environmental, social and economic impacts generated (T. Norgate & Haque, 2010).
In the Colombian case, the country has abundance of natural resources due to climate
diversity and has a wide range of mineral deposits, including coal, gold, platinum, nickel,
emerald, limestone, among others extracted at smaller scale, which have been exploited
since pre-Columbian times as a permanent resource (Ministry of Mines and energy,
2016). A country with a mining tradition that has played an important role in both
economic and social environment of the country; the mining sector represents an average
contribution of 2.2% of the GDP, going from $9.5 trillion in 2010 to $10.6 trillion in 2015,
with a foreign investment of USD $2,272 million per year approximately for the period
2010-2014 (Ministry of Mines and energy, 2016). The National Development Plan 2014-
2018, states that mining-energy sector will remain one of the engines of development of
the country through its contribution to economic growth, maximizing their potential in
natural resources, under high environmental and social standards (Ministry of Mines and
energy, 2016). This evidences how mining sector in Colombia is considered one of the
main economic sectors and its growth will continue; it is estimated that US $ 250 billion
will be invested in mining projects in Latin America by 2020 (SMGE, 2012).

12 Introduction
Although mineral extraction is a permanent source of resources for most economic
activities, it is also considered to be one of the activities with greatest economic, social
and environmental impacts at global and local scales, both reversibly and irreversibly
(Vintró, Sanmiquel, & Freijo, 2014). While the mining sector supplies vital raw materials
and energy to a large number of industries, its activities are still commonly considered to
be a threat to the environment, especially because of the effects they have on the air,
water and soil, such as greenhouse gas emissions, destruction of ecosystems, damage to
protected areas, pollution and affectation to availability of renewable (water resources)
(Bustamante, Danoucaras, McIre, Díaz-Martínez, & Restrepo-Baena, 2017) and non-
renewable resources (mineral extraction) (Vintró et al., 2014). These impacts are
expected to increase exponentially because the ore grade (metal content) has been
falling globally for some time as presented by the Hubber Peak model; the minerals have
an increasing speed of production until reaching their maximum peak, and then decline as
fast as it grew (Hubbert, 1956; Valero Delgado, 2013); this involves processing more rock
for an equivalent amount of metal for an equivalent amount of metal (Domínguez,
Czarnowska, Valero, Stanek, & Valero, 2014), leading to higher consumption of energy
resources, water, chemicals and other operating costs; thus, more waste/emissions are
generated, mainly in mining and processing stages (Awuah-offei, 2016; T. Norgate &
Haque, 2010), besides fluctuation in the price of minerals. That is why it is absolutely
urgent to make adequate assessments of mineral resources and mining operations to
enable better management of mineral capital on Earth to face these challenges
(Dominguez et al., 2014).
Not only extractive activity has generated impacts on the environment; in recent decades,
social (child employment, low-quality jobs with low levels of industrial, social and health
security; conflicts between mining companies, community, government and workers) and
economic controversies (minimal working capital, scarce financial resources for
investment, inadequate management of royalties from this activity) have been unleashed
around this productive activity, subject to different reasons inherent to socio-political and
cultural conditions of the country, like poorly carried out mining practices, shortcomings in
normativity on mining-environmental sector due to the non-uniformity of a regulatory
framework and the ignorance on objective methodologies for sustainability assessment. It
is not within the scope of this research work to address each possible cause that make
mining a controversial activity in Colombia, since these roles are not the responsibility of

Introduction 13
academic community, however, from the point of view of academia it is possible to
establish a quantifiable and measurable scientific basis for sustainability assessment in
the mining sector that allows different stakeholders (entities that exercise some type of
control and regulation in the sector, mining companies, community) to make decisions
with the aim of help mining wealth to become an opportunity for development and to
respond to future generations how resources from non-renewable assets were invested
without affecting renewables.
Since the first decade of the 21st century, mining and its sustainability have been a
renewed topic for discussion due to the public interest in the current environmental
degradation. Mining faces a challenge in relation to sustainable development; to ensure
its contribution to the welfare of present generations without affecting the quality of life of
future generations; definition of sustainable development (Commission, 1987), whose
objectives were identified as economic development, social development and
environmental protection, also known as the three pillars of sustainability (United Nations
General Assembly, 2005). Today, companies are expected to react positively to these
challenges by assuming responsibilities in the local and national development, by
adopting new strategies to meet these requirements and to address the compatibility
between productive activity and environmental and social protection (Vintró et al., 2014).
In order to face the challenges of this highly demanding productive activity in the country,
it must be managed through the use of methodological valuation tools that enable to
harmonize economic with environmental and social dimensions, since these three factors
cannot be assessed independently but must be analysed in a joint and interrelated way to
manage them in a sustainable manner. It has led to the implementation of different
sustainability assessment methodologies in most of metal production life cycles. However,
most of the sustainability assessments in metal production do not consider mining and
processing stages in detail (T. Norgate & Haque, 2010), neither consider these three
pillars in an integrated way, but individually.
The first attempts to quantify sustainability arose from the use of thermodynamic
principles in an ecological field to measure the sustainability of ecological systems
(Bakshi, 2000; M. Raugei, Rugani, Benetto, & Ingwersen, 2012). Emergy Analysis was
one of the first, followed by other conceptual tools like Exergy Analysis and Life Cycle
Assessment (Angelakoglou & Gaidajis, 2015). These methods, which have been widely

14 Introduction
discussed and employed in literature, attempt to assess the sustainability of different
production systems in terms of energy, exergy and/or life cycle analysis from an
accounting perspective but under different basis of analysis. This is because
"sustainability" has no clear and distinct meaning due to its multidimensional intrinsic
nature (Liu, Brown, & Casazza, 2017). Methods based on ecological, economic,
thermodynamic, and ecological-economic, public policy, and planning theory approaches
(Sala, Ciuffo, & Nijkamp, 2015).
All these methodologies converge to the same point: tools that provide decision-makers
with indicators of environmental, economic or social sustainability for the formulation and
implementation of public policies. These indicators can be taken as individual or
composite parameters; that is, synthetic aggregations of independent parameters
reflecting the values of interested parties and considerations of the experts (Arbault,
Rugani, Marvuglia, Benetto, & Tiruta-Barna, 2014). However, none of these approaches
take into consideration that physical limits of human exploitation of the planet may have
been reached (Rockstrom, J., Steffen, W., Noone, K., et al., 2009) due to the increasing
global population and technological improvements (Moldan, B., Janouˇ sková, S., Hák,
2012), in order to assess the impact of resource scarcity, especially exhaustible ones.
They also ignore intensive dimensions of sustainability, such as the effect of topological
structure of connections, distribution of resources among the entities of a system, and
system resiliency (Kharrazi et al., 2014). The foundation of each of these methodologies
is summarized below.
Life cycle assessment (LCA) is a methodology used to evaluate the environmental
impacts of a process through their entire life-cycle, including raw materials (extraction),
manufacture, transport, use, disposal and reuse (cradle to grave). Methodology is
standardized by ISO 14040 (ISO, 1998) in four stages: goal and scope definition,
inventory analysis, impact assessment and interpretation. In goal stage the motivation of
the research is defined together with scope, which is systems boundaries and functional
unit. In inventory analysis, raw data are gathered including resource inputs, products and
emissions, and their environmental impacts are quantified by characterization factors that
depend on each methodology choosing in impact assessment. Finally, results are
analyzed to make decisions with the aim of improving the process in environmental terms.
LCA has been implemented in mining (Burchart-Korol, Fugiel, Czaplicka-Kolarz, & Turek,

Introduction 15
2016; W. Chen et al., 2018; Terry Norgate & Haque, 2012), biorefinery (Palmeros Parada,
Osseweijer, & Posada Duque, 2017), construction (Martínez-Rocamora, Solís-Guzmán, &
Marrero, 2016; Röck, Hollberg, Habert, & Passer, 2018), agriculture (Goglio et al., 2015;
Recanati et al., 2018), among the most representative .
Exergy analysis, exergy is a thermodynamic property that allows to determine the
useful working potential of a certain amount of energy to reach equilibrium with the
surroundings. It provides the sustainability assessment of a system based on
sustainability rates, which makes it possible to predict the future evolution of these
processes, as well as different changes that may occur in their environment (Dincer, I. &
Rosen, 2007; Jan Szargut, Morris, & Steward, 1988). The particularities of exergy are, as
pointed out by Ayres in (Ayres, R.U.; Ayres, L.W.; Martinas, 1998); a natural way of
measuring resource inputs, waste outputs and losses of an economic system, taking into
account quality and quantity conditions, being applicable to material and energy flows.
Exergy analysis has been implemented in biofuels (Ojeda, 2011; Velásquez Arredondo,
2009), biological systems (Federico, Hincapié, Iván, & Arredondo, 2013), mining (Calvo,
Valero, & Valero, 2015; Valero, 2013), sustainability (Baral & Bakshi, 2010; Dincer, I. &
Rosen, 2007; J. Szargut, 2005).
Emergy Accounting is an energy-based environmental accounting method that expresses
all process inputs (energy, natural resources, and services) and outputs (products or
services) in solar equivalents. Emergy is defined as solar energy used directly or indirectly
to generate a product or service (Odum & Odum, 2003; Vassallo, Paoli, & Fabiano, 2009)
measured in solar equivalent joules (seJ) as an indicator of the environmental work that
would be needed to replace what is consumed (M. Raugei et al., 2012); it accounts for the
contribution of ecosystems to economic activity. Emergy analysis has been applied in
wastewater treatment (Cano Londoño, Suárez, Velásquez, & Ruiz-Mercado, 2017),
agriculture (G. Q. Chen, Jiang, Chen, Yang, & Lin, 2006; Jiang et al., 2007), ecosystems
(Zhong et al., 2018), mining (Ingwersen, 2009, 2011), among others.
Over the past four decades, other Environmental Accounting Tools have been developed
to conceptualize and quantify direct and indirect effects of human activity on the
environment, to enable decision makers to track and measure progress towards
sustainability outcomes and goals. These environmental accounting methods range from

16 Introduction
ecological footprint, carbon footprint, energy analysis, ecological pricing and input-output
analysis (Patterson et al., 2017), greenscope (Smith, Ruiz-Mercado, & Gonzalez, 2015).
Given this panorama, where it is indisputable that mining activity is necessary for the
development of human being in its daily life, added to growth projections in the use of
minerals and the discussion about true environmental, social and economic benefits and
costs; currently, there are no solid and robust scientific studies in Colombia that allow
objective decision making for the sustainability assessment of the mining process in a
holistic way, that is, from exploration, extraction, and mineral benefit stages to mineral
obtaining to be commercialized; a situation that leads to wrong decisions regarding
whether mining constitutes a potential or a threat to society, the environment and/or the
economy of the country. Thus, for many social actors, it represents a profitable business
that provides social welfare while for other social groups it represents the opposite. As a
consequence, in response to the environmental awareness that has been rising in recent
years, corrective and preventive measures that governmental agencies have been
implementing in sustainable management of extraction processes and use of non-
renewable resources are undervalued or seen as inefficient.
That is why it is necessary to implement among the many valuation methodologies
available, those that allow a sustainable assessment of the current management and
processing of mining extraction in Colombia to make it bearable and equitable in
economic, energy and environmental terms, and also to identify the gap in it, given that in
the current regulation governing this sector there is a wide imbalance between these
aspects. In other words, in many situations, mining is carried out because it has a great
economic benefit but it causes irreversible environmental damage or major social
problems that lead to collective chaos. Or, on the contrary, many extraction licenses are
denied, preventing economic growth because of an environmental impact that may be
acceptable; disagreements caused by ignorance and no implementation of
methodological tools that allow the sustainability assessment of different productive
sectors of society, harmonizing and/or balancing economic, energy and environmental
aspects.
However, these analysis methodologies are not sufficient by themselves to assess the
three dimensions of process sustainability in a holistic way. Each of them presents a

Introduction 17
sustainability assessment under a different calculation basis: use of resources,
environmental burden generated, and process efficiency; which also focus on
environmental, social and/or economic sustainability. Differences and similarities between
these valuable analysis tools make them compatible but not interchangeable in order to
address the behaviour of different production systems in a more extensive and complete
way. Therefore, in this doctoral thesis, each valuation methodology (Life Cycle
Assessment, Exergy Analysis and Emergy Accounting) is implemented individually,
complementary, and under an integrated methodology proposed for two of the most
productive gold production systems in Colombia; alluvial and open-pit mining. In addition,
these tools allow to identify shortcomings that make this activity appear to be a threat to
some sectors of society.
With the implementation of these methodologies, it will be possible to identify process
stages for each extraction system generating the greatest environmental impacts, the
greatest exergyal losses, and the lowest overall emergy efficiency in the entire production
chain. Likewise, it will be possible to identify the reasons why these processes are not so
sustainable and are subject to improvements; efficient use of resources, environmental
load generated, process efficiency, and use of residual currents. Finally, the
complementarity or redundancy of results obtained by the three methodologies will be
used as a tool to guide decision making in mining sector. All this in order to make mining
a lever for development, going beyond its commitment to the country and the locality that
hosts it.
Proposal
The purpose of this research is to propose the implementation of methodological tools:
Life Cycle Assessment, Exergy Analysis, and Emergy Accounting; used for the
sustainability assessment of a system or process for decision making, in a way that allows
to evaluate and to compare in a holistic way the sustainability of two gold mining
processes (open-pit and alluvial) in Colombia, through sustainability indicators, providing
the possibility of involving energy, economic, social and environmental factors in a joint
and interrelated way. It allows to determine gaps and/or strengths of the current mining
extraction system, which detract or reinforce the efficient use of renewable (water
resources), non-renewable (mineral extraction) and energy resources; as well as the

18 Introduction
added value offered to the waste generated in the process, which contributes to its
reduction, since otherwise, the environmental, economic and social impacts would
increase. All this with the aim of providing a useful analysis tool to policymakers for
planning of improvements, changes and key elements for the economic, energy and
especially environmental optimization of the process.
Although the objective of this study was to identify only the complementarity or
redundancy of results obtained by the three analysis methodologies used as tools to
inform decision-making in the mining sector, it was possible to propose an integrated
model of sustainability assessment applicable to mining activity in Colombia based on
these methodologies. So far, only the use of LCA and Emergy Accounting in mining
systems has been reported, but not the use of Exergy Analysis; as well as the use of the
three methodologies in an individual and complementary but not integrated way, nor the
use of different thermodynamic concepts has been made simultaneously with mining
products. The proposed integration methodology could be used as a guideline to regulate
this productive sector in a sustainable way, since there is no doubt that regulation is the
origin of many limitations of extractive activity.
Hypothesis
How could it be obtained a unified performance metric (Integrated Sustainability Index) to
assess Triple Bottom Line - TBL over life cycle of mining system. Life Cycle Assessment,
Exergy Analysis and Emergy Accounting are complementary tools that allow such
integration.
Objectives
General Objective
Sustainability assessment of alluvial and open-pit gold mining systems in Colombia,
based on Emergy Accounting, Exergy Analysis and Life Cycle Assessment sustainability
indicators.
Specific objectives
1. Sustainability assessment of alluvial and open-pit gold mining systems in Colombia
using sustainability indicators provided by Emergy Accounting method.
Introduction 19
2. Sustainability assessment of alluvial and open-pit gold mining systems in Colombia
using sustainability indicators provided by the Exergy Analysis method.
3. Sustainability assessment of alluvial and open-pit gold mining systems in Colombia
through environmental impact categories provided by Life Cycle Assessment, relevant to
the mining sector.
4. To analyse and compare sustainability indicators and/or environmental impact
categories for each methodology described for the two gold mining systems.
5. To identify process stages for each extractive system generating the greatest
environmental impacts, the greatest exegetical losses and the lowest overall emergy
efficiency in the entire production chain.
6 To identify the complementarity or redundancy of results obtained by the three
methodologies as a tool to inform decision making in mining sector.

1. Sustainability Assessment of Gold Mining by Life Cycle Assessment: Open-pit Mining VS Alluvial Mining
ABSTRACT
Colombia is a country with a mining tradition that has played an important role in both
economic and social environments of the country; ranks fifth in annual gold production in
Latin America, being gold one of the most valued minerals by society, following precious
metals. The challenge is to convert mineral wealth into a development opportunity and
respond to future generations about how resources from non-renewable assets were
invested without affecting renewable ones, by implementing strategies for efficient use of
renewable and non-renewable materials and energy resources. For this reason, the aim of
this study is to evaluate the environmental sustainability of two gold extractive systems
from cradle to gate; open-pit and alluvial (placer) mining technologies by the application of
Life Cycle Assessment, and to know what are the most critical stages of both mining
technologies, evaluated by impact categories and to conclude why an alternative is more
sustainable with respect to the other for environmental decision making.
Environmental impacts were classified and characterized by (mid-point) impact categories
and aggregated by end-point indicators assigned through ReCiPe Methodology. The
effectiveness of efficiency measures was evaluated by comparing different scenarios of
optimized electricity and fuel consumption in a sensitivity analysis. In open-pit mining
technology, tails and extraction process were the most critical stages, where human
toxicity and natural land transformation were the most representative impact categories to
tails; and particulate matter formation and climate change to the extraction system. In
alluvial mining technology it was the stripping stage; being natural transformation,
agricultural land occupation and water depletion the most relevant environmental impact

22 Sustainability Assessment of Alluvial and Open Pit Mining Systems in Colombia: Life Cycle Assessment, Exergy Analysis, and Emergy Accounting
categories. It is noteworthy that to open-pit mining approximately 70 substances present in
tails stage were taken into account, unlike of alluvial mining where only 17 substances
were considered for reasons of quality data. This are implications in the non-comparability
of both mining systems in this stage of the process.
Keywords: Mining, gold ore, LCA, environmental sustainability, alluvial mining, open-pit
mining, indicators
Highlights:
● ReCiPe LCA midpoint and endpoint indicators for 1kg gold from open-pit and
alluvial mining.
● Tailings and extraction process, critical stages in open-pit mining technology.
● Stripping process, critical stage in alluvial mining technology.
● Human toxicity, the most representative impact category for open-pit tailings
● Natural land transformation, the most representative impact category for alluvial
stripping
1.1 Introduction
It is indisputable how mining can be contemplated as a key inherent human and social
development activity, since the use of all materials to achieve its evolution comes from
mining; computers, televisions, electricity, and automobiles are some of the many
examples that can be shown (Shen, Muduli, & Barve, 2015). This is, how the ever growing
demand for consumer products results in the considerable increase of primary metals
production in the future, despite the great efforts of society through recycling and
dematerialization itself (broadly defined as the reduction in the amount of energy and
materials required for an economic function) (T. Norgate & Haque, 2010).
Colombia has abundance of natural resources due to climate diversity and has a wide
range of mineral deposits, including coal, gold, platinum, nickel, emerald, limestone,
among others extracted at smaller scale, which has been exploited since pre-Columbian
times as a permanent resource (PCM, 2016). Colombia is a country with a mining tradition
that has played an important role in both economic and social environment of the country;

Chapter 1 23
the mining sector represents an average contribution of 2.2% of the GDP, going from $9.5
trillion in 2010 to $10.6 trillion in 2015, with a foreign investment of USD $2,272 million per
year approximately for the period 2010-2014 (Ministry of Mines and energy, 2016). The
National Development Plan 2014-2018, states that mining-energy sector will remain one of
the engines of development of the country through its contribution to economic growth,
maximizing their potential in natural resources, under high environmental and social
standards (Ministry of Mines and energy, 2016) this evidences how the mining sector in
Colombia is considered one of the main economic engines, since it is not the only
generation of employment but also investments in infrastructure, public services and social
and environmental management (SMGE, 2012).
From all of minerals, gold has been one of the most valued by society following precious
metals (Terry Norgate & Haque, 2012) for its multiple uses; backup currency, jewelry, and
dentistry among the most representative. It also has a number of attributes that make it
special: it is one of the few common metals colored bright yellow giving a perception of
beauty, one of the few non-reactive metals, malleable and easy to use, good conductor of
heat and electricity and relatively rare (Terry Norgate & Haque, 2012). This mineral is
mainly found in two types of deposit; vein deposits are characterized because gold is
embedded in cracks and veins in rocks, and alluvial deposits (placer deposits) formed by
the movement of water that has eroded gold out of mud and deposited it into sand, cracks
and stream beds (Terry Norgate & Haque, 2012). In terms of gold production in Latin
America, Colombia ranks fifth in annual production, with about 57 tons per year (resources
of approximately 4,550 tons of gold (Ministry of Mines and energy, 2016). However, it is
important to highlight the unstable behaviour of gold production in the country over the
past 30 years, since the production in 2010 increased significantly and in 2012 came to 66
tons, but production in 2014 and 2015 fell to 57 and 59 tons respectively (Ministry of Mines
and energy, 2016).
As long as the sector provides vital raw materials and energy for many industries, its
activities are still commonly seen as a threat to nature, with environmental effects on air,
water and soil (Vintró et al., 2014) as well as greenhouse gas emissions, destruction of
ecosystems, damage to protected areas, pollution and impact on the availability of
renewable resources (water) and non-renewable (mineral extraction). It is anticipated that
these impacts will increase exponentially because mineral grades (fraction of metal

24 Sustainability Assessment of Alluvial and Open Pit Mining Systems in Colombia: Life Cycle Assessment, Exergy Analysis, and Emergy Accounting
content) have been falling globally for some time, and this has a significant effect on the
amount of energy required for extraction and processing of these lesser degree minerals,
due to the additional amount of material to be treated in these stages. Then, it can be
expected that environmental impacts, particularly energy consumption and greenhouse
gas emissions and other waste generated from mining and mineral processing for many
metals will become much more significant in the future. It is therefore very important that
contributions of the various production stages part of the threads are quantified by
identifying the stages with the greatest intake, so efforts are focused on reducing
environmental burdens (Awuah-offei, 2016; T. Norgate & Haque, 2010) (T. Norgate &
Haque, 2010).
For this reason, mining is a challenge facing sustainable development (interdependence of
social, environmental and economic aspects (Cano Londoño, Suárez, Velásquez, & Ruiz-
Mercado, 2017; Chaabane, Ramudhin, & Paquet, 2012)), aiming to convert mineral wealth
in a development opportunity, and respond to future generations about how resources
from non-renewable assets were invested without affecting renewable ones by
implementing strategies for the efficient use of renewable and non-renewable resources
and energy (Azapagic, 2004; T. Norgate & Haque, 2010) (T. Norgate & Haque, 2010),
and the use of byproducts and proper management of waste generated in the process in
order to reduce environmental burdens throughout the entire life cycle of the supply chain
by analyzing lifecycle (Adibi et al., 2015). This has led to the application of methodologies
for sustainability analysis in most metals production life cycle (Liu & Müller, 2012; Memary,
Giurco, Mudd, & Mason, 2012; Mudd, 2010; S. Northey, Haque, & Mudd, 2013). However,
most sustainability analysis in the production of metals do not consider extraction stages
and mineral processing in detail (T. Norgate & Haque, 2010). At the same time, most
mining literature has few quantitative studies assessing the social dimension (Seuring,
2013).
Among many approaches to quantitatively address sustainability issues, Life Cycle
Assessment (LCA) has been accepted as a well-established methodology for assessing
and comparing the environmental impact of products and processes with improvement
initiatives (Azapagic, A., Clift, R., 1999). Life Cycle Assessment is an environmental
approach that considers the quantification of natural resource consumption, pollutant
emissions from a product, not only at production stage but also at its early stages

Chapter 1 25
(manufacturing and raw materials) and later stages of use and its disposal as waste
(Blengini, G.A., Garbarino, E., Solar, S., Shields, D.J., Vinai, R., Agioutantis, Z., 2012).
The application scope of LCA as a methodological tool for assessing sustainability in
mining industry has increased by formulating methodologies considering specific
conditions of mines and the development of tools adapted to LCA methodology as
described by (Burchart-Korol, Fugiel, Czaplicka-Kolarz, & Turek, 2016). Initially, the
application of life cycle assessment in mining industry (Awuah-offei & Adekpedjou, 2011;
Blengini, G.A., Garbarino, E., Solar, S., Shields, D.J., Vinai, R., Agioutantis, Z., 2012) and
research challenges in this regard were studied by Lesage et al., 2008; where he
emphasizes how to measure the impacts generated by mineral production, identifying
hotspots in the entire production cycle for the formulation of public policies. Thus, the
application of life cycle assessment has spread to different minerals such as copper and
aluminum (Spitzley & Tolle, 2004) gold (Awuah-offei, 2009), coal (Ditsele, O., Awuah-Offei,
2012), bauxite (Bovea et al., 2007; Durucan, Korre, & Munoz-Melendez, 2006), copper,
nickel and zinc mining and processing (Suppen et al, . 2006; S. A. Northey, Mudd,
Saarivuori, Wessman-J & Haque, 2016; Douni, I., Taxiarchou, M., Paspaliaris, I., 2003;
Suppen, Carranza, Huerta, & Hernández, 2006), iron ore extraction and processing. et al.,
2017). LCA studies on gold production were very few (Norgate & Haque, 2012). LCA
studies on gold production were very few (Terry Norgate & Haque, 2012). The following
impact categories were evaluated: loss of ecosystem quality, abiotic resources depletion
and climate change (Ferreira & Leite, 2015) in both open-pit and underground mining
(Mangena & Brent, 2006). Similarly there are challenges and problems in applying life
cycle assessment to mining industry, and they are associated with differently defined
functional units, scope, definition of environmental impact categories mainly (Awuah-offei
& Adekpedjou, 2011), as well as data availability, because it could be highly confidential
for mining companies (Durucan et al., 2006).
Thus, mining brings damages to air, soil, and water. In 2017 Fugiel et al., 2017 evaluated
damage categories affected by particle emissions (PM2.5, PM10) and greenhouse gases
(CO2, CO, NOx, SOx, CH4, NMVOCs and NH) in different extractive activities; solids (coal
and ores), liquids (petroleum) and gases (natural gas), concluding that higher levels of the
analyzed impact categories were greenhouse gas emissions, terrestrial acidification,
photochemical smog and formation of particulate matter, significantly affecting human
health. Furthermore, water and edaphic resources generally are altered negatively by

26 Sustainability Assessment of Alluvial and Open Pit Mining Systems in Colombia: Life Cycle Assessment, Exergy Analysis, and Emergy Accounting
tailing. It consists of residues (product) with small amounts of minerals or valuable metals,
chemicals, organic and process water products (Lottermoser, 2010; TI, 2014) which
management is a crucial issue in the mining operation because of the irreversible impacts
it generates. Others dimensions are: economic (capital operating expenditure, reagent
loss, energy cost, cost closure) and social (health issues, safety issues for public,
stakeholder perception, cultural impact) (Adiansyah, Rosano, Vink, & Keir, 2015). Chen, et
al., assess the environmental impacts of gold production in China by using life cycle
assessment, and conclude how the Gold production has significant environmental impacts
on ecosystem and human health (Chen et al., 2018).
For all the above, in the strict sense, mining cannot be a sustainable activity since its
operations have a finite useful life and the dependence on non-renewable resources
cannot continue indefinitely (Sterman, 2012). However, based on the Council on Mining
and Metals (ICMM, 2012), mining can contribute to sustainable development in the sense
that, if well managed, it can provide lasting opportunities for growth and progress
(Pimentel, Gonzalez, & Barbosa, 2016). This author presents, among other challenges,
addressing both environmental and relevant social impacts throughout the entire project
life cycle, from exploration to mining and refining operations. In recent years, Social Life
Cycle Assessment (SLCA) has been developed (Kloepffer, 2008), but its implementation
still demands considerable research (Benoit et al., 2010) because there still are significant
gaps and equally important challenges in the application to mining industry (Santos
Pimentel et al., 2016). Some of the social indicators underlie impact categories associated
with human rights, labor practices, and working conditions, the corporate responsibility of
the product (Jorgensen et al., 2008).
The aim of this study is to evaluate the application of life cycle assessment to two gold
extractive systems; open-pit mining and alluvial (or placer) mining in the department of
Antioquia (Colombia). It is worth noting that as of today life cycle assessment in alluvial
mining has not been developed as a tool for quantification and interpretation of
environmental impacts in the extraction and processing of gold; including byproducts and
waste generated in the process for assessing the sustainability of renewable and non-
renewable resources and energy consumption in order to approach improvements,
changes and key elements for economic, energy and especially environmental
optimization of the process through climate change, particulate matter formation,

Chapter 1 27
photochemical oxidant formation, human toxicity, terrestrial ecotoxicity, fossil depletion,
land occupation (agricultural or urban), freshwater ecotoxicity, marine ecotoxicity and
natural land transformation impact categories. On the other hand is raw materials,
consumption of energy resources and water. An analysis of life cycle assessment from
cradle to gate is presented, with 1kg of gold as a functional unit using the Recipe
methodology for estimating impact categories (Midpoints and Endpoints), and Umberto
software for model development. (1) The first step is to define the limits of the systems,
scope of study and description of open-pit and alluvial (or placer) process, as well as the
inventory of life cycle assessment by primary information, and material and energy
balances for quantification of renewable (water) and non-renewable (inert material
removed) resources and energy involved, and waste and/or recycled inputs during the
process. (2) To Follow the classification and characterization of more susceptible
environmental impact categories for making environmental decisions that lead to impact
reduction, minimizing critical consumption (energy, water, and material removed) in those
limiting stages and evaluating the effectiveness of efficiency measures and the impacts of
chemical leaking in sensitivity analysis (3) the two extractive alternatives are compared
getting to conclude why an alternative is more sustainable with respect to the other. It is
noteworthy that in this study, the projections of individual operating companies are not
examined, but it is focused into assessing the sustainability of the extractive process under
two different methodologies; open pit and alluvial mining technologies.
1.2 Description of gold mining system technology in Colombia: alluvial mining and open-pit mining
One of the biggest challenges of mining, not only in Colombia but worldwide, lies in how
the extraction process is done for obtaining this mineral depending on the type of deposit;
alluvial (or placer), Philonian or spread. Which according to their geological environment
lead to different extraction systems; these constitute a very special chapter of mining and
give a response to local needs in accordance with the economic capacities and the
amount of production, looking for a return on their limited to environmental effects brought
by the production process (Orche, 1998). In this paper, open-pit mining and alluvial mining
(or placer mining) are discussed as case studies for assessing the sustainability of gold
mining under these methodologies, being open-pit mining the most favored method in
recent years. Most of the gold production in Australia and the United States comes from

28 Sustainability Assessment of Alluvial and Open Pit Mining Systems in Colombia: Life Cycle Assessment, Exergy Analysis, and Emergy Accounting
opencast mines (Norgate, 2012) and alluvial mining (or placer mining), a less conventional
extractive method, reason why no life cycle assessment has been dated for the
determination of impacts. Generally, a rational extractive system is limited to a stage of
prospecting and exploration, mining, and benefit for obtaining the mineral of interest; for
both systems the operational process was taken from cut and stripping stage, followed by
extraction stage, to the processing and transformation for obtaining a gold ingot, which
data lies in annual primary information provided by each company with the respective
balances of materials and energy.
1.2.1 Description of open-pit mining process
The topographical features presented in the area, and depth and soil type, which in some
cases contain mineralization (mineralized saprolite), has led to select open-pit extraction
method as the best alternative for the 13 year life of the project; 2 years pre-mining
(construction and assembly, 11 years in operation). For practical and representative
purposes of this study, 11 years of average productivity were chosen. The operation stage
of mining cycle consists of the steps shown in Figure 1-1. Is to emphasize that in this
process, technology is designed to optimize gold like mineral mainly, but silver is produced
in highest amounts as by-product which has an aggregate value into the process.
Preparation of Mine phase (clearing and stripping)
For the mining project development for 11 years average in operation, 57,72 hectares of
vegetation were identified to intervene, representing 1,33, E+03 tons, and organic soil to
remove in proportions equal to 1,14, E+03 tons to be stored for restoration work in
subsequent years by advance area.
Extraction
Regarding the operation method, it is currently working on double digging simple banks
10mt high, reaching end walls of 20mt height. The equipment was selected for a standard
open-pit mining operation with conventional drilling, blasting (1,41, E+04 ton/year) loading,
and hauling, including sterile excavation with hydraulic shovels and ore extraction, using
the same hydraulic shovels and front loaders. The nominal value of material removed per
year is 7,30, E+07 tons.
Physical and chemical benefit

Chapter 1 29
Primary crushing and primary and secondary milling. Ore from the start and load stage is
subjected to a primary crushing process in which the rock P80 of 150 mm is reduced and
transported to the crushed ore stack. 77,7% of the particles from primary crushing process
go to a primary and secondary wet milling in order to reduce their size (maximum diameter
of 150 mm to a minimum of 50 mm). This latter milling circuit has a semi-autogenous
grinding (SAG), a ball mill and a 22 cyclones battery, to ensure the desired classification
by size and feed subsequent circuits of gravimetric separation and flotation as it were in
later sections. It is noteworthy that spray water consumption for controlling emissions of
total particulate matter (PST), both in primary crushing as primary and secondary milling,
was not accounted since its low power consumption is completely evaporated with respect
to the overall.
Flotation. Ore from milling step goes to flotation process, which aims to concentrate sulfide
minerals containing gold, to separate silicates, feldspar and other minerals not containing
it, by adding foaming (437 ton/year) and organic collectors (529 ton/year) that promote the
selectivity of the ones containing gold (float) and suppress unwanted minerals. The
flotation concentrate is classified by hydrocyclones, out of which fine material (overflow)
goes to a pre leaching tank feeding the leach circuit, and coarse material (low flow) feeds
milling and gravity concentration circuits. Flotation circuit queues are transported to the
tailing dam by pumping with 65,7% moisture. This flotation process is designed for a gold
recovery of 96,3% and a silver recovery of 79,5%.
Gravimetric separation. A proportion of gold in the ore will be present as gold recoverable
by gravity (GRG), so a circuit of gravimetric concentration is included in the design of the
object system processing plant. Gravimetric concentration circuit is fed by the coarser
fraction of flotation concentrate that goes through two vertical mills which discharge the
equipment of gravimetric concentration as shown in Figure 1-1. The gravimetric
concentrate is sent to the reactor and intensive leaching circuit queues are recirculated in
the same process. Sodium hydroxide (10,8 ton /year NaOH) is used in intensive leaching
operation for increasing pH; likewise, cyanide (89,8 ton/year NaCN) is used in intensive
leaching to recover the mineral that cannot be treated easily by simple physical processes
such as crushing and gravity separation, including chemical processes such as flotation.
34,7% of gold and 10,0% of silver are recovered in this step.

30 Sustainability Assessment of Alluvial and Open Pit Mining Systems in Colombia: Life Cycle Assessment, Exergy Analysis, and Emergy Accounting
Leach tanks. The fine fraction of gold concentrate passes to a pre leaching tank feeding
the leaching circuit, which in turn feeds the leaching process, consisting of a pre-aeration
tank (22,7 ton/year) and six leaching tanks in which, by mechanical agitation and pH
conditioning and the addition of sodium cyanide (1,87, E+03 ton/year NaCN), a rich gold
and silver pulp is obtained and passed to carbon adsorption process (CIP). Leaching
process queues and adsorption queues go to detoxification process. In leaching step
together with carbon adsorption, elution and electrowinning process, gold recovery is 97,0
% and the silver recovery is 65,3%
Carbon adsorption (CIP). The pulp from leaching feeds tanks in a series circuit of carbon
in pulp (CIP) adsorption, wherein activated carbon is added (has the property of adsorbing
the gold content in cyanide solutions) to make way for adsorption, once activated carbon
has reached the required gold and silver load they will go to CIP elution circuit (2,59, E+03
ton/year); process tails (with cyanide) are sent to detoxification process prior to disposal in
tailings dam.
Finally, gold and silver are released from carbon at elution column (injection of sodium
hydroxide (NaOH) and sodium cyanide (NaCN)), this solution continues to an electro-
winning process where a selective precipitation is made by electrolysis. Once the
electrowinning of gold and silver is obtained, it is sent to casting furnace. Sterile carbon
resulting from the process (carbon uncharged of gold) is sent to carbon reversing furnace
to reactivate it and reuse it in CIP process; the process of removing as much of organic
and inorganic material which adheres to carbon during adsorption and is not removed
during elution.
Flotation tails correspond to 96,5% of the total industrial wastewater generated in
beneficiation process, it is composed of silicates and feldspars that require no special
chemical treatment prior to disposal in tailings dam. This activity includes the operation of
cyclones to classify the fine and coarse material before disposing them in the tailings pool.
Leaching queues and carbon adsorption (CIP) correspond to the remaining 3,5%, which
prior to disposal in the tailings, made underwater to reduce the presence of oxygen in said
stream and avoid generation of acid drainage rock, are treated by detoxification system,
wherein the solution of the circuit is oxidized by applying hydrogen peroxide (H2O2).

Chapter 1 31
Casting and moulding
The gold and silver recovery is carried out by heat through pyrometallurgical process.
Assuming no losses in the process of smelting and casting, 19,04 ton gold/year and 21,55
ton/ silver year are melted, which are approximately 952 and 1077 of gold and silver ingots
respectively, with a millesimal fineness 900, a diesel and electricity consumption of
1,35,E+09 kJ/year and 7,99,E+09 kJ/year respectively.

32 Sustainability Assessment of Alluvial and Open Pit Mining Systems in Colombia: Life Cycle Assessment, Exergy Analysis, and Emergy Accounting
Figure 1-1: Flow diagram of open-pit mining process from stripping to casting and moulding.
Note: Exploration and stripping is not graphed because is a batch process, but are into account in the calculated
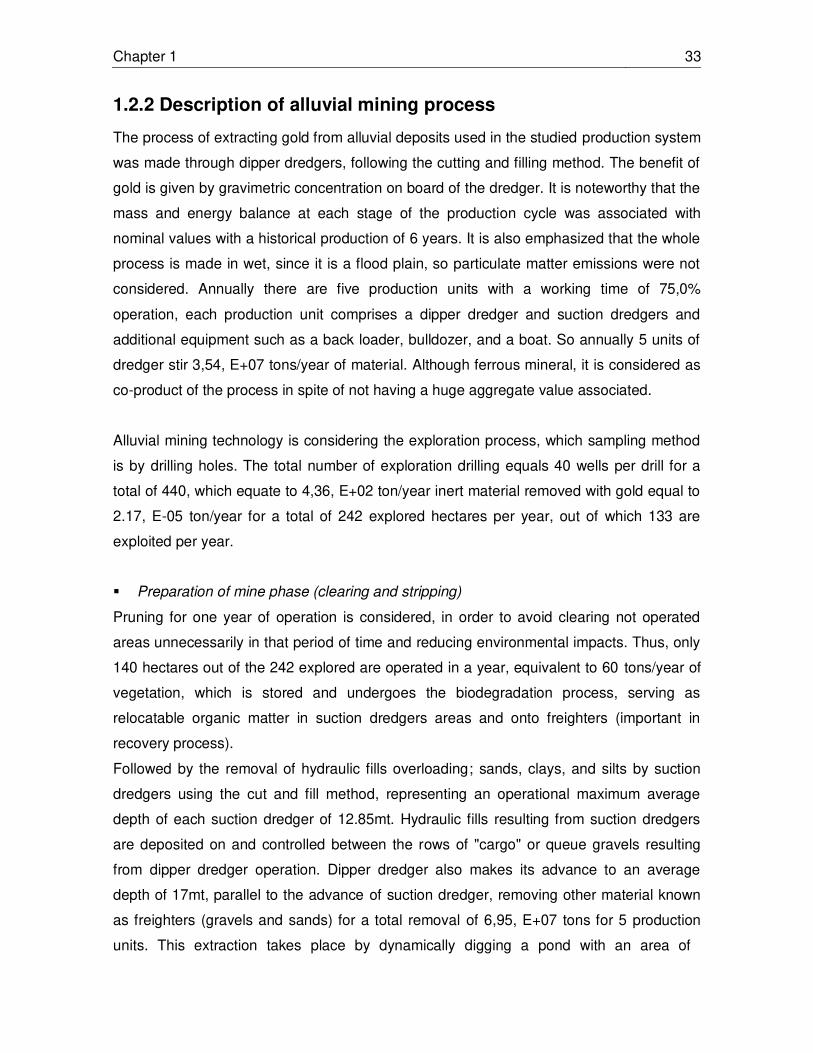
Chapter 1 33
1.2.2 Description of alluvial mining process
The process of extracting gold from alluvial deposits used in the studied production system
was made through dipper dredgers, following the cutting and filling method. The benefit of
gold is given by gravimetric concentration on board of the dredger. It is noteworthy that the
mass and energy balance at each stage of the production cycle was associated with
nominal values with a historical production of 6 years. It is also emphasized that the whole
process is made in wet, since it is a flood plain, so particulate matter emissions were not
considered. Annually there are five production units with a working time of 75,0%
operation, each production unit comprises a dipper dredger and suction dredgers and
additional equipment such as a back loader, bulldozer, and a boat. So annually 5 units of
dredger stir 3,54, E+07 tons/year of material. Although ferrous mineral, it is considered as
co-product of the process in spite of not having a huge aggregate value associated.
Alluvial mining technology is considering the exploration process, which sampling method
is by drilling holes. The total number of exploration drilling equals 40 wells per drill for a
total of 440, which equate to 4,36, E+02 ton/year inert material removed with gold equal to
2.17, E-05 ton/year for a total of 242 explored hectares per year, out of which 133 are
exploited per year.
Preparation of mine phase (clearing and stripping)
Pruning for one year of operation is considered, in order to avoid clearing not operated
areas unnecessarily in that period of time and reducing environmental impacts. Thus, only
140 hectares out of the 242 explored are operated in a year, equivalent to 60 tons/year of
vegetation, which is stored and undergoes the biodegradation process, serving as
relocatable organic matter in suction dredgers areas and onto freighters (important in
recovery process).
Followed by the removal of hydraulic fills overloading; sands, clays, and silts by suction
dredgers using the cut and fill method, representing an operational maximum average
depth of each suction dredger of 12.85mt. Hydraulic fills resulting from suction dredgers
are deposited on and controlled between the rows of "cargo" or queue gravels resulting
from dipper dredger operation. Dipper dredger also makes its advance to an average
depth of 17mt, parallel to the advance of suction dredger, removing other material known
as freighters (gravels and sands) for a total removal of 6,95, E+07 tons for 5 production
units. This extraction takes place by dynamically digging a pond with an area of

34 Sustainability Assessment of Alluvial and Open Pit Mining Systems in Colombia: Life Cycle Assessment, Exergy Analysis, and Emergy Accounting
approximately 1.5 hectares, which depth reaches only up to thirty (30,0) meters. The
artificial pond filled with water once for an annual consumption equal to 1,00, E+07 tons
which correspond to approximately 25% of the land dredged in a year.
Extraction and processing (Dipper dredger)
Once the pond is set, the operation advances to a rate of approximately 1,5 ha/month;
much of the gold beneficiation process is performed within the dipper dredger, which
returns rejected material from the rear and discharges into the same excavation to fill it, so
that the pond will actually move along with the exploitation. This is an operating process
with backfilling or dynamic land movement, similar to those developed in other opencast
mining systems. Benefit is made aboard dredger, using high specific gravity of the mineral
of interest compared with gangue material accompanying it through a gravimetric
concentration process, which is, without using mercury.
Physical and chemical benefit
It is noteworthy that all the material concentrated on dredges is processed gravimetrically,
without the use of mercury in ground processing plant, which has a maximum nominal
processing capacity of 8tph. Concentrate recovery plant is divided into two processes: a
physical process followed by a chemical process which recovers 99,5% of gold
concentrate. The gravimetric process (physical) will get not only concentrates rich in gold
but gold from exploration stage. Processing that gravimetric gold, 96,0 % of gold is
recovered passing directly to a drying step and separation of ferrous minerals (1,55 tons)
as byproducts without the aggregate value of the overall process as shown in Figure 1-2.
Annual tailings generated in filtration and separation processes are treated in a treatment
plant for subsequent recirculation within the same beneficiation plant.
The remaining gold not recovered in the first stage (very fine or laminar gold less than 74
microns) from beneficiation plant tailings, a product of gravimetric concentration stage, is
recovered via flotation using foam as the first option. This method involves the separation
of minerals exploiting surface properties of gold and hydrophilizing the surface by
adsorption of some substances with high recovery rates, which range between 92,0 % and
99,0 %. Mud product of filtration stage treatment and separation, which previously passed
through the WWTP and floating sludge, is deposited into tailings pond where it is
subjected to a dehydration process recovering 4,42, E+05 ton/ year of water for further
treatment and recycled to process.

Chapter 1 35
Casting and moulding
Gold obtained from concentrates is melted every 10 days approximately in a tilting diesel
melting furnace with a graphite crucible, capacity of 70 kg of metal and an average
temperature of 1200 °C. Casting process is performed for 40 minutes with 20 kg of gold on
average, using suitable flux loads. Tilting furnace, with a crank and gear, facilitates the
emptying of casting steel molds or ingot molds. For more efficient combustion, diesel fuel
is injected with pressurized air, with a consumption of 5 gal/h and 680 fuel m3/h of
air. Assuming no losses in smelting and casting processes, 3,103 ton/year are melted,
which is approximately 155 ingots with a 900 millesimal fineness.

36 Sustainability Assessment of Alluvial and Open Pit Mining Systems in Colombia: Life Cycle Assessment, Exergy Analysis, and Emergy Accounting
Figure 1-2: Flow diagram of alluvial mining process from stripping to casting and moulding.
Note: Exploration and stripping is not graphed because is a batch process, but are into account in the calculated
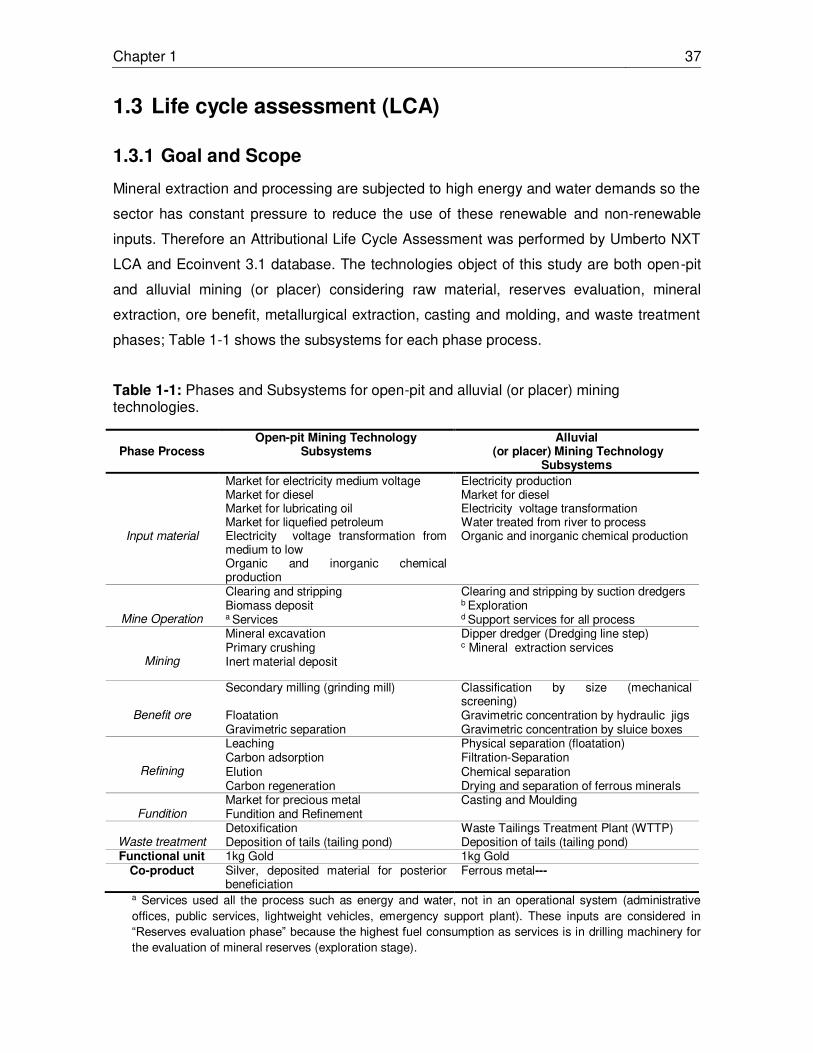
Chapter 1 37
1.3 Life cycle assessment (LCA)
1.3.1 Goal and Scope
Mineral extraction and processing are subjected to high energy and water demands so the
sector has constant pressure to reduce the use of these renewable and non-renewable
inputs. Therefore an Attributional Life Cycle Assessment was performed by Umberto NXT
LCA and Ecoinvent 3.1 database. The technologies object of this study are both open-pit
and alluvial mining (or placer) considering raw material, reserves evaluation, mineral
extraction, ore benefit, metallurgical extraction, casting and molding, and waste treatment
phases; Table 1-1 shows the subsystems for each phase process.
Table 1-1: Phases and Subsystems for open-pit and alluvial (or placer) mining technologies.
Phase Process
Open-pit Mining Technology Subsystems
Alluvial (or placer) Mining Technology
Subsystems
Input material
Market for electricity medium voltage Electricity production Market for diesel Market for diesel Market for lubricating oil Electricity voltage transformation Market for liquefied petroleum Water treated from river to process Electricity voltage transformation from medium to low
Organic and inorganic chemical production
Organic and inorganic chemical production
Mine Operation
Clearing and stripping Clearing and stripping by suction dredgers Biomass deposit b Exploration a Services d Support services for all process
Mining
Mineral excavation Dipper dredger (Dredging line step) Primary crushing c Mineral extraction services Inert material deposit
Benefit ore
Secondary milling (grinding mill) Classification by size (mechanical screening)
Floatation Gravimetric concentration by hydraulic jigs Gravimetric separation Gravimetric concentration by sluice boxes
Refining
Leaching Physical separation (floatation) Carbon adsorption Filtration-Separation Elution Chemical separation Carbon regeneration Drying and separation of ferrous minerals
Fundition
Market for precious metal Casting and Moulding Fundition and Refinement
Waste treatment
Detoxification Waste Tailings Treatment Plant (WTTP) Deposition of tails (tailing pond) Deposition of tails (tailing pond)
Functional unit 1kg Gold 1kg Gold Co-product Silver, deposited material for posterior
beneficiation Ferrous metal---
a Services used all the process such as energy and water, not in an operational system (administrative offices, public services, lightweight vehicles, emergency support plant). These inputs are considered in “Reserves evaluation phase” because the highest fuel consumption as services is in drilling machinery for the evaluation of mineral reserves (exploration stage).

38 Sustainability Assessment of Alluvial and Open Pit Mining Systems in Colombia: Life Cycle Assessment, Exergy Analysis, and Emergy Accounting
b Exploration activities are only considered within alluvial mining technology c Power services in bucket dredger, pump work, bow work, stern draughts work, conveyor belt work and other auxiliary pumps d Support services for all processes included waste water domestic treatment and fuel consumption by
helicopter
1. The selected scope was cradle to gate (from raw material until obtaining the
mineral of interest) as shown in Table 1-1, considering mass and energy inputs/outputs;
where the main product is gold ore and silver ore is an inevitable co-product from open-pit
technology. Additionally, in alluvial mining technology, ferrous mineral is produced as co-
product. To guarantee the scope from cradle, the life time to electricity (included market for
electricity), diesel (included market for diesel) a wear machinery.
2. The selected functional unit (FU) was one kg of gold.
3. Life Cycle Inventory (LCI) was associated with first-hand data on an annual time
scale by the two mining technologies combined with material and energy balances, no
data was assumed. For alluvial mining, the inventory was built from nominal values for a
historical production of 6 years, while for open-pit mining it was built from mass and energy
balance assuming the average productivity over 11 years at extraction stage. Similarly, the
consumption of non-renewable (removed material mining progress) and renewable
resources (water) and energy is emphasized for each stage listed above
4. Environmental impacts were classified and characterized by (mid-point) impact
categories and aggregated by end-point indicators assigned through ReCiPe
Methodology.
5. The effectiveness of efficiency measures was evaluated by comparing different
scenarios of optimized electricity and fuel consumption in a sensitivity analysis.
6. Finally, results were compared between both extractive systems in order to
evaluate the performance of both processes in environmental terms
1.3.2 Allocation
As allocation of environmental impacts could not be avoided (International Organisation for
Standardisation, 2006), inputs and outputs of the mining processes should be partitioned
between its different products or functions in a way that reflects the underlying physical or
economical relationships between them (Ardente & Cellura, 2012). Several studies have
developed allocation under different methodologies (Heijungs & Guinée, 2007; Mackenzie,
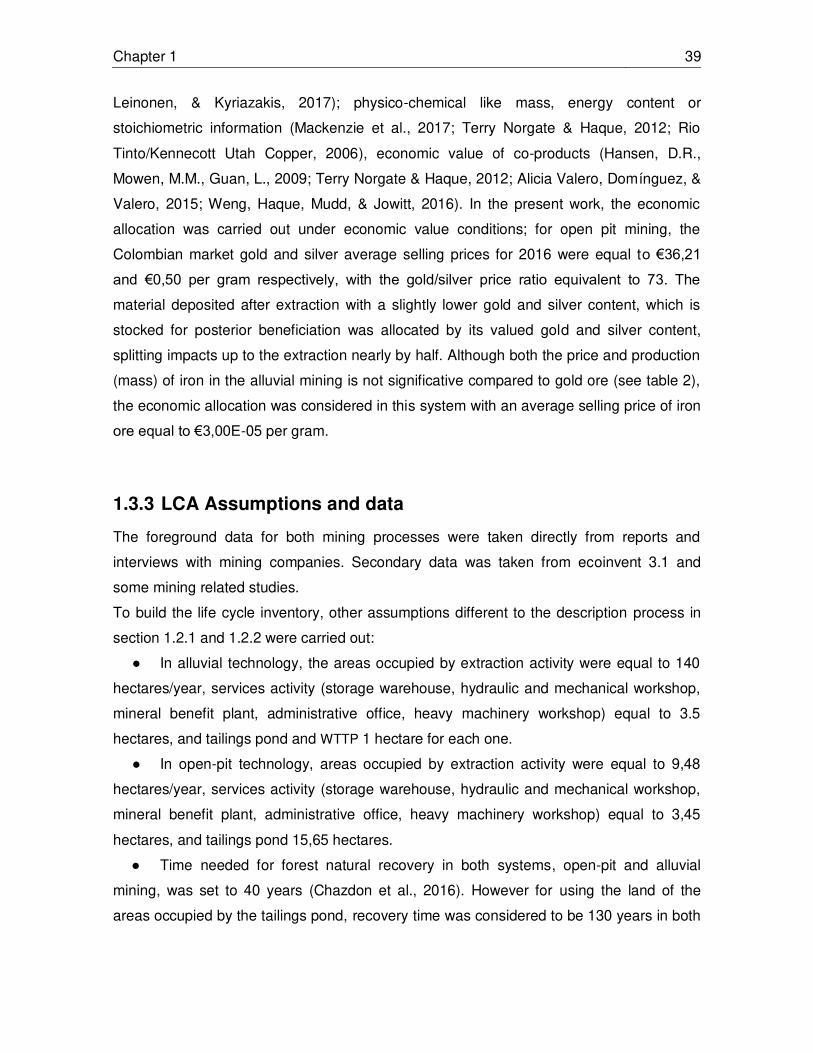
Chapter 1 39
Leinonen, & Kyriazakis, 2017); physico-chemical like mass, energy content or
stoichiometric information (Mackenzie et al., 2017; Terry Norgate & Haque, 2012; Rio
Tinto/Kennecott Utah Copper, 2006), economic value of co-products (Hansen, D.R.,
Mowen, M.M., Guan, L., 2009; Terry Norgate & Haque, 2012; Alicia Valero, Domínguez, &
Valero, 2015; Weng, Haque, Mudd, & Jowitt, 2016). In the present work, the economic
allocation was carried out under economic value conditions; for open pit mining, the
Colombian market gold and silver average selling prices for 2016 were equal to €36,21
and €0,50 per gram respectively, with the gold/silver price ratio equivalent to 73. The
material deposited after extraction with a slightly lower gold and silver content, which is
stocked for posterior beneficiation was allocated by its valued gold and silver content,
splitting impacts up to the extraction nearly by half. Although both the price and production
(mass) of iron in the alluvial mining is not significative compared to gold ore (see table 2),
the economic allocation was considered in this system with an average selling price of iron
ore equal to €3,00E-05 per gram.
1.3.3 LCA Assumptions and data
The foreground data for both mining processes were taken directly from reports and
interviews with mining companies. Secondary data was taken from ecoinvent 3.1 and
some mining related studies.
To build the life cycle inventory, other assumptions different to the description process in
section 1.2.1 and 1.2.2 were carried out:
● In alluvial technology, the areas occupied by extraction activity were equal to 140
hectares/year, services activity (storage warehouse, hydraulic and mechanical workshop,
mineral benefit plant, administrative office, heavy machinery workshop) equal to 3.5
hectares, and tailings pond and WTTP 1 hectare for each one.
● In open-pit technology, areas occupied by extraction activity were equal to 9,48
hectares/year, services activity (storage warehouse, hydraulic and mechanical workshop,
mineral benefit plant, administrative office, heavy machinery workshop) equal to 3,45
hectares, and tailings pond 15,65 hectares.
● Time needed for forest natural recovery in both systems, open-pit and alluvial
mining, was set to 40 years (Chazdon et al., 2016). However for using the land of the
areas occupied by the tailings pond, recovery time was considered to be 130 years in both

40 Sustainability Assessment of Alluvial and Open Pit Mining Systems in Colombia: Life Cycle Assessment, Exergy Analysis, and Emergy Accounting
systems, equal to comparable mining processes in ecoinvent 3.1 (Tuchschmid, 2014;
Reid, 2014).
● Emissions generated for alluvial technology corresponded only to a tilting diesel
melting furnace equal to 1,04 kg Total Suspended Particles (PST)/ year, 1,73 kg SO2/year,
2,04 NOx/year; for the rest of the steps, PST emissions were not considered due since it is
a wet process where emissions are not significative. Emissions in open-pit mining
technology are described in Table 2.
● It is noteworthy that for open-pit mining, approximately 70 substances present in
tails stage were taken into account, unlike alluvial mining where only 17 substances were
considered for reasons of quality data. This are implications in the non-comparability of
both mining systems in this stage of the process. However, in alluvial mining technology,
water resource plays an important role in mineral benefit stage, avoiding the use of toxic
chemicals, implemented in minor concentrations, in comparison with open-pit mining
technology.
● In open-pit mining technology the 83% of water used in all process (reserves
evaluation to casting and moulding) is recycled, while in alluvial mining is 0,45%; which
corresponds to 99,9% of the water used in metallurgical extraction stage, since water used
in this process is carried to WTTP and afterwards reused into the same process.
● Mining exploration stage is considered only in alluvial mining technology, because
in open-pit mining inputs are unrepresentative with regard to the holistic system.
● Gold and silver price for both technologies, open-pit and alluvial mining, is
considered like the average price for 2016 equivalent to €36,21 and €0,50 per gram
(Colombia Republic Bank, 2017) (Colombian Stock Exchange, 2017). Regarding iron
average price for the same year it is equal to €3,00E-05 per gram (Index mundi, 2016). For
this reason, silver ore is taken into account as co-product in open-pit mining and iron ore
as a stock resource to be used in future processes.
● eWear and depreciation of machinery in both technologies is considered using
datasets from ecoinvent and unit use according to reference flow.
● The emission of greenhouse gases associated with organic material removed
(vegetation covered harbors and organic soil) has been considered; despite part of this
resource is used in forestal restoration activities.
● Due to lack of LCI data for Colombian electrical matrix, the electricity mix process
for Colombia has been designed, where energy consumption average (2012-2016) for
different energy resources was taken: hydraulic (70,39%), gas (15,15%), carbon (8,41%),

Chapter 1 41
wind (0,10%), biomass (0,7%), fuel oil (0,66%), Jet-A1 mix fuel (1,75%), ACPM (2,70%),
JET-A1(0,04%), others (0,09%) (Ministerio de Minas y Energía, 2016)
● Electricity consumption in gold and silver refining process (electrolytic process)
from doré (open-pit mining) is assumed as 325 kWh/ton gold and 630 kWh/ton silver
respectively (Terry Norgate & Haque, 2012).
● To refine gold ore-impurities a mix of borax and sodium carbonate (3:1 ratio) is
used applying high temperature and air enriched with oxygen
● Emissions of biomass decay after stripping the mining site has been assumed as
1.15 kg/t/year, which means that it has been basically omitted
● It is assumed that there are no chemical leaks in any stage of the system where
organic and inorganic chemicals are used; i.e. all the chemicals are contained at the end in
tailings pool, based on the information provided by mining companies which remains to be
tested
● LCA model is taking into account chemical element fractions analyzed in
independent laboratories for sulfide tailings of both systems; however, this sensitive data
cannot be disclosed for being confidential information.
● It was assumed that as a long term effect all (100%) chemical substances within
sulfidic tailings are liberated into the environment, reaching at last groundwater. No
internal chemical reactions of the slurry have been considered (e.g. acid mine drainage -
AMD).
● Radioactive emissions to air (uranium, thorium, zirconium) have been omitted
● In this study, all the chemicals used in both open-pit and alluvial mining
technologies are taken as “organic chemicals” and “inorganic chemicals” from Ecoinvent
3.1 database, except sodium cyanide (NaCN), calcium oxide (CaO), sodium borate and
activate carbon. Appendix A approach in more detail this issue.
1.3.4 Life cycle inventory (LCI)
Life cycle Inventory was built based on first-hand data and mass and energy balance for
both technologies; open-pit and alluvial mining. Table 1-2 shows the global input/output for
the holistic process; Table 1-2 gives a support of the input/output and details of the
assumptions to each subsystem respectively.

42 Sustainability Assessment of Alluvial and Open Pit Mining Systems in Colombia: Life Cycle Assessment, Exergy Analysis, and Emergy Accounting
Table 1-2: Input/output description in open-pit and alluvial mining technologies.
Open-pit Mining
Technology
Alluvial (or placer) Mining
Technology
Unit
Input
Water l5,70,E+07 a9,79,E+07 ton/year Energy (electrical) m2,03E+12 b2,53E+11 kJ/year Energy (gas) n1,68,E+10 c1,60E+07 kJ/year Energy (diesel) o1,15E+12 d1,12E+09 kJ/year Oxygen (air) p3,75,E+05 e40 ton/year Others ** 1,01,E+06 *318,8 ton /year Output Inert material removed (sterile mineral) q 6,94,E+07 f1,06,E+08 ton/year Vegetation cover harbors (clearing and stripping)
r 1,33,E+03 g60 ton/year
Sludge tails (wet weight) s 2,42,E+07 h4,52,E+03 ton/year Energy losses t1,24,E+12 i4,74,E+10 kJ/year Emissions of substances to air, water and soil by combustion, detonation, triturationu, leakage etc.
---
Stored material with mineral of interest v3,98,E+07 --- ton/year Metal Ferrous co-product (dry weight, 55% iron)
--- 1,55 ton/year
Silver co-product (dry weight) w21,55 --- ton/year Gold (dry weight) x19,05 j3,10 ton/year Recycling
Water y4,79,E+07 k4,42,E+05 ton/year aWater in alluvial mining technology (ton/year): Exploration (1,25,E+02), clearing and stripping (1,15,E+06), float up of suction dredger (1,00,E+07), mechanical screening (7,46,E+07), hydraulic jigs (1,12,E+07), sluice boxes (4,84,E+05), Physical separation (4,46,E+05), Waste Tailings Treatment Plant (3,80,E-01), Services (9,38,E+ 03 water for domestic use, not used into operational process).
b Electrical energy in alluvial mining technology (kJ/year): clearing and stripping (9,98,E+10), dipper dredger (6,86,E+10), mechanical screening (4,47,E+10), hydraulic jigs (2,33,E+10), sluice boxes (2,76,E+09), physical separation (1,92,E+08), filtration-separation (7,67,E+07), chemical separation (1,15,E+08), WTTP (4,77,E+07), tailings pond (6,95,E+07), services (1,35,E+10 to support suction dredger, dipper dredger and administrative offices).
c Gas energy (propane) in alluvial mining technology (kJ/year): drying and separation of ferrous minerals (1,60,E+07).
d Diesel fuel (derived from petroleum) in alluvial mining technology (kJ/year): Exploration (2,86,E+08), Casting and molding (4,33,E+06), Services (8,34,E+08 to support suction dredger, dipper dredger).
e Oxygen (air) in alluvial mining technology (ton/year): drying and separation (20), tailings pond (20)
f Inert material removed (sterile mineral in dry weight) in alluvial mining technology (ton/year): reserves evaluation, exploration (5,61,E+02); reserves evaluation, clearing and stripping (3,65,E+07); mineral extraction, dipper dredger (6,95,E+07).
g Vegetation covered harbors in alluvial mining technology (ton/year): clearing and stripping (60 corresponding to 140 hectares)
h Sludge tails (wet weight) in alluvial mining technology 4,52,E+03 with 98,7% humidity.

Chapter 1 43
i Energy losses in alluvial mining technology (KJ/year): clearing and stripping (9,98,E+09), dipper dredger (6,86,E+09), mechanical screening (2,41,E+10), hydraulic jigs (2,33,E+09), sluice boxes (7,73,E+08), physical separation (1,92,E+07), filtration-separation (2,15,E+07), chemical separation (3,22,E+07), WTTP (1,34,E+07), tailing pond (1,94,E+07), services (3,10,E+09 to support suction dredger, dipper dredger and administrative offices), drying and separation of ferrous minerals (1,60,E+06), Exploration (1,80,E+08), Casting and molding (1,99,E+03).
j Gold (dry weight) in alluvial mining technology (ingot/year): 155 each 20kg.
k Recycling in alluvial mining technology, water treated from WTTP to physical separation.
l Water in open-pit Mining Technology (ton/year): clearing and stripping (5,65,E+06 water for irrigation to minimize PST in the air), mineral excavation (5,08,E+06 06 spray irrigation systems to minimize PST in the air), secondary milling (3,59,E+07), gravimetric separation (8,32,E+06), floatation (2,08,E+06), elution (6,96,E+05). Primary crushing step is not significative in spray irrigation systems, which is not quantified into the process.
* Others in alluvial mining technology (ton/year): services (7,3 organic material in domestic waste water), chemical separation (emulsifying agent 0,1; foaming agent 0,23; flotation agent 0,48), WTTP (coagulating agent 0,45), Casting and molding (Sodium borate 232,68 as a fluxing agent; calcium carbonate 77,56).
m Electrical energy in open-pit mining technology (kJ/year): mineral excavation (8,08,E+10), primary crushing (7,82,E+10), secondary milling (1,36,E+12), gravimetric separation (2,15,E+09), floatation (1,97,E+11), leaching (4,45,E+10), carbon adsorption (8,05,E+09), detoxification (2,02,E+08), tailings pond (5,34,E+10), elution and carbon regeneration (3,90,E+10), casting and electro-winning (7,99,E+09), other services (1,55,E+11 administrative offices, public services).
n Gas energy (liquefied petroleum gas) in open-pit mining technology (kJ/year): others services (1,68,E+10).
o Diesel fuel (derived from petroleum) in open-pit mining technology (kJ/year): mineral excavation (1,14,E+12), casting and electro-winning (1,35,E+09), other services (5,35,E+09 lightweight vehicles).
p Oxygen (air) in open-pit mining technology (ton/year): floatation (2,27,E+04), leaching (3,75,E+05).
q Inert material removed (sterile mineral in dry weight) in open-pit mining technology (ton/year): reserves evaluation, clearing and stripping (1,09,E+03); mineral excavation (6,93,E+07).
r Vegetation covered harbors in open-pit mining technology (ton/year): clearing and stripping (1,33,E+03 vegetation covered harbors).
s Sludge tails (wet weight) in open-pit mining technology (ton/year): 2,42,E+07 with 2,36,E-04 % humidity.
t Energy losses open-pit mining technology (KJ/year): mineral excavation (7,48,E+11), primary crushing (1,49,E+10), secondary milling (2,59,E+11), gravimetric separation (2,15,E+08), floatation (5,50,E+10), leaching (4,45,E+09), carbon adsorption (3,62,E+09), detoxification (5,64,E+07), tailings pond (5,34,E+09), elution and carbon regeneration (1,09,E+10), casting and electro-winning (1,65,E+09), other services (1,39,E+11 administrative offices, public services).
u Emissions, Total Suspended Particles(PST) in open-pit mining technology (ton/year): mineral excavation (1,75,E+03), primary crushing (2,41,E+01), secondary milling (7,09,E+01), tailings pond (3,75,E+02).
v Stored material with mineral of interest (ton/year): 55% of the extracted material (3,98,E+07) with a significative gold concentration is stored (3,98,E+07) for beneficiation in the future when mine is reaching its lifespan.
w Silver (dry weight) in open-pit mining technology (ingot/year): Average 1078 each 20kg.
44 Sustainability Assessment of Alluvial and Open Pit Mining Systems in Colombia: Life Cycle Assessment, Exergy Analysis, and Emergy Accounting
x Gold (dry weight) in open-pit mining technology (ingot/year): Average 952 each 20kg.
y Recycling in open-pit mining technology, water treated from WTTP to all the process.
** Others in open-pit mining technology (ton/year): mineral excavation (1,41,E+04 Ammonium Nitrate - Fuel Oil ANFO, 95% ammonium nitrate and 5% kerosene), chemical separation (1,08,E+01 NaOH; 8,99,E+01 NaCN), floatation (Potassium Ammonium Xanthate 5,29,E+02; 4,37,E+02 flotation agent), leaching (1,87,E+03 NaCN, 2,19,E+03 CaO), carbon adsorption (2,67,E+03 activated carbon), detoxification (1,15,E+02 CaO; 1,10,E+00 H2O2; 1,27,E+02 Na2S2O5), tailings pond (flocculating agent 3,11,E+02), elution and carbon regeneration (9,91,E+05 inorganic chemicals)
1.3.5 Life cycle impact assessment (LCIA)
The goal and scope of an LCA determine the selection of impact categories and
characterization methods. In this study, ReCiPe method (hierarchist, including long term
effects) (Goedkoop, M., Heijungs, R., Huijbregts, M., De Schryver, A., Struijs, J., Van
Zelm, 2013) has been chosen to include midpoint and endpoint indicators, and also water
depletion as a significant midpoint indicator. For normalization, world average impacts per
capita and year as provided by the ReCiPe methodology have been elected how is shown
in the Figure 1-3.
Figure 1-3: ReCiPe methodology framework with midpoint and endpoint indicators (Goedkoop, M., Heijungs, R., Huijbregts, M., De Schryver, A., Struijs, J., Van Zelm, 2013).

Chapter 1 45
1.3.6 Sensitivity analysis
For a sensitivity analysis different efficiency scenarios have been chosen, to evaluate the
effects of energy efficiency on the impacts caused by gold mining. In both mining
technologies, it has been assumed that electric energy and diesel consumption could be
lowered up to 30%. The baseline and scenarios of 10%, 20% and 30% efficiency
improvement have been calculated to be able to compare the effects on different impact
categories.

46 Sustainability Assessment of Alluvial and Open Pit Mining Systems in Colombia: Life Cycle Assessment, Exergy Analysis, and Emergy Accounting
1.4 Results and discussion
In in this section two aspects are analyzed; consumption of non-renewable (removed
material mining progress) and renewable resources (water) and energy and, the different
impact categories in soil, air and water sources in mid-points for both mining technologies;
open-pit and alluvial mining technology, in comparison to gold mining standard literature
results (Ecoinvent 3.1. database), and following the most significant impact categories
(mid-points, end-points (Burchart-Korol et al., 2016; Goedkoop, M., Heijungs, R.,
Huijbregts, M., De Schryver, A., Struijs, J., Van Zelm, 2013); by process, phases, and
products for each mining technology, and sensitivity analysis to energy consumption
(electricity, diesel) like critical input, due to its high contribution to different impacts
categories.
1.4.1 Non-renewable, renewable resources and energy inputs
Environmental impacts associated with energy and water use are among the most
important issues for mining industry (Pimentel et al., 2016). Consumption of non-
renewable (removed material mining progress) and renewable resources (water) and
energy is emphasized for each stage listed above, with the challenge to improve the
efficiency of both technologies in terms of critical resources in future research (de Faria,
D.C., de Souza, A.A.U., 2009; Dharmappa, H., Wingrove, K., Sivakumar, M., Singh, 2008).
It should also be pointed out that greater environmental impacts are expected in those
stages with highest consumption of non- renewable, renewable and energy resources.
Northey et al., 2013 suggest to separate energy consumption by type (electrical, diesel
input for machineries in detail for each type of machine, gas), source of electricity
(produced on-site or off-site grid) among other aspects; those to find specific opportunities
for improving the measures to be implemented and for sustainability reporting (S. Northey
et al., 2013). The global production-consumption cycles of minerals and energy are
inextricably connected (Giurco, McLellan, Franks, Nansai, & Prior, 2014), for this reason
the environmental impacts from energy consumption are assessed into all previously
mentioned impact categories, becoming the input resource with a greater contribution in
each environmental impact as shown in the next sections, therefore, sensitivity analysis
was carried out with this parameter to evaluate the change in impact categories according
to the decrease of electricity and diesel consumption.

Chapter 1 47
Then, the values for direct and indirect energy consumption provide an approximation of
the electricity, gas, and energy mines acquire or in a few cases is generated in-situ.
Figure 1-4 shows energy consumption, energy losses (38,93% of the total energy input)
and total useful energy (61,07% of the total energy input) for open-pit and alluvial mining
technologies, where 63,56% of the energy total consume comes from electricity, 35,91%
from Diesel and a 0,53% from gas. The highest electricity, gas and diesel energy
consumed in open-pit mining is presented in grinding mill stage with 67,14%, other
services stage with a 100%, and mineral excavation stage with 99,41% of total
consumption from the holistic process. In the same way, the highest loss of energy is
presented in services and mineral excavation stage with a first law efficiency equal to
35,0%.
Figure 1-4: Energy consumption and loss for each stage of the process in open-pit mining technology.
a) Energy consumption for each stage open-pit mining
0%
10%
20%
30%
40%
50%
60%
70%
80%
90%
100%
Total Useful Eletricity Total Useful Gas Total Useful Diesel
Total losses
Services
Casting and molding
Elution and regeneration
WTTP
Detoxification
Adsorption
Leaching
Flotation
Gravimetric separation
Grinding mill
Primary crushing
Extraction

48 Sustainability Assessment of Alluvial and Open Pit Mining Systems in Colombia: Life Cycle Assessment, Exergy Analysis, and Emergy Accounting
b) Energy loss for each stage of the alluvial mining
Note: Efficiency of first law. Extraction (ŋ= 38%) (Cullen & Allwood, 2010; Pellegrino, Margolis, Justiniano, Miller, & Thedki, 2004; Romero Rueda, de Armas Teyra, Pérez Mena, & Guerrero Rojas, 2012), primary crushing (ŋ= 81%) (Wang, 2013), grinding mill (ŋ= 81%)(Fuerstenau & Abouzeid, 2002; Shi, Morrison, Cervellin, Burns, & Musa, 2009; Wang, 2013), gravimetric separation (ŋ= 90%) (Cullen & Allwood, 2010; Pellegrino et al., 2004; Romero Rueda et al., 2012), flotation (ŋ= 72%)(Cullen & Allwood, 2010; Pellegrino et al., 2004; Romero Rueda et al., 2012), leaching (ŋ= 90%) (Cullen & Allwood, 2010; Pellegrino et al., 2004; Romero Rueda et al., 2012), adsorption (ŋ= 55%)(Cullen & Allwood, 2010; Pellegrino et al., 2004; Romero Rueda et al., 2012), detoxification (ŋ= 72%) (Cullen & Allwood, 2010; Pellegrino et al., 2004; Romero Rueda et al., 2012), WTTP (ŋ= 90%) (Cullen & Allwood, 2010; Pellegrino et al., 2004; Romero Rueda et al., 2012), elution and regeneration (ŋ= 72%) (Cullen & Allwood, 2010; Pellegrino et al., 2004; Romero Rueda et al., 2012; Soundararajan, Ho, & Su, 2014), casting and molding (ŋ= 82%) (Cullen & Allwood, 2010), other services (ŋ= 21%) (Cullen & Allwood, 2010; Pellegrino et al., 2004). Energy consumption is not specific.
Otherwise, in alluvial mining technology, energy losses (10,93% of the total energy input)
and total useful energy (89,07% of the total energy input) are shown in Figure 1-5; 99,55%
of the energy total consume comes from electricity, 0,44% from diesel, and 6,35, E-05%
from gas. The highest electricity, gas and diesel energy consumed in alluvial mining are
presented in clearing and stripping stage with 39,43%, drying and separation stage with a
100%, and mineral excavation stage with 74,20% of total consumption from the holistic
process. The highest loss of energy is presented in clearing and stripping stage with a first
law efficiency equal to 90%. However, in this mining process they have installed their own
run-of-river hydroelectric plant for production line self-supporting, where 1,46E+18 kJ are
generated annually, unlike open-pit mining where electrical consumption is from off-site
0%
10%
20%
30%
40%
50%
60%
70%
Total Losses Eletricity Total Losses Gas Total Losses ACPM
Services
Casting and molding
Elution and regeneration
WTTP
Detoxification
Adsorption
Leaching
Flotation
Gravimetric separation
Grinding mill
Primary crushing
Extraction

Chapter 1 49
grid. Appendix D present grassmann energy diagram to open-pit and alluvial mining by
process.
Figure 1-5: Energy consumption for each stage of the process in alluvial mining technology.
a) Energy consumption for each stage of the process
b) Energy loss for each stage of the process
Note: First law efficiency. Exploration (ŋ= 37%), stripping (ŋ= 90%), dredging line (ŋ= 90%), mechanical screening (ŋ= 90%), hydraulic jigs (ŋ= 90%), sluice boxes (ŋ= 72%), services (ŋ= 78%), physical separation (ŋ= 90%), filtration separation (ŋ= 72%), chemical separation (ŋ= 72%), drying and separation (ŋ= 90%), WTTP (ŋ= 72%), casting and molding (ŋ= 37%), tailings pond (ŋ= 72%). Energy consumption is not specific. All efficiencies are taken from (Cullen & Allwood, 2010; Pellegrino et al., 2004; Romero Rueda et al., 2012); except exploration, drying and separation and, casting and molding (Cullen & Allwood, 2010)
0%
10%
20%
30%
40%
50%
60%
70%
80%
90%
100%
Total Useful Eletricity Total Useful Gas Total Useful Diesel
Total losses
Tailings pond
Casting and molding
WWTP
Drying and separation
Chemical separation
Filtration-separation
Physical separation
Sevices
Sluice boxes
Jigs
Trommel
0%
10%
20%
30%
40%
50%
60%
70%
Total Losses Eletricity Total Losses Gas Total Losses ACPM
Tailings pond
Casting and molding
WWTP
Drying and separation
Chemical separation
Filtration-separation
Physical separation
Sevices
Sluice boxes
Jigs
Trommel
Dredging line
Stripping
Exploration

50 Sustainability Assessment of Alluvial and Open Pit Mining Systems in Colombia: Life Cycle Assessment, Exergy Analysis, and Emergy Accounting
Regarding non-renewable (removed material mining progress) and renewable resources
(water), in Figure 1-6 and Figure 1-7 the continue advance of mining from mineral
extraction stage until obtaining gold. To both technologies, the increase of gold fraction in
contrast with the decreasing of sterile mineral fraction can be seen. In addition, water
consumption is presented in each stage of the process; water is used by both in greater
proportion in ore benefit and metallurgical extraction phase, thus also to control dust
suppression. Highest water inputs are in grinding mill stage (3,59, E+07 ton) and
mechanical screening (7,46, E+07 ton) in open-pit and alluvial mining respectively.
Comparing the energy and water consumption of open-pit mining and alluvial mining with
the processes referenced in the literature for the production of 1 kg of gold and other
minerals such as copper, iron, and bauxite, the mining processes addressed in this study
exceed the referenced consumption as can be see the Table 1-3; however, it is clear that
this comparison is broad and requires a more thorough study to be valid.
Table 1-3: Energy and water Consumption in others studies.
Open-Pit Alluvial PaPua* guinea
Perú** ROW*** Haque & Norgate,
2014
Norgate & Haque, 2012
Mudd, 2007
Energy, KJ / kg Au
1,68E+14 8,20E+13 4,72E+07 6,39E+07 1,54E+08 3,47E+08 4,65E+08 1,49E+11
Water kg / kg Au
2,51E+09 1,43E+08 1,33E+06 6,89E+07 4,28E+05 2,88E+02 2,59E+02 6,35E+05
*Papua Guinea, gold-silver mine operation with refinery. From the transport of raw materials to the mine, until the refining of gold and silver (Gobain, Sa, & Frank, 2016). **Peru Yanacocha Mine, cradle to gate from raw material until refining gold (Gobain et al., 2016) gold-silver mine operation with refinery, PE, (Author: Matthias Tuchschmid (obsolete) active) *** Row (rest of the world), open-pit gold-silver mine operation with refinery. This multi-output process 'mining and refining, gold-silver deposit' delivers the two co-products; gold and silver. This data set includes the combined mining and refining of gold and silver in open pit mines in Peru. Collection of a range of data of the Australian mining industry (Mudd, 2010) Note: copper (6,10E+10 KJ/ kg), iron (1,53E+02 KJ/ kg), Bauxite (5,49E+01 KJ/ kg) (T. E. Norgate, Jahanshahi, & Rankin, 2007; T. Norgate & Haque, 2010)

Chapter 1 51
Figure 1-6: Non-renewable (inert material removed) and renewable (water) consumption in open-pit mining technology from cradle to gate. Non-renewable (inert material removed) and renewable consumption is not specific.

52 Sustainability Assessment of Alluvial and Open Pit Mining Systems in Colombia: Life Cycle Assessment, Exergy Analysis, and Emergy Accounting
Figure 1-7: Non-renewable (inert material removed) and renewable (water) consumption in alluvial mining technology from cradle to gate. Non-renewable (inert material removed) and renewable consumption is not specific.

Chapter 1 53
It is noteworthy that the 83,98% and 0,45% of water consumption are reused in mining
process previously in water treatment and, in alluvial mining technology 24,65% of the
water return to the same catchment area, as shown in Figure 1-8. Finally, accounting the
respective input/output water of the process, water consumption into the process is equal
to 4,79,E+02 ton/year in open-pit mining, and 2,36,E+04 ton/year in alluvial mining
technology what corresponds to 16,02% and 74,90 of the total water entry respectively.
Although both water recovering and intensity uses depend on cooler climates or arid
regions (S. Northey et al., 2013); therefore, higher temperatures in arid regions result in
more water being lost throughout the site via evaporation that reduces the amount of water
available to be recovered through tailings dewatering (Castillo, J., Sanchez, J.M., Kunze,
V., Araya, 2001), and the water required for dust suppression activities is also increased
due to decreased moisture content in soils (Gambatese, J.A., James, D.E., 2001).
Figure 1-8: Water use in open-pit and alluvial mining technologies.
Note: Water returns to the same catchment area
Despite an intensive use of water is presented in both mining technologies, in this study
the full water footprint impact based on Life Cycle Assessment is not considered
(LCA)(ISO, 2014); where this impact assessment metrics are analyzed (Boulay, A.-M.,
Bayart, J.-B., Bulle, C., Franceschini, H., Motoshita, M., Muñoz, I., Pfister, S., 2013);
scarcity or stress indicators (Boulay, A.-M., Motoshita, M., Pfister, S., Bulle, C., Muñoz, I.,
Franceschini, H., Margni, 2015; Pfister, S., Ridoutt, 2014), water availability indicator,
quality indicators based on water degradation (Eutrophication, ecotoxicity, acidification,
0%
10%
20%
30%
40%
50%
60%
70%
80%
90%
100%
Open-pit mining
technology
Alluvial mining
technology
Water content into the
process
Water recycling
Water return

54 Sustainability Assessment of Alluvial and Open Pit Mining Systems in Colombia: Life Cycle Assessment, Exergy Analysis, and Emergy Accounting
among others by Recipe midpoint methodology)(ISO, 2014), and endpoint modeling
(human health, ecosystems and resources) (ISO, 2014), in spite,t only quality indicators
and specific water sources will be assessed by considering more traditional life cycle
assessment impact categories for the following reasons:
● To Colombia, the Water Stress Index WSI (Pfister, S., Koehler, S., Hellweg, 2009),
Water Depletion Index WDI (Berger, M., van der Ent, R., Eisner, S., Bach,
V.,Finkbeiner, M., 2014) and Water Deprivation Potential WDP (WULCA, 2015)
used to calculate the scarcity, stress, and availability indicators are not
representing significative values because it is one of the few countries around the
world that has low values for all indexes, as shown by Northey et al., 2016 in the
“Water footprinting and mining: Where are the limitations and opportunities?” study.
This is corroborated by Padowski et al., 2016 who show lower values to Colombia
when assessing global water security around the world underwater availability,
accessibility to water services, quality and safety, governance conditions. Other
studies approach freshwater withdrawals (% of total renewable water resources)
(UNDP, 2016), Water Poverty Index (Lawrence, Meigh, & Sullivan, 2002).
Research more specifically to Colombia shows a WSI lowest to Hydrographic
Subzone in the average year, where is located the productive system mining
(SuizAgua, 2015).
● According to the water footprint framework formalized in ISO 14046 standard by
LCA, to date, no consensus-based approach exists for applying this standard and
results are not always comparable when different scarcity or stress indicators are
used for characterization of impacts (Boulay et al., 2017). Additionally, regionalized
assessment is still a challenge with the current databases and software, referring to
a “global” region when no geographic information is specified (Boulay et al., 2017).
● A range of methodological and data limitations hamper the efforts to conduct water
footprint studies of mining (S. A. Northey et al., 2016), mainly in private mining
companies where data are not public. General life cycle assessment studies that
include a “water use” are focused only on water consumption and not in the
environmental impacts of consumption.
● The aim of the present research is not to assess the footprint water in both alluvial
and mining processes, the focus is to analyze the most relevant environmental
impacts in a holistic way by LCA. Impact categories assessment that show the

Chapter 1 55
damage of water resource in this study are: freshwater ecotoxicity, freshwater
eutrophication, marine ecotoxicity, marine eutrophication and water depletion.
1.4.2 Environmental impact categories in open-pit vs alluvial mining technologies
Table 1-4 shows the comparison of damage categories (ecosystem, resource, and human
health) for different environmental impacts for each mining technology, together with
mining processes taken from ecoinvent 3.1 database. In this study ecosystem damage
categories are subdivided in soil and water resources with the aim to emphasize in water
use and quality indicators, since in the Colombian context water has a determinant roll into
decision making for concession of environmental and social licenses, it generated conflicts
between different stakeholders of mining sector. As can be seen in Figure 1-9, for all
impact categories, alluvial mining technology presented the lowest value in comparison
with the standard results to Perú, Papua New Guinea and ROW from ecoinvent 3.1
database, and open-pit mining process except for water depletion, agricultural land
occupation and natural land transformation, where it obtained the highest values. This
behaviour was expected for the intense water use and the number of hectares used and
transformed in this technology. These results will be further analyzed in the followings
sections.
The most relevant impact in soil ecosystem category is terrestrial acidification to open-pit
mining (Ecoinvent 3.1. database Papua New Guinea, Peru, ROW), alluvial mining
presents a different behavior in regard to the previous ones, being natural land
transformation the impact category that contributes the most to soil damage. In the case of
water resource, marine ecotoxicity is the most representative impact to alluvial mining and
literature results (Papua New Guinea, Peru, ROW), to open-pit mining it is freshwater
ecotoxicity. To human health damage categories, human toxicity and particulate matter
formation are the most significative impacts; this last impact category is not relevant to
alluvial mining technology. In resource damage category, metal depletion has the highest
impact as would be expected for a metal mining process.
It is important to point out the fact that open-pit mining presents similar impact results to
Ecoinvent mining processes (Ecoinvent 3.1. database) because all use a similar

56 Sustainability Assessment of Alluvial and Open Pit Mining Systems in Colombia: Life Cycle Assessment, Exergy Analysis, and Emergy Accounting
conventional ore extractive method, different to alluvial extracted operation. However,
values for all impact categories showed in Table 1-4 are highest in the analyzed open-pit
technology than in Ecoinvent process results, except for terrestrial ecotoxicity, marine
eutrophication, and photochemical oxidant formation. Going into detail, it becomes clear
that there are very specific substances that cause high toxicity values of open pit mining
process, according to laboratory values of its tails composition. Freshwater ecotoxicity
stems nearly 75% from the Phosphorus content of tails slug, freshwater eutrophication
even to 99%. In human toxicity, Barium content accounts for nearly 40%, while in Peruvian
mine it does not play an important role. It can be said that impact values depend highly on
the selection of substances that have been included for analysis of tails solid content.
Alluvial mining technology presents an unusual behavior in comparison with other mining
systems where impact values are the lowest, except in agricultural land occupation,
natural land transformation and water and metal depletion. That is to say, conventional
extractive process like open-pit mining technology (Ecoinvent 3.1 to Perú, ROW and this
study) seems generally less efficient in comparison to alluvial mining technology in terms
of environmental impacts to ecosystem, resources, and human health; it could be due to
the difference between extractive methods, technologies implemented, time line,
boundaries system (from cradle to gate for this study), local regulations, among other
factors.
Based in the normalization of values (Figure 1-10) and literature results (Burchart-Korol et
al., 2016; Ferreira & Leite, 2015; Fugiel et al., 2017; Erkayaoğlu & Demirel, 2016), the
impact categories to analyse from this point on are: climate change, freshwater ecotoxicity,
freshwater eutrophication, human toxicity, marine ecotoxicity, marine eutrophication,
particulate matter formation, photochemical oxidant formation, natural land transformation,
water depletion and terrestrial acidification.

Chapter 1 57
Figure 1-9: Comparison of midpoint impacts of different mining systems (total values, cut at 20000).
Figure 1-10: Comparison of midpoint impacts of different mining systems (normalized values, cut at 40).
Table 1-4: Comparison of gold processes impact categories for open-pit and alluvial mining technologies, and ecoinvent 3.1. Database.

Damage categories
Impact categories Alluvial mining
technology Open-pit mining
technology Ecoinvent 3.1. database Peru
Ecoinvent 3.1. database Papua New
Guinea
Ecoinvent 3.1. database ROW
Normalized
values
Normalized values
Normalized
values Normalized
values Normalized
values
Ecosystem (soil)
agricultural land occupation, (m2a/yr)
1,81E+04 3,33E+00 2,65E+02 4,88E-02 4,13E+02 7,61E-02 1,24E+03 2,29E-01 6,06E+02 1,12E-01
natural land transformation, (m2/yr)
4,64E+02 3,86E+01 1,93E+01 1,60E+00 5,17E+00 4,29E-01 9,45E+00 7,86E-01 6,60E+00 5,49E-01
urban land occupation, (m2a/yr)
4,21E+02 5,43E-01 1,30E+03 1,68E+00 1,09E+03 1,41E+00 1,20E+03 1,55E+00 1,09E+03 1,40E+00
terrestrial acidification, (kg SO2 eq/yr)
8,05E-01 2,11E-02 2,07E+02 5,42E+00 1,90E+02 4,98E+00 2,54E+02 6,66E+00 2,41E+02 6,31E+00
terrestrial ecotoxicity, (kg 1,4-DB eq/yr)
1,15E-02 1,94E-03 1,03E+01 1,74E+00 2,20E+00 3,72E-01 1,95E+00 3,28E-01 2,53E+00 4,27E-01
Ecosystem (water)
freshwater ecotoxicity (kg 1,4-DB eq/yr)
1,29E+01 3,01E+00 7,39E+04 1,72E+04 1,41E+04 3,28E+03 6,33E+03 1,47E+03 1,24E+04 2,89E+03
freshwater eutrophication, (kg P-eq /m3)
4,20E-02 1,45E-01 4,94E+02 1,71E+03 3,80E+02 1,31E+03 1,70E+02 5,87E+02 3,24E+02 1,12E+03
marine ecotoxicity (kg 1,4-DB eq/yr)
1,14E+01 4,63E+00 2,11E+04 8,57E+03 1,25E+04 5,08E+03 9,07E+03 3,68E+03 1,18E+04 4,79E+03
marine eutrophication, (kg N-eq/m3)
3,94E-01 5,37E-02 8,55E+01 1,16E+01 1,06E+02 1,44E+01 1,20E+02 1,64E+01 1,26E+02 1,72E+01
water depletion (m3/yr)1 2,82E+04 4,91E+02 1,89E+01 1,23E+03 1,34E+02
Resources fossil depletion, (kg oil eq/yr)
4,29E+01 3,32E-02 3,94E+03 3,06E+00 2,48E+03 1,92E+00 9,82E+03 7,61E+00 5,06E+03 3,92E+00
metal depletion (kg Fe-eq) 7,00E+04 1,57E+02 8,29E+04 1,86E+02 8,23E+04 1,85E+02 8,14E+04 1,83E+02 1,01E+05 2,28E+02
Human health
climate change kg CO2 eq/yr
1,66E+02 2,41E-02 1,51E+04 2,19E+00 8,07E+03 1,17E+00 2,90E+04 4,22E+00 1,57E+04 2,28E+00
ozone depletion, (kg CFC-11 eq/yr)
1,63E-05 4,34E-04 1,06E-03 2,81E-02 1,07E-03 2,84E-02 3,46E-03 9,18E-02 2,04E-03 5,43E-02
particulate matter formation (kg PM10 eq/yr)
6,91E-01 4,92E-02 1,65E+02 1,18E+01 6,56E+01 4,67E+00 1,04E+02 7,41E+00 8,44E+01 6,00E+00
photochemical oxidant formation (kg NMVOC/yr)
7,86E-01 1,38E-02 2,18E+02 3,84E+00 2,34E+02 4,12E+00 3,15E+02 5,55E+00 2,87E+02 5,05E+00
human toxicity (kg 1,4-DB eq/yr)
7,35E+01 2,25E-01 5,56E+05 1,70E+03 6,42E+05 1,97E+03 2,88E+05 8,82E+02 5,47E+05 1,68E+03
1 The normalization of water depletion category impact is not possible because ReCiPe Methodology does not have the characterization factor for this.

Environmental impact categories by process in open-pit vs alluvial mining
technologies
As shown in Figure 1-11, the contribution of each process to the environmental impact
categories to open-pit mining technology, where tails, market for electricity, extraction, and
inorganic chemicals were the processes that contribute the most to the different impact
categories analyzed in this study.
Sulfidic tailing (tails), due to its huge need of area and its contents of toxic substances, was the
process that contributed the most to natural land transformation, freshwater ecotoxicity, human
toxicity, marine ecotoxicity, and freshwater eutrophication. For the rest of impact categories such
as particulate matter formation, photochemical oxidant formation, terrestrial acidification and
marine eutrophication, extraction process was the most impacting stage, due to its use of diesel
fuel and electricity, as well as the use of explosives. To water depletion, water extraction from
river was the most relevant process, and for climatic change the most relevant process was the
market for electricity, containing a fraction of fossil fueled thermal plants.
Figure 1-11: Environmental impact categories in open-pit mining technology by processes.
In the case of alluvial mining technology (see Figure 1-12), water extraction, stripping and
electricity production were the processes that contributed the most to the impact categories
analyzed in this study. To natural land transformation, stripping process was the one that
contributed the most. Electricity production (hydro, run-of-river) process was the highest
contributor in the following impact categories: freshwater ecotoxicity, marine ecotoxicity, human

Sustainability Assessment of Alluvial and Open Pit Mining Systems in Colombia: Life Cycle Assessment, Exergy Analysis, and Emergy Accounting
toxicity, particulate matter, terrestrial acidification, freshwater eutrophication, marine
eutrophication, climatic change and photochemical oxidant formation. The inventory of run-of-
river plant was taken from ecoinvent 3.1, it is assumed that impacts generate mainly from the
installation activities of the plant, including building of a retaining dam. For water depletion
impact, water extraction from river was the most significative contribution.
Figure 1-12: Environmental impact categories (mid-point) in alluvial mining technology by processes.
In regards to water resource for both mining technologies, freshwater ecotoxicity and marine
ecotoxicity water were the more affected impact categories in comparison to freshwater and
marine eutrophication. Open-pit mining technology presents higher values in relation to each
water resource impact category but water depletion, where it is significatively bigger in alluvial
mining technology due to intensive use of this resource with a value equal to 2,82, E+04
m3/year. The total water consumed in open-pit and alluvial mining technologies is equal to 5,70,
E+07 ton/year and 9,79, E+07 ton/year respectively, however in the second extractive process
the amount of water returned to river basin is equal to 2,41,E+07 ton/year; and water
recirculated into the process 4,79,E+07 ton/year, and 4,42,E+05 ton/year to open and alluvial
mining respectively, which translates the values of water content into the process 9,83,E+06
ton/year and 7,33,E+07 ton/year respectively, as shown in Figure 1-6 and Figure 1-7.

Chapter 1 61
Environmental impact categories by phases in open-pit vs alluvial mining technology
Figure 1-13 presents the impact categories for both mining technology systems by phases. It
illustrates the little similarity between the two mining technologies. Whereas in alluvial mining,
mine operation phase – where the stripping takes place – is nearly sole responsible for the
natural land transformation; in open pit mining, prechain activities for input materials and waste
treatment are the most contributing phases, followed by mining and mine operation. In all the
toxicity impact categories of open pit mining, the responsible is waste treatment, whereas in
alluvial mining, with supposedly lot less toxic tails, toxicity stems mainly from the divers prechain
activities. Whereas in alluvial mining, fundition phase is one of the main consumers of fossil fuels
and therefore contributing to various impact categories. In open pit mining, extraction process in
the mining phase is responsible for detonation and the majority of fuel combustion, causing a
considerable fraction in terrestrial acidification, marine eutrophication, climate change,
particulate matter formation and photochemical oxidant formation impact categories.
Figure 1-13: Environmental impact categories in open-pit and alluvial mining technologies by phases.
Environmental impact categories by subproduct in open-pit and alluvial mining
technology

Sustainability Assessment of Alluvial and Open Pit Mining Systems in Colombia: Life Cycle Assessment, Exergy Analysis, and Emergy Accounting
In Figure 1-14 are presented the environmental impacts partitioned by the different (sub-)
products generated in both mining systems. It is important to highlight that in alluvial mining
technology nearly 100% of environmental impacts is attributed to gold ore; due to the low price
(€3,00E-05 per gram) and moderate production (1,55 tons per year) iron is not significative
compared to gold ore. In contrast to open-pit mining, where economical allocation was assigned
to gold ore as principal product by economic value, followed by silver ore and the material
deposited after extraction with a lower gold and silver content (2.091,79 tones with a
concentration of Au 5.0E-5%, Ag 8.1E-5%), which is stocked for a posterior beneficiation
process. As can be seen in Figure 14 the majority of impacts correspond to gold ore, followed by
deposited material and only a small fraction can be allocated to silver ore.
Figure 1-14: Environmental impact categories in open-pit and alluvial mining technologies by-products.
1.4.3 Sensitivity analysis open-pit vs alluvial mining technologies
For a sensitivity analysis scenarios were created for both mining technologies, assuming an
improved efficiency in electricity (CFE) and fuel (diesel) consumption (CFD) of up to 30%. As
can be seen in Figure 1-15 and Figure 1-16, the improved fossil fuels efficiency has a rather low
effect on climate change impact, as in open pit mining the rather “green” grid energy is used,
and in alluvial mining electric energy is produced in a run-of-river plant. As in Colombian national

Chapter 1 63
grid nonetheless a certain percentage of energy stems from fossil fuels, there is a notable
change in the fossil depletion category.
Figure 1-15: Sensitivity analysis in open-pit mining, impact categories (mid-point).
The enhanced efficiency in diesel consumption shows a significant improvement in the climate
change and fossil depletion categories, due to the decreased use of fossil fuels and therefore
lower emissions to the atmosphere.
Figure 1-16: Sensitivity analysis in alluvial mining, impact categories (mid-point).
-25%
-20%
-15%
-10%
-5%
0%
-35% -30% -25% -20% -15% -10% -5% 0%
Open-pit mining CFD GWP100
%
CFD FDP %
CFD ALOP %
CFE GWP100
%
CFE FDP %
CFE ALOP %

Sustainability Assessment of Alluvial and Open Pit Mining Systems in Colombia: Life Cycle Assessment, Exergy Analysis, and Emergy Accounting
In the same way, Figure 1-17 and Figure 1-18 shows the sensitivity analysis to damages
categories (end-point) for both mining systems. In open-pit mining with the improvement in the
electrical and diesel efficiency, resource damaged category presents a considerable decreasing,
unlike human health.
Instead in alluvial mining, the increasing efficiency electricity consumption reflect a significative
improve in both resources and human health.
In the Appendix B and Appendix C, is showing how was the choose of the impact categories
(mid-point) for this sensitivity analysis.
Figure 1-17: Sensitivity analysis in open mining, damaged categories (end-point).
-20%
-18%
-16%
-14%
-12%
-10%
-8%
-6%
-4%
-2%
0%
-35% -30% -25% -20% -15% -10% -5% 0%
Alluvial mining CFD
GWP100 %
CFD FDP %
CFD ALOP %
CFE GWP100
%
CFE FDP %
CFE ALOP %

Chapter 1 65
Figure 1-18: Sensitivity analysis in open mining, damaged categories (end-point).
-16%
-14%
-12%
-10%
-8%
-6%
-4%
-2%
0%
-35% -30% -25% -20% -15% -10% -5% 0%
Open-pit mining CFD ecosystem
quality %
CFD human
health %
CFD resources
%
CFE ecosystem
quality %
CFE human
health %
CFE resources
%
-25%
-20%
-15%
-10%
-5%
0%
-35% -30% -25% -20% -15% -10% -5% 0%
Alluvial mining CFD ecosystem
quality %
CFD human
health %
CFD resources
%
CFE ecosystem
quality %
CFE human
health %
CFE resources
%

Sustainability Assessment of Alluvial and Open Pit Mining Systems in Colombia: Life Cycle Assessment, Exergy Analysis, and Emergy Accounting
1.4.4 Environmental end-points indicators in open-pit and alluvial mining technology
Finally Figura 1-19 explains the contribution of each mining technology in end-point indicators;
since in LCA, indicators aim to quantify potential environmental impacts of human interventions
(such as water use or consumption) ultimately affecting three protection areas: human health,
ecosystem quality, and resource depletion (Jolliet O, Müller-wenk R, 2004), with a damage
factor (weighting damage category hierarchist perspective) equal to 300, 400 and 300
respectively. The total impact point to open-pit mining technology is equal to 1,01,E+04
discretized in 6,02,E+02 points to ecosystem quality, 8,98,E+03 points to human health, and
4,88,E+02 points to resource availability; the same way to alluvial mining technology with
2,38,E+03 total impact points divided in 2,37,E+03 points to ecosystem quality, 9,35,E+00 and
7,43,E+00 points to human health and resource depletion respectively.
Figura 1-19: End-point environmental indicators ecosystem quality, human health, and resources in open-pit and alluvial mining technologies.
In open-pit mining technology the 39,75% from ecosystem quality indicators come from the
electricity process marker, following tails and extraction process with a contribution of the
38,43% and 13,85% respectively; in the same way to human health indicator the 87,05% of total
Points

Chapter 1 67
impact stems from tails process followed by regeneration extraction and market for electricity,
with a contribution equal to 7,44% and 3,27% respectively. This same behavior remains for
resource indicator, where market for electricity process presents a greater contribution with a
42,00% of the total impact, market for diesel and extraction with values equal to 25,54% and
21,26% respectively, being input material phase, the one with greater contribution to ecosystem
quality and resource end-point indicator, and waste treatment phase in human health indicator.
Figure 1-20 shows more this behavior globally, where tails and extraction process are the most
critical stages in open-pit mining technology, being human toxicity (mainly for the effect of
manganese and Barium present in tails) and natural land transformation (mainly for the
extension of soil occupied by tails, followed by electricity generation, stripping process and
storage of excavated material in less proportion) are the most representative impact categories
for tails, and particulate matter formation (50% of the emissions from blasting process and the
rest of suspended particles generated in excavation activity) and climate change (emissions
from blasting process and burning diesel in the machinery for excavation) to the extraction
system.
Figure 1-20: End-point environmental indicators per processes in open-pit mining technology.
Points

Sustainability Assessment of Alluvial and Open Pit Mining Systems in Colombia: Life Cycle Assessment, Exergy Analysis, and Emergy Accounting
In the case of alluvial mining technology the 96,11% of the ecosystem quality damage is
associated to stripping process, the resource indicator is associated to electricity production
(66,62%) and services (15,79%), and human health indicator is associated to hydroelectricity
production run-of-river (71,30%), services (10.17%) and casting and molding (7,91%), input
materials phase having the greater contribution to human health and resource end-point
indicator, and mine operation phase in ecosystem quality indicator as shown in Figure 1-21.
Figure 1-21 allows to see how in alluvial mining technology, stripping stage is the most critical
process in environmental terms, being natural land transformation (93% of the natural land
transformation corresponding the stripping process) and agricultural land occupation (the areas
occupied by extraction activity were equal to 140 hectares/year and the forest natural recovery is
the 40 years) the most relevant environmental impact categories.
Figure 1-21: End-point environmental indicators by process in alluvial mining technology.
1.4.5 Contribution of dominant substances
Figure 1-22 and Figure 1-23 present the contribution of dominant substances (first 30
substances) for each environmental impact category (end-points) for open-pit and alluvial mining
technologies respectively. In open-pit mining, manganese and barium were the predominant
substances in human toxicity category, which come from extraction stage (soil compounds) that
end in tailings process. In alluvial mining, predominant resources were forest transformation and
Points

Chapter 1 69
forest occupation to natural land transformation and agricultural land occupation environmental
impact category respectively, which were the most critical inputs in stripping stage.
Figure 1-22: Contribution of first 30 dominant substances in open-pit mining technology.
Figure 1-23: Contribution of first 30 dominant substances in alluvial mining technology.

Sustainability Assessment of Alluvial and Open Pit Mining Systems in Colombia: Life Cycle Assessment, Exergy Analysis, and Emergy Accounting
1.5 Conclusions
● As is commonly known, the main limitation in LCA research in mining sector is
confidential data; reason why, studies of the LCA applied at the mining activity are limited.
Generally, the scope of this studies are only benefit and ore refining process. Additionally, to
date, LCA has not been applied to alluvial mining technology. In this study, LCA was applied to
the open-pit and alluvial holistic mining system (exploration, mining extraction, benefit ore,
refining and fundition) where both electricity and diesel energy consumption, renewable (water)
and non- renewable resources (removed material mining progress) were critical inputs
associated with environmental impacts.
● Management strategies for water and energy consumption and removed mining material
should be implemented to reduce renewable and non-renewable inputs and, in turn, improve the
environmental quality. In fact, regarding water use management, in open-pit mining the 83,98%
of water is reused into the process and, in alluvial mining the 24,65% of water return to the same
catchment area, despite water intensity of the wet process. It would be possible to increase the
energy efficiency presented in each stage of the process by environmental decision making

Chapter 1 71
related with improving the technology adopted, mainly in those with highest consumptions
(grinding mill and extraction stages in open-pit mining technology; stripping and dredging line
stage in alluvial mining technology) and losses (extraction and services stage in open-pit mining;
exploration and services stage in alluvial mining). Finally, in terms of excavated inert material in
alluvial mining, it is ensured a minimum tenor equal to 100mg gold/m3 soil for the extractive
activity to be technically, economically, energyally and environmentally viable; the same is true
for open-pit mining with a tenor equal to 0,47 g gold/ton soil. The material excavated in alluvial
process returns to the river, while in open-pit it is partly stored for posterior beneficiation after
mining system end of life.
● Unfortunately, one of the limitations of life cycle assessments is LCI phase, since in the
mining sector there is not data available within inventory databases about many chemicals used
at mine and mineral processing operations (e.g. flotation, foaming, emulsifying, coagulation
reagents). As a result, studies may be required to use generic inventory items (e.g. “inorganic
chemicals”, “organic chemicals”) as a proxy for missing data.
● A sensitivity analysis was carried out with parameters to evaluate the change in impact
categories according to the decrease of electricity and diesel consumption. It was shown that
with an efficiency increase of all fuel consumption, impacts on climate change and fossil
depletion could be lowered nearly proportionally in terms of percentages.
Comparing both mining technologies from cradle to gate for 1 kg gold based on the data
provided by each company, open-pit mining technology presents highest environmental impacts
(1,01,E+04 points), being human health the most relevant damage category, influenced by
tails (87,05%) and extraction (7,44%) process. The reason could be the particulate matter and
gas emissions generated in extraction process by diesel, explosives and electrical consumption;
and on the other hand by water affectation caused by chemicals used in the process or brought
to the surface that end up in the tails pond. Opposite to alluvial mining technology which
presents lower impacts (2,38,E+03 points), being ecosystem quality the most important damage
category due to land use by stripping process (96,79%). It is emphasized that, in alluvial mining,
the process is wet (water intensive use), where the water action supported with a gravimetric
process does the beneficiation process largely, avoiding the use of chemicals and energy
consumption in the following stages, although it also this implies the use of large land areas.
Nevertheless, despite an intensive water use is presented, the full water footprint impact is not
considered in this study based on Life Cycle Assessment since in Colombia, WSI, WDI and
WDP are not representing significative values because it is one of the few countries around the

Sustainability Assessment of Alluvial and Open Pit Mining Systems in Colombia: Life Cycle Assessment, Exergy Analysis, and Emergy Accounting
world with low values for all indexes. While in open-pit mining, the process is dry, which implies
not just material particulate emissions in mineral excavation but also a more intense physific-
chemical benefit process regarding electrical consumption in primary crushing, secondary
milling and gravimetric separation, and large amounts of organic and inorganic chemicals in
process as floatation and leaching that end in the tails pond, generating environmental impacts
as freshwater and marine ecotoxicity and freshwater eutrophication even though land is less
used.
● In environmental terms, tails and extraction process were the most critical stages in
open-pit mining technology, where human toxicity and natural land transformation were the most
representative impact categories to tails, and particulate matter formation and climate change to
this extraction system. In alluvial mining technology it was the stripping stage, being natural
transformation and agricultural land transformation the most relevant environmental impact
categories. These results are possibly influenced by a few skews, since in open-pit mining
approximately 70 substances present in tails stage were taken into account, unlike alluvial
mining where only 17 substances were considered for reasons of quality data. This are
implications in the non-comparability of both mining systems in this stage of the process.
However, in alluvial mining technology, water resource plays an important role in mineral benefit
stage, avoiding the use of toxic chemicals, implemented in minor concentrations, in comparison
with the open-pit mining technology.
● Despite best strategies for mine tailings management suggested by Adiansyah et al.,
2015 are implemented in open-pit mine technology, such as to reduce the percentage of water
content in mine tailings by dewatering process, that includes thickened tailings technology (1.2
times more preferable than the conventional tailings method.), which increases the efficiency of
water use, recycling in the mining system (83,98% water consumption are reused) and
preventing fresh water utilization, with the aim to protect the environment and human health, the
most relevant environmental impact stage is tails. This behaviour should have different
variables; relevant regulations in place, decision making by relevant stakeholders involved,
disfavorable geochemical in place (release any contaminant), meteorological variables (rainfalls
or semi-arid conditions) as main variables, which make each mine to have specific features and
differ from the others, for this reason, they should not be treated the same way. Also, it is
necessary to implement a tailings management system throughout TSF life, from planning and
design to construction, operation, and planning closure according to Adiansyah et al., 2015.

Chapter 1 73
● The extraction of minerals deposits implies a reduction of the natural stock, which lead to
declining ore grades and a tendency to excavate deeper and deeper into the crust, and more
commercially worthless material needs to be removed to obtain the same amount of ore than
before. In turn huge amounts of water and energy are required to extract minerals as it happens
with fossil fuels (Antonio Valero, Carpintero, Valero, & Calvo, 2014). A possible alternative
approach could be a reprocessing of tailings material to extract precious metals that ended up in
tails slurry or to remove toxic substances (Engels & Dixon-Hardy, 2009; Smith, 2017).
● To get a clearer picture of the impacts caused by the sulfidic tailings, it is proposed to do
a more profound study on this issue with an equal set of substances analyzed in both mining
systems, and performing a sensitivity analysis of the percentages of substances released to
ground water. As in the open pit mining the set of substances analyzed in slurry tailing was more
extensive than in alluvial mining, the direct comparison does not seem valid.
● As can be seen in the present study, there is no easy answer to which of the two mining
systems evaluated has a better environmental performance. The open pit mining system
presents higher values in human health damage category, whereas alluvial mining causes more
damage on ecosystem quality. To get a clearer picture it is proposed to invest in further
investigation on the exact composition and lixiviation of toxic substances in both mining systems,
and on secondary effects of land and water use above all in alluvial mining. Based on more
precise information some recommendations could be formulated to optimize both mining
systems and to reach a well-founded decision on which mining system is preferrable, taking into
account the local conditions of each mining site.
1.6 Acknowledgments
This project was carried out as part of the Doctoral Program funded by the Department of
Science and Technology of Colombia (COLCIENCIAS). The authors thank the mining
companies (open-pit and alluvial mining technology) for the provided data and
recommendations. This research was supported by the 1) School of Mines at the National
University of Colombia at Medellín; 2) Bioprocess and Reactive Flow Research Group; 3)
Faculty of Applied sciences, Department of Biotechnology at Delft University of Technology; 4)
Biotechnology and Society Research Group.
Sustainability Assessment of Alluvial and Open Pit Mining Systems in Colombia: Life Cycle Assessment, Exergy Analysis, and Emergy Accounting
1.7 Disclaimer
This research is focused on studying the sustainability of two different extraction mining
processes such as open pit and alluvial mining technologies. Data provided by mining
companies is confidential information used only to academic purposes.
References
Adiansyah, J. S., Rosano, M., Vink, S., & Keir, G. (2015). A framework for a sustainable approach to mine tailings management: Disposal strategies. Journal of Cleaner Production, 108, 1–13. http://doi.org/10.1016/j.jclepro.2015.07.139
Ã, G. M. M. (2007). Global trends in gold mining : Towards quantifying environmental and resource sustainability ?, 32, 42–56. http://doi.org/10.1016/j.resourpol.2007.05.002
Awuah-offei, K. (2009). Valuation of Belt Conveyor and Truck Haulage Systems in an Open Pit Mine using Life Cycle Assessment executive summaries Evaluation of Belt Conveyor and Truck Haulage Systems in an Open Pit Mine Using Life Cycle Assessment, (December 2015).
Awuah-offei, K. (2016). Energy ef fi ciency in mining : a review with emphasis on the role of operators in loading and hauling operations. Journal of Cleaner Production, 117, 89–97. http://doi.org/10.1016/j.jclepro.2016.01.035
Awuah-offei, K., & Adekpedjou, A. (2011). Application of life cycle assessment in the mining industry, 82–89. http://doi.org/10.1007/s11367-010-0246-6
Azapagic, A., Clift, R. (1999). Life cycle assessment as a tool for improving process performance: a case study on boron products, 4(3), 133–142.
Azapagic, A. (2004). Developing a framework for sustainable development indicators for the mining and minerals industry, 12, 639–662. http://doi.org/10.1016/S0959-6526(03)00075-1
Berger, M., van der Ent, R., Eisner, S., Bach, V.,Finkbeiner, M. (2014). Water accounting and vulnerability evaluation (WAVE): considering atmospheric evaporation recycling and the risk of freshwater depletion in water footprinting. Environmental Science & Technology, 48, 4521–4528.
Blengini, G.A., Garbarino, E., Solar, S., Shields, D.J., Vinai, R., Agioutantis, Z. (2012). Life cycle assessment guidelines for the sustainable pro- duction and recycling of aggregates: the Sustainable aggregates Resource Management Project (SARMa). J. Clean. Prod., 27, 177–181.
Boulay, A.-M., Bayart, J.-B., Bulle, C., Franceschini, H., Motoshita, M., Muñoz, I., Pfister, S. (2013). Water impact assessment methods analysis (Part B): Applicability for water footprinting and decision making with a laundry case study. International Journal of Life Cycle Assessment.
Boulay, A.-M., Motoshita, M., Pfister, S., Bulle, C., Muñoz, I., Franceschini, H., Margni, M. (2015). Analysis of water use impact assessment methods (part A): evaluation of modelling choices based on a quantitative comparison of scarcity and human health indicators. The International Journal of Life Cycle Assessment, 20, 139–160.
Boulay, A. M., Bare, J., Benini, L., Berger, M., Lathuillière, M. J., Manzardo, A., … Pfister, S. (2017). The WULCA consensus characterization model for water scarcity footprints: assessing impacts of water consumption based on available water remaining (AWARE). International Journal of Life Cycle Assessment, 1–11. http://doi.org/10.1007/s11367-017-1333-8
Bovea, M., Saura, Ú., Ferrero, J. L., Giner, J., Zorrilla, C. R., Ambiente, R., & Crevillente, C. (2007). LCA Case Studies Cradle-to-Gate Study of Red Clay for Use in the Ceramic Industry, 12(6), 439–447.
Burchart-Korol, D., Fugiel, A., Czaplicka-Kolarz, K., & Turek, M. (2016). Model of environmental life cycle assessment for coal mining operations. Science of the Total Environment, 562, 61–72. http://doi.org/10.1016/j.scitotenv.2016.03.202
Cano Londoño, N. A., Suárez, D. G., Velásquez, H. I., & Ruiz-Mercado, G. J. (2017). Emergy analysis for the sustainable utilization of biosolids generated in a municipal wastewater treatment plant. Journal of Cleaner Production, 141. http://doi.org/10.1016/j.jclepro.2016.09.033

Chapter 1 75
Castillo, J., Sanchez, J.M., Kunze, V., Araya, R. (2001). Large Mines and the Community: Socioeconomic and Environmental Effects in Latin America, Canada, and Spain. In World Bank Publications, Washington (pp. 87–142). Chile.
Chaabane, A., Ramudhin, A., & Paquet, M. (2012). Design of sustainable supply chains under the emission trading scheme. International Journal of Production Economics, 135(1), 37–49. http://doi.org/10.1016/j.ijpe.2010.10.025
Chazdon, R. L., Broadbent, E. N., Rozendaal, D. M. A., Bongers, F., Zambrano, A. M. A., Aide, T. M., … Poorter, L. (2016). Carbon sequestration potential of second-growth forest regeneration in the Latin American tropics. Science Advances, 2(5), e1501639–e1501639. http://doi.org/10.1126/sciadv.1501639
Chen, W., Geng, Y., Hong, J., Dong, H., Cui, X., Sun, M., & Zhang, Q. (2018). Life cycle assessment of gold production in China. Journal of Cleaner Production, 179, 143–150. http://doi.org/10.1016/j.jclepro.2018.01.114
Colombia Republic Bank. (2017). Price gold and silver. Retrieved August 16, 2017, from http://www.banrep.gov.co/es/precios-oro-plata-platino
Colombian Stock Exchange. (2017). Economic indices. Retrieved from http://en.bvc.com.co/pps/tibco/portalbvc
Cullen, J. M., & Allwood, J. M. (2010). Theoretical efficiency limits for energy conversion devices. Energy, 35(5), 2059–2069. http://doi.org/10.1016/j.energy.2010.01.024
de Faria, D.C., de Souza, A.A.U., de A. G. U. de S. (2009). Optimization of water networks in industrial processes. Cleaner Production, 17, 857–862.
Dharmappa, H., Wingrove, K., Sivakumar, M., Singh, R. (2008). Wastewater and stormwater minimisation in a coal. Cleaner Production, 8, 23–34.
Ditsele, O., Awuah-Offei, K. (2012). Effect of mine characteristics on life cycle impacts of US surface coal mining. The International Journal of Life Cycle Assessment, 17, 287–294.
Douni, I., Taxiarchou, M., Paspaliaris, I. (2003). ife Cycle Inventory Methodology in the Mineral Processing Industries (Book of pr). Milos Island, Greece. Dubiński,: International Conference: Sustainable Development Indicators in theMineral Industries.
Durucan, S., Korre, A., & Munoz-Melendez, G. (2006). Mining life cycle modelling: a cradle-to-gate approach to environmental management in the minerals industry. Journal of Cleaner Production, 14(12–13 SPEC. ISS.), 1057–1070. http://doi.org/10.1016/j.jclepro.2004.12.021
Engels, J., & Dixon-Hardy, D. (2009). Kaltails project, Kalgoorlie, Western Australia. Retrieved October 19, 2009, from http://www.tailings.info/casestudies/kaltails.htm
Ferreira, H., & Leite, M. G. P. (2015). A Life Cycle Assessment study of iron ore mining. Journal of Cleaner Production, 108, 1081–1091. http://doi.org/10.1016/j.jclepro.2015.05.140
Fuerstenau, D. W., & Abouzeid, A.-Z. . (2002). The energy efficiency of ball milling in comminution. International Journal of Mineral Processing, 67(1), 161–185. http://doi.org/http://dx.doi.org/10.1016/S0301-7516(02)00039-X
Fugiel, A., Burchart-Korol, D., Czaplicka-Kolarz, K., & Smoliński, A. (2017). Environmental impact and damage categories caused by air pollution emissions from mining and quarrying sectors of European countries. Journal of Cleaner Production, 143, 159–168. http://doi.org/10.1016/j.jclepro.2016.12.136
Gambatese, J.A., James, D.E. (2001). Dust suppression using truck-mounted water spray system. Journal of Construction Engineering and Management, 127(1), 53–59.
Giurco, D., McLellan, B., Franks, D. M., Nansai, K., & Prior, T. (2014). Responsible mineral and energy futures: Views at the nexus. Journal of Cleaner Production, 84(1). http://doi.org/10.1016/j.jclepro.2014.05.102
Gobain, S., Sa, I., & Frank, A. (2016). Dataset Information ( UPR ), 01(2014), 1–15. Goedkoop, M., Heijungs, R., Huijbregts, M., De Schryver, A., Struijs, J., Van Zelm, R. (2013). ReCiPe
2008 A Life Cycle Impact Assessment Method Which Comprises Harmonised Category Indicators at the Midpoint and the Endpoint Level Report I: Characterisation. PReConsultants.
Haque, N., & Norgate, T. (2014). The greenhouse gas footprint of in-situ leaching of uranium, gold and copper in Australia. Journal of Cleaner Production. http://doi.org/10.1016/j.jclepro.2013.09.033
Hansen, D.R., Mowen, M.M., Guan, L. (2009). Cost Management: Accounting and Control. South Western

Sustainability Assessment of Alluvial and Open Pit Mining Systems in Colombia: Life Cycle Assessment, Exergy Analysis, and Emergy Accounting
CENGAGE Learning.
Heijungs, R., & Guinée, J. B. (2007). Allocation and “what-if” scenarios in life cycle assessment of waste management systems. Waste Management, 27(8), 997–1005. http://doi.org/10.1016/j.wasman.2007.02.013
ICMM. (2012). Mining’s Contribution to Sustainable Development. In TechRep International. Council on Mining and Metals,. London.
Index mundi. (2016). Mineral de hierro vs Oro - Price Rate of Change Comparison. Retrieved August 24, 2017, from http://www.indexmundi.com/es/precios-de-mercado/?mercancia=mineral-de-hierro&meses=60&moneda=eur&mercancia=oro
International Organisation for Standardisation. EN ISO 14044 European Commission for Standardisation, (2006). Brussels.
ISO. ISO 14046:2014 International Organisation for Stan- dardization (ISO). Environmental Management e Water Footprint e Principles, Requirements and Guidelines (2014). Geneva, Switzerland.
Jolliet O, Müller-wenk R, B. J. (2004). UNEP/SETAC life cycle initiative UNEP/SETAC life cycle initiative the LCIA midpointdamage framework of the UNEP/SETAC life cycle initiative. The International Journal of Life Cycle Assessment, 9, 394–404.
Lawrence, P., Meigh, J., & Sullivan, C. (2002). The Water Poverty Index: An International Comparison. Keele Economics Research Papers, 19(October), 17. http://doi.org/10.1111/1477-8947.00054
Lesage, P., Reid, C., Margni, M., Aubertin, M., Deschenes, L. (2008). Use of LCA in mining industry and research challenges. In Symposium sur l’environment et les.
Liu, G., & Müller, D. B. (2012). Addressing sustainability in the aluminum industry: A critical review of life cycle assessments. Journal of Cleaner Production, 35, 108–117. http://doi.org/10.1016/j.jclepro.2012.05.030
Lottermoser, B. G. (2010). MineWastes. (Springer-Verlag Berlin Heidelberg, Ed.). New York. Mackenzie, S. G., Leinonen, I., & Kyriazakis, I. (2017). The need for co-product allocation in the life cycle
assessment of agricultural systems—is “biophysical” allocation progress? International Journal of Life Cycle Assessment, 22(2), 128–137. http://doi.org/10.1007/s11367-016-1161-2
Mangena, S. J., & Brent, A. C. (2006). Application of a Life Cycle Impact Assessment framework to evaluate and compare environmental performances with economic values of supplied coal products, 14. http://doi.org/10.1016/j.jclepro.2004.04.012
Memary, R., Giurco, D., Mudd, G., & Mason, L. (2012). Life cycle assessment: A time-series analysis of copper. Journal of Cleaner Production, 33, 97–108. http://doi.org/10.1016/j.jclepro.2012.04.025
Ministerio de Minas y Energía. (2016). Boletín estadisticos de Minas y Energía 2012 – 2016. http://doi.org/10.1017/CBO9781107415324.004
Ministry of Mines and energy. (2016). Política Mínera de Colombia Bases para la Minería del Futuro, 62. Mudd, G. M. (2010). The Environmental sustainability of mining in Australia: key mega-trends and looming
constraints. Resources Policy, 35(2), 98–115. http://doi.org/10.1016/j.resourpol.2009.12.001 Norgate, T. E., Jahanshahi, S., & Rankin, W. J. (2007). Assessing the environmental impact of metal
production processes. Journal of Cleaner Production, 15(8–9), 838–848. http://doi.org/10.1016/j.jclepro.2006.06.018
Norgate, T., & Haque, N. (2010). Energy and greenhouse gas impacts of mining and mineral processing operations. Journal of Cleaner Production, 18(3), 266–274. http://doi.org/10.1016/j.jclepro.2009.09.020
Norgate, T., & Haque, N. (2012). Using life cycle assessment to evaluate some environmental impacts of gold production. Journal of Cleaner Production, 29–30, 53–63. http://doi.org/10.1016/j.jclepro.2012.01.042
Northey, S. A., Mudd, G. M., Saarivuori, E., Wessman-J????skel??inen, H., & Haque, N. (2016). Water footprinting and mining: Where are the limitations and opportunities? Journal of Cleaner Production, 135, 1098–1116. http://doi.org/10.1016/j.jclepro.2016.07.024
Northey, S., Haque, N., & Mudd, G. (2013). Using sustainability reporting to assess the environmental footprint of copper mining. Journal of Cleaner Production, 40, 118–128. http://doi.org/10.1016/j.jclepro.2012.09.027
Orche, E. (1998). Minería americana del oro en las épocas precolombina y del imperio. Boletín Geológico Y Minero, 599–616.

Chapter 1 77
Padowski, J. C., Gorelick, S. M., Thompson, B. H., Kummu, M., Ward, P. J., & Moel, H. De. (2016). Measuring global water security towards sustainable development goals. Environmental Research Letters, 11(124015).
Pellegrino, J. L., Margolis, N., Justiniano, M., Miller, M., & Thedki, A. (2004). Energy Use, Loss and Opportunities Analysis: US Manufacturing and Mining. DOE/ITP (U.S. Department of Energy’s Iindustrial Technologies Program), (December), 169.
Pfister, S., Koehler, S., Hellweg, S. (2009). Assessing the environmental impacts of freshwater consumption in LCA. Environmental Science & Technology, 43, 1098–4104.
Pfister, S., Ridoutt, B. G. (2014). Water footprint: pitfalls on common ground. Environmental Science & Technology, 48, 4–4.
Pimentel, B. S., Gonzalez, E. S., & Barbosa, G. N. O. (2016). Decision-support models for sustainable mining networks: Fundamentals and challenges. Journal of Cleaner Production, 112, 2145–2157. http://doi.org/10.1016/j.jclepro.2015.09.023
Rio Tinto/Kennecott Utah Copper. Gold Environmental Profile: Life Cycle (2006). Romero Rueda, I., de Armas Teyra, M., Pérez Mena, B. M., & Guerrero Rojas, Y. (2012). Evaluación
energética de motores asincrónicos ante armónicos y desbalance de voltaje en una empresa minera. (Spanish). Energetic Evaluation of Asynchronous Motors in Presence of Harmonics and Unbalanced Voltage in Mining Enterprises. (English), 28(1), 49–61.
Seuring, S. (2013). A review of modeling approaches for sustainable supply chain management. Decision Support Systems, 54(4), 1513–1520. http://doi.org/10.1016/j.dss.2012.05.053
Shen, L., Muduli, K., & Barve, A. (2015). Developing a sustainable development framework in the context of mining industries: AHP approach. Resources Policy, 46, 15–26. http://doi.org/10.1016/j.resourpol.2013.10.006
Shi, F., Morrison, R., Cervellin, A., Burns, F., & Musa, F. (2009). Comparison of energy efficiency between ball mills and stirred mills in coarse grinding. Minerals Engineering, 22(7), 673–680. http://doi.org/http://dx.doi.org/10.1016/j.mineng.2008.12.002
Smith, M. (2017). Can African machine produce a promising future in Butte? Soundararajan, K., Ho, H. K., & Su, B. (2014). Sankey diagram framework for energy and exergy flows.
Applied Energy, 136, 1035–1042. http://doi.org/10.1016/j.apenergy.2014.08.070 Spitzley, D. V., & Tolle, D. A. (2004). Evaluating land-use impacts: Selection of surface area metrics for
life-cycle assessment of mining. Journal of Industrial Ecology, 8(1–2), 11–21. Sterman, J. D. (2012). Sustaining sustainability: creating a systems science in a frag- mented academy
and polarized world. In R. Weinstein, M., Turner (Ed.), Sustainability Science: the Emerging Paradigm and the Urban Environment (p. 21e58).
SuizAgua. (2015). Índice de Estrés Hídrico (WSI) de Colombia a escala de Subzona Hidrográfica. Retrieved August 22, 2017, from http://www.suizagua.org/noticias/indice-de-estres-hidrico-(wsi)-de-colombia-a-escala-de-subzona-hidrografica
Suppen, N., Carranza, M., Huerta, M., & Hernández, M. A. (2006). Environmental management and life cycle approaches in the Mexican mining industry. Journal of Cleaner Production, 14(12–13 SPEC. ISS.), 1101–1115. http://doi.org/10.1016/j.jclepro.2004.12.020
TI. (2014). Their Nature and Production. UNDP. (2016). United Nations Development Programme. Human Development Reports. Valero, A., Carpintero, Ó., Valero, A., & Calvo, G. (2014). How to account for mineral depletion . The
exergy and economic mineral balance of Spain as a case study. Ecological Indicators, 46, 548–559. http://doi.org/10.1016/j.ecolind.2014.07.021
Valero, A., Domínguez, A., & Valero, A. (2015). Exergy cost allocation of by-products in the mining and metallurgical industry. Resources, Conservation and Recycling, 102, 128–142. http://doi.org/http://dx.doi.org/10.1016/j.resconrec.2015.04.012
Vintró, C., Sanmiquel, L., & Freijo, M. (2014). Environmental sustainability in the mining sector: Evidence from Catalan companies. Journal of Cleaner Production, 84(1), 155–163. http://doi.org/10.1016/j.jclepro.2013.12.069
Wang, C. (2013). Comparison of HPGR- ball mill and HPGR - stirred mill circuits to the existing AG/SAG mill - ball mill circuits, (January), 169.
Weng, Z., Haque, N., Mudd, G. M., & Jowitt, S. M. (2016). Assessing the energy requirements and global

Sustainability Assessment of Alluvial and Open Pit Mining Systems in Colombia: Life Cycle Assessment, Exergy Analysis, and Emergy Accounting
warming potential of the production of rare earth elements. Journal of Cleaner Production, 139, 1282–1297. http://doi.org/10.1016/j.jclepro.2016.08.132
WULCA. (2015). Consensual Method Development: Preliminary Recommendation e AWaRe v1.1. Water Use in LCA (WULCA) working group. Retrieved November 10, 2015, from www. wulca-waterlca.org

2. Life Cycle Assessment of Exergy Indicators in Colombian Gold Mining Sector: Case Study in Open-Pit and Alluvial Mining Process
Abstract
Thermodynamic methods such as Exergy Analysis allow the assessment of environmental
load (environmental impacts), by calculating the entropy generated or exergy destroyed
due to the use of renewable and non-renewable resources along the entire productive
chain. In this research, Exergy Analysis will be approached as an extension of LCA to
ExLCA (Exergy Analysis of the Life Cycle), as complementary and not exchangeable tools,
for sustainability assessment of two gold mining systems in Colombia. Open-pit and
alluvial mining processes, from cradle to gate, under two perspectives: a) Exergy Analysis
methods taken from a life-cycle perspective, quantifying exergy life cycle efficiencies;
Cumulative Energy / Exergy Demand distinguishing between renewable and non-
renewable resources used in the process, and b) thermodynamic approach, quantifying
Cumulative Energy / Exergy Demand, input / output Exergy, destroyed Exergy, Relative
Irreversibility, Product Exergy Efficiency, Exergy efficiency and Sustainable Index (SI) for
all stages of both mining processes.
The most sustainable process in exergy terms would be the one that makes better use of
the available energy contained in renewable and non-renewable resources, interpreted as
a measure of its utility potential, and which inefficient use generates waste streams with an
exergy content that may be a measure of its potential to cause environmental damage. In
open-pit mining, 99.62% of the exergy used was destroyed, presenting an efficiency of

Sustainability Assessment of Alluvial and Open Pit Mining Systems in Colombia: Life Cycle Assessment, Exergy Analysis, and Emergy Accounting
0.37% and a Sustainability Index (SI) equal to 1. While in alluvial mining, 69% of input
exergy is destroyed, with an exergy efficiency of 31% and SI equal to 1.46. This implies
that alluvial mining process is more sustainable compared to open-pit mining.
Additionally, sensitivity analysis was carried out to evaluate the effect of the decrease of
invested work on exergy efficiency and Sustainable Index in thermodynamic approach,
and the effect of the improvement of electric and fossil energy consumption efficiency on
Cumulative Energy / Exergy Demand of renewable and non-renewable resources under
LCA approach.
KEYWORDS. Exergy Analysis, Life Cycle Assessment, Sustainable Index, mining process, gold extraction.
HIGHLIGHTS.
● Exergy analysis and Life cycle Assessment can be seen as complementary
and not exchangeable tools
● Exergy Analysis quantifies the sustainability of a process based on the
environmental burden generated by the use of resources
● Exergy efficiency improvement by reduction of exergy inputs and exergy
emissions / waste
2.1 Introduction
The growing demand in the consumption of goods and services translates into the
increase of extraction and production of primary metals, since the availability and access
to these resources are fundamental conditions to guarantee human welfare and global
economies functioning (ICMM, 2012b, Mancini, Benini, & Sala, 2015), despite the great
efforts of society in relation to the efficient use of resources, circular economy and
dematerialization itself, defined as the reduction in the amount of energy and materials
required for some economic function (European Commission, 2011, UNEP, 2012), with the
objective of reducing environmental impacts and maximizing the use of renewable
resources (Eco-efficiency) (WBCSD, 2000).
Mining sector, minerals processing and metals production, like other industrial sectors, are
under increasing pressure to reduce not only the renewable, non-renewable and energy

Chapter 2 81
sources they consume, but also the waste released into the air, soil and water. From there,
to materialize the concept of sustainability in different production systems, sustainable
energy resources and the efficient use of their waste are required (Dincer, I. & Rosen,
2007). Despite deep debates and conceptual ambiguities that have not allowed the
establishment of a universally accepted definition by the scientific community (Kharrazi,
Kraines, Hoang, & Yarime, 2014), far from being agreed on how to evaluate mining
sustainability, and even within similar contexts and analysis units (Fonseca, McAllister, &
Fitzpatrick, 2013). Being the main debate, whether the total capital stock should be kept
constant in monetary terms (weak sustainability) or in physical terms (strong sustainability)
to meet the needs of the present without compromising the ability of future generations to
supply their own needs (Neumayer, 2010).
As a result, mining sector is at a crossroads of two sustainable development challenges: 1)
short-and-long-term depletion of mineral resources, and 2) sustainable mining industrial
practices (Tuusjärvi, 2013). Despite the fact that many NGOs (Non-Governmental
Organization) have argued that "mining is intrinsically unsustainable" and that a truly
sustainable society will take less mineral from land each year (Young, J., Septoff, A.,
2002), contrary to the International holds Council on Mining and Metals (ICMM) "mining
activities should be kept to a minimum, since the sector plays an important role in
promoting sustainable development" (Fonseca et al., 2013; ICMM, 2012a)
With respect to the first challenge; even if recycling practices are carried out to reduce
primary metals extraction, recycling can not substitute primary metals production
completely, because it is a finite natural resource, since predictions show its constant
increase (extractive activity has increased around a factor of 8 between 1900 and 2005
(UNEP, 2011)) (Backman, 2008), even if recycling was 100%, extracted materials will still
be necessary for the manufacture of a growing economy (Jeswiet, 2017). In addition, land
can not be considered as an infinite reservoir of minerals (Antonio Valero, Carpintero,
Valero, & Calvo, 2014). At this point, it is important to mention what was developed by
Henckens et al. in 2017, from an optimistic and pessimistic view of the use of non-
renewable resources; humanity will find a solution to replace depleted resources by
functional substitutes, and humanity should not deliberately deprive future generations of
scarce resources, respectively (Henckens, Driessen, Ryngaert, & Worrell, 2016). These
visions are not mutually exclusive, in fact, they are reconcilable through of the

Sustainability Assessment of Alluvial and Open Pit Mining Systems in Colombia: Life Cycle Assessment, Exergy Analysis, and Emergy Accounting
implementation of different strategies. According to Valero & Valero, 2010a, in just one
century, humankind has depleted 26% of its world non-fuel reserves, being mercury, silver,
gold, tin, and arsenic the most depleted commodities. Henckens et al., 2014, gold is one of
the minerals classified as "scarse" that will be exhausted in 100 years if its extraction
continues at the rate at which it goes, therefore he suggests strategies such as: 1)
extraction needs to be reduced by 98% by 2050 to ensure that future generations can
enjoy the benefits of this resource, 2) replace the resource with a less scarce one that
provides the same function, 3) recycling more (Henckens et al., 2016). These measures
will achieve an equitable distribution of scarce resources between the stream and future
generations.
With respect to the second challenge; sustainable mining practices, Life Cycle
Assessment (LCA) has been accepted by the European waste policy as a useful tool to
measure the impact of products and services on the environment, either through raw
materials and resources consumption or for environmental deterioration caused by
pollutant emissions that take place on each life cycle stage, which leads to sustainable use
of resources (Lazarevic, D., Buclet, N .; Brandt, 2012). The unique feature of LCA is the
focus on a life-cycle perspective (Finnveden, Arushanyan, & Brandao, 2016). This implies
that system limits are so wide that they allow accounting for resources that enter the
system from nature and emissions that are released into the environment.
Likewise, there are thermodynamic methods that allow the assessment of environmental
load by calculating the entropy generated or the exergy destroyed by a process (method
based on exergy decrease or entropy increase) (Finnveden et al., 2016), since
environmental degradation is a problem associated, among others, with exergy losses
(destruction and disposal) (Dincer & Rosen, 2015; Niembro & Gonzalez, 2012). Methods
and data based on this approach have been developed for LCA as an environmental
impact category (Ayres, R.U.; Ayres, L.W.; Martinas, 1998; Dewulf, J.; Bösch, M.E.; De
Meester, B.; Van der Vorst, G.; Van Langenhove, H.; Hellweg, S.; Huijbregts, 2007;
Dewulf, Bösch, De Meester, et al., 2007; Finnveden, G.; Östlund, 1997; Gössling-
Reisemann, 2007; A. Valero, 2013). The ultimate goal is to preserve exergy through
greater efficiency, it is in other words, to degrade as little exergy as possible for a process,
in this way the environmental damage is reduced. Waste exergy emissions are another
relevant point; since the exergy contained in waste/emissions contains energy available

Chapter 2 83
that, since it is not in equilibrium with the environment, generally has the potential to
damage it. Only a few times can this change be perceived as beneficial (Dincer, I. &
Rosen, 2007).
On the one hand, Life Cycle Assessment limits the environmental impacts in three great
perspectives: damage to ecosystem, quality, and damage to human health (Zah, R., Böni,
H., Gauch, M., Hischier, R., Lehmann, M., Wäger, 2007). Its generalization and impact
weighting (weight), or comparison of these aggregations, is difficult because it is often
limited to very specific contexts, which makes it become a complex and controversial issue
in scientific community (Benetto, E., Dujet, C., Rousseaux, P., 2006; Benetto, Tiruta-
Barna, & Perrodin, 2007; Soares, S.R., Toffoletto, L., Decheˆnes, 2006). On the other
hand, Exergy Analysis allows to cover these deficiencies by means of accounting the
destroyed exergy as one of the negative effects related to resources demand. However, its
application also has technical and theoretical limitations regarding the evaluation of
sustainability (Maes & Van Passel, 2014). In relation to the application of Exergy Analysis
for mineral resources valuation, it can also measure physical facts related to the
composition, concentration or cohesion of minerals; however, it is unable to quantify social
aspects or certain environmental aspects that are also crucial in mining industry (Gabriel
Carmona, Whiting, Valero, & Valero, 2015).
For the above reasons, several studies propose to incorporate "Exergy Analysis of the Life
Cycle" (ExLCA) with the objective of expanding the limits of traditional exergy analysis and
thus explain the energy quality incorporated in products as a complementary analysis
(Corneliessen, 1997; Cornelissen RL, 2002; Gong, M., Wall, 1997; Portha, Louret, Pons, &
Jaubert, 2010; Rocco, Di Lucchio, & Colombo, 2017). Also, to evaluate and improve the
thermodynamic performance of productive systems, reducing energy resources depletion
(Rubio Rodríguez MA, De Ruyck J, Díaz PR, Verma VK, 2011), renewable and non-
renewable, throughout their life cycle. That is, exergy analysis can be part of LCA,
representing a method for Life-Cycle Impact Assessment (LCIA) of the resource (Dewulf, J
.; Bösch, ME; De Meester, B .; Van der Vorst, G Van Langenhove, H., Hellweg, S.,
Huijbregts, 2007). It should be clarified that ExLCA is complementary information and is
not exchangeable with conventional LCA, because environmental impacts of LCA can not
be reduced to a single exergy value (Alting, LL, Legarth, 1995, Portha et al., 2010),
considering that LCA provides more information than the obtained / reduced with exergy,

Sustainability Assessment of Alluvial and Open Pit Mining Systems in Colombia: Life Cycle Assessment, Exergy Analysis, and Emergy Accounting
because LCA addresses a broad category of impacts depending on the methodology that
is implemented.
In this research Exergy Analysis will be addressed as indicator of the energy quality of
resources, as an extension of LCA to ExLCA for the assessment of sustainability of two
gold mining systems in Colombia: open pit and alluvial mining, from cradle to gate, under
two perspectives:
1) Exergy Analysis methods taken from a life-cycle perspective, quantifying life
cycle exergy efficiencies; Cumulated Exergy Demand (CExD) (Bösch, ME,
Hellweg, S.; Huijbregts, M.; Frischknecht, 2007) and Cumulative Energy Demand
(CEnD) indicators (Frischknecht, R .; Wyss, F.; Büsser Knöpfel, S.; Lützkendorf, T:
Balouktsi, 2015) of open-pit and alluvial gold mining system from cradle to gate
taken from Ecoinvent 3.1 database. Both indicators quantify energy and exergy
used throughout gold life cycle, distinguishing between renewable and non-
renewable energy requirements.
2) Thermodynamic approach (Szargut, J .; Morris, DR; Steward, 1988; A Valero,
1998), where exergy data were taken from (Finnveden, G., Östlund, 1997, Kotas,
1985). These data were calculated from information on the chemical composition of
the material, basic thermodynamic data and reference state developed by Szargut
et al.(Szargut, J.; Morris, DR; Steward, 1988).
It is noteworthy that to date Exergy Analysis has not been applied to evaluate the exergy
cost of gold production, or of any other mineral, from the extractive process to casting and
molding of the ore of interest, going through profit and refining stages.
2.2 Exergy Analysis in mining sector
To speak of sustainability in the extraction of non-renewable resources, use rates of these
non-renewable resources must not exceed the rates at which renewable substitutes are
developed. Likewise, polluting emission rates should not exceed the corresponding
assimilation capacity of the environment (OECD, 1996). It should be noted that Exergy
Analysis is a way to strategically evaluate mineral resources, but it is not the only

Chapter 2 85
methodological tool to do it (Finnveden et al., 2016). However, several studies have used
Exergy Analysis and thermoeconomic tools for assessing the problem of non-renewable
resources depletion and scarcity degree (Gabriel Carmona et al., 2015; Alicia Valero &
Valero, 2010b; Antonio Valero et al., 2014); in the sense that exergy replacement cost
represents the effort needed by humankind to return minerals to their original conditions
from "commercially dead state" (Gabriel Carmona et al., 2015); in other words (depleted
planet, called Thanatia, where all minerals have been depleted and are dispersed, and all
fossil fuels have been burnt), to the initial conditions of composition and concentration in
which they were originally found and with the best technologies available (Calvo, Valero, &
Valero, 2015, Dominguez, Valero, & Valero, 2013, Antonio Valero et al., 2014). In 2017,
Whiting et al., evaluated the sustainability of fossil fuels and non-fuel mineral depletion by
a Life Cycle Exergy Assessment (LCEA) that goes from cradle to grave and, exergy
replacement cost that goes from grave to cradle (Whiting, Carmona, & Sousa, 2017).
Dominguez et al., state that those mines whose ore is more concentrated, do not require
large energy consumption in its extraction process and benefit due to its concentration, but
then its replacement cost will be high because minerals with high exergy content are
exhausting. Contrary to mines with low-grade ore such as gold that requires large amounts
of energy in their extraction process (high extraction exergy cost) and benefit but their
replacement costs are low (Dominguez et al., 2013). Carmona and collaborators in 2015,
conclude how the market price of minerals should reflect the physical value of the same;
the "price" that nature had to pay to produce a mineral given a deposit, and how Colombia
is losing its mineral wealth in exports sold to world market (Gabriel Carmona et al., 2015).
Likewise, Valero & Valero in 2010, estimated from geological data when the peak
production of 51 minerals could be achieved; the amount of exergy resources available in
the planet and the possible exhaustion behavior (Alicia Valero & Valero, 2010b) by the
combined methodology of Hubbert Peak Model and exergy approach also used for the
case of lithium (Calvo, Valero, & Valero, 2017 ).
Other works carried out under Exergy Analysis in mining sector are; recycling of ferrous
waste and production and use of a laptop (Finnveden et al., 2016), nickel production
(Domínguez et al., 2013), and factors that affect energy and exergy demand of mine water
management options (Nguyen, Ziemski, & Vink, 2014). It is noteworthy that the objective
of this research is not to evaluate replacement costs, it is to evaluate exergy cost of the
extractive process from cradle to gate; the former assesses the resource from entropic

Sustainability Assessment of Alluvial and Open Pit Mining Systems in Colombia: Life Cycle Assessment, Exergy Analysis, and Emergy Accounting
planet to mine, and the latter assesses the resource from mine to market (Szargut, J.,
Morris, DR, Steward, 1988).
2.3 Case study: open-pit and alluvial mining technologies in Colombia
The exploitation of gold in Colombia has two types of deposits based on geological
conditions of formation. Primary deposits, characterized by underground exploitation
(mineral deposits in situ where initial exploitation takes place in surface areas and then in
depth) (United Nations, 2016); and secondary or alluvial deposits with open sky
exploitation (those that after weathering processes of a primary reservoir have a natural
mechanical disintegration and gold particles are transported at certain distances by the
action of water, they tend to concentrate in water channels, giving rise to the known "gold
placer" (CIPRO, 2014; "Methods of mining exploitation.Vetas y Aluvión,” n.d.); United
Nations, 2016). 18% of gold production in Colombia comes from reef farms and 82% from
alluvial operations.
In this research, two types of extractive technologies will be addressed as a case study:
Open-pit and alluvial mining technology for the exploitation of a primary and secondary
deposit, respectively. Table 2-1 describes input and output flows of the two studied
systems shown in Figure 2-1 and Figure 2-2.
2.3.1 Open-Pit mining technology
In (Cano, summited) and Figure 2-1, the description of extractive process by open-pit
mining technology is detailed. Land is prepared by removing the vegetation cover and
organic soil by clearing and stripping stage, and residual biomass is stored for restoration
work in subsequent years by advance area. Mineral excavation is carried out by
conventional extraction methods; drilling, blasting, loading, and hauling.
Ore benefit is carried out through physical-chemical processes. It starts with size reduction
of the excavated mineral by means of primary crushing and primary and secondary milling.
Irrigation water is used in this step to minimize the impacts of total particulate matter (PST)
emitted. From the last stage, two process lines are obtained; the first flow goes to flotation
process to concentrate sulfide minerals containing gold (96.3% and 79.5% of the gold and
silver are recovered in this stage respectively), the mineral coming from flotation that can
Chapter 2 87
not be easily treated by conventional physical-chemical processes such as crushing,
milling, and flotation goes through an intensive leaching process (34.7% and 10% of gold
and silver are recovered in this process), and tailings are stored in tailing pond. Gold
Recoverable by Gravity (GRG) from milling process and the thickest fraction of flotation
concentrate feed the gravimetric concentration circuit.
Gold and other metals extracted from leaching process (cyanidation) and gravimetric
separation are adsorbed on activated carbon in a carbon-in-pulp circuit (CIP), which are
then released into elution column under certain conditions of pressure and temperature.
This gold-rich solution continues to electrowinning process where a selective precipitation
is made by electrolysis. Once the electrowinning of gold and silver is obtained, it is sent to
casting furnace. Assuming no losses in the smelting and casting process, 19,04 ton gold /
year and 21,55 ton / silver year are estimated, which are approximately 952 and 1077 of
gold and silver ingots respectively, with a 900 millesimal fineness.
Tailings are conformed by flotation tails; 96.5% of the total industrial wastewater generated
in beneficiation process, and leaching and carbon adsorption tails corresponding to the
remaining 3.5%. These last two are treated by detoxification system, where the solution of
circuit is oxidized by applying hydrogen peroxide (H2O2) before being stored in the tailings
pool, where a dewatering process is done and recirculation is carried out; 98% of the water
of the whole extraction and benefit process.
Sterile carbon resulting from elution process (gold uncharged carbon) is sent to carbon
reversing furnace to reactivate it and reuse it in CIP process. 83.98% of the water in the
entire process is recirculated.
It is noteworthy that services used for this process are not considered an operational
system (administrative offices, public services, lightweight vehicles, emergency support
plant).

Sustainability Assessment of Alluvial and Open Pit Mining Systems in Colombia: Life Cycle Assessment, Exergy Analysis, and Emergy Accounting
Figure 2-1: Description of open-pit mining technology.

Chapter 2 89
2.3.2 Alluvial mining technology
In (Cano, summited) and in Figure 2-2, description of the alluvial mining process is made
in detail. Once the selection of sediment deposits conducive to the exploitation of alluvial
gold (exploration stage) is made, preparation and access to the exploitation zone
continues; clearing and stripping by suction dredgers, where vegetation cover is changed
for bare soil by cutting and removing the superficial horizons of the soil (United Nations,
2016).
The start of the operation and benefit activities of the mineral occur simultaneously at the
exploitation place; mineral excavation (consists of the excavation of sand, gravel, clay and
mineral of interest) is carried out by Dipper dredger (Dredging line step), which pulls the
ore up from the riverbed. Followed by gold physical benefit by size classification
(mechanical screening), gravimetric concentration by hydraulic jigs and sluice boxes. As a
result of these first stages of the process, a waste line (sterile material such as gravel,
sands, clays and silts) that returns to the river again is obtained, and a second process
flow (wet), rich in gold mixed with sands, ferrous metals, and other impurities that continue
in the process line in order to increase the concentration and purification of gold (floatation
stage). 11% of ore (dry basis) enter to continuous flotation stage in benefit line to filtration
and separation stage, where 99% of the process stream moisture is removed chemically
for further concentration, with the objective of recovering 4% of the gold that was not
obtained during flotation stage. These gold-rich flows (wet basis) that come from flotation
and chemical separation process continue in drying line, where moisture is removed, and
simultaneously the separation of gold from ferrous minerals that corresponds to 3% of gold
rich flow line.
The gold obtained from concentrates is melted. Casting process is performed for 40
minutes with 20 kg of gold on average, using suitable flux loads. The tilting furnace, with a
crank and gear, facilitates emptying casting steel molds or ingot molds. For more efficient
combustion, diesel fuel is injected with pressurized air, with a consumption of 5 gal/h and
680 fuel m3/h of air. Assuming no losses in smelting and casting process; 3,103 ton/year
are melted, which is approximately 155 ingots with a 900 millesimal fineness (Cano,
summited).

Sustainability Assessment of Alluvial and Open Pit Mining Systems in Colombia: Life Cycle Assessment, Exergy Analysis, and Emergy Accounting
Tailings generated in filtration-separation and chemical separation stages are submitted at
Waste Tailings Treatment Plant (WTTP), where 99% of the water used in benefit process
is recovered and reused in the same process, together with the water obtained from
dewatering tailings pond. Ferrous metal is stored for futures economical uses, as a co-
product of the process.
It is noteworthy that services used in the process, not in an operational system
(administrative offices, public services, lightweight vehicles, emergency support plant,
domestic wastewater treatment and fuel by helicopter) are considered, therefore,
accounted.
Figure 2-2: Description of open-pit mining technology.

Chapter 2 91
Note: Exploration and stripping is not graphed because is a batch process, but are into account in the calculated

Sustainability Assessment of Alluvial and Open Pit Mining Systems in Colombia: Life Cycle Assessment, Exergy Analysis, and Emergy Accounting
Table 2-1: Input / output description in open-pit and alluvial mining technology.
Open-pit Mining
Technology
Alluvial (or placer) Mining
Technology
Unit
Input Water l 5.70, E + 07 to 9.79, E + 07 ton / year Energy (electrical) m 2,03E + 12 b 2.53E + 11 kJ / year Energy (gas) n 1.68, E + 10 c 1,60E + 07 kJ / year Energy (diesel) or 1,15E + 12 d 1,12E + 09 kJ / year Oxygen (air) p 3.75, E + 05 e 40 ton / year Others ** 1.01, E + 06 * 318.8 ton / year Output Inert material removed (sterile mineral) q 6.94, E + 07 f 1.06, E + 08 ton / year Vegetation cover harbors (clearing and stripping)
r 1.33, E + 03 g 60 ton / year
Sludge tails (wet weight) s 2.42, E + 07 h 4.52, E + 03 ton / year Energy losses t 1,24, E + 12 i 4.74, E + 10 kJ / year Emissions of substances to air, water and soil by combustion, detonation, trituration u, leakage etc.
---
Stored material containing mineral of interest v 3.98, E + 07 --- ton / year Ferrous Metal co-product (dry weight, 55% iron)
--- 1.55 ton / year
Silver co-product (dry weight) w 21.55 --- ton / year Gold (dry weight) x 19.05 j 3.10 ton / year Recycling Water y 4.79, E + 07 k 4.42, E + 05 ton / year
a Water in alluvial mining technology (ton / year): Exploration (1.25, E + 02), clearing and stripping (1.15, E + 06), float up of the suction dredger (1.00, E + 07), mechanical screening (7.46, E + 07), hydraulic jigs (1.12, E + 07), sluice boxes (4.84, E + 05), physical separation (4.46, E + 05), Waste Tailings Treatment Plant (3.80, E-01), Services (9.38, E + 03 water for domestic use, not used into the operational process).
b Electrical energy in alluvial mining technology (kJ / year): clearing and stripping (9,98, E + 10), dipper dredger (6,86, E + 10), mechanical screening (4,47, E + 10), hydraulic jigs (2 , 33, E + 10), sluice boxes (2.76, E + 09), physical separation (1.92, E + 08), filtration-separation (7.67, E + 07), chemical separation (1, 15, E + 08), WTTP (4.77, E + 07), tailing pond (6.95, E + 07), services (1.35, E + 10 to support suction dredger, dipper dredger and administrative offices).
c Gas energy (propane) in alluvial mining technology (kJ / year): drying and separation of ferrous minerals (1.60, E + 07).
d Diesel fuel (derived from petroleum) in alluvial mining technology (kJ / year): Exploration (2.86, E + 08), Casting and molding (4.33, E + 06), Services (8.34, E + 08 to support suction dredger, dipper dredger).
e Oxygen (air) in alluvial mining technology (ton / year): drying and separation (20), tailing pond (20)
f Inert material removed (sterile mineral in dry weight) in alluvial mining technology (ton / year): reserves evaluation, exploration (5.61, E + 02); reserves evaluation, clearing and stripping (3.65, E + 07); mineral extraction, dipper dredger (6.95, E + 07).
g Vegetation covered harbors in alluvial mining technology (ton / year): clearing and stripping (60 corresponding to 140 hectares)
h Sludge tails (wet weight) in alluvial mining technology 4.52, E + 03 with 98.7% humidity.

Chapter 2 93
i Energy losses in alluvial mining technology (KJ / year): clearing and stripping (9,98, E + 09), dipper dredger (6,86, E + 09), mechanical screening (2,41, E + 10), hydraulic jigs (2 , 33, E + 09), sluice boxes (7.73, E + 08), physical separation (1.92, E + 07), filtration-separation (2.15, E + 07), chemical separation (3, 22, E + 07), WTTP (1.34, E + 07), tailing pond (1.94, E + 07), services (3.10, E + 09 to support suction dredger, dipper dredger and administrative offices), drying and separation of ferrous minerals (1.60, E + 06), Exploration (1.80, E + 08), Casting and molding (1.99, E + 03).
j Gold (dry weight) in alluvial mining technology (ingot / year): 155 each 20kg.
k Recycling in alluvial mining technology, water treated from WTTP to physical separation.
l Water in open-pit mining technology (ton / year): clearing and stripping (5.65, E + 06 water for irrigation to minimize PST in the air), mineral excavation (5.08, E + 06 06 spray irrigation systems to minimize PST in the air), secondary milling (3.59, E + 07), gravimetric separation (8.32, E + 06), floatation (2.08, E + 06), elution (6.96 , E + 05). Primary crushing step is not significant for irrigation systems, which is not quantified into the process.
* Others in alluvial mining technology (ton / year): services (7.3 organic material in domestic wastewater), chemical separation (emulsifying agent 0.1, foaming agent 0.23, flotation agent 0.48), WTTP (coagulating agent 0, 45), Casting and molding (Sodium borate 232.68 a fluxing agent, calcium carbonate 77.56).
m Electrical energy in open-pit mining technology (kJ / year): mineral excavation (8.08, E + 10), primary crushing (7.82, E + 10), secondary milling (1.36, E + 12) , gravimetric separation (2,15, E + 09), floatation (1,97, E + 11), leaching (4,45, E + 10), carbon adsorption (8,05, E + 09), detoxification (2 , 02, E + 08), tailing pond (5,34, E + 10), elution and carbon regeneration (3,90, E + 10), casting and electro-winning (7,99, E + 09), other services (1.55, E + 11 administrative offices, public services).
n Gas energy (liquefied petroleum gas) in open-pit mining technology (kJ / year): other services (1.68, E + 10).
o Diesel fuel (derived from petroleum) in open-pit mining technology (kJ / year): mineral excavation (1,14, E + 12), casting and electro-winning (1,35, E + 09), other services (5,35, E + 09 lightweight vehicles ).
p Oxygen (air) in open-pit mining technology (ton / year): floatation (2.27, E + 04), leaching (3.75, E + 05).
q Inert materials removed (in mineral sterile dry weight) in open-pit mining technology (ton / year): reserves evaluation, clearing and stripping (1.09, E + 03); mineral excavation (6.93, E + 07).
r Vegetation covered harbors in open-pit mining technology (ton / year): clearing and stripping (1.33, E + 03 vegetation covered harbors).
s Sludge tails (wet weight) in open-pit mining technology (ton / year): 2.42, E + 07 with 2.36, E-04% humidity.
t Energy losses open-pit mining technology (KJ / year): mineral excavation (7,48, E + 11), primary crushing (1,49, E + 10), secondary milling (2,59, E + 11), gravimetric separation (2.15, E + 08), floatation (5.50, E + 10), leaching (4.45, E + 09), carbon adsorption (3.62, E + 09), detoxification (5, 64, E + 07), tailing pond (5,34, E + 09), elution and carbon regeneration (1,09, E + 10), casting and electro-winning (1,65, E + 09), other services (1.39, E + 11 administrative offices, public services).
u Emissions, Total Suspended Particles (PST) in open-pit mining technology (ton / year): mineral excavation (1.75, E + 03), primary crushing (2.41, E + 01), secondary milling (7, 09, E + 01), tailing pond (3.75, E + 02).
v Stored material containing mineral of interest (ton / year): 55% of the extracted material (3.98, E + 07) with a significant gold concentration is stored (3.98, E + 07) for beneficiation in the future when mine is reaching its end of life.
w Silver (dry weight) in open-pit mining technology (ingot / year): Average 1078 each 20kg.

Sustainability Assessment of Alluvial and Open Pit Mining Systems in Colombia: Life Cycle Assessment, Exergy Analysis, and Emergy Accounting
x Gold (dry weight) in open-pit mining technology (ingot / year): Average 952 each 20kg.
y Recycling in in open-pit mining technology, water treatment from WTTP to all the process.
** Others in in open-pit mining technology (ton / year): mineral excavation (1.41, E + 04 Ammonium Nitrate - Fuel Oil ANFO, 95% ammonium nitrate and 5% kerosene), chemical separation (1.08, E + 01 NaOH; 8.99, E + 01 NaCN), floatation (Potassium Ammonium Xanthate 5.29, E + 02, 4.37, E + 02 flotation agent), leaching (1.87, E + 03 NaCN, 2.19, E + 03 CaO), carbon adsorption (2.67, E + 03 activated carbon), detoxification (1.15, E + 02 CaO, 1.10, E + 00 H 2 O 2 , 1.27, E + 02 Na2S2O5), tailing pond (flocculating agent 3,11, E + 02), elution and carbon regeneration (9,91, E + 05 inorganic chemicals)
2.4 Methodology
Having finite natural resources and large energy demands, it becomes increasingly
important to understand the mechanisms that degrades energy and resources, and to
develop systematic approaches for improving systems and thus also for reducing the
environmental impact (Dincer, I. & Rosen, 2007). An energy balance can not explain the
degradation of energy or resources during a process, and does not quantify the usefulness
or quality of energy and material quantities (eg, input, product, and waste flows for a
system) (Dincer & Rosen, 2015). Exergy Analysis can quantify the quality of energy by
improving process efficiency. That is, process sustainability increases when exergy
efficiency is closer to process ideality.
As mentioned above, the objective of this research is to evaluate and compare the
sustainability of the open-pit and alluvial mining technologies in Colombia through exergy
indicators; thermodynamic analysis technique based on lineal combination of the first and
second law of thermodynamics, which focuses on calculating the availability of each
streams involved in a process to perform work, that decreases due to destroyed exergy
depending on a reference environment (Szargut, Morris, & Steward, 1988). For this 1) the
stages of each mining process will be identified, where the greatest exergy losses are
presented in terms of destroyed exergy. Likewise, other exergy indicators will be
calculated, such as Cumulative Energy / Exergy Demand, Input / Output Exergy, Relative
Irreversibility, Exergy Efficiency, Exergy Efficiency of the Product (for valorisation of those
residues with usable energy content), and Sustainable Index for all the stages of both
mining processes. 2) Thermodynamic indicators obtained previously will be complemented
with those obtained by taking exergy assessment (LCEA) from cradle to gate, Ecoinvent
3.1 database, in order to quantify energy life cycle and exergy demand of the extractive

Chapter 2 95
process. Cumulative Exergy Demand (CExD) is defined as the sum of exergy of all
resources required to provide a process or product (Bösch, Hellweg, Huijbregts, &
Frischknecht, 2007b, Dewulf, Bösch, Meester, et al., 2007), and Cumulative Energy
Demand (CED) as the sum of the total primary energy required to provide a process or
product (Niembro, 2009). 3) For LCA approach, sensitivity analysis is to be used to
evaluate CEnD and CExD categories, assuming an improved efficiency in electricity (CFE)
and fuel (diesel) (CFD) up to 30%. While for thermodynamic approach, sensitivity analysis
was carried out to evaluate the effect of a decrease in the work invested in the process (up
to 40%) on Exergy Efficiency and Sustainable Index (SI).
2.4.1 Energy / Exergy indicators for Life Cycle Assessment perspective
Exergy Analysis method from a Life-Cycle perspective (Corneliessen, 1997; Cornelissen
RL, 2002; Gong, M., Wall, 1997; Rocco, Di Lucchio, & Colombo, 2017), quantifying life
cycle exergy efficiencies; Cumulated Exergy Demand indicator (CExD) (Bösch, ME,
Hellweg, S., Huijbregts, M.; Frischknecht, 2007) and Cumulative Energy Demand (CEnD)
(Frischknecht, R.; Wyss, F.; Büsser Knöpfel, S.; Lützkendorf, T., Balouktsi, 2015) from
"cradle to gate" taken from Ecoinvent 3.1 database and 1 kg of gold as Functional Unit
(FU).
The objective of Cumulative Energy Demand Indicator (CEnD) is to quantify the energy
used throughout gold life cycle (cradle to gate), distinguishing between renewable and
non-renewable energy requirements. CED-indicator is split up into eight categories for
Ecoinvent 3.1 database expressed in MJ equivalents as shown in Table 2-2.
Table 2-2: Cumulative energy demand (CEnD) of impact assessment method implemented in Ecoinvent. Taken from (Hischier et al., 2010).
SUBCATEGORY INCLUDES Non-renewable resources
Fossil hard coal, lignite, crude oil, natural gas, coal mining off-gas, peat Nuclear uranium Primary forest wood and biomass from primary forests
Renewable resources
Biomass wood, food products, biomass from agriculture, eg straw Wind wind energy Solar solar energy (used for heat & electricity) Geothermal geothermal energy (shallow: 100-300m) Water run-of-river hydro power, reservoir hydro power

Sustainability Assessment of Alluvial and Open Pit Mining Systems in Colombia: Life Cycle Assessment, Exergy Analysis, and Emergy Accounting
Cumulative Exergy Demand indicator (CExD) is introduced to depict total exergy removal
from nature to provide a product, summing up the exergy of all resources required. CExD
assesses the quality of energy demand and includes the exergy of energy carriers, as well
as non-energetic materials (Bösch, Hellweg, Huijbregts, & Frischknecht, 2007a) from
"cradle to gate". This indicator is split up into eight categories for Ecoinvent 3.1 database
expressed in MJ equivalents as shown in Tabla 2-3. There is no impact category for
geothermal energy, because no characterization is assigned to 'Energy, geothermal' since
this elementary flow is mainly input to heat pump systems. It was assumed that the
average temperature of heat sources for heat pumps is below the temperature in reference
environment (298.15 K), which is applied for calculating characterization factors (Bösch et
al., 2007a; Hischier et al. , 2010).
Tabla 2-3: Cumulative exergy demand (CExD) of impact assessment method implemented in Ecoinvent. Taken (Hischier et al., 2010).
CATEGORY SUBCATEGORY NAME CUMULATIVE
EXERGY DEMAND
Non-renewable resources
Fossil non-renewable energy resources, fossil Nuclear non-renewable energy resources, nuclear Primary forest non-renewable energy resources, primary
forest metals non-renewable material resources, metals minerals non-renewable material resources, minerals
Renewable resources
Biomass renewable energy resources, biomass Wind, renewable energy resources, kinetic (in wind),
converted Solar renewable energy resources, solar, converted Water renewable material resources, water Water renewable energy resources, potential (in
barrage water), converted
2.4.2 Thermodynamic approach of Energy / Exergy indicators
Unlike the first law of thermodynamics, the second law emphasizes that each process
generates entropy, which indicates that the loss of energy quality plays an important role in
calculating energy efficiency (Wu, Wang, Pu, & Qi, 2016). In this sense, exergy analysis is
a technique based on lineal combination of the first and second law of thermodynamics
which provides an alternative process comparison (Krahl, Aur, Pinto, Uff, & Bv, 2010),
allowing to identify how near to ideality the process is, and the causes and location of
energy losses and environmental impacts (Kanoglu, M., Dincer). A direct way to emit less
waste to the environment is to have more efficient processes and use fewer resources,

Chapter 2 97
thus, this analysis allows to improve and optimize the design of the evaluated process.The
exergy of a resource, counts the minimum work necessary to form it from its constituent
elements found in reference environment (Szargut, Morris, & Steward, 1988, Alicia Valero
& Valero, 2010a), or the maximum amount of work that can be obtained by carrying the
components of the resource to its most common state in natural environment, depending
on the reference (Szargut et al., 1988); in a concentrated mineral deposit "contrasts" with
reference environment and thus has exergy, which increases with concentration of mineral
(Dincer & Rosen, 2015). The Reference Environment (RE) can be assumed to be a
thermodynamically dead planet; is a hypothetical and homogeneous earth (it is assumed
that thermodynamic change occurs in RE (Rosen, 2007b; Szargut et al., 2005)), where all
substances have been reacted and mixed, without kinetic or potential energy, and at
ambient pressure and temperature (Alicia Valero & Valero, 2010b). In this work,
thermodynamic data and reference state were taken from Szargut et al. (Szargut, J.;
Morris, DR; Steward, 1988).
In gold extraction process using open pit mining and alluvial mining, analysis stages were
described by (Cano, summited). It is necessary to establish flows of matter and energy at
each stage, as well as the composition of each stream involved, to perform an exergy
analysis, it is necessary to know the standard chemical exergy of each component. For the
case of minerals, standard chemical exergy used values reported by (Kotas, 1985);
engraving, sands and clays were modeled by the most representative compounds in order
to take a characteristic species2 (Wedepohl, 1995) and give a value of chemical exergy
(Table E-1, Appendix E), this leads to an error of less than 5% with respect to composition.
Additionally, Table E-2 (Appendix E) presents chemical properties of pure compounds
used in both mining systems.
The exergy of each stream is calculated like the contribution of entropy (sum of the mass
fraction and the standard energy of each compound) plus the exergy of mixture (equation
2 To both systems; open-pit and alluvial mining technology, the composition of the mineral excavated were taken as the composition of the mainly element of the continental crust reported in “The composition of the continental crust” (Wedepohl, 1995) Table A-1. In the case of engraving, sands and clays in alluvial mining technology the composition is the same.

Sustainability Assessment of Alluvial and Open Pit Mining Systems in Colombia: Life Cycle Assessment, Exergy Analysis, and Emergy Accounting
(2.1). In the case of this balance, it was assumed that the mixture is ideal, this is valid
because gold composition in mineral mixture is very diluted, so it can be said that activity
coefficient is ideal due to the chemical activity between the components is negligible
(Szargut, J .; Morris, DR; Steward, 1988).
Since all streams that come out of the process end up dissipating their energy into the
environment and are not used for the generation of useful work, the term of physical
excerption has been neglected from the calculation of each stream specific exergy.
For the case of chemical substances that participate in the process and are not tabulated
in references, like in the case of flocculation and flotation agents, foamers and other
substances used during gold extraction process, their chemical exergy is calculated using
the free energy of Gibbs and the Joback method of contribution of atomic groups to
estimate their thermodynamic properties (Joback, KG & Reid, 1987) Eq. (2.2). (Appendix
F).
+ + + + → + + + = 2 + 2 𝑙 + 2 𝑔 + 2 𝑔 − ∆ , ∆ , = . +∑ 𝑖
(2.2)
In Ec. 2, N is the number of atomic group (ie. , , phenyl radical. Etc.) and 𝑖 is the
contribution of this group to Gibbs formation energy, tabulated in Perry, Green, & Maloney,
1997. The average errors reported with this method are of the order of 8 to 9 kJ / mol.
For the case of vegetal cover, its chemical exergy was calculated with the method
developed by Qian et al., (Qian et al., 2017). Where ∆ °, is the standard specific entropy
change of the combustion reaction in kJ kg -1 K -1 Eq. (2.3) and, the standard specific
entropy was calculated by the correlation proposed by Song et al., (Song GH, Shen LH,
2011) Eq . (2.4) and Eq. (2.5)
𝜖 ℎ =∑ 𝜖 ℎ ,= + ∑ ln=
(2.1)

Chapter 2 99
∆ ° = ° + ° + ° + ° − + − + °− °
(2.3)
° = . + . + . + . + . , . − . −
(2.4) = 2 + 2 𝑙 + 2 𝑔 + 2 𝑔 + + ∆ °
(2.5)
Where ° , ° , ° , ° , ° are standard entropies of carbon dioxide, water
(liquid phase), nitrogen, sulfur dioxide and oxygen, respectively, kJ mol -1 K -1.The
appendix G explains in more detail.
Finally, the exergy balance in each stage of the process was developed considering the
work done and all the inputs and outputs to find exergy destroyed ( by stage Eq.(2.6) = �̇� 𝜖 ℎ , − ̇ 𝜖 ℎ , + − (2.6) = − �̇� ℎ − ℎ + ̇ − + �̇� 𝜖 ℎ , − ̇ 𝜖 ℎ ,+ −
Efficiency of the first law
Energy efficiency, defined as "total energy for useful products or activities" (Patterson,
1996). It evaluates how energy content of inputs or raw material, whether renewable or
non-renewable, is exploited using first law balances Eq. (2.7). Relationship between
energy produced ( and total input energy ( (Szargut, J.; Morris, DR; Steward,
1988)
(2.7)
● Efficiency of the second law (exergy efficiency) 𝜏 exergy efficiency, used to measure a resource degree of use (Szargut, J .; Morris, DR;
Steward, 1988), provides a tool to identify waste and energy losses of the process by
detecting areas that require technological improvements (Talens, l., Villalba, G. Gabarrell,
2007). In this way, the performance of the system is evaluated to convert exergy input into
exergy associated with products (It is expressed under equation (2.8) as the relation between
produced exergy ( usable by the system and total input exergy ( (Szargut, J .;
Morris, DR; Steward, 1988.
𝜂 = 𝑟 𝑑𝑖

Sustainability Assessment of Alluvial and Open Pit Mining Systems in Colombia: Life Cycle Assessment, Exergy Analysis, and Emergy Accounting
(2.8)
● Cumulative Energy Demand (CEnD)
Cumulative Energy Demand (CEnD) is used to assess energy demand of primary energy
sources throughout the productive chain. The quality of energy is not taken into account. It
is an indicator of environmental impacts with regard to energy consumption of the
systems. Eq. (2.9) is the result of the sum of each i process energy demand.
(2.9)
● Cumulative Exergy Demand (CExD)
The Cumulative Exergy Demand (CExD) indicator is introduced to depict total exergy
removal from nature to provide a given good or service, summing up the exergy of all
required resources (Szargut, J., Morris, DR, Steward, 1988). CExD assesses the quality
of energy demand and includes exergy of energy carriers as well as of non-energetic
materials (Bösch et al., 2007b). CExD is equivalent to the definition of cumulative exergy
(CExC) of Szargut, 2005, is expressed by the sum of exergy demand of each process is,
Eq. (2.10).
(2.10)
● Exergy efficiency of the product
is defined as the amount of exergy that the product I i ( − contains with respect to
the amount of total exergy that enters the process Eq. (2.11). This relationship
between exergy of the analyzed product and total input exergy indicates the fraction of
available exergy used by the stream of interest (Szargut, 2005).
(2.11)
Ecological efficiency
It is the difference of the renewable exergy resources − and non-renewable . This
indicator considers the environmental impact associated with the use of renewable
𝜏 =
∑=
∑ =
= −

Chapter 2 101
resources compared to non-renewable resources. When non-renewable resources are not
used, the indicator acquires an value of 1, and when only non-renewable resources are
used, the indicator will be equal to the exeregy efficiency as shown in equation (2.12)
(Toxopeus, Lutters, & Van Houten, n.d.)
(2.12)
Exergy Sustainability index
The relationship between exergy and environment provides a knowledge of environmental
impacts associated with the implementation of a process. When usable exergy of a system
approaches 100%, environmental impacts approach zero. Szargut in 2005 defines Exergy
Sustainability index (with respect to exergy efficiency as the inverse of the depletion
number (Eq.(2.13)) (Dincer, I. & Rosen, 2007; Szargut, 2005).
Where SI is Sustainability Index, is Depletion Number, is the exergy destroyed in
system (irreversibilities) and is the exergy input of the system
(2.13)
(2.14)
● Relative irreversibility
It allows to visualize the contribution to the exergy destroyed by each process within the
system. It is defined as exergy destroyed in i subprocess over total exergy destroyed. Eq.
(2.15) (Kotas, 1985).
(2.15)
Environmental exergy indicator
Finally, is adressing the sustainability index proposed by Velasquez et al., 2009, called
the environmental exergy indicator, which relates the exergy of the products and the
exergy of the renewable resources , non-renewable − , destroyed exergy
= − +− +
=
=
=

Sustainability Assessment of Alluvial and Open Pit Mining Systems in Colombia: Life Cycle Assessment, Exergy Analysis, and Emergy Accounting
and exergy of deactivation defined as the exergy necessary for the
treatment of the waste generated in the process (Velásquez Arredondo, 2009).
(2.16)
Environmentally unfavorable when < <
Internally and externally reversible process, with the exclusive use of renewable resources =
Environmentally favorable >
Internally and externally reversible process, with the exclusive use of renewable resources → ∞
2.5 Results and discussion
2.5.1 Energy/Exergy indicators from life cycle assessment perspective
This section is addressing the Cumulative Energy Demand (CEnD) and Cumulated Exergy
Demand (CExD) indicators under life cycle perspective; boundaries system: cradle to gate,
Functional Unit 1Kg gold, Ecoinvent 3.1 database. Economical allocation was carried out
under economic value conditions; for open pit mining, Colombian market gold and silver
average selling price for 2016 was equal to € 36.21 and € 0.50 per gram respectively, with
gold / silver price ratio equivalent to 73. The material deposited after extraction with a
slightly lower gold and silver content, which is stocked for later beneficiation was allocated
by its valued gold and silver content, splitting up the extraction nearly by half. Since both
the price and the production (mass) of iron in alluvial mining is not significant compared to
gold ore (with average selling price of iron ore equal to € 3,00E-05 per gram), the
economic allocation was not considered in this system. For this reason, in open-pit mining
process, results under this approach are taken only for gold production, in order to make a
more objective comparison between both productive systems.
Due to the lack of LCI data for Colombian electrical matrix, the electricity mix process for
Colombia has been designed, where it took energy average (2012-2016) for different
= ∑∑ − +∑ +∑ +

Chapter 2 103
energetic resources: hydraulic (70.39%), gas (15 , 15%), coal (8.41%), wind (0.10%),
biomass (0.7%), fuel oil (0.66%), Gas Jet-A1 mix (1.75%), ACPM (2.70%), JET-A1
(0.04%), others (0.09%) (Cano, summited, Ministry of Mines and Energy, 2016).
Cumulative Energy Demand (CEnD)
Figure 2-3 a) and b) present the CEnD contribution for renewable and non-renewable
resources of open-pit and alluvial mining process phases (input materials, mining, mine
operation, refining and fundition) respectively. In both mining systems, the highest energy
consumption is presented in input materials phase, followed by extraction phase.
The total CEnD in open-pit mining technology for gold production is equal to 2.51E + 05
MJ-eq. The greatest contribution to energetic process comes from fossil energy resource
and water resource for hydroelectric generation, with value equal to 1,65E + 05 MJ-eq
(65.88% of the total) and 7,89E + 04 MJ -eq (31.42% of the total) respectively. 57.30% of
the fossil energy is consumed in electricity mix for Colombia (consumed in greater
proportion in grinding mill process), followed by market for diesel (19.81%), extraction
process (14.44%), organic and inorganic chemical production (7.44%) and market for
liquefied petroleum gas (0.74%) (consumed in several services of mining process), among
the most relevant. Likewise, 98.54% of the energy content of water used for hydroelectric
generation corresponds to the electricity mix generation for Colombia, followed by
extraction process (1.10%). The 80.89% of the cumulative energy demand comes from
gold production (2.51E + 05 MJ-eq), 17.86% (5.54E + 04MJ-eq) of stocked material and
1.25% (3.89E + 03MJ-eq) of silver for a cumulative total exergy demand equal to 3.75E +
05 MJ-eq.
Figure 2-3: Cumulative Energy Demand (CEnD) for each stage of a) open-pit mining process and b) alluvial mining process.

Sustainability Assessment of Alluvial and Open Pit Mining Systems in Colombia: Life Cycle Assessment, Exergy Analysis, and Emergy Accounting
a)
b)
For alluvial mining technology, total CEnD is equal to 9,12E + 04 MJ-eq, the largest
energetic contribution comes from water potential energy and fossil resource with a value
MJ-eq
MJ-eq

Chapter 2 105
equal to 8.93E + 04 MJ-eq (97.83% of the total) and 1,80E + 03 MJ-eq (1.97% of the total)
respectively.
99.98% of water energy potential is consumed in electricity production (hydro, run-of-river).
53.23% of fossil energy resource is consumed in electricity production (hydro, run-of-river),
following services (22.29%), casting and molding (10.10%), market for diesel (8, 74%) and
inorganic chemical production (4.67%) stages. Approximately 100% of energy resources
consumption come from gold production.
Cumulative Exergy Demand (CExD)
In the same way, Figure 2-4 a) and b) present the Cumulative Exergy Demand (CExD) to
open-pit and alluvial mining technologies respectively, where there is no significant
difference with respect to the Cumulative Energy Demand (CEnD), keeping the same
behavior. The total contribution of CExD from gold production by open-pit mining is equal
to 3.07E + 05 MJ-eq, the greatest contribution is given by the consumption of fossil, non-
renewable energy resources with a value equal to 1, 64E + 05 MJ-eq (53% of the total),
distributed as follows: electricity mix for Colombia (56.84%), market for diesel (20.20%),
extraction (14.57%), organic and inorganic chemicals production (7.39%) and market for
liquefied petroleum gas (0.75%) among the most representative. CExD attributable to
hydroelectricity generation is equal to 7.89E + 04 MJ-eq (26% of total), where 98.54%
corresponds to electricity mix for Colombia. The water resource used in different stages of
mining process has also a significant exergy contribution, with a value equal to 5,49E + 04
MJ-eq (18% of the total); where 47.01% comes from electricity mix for Colombia, 40.03%
comes from water extracted from the river (used in different stages of the process,
presenting highest consumption in primary crushing process) and 7.82% used in extraction
process.
It is noteworthy that 81.77% of cumulative demand for exergy comes from gold production
(3.07E + 05 MJ-eq), 16.96% (6.36E + 04 MJ-eq) of stocked material and 1.27% (4,75E +
03 MJ-eq) of silver for a cumulative total exergy demand equal to 3,75E + 05 MJ eq.
Figure 2-4: Cumulative Exergy Demand (CExD) for each stage of a) open-pit mining process and b) alluvial mining process.

Sustainability Assessment of Alluvial and Open Pit Mining Systems in Colombia: Life Cycle Assessment, Exergy Analysis, and Emergy Accounting
a)
b)
MJ-eq
MJ-eq

Chapter 2 107
Total CExD in alluvial mining technology was equal to 1.50E + 06 MJ-eq as expected,
because water resource presents the greatest exergy contribution being the critical input
resource (Figure 4) with a value equal to 1 , 41E + 06 MJ-eq; this significant contribution of
93.84% occurs mainly in the extraction phase (trommel process). Followed by water
resource used in electrical generation (run-of-river power plant) with a value equal to
8.92E + 04 MJ-eq (6.04%). Approximately 100% of the total CExD comes from gold
production.
Finally, Figure 2-5, Table 2-4 and Table 2-5 summarize the comparison between CEnD
and CExD indicators for open-pit and alluvial mining system.
Figure 2-5: Comparison between CEnD and CExD for each stage of a) open-pit mining process and b) alluvial mining process.
a)
MJ-eq

Sustainability Assessment of Alluvial and Open Pit Mining Systems in Colombia: Life Cycle Assessment, Exergy Analysis, and Emergy Accounting
-
b)
MJ-eq

Chapter 2 109
Table 2-4: Cumulative Energy (CEnD) / Exergy Demand (CExD ) for each stage in open-pit mining process.
Cumulative Energy (CEnD) / Exergy Demand (CExD) from
Biomass, renewable energy resources,
biomass
Fossil, non-renewable energy resources,
fossil
Geothermal, renewable energy
resources, geothermal, converted
Nuclear, non-renewable energy resources,
nuclear
Primary forest, non-renewable energy resources, primary
forest
Solar, renewable energy resources, solar,
converted CEnD CExD CEnD CExD CEnD CExD CEnD CExD CEnD CExD CEnD CExD
Electricity mix [CO] 2,85E + 03 2,99E + 03 9,48E + 04 9.34E + 04 1,97E + 01 --- 3.58E + 02 3.58E + 02 2,65E-01 2,78E-01 4.76E-02 4,43E-02
Market for diesel [RoW] 3,19E + 01 3,35E + 01 3,28E + 04 3.32E + 04 6.37E + 00 --- 1,74E + 02 1,74E + 02 1,51E-01 1,58E-01 5,71E-02 5,31E-02
Extraction 8.84E + 02 9.29E + 02 2.39E + 04 2.39E + 04 3.49E + 01 --- 1.04E + 03 1.04E + 03 3,21E + 00 3,37E + 00 1,22E-01 1,13E-01
Water extraction, river --- --- --- --- --- --- --- --- --- --- ---
Chemical production, inorganic 1,31E + 02 1.38E + 02 8,20E + 03 8.04E + 03 2.08E + 01 --- 6,56E + 02 6,56E + 02 1,53E-01 1,61E-01 8.32E-03 7.73E-03
Chemical production, organic [GLO] 1.87E + 01 1,96E + 01 4.12E + 03 4.06E + 03 2,52E + 00 --- 1.77E + 02 1.77E + 02 1,85E-02 1,94E-02 3,41E-03 3,17E-03
Market for liquefied petroleum gas [RoW] 1,34E + 00 1,41E + 00 1,22E + 03 1,24E + 03 2,81E-01 --- 7.77E + 00 7.77E + 00 5,10E-03 5,35E-03 1,99E-03 1,85E-03
Market for lubricating oil [GLO] 1,18E + 00 1,24E + 00 4,10E + 02 4.14E + 02 2,31E-01 --- 6.755E +
00 6.755E + 00 3.02E-03 3,17E-03 9,14E-04 8,50E-04
Regeneration 1,94E + 02 2.04E + 02 3.08E + 01 3,11E + 01 4,48E-02 --- 1,11E + 00 1,11E + 00 3.07E-02 3,23E-02 2,39E-04 2,22E-04
Market for precious metal refinery [GLO] 5,11E-02 5,37E-02 1.88E + 00 1,87E + 00 3,84E-03 --- 1,14E-01 1,14E-01 6,64E-05 6.98E-05 8.51E-06 7.91E-06
Services 5,93E-03 6,23E-03 1,48E-01 1,49E-01 4.94E-04 --- 1,47E-02 1,47E-02 1.88E-05 1,97E-05 9.71E-07 9,03E-07
Fundition 7.96E-04 8.36E-04 2,88E-02 2,89E-02 1.09E-04 --- 2,63E-03 2,63E-03 3,28E-06 3,44E-06 9.26E-08 8,61E-08
Grand Total 4,11E + 03 4.32E + 03 1,65E + 05 1,64E + 05 8,48E + 01 --- 2.42E + 03 2.42E + 03 3.84E + 00 4.03E + 00 2,41E-01 2,25E-01

Sustainability Assessment of Alluvial and Open Pit Mining Systems in Colombia: Life Cycle Assessment, Exergy Analysis, and Emergy Accounting
(Continued)
Cumulative Energy / Exergy Demand (CEnD) from
Water, renewable energy resources, potential (in
barrage water), converted
Wind, renewable energy resources, kinetic (in wind),
converted
Metals, non-renewable material
resources
minerals, non-renewable material
resources
water resources, renewable material
resources Grand Total CenD CexD CenD CexD CenD CexD CenD CexD CenD CexD CenD CexD
Electricity mix [CO] 7.78E + 04 7.78E + 04 1,21E + 02 1,21E + 02 --- 1,86E + 02 --- 9,35E + 01 --- 2.58E + 04 1,76E + 05 2.01E + 05 Market for diesel [RoW] 5.68E + 01 5.68E + 01 3.71E + 00 3.71E + 00 --- 2.56E + 01 --- 1,37E + 01 --- 4,80E + 02 3,31E + 04 3,40E + 04 Extraction 8.71E + 02 8.71E + 02 2.44E + 01 2.44E + 01 --- 9.97E + 02 --- 2.42E + 02 --- 4.29E + 03 2.68E + 04 3,23E + 04 Water extraction, river --- --- --- --- --- --- --- --- --- 2,20E + 04 2,20E + 04 Chemical roduction, inorganic 1,92E + 02 1,92E + 02 1.34E + 01 1.34E + 01 --- 1.06E + 02 --- 4,25E + 01 --- 1,74E + 03 9,21E + 03 1.09E + 04 Chemical production, organic [GLO] 2.82E + 01 2.82E + 01 1,85E + 00 1,85E + 00 --- 1.72E + 01 --- 2.61E + 00 --- 5.58E + 02 4,35E + 03 4.87E + 03 Market for liquefied petroleum gas [RoW] 2.46E + 00 2.46E + 00 1.78E-01 1.78E-01 --- 9,69E-01 --- 5,43E-01 --- 2,00E + 01 1,24E + 03 1,27E + 03 Market for lubricating oil [GLO] 2,04E + 00 2,04E + 00 1,84E-01 1,84E-01 --- 1,61E + 00 --- 2,17E-01 --- 1,20E + 01 4.21E + 02 4.38E + 02 Regeneration 3,90E-01 3,90E-01 2.82E-02 2.82E-02 --- 3,39E-01 --- 1,10E-01 --- 1,18E + 01 2,27E + 02 2.49E + 02 Market for precious metal refinery [GLO] 7,55E-02 7,55E-02 2,63E-03 2,63E-03 --- 1,72E-01 --- 1.06E-01 --- 3.59E-01 2.12E + 00 2,75E + 00 Services 1,23E-02 1,23E-02 3,10E-04 3,10E-04 --- 1,17E-01 --- 5,42E-04 --- 4.70E-02 1.82E-01 3,46E-01 Fundition 1,36E-03 1,36E-03 6,76E-05 6,76E-05 --- 4.07E-03 --- 7.72E-05 --- 6.04E-03 3,38E-02 4,40E-02 Grand Total 7.89E + 04 7.89E + 04 1,65E + 02 1,65E + 02 --- 1,34E + 03 --- 3,95E + 02 --- 5,49E + 04 2,51E + 05 3.07E + 05

Chapter 2 111
Table 2-5: Cumulative Energy (CEnD) / Exergy Demand (CExD) for each stage in alluvial mining process.
Cumulative Energy (CEnD) / Exergy Demand (CExD) from
Biomass, renewable energy resources,
biomass
Fossil, non-renewable energy resources,
fossil
Geothermal, renewable energy
resources, geothermal, converted
Nuclear, non-renewable energy resources,
nuclear
Primary forest, non-renewable energy resources, primary
forest
Solar, renewable energy resources, solar,
converted CEnD CExD CEnD CExD CEnD CExD CEnD CExD CEnD CExD CEnD CExD
Water extraction, river --- --- --- --- --- --- --- --- --- --- --- Electricity production, hydro, run-of-river [RoW]
3,64E + 01
3.82E + 01
9,57E + 02
9,65E + 02
2.92E + 00 ---
7.18E + 01 7.18E + 01 2,87E-02 3.02E-02 5,90E-03 5,48E-03
Casting and Molding 4,46E +
00 4.69E +
00 1.82E +
02 1.82E +
02 1,76E +
00 --- 3.00E +
01 3.00E + 01 2.37E-03 2,49E-03 2,15E-04 2,00E-04
Services 1,24E +
00 1,30E +
00 4.01E +
02 4.05E +
02 2,88E-01 --- 6,67E +
00 6,67E + 00 2,54E-03 2,67E-03 3,76E-03 3,50E-03
Market for diesel [RoW] 1,53E-01 1,61E-01 1,57E +
02 1,59E +
02 3.06E-02 --- 8.34E-01 8.34E-01 7.22E-04 7.58E-04 2,73E-04 2,54E-04
Chemical production, inorganic 7.41E +
00 7.78E +
00 8,40E +
01 8.26E +
01 3,75E-01 --- 7.24E +
00 7.24E + 00 6,98E-03 7,33E-03 2.01E-04 1.86E-04
Chemical separation 2,32E-01 2,44E-01 5,47E +
00 5,46E +
00 5,21E-02 --- 3,16E +
00 3,16E + 00 9.81E-04 1.03E-03 1.01E-02 9,37E-03
Market for propane [GLO] 1,50E-02 1,57E-02 6.86E +
00 6.92E +
00 1,75E-03 --- 4.92E-02 4.92E-02 3,32E-05 3.48E-05 1,31E-05 1,22E-05
Chemical production, organic [GLO] 2,04E-02 2,15E-02 4.51E +
00 4,45E +
00 2,76E-03 --- 1,93E-01 1,93E-01 2.02E-05 2.12E-05 3,73E-06 3,47E-06 Dredging line --- --- --- --- --- --- --- --- --- --- --- Exploration 6,18E-03 6,49E-03 7.06E-01 7,12E-01 7.06E-04 --- 2.09E-02 2.09E-02 1,86E-05 1,95E-05 2,06E-06 1.91E-06 Drying and separation 6.77E-05 7,10E-05 2,45E-03 2,46E-03 9,25E-06 --- 2,23E-04 2,23E-04 2.79E-07 2,93E-07 7.87E-09 7.32E-09 Grand Total 4.99E + 01 5,24E + 01 1,80E + 03 1,81E + 03 5,42E + 00 --- 1,20E + 02 1,20E + 02 4,24E-02 4,45E-02 2,04E-02 1,90E-02

Sustainability Assessment of Alluvial and Open Pit Mining Systems in Colombia: Life Cycle Assessment, Exergy Analysis, and Emergy Accounting
(Continued)
Cumulative Energy / Exergy Demand (CEnD) from
Water, renewable energy resources, potential (in
barrage water), converted
Wind, renewable energy resources, kinetic (in wind),
converted
Metals, non-renewable material
resources
minerals, non-renewable material
resources
water resources, renewable material
resources Grand Total CenD CexD CenD CexD CenD CexD CenD CexD CenD CexD CenD CexD
Water extraction, river --- --- --- --- --- --- --- --- --- --- --- Electricity production, hydro, run-of-river [RoW] 8,92E + 04 8,92E + 04 1,84E + 00 1,84E + 00 --- 1.06E + 02 --- 4.13E + 01 --- 1,92E + 02 9.03E + 04 9.07E + 04 Casting and Molding 1,25E + 01 1,25E + 01 6.24E-01 6.24E-01 --- 6,11E-01 --- 6.79E-02 --- 6,65E + 02 2.31E + 02 8,95E + 02 Services 2.68E + 00 2.68E + 00 1,47E-01 1,47E-01 --- 1,87E + 00 --- 5.82E-01 --- 1,74E + 02 4.12E + 02 5.93E + 02 Market for diesel [RoW] 2,72E-01 2,72E-01 1,78E-02 1,78E-02 --- 1,23E-01 --- 6,54E-02 --- 2,30E + 00 1.58E + 02 1,63E + 02 Chemical production, inorganic 4.52E + 00 4.52E + 00 1,67E-01 1,67E-01 --- 1,40E + 00 --- 5,61E-01 --- 2.58E + 01 1.04E + 02 1,30E + 02 Chemical separation 4.93E-01 4.93E-01 1,15E-01 1,15E-01 --- 9,63E-02 --- 3,24E-03 --- 2.46E + 00 9,54E + 00 1,20E + 01 Market for propane [GLO] 1.58E-02 1.58E-02 1,13E-03 1,13E-03 --- 6,84E-03 --- 3,49E-03 --- 1,45E-01 6.94E + 00 7,16E + 00 Chemical production, organic [GLO] 3.09E-02 3.09E-02 2.02E-03 2.02E-03 --- 1.88E-02 --- 2,85E-03 --- 6,11E-01 4.76E + 00 5,33E + 00 Dredging line --- --- --- --- --- 1,26E + 00 --- --- --- --- --- 1,26E + 00 Exploration 1,23E-02 1,23E-02 5,00E-04 5,00E-04 --- 9,09E-02 --- 6,88E-04 --- 5,10E-02 7,46E-01 8,95E-01 Drying and separation 1,16E-04 1,16E-04 5.74E-06 5.74E-06 --- 3,46E-04 --- 6,56E-06 --- 5,13E-04 2,87E-03 3.74E-03 Grand Total 8.93E + 04 8.93E + 04 2.91E + 00 2.91E + 00 --- 1,12E + 02 --- 4.26E + 01 --- 1,41E + 06 9,12E + 04 1,50E + 06

Chapter 2 113
Sensitivity analysis of Cumulative Energy / Exergy Demand
It is assumed an improved efficiency in electricity (CFE) and fuel3 (diesel) (CFD) of up to
30% for sensitivity analysis of the process: open-pit and alluvial mining process. Appendix
J and Appendix K show how renewable and non-renewable categories were chosen for
this analysis; categories with highest change when efficiency in electricity (CFE) is
improved and fossil energy decrease in 10%, 20% and 30% are fossil, water and potential
energy for CExD indicator, and fossil and potential energy for CEnD indicator.
Figure 2-6: CExD sensitivity analysis for a) open-pit mining technology b) alluvial mining technology.
a)
3 Chemical Exergy of fuel (diesel) consumption do not include the combustion. Include extraction and refinery stage
-35%
-30%
-25%
-20%
-15%
-10%
-5%
0%
-30% -25% -20% -15% -10% -5% 0%
Open-pit mining CFD CExD fossil %
CFD CExD water
resources %
CFD CExD potential
energy %
CFE CExD fossil %
CFE CExD water
resources %
CFE CExD potential
energy %

Sustainability Assessment of Alluvial and Open Pit Mining Systems in Colombia: Life Cycle Assessment, Exergy Analysis, and Emergy Accounting
b)
As shown in Figure 2-6, improved fossil fuels efficiency has a rather low effect on
renewable and non-renewable categories. Unlike the improvement of electricity efficiency,
where a significant reduction in water resource as potential energy is presented (30%
approximately), followed by fossil resource with a decrease of 17,05% and 15,98% for
open-pit and alluvial mining. The same behavior is presented for CEnD indicator
Figure 2-7: CEnD sensitivity analysis for a) open-pit mining technology b) alluvial mining technology.
-35%
-30%
-25%
-20%
-15%
-10%
-5%
0%
-30% -25% -20% -15% -10% -5% 0%
Alluvial mining CFD CExD fossil %
CFD CExD water
resources %
CFD CExD
potential energy
%CFE CExD fossil %
CFE CExD water
resources %
CFE CExD
potential energy
%

Chapter 2 115
a)
b)
-35%
-30%
-25%
-20%
-15%
-10%
-5%
0%
-30% -25% -20% -15% -10% -5% 0%
Open pit miningCFD CEnD fossil %
CFD CEnD potential
energy %
CFE CEnD fossil %
CFE CEnD potential
energy %
-35%
-30%
-25%
-20%
-15%
-10%
-5%
0%
-30% -25% -20% -15% -10% -5% 0%
Alluvial mining CFD CEnD fossil %
CFD CEnD
potential energy
%
CFE CEnD fossil %
CFE CEnD
potential energy
%

Sustainability Assessment of Alluvial and Open Pit Mining Systems in Colombia: Life Cycle Assessment, Exergy Analysis, and Emergy Accounting
2.5.2 Thermodynamic approach to Energy/Exergy indicators
In accordance with Table 2-6 and Table 2-8, energy and exergy indicators to open-pit and
alluvial mining, it can be seen that in open-pit mining, a greater energy demand is required
(1.60E + 08 kW) and accumulated exergy (1.62E + 08 kW) compared to alluvial mining
process (3.76E + 07 kW and 5.20E + 07 kW respectively). In Appendix H and Appendix I,
open-pit and alluvial mining process descriptions, mass and energy balance and exergy
balance or each process can be found respectively. Note that this accumulated exergy
demand includes deactivation exergy; defined as the actual decontamination cost
(Szargut, 2005). For open-pit mining this cost refers to the exergy invested in tails,
detoxification and regeneration stages with a value equal to 1.87E + 09 kW. In alluvial
mining refers to the waste tails treatment plant stage with a value equal to 1.43E + 06 kW.
Speaking in exergy terms, alluvial process presents a higher Sustainability Index (SI) with
a value equal to 1.38 compared to the open-pit process with an SI equal to 1.00. This is
reflected in the generation of entropy or destroyed exergy of both processes generated by
losses of internal exergy related to the thermodynamic irreversibilities of the system, being
4 times higher in open-pit process (1.59E + 08 kW) with respect to a alluvial process
(3.76E + 07kW). It is clear that in open-pit mining, 98.64% (1.57E + 08 kW) of destroyed
exergy corresponds to gold production and 1.36% to silver production (2.17E + 06 kW) by
economic allocation method, based on the Colombian market gold and silver average
prices for 2016 that were equal to € 36.21 and € 0.50 per gram. While in alluvial mining the
allocation for gold and ferrous mineral produced was not considered, because the price of
ferrous ore in the Colombian market is equal to € 3,00E-05 per gram, which means that
99.99% of the destined exergy corresponds to gold production.
Equally, exergy efficiency is directly related to Sustainability Index. When the exergy
efficiency of a process is low, sustainability is also low; because input resources are not
100% exploited, generating waste products with a high energy content, causing
environmental impacts (environmental load). Exergy efficiency for open-pit mining is
1.57% and 27.75% for alluvial mining.
In Open-pit mining, the stages that contribute the most to exergy destruction are tails and
extraction, therefore being the most unsustainable. Unlike alluvial mining, where the

Chapter 2 117
contribution to overall process exergy destruction is more distributed between stages,
being casting and molding the most influential stage, followed by stripping.
Table 2-6 shows how most of ore benefit phases (milling, gravimetric separation and
floatation), Refining (leaching, carbon adsorption, elution and regeneration) and Fundition
show a good use of the exergy resource in open-pit mining process, being carbon
adsorption and regeneration the most exergyally sustainable phases, while Mine operation
(stripping), Mining (mineral excavation), and Waste treatment were the less sustainable
(detoxification and tailing pond).

Sustainability Assessment of Alluvial and Open Pit Mining Systems in Colombia: Life Cycle Assessment, Exergy Analysis, and Emergy Accounting
Table 2-6: Energy and Exergy indicators (thermodynamic approach) to open-pit mining technology.
Process Energy Consumption [kW]
Input Exergy [kW]
Output Exergy [kW]
Destroyed Exergy [kW]
Exergy efficiency [%]
Depletion Number (Dp)
Sustainable Index (SI)
Exergy renewable resource [GW]
Exergy non-renewable resource [GW]
Ecology efficiency [GW]
Exergy environmental indicator
(
Stripping 2.39E + 07 2.40E + 07 1.73E + 05 2.38E + 07 0.72 0.993 1.01 9.61E+03 2.39E+07 0.721
Extraction 1.36E + 08 1.38E + 08 2.21E + 06 1.36E + 08 1.60 0.984 1.02 8.65E+03 1.38E+08 1.604
Crushing 3.29E + 00 1.03E + 06 1.01E + 06 2.12E + 04 97.95 0.021 48.72 0.00E+00 1.57E+06 97.14
Milling 4.79E + 01 1.63E + 06 1.58E + 06 4,85E + 04 97.03 0.030 33.68 6.32E+04 1.03E+06 97.95
Gravimetric separation 7.56E-02 7.98E + 05 7.76E + 05 2,26E + 04 97,16 0.028 35.26 1.47E+04 7.84E+05 97.21
Floatation 6.92E + 00 8.06E + 05 8,05E + 05 3.59E + 02 99.96 0,000 2245,13 3.67E+03 8.02E+05 99.96
Leaching 1.57E + 00 3.58E + 04 3.37E + 04 2.14E + 03 94.04 0.060 16,77 0.00E+00 3.58E+04 94.04
Adsorption 2.83E-01 2.97E + 04 2.97E + 04 1,95E-01 100.00 0,000 152383,17 0.00E+00 2.97E+04 100.0
Adsorption R. 0.00E + 00 4.29E + 01 4.29E + 01 0.00E + 00 100.00 0,000 0.00 0.00E+00 4.29E+01 100.0
Detoxification 710E-03 3.67E + 04 3.58E + 04 9.29E + 02 97.47 0.025 39.49 0.00E+00 3.67E+04 97.47
Tails 1.88E + 00 1.87E + 09 8,95E + 05 1.87E + 09 0.05 1,000 1.00 0.00E+00 1.87E+09 0.048
Elution 1.37E + 00 1.49E + 04 1,44E + 04 4.73E + 02 96.82 0.032 31.46 1.21E+03 1.37E+04 97.07
Regeneration 1.17E + 01 5.11E + 04 5,11E + 04 1.58E + 00 100.00 0,000 32309.98 0.00E+00 5.11E+04 100.00
Casting 1.67E + 01 1.86E + 01 1.93E + 00 1.67E + 01 10.35 0,897 1.12 0.00E+00 1.87E+00 10.35
Global 1.60E + 08 * 1.62 + 08 ** 2.54E + 06 1.59E + 08 1.57 0.98 1.02 1.01E+05 1.62E+08 1.58 5.95E-09 * Cumulative Energy Demand
** Cumulative Exergy Demand

Chapter 2 119
Table 2-7 shows the fraction of energy available in output stream of each process (stream
of interest and waste) with respect to input exergy. Only in crushing, milling, leaching and
fundition stages the stream of interest (gold stream) has the largest fraction of usable
energy, contrary to the remaining stages where exergy entering the process is being
transformed into waste and not into products. Note that stages such as stripping,
adsorption, detoxification, tails and regeneration have no associated stream of interest
since they are waste generating processes, although in tails stage the water stream (A7) is
recirculated within the process itself. Unlike casting stage, where gold and silver streams
have a very similar available energy faction, being higher for gold stream (0.01 and 0.093
respectively). Streams with potential for use are: sterile material with low gold content that
is generated during extraction process and that is stored for future use in order to extend
the mine lifespan (S1), residual stream of the gravimetric separation process recirculated
to the grinding process to be used, residual stream of floatation process (S7), mostly water
(0.65), carries a high energy content that is used in tailings process through the
dehydration process of mining sludge for recirculation of water. It can be seen how most
waste streams can be used in the mining process, although in stripping stage it is
necessary to improve the process technology.
Table 2-7: Stream utility efficiency for each stage of the process in open-pit mining technology.
Process Product (stream)
Exergy
efficiency of the product
Process Product (stream)
Exergy
efficiency of the
product
Stripping
In [Gw] 23958746,62
4
Adsorption
In [Gw] 29694,632
VM 3,86E-05 O8 0,001
S3 7,17E-03 S9 0,999
Ew 8,07E-08 S19 9,85E-05
Extraction
In [Gw] 137923315,1
25 Adsorption R.
In [Gw] 42,873
O2 0,007 S13 1,000
S1 0,009
Gas 6,51E-07
Detoxification
In [Gw] 36681,644
Ew1 6,27E-05 S10 0,875
PM2 4,09E-07 S16 0,025
Crushing In [Gw] 1034977,53 S10a 0,075
O3 0,767 Tails In [Gw] 186977498

Sustainability Assessment of Alluvial and Open Pit Mining Systems in Colombia: Life Cycle Assessment, Exergy Analysis, and Emergy Accounting
7,126
PM3 7,78E-07 A7 4,51E-05
S4 0,213 S11 4,33E-04
Milling
In [Gw] 1632445,293 PM5 6,71E-09
PM4 1,45E-06
Elution
In [Gw] 14869,113
O12 0,480 O10 0,00004
O4 0,490 S12 0,968
Gravimetric separation
In [Gw] 798269,144 M2 0,000
S6 0,972
Regeneration
In [Gw] 51137
O9 2,62E-05 S13 0,003
Floatation
In [Gw] 805562,402 S14 0,997
O5 0,043
Casting
In [Gw] 18,608
O6 2,72E-04 O11 0,093
S7 0,957 O11o 0,010
Leaching
In [Gw] 35843,567
O7 0,744
S8 0,196 Note: the streams of interest are highlighted. Stream in fraction
In alluvial mining process, the greatest exergy use is seen at Refining (floatation, filtration-
separation, chemical separation, drying and separation) and Waste treatment (Waste
Tailings Treatment Plant and Tailing Pond) phases, where WTTP and filtration-separation
stages present the best exergy Sustainability Index. Unlike Mine operation (exploration
and stripping), Mining (dredging line step), ore benefit (screening, sluice boxes. However,
gravimetric concentration by hydraulic jigs has a high SI equal to 6,45 in this phase of the
process) and Casting and molding; phases of the process subject to possible
improvements in the efficient use of resources (inputs) and in the valorization of those
residual streams that have a usable exergy content, Table 2-8.
Table 2-9 indicates the fraction of available exergy that is used by the stream of interest
(gold) in each stage of the alluvial mining process. In bucket-line, screening and floatation
stages, the stream of interest is the one that carries the largest fraction of available
energy. This is due to the flow of residual streams in the first two processes is not so big in
relation to the one of interest and, in the last stage it can be said that the two output
streams (S23 and S19) are used within the process.

Chapter 2 121
In the other stages of the process, such as hydraulic jigs and sluice boxes, the residual
streams are mainly made up of large quantities of water and sand (S17 and S17a that are
returned to the water source where the extractive process is done) in relation to the small
flow that continues in the process line.
Finally, in the circuit of physical-chemical benefit in flotation stage, where the greatest gold
recovery occurs (S23), the processes that follow it do not have such a significant recovery,
so residual streams are the ones that contain most exergy. It is noteworthy that in Waste
Tails Treatment Plant (WTTP) and tailing pond stage, the residual water that comes out of
both processes is recovered and recirculated, which allows a significant exergy use of
these waste streams (A15, A13). It is necessary to recover the energy contained in
exhaust gases of casting and molding stage.

Sustainability Assessment of Alluvial and Open Pit Mining Systems in Colombia: Life Cycle Assessment, Exergy Analysis, and Emergy Accounting
Table 2-8: Exergy indicators (thermodynamic approach) to alluvial mining technology.
Process
Cumulative Energy Demand [kW]
Input Exergy [kW]
Output Exergy [kW]
Destroyed Exergy [kW]
Exergy efficiency [%]
Deplection Number (Dp)
Sustainable Index (SI)
Exergy renewable resource [GW]
Exergy non-renewable resource [GW]
Ecology efficiency [GW]
Exergy environmental indicator
(
Exploration 3,27E + 04 3,27E + 04 3.00E + 01 3,27E + 04 0.09 0.999 1.00 1.55E+01 3.27E+04 0.09
Stripping 1,14E + 07 1,28E + 07 1.33E + 06 1,14E + 07 10.46 0.895 1.12 1.43E+05 1.26E+07 10.61
Bucket-line 1.01E + 07 1,25E + 07 2.37E + 06 1.01E + 07 19,01 0.810 1.23 0.00E+00 1.25E+07 19.05
Screening 1.02E + 07 2,17E + 07 1,14E + 07 1.02E + 07 52,72 0.473 2.11 9.25E+06 1.24E+07 66.12
Jig 2.66E + 06 1,72E + 07 1,45E + 07 2.66E + 06 84.50 0.155 6.45 1.39E+06 1.58E+07 85.60
Sluice boxes 9.00E + 04 3,18E + 05 2,28E + 05 9,01E + 04 71.70 0.283 3.53 6.00E+04 2.59E+05 75.80
Services 1,65E + 06 1,65E + 06 1,17E + 03 1,65E + 06 0.07 0.999 1.00 1.16E+03 1.65E+06 0.07
Floatation 5,16E + 05 1.81E + 06 1,30E + 06 5,16E + 05 71.57 0.284 3.52 1.30E+06 5.16E+05 89.86
Filtration-Separation
2.06E + 05 1,50E + 06 1,30E + 06 2.06E + 05 86.29 0.137 7.30 0.00E+00 1.50E+06 100.00
Chemical separation 3.09E + 05 3.09E + 05 1,43E + 01 3.09E + 05 0.00 1.000 1.00 0.00E+00 3.09E+05 0.01
Drying and separation 4,30E + 04 4.31E + 04 1,37E + 02 4,30E + 04 0.32 0.997 1.00 0.00E+00 4.31E+04 0.32
WTTP 1,28E + 05 1,43E + 06 1,30E + 06 1,28E + 05 91.03 0.090 11.15 1.30E+06 1.28E+05 99.12
Tailing pond 1,87E + 05 2,00E + 05 1,30E + 04 1,87E + 05 6.52 0.935 1.07 0.00E+00 2.00E+05 6.53
Casting and Molding 6,99E + 02 4,36E+07 1,95E+00 4,36E+07 0.00 1.000 1.00 0.00E+00 7.01E+02 0.00
Global 3.76E + 07 * 5,20E+07** 1,44E+07 3,76E+07 27,75 0.723 1.38 1.22E+07 4.12E+07 34.56 1.14E-10
* Cumulative Energy Demand
** Cumulative Exergy Demand

Chapter 2 123
In both mining processes Ecology efficiency and Exergy Environmental Indicator is
evaluated. In open-pit mining the stages that present greater ecological efficiency are
gravimetric separation, regeneration, floatation, crushing, milling, adsorption, elution; being
this last process where a better use of resources is made. In alluvial mining, the processes
are filtration-separation, floatation and WTTP, being the flotation process where resources
are used more efficiently in terms of sustainability; that is, it makes greater use of
renewable resources.
With respect to the environmental exergy indicator the two processes are environmentally
unfavorable, being less unfavorable alluvial mining with a value equal to 1.14E-10. This
indicator consists with the calculated SI from (Szargut, 2005)
Table 2-9: Stream utility efficiency for each stage of the process in open-pit mining technology.
Process Product (stream)
Exergy efficiency of the product
Process Product (stream)
Exergy efficiency of the product
Exploration
In [Gw] 32725,291
Floatation
In [Gw] 1814512,156
S2 1,65E-12 S23 0,716
S3 0,001 S19 7,0497E-05
Stripping In [Gw]
12770100,735
Filtration-Separation
In [Gw] 1298594,210
S6 0,094 A14 1,000
A4 0,011 S24 9,165E-06
Bucket-line In [Gw]
12496871,372
Chemical separation
In [Gw] 309400,478
S9 0,175 S25 2,3461E-08
A3 0,016 S26 6,5609E-05
Screening In [Gw]
21660369,139
Drying and separation
In [Gw] 43097,267
S10 0,021 S21 0,003
S11 0,507 S20 4,2107E-06
Jig
In [Gw] In
WTTP
In [Gw] 1426767,209
S17 0,709 A15 0,901
S16 0,136 S28 0,009
Sluice boxes
In [Gw] 318851,880
Tailing pond
In [Gw] 199761,975
S18 5,25877E-06 A13 5,5689E-05
S17a 0,718 S27 0,065
Services In [Gw] 1646990,002 Casting and In [Gw] 43604534,476

Sustainability Assessment of Alluvial and Open Pit Mining Systems in Colombia: Life Cycle Assessment, Exergy Analysis, and Emergy Accounting
S18 1,01808E-06 Molding S22 2,49501E-10 A11 7,09E-04 Gas 4,45165E-08
Note: the streams of interest are highlighted. Stream in fraction
Figure 2-8 - Figure 2-11 shows grassmann exergy diagram for each stage of the open-pit
and alluvial mining process in percentages and the global process by streams [GW]
respectively.

Chapter 2 125
Figure 2-8: Grassmann exergy diagram open-pit mining by process.

Sustainability Assessment of Alluvial and Open Pit Mining Systems in Colombia: Life Cycle Assessment, Exergy Analysis, and Emergy Accounting

Chapter 2 127

Sustainability Assessment of Alluvial and Open Pit Mining Systems in Colombia: Life Cycle Assessment, Exergy Analysis, and Emergy Accounting
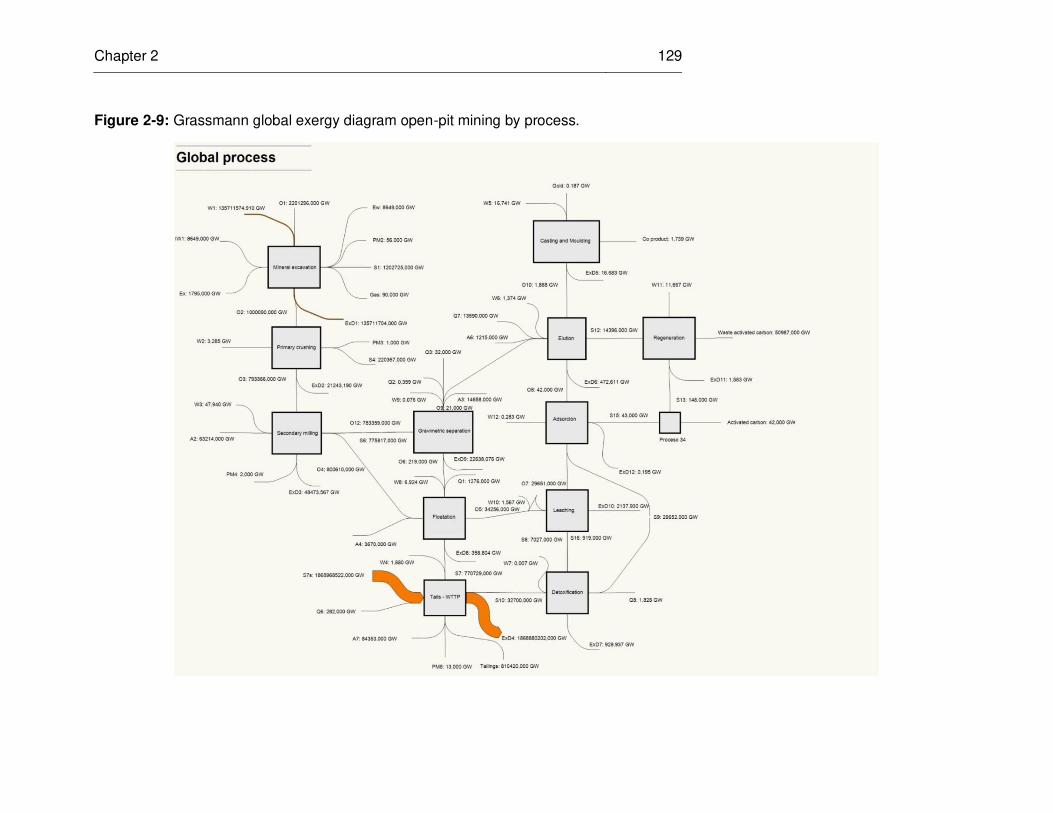
Chapter 2 129
Figure 2-9: Grassmann global exergy diagram open-pit mining by process.

Sustainability Assessment of Alluvial and Open Pit Mining Systems in Colombia: Life Cycle Assessment, Exergy Analysis, and Emergy Accounting
Figure 2-10: Grassmann exergy diagram alluvial mining by process.

Chapter 2 131

Sustainability Assessment of Alluvial and Open Pit Mining Systems in Colombia: Life Cycle Assessment, Exergy Analysis, and Emergy Accounting

Chapter 2 133

Sustainability Assessment of Alluvial and Open Pit Mining Systems in Colombia: Life Cycle Assessment, Exergy Analysis, and Emergy Accounting
Figure 2-11: Grassmann global exergy diagram open-pit mining by process.

Error! Reference source not found. 135
Sensitivity analysis
The sensitivity analysis was carried out evaluating the difference of exergy efficiency and
sustainability index of each stage of the process with respect to the baseline (process
without change) assuming a decrease in work (W in kW) up to 40% at each stage of the
process, Figure 2-12 and Figure 2-13.
For alluvial mining process, the implemented decrease in work does not present any
variation in Exergy efficiency (with respect to the baseline) of the exploration, services,
chemical separation and drying and separation stages. The most significant change is
presented in Screening, Bucket-line, Sluice boxes, and Floatation with an improvement in
exergy efficiency of 12% of the first stage and 9% for the others, Figure 2-12 a). It is
important to highlight how smelting process is not sensitive to change, knowing that it is
the stage that contributes the most to global destined exergy. On the other hand, the
improvement of response variable does not have a linear behavior with work variation at
each stage.
With respect to Sustainability Index, there are no variations (with respect to the baseline)
in those stages that were not sensitive to the change of exergy efficiency. Although the
biggest changes were presented in WTTP, Filtration-Separation and Jig with an
improvement of 38% (6.77), 37% (4.19) and 36% (3.63), note that these stages were the
ones that presented greater SI in baseline case Figure 2-12 b).
Figure 2-12: Sensitivity analysis alluvial mining a) exergy efficiency b) Sustainable index.

136 Sustainability Assessment of Alluvial and Open Pit Mining Systems in Colombia: Life Cycle Assessment, Exergy Analysis, and Emergy Accounting
a)
b)
For open-pit mining process, it can be said in general terms that there is no significant
effect on exergy efficiency and SI (with respect to baseline) when work consumed in each
stage of the process is reduced by up to 40%. With respect to Exergy efficiency, casting
stage presents an improvement of 5.82%, followed by extraction (1.04%), and stripping
0%
2%
4%
6%
8%
10%
12%
14%
Baseline W-10% W-20% W-30% W-40%
0.00
1.00
2.00
3.00
4.00
5.00
6.00
7.00
8.00
Baseline W-10% W-20% W-30% W-40%

Chapter 2 137
stage (0.48%) Figure 2-13 a). SI shows a very significant effect in regeneration and
adsorption stage in Figure 2-13 b), with an improvement of 74% and the 58%
respectively; stages that present the best sustainability index in baseline escene. Note
that the regeneration stage reaches its highest SI when work consumed is reduced by
20%, achieving the highest exergy efficiency in this stage.
Figure 2-13: Sensitivity analysis open-pit mining a) Exergy efficiency b) Sustainable index.
a)
0%
1%
2%
3%
4%
5%
6%
7%
Baseline W-10% W-20% W-30% W-40%

138 Sustainability Assessment of Alluvial and Open Pit Mining Systems in Colombia: Life Cycle Assessment, Exergy Analysis, and Emergy Accounting
b)
Finally, in global terms of both processes, in open-pit and alluvial mining process an
improvement of 0.1% and 5% respectively was achieved in the overall Exergy efficiency.
With respect to global Sustainability Index, open-pit mining did not show any effect on the
decrease of work consumed in the process, unlike alluvial mining process, where an
improvement of 7% was obtained in this index.
2.6 Discussion and Conclusions
Through the present study it was possible to see how, given the extension of the limits of
Traditional Exergètic Analysis System by incorporating the Life Cycle Assessment as a
complementary and not exchangeable analysis, it was possible to quantify the energy and
exergy used throughout gold life cycle, distinguishing between renewable and non-
renewable energy and exergy requirements under LCA perspective. In the same way,
Cumulative Energy / Exergy Demand, Input / output Exergy, Destroyed Exergy, relative
irreversibility, Exergy Efficiency of the Product, Exergy efficiency and Sustainability Index
for all the stages of both mining processes under thermodynamic approach were
quantified. This last approach allowed to examine the most efficient way to carry out two
mining processes from cradle to gate, allowing to quantify energy quality losses within the
process, this analysis can not indicate how the process can be improved but it can
0.00E+00
5.00E+04
1.00E+05
1.50E+05
2.00E+05
2.50E+05
Baseline W-10% W-20% W-30% W-40%

Chapter 2 139
indicate where the process may be improved and in turn may receive technical attention
(Szargut, J., Morris, DR, Steward, 1988).
For open-pit mining process, 65.74% of the energy consumed comes from fossil non-
renewable resource, and 31.43% comes from the use of potential energy of water
(renewable resource). Unlike alluvial mining process, where 97.92% comes from the use
of water as an energy resource and 1.97% from fossil energy. This is because in alluvial
mining, electricity used is generated by run-of-the-river power plants, which do not require
reservoirs and thus have minimal environmental impact.
In exergy terms, in open-pit mining 53% of exergy consumed comes from fossil energy
and 26% of energetic use of water; this is because usable energy content of each energy
resource is not 100%. On the other hand, in alluvial mining, 94% of exergy flow comes
from water as a resource used within process activities, this as a consequence of the role
water plays in benefit process and gold obtaining in alluvial mining extractive process;
approximately the remaining 6% comes from the use of potential energy of water for the
generation of electricity, that satisfies 100% of electricity consumption of extractive
process, and other activities of the company.
The effect of diesel and electricity consumption decrease in the open-pit process does not
have such a significant effect on the demand for exergy from nonrenewable and
renewable resources (fossil, water resource, potential energy) even though it is the
greatest energy contributor in the process compared to the decrease of up to 30% of
electricity consumption, having a significant effect on the categories mentioned above.
For other mining system (alluvial process) the same behavior is presented; however, a
decrease (30%) in electricity consumption results in a decrease of approximately 30% in
the cumulative Exergy demand from potential energy.
Based on the thermodynamic perspective, cumulative exergy demand to open-pit mining
from cradle to gate was equal to 1.62E + 08 kW, of which 98.43% was destroyed,
presenting an efficiency of 1.57% and a sustainability index (SI) equal to 1.02. While in
alluvial process, 69% of input exergy is destroyed (3.76E + 07 kW), with an exergy
efficiency of 27.75% and SI equal to 1.38. This implies that the alluvial mining process is

140 Sustainability Assessment of Alluvial and Open Pit Mining Systems in Colombia: Life Cycle Assessment, Exergy Analysis, and Emergy Accounting
more sustainable in exergy terms compared to the open-pit mining process, since the
latter generates greater entropy due to thermodynamic irreversibilities of the process,
causing a greater load to the receiving environment, reflecting in different types of
emissions/ environmental impacts to soil, water and air, which are determined by other
analysis methodologies such as Life Cycle Assessment (environmental impact
categories).
This is how Exergy Analysis allows quantifying the sustainability of a process based on
the environmental burden generated by the use of renewable and non-renewable
resources. It is more sustainable or more efficient in exergy terms, the process that
makes better use of the available energy contained in these resources, interpreted as a
measure of its potential for use, and which inefficient use generates waste streams whose
exergy content can be a measure of its potential to cause environmental damage.
Aditionally, this method quantifies in exergy units the cost of abatement (deactivation) of
the contamination or how much does it cost to decontaminate
It is possible to see how the extraction, gravimetric separation and floatation stages of
waste stream S1, S6 and S7 have a high exergy content that is exploited within the
process in open-pit mining.
The same case is presented in alluvial mining, where waste water stream A13 and A15
from tailing pond and WTTP are respectively recovered and reused in the mining process,
residual gas from casting process can be used. In this way, process sustainability can be
improved. However, it is noteworthy that each stage has an interdependence with other
stages. An improvement in one of these stages can modify the exergy losses in the
others, even being equal to or greater than the original configuration (baseline).
Although alluvial mining process presents a lower environmental load (compared to open-
pit mining), it is more subject to improvements in its exergy indicators (Exergy Efficiency
and Sustainable Index) when work consumed at each stage of the process is reduced to
an 40%, this behavior is not seen in open-pit mining process. An improvement of 5% in
Exergy efficiency was achieved in the first mining process, and an improvement of 0.1%
in the second process. For Sustainability Index in alluvial mining a global improvement of
7% is achieved, while in open-pit mining there is no evidence of any improvement, this is

Chapter 2 141
because the work in this process contributes 7% of the total exergy input, so a variation
does not have a very significant effect on process overall sustainability.
It can be said then that both mining processes, especially Open-pit mining technology,
seen from thermodynamic point, is considered as anti-exergy, since there is a decrease of
exergy between the initial state of input and end of output, giving rise to a waste with a
high exergy content (Uche, 2013), and where improvements can only be achieved by
changing the technology for a much more efficient one and by changing the process
configuration. Hence the need of using methodologies complementary to exergy analysis
such as thermoeconomic analysis, which allows to justify exergy and economic cost
through the market price of gold; that is, the market price of gold is the one that
internalizes the externalities generated in the process. This market price bears the exergy
losses of the process and, in turn, allows recovering the natural and human capital
invested in the process from cradle to gate.
In order to reduce the environmental impact associated with gold generation life cycle
from cradle to gate for the two extractive systems described in this study, four strategies
should be implemented:
- Increased efficiency by reducing the exergy required in tails stages and extraction (in
open-pit mining process and, casting and molding, and screening where large exergy
supplies are required.
- Increasing efficiency through the reduction of exergy emissions and residues in casting
and molding stage in alluvial mining, and stripping stage in open-pit mining. Or giving an
added value to those streams that are exergyally exploitable as S1 and S7 in extraction
and floatation process respectively in open-pit mining, S6 in stripping process in alluvial
mining that are released to the environment, causing a modification on it (environmental
degradation) due to reactions that occur, to achieve balance with the environment.
- Using external exergy resources, such as renewable resources from nature (solar,
wind, hydraulic) as proposed by the exergy analysis method from a life-cycle
perspective or the emergy methodology, where all direct and indirect resources used for
the elaboration of a product or service are quantified in joules solar equivalents, being
sustainable the process that demands greater consumption of renewable resources
instead of non-renewable.

142 Sustainability Assessment of Alluvial and Open Pit Mining Systems in Colombia: Life Cycle Assessment, Exergy Analysis, and Emergy Accounting
- Applying the concept of circular economy, which implies the reduction in consumption
of resources in two ways:
By reducing exergy lost contained in usable waste released into the
environment, since the rate of polluting emissions should not exceed the
corresponding assimilation capacity of the environment.
By reducing the use of virgin resources within the process by reusing
resources, since the rate of use of non-renewable resources must not
exceed the rates at which renewable substitutes are developed.
The use of exergy analysis as a tool to determine the efficiency of the process allows us
to assess the degree of consumption and the transformation of resources into a value-
added product such as gold. In this process, the use of energy efficiencies is
meaningless, since the energy involved in the process is for obtaining a non-energy
product. Therefore, the evaluation of an energy efficiency in this process is not the true
evaluation of the efficiency of the process but of the system; mining processes are energy
sinks justified by the high added value of the product obtained. The exergy allows to
evaluate these processes and put a scale of comparison of applied technologies.
2.7 Acknowledgments
This project was carried out as part of the Doctoral Program funded by the Department of
Science and Technology of Colombia (COLCIENCIAS). The authors thank the mining
companies (open-pit and alluvial mining technology) for the provided data and
recommendations. This research was supported by the 1) School of Mines at the National
University of Colombia at Medellín; 2) Bioprocess and Reactive Flow Research Group; 3)
Faculty of Applied sciences, Department of Biotechnology at Delft University of
Technology; 4) Biotechnology and Society Research Group.
2.8 Disclaimer
This research is focused on studying the sustainability of two different extraction mining
processes such as open pit and alluvial mining technologies. Data provided by mining
companies is confidential information used only to academic purposes.

Chapter 2 143
References
Alting, L.L., Legarth, J. B. (1995). Life–Cycle Engineering and Design. Life Centre, DTU,Copenhagen.
Ayres, R.U.; Ayres, L.W.; Martinas, K. (1998). Exergy, waste accounting and life-cycle analysis. Energy, 23, 355–363.
Backman, C. (2008). Global supply and demand of metals in the future. Journal of Toxicology and
Environmental Health Part A., 71(18), 1244–53.
Benetto, E., Dujet, C., Rousseaux, P. (2006). Possibility theory: a new approach to uncertainty analysis? The International Journal of Life Cycle Assessment, 11(2), 114–116.
Benetto, E., Tiruta-Barna, L., & Perrodin, Y. (2007). Combining lifecycle and risk assessments of mineral waste reuse scenarios for decision making support. Environmental Impact
Assessment Review, 27(3), 266–285. http://doi.org/10.1016/j.eiar.2006.10.007
Bösch, M.E.; Hellweg, S.; Huijbregts, M.; Frischknecht, R. (2007). Applying cumulative exergy demand (CExD) indicators to the ecoinvent database. International Journal of Life Cycle
Assessment, 12, 181–190.
Bösch, M. E., Hellweg, S., Huijbregts, M. A. J., & Frischknecht, R. (2007a). Applying cumulative exergy demand (CExD) indicators to the ecoinvent database. The International Journal of Life
Cycle Assessment. http://doi.org/10.1065/lca2006.11.282
Bösch, M. E., Hellweg, S., Huijbregts, M. A. J., & Frischknecht, R. (2007b). Applying Cumulative Exergy Demand (CExD) indicators to the ecoinvent database. International Journal of Life
Cycle Assessment, 12(3), 181–190. http://doi.org/10.1065/lca2006.11.282
Calvo, G., Valero, A., & Valero, A. (2015). An exergoecological analysis of the mineral economy in Spain, 88, 2–8. http://doi.org/10.1016/j.energy.2015.01.083
Calvo, G., Valero, A., & Valero, A. (2017). Assessing maximum production peak and resource availability of non-fuel mineral resources: Analyzing the influence of extractable global resources. Resources, Conservation and Recycling, 125(June), 208–217. http://doi.org/10.1016/j.resconrec.2017.06.009
Cano, N. (n.d.). Sustainability Assessment of Gold Mining by Life Cycle Assessment: Open-pit Mining VS Alluvial Mining. Cleaner Production.
Cengel, & Boles. (2012). Termodinámica. (Mc Graw Hill, Ed.) (Séptima ed). México.
CIPRO. (2014). Redescubriendo la minería aurifera aluvial. Bogotá, Colombia.
Corneliessen, R. L. (1997). Thermodynamics and Sustainable Development. The use of exergy
analysis and the reduction of irreversibility. Univ. of Twente.
Cornelissen RL, H. G. (2002). The value of the exergetic life cycle assessment besides the LCA. Energy Conversion and Management, 43, 1417–24.
Dewulf, J.; Bösch, M.E.; De Meester, B.; Van der Vorst, G.; Van Langenhove, H.; Hellweg, S.;

144 Sustainability Assessment of Alluvial and Open Pit Mining Systems in Colombia: Life Cycle Assessment, Exergy Analysis, and Emergy Accounting
Huijbregts, M. A. J. (2007). Cumulative Exergy Extraction from the Natural Environment (CEENE): A comprehensive Life Cycle Impact Assessment method for resource accounting. Environmental Science & Technology, 41, 8477–8483.
Dewulf, J., Bösch, M. E., De Meester, B., Van Der Vorst, G., Van Langenhove, H., Hellweg, S., & Huijbregts, M. A. J. (2007). Cumulative exergy extraction from the natural environment (CEENE): A comprehensive life cycle impact assessment method for resource accounting. Environmental Science and Technology. http://doi.org/10.1021/es0711415
Dewulf, J., Bösch, M. E., Meester, B. De, Vorst, G. Van Der, Langenhove, H. Van, Hellweg, S., & Huijbregts, M. A. J. (2007). Cumulative Exergy Extraction from the Natural Environment ( CEENE ): a comprehensive Life Cycle Impact Assessment method for resource accounting Cumulative Exergy Extraction from the Natural Environment ( CEENE ): a comprehensive Life Cycle Impact Assessm. http://doi.org/10.1021/es0711415
Dincer, I. & Rosen, M. A. (2007). Exergy, energy, environment and sustainable development (1a. Ed.). Elsevier.
Dincer, I., & Rosen, M. A. (2015). Chapter 1 - Exergy and its Ties to the Environment, Economics,
and Sustainability. Exergy Analysis of Heating, Refrigerating and Air Conditioning. Methods
and Applications. http://doi.org/http://dx.doi.org/10.1016/B978-0-12-417203-6.00001-6
Domínguez, A., Valero, A., & Valero, A. (2013). Exergy accounting applied to metallurgical systems : The case of nickel processing. Energy, 62, 37–45. http://doi.org/10.1016/j.energy.2013.03.089
European Commission. A Resource-Efficient Europe – Flagship Initiative Under the Europe 2020 Strategy. (2011).
Finnveden, G.; Östlund, P. (1997). Exergies of Natural Resources in Life Cycle Assessment and Other Applications. Energy, 22, 923–931.
Finnveden, G., Arushanyan, Y., & Brandao, M. (2016). Exergy as a Measure of Resource Use in Life Cycle Assessment and Other Sustainability Assessment Tools. RESOURCES-BASEL. http://doi.org/10.3390/resources5030023
Fonseca, A., McAllister, M. L., & Fitzpatrick, P. (2013). Measuring what? A comparative anatomy of five mining sustainability frameworks. Minerals Engineering, 46–47. http://doi.org/10.1016/j.mineng.2013.04.008
Frischknecht, R.; Wyss, F.; Büsser Knöpfel, S.; Lützkendorf, T.; Balouktsi, M. (2015). Cumulative energy demand in LCA: the energy harvested approach. International Journal of Life Cycle
Assessment, 20, 957–969.
Gabriel Carmona, L., Whiting, K., Valero, A., & Valero, A. (2015). Colombian mineral resources: An analysis from a Thermodynamic Second Law perspective. Resources Policy, 45, 23–28. http://doi.org/10.1016/j.resourpol.2015.03.005
Gong, M., Wall, G. (1997). On Exergetics, Economics and Optimization of Technical Processes to Meet Environmental Conditions. In Thermodynamic Analysis and Improvement of Energy
Systems (pp. 453–60).

Chapter 2 145
Gössling-Reisemann, S. (2007). Combining LCA with thermodynamics. In Information
Technologies in Environmental Engineering. (C. Marx Gomez, J., Sonnenschein, M., Müller, M., Welsch, H., Rautenstrauch, Ed.) (Springer). Heidelberg, Germany.
Henckens, M.L.C.M., Driessen, P.P.J., Worrell, E. (2014). Metal scarcity and sustainability: analyzing the necessity to reduce the extraction of scarce metals. Resources, Conservation
and Recycling, 93, 1–8.
Henckens, M. L. C. M., Driessen, P. P. J., Ryngaert, C., & Worrell, E. (2016). The set-up of an international agreement on the conservation and sustainable use of geologically scarce mineral resources. Resources Policy. http://doi.org/10.1016/j.resourpol.2016.04.010
Hischier, R., Weidema, B., Althaus, H.-J., Bauer, C., Doka, G., Dones, R., … Nemecek, T. (2010). Implementation of Life Cycle Impact Assessment Methods Data v2.2 (2010). Ecoinvent
Report No. 3, (3), 176.
ICMM. (2012a). Our Work: Sustainable Development Framework. International Council on Mining and Metals. Retrieved October 7, 2012, from http://www.icmm.com/our-work/ sustainable-development-framework
ICMM. Trends in the Mining and Metals Industry. Mining’s Contribution to Sustainable Developmen (2012).
Jeswiet, J. (2017). Including Towards Sustainable Mining in Evaluating Mining Impacts. In Procedia CIRP. http://doi.org/10.1016/j.procir.2016.06.123
Joback, K. G. & Reid, R. C. (1987). Estimation of pure-component properties from groupcontributions. Chemical Engineering Communications, 57(1–6), 233–243.
Kanoglu, M., Dincer, I., Cengel, Y. (2008). Exergy for better environment and sustainability. In Environment, Development and Sustainability. http://doi.org/10.1007/s10668-008-9162-3.
Kharrazi, A., Kraines, S., Hoang, L., & Yarime, M. (2014). Advancing quantification methods of sustainability: A critical examination emergy, exergy, ecological footprint, and ecological information-based approaches. Ecological Indicators, 37(PART A), 81–89. http://doi.org/10.1016/j.ecolind.2013.10.003
Kotas, T. J. (1985). The Exergy Method of Thermal Plant Analysis. Malabar, Florida: Krieger Publishing Company.
Krahl, M., Aur, M., Pinto, C., Uff, L., & Bv, E. E. (2010). EXERGIA E SUA RELAÇÃO COM GESTÂO AMBIENTAL.
Lazarevic, D.; Buclet, N.; Brandt, N. J. (2012). The application of life cycle thinking in the context of European waste policy. Cleaner Production, 29–30, 199–207.
Maes, D., & Van Passel, S. (2014). Advantages and limitations of exergy indicators to assess sustainability of bioenergy and biobased materials. Environmental Impact Assessment
Review. http://doi.org/10.1016/j.eiar.2013.11.002
Mancini, L., Benini, L., & Sala, S. (2015). Resource footprint of Europe: Complementarity of

146 Sustainability Assessment of Alluvial and Open Pit Mining Systems in Colombia: Life Cycle Assessment, Exergy Analysis, and Emergy Accounting
material flow analysis and life cycle assessment for policy support. Environmental Science
and Policy, 54. http://doi.org/10.1016/j.envsci.2015.07.025
Métodos de explotación minera. Vetas y Aluvión. (n.d.).
Ministerio de Minas y Energía. (2016). Boletín estadisticos de Minas y Energía 2012 – 2016. http://doi.org/10.1017/CBO9781107415324.004
Naciones Unidas. (2016). Colombia. Explotación de Oro de Aluvión. Evidencias a Partir de Percepción Remota. Oficina de Las Naciones Unidas Contra La Droga Y El Delito, 164.
Neumayer, E. (2010). Weak versus Strong Sustainability. (C. Edward Elgar, Ed.) (third ed).
Nguyen, M. T., Ziemski, M., & Vink, S. (2014). Application of an exergy approach to understand energy demand of mine water management options. Journal of Cleaner Production, 84, 639–648. http://doi.org/10.1016/j.jclepro.2014.04.004
Niembro, I. (2009). Energía y exergía: Enfoques hacia la sostenibilidad mediante el análisis de ciclo de vida. Congreso Nacional Del Medio Ambiente, 1–15.
Niembro, I., & Gonzalez, M. (2012). Energía y Exergía : Enfoques hacia la Sostenibilidad mediante el Análisis de Ciclo de Vida. Congreso Nacional Del Medio Ambiente.
OECD. (1996). Pollution Prevention and Control: Environmental Criteria for Sustainable Transport.
Ojeda, K. (2011). Aplicación de análisis exergético para la evaluación de procesos de producción de bioetanol de segunda generación, 33–45.
Patterson, M. (1996). What is energy efficiency? concepts, indicators and methodological issues. Energy Policy, 24, 377–90.
Perry, R. H., Green, D. W., & Maloney, J. O. (1997). Chemical Engineers ’ Handbook Seventh. Society (Vol. 27). http://doi.org/10.1021/ed027p533.1
Portha, J. F., Louret, S., Pons, M. N., & Jaubert, J. N. (2010). Estimation of the environmental impact of a petrochemical process using coupled LCA and exergy analysis. Resources,
Conservation and Recycling, 54(5), 291–298. http://doi.org/10.1016/j.resconrec.2009.09.009
Qian, H., Zhu, W., Fan, S., Liu, C., Lu, X., Wang, Z., … Chen, W. (2017). Prediction models for chemical exergy of biomass on dry basis from ultimate analysis using available electron concepts. Energy, 131, 251–258. http://doi.org/10.1016/j.energy.2017.05.037
Rocco, M. V., Di Lucchio, A., & Colombo, E. (2017). Exergy Life Cycle Assessment of electricity production from Waste-to-Energy technology: A Hybrid Input-Output approach. Applied
Energy, 194, 832–844. http://doi.org/10.1016/j.apenergy.2016.11.059
Rubio Rodríguez MA, De Ruyck J, Díaz PR, Verma VK, B. S. (2011). An LCA based indicator for evaluation of alternative energy routes. Applied Energy, 88, 630–5.
Soares, S.R., Toffoletto, L., Decheˆnes, L. (2006). Development of weighting factors in the context of LCIA. Journal of Cleaner Production, 14, 649–660.

Chapter 2 147
Song GH, Shen LH, X. J. (2011). Estimating specific chemical exergy of biomass from basic analysis data. Industrial & Engineering Chemistry Research, 50, 9758–66.
Szargut, J.; Morris, D.R.; Steward, F. R. (1988). Exergy Analysis of Thermal, Chemical and
Metallurgical Processes. (Hemisphere, Ed.). New York, NY, USA.
Szargut, J. (2005). Exergy method: Technical and ecological applications. (S. WIT Press, Ed.).
Szargut, J., Morris, D. R., & Steward, F. R. (1988). Exergy analysis of thermal, chemical, and
metallurgical processes. (Springer-Verlag Berlin and Heidelberg GmbH & Co. K, Ed.).
Talens, l., Villalba, G. Gabarrell, X. (2007). Exergy analysis applied to biodisel production. Resources, Conservation and Recycling, 51, 397–407.
Toxopeus, M. E., Lutters, D., & Van Houten, F. (n.d.). Environmental indicators & engineering; an alternative for weighting factors. In D. W. Willems, B. Duflou, J. (Ed.), Proceedings of the 13th
CIRP International Conference on Life Cycle Engineering (pp. 75–80). Leuven, Belgium.
Tuusjärvi, M. (2013). From a mine to you : Sustainability of the Finnish mining sector in the context of global supply chains of metals.
Uche, J. (2013). La energía en el agua. (P. de la U. de Zaragoza, Ed.). Zaragoza.
UNEP. (2011). Decoupling natural resource use and environmental impacts from economic
growth. (A. Fischer-Kowalski, M., Swilling, M., von Weizsäcker, E.U., Ren, Y., Moriguchi, Y., Crane, W., Krausmann, F., Eisenmenger, N., Giljum, S., Hennicke, P., Romero Lankao, P., Siriban Manalang, Ed.). A Report of the Working Group on Decoupling to the International Resource Panel. UNEP.
UNEP. (2012). Responsible Resource Management for a Sustainable World: Findings International Resource Panel.
Valero, A. (1998). Thermoeconomics as a Conceptual basis for Energy Ecological Analysis. Advances in Energy Studies. Energy Flows in Ecology and Economy, (February), 415–444.
Valero, A. (2013). From grave to cradle. A thermodynamic approach for accounting for abiotic resource depletion. Journal of Industrial Ecology, 17, 43–52.
Valero, A., Carpintero, Ó., Valero, A., & Calvo, G. (2014). How to account for mineral depletion . The exergy and economic mineral balance of Spain as a case study. Ecological Indicators, 46, 548–559. http://doi.org/10.1016/j.ecolind.2014.07.021
Valero, A., & Valero, A. (2010a). Physical geonomics: Combining the exergy and Hubbert peak analysis for predicting mineral resources depletion. Resources, Conservation and Recycling, 54(12), 1074–1083. http://doi.org/10.1016/j.resconrec.2010.02.010
Valero, A., & Valero, A. (2010b). Resources , Conservation and Recycling Physical geonomics : Combining the exergy and Hubbert peak analysis for predicting mineral resources depletion. “Resources, Conservation & Recycling,” 54(12), 1074–1083. http://doi.org/10.1016/j.resconrec.2010.02.010
Velásquez Arredondo, H. I. (2009). Avaliação exergética e exergo-ambiental da produção de

148 Sustainability Assessment of Alluvial and Open Pit Mining Systems in Colombia: Life Cycle Assessment, Exergy Analysis, and Emergy Accounting
biocombustíveis. Universidade de São Paulo.
WBCSD. Eco-efficiency: Creating More Value with Less Impact (2000).
Wedepohl, K. H. (1995). INGERSON LECTURE The composition of the continental crust. Geochimica et Cosmochimica Acta, 59(7), 1217–1232. http://doi.org/10.1016/0016-7037(95)00038-2
Whiting, K., Carmona, L. G., & Sousa, T. (2017). A review of the use of exergy to evaluate the sustainability of fossil fuels and non-fuel mineral depletion. Renewable and Sustainable
Energy Reviews, 76(March), 202–211. http://doi.org/10.1016/j.rser.2017.03.059
Wu, J., Wang, R., Pu, G., & Qi, H. (2016). Integrated assessment of exergy , energy and carbon dioxide emissions in an iron and steel industrial network. Applied Energy, 183, 430–444. http://doi.org/10.1016/j.apenergy.2016.08.192
Young, J., Septoff, A. (2002). Digging for change: towards a responsible minerals future. An NGO and community perspective. Mineral Policy Centre.
Zah, R., Böni, H., Gauch, M., Hischier, R., Lehmann, M., Wäger, P. (2007). Life cycle assessment of energy products: environmental assessment of biofuels. EMPA.

3. Emergy synthesis and Life Cycle Assessment integration (Em-LCA) for evaluating the environmental sustainability of gold production
ABSTRACT
Emergy and Life Cycle Assessment (EM-LCA) were carried out for the evaluation of
sustainability of two mining processes in Colombia: Open-pit and alluvial mining from
cradle to gate through quantification in emergy terms of the work that nature had to do to
provide renewable (R), non-renewable (NR) and imported (F) resources used in gold
production. Emergy cost associated with ecological services for diluting airborne /
waterborne pollutants and emergy equivalent for the loss of natural and human capital
associated with emissions.
Open-pit and alluvial mining are unsustainable in the long term, with values of ESI = 0.02
ESI = 0.03 respectively, excluding costs associated with air and water emissions, and ESI
= 1.76E-03 ESI = 3, 46E-02 including these costs. This is due to the high percentage of
imported resources demanded in mining process in relation to renewable resources (F =
0.88 for open-pit mining and F = 0.48 for alluvial mining), which implies a high
dependence on purchased resources, making this type of processes have weak
competition in the market. This explains the high economic value of gold in world market,
which internalizes the low contribution of renewable natural capital in the economy of the
process, allowing a rapid emergy return of imported resources and costs associated with
the environmental recovery of the process.

151 Sustainability Assessment of Alluvial and Open Pit Mining Systems in Colombia: Life Cycle Assessment, Exergy Analysis, and Emergy Accounting
KEYWORDS: Emergy accounting, Life cycle assessment, alluvial mining, open-pit
mining, sustainability.
HIGHLIGHTS:
● Life Cycle Assesment is an user-oriented approach and emergy accounting is a
donor-oriented approach
● Ecological services (EL) provided by water environment are higher in relation to
atmospheric environment
● Emergy equivalent of loss (natural and human capital) by air / water emissions are
not significant in either of two processes
● Imported resources (F) and renewable resources (R) contribute the most to
demanded emergy in the two mining processes
3.1 Introduction
The main challenge of sustainable development is how to balance the use of resources
and environmental impacts of economic production with the benefits obtained by society
(DE Campbell, 2004). Gold production has significant environmental impacts on
ecosystem and human health (Chen et al., 2018); is responsible for ecosystem
degradation due to mining-related vegetation removal and soil excavation (Asner, G.P.,
Tupayachi, 2017), and to the use of chemicals hazardous sources such as cyanide and
arsenic, generated serious impact on biodiversity and human health (Akpalu, W.,
Normanyo, 2017). However, the mining sector has played an important role in Colombian
economic and social environments, contributing the 2.2% of the GDP. For this reason it is
necessary to use methodologies to assess the environmental sustainability of mining
projects where the efficient use of renewable and non-renewable resources (Emergy
Synthesis), the loss of natural and human capital as a consequence of environmental
burden (Life Cycle Assessment), and the ecological services necessary to dilute the
emissions generated in the process are evaluated. All this in order to make environmental
decisions with the objective of minimizing impacts on ecosystem and human health, and
thus turn mining activity into an axis of economic and social development.
These methodological approaches are not mutually exclusive (Kharrazi, Kraines, Hoang,
& Yarime, 2014); on the contrary, they are considered to be more complementary rather

Chapter 3 152
than competitive among themselves. Since Life Cycle Assessment has a user-oriented
approach and emergy accounting has a donor- oriented approach.
Thermodynamic donor-side perspective refers to the work of the environment that would
be needed to replace what was consumed (Lacarrière, Deutz, Jamali-Zghal, & Le Corre,
2015). Thus, it accounts for all resources that are directly or indirectly supplied to support
production systems. It implies that the method is not good at measuring environmental
pollution (Asamoah, Zhang, Liang, Pang, & Tang, 2017). And user-side approach
assessment looks at final efficiency indicators (energy delivered per unit of energy input,
and emissions per unit of energy delivered); that is, it evaluates the impact of emissions in
the production chain (Lou, Qiu, & Ulgiati, 2015).
It is thus, as evidenced by fundamental differences between both methodologies, which
make them complementary. LCA (bottom-up environmental tool), aims to quantify
environmental impacts generated by the use of resources (emissions and waste
generated and released into the air, water and soil) from cradle to grave and containing
only up-stream and down -stream data of a product or service (categories per functional
unit) (Yu, Geng, Dong, Fujita, & Liu, 2016). Thus, it cannot embody indirect flows outside
the boundary system, ignores the work of ecosystems to provide 'freely available' services
and products (e.g. land restoration, rainfall, soil organic matter, etc.) (M. Raugei, Rugani,
Benetto, & Ingwersen, 2012). Emergy accounting provides a 'supply-side' evaluation by
assigning values to environmental efforts and investment of nature to make and support
flows, materials, and services; this method can evaluate the real contribution of natural
ecosystem to the economic system (Geng, Y., Sarkis, J., Ulgiati, 2016). Several
researches have addressed these two methodologies as complementary tools for
assessing the sustainability of development projects under different scales (Arbault,
Rugani, Tiruta-Barna, & Benetto, 2014; Brown, Raugei, & Ulgiati, 2012; Buonocore,
Vanoli, Carotenuto, & Ulgiati, 2015; Ingwersen, 2011; Kursun, Bakshi, Mahata, & Martin,
2015; Lou et al., 2015; M. Raugei et al., 2012; H. Pan, Zhang, Wang, et al., 2016; Reza,
Sadiq, & Hewage, 2014a, 2014b; B. Rugani, 2010). The combination of both
methodologies helps to track aggregate impacts caused by the consumption of resources
and the environmental burden generated, by providing a more complete picture of the
system accounting to meet sustainability challenges. To date, software has already been

153 Sustainability Assessment of Alluvial and Open Pit Mining Systems in Colombia: Life Cycle Assessment, Exergy Analysis, and Emergy Accounting
developed (SCALE) to calculate emergy values in base to Life Cycle Inventories (Arbault,
Rugani, Tiruta-Barna, et al., 2014; Marvuglia, Benetto, Rios, & Rugani, 2013).
Chen, 2018; in his study "Life Cycle Assessment of gold production in China" suggests
using emergy method for the assessment of gold production sustainability, due to the
effectiveness of the method to discover the relationship between socioeconomic and
natural systems (Chen et al. ., 2018). However, few studies have been developed around
the estimation of emergy indicators for the assessment of environmental sustainability in
extractive processes, because their application still presents theoretical and practical
barriers. Cement industry (Chen et al., 2016, Mikulčić, Cabezas, Vujanović, & Duić, 2016,
Pulselli, RM, Simoncini, E., Ridol fi, R., Bastianoni, 2008, Xiaohong Zhang et al., 2017),
fossil production (ET Campbell, 2015), oil refining processes (Bastianoni, Campbell,
Ridolfi, & Pulselli, 2009), gold production by open-pit method (Ingwersen, 2011), by
alluvial and underground technology (Asamoah et al., 2017). In that research,
underground mining presents a better sustainability index (SI = 0.52) for alluvial system
(SI = 0.33), being labor, operational cost, and machine maintenance the major
contributors to emergy consumption. In this sense, the low values of emergy sustainability
index are attributed mainly to the high percentage of non-renewable emergy used. It is
noteworthy that in this study, the sustainability of both systems was evaluated based only
on the use of resources, the loss of natural and human capital was not assessed, nor the
ecosystem services of dilution (Asamoah et al., 2017), so authors suggest to count the
environmental costs and impacts on the ecosystems and human health in future studies.
It can be concluded that, although natural resources provide human being welfare and
economic development of a country, their rapid extraction and consumption induces many
problems such as resource depletion, air pollutant emissions, wastewater discharge and
solid wastes. In this study, the work that nature had to provide to generate and
concentrate renewable, non-renewable and imported resources used for gold production,
and accounting the loss of natural and human capital as a consequence of airborne, and
waterborne emissions and solid waste generation (Bakshi, 2000), and ecological services
to dilute the emissions generated in the process (Ulgiati & Brown, 2002) will be evaluated
in emergy terms using Emergy Accounting and Life Cycle Assement; one as a
complement to the other (Em-LCA). This finally leads to the evaluation of sustainability of

Chapter 3 154
open-pit and alluvial mining extraction systems in Colombia using sustainable indicators
provided by emergy accounting.
3.2 Background
3.2.1. Emergy accounting
Humanity survival depends on natural resources: solar energy, wind, rain, geothermal
heat, ocean energy, minerals, and fossil fuels. The driving forces of solar radiation, deep
heat, and gravitational potential of the system, provide a set of ecosystem services (water
cycling, air cycling, oceanic currents, cycling of nutrients, among others) and build natural
capital storages (mineral and fossil fuel stocks, topsoil, standing forests, water reservoirs
and biodiversity). The work that nature had to do to concentrate those resources and
human work to transform them into products and services can be quantified in common
units (solar equivalents unit) that give rise to what is known as emergy (Lou et al., 2015).
Emergy is defined as the available energy (exergy) of one kind (common basis, solar
energy) that is used in transformations, directly and indirectly, to make a product or
service (ET Campbell, 2015) expressed on a common energy metrics: solar equivalent
joules (SeJ). That is, the emergy of a process is the sum of all renewable (R), non-
renewable (NR), and imported resources (F) multiplied by their respective Unit Emergy
Value (UEV) Ec. (3.1)
(3.1)
Where, Em is the total emergy calculated over all the independent input flow, E i is the
available energy or exergy (R, NR, F), and Tri is the solar transformity of the ith input flow
of a product or service. With this definition of emergy, human labor, utilities, raw materials,
goods and services can be compared to identify critical processes, measure the real
value of natural resources and give historical information (Zhelev, 2007). Note that
emergy can be expressed as a function of exergy, but it leads to an absolutely different
meaning and rationale: not all emergy is equal to exergy. That is, if the amount of energy
directly and indirectly required to produce a certain item is high (after a process of
selection), it means that the item has high emergy and is valuable for the system,
=∑ × = , , , , …

155 Sustainability Assessment of Alluvial and Open Pit Mining Systems in Colombia: Life Cycle Assessment, Exergy Analysis, and Emergy Accounting
regardless of the exergy it potentially carries (Nielsen, SN, Bastianoni, 2007). For emergy,
the system is the earth as a whole that takes energy of the sun as its basic impeller, while
for exergy, the system is defined according to the objectives of the study and focuses on
the amount of exergy of the first step (sources) of energy transformation of the system.
Since the exergetic equivalent of solar energy is ~0.93 (Wall & Gong, 2001) (and that it is
maintained through all energy transformations, it is possible to calculate emergy
depending on exergy (Buitrago Soto, 2014).
Values of UEV (transformity, specific emergy, emergy per unit money, etc.) represent the
ratio of solar energy embodied in a product or process in terms of seJ per joule (sej / J),
per kilogram (sej / kg), or per money earned (sej / $) respectively (NA Cano Londoño,
Suárez, Velásquez, & Ruiz-Mercado, 2017, HT Odum, 1996, B. Rugani, 2010). For
example, if 4,000 solar emjoules are required to generate a joule of wood, then the solar
transformity of that wood is 4000 seJ/J. UEVs have been calculated for a wide variety of
energies, materials and services, and this builds up a solid foundation for emergy analysis
(Howard T Odum, Brown, & Brandt-Williams, 2000), and provides the memory of all
energies used to produce a particular resource / product (Zhelev, 2007). UEV were
rescaled based on geo-biosphere baseline, which is established by a calculation
procedure that takes into account the connection between solar radiation, geothermal
heat, and gravitational potential energy (geo-biosphere drivers) (ODUM, 2001). However,
one of the main drawbacks of emergy accounting is to calculate UEVs or transformities
that could change according to time, process, geography, and other variables (Reza et
al., 2014b). That is, transformities are not constant nor have they the same value for the
same product everywhere, since many different pathways may be chosen to reach the
same end state (Amaya, 2009).
(3.2)
For practicality, it is very common to use transformations derived from other studies,
whose values are valid under a series of small conditions such as place / time. However,
there is generally a range of values for the same product, which depends on the
production process (Hossaini & Hewage, 2013). This is one of the main arguments
contractors of emergy analysis and policy makers have to prioritize the use of other
= 𝐴

Chapter 3 156
evaluation methodologies such as Life Cycle Assessments, Material Flow Accounting,
etc., above emergy accounting, since this fact could reduce the accuracy of final
indicators. Odum recommends using reasonable calculated transformities found in
Appendix C of the book "Environmental Accounting: Emergy and Environmental Decision
Making" as long as similar systems are discussed (Howard T Odum & Odum, 2003). In
this investigation, transformity factors of other studies with characteristics similar to the
systems assessed here were taken, making possible to incur an insignificant error
compared with the errors that could occur if these are calculated from the information we
count on.
3.2.2. Emergy "algebra"
Like a thermodynamic analysis, emergy evaluation requires to define the limits of the
system and to consider a time scale (Le Corre & Truffet, 2015), apart from that, Odum
stated four rules to allocate emergy inputs in the case of complex systems. Emergy
"algebra" is summarized under the following 4 rules (HT Odum, 1996), that focus basically
on the difference between the categories of splits and co-products (or by-products) (M.T
Brown & Herendeen, 1996). In particular, co-products are "product items showing
different physicochemical characteristics, but which can only be produced jointly"
(Sciubba & Ulgiati, 2005). Splits instead are "originating flows showing the same physico-
chemical characteristics" (Sciubba & Ulgiati, 2005).
(1) All emergy sources of a process are assigned to processes output, that is,
when a single product is obtained in the process.
The following rules apply when there is more than one output:
(2) By-products from a process have the total emergy assigned to each pathway.
(3) When a pathway splits, emergy is assigned to each 'leg' of the split based on its
percentage of total energy flow on the pathway.
(4) Emergy cannot be counted twice within a system, i.e. Emergy in feedbacks
cannot be double-counted and Co-products, when reunited, cannot be summed up. Only
the emergy of largest co-product flow is accounted for.

157 Sustainability Assessment of Alluvial and Open Pit Mining Systems in Colombia: Life Cycle Assessment, Exergy Analysis, and Emergy Accounting
Emergy accounting is a successful tool for assessing the sustainability of development
projects, however, it ignores waste management, which is an important characteristic of
industrial processes; so it is necessary to use complementary methodologies such as
LCA and exergy in order to compare in a holistic way the merits and deficiencies of
different alternatives to be evaluated with regard to environmental impacts assessing
(Song, Wang, Li, & Duan, 2012)
3.3 Methodology
In 2001, the Organization for Economic Cooperation and Development (OECD) defined a
criterion for environmental sustainability (OECD, 2001) as:
● Regeneration: the consumption rate of renewable resources must not exceed their
natural regeneration rate through efficient use
● Assimilation: polluting emissions must not exceed the capacity for environmental
assimilation
● Avoiding irreversibility
In this study the first issue will be addressed by accounting for the consumption of
renewable (R), non-renewable (NR) and imported (F) resources in solar equivalent joules
(SeJ); this distinction makes it possible to define several emergy-based indicators as a
tool for environmental decision making, mainly when it comes to alternatives comparison.
The second criterion will be addressed by calculating the emergy equivalent of natural
loss due to discharge of solid waste on land (SW), emergy equivalent of human health loss
(HH), and emergy equivalent of regional natural resources (THEEQ) due to given emission.
The last criterion was addressed in (Natalia A. Cano Londoño, Ordoñez Loza, Posada, &
Velásquez, submitted) by exergy approach, and waste emergy was considered as the
cost of waste disposal, treatment or soil occupied by waste disposal as the case may be.
3.3.1 Emergy accounting method
Emergy evaluation consists of the following steps:

Chapter 3 158
a) Identification of system boundaries. Drawing energy flow chart of the studied system is
in this step, this diagram is an overview of the scope and boundaries of analysis in where
it can be perceived as a thermodynamic engine that ingests resources to produce specific
amenities; produce emissions to air, water, and land. Boundaries system goes from
cradle to gate in gold production systems in Colombia: open-pit mining Figure 3-1 and
alluvial system Figure 3-2, where the inter-relationships of renewable (R), nonrenewable
(NR) and imported resources inputs, and waste and emission in all phases of the process
of both mining systems; mine operation, mining, ore benefit, refining, foundry and waste
treatment, Table 3-1. Simultaneously, it is associated with socio-economic impacts
including monetary costs and purchased labor and services.
In open-pit mining, given the topographic features of the area where the mineral is
located, as well as the depth and type of soil that, in some cases, contains mineralization
(mineralized saprolite), led to select open-pit extraction method as the best alternative
through the use of explosives, followed by the benefit of mineral through physical-
chemical processes. The intervention area is equal to 119.36 hectares for 24 years
lifespan of the project (3 years of resettlement, 2.5 years in construction and assembly, 11
years in operation and 7.5 years in construction and assembly). On average, 19.05 tons
of gold and 21.55 tons of silver are generated annually as a co-product.
In alluvial mining, gold extraction process is made by means of bucket dredges, following
the cutting and filling method. Gold benefit is given by gravimetric concentration on board
the dredger and with a constant environmental recovery that involves productive
processes together with the local community. Annually, an average of 3.10 tons of gold
and 1.55 tons of ferrous ore are generated as a co-product.
Table 3-1: Open-pit and alluvial mining process.
Phase Process Open-pit Mining Subsystems Alluvial
Mining Subsystems Mine Operation
Clearing and stripping Clearing and stripping by suction
dredgers Biomass deposit Exploration
Mining Mineral excavation Dipper dredger (Dredging line step) Primary crushing Mineral extraction services Inert material deposit
Benefit ore
Secondary milling (grinding mill) Classification by size (mechanical screening)
Floatation Gravimetric concentration by

159 Sustainability Assessment of Alluvial and Open Pit Mining Systems in Colombia: Life Cycle Assessment, Exergy Analysis, and Emergy Accounting
hydraulic jigs Gravimetric separation Gravimetric concentration by sluice
boxes
Refining
Leaching Physical separation (floatation) Carbon adsorption Filtration-Separation Elution Chemical separation Carbon regeneration Drying and separation of ferrous
minerals
Fundition Market for precious metal Casting and Molding Fundition and Refinement
Waste treatment
Detoxification Waste Tailings Treatment Plant (WTTP)
Deposition of tails (tailing pond) Deposition of tails (tailing pond) Product Gold Gold
Co-product Silver Ferrous metal
b) Data sources: Identification and quantification of matter, energy and money flows that
support the process. Appendix H shows the matter and energy balance for both
processes, data lies in annual primary information provided by each company with the
respective balances of matter, energy and money flows that support the process,
including renewables provided for free by the environment (R), non-renewables locally
available (N), and imported goods and commodities. It is noteworthy that for practical and
representative purposes of the present study, balances of matter and energy in each
stage of the production cycle are associated with a production history of 6 years for
alluvial mining, and 11 years for open-pit mining with nominal values.
c) Conversion of the different flows into emergy units by means of suitable conversion
factors (UEVs, Unit Emergy Values), editing emergy analysis table. In this study the
baseline was 15.83 x 1024 seJ / year (Howard T Odum et al., 2000), all the UEVs
calculated using the old planetary baselines, such as 9.26 x 10 24 seJ / year, 9.44 x 10 24
seJ / year, 1.52 x 10 25 seJ / year and 1.16 x 10 25 seJ / year were scaled up to 15.83 x
1024 seJ / year with factors such as 1.71, 1.68, 1.04 and 1.36, respectively, being the
correction factor the ratio between new and old value (15.83 x 10 24 /9.26 x 10 24 = 1.68)
(Odum et al., 2000). This conversion is performed by equation (3.1).
d) Calculating proposed indicator values, and finally analyzing results and putting forward
some targeted measures or suggestions. In this study, emergy indicators to be analyzed
allow to evaluate three types of impacts: upstream (use of direct and indirect resources
for extraction, benefit and refinement of gold), downstream (ecological services for the
dilution of pollutants in air and water, and natural and human capital losses due to

Chapter 3 160
generated emissions), and socio-economics (socio-economic contribution to make a
product, process, or service available). Sections 3.2. and 3 .3. describe the calculated
emergy indices.

Figure 3-1: System emergy diagram showing the interrelation of renewable (R), nonrenewable (NR) and imported flows (F) of open pit mining process.

163 Sustainability Assessment of Alluvial and Open Pit Mining Systems in Colombia: Life Cycle Assessment, Exergy Analysis, and Emergy Accounting
Figure 3-2: System emergy diagram showing the interrelation of renewable (R), non-renewable (NR) and imported (F) flows of alluvial mining process.

Chapter 3 165
3.3.2 Traditional sustainable emergy indicators
The method combines irreversible thermodynamics principles and system ecology as
basis for evaluating the environmental performance of a product system (Asamoah et al.,
2017), by using traditional emergy indicators. It is possible to define several emergy-
based indicators (HT Odum, 1996) that can provide decision support tools on public policy
and environmental management holistically, especially when there are several
alternatives (Brown & Bardi, 2001). Table 3-2 describes traditional sustainable emergy
indicators: Emergy Yield Ratio (EYR), Environmental Loading Ratio (ELR), Emergy
Sustainability Index (ESI), Emergy Exchange Ratio (EER), Emergy Investment Ratio
(EIR), Renewability (RI), Soil Emergy Cost (SEC), Product Unit Emergy Value (PUEV),
Unit Emergy Value of Economic output (UEVE).
Table 3-2: Traditional emergy index.
ITEMS Expression Description Renewable natural resource [seJ / yr]
R Includes sun, wind, water river, oxygen, etc.
Non-renewable natural resource [seJ / yr]
NR Includes limestone, clay, sandstone and gypsum, etc.
Purchased inputs [seJ / yr] F
Includes coal, petroleum, labor, extractive cost, operating cost, restauration cost and service, etc.
Total emergy, Y [seJ / yr] 𝑌 = + +
Total sum of renewable sources (R), non-renewable energy and resources (N) and imported total resources (F).
Environmental loading ratio, ELR [-]
= +
ELR refers to the relationship between inputs of non-renewable and imported resources to the use of renewable resources by the system (Cao & Feng, 2007). Where F represents total input of imported resources (eg, machinery, human labor), R is the total input of renewable resources (eg, oxygen consumption), and NR is the total input of nonrenewable resources (e.g. chemical substances) (NA Cano Londoño et al., 2017). Low values of ELR (ELR <2), indicate processes having a low environmental impact or a very large area to dissipate any negative environmental impact. When ELR>10 there is a high environmental load, and when 2 < ELR < 10 the impact is considered moderate (Cao & Feng, 2007).
Emergy yield ratio , EYR [-] 𝑌 = + +
Indicates the relationship or dependency between the total system emergy on imported resources (NA Cano Londoño et al., 2017). It is used to

166 Sustainability Assessment of Alluvial and Open Pit Mining Systems in Colombia: Life Cycle Assessment, Exergy Analysis, and Emergy Accounting
estimate the dependence of the process on imported resources, and shows the contribution of local natural capital in the economy of the region or the process. Low values of EYR indicate low economic benefits and a weak market competition. On the contrary, high values of EYR denote strong competition ability and high economic benefits (XH Zhang et al., 2010). For example, an EYR<5 indicates that a large number of secondary energy resources were used in the process; raw materials such as cement, steel and
others. An EYR>5 indicates the use of primary energy resources and when EYR <2 Indicates no significant contribution of local resources and this is associated to processes which are almost entirely manufactured externally (Brown et al., 2012).
Emergy Sustainability Index, ESI [-]
= 𝑌
ESI encompasses the relationship between emergy yield ratio and environmental load ratio (NA Cano Londoño et al., 2017). This index reflects the ability of a system to provide products or services with minimal environmental stress and a maximum economic benefit (XH Zhang et al., 2010). When ESI<1, process and products are not sustainable in the long term and high economic systems (Zhang, XH, Pang, MY, Wang, 2014). When 1<ESI<5 a sustainable contribution to the economy for mid-term periods. For processes with ESI>5 can be considered sustainable in the long term (Cao & Feng, 2007). However, when ESI>10 the process is considered underdeveloped (Zhang, XH, Pang, MY, Wang, 2014).
Emergy Inversion Ratio , EIR [-] = +
Indicate the relationship between input of imported resources into the system over the total amount of renewable and non-renewable resources (NA Cano Londoño et al., 2017). When comparing different process alternatives using this indicator, the process alternative scoring the lower value tends to be the most competitive and to thrive in the market. Generally, a higher value means a higher level of economic development of the system (LX Zhang, Yang, & Chen, 2007).
Renewability Index, RI [%] = + +
This indicator comprises a relationship between the inputs of renewable sources for the system over the total input of emergy sources (NA Cano Londoño et al., 2017). Systems with a high percentage of renewable emergy are more likely to be more sustainable and prevail, if they have to survive under economic stress, than those using more nonrenewable emergy inputs (Cohen, Brown, & Shepherd, 2006).
Soil Emergy Cost, SEC [-] = + +
Is the ratio between non-renewable inputs in an agricultural system and total emergy inputs. This indicator provides a cost-benefit (soil-agriculture) relationship for farming practices. Thus, SEC compares agricultural yields to the loss of emergy associated with eroded soil and represents the amount of degraded soil per emergy unit. The value of this index should be less than one (Zhang et al., 2007).
Emergy Exchange Ratio , EER
= + + ∗
Is calculated by dividing total emergy of the product by emergy received from the sale. The "emergy money ratio" known as emergy-money or emergy exchange, is the amount of emergy that can be purchased in one country by a unit of money (one dollar) in a specific year (NA Cano Londono et al., 2017). In addition, EER provides a measure of who won during trading between

Chapter 3 167
consumers and producers (Cohen et al., 2006). An EER>1 indicates that more emergy was supplied to consumers than received in exchange. In other words, producer received less emergy (sales revenue as emergy equivalents) than the amount of emergy used to produce the good. An EER<1 indicates the manufacturer made a profit and received more emergy than the used for producing the good.
Product unit emergy value, PUEV [seJ / g]
= 𝑌
It is defined as the equivalent solar emergy required per unit of product output. And this indicator is inversely related to the efficiency of a production system (Brown et al., 2012).
Unit emergy value of economic output UEVE [seJ / USD]
= 𝑌
This indicator connects economic activity to emergy flows that support economy within a given year (Y. Pan & Li, 2016). For evaluating how regional economic system depends on resource and local money purchasing power (Yu, Geng, Dong, Ulgiati, et al., 2016). A higher value of this indicator means that more resources would be used to generate the same amount of money (Zhang, L., Geng, Y., Dong, H., Zhong, Y., Fujita, T., Xue, B. , Park, 2016)
3.3.3 Improved sustainable emergy index
As mentioned above, emergy analysis was used together with LCA approach (Em-LCA)
to quantify the emergy equivalent of ecological services (ESair, ESwater), emergy equivalent
of natural loss due to discharge of solid waste on land ( ELSW), emergy equivalent of
human health loss (ELHH), and emergy equivalent of regional natural resources (ELEQ)
due to given emission. For instance, Life Cycle Assessment (LCA) can effectively
measure downstream environmental burden, e.g., the impact of emissions in the
production chain (H. Pan, Zhang, Wu, et al., 2016). In this LCA study, all materials
emissions and energy consumption were based on 1 kg of gold as a functional unit under
Ecoindicador 99 metodhology, Ecoinvent 3.1. Database, and Umberto NTXUniversal
software (Cano, submitted).
Ecological services
It is necessary to account for ecological services that environment provides (water and air
resource) for the dilution of those pollutants generated in the process, at levels accepted
for compliance with environmental regulations. Ecological services are environmental self-
purification; which includes physical, chemical and biological processes, and are often the
last step maintaining environmental quality (H. Pan, Zhang, Wu, et al., 2016)
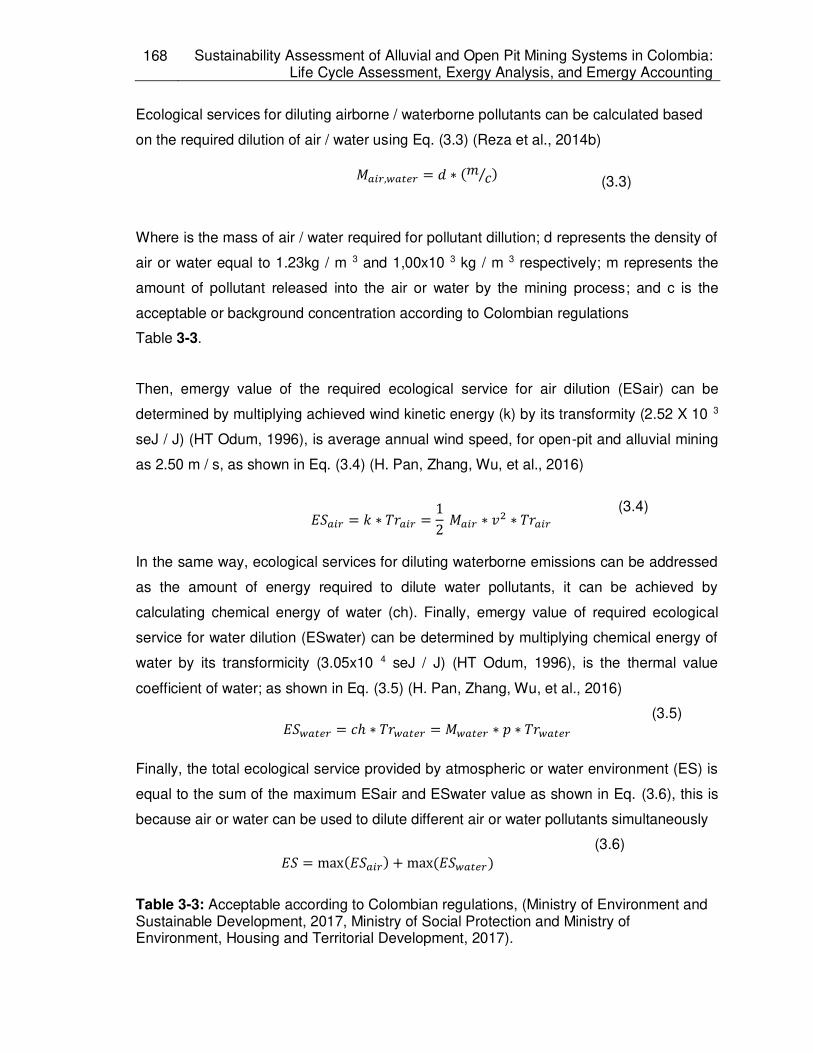
168 Sustainability Assessment of Alluvial and Open Pit Mining Systems in Colombia: Life Cycle Assessment, Exergy Analysis, and Emergy Accounting
Ecological services for diluting airborne / waterborne pollutants can be calculated based
on the required dilution of air / water using Eq. (3.3) (Reza et al., 2014b)
(3.3)
Where is the mass of air / water required for pollutant dillution; d represents the density of
air or water equal to 1.23kg / m 3 and 1,00x10 3 kg / m 3 respectively; m represents the
amount of pollutant released into the air or water by the mining process; and c is the
acceptable or background concentration according to Colombian regulations
Table 3-3.
Then, emergy value of the required ecological service for air dilution (ESair) can be
determined by multiplying achieved wind kinetic energy (k) by its transformity (2.52 X 10 3
seJ / J) (HT Odum, 1996), is average annual wind speed, for open-pit and alluvial mining
as 2.50 m / s, as shown in Eq. (3.4) (H. Pan, Zhang, Wu, et al., 2016)
(3.4)
In the same way, ecological services for diluting waterborne emissions can be addressed
as the amount of energy required to dilute water pollutants, it can be achieved by
calculating chemical energy of water (ch). Finally, emergy value of required ecological
service for water dilution (ESwater) can be determined by multiplying chemical energy of
water by its transformicity (3.05x10 4 seJ / J) (HT Odum, 1996), is the thermal value
coefficient of water; as shown in Eq. (3.5) (H. Pan, Zhang, Wu, et al., 2016)
(3.5)
Finally, the total ecological service provided by atmospheric or water environment (ES) is
equal to the sum of the maximum ESair and ESwater value as shown in Eq. (3.6), this is
because air or water can be used to dilute different air or water pollutants simultaneously
(3.6)
Table 3-3: Acceptable according to Colombian regulations, (Ministry of Environment and Sustainable Development, 2017, Ministry of Social Protection and Ministry of Environment, Housing and Territorial Development, 2017).
, = ∗ ⁄
= ∗ = ∗ ∗
= ℎ ∗ = ∗ ∗
= max + max
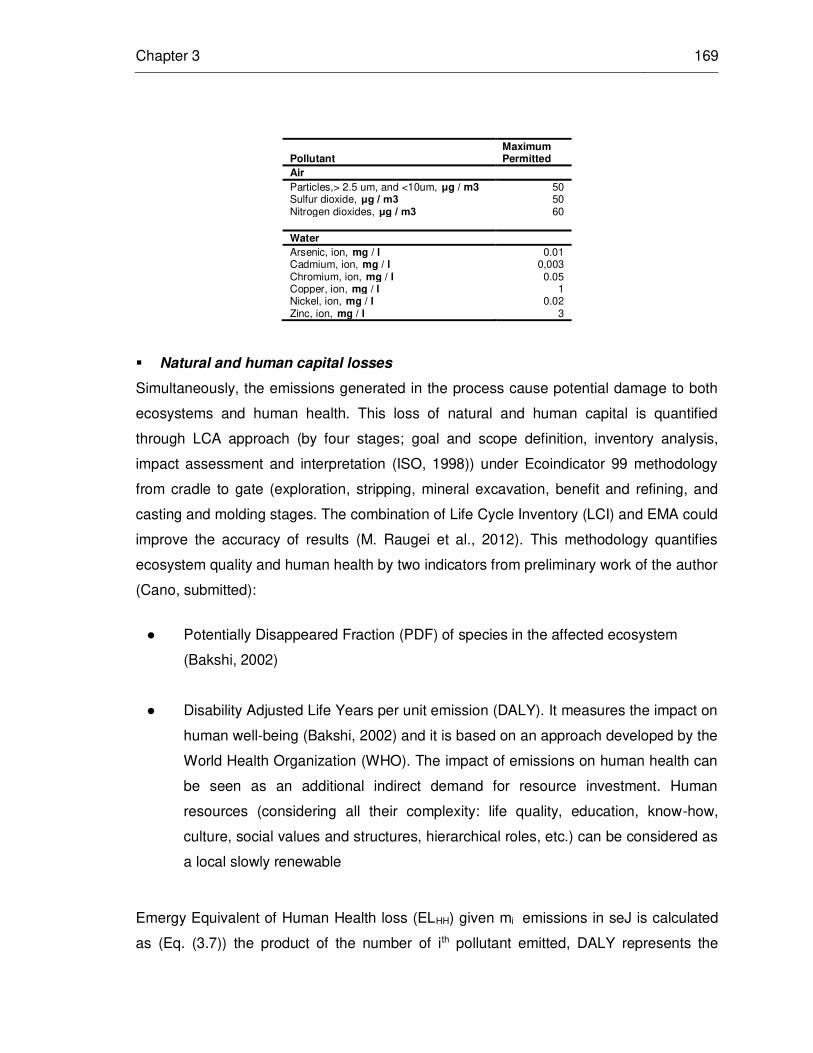
Chapter 3 169
Pollutant Maximum Permitted
Air Particles,> 2.5 um, and <10um, μg / m3 50 Sulfur dioxide, μg / m3 50 Nitrogen dioxides, μg / m3 60 Water Arsenic, ion, mg / l 0.01 Cadmium, ion, mg / l 0,003 Chromium, ion, mg / l 0.05 Copper, ion, mg / l 1 Nickel, ion, mg / l 0.02 Zinc, ion, mg / l 3
Natural and human capital losses
Simultaneously, the emissions generated in the process cause potential damage to both
ecosystems and human health. This loss of natural and human capital is quantified
through LCA approach (by four stages; goal and scope definition, inventory analysis,
impact assessment and interpretation (ISO, 1998)) under Ecoindicator 99 methodology
from cradle to gate (exploration, stripping, mineral excavation, benefit and refining, and
casting and molding stages. The combination of Life Cycle Inventory (LCI) and EMA could
improve the accuracy of results (M. Raugei et al., 2012). This methodology quantifies
ecosystem quality and human health by two indicators from preliminary work of the author
(Cano, submitted):
● Potentially Disappeared Fraction (PDF) of species in the affected ecosystem
(Bakshi, 2002)
● Disability Adjusted Life Years per unit emission (DALY). It measures the impact on
human well-being (Bakshi, 2002) and it is based on an approach developed by the
World Health Organization (WHO). The impact of emissions on human health can
be seen as an additional indirect demand for resource investment. Human
resources (considering all their complexity: life quality, education, know-how,
culture, social values and structures, hierarchical roles, etc.) can be considered as
a local slowly renewable
Emergy Equivalent of Human Health loss (ELHH) given mi emissions in seJ is calculated
as (Eq. (3.7)) the product of the number of ith pollutant emitted, DALY represents the

170 Sustainability Assessment of Alluvial and Open Pit Mining Systems in Colombia: Life Cycle Assessment, Exergy Analysis, and Emergy Accounting
Disability Adjusted Life Years per unit emission (yr x g-1 ), and Ep is the total annual
emergy used in a country or region divided by its population, for Colombia it is equal to
1.98x10 -6 seJ / yr / pop (Colombian annual emergy equal to 98.6 seJ / yr (Comar &
Komori, 2007), Population 49,750,404 people (DANE, 2017)) (Liu, Z. Yang, B. Chen,
2011).
(3.7)
Furthermore, emergy equivalent of loss in support of local ecological resources (ELEQ)
given a mi emission, the product of the amount of i th chemical released can be measured,
PDF (%) is calculated as PDF xm 2 x r x kg -1, and Ebio represents the unit of annual
emergy allocated to natural regional capital (and LZG Liu, Z. Yang, B. Chen, 2011, Reza
et al., 2014b)
(3.8)
Finally, emergy equivalent of natural loss due to discharge of solid waste on land, ELSW is
calculated as the multiplication of solid waste total mass (tonne) mi, the land occupation
factor Loc 2,85X10⁴ ha/tons of waste. EL is the emergy value unit of land restoration per
area (seJ/ha) assuming 50 years recovery time, due to land erosion, and replacement can
be measured using the UEV of 1.05E+15 seJ/ha (H.T Odum, 1996)
(3.9)
Table 3-4 summarizes emergy equivalent loss and ecological services indicators together
with traditional modified emergy indices. Note that the modification of indices lies in
emergy feedback (from economy and ecology), F1
Table 3-4: Improved emergy indicators.
ITEMS Expression Unit Emergy equivalent of human health loss, EL HH = ∑ × 𝐴 𝑌 × seJ / yr
Emergy equivalent of ecological loss, EL EQ =∑ × % × seJ / yr Emergy loss due to solid waste discharge on land, SW =∑ × × 𝐿 seJ / yr Ecological services for dispersal of air pollutants, ESair = ∗ = ∗ ∗ seJ / yr Ecological services for dispersal of water Pollutants, ESwater
= ℎ ∗ = ∗ ∗ seJ / yr
= ∑ × 𝐴 𝑌 ×
= ∑ × % ×
=∑ × × 𝐿

Chapter 3 171
Emergy feedback (from economy and ecology), F 1
= + + seJ / yr
Emergy equivalent of loss, EL 𝐿 = + + seJ / yr Total emergy, Y 1 𝑌 = + + seJ / yr Environmental loading ratio, ELR 1 = + -
Emergy yield ratio, EYR 1 𝑌 = + + -
Emergy Sustainability Index, ESI 1 = 𝑌 -
Emergy Inversion Ratio, EIR 1 = + -
Renewability Index, RI 1 = + + %
Soil Emergy Cost, SEC 1 = + +
Emergy Exchange Ratio, EER 1 = + + ∗
Product Unit Emergy value, PUEV 1 = 𝑌 seJ / g
Emergy Loss Percentage, * ELP% = 𝑌 % Unit Emergy Value of Economic output, UEVE 1
= 𝑌
* Total emergy loss includes ecological and economic losses caused by emissions in terms of emergy. The bigger the ratio, the greater emissions impacts on the production process (Zhang, X.H., Jiang, W.J., Deng, S.H., Peng, 2009). This indicator also measures the cleaner production level of industrial enterprises and their press on the environmental system indirectly. A larger ratio means the lower cleaner production level and higher environmental loading (H. Pan, Zhang, Wu, et al., 2016).
In this way making use of traditional and improved emergy indicators, emergy algebra
comprises two parts: 1) resources and energy inputs 2) emissions. In the same way the
emergy embodied into the product (gold) is composed of the work of biosphere and goods
and services necessary for manufacturing the product (technosphere) (Liu, Z. Yang, B.
Chen, 2011).
3.3.4 Sensitivity analysis
Finally, sensitivity analysis is carried out, its objective is to evaluate the variation of
sustainability indices (ELR, EYR, EER, ESI) when emergy efficiency (PUEV) is improved
by 10, 20,.., 50%. The same analysis is done by varying the entry of imported resources
(F), given that low sustainability of both mining processes is due to the high dependence
on purchased resources in relation to free renewable resources. If sensitivity analysis
verifies that these variations do not alter the final conclusions of emergy analysis, the
evaluation will be finalized and the most viable alternative will be selected. Otherwise it
might be necessary to apply an uncertainty modeling technique to characterize and

172 Sustainability Assessment of Alluvial and Open Pit Mining Systems in Colombia: Life Cycle Assessment, Exergy Analysis, and Emergy Accounting
propagate the effects of different sources of uncertainties incorporated in emergy process,
which is already outside the scope of this study.
3.4 Results
Figure 3.1 and Figure 3.2 present emergy diagram for open-pit and alluvial mining
processes. Following the emergy accounting method stages, Table 3-5 and Table 3-6
show emergy calculations for both mining systems discretizing renewable, nonrenewable,
and imported resources from primary data provided by two mining companies, and
material and energy balances described in Appendix H. In addition, Appendix L and
Appendix M shows renewable, non- renewable and purchased input resources for each
stage of both mining processes. It is noteworthy that, in order to avoid a double
accounting of renewable resources provided by nature (sun, rain, wind, gethermal heat),
rain value (highest score) is the only one considered for renewable inputs.
As previously stated, emergy evaluation could benefit from the use of Life Cycle Inventory
(LCI) databases, which represent hundreds of environmental interventions in thousands
of common industrial processes, such as Ecoinvent database (Hischier et al., 2010), or
using detailed LCA data sets to improve the resolution of emergy assessments (Arbault,
Rugani, Marvuglia, Benetto, & Tiruta-Barna, 2014) and to calculate emergy unit values
(UEV), that is, emergy per product unit (Benedetto Rugani, Huijbregts, Mutel, Bastianoni,
& Hellweg, 2011). In this study, transformities for compounds such as cyanide and
hydrogen peroxide were taken from solar emergy factors calculated for unit processes of
Ecoinvent database v2.1. (Benedetto Rugani et al., 2011), since the use of a large
database like ecoinvent may provide reliable, consistent and available equivalent solar
energy data on the level of unit process (B. Rugani, 2010)
In open-pit mining, total emergy is equal to 1.13E + 21 seJ / yr, where 87% corresponds
to the use of imported resources (F), 11% to the use of non-renewable resources (NR)
and 1% to the use of renewable resources. Water and oxygen inputs are the main emergy
contributors to renewable resources with 49% and 48% respectively. Water used mainly
at milling and gravimetric separation stages, and oxygen in leaching stage. 97% of non-
renewable input emergy comes from inorganic soil removed (sterile mineral) in the
excavation process. Finally, 62% of purchased resources corresponds to electricity

Chapter 3 173
consumption and 29% to machinery. It is noteworthy that in this process it is generated as
a co- product.
Similarly, in alluvial mining the total emergy is equal to 1.13E + 21 seJ / yr, discretized as
follows: 52% non-renewable resources, 47% imported resources and 2% renewable
resources.
The largest non-renewable input corresponds to organic soil loss (70%), the highest input
purchased corresponds to machinery (90%), and the largest renewable input corresponds
to water (98%) in a considerable percentage since the entire extractive process is done
inside the artificial water pool (float up of suction dredger) where the extractive process is
developed, and water used in the mineral beneficiation process.
On the other hand, like total emergy in each mining process, emergy value is equal to
9,54E + 07 $ / yr and 9,57E + 07 $ / yr for open-pit and alluvial mining respectively.
Table 3-5: Emergy calculations from open-pit mining process, discretizing renewable, nonrenewable, and imported resources.
Note
Item
Unit
Data (units / yr)
Solar unit emergy * (seJ / unit)
Solar emergy (seJ / yr)
Em $ Value ($ / yr)
Emergy fraction
RENEWABLE RESOURCES 1 Sun J 2,44E + 15 1,00E + 00 2,44E + 15 2.07E + 02 2 Rain, chemical energy J 9.86E + 12 3,10E + 04 3.06E + 17 2,59E + 04 0,0003 3 Wind, kinetic energy J 6.92E + 10 2,45E + 03 1,70E + 14 1,44E + 01 4 Geothermal heat, J 1.58E + 10 2,08E + 04 3,29E + 14 2.79E + 01 5 Water m 3 5,80E + 07 1,26E + 11 7.31E + 18 6,20E + 05 0.0065 6 Oxygen (air) ton 8,35E + 04 8.66 + 13 7.23E + 18 6,12E + 05 0.0064 7 Vegetation covered harbors kg 1.33E + 06 9.96E + 10 1.33E + 17 1,12E + 04 0.0001 NONRENEWABLE STORAGES 8 Organic soil loss J 2.57E + 13 1,24E + 05 3,18E + 18 2,70E + 05 0.003 9 Inorganic soil removed (sterile
mineral) kg 6.93E + 13 1.73E + 06 1,20E + 20 1.02E + 07 0.107
PURCHASED INPUTS 10 Fuel J 1,15E + 15 3,84E + 04 4,40E + 19 3,73E + 06 0.039 11 Electricity J 2,03E + 15 2,92E + 05 5.92E + 20 5.01E + 07 0,526 12 Gas (liquefied petroleum gas) MJ 1,68E + 07 8,05E + 10 1,35E + 18 1,14E + 05 0.001 13 Explosives g 1,41E + 10 4.19E + 09 5.89E + 19 5,00E + 06 0.052 14 Machinery g 1,52E + 10 1.79E + 10 2.73E + 20 2.31E + 07 0,242 15 Cyanide kg 2,00E + 06 1.33E + 08 2,65E + 14 2,25E + 01 2,36E-
07 16 Sodium hydroxide ton 1.08E + 02 1.08E + 02 1,17E + 04 9,90E-10 1.04E-

174 Sustainability Assessment of Alluvial and Open Pit Mining Systems in Colombia: Life Cycle Assessment, Exergy Analysis, and Emergy Accounting
17
17 Lime ton 2,30E + 03 1,68E + 15 3,86E + 18 3,27E + 05 0.003 18 Amylxanthate (PAX) g 4.37E + 08 2.33E + 09 1,23E + 18 1.04E + 05 0.001 19 Methyl-isobutyl-carbinol (MIBC) g 4.37E + 08 2.33E + 09 1.02E + 18 8.63E + 04 0.001 20 Coal kg 2.41E + 12 1,78E + 05 4,30E + 17 3,64E + 04 3.82E-
04 21 Hydrogen peroxide kg 1,10E + 03 4.00E + 06 4.42E + 09 3,74E-04 3.92E-
12 22 Sodium metabisulfite g 1,27E + 08 8.70E + 09 1,10E + 18 9.33E + 04 0.001 23 Magnafloc 155 (polyacrylamide),
flocculant g 3,11E + 08 2.33E + 09 7.23E + 17 6,13E + 04 0.001
24 Hydrochloric acid ton 9.91E + 02 4.44E + 15 4,40E + 18 3,73E + 05 0.004 25 Human labor J 2.69E + 11 4,45E + 06 1,20E + 18 1.01E + 05 0.001 26 Operating costs USD 1,23E + 08 1,18E + 13 1,55E + 18 1,31E + 05 0.001 27 Phytoremediation costs USD 1,31E + 05 1,18E + 13 1,55E + 18 1,31E + 05 0.001 28 Herbaceous Rehabilitation USD 1,16E + 05 1,18E + 13 1.37E + 18 1,16E + 05 0.001 29 Waste Tailings Treatment Plant
(WTTP) USD 6,56E + 03 1,18E + 13 7.74E + 16 6,56E + 03
6,87E-05
Total Emergy 1,13E + 21 9,54E + 07 1.00 TRANSFORMITIES, Calculated 30 Total Yield, gold Ton 19.05 31 Total Yield, silver Ton 21.55 Transformity gold, seJ / ton 5.72E + 19 Transformity silver, seJ / ton 5.05E + 19 Colombian Emergy Money Ratio 1,18E + 13 Gold sale Price millions USD 763.4 Silver sale Price (U $ Dollars) USD 9.44 Colombia GDP, 282.5
thousands of millions USD USD 282.5 Summary NR R F Y Y (g, j, $) ** Y 1 (seJ / yr) 1,23E + 20 1,50E
+ 19 9.87E + 20 1,13E + 21 9,54E + 07 8.66 + 21 Fraction 0.11 0.01 0.88 1.00
*Unit solar emergy (SeJ/unit) references for respective row number 1 -3 (Howard T. Odum, Brown, & Brandt-Williams, 2000) 4 (Mark T. Brown & Ulgiati, 2010) 5 (De Wilbiss, C.; Brown,M.T.;Ma & Ingwersen, 2015) 6 (Ulgiati & Brown, 2002) 7 (H.T Odum, 1996) 8 (Howard T. Odum et al., 2000) 9 (De Wilbiss, C.; Brown,M.T.;Ma & Ingwersen, 2015) 10 (Mark T. Brown & Bardi, 2001) 11 (ODUM, 2001) 12 (H.T Odum, 1996) 13 (Cohen, Sweeney, & Brown, 2007) 14 (Brandt-williams, Sherry, 2002) 15 (Benedetto Rugani, Huijbregts, Mutel, Bastianoni, & Hellweg, 2011) 16 (Cao & Feng, 2007) 17 (Lan, Qin, & Lu, 2002) 18-19 (Zhang, X.H., Pang, M.Y., Wang, 2014) 20 (ODUM, 2001) 21 (Benedetto Rugani et al., 2011) 22 (Campbell, 2015) 23 (Zhang, X.H., Pang, M.Y., Wang, 2014) 24 (Zhang, Deng, Wu, & Jiang, 2010) 25 (H. Odum, Brown, & Brandt-Williams, 2000) 26-29 (Comar & Komori, 2007).
** Y 1 includes ecological services for pollutants dillution that were added in F1, see Table 3-4 Note: See Appendix L and Appendix M
Table 3-6: Emergy calculations from alluvial mining process, discretizing renewable, nonrenewable, and imported resources.
Note
Item
Unit
Data (units / yr)
Unit solar emergy * (seJ / unit)
Solar emergy (seJ / yr)
Em $ Value ($ / yr)
Emergy fraction
RENEWABLE RESOURCES
1 Sun j 7.08E + 15 1,00E + 00 7.08E + 15 6,00E + 02

Chapter 3 175
2 Rain, chemical energy j 1,45E + 13 3,10E + 04 4.50E + 17 3,82E + 04 0.0004 3 Wind, kinetic energy j 2,04E + 11 2,45E + 03 4.99E + 14 4.23E + 01 4 Geothermal heat, j 5.82E + 10 2,08E + 04 1,21E + 15 1.03E + 02 5 Water m 3 1,45E + 08 1,26E + 11 1.82E + 19 1,54E + 06 0.016 6 Oxygen (air) ton 8,40E + 00 8.66 + 13 7.27E + 14 6.16E + 01 6,43E-07 7 Oxygen (air) for
combustion ton 8,40E + 00 5,16E + 07 8.00E + 08
6,78E-05 7.08E-13 8 Vegetation cover
harbors kg 6,00E + 04 9.96E + 10 5.98E + 15
5.06E + 02 5,29E-06 NONRENEWABLE STORAGES 9 Organic soil loss j 3,33E + 15 1,24E + 05 4.13E + 20 3,50E + 07 0.366 10 Inorganic soil removed
(sterile mineral) kg 9.94E + 13 1,72E + 20 1,72E + 20
1,46E + 07 0.152 PURCHASED INPUTS
11 Fuel j 1,12E + 12 3,84E + 04 4.31E + 16 3,66E + 03 12 Electricity j 2,53E + 14 1,34E + 05 3,40E + 19 2,88E + 06
3,82E-05 13 Gas (liquefied
petroleum gas) MJ 1,60E + 04 8.06E + 04 1,29E + 09 1.09E-04
0.030 14 Machinery g 2.64E + 10 1.79E + 10 4.73E + 20 4.01E + 07
1,14E-12 15 Aerophine 3416,
coagulant g 4.70E + 05 1,71E + 09 8.04E + 14 6.81E + 01
0.419 16 Aerofroth 65,
surfactant g 2,30E + 05 1,71E + 09 3.93E + 14 3,33E + 01
7,11E-07 17 Borax kg 2,33E + 05 1.68E + 09 1,68E + 14 1,42E + 01
3.48E-07 18 Lime ton 1,00E-01 1,68E + 15 1,68E + 14 1,42E + 01
1,48E-07 19 Sodium carbonate kg 7.76E + 04 1.38E + 12 1.07E + 17 9.07E + 03
1,48E-07 20 Magnafloc 155
(polyacrylamide) g 4,46E + 05 1,71E + 09 7.62E + 14 6,46E + 01
9,48E-05 21 Human labor j 1,13E + 12 4,45E + 06 5.03E + 18 4.26E + 05
6,75E-07 22 Extractive cost USD 2.57E + 02 1,18E + 13 7.98E + 15 6.76E + 02
0.004 23 Restoration costs USD 1,19E + 06 1,18E + 13 1,40E + 19 1,19E + 06
2.69E-06 Total Emergy 1,13E + 21 9,57E + 07 1.00
TRANSFORMITIES, Calculated
24 Total Yield, gold Ton 3.10 25 Total Yield, ferrous
mineral Ton 2.00
Transformity gold, seJ / ton 3,64E + 20
Transformity mineral ferrous, seJ / ton 5,65E + 20
Colombian Emergy Money Ratio 1,18E + 13
Gold sale Price millions USD 763.4
Ferrous minerals sale Price millions USD 5.82E-18
Colombia GDP, 282.5 thousands of millions USD
USD 282.5
Summary
NR R F Y Y (g, j, $) Y1
(seJ / yr) 5.85E + 20 1,87E
+ 19 5,26E + 20 1,13E + 21 9,57E + 07 1,13E + 21
Fraction 0.508 0.016 0.476 1.00

176 Sustainability Assessment of Alluvial and Open Pit Mining Systems in Colombia: Life Cycle Assessment, Exergy Analysis, and Emergy Accounting
*Unit solar emergy (sej/unit) references for respective row number 1 -3 (Howard T. Odum et al., 2000) 4 (Mark T. Brown & Ulgiati, 2010) 5 (De Wilbiss, C.; Brown,M.T.;Ma & Ingwersen, 2015) 6 (Ulgiati & Brown, 2002) 7 (Bargigli, S., Cigolotti, V., Pierini, D., Moreno, A., Iacobone, F., Ulgiati, 2010) 8 (H.T Odum, 1996) (Howard T. Odum et al., 2000) 10 (De Wilbiss, C.; Brown,M.T.;Ma & Ingwersen, 2015) 11 (Mark T. Brown & Bardi, 2001) 12 (ODUM, 2001) 13 (Ulgiati & Brown, 2002) 14 (Brandt-williams, Sherry, 2002) 15-16 (Zhang, X.H., Pang, M.Y., Wang, 2014) 17 (H. Odum et al., 2000) 18 (Lan et al., 2002) 19 (De Vilbiss & Brown, 2015) 20 (Zhang, X.H., Pang, M.Y., Wang, 2014) 21 (H. Odum et al., 2000) 22-23 (Comar & Komori, 2007)
** Y1 includes ecological services for dilution of the pollutants added in F1, see Table 3-4.
Note: See Appendix L and Appendix M
Finally, Table 3-7 summarizes the percentage of renewable, non-renewable and imported
resources for each mining process with their respective total emergy contribution. As
evidenced, Solar Energy Demand (SED) is the same in both processes. This implies that
total emergy of the extractive process is independent of the method by which it is carried
out, being the distribution of renewable, non-renewable and imported resources used, the
differentiating factor of implemented technology.
Table 3-7: Emergy indices of the two mining systems.
NR (%) R (%) F (%) Total Emergy (seJ / yr)
Open-pit mining
process 10.9 1,3 87.8 1,13E + 21
Alluvial mining
process 50.76 1.62 47.62 1,13E + 21
3.4.1 Sustainability emergy-based traditional indicator results and analysis.
Table 3-13 summarizes the values obtained for each emergy indicator described above
for each mining process under analysis. Then analysis and discussion are done.
Environmental loading ratio (ELR). Values obtained from this indicator were equal
to 74.63 and 59.45 for open pit an alluvial process respectively, which shows a high
environmental load and therefore less sustainable for both processes, being more
representative in open-pit mining system. In alluvial mining, this is due to the large
amount of mineral excavated (gravel, sand, silt, clay) to obtain the mineral and high
consumption of imported resources such as machinery; this environmental burden is
reflected mainly in large hectares of land that have to be cleared every year (stripping

Chapter 3 177
activity, 133 hectares), showing loss of biodiversity, changes in land use, loss of organic
matter and soil erosion. In the same way, since this system is on-river and / or on river
basins, it results in deteriorated water bodies and creation of diversion channels
(Asamoah et al., 2017).
In open-pit mining, high environmental pressure is attributed mainly to the use of
machinery, electricity consumption and removal of large quantities of inorganic soil in ore
extraction stages, and ore benefit, seeing mainly the impact on changes in land use,
which become large craters after the extractive process. It is noteworthy that in this
extractive process the greatest environmental burden is not evidenced by the
consumption of resources but by the ecological services necessary for the dilution of
emissions to soil, air and water in benefit process, and for the loss of capital and nature
due to these emissions, which with these emergy traditional indicators cannot be
reflected.
Since there are few studies that address xtractive systems sustainability through emergy
analysis, it is worth comparing these results with those of this study. Lower values are
obtained if both processes are compared with cement industry (Xiaohong Zhang et al.,
2017) referenced in literature, where a value equal to 150.53 is obtained.
Emergy Yield Ratio (EYR). This indicator shows values equal to 1.14 and 2.15 for
open-pit and alluvial mining respectively. This shows a high dependence of both
processes on imported resources and not on local resources. It explains the high
economic value of gold in world market that internalizes the low contribution of renewable
natural capital in process economy (being this contribution lower from free sources of
emergy for open-pit mining process), which otherwise, would lead to low economic
benefits and weak competition in the market. Similar values are obtained in other studies
reported for alluvial (1.44) and underground mining (1.32) (Asamoah et al., 2017).
Emergy sustainability index (ESI). In emergy terms, a process is sustainable when
it has a greater dependence on renewable resources and not on purchased or non-
renewable resources. Both extractive systems are unsustainable in the long term with
values equal to 0.02 (open-pit mining) and 0.04 (alluvial mining), because they present

178 Sustainability Assessment of Alluvial and Open Pit Mining Systems in Colombia: Life Cycle Assessment, Exergy Analysis, and Emergy Accounting
high environmental burdens, economically uncompetitive. This implies that both systems
provide a very low return at the expense of a relatively high environmental load.
With a negligible difference in the two mining processes, it could not be determined if one
system is more sustainable with respect to the other. However, that slight difference may
be marked by the high dependence on imported resources such as high emergy cost of
electricity in open-pit mining (presenting the largest contribution to gold benefit, grinding
milling stage) with a contribution of 52.58% of the total emergy of the process.
A complementary valuation methodology should be used to assess the market price of
gold in relation to associated environmental burdens, economic investment and social
benefits of extractive activity.
Very similar values are obtained in cement industry (0.039) (Xiaohong Zhang et al.,
2017). In gold extraction, a value of 0.33 is obtained from the study carried out by
Asamoah for alluvial process (Asamoah et al., 2017)
Emergy Investment Ratio (EIR). Alluvial mining process can be more competitive
and prosperous in economic terms in the market with respect to open-pit mining, with a
value equal to 0.87, since the latter has not only a higher level of economic development
of the system with respect to the import of resources but also has high economic costs
associated with operation, phytoremediation and herbaceous rehabilitation, 88% of the
total emergy of the process comes from imported resources with an EIR equal to 7.15.
Renewability Index (RI). The emergy of renewable resources (R) is usually very
small or even close to zero for many industrial systems (Asamoah, Zhang, Liang, Pang, &
Tang, 2017; Yang, Li, Shen, & Hu, 2003), this makes some traditional emergy indicators
unrealistically large or small, depending on whether R appears in the numerator or the
denominator of the indicator (Song, Wang, Li, & Duan, 2012). Both extractive systems
present low renewability values, without a significant difference between them (1.33% to
open-pit and 1.65 % to alluvial mining). This implies that both systems have low capacity
to survive an economic stress, local or global; that is, there is a low probability that they

Chapter 3 179
will survive long-term economic competition due to the use of large sources of non-
renewable and purchased emergy.
If we compare gold extraction activity in Peru (35% renewability) (Ingwersen, 2011) and
Ghana with 18.8% to alluvial mining and 28.4% to underground mining) (Asamoah et al.,
2017, we can see that these processes have a stronger economy, being more sustainable
and more likely to overcome an economic crisis compared to mining in Colombia.
Soil Emergy Cost (SEC). A value equal to 0.11 is obtained in open-pit mining for
this indicator, considered very low compared to the unit, which implies a very low
erodability of the exploited land compared with the total yield and benefits. In contrast to
alluvial mining, with a value of 0.5 2 due to the large number of hectares cleared by
removing vegetation cover, organic, and inorganic soil as previously explained.
Emergy Exchange Ratio (EER). As specified in Table 2, this indicator shows the
economic benefit of producers with respect to consumers. As it has been discussed, gold
production (extraction and benefit stage) generates large environmental burdens with a
high economic investment, making it an unsustainable and unfeasible process, where its
market price can withstand such externalities that allows a fast emergy return of imported
resources and costs associated with environmental recovery of the process, not being
least important the recovery of work that nature had to do to provide free resources and
recovery of non-renewable resources (loss of organic and inorganic soil).
Both mining processes present an economic gain in terms of gold sale, this implies that
producers receive more emergy from consumers than they invested in the whole process.
Open-pit mining presents a higher emergy profitability (EER = 0.1 2) compared with
alluvial mining (EER = 0.77), this is because the first system produces approximately 6
times more gold than the second with identical emergy investment.
Product Unit Emergy Value (PUEV). In emergy terms, alluvial mining process is
less efficient compared with open-pit mining. That is, more resources are required in
alluvial mining to produce a ton of gold. While for open pit mining 5, 91E + 19 seJ is

180 Sustainability Assessment of Alluvial and Open Pit Mining Systems in Colombia: Life Cycle Assessment, Exergy Analysis, and Emergy Accounting
required to produce a ton of gold, in alluvial mining 3,64E + 20 SeJ are required for the
same ton (approximately 7 times more).
Comparing these results with respect to gold mining in Ghana, with PUEV values of 4.11E
+ 20 seJ / ton to alluvial mining and 3.12E + 20 seJ / ton to underground mining, it can be
seen that gold extraction systems in Colombia are more efficient, even for those that
present the same extraction technology. However, comparing extraction systems in
Colombia with the Peruvian, the latter have higher emergy efficiencies 1,6E + 16 seJ /
ton, possibly because it has a higher mineral grade in Peru followed by Colombia and
Ghana, or greater efficiency in technology, which allows a greater recovery of gold.
Cement processing presents the best efficiency equal to 3 .64E15 sej / t.
Both mining systems have associated co-products, silver in open pit mining and ferrous
mineral in alluvial mining. Silver presents a higher efficiency (5.22 E19 seJ / ton) even
though it is not the main interest product because it does not have an economic value
comparable to gold, since deposit is richer in silver than in gold. EER for silver is equal to
10.09 which indicates that the mining company would receive less emergy by consumers
compared to the one invested in the process, generating economic losses in case this
was the only product generated, but it is still a profit because it is the co-product. In
Peruvian extractive system, silver also has a better exergy efficiency compared to
Colombian system (7.5E + 15 seJ / ton).
The same situation occurs in alluvial mining, co-product is ferrous mineral, whose PUEV
is 5.65 E + 20 sej / ton very similar to that of gold, since its annual production is very
similar (19.05 tons of gold and 21.55 of ferrous minerals). However, given its low sale
price (USD / ton 2.91E-18) added to the low amount generated it is not viable in economic
and environmental terms, so emergy allocation is not applicable for this case.
Unit Emergy Value of Economic output (UEVE). In relation to this indicator there is
little that can be said, since there is not a very significant difference between values of
both systems; 3.98E + 09 seJ / USD to open-pit and 4.00 E + 09 sej / USD to alluvial
mining. It can be said that both systems obtained good economic efficiency (EER), where
the consumption of resources is reasonable in relation to economic productivity,
presenting an efficient use (fair amount) without generating cost overruns for useless
losses (the amount of resources used is enough, there is not an oversize).

Chapter 3 181
3.4.2 Improve sustainability emergy- indicator results and analysis.
As stated in previous sections, there is a need to integrate emergy evaluation (EME) with
LCA, since the former does not account ecological services for dilution of pollutants
generated in the process, nor the loss of natural, economic and human capital caused by
such emissions, even more in mining process, where chemical compounds harmful to
health and the environment are used in gold benefit and refinement. Therefore all efforts
have been made to use these methodological tools as complementary, instead of making
a structural integration (Reza et al., 2014a).
Since the choice of a mining process depends not only on the relationship between
economic burdens and environmental burdens, as we saw with conventional emergy
indicators, but also on the environmental burdens generated, type of resource,
abundance of resource in the nature, location on land, and access to it (Asamoah et al.,
2017); this section will address the additional work required to compensate and mitigate
these ecological and human losses in emergy equivalent of loss (due to discharge of solid
waste on land, human and natural capital due to emissions released to land and water).
Ecological services
In open-pit mining 7,52E + 21 seJ are required for the environment to self-purify and
reach the permissible limits (in air and water) decreed in the Colombian regulation
through physical, chemical and biological processes; being the greatest contribution
emissions to water (99%) of Chromium, ion and in a lower proportion of nitrogen oxides
released into the air (7,53E + 17 seJ). In alluvial mining, emissions to air and water are
much lower with a value equal to 3.18E + 17, with nickel and nitrogen oxides (1.77E + 14
seJ) being the main contributors of emissions to water and air respectively (see Table 3-8
to Table 3-11 and Appendix N).
Ecological services in open-pit mining are 87% of the total emergy (modified, see Table 3-
4) of the process, while in alluvial mining it is 0.03% (see Table 3-8 to Table 3-11). This
was expected, since the greater environmental burdens in conventional mining processes
(open-pit, underground mining) are usually presented in the mineral benefit process,
however in alluvial mining the profit process is less aggressive, since much of it is done

182 Sustainability Assessment of Alluvial and Open Pit Mining Systems in Colombia: Life Cycle Assessment, Exergy Analysis, and Emergy Accounting
on board dredger through the action of water and physical separation methods (densities
or sizes), which leads to a very small use of chemicals, thus avoiding emissions to the air
and water.
It is necessary to account for the ecological services that environment (water and air
resource) provides for the dilution of those pollutants generated in the process at the
levels accepted for compliance with environmental regulations. Ecological services are
environmental self-purification, which include physical, chemical and biological processes,
and it is often the last step maintaining environmental quality (H. Pan, Zhang, Wu, et al.,
2016)
Natural and human capital losses
Emergy equivalent of human health loss (ELHH)
The emergy equivalent of human health loss (HH) to open-pit mining caused by emissions
to water and air is equal to 3.72E + 06 seJ and 4.13E + 08 seJ respectively. As evidenced
by the greater impacts to human health, they are caused by air emissions mainly by
particulate material (35%), one of the greatest impacts of open-pit mining in the stage of
mineral excavation and particles generated in tailings pool, nitrogen oxides also make a
significant contribution (31.42%) (See Table 3-8, Table 3-9 and Appendix N).
Continuing the same analysis in the second extractive process, the HH is equal to 1.41E +
02 seJ caused by emissions to water and 6.82E + 02 seJ caused by emissions to air
originated mainly by biogenic (60, 31%) and fossil (36.76%) carbon dioxide (see Table
3-10 and Table 3-11).
Emergy equivalent of loss in support of local ecological resources (ELEQ)
Potentially Disappeared Fraction (PDF) of species in the affected ecosystem to open-pit
mining has a value of 4.78E + 14 seJ mainly by emissions of chromium (43.86%) and
copper (52.04%) to water. In relation to ELEQ caused by emissions to the air is 1.285E +
14 seJ, 93.61% due to nitrogen oxides emissions (see Table 3-8, Table 3-9 and Appendix
N).
In alluvial mining ELEQ = 3,45E + 10 seJ, where 94.79% is copper emissions to water.
ELEQ = 8.47E + 6 seJ, where 93.7% is generated by nitrogen oxides released into the air
(see Table 3-10 and Table 3-11 and Appendix N).

Chapter 3 183
Emergy equivalent of natural loss due to discharge of solid waste on land (ELSW)
Finally, emergy equivalent of natural loss is 2.63E +18 seJ and 3.93E + 12 seJ to open-pit
and alluvial mining respectively. Being tailings (33.88%) generated in the benefit process
and stored material with mineral of interest (55.79%) the main contributors to this index in
open pit mining, and mineral dredging (93.44%) in alluvial mining (see Table 3-12 and
Appendix N).
It is important to clarify how waste treatment can reduce environmental degradation but
not without an additional energy cost. Summing up the losses of natural and human
capital, the total emergy equivalent to open-pit and alluvial mining is 2.63E +18 seJ and
3.97E + 12 seJ respectively. In the first mining system, 99% of the losses are attributed to
ELSW and, in alluvial mining, 99% of the losses are also attributed to ELSW. It is
noteworthy that open-pit mining achieved all the highest rates (ELSW, ELHH and ELEQ
caused by water and air emissions, being air emissions the ones that contribute most to
ELHH and ELEQ in relation to emissions to water. However, the ecological service
provided by water environment is higher in relation to atmospheric environment; this is
due to the maximum permissible limits of pollutants in the air and water standardized in
the Colombian environmental regulation (see Table 3-3).
Table 3-8: Emergy equivalent loss and ecological services by waterborne pollution in open-pit mining.
Emergy equivalent of loss seJ
Ecological services seJ
Waterborne pollution
Damage category human health
DALY / g
Damage category ecosystem quality
PDF% ELHH ELEQ Dilution mass, Mdil
Eswater
Arsenic, ion Carcinogenic 5,15E + 07
Ecotoxicity 3.08E + 06
3.71E + 12
5,60E + 20
Cadmium, ion
Carcinogenic 2,44E + 07
Ecotoxicity 4.95 + 05
6,39E + 05
6,20E + 10
5,41E + 12
8,15E + 20
Chromium, ion
Ecotoxicity 1.09E + 07
2.09E + 14
4.99E + 13
7.52E + 21
Copper, ion Ecotoxicity 1,73E + 07
2,49E + 14
1,86E + 12
2,80E + 20
Nickel, ion Ecotoxicity 3.38E + 06
9.77E + 12
1,87E + 13
2.82E + 21
Zinc, ion Ecotoxicity 1,11E + 06
9.77E + 12
3.58E + 11
5.39E + 19
3.72E + 06
4.78E + 14
7.52E + 21
Total Ecological Services 7.52E + 21

184 Sustainability Assessment of Alluvial and Open Pit Mining Systems in Colombia: Life Cycle Assessment, Exergy Analysis, and Emergy Accounting
Table 3-9: Emergy equivalent loss and ecological services by airborne pollution in open-pit mining.
Emergy equivalent of loss seJ
Ecological services seJ
Airborne pollution
Damage category human health
DALY / g
Damage category ecosystem quality
PDF% ELHH ELEQ Dilution mass, Mdil
Kinetic Energy, K
Esair
Carbon dioxide, biogenic
Climate change
4,30E + 05
6.71E + 07
Carbon dioxide, fossil
Climate change
3,75E + 05
5,11E + 07
Carbon dioxide, from soil
Climate change
2.37E + 05
2.05E + 07
Methane, fossil
Climate change
2,80E + 04
1.36E + 04
Methane, biogenic
Climate change
9,50E + 04
1,57E + 05
Nitrogen oxides
Respiratory effects
1,23E + 07
Acidification & Eutrophication
2.37E + 06
1,30E + 08
1,20E + 14
1,20E + 14
2,99E + 14
7.53E + 17
Particles,> 2.5 um, and <10um
Respiratory effects
2.66E + 07
1,44E + 08
6.72E + 13
1,68E + 14
4.23E + 17
Sulfur dioxide
Respiratory effects
5,24E + 05
Acidification & Eutrophication
3.52E + 04
4.51E + 05
1,45E + 11
1.07E + 13
2.67E + 13
6.73E + 16
Ammonia Acidification & Eutrophication
1.02E + 06
8.06E + 12
4.13E + 08
1,285E + 14
7.53E + 17
Table 3-10: Emergy equivalent loss and ecological services by waterborne pollution in alluvial mining.
Emergy equivalent of loss seJ
Ecological services seJ
Waterborne pollution
Damage category human health
DALY / g
Damage category ecosystem quality
PDF% ELHH ELEQ Dilution mass, Mdil
ES water
Arsenic, ion Carcinogenic 1,90E +
03 Ecotoxicity 1,14E + 02 1,37E +
08 2,06E + 16
Cadmium, ion Carcinogenic 1.06E +
03 Ecotoxicity 2,14E + 01
2,76E + 01
2.68E + 06
2,34E + 08
3.53E + 16
Chromium, ion Ecotoxicity 3.57E +
01 6,88E + 08
1,64E + 08
2.47E + 16
Copper, ion Ecotoxicity 2,28E + 03 3,27E +
10 2,45E + 08
3,69E + 16
Nickel, ion Ecotoxicity 3,83E + 02 1,11E +
09 2,11E + 09
3,18E + 17
Zinc, ion Ecotoxicity 4,65E + 01 1,62E +
04 1,50E + 07
2,26E + 15
1,41E + 02
3,45E + 10 3,18E +
17 Total Ecological Services 3,18E +
17

Chapter 3 185
Table 3-11: Emergy equivalent loss and ecological services by airborne pollution in alluvial mining.
Emergy equivalent of loss seJ
Ecological services seJ
Airborne pollution
Damage category human health
DALY / g Damage category ecosystem quality
PDF% ELHH ELEQ Dilution mass, Mdil
Kinetic Energy, K
Esair
Carbon dioxide, biogenic
Climate change
1.01E + 03 3,73E + 02
Carbon dioxide, fossil
Climate change
7.91E + 02 2,27E + 02
Carbon dioxide, from soil
Climate change
0.00E + 00
Methane, fossil Climate change
6,48E + 01 6.77E-03
Nitrogen oxides
Respiratory effects
3,16E + 03 Acidification & Eutrophication
6,10E + 02
8.58E + 00
7.94E + 06
2.81E + 10
7.02E + 10
1,77E + 14
Particles,> 2.5 um, and <10um
Respiratory effects
6,49E + 03 7.58E + 00
7.67E + 07
3,62E + 10
9,13E + 13
Sulfur dioxide Respiratory effects
1,18E + 03 Acidification & Eutrophication
6,75E + 01
1,95E + 00
5,34E + 05
2,05E + 10
5.12E + 10
1,29E + 14
Ammonia Acidification & Eutrophication
1,11E + 01
1.07E + 03
6.18E + 02
8,47E + 06
1,77E + 14
Table 3-12: Solid wastes occupation on economy.
Alluvial mining Open-Pit mining
Solid / waste Amount [ton]
Land occupation [ha / ton]
Emergy equivalent of loss [seJ]
Solid / waste
Amount [ton]
Land occupation [ha / ton]
Emergy equivalent of loss [seJ]
Others 4.00E + 00 1,40E-04 1,47E + 11
Tails - WTTP: 3,00E + 00 1.05E-04 1,11E + 11
Stored material with mineral of interest
3.98E + 07 1,40E + 03 1,47E + 18
Mineral dredging 9.98E + 01 3,50E-03 3,68E + 12
Primary crushing stored
7.37E + 06 2,59E + 02 2,72E + 17
Regeneration (Waste activated carbon)
3.01E + 03 1.06E-01 1,11E + 14
Tails 2.42E + 07 8,49E + 02 8.92E + 17
Emergy equivalent of natural loss due to discharge of solid waste on land, ELSW
3.93E + 12 2.63E + 18

186 Sustainability Assessment of Alluvial and Open Pit Mining Systems in Colombia: Life Cycle Assessment, Exergy Analysis, and Emergy Accounting
The modification of traditional emergy indicators consists in the inclusion of indicators of
natural and human capital losses (ELHH , ELEQ , ELSW), as well as ecological services
(ESair, Eswater) as shown in Table 4, where the cost of ecological services is added to the
invested resources and the environmental loading ratio (ELR) includes the loss of EL
natural and human capital. Table 3-13 summarizes emergy sustainability indicators
described in section 4.1 and improved indicators.
Table 3-13: Emergy traditional indicator vs emergy improved indicator to open-pit and alluvial mining process.
Open-pit mining Alluvial mining
Emergy indicator Traditional Improved Traditional Improved
Enviromental Loading Ratio, ELR 74,13 576.70 59.45 60.69 Emergy Yield Ratio, EYR 1,14 1.02 2.15 2.10 Emergy Sustainable Indices, ESI 0.02 1,76E-03 0.04 3,46E-02 Emergy Investment Ratio, EIR 7.15 61,66 0.87 0.91 Renewability Ratio, [%] 1.33 0.17 1.65 1.62 Soil Emergy Cost, SEC [%] 0.11 0.01 0,52 0,51 Emergy Exchange Ratio, EER 0.12 0.96 0.77 0.79 Product Unit Emergy Value Gold, PUEV [seJ / ton] 5.91E + 19 4.54E + 20 3,64E + 20 3.72E + 20 Product Unit Emergy Value Silver, PUEV [seJ / ton] 5,22E + 19 4.01E + 20 5,65E + 20 5.7E + 20 Unit Emergy Value of Economic output, UEVE [seJ / USD] 3,98E + 09 3.06E + 10 4.00E + 09 4.08E + 09
Imported Resource F, modified [seJ / yr] --- 8.51E + 21 --- 5,26E + 20 Emergy equivalent loss, EL [seJ / yr] --- 2.63E + 18 --- 3.97E + 12 Emergy loss percentage; ELP (%) --- 0.03 --- 3.51E-07 Ecological services (%) 86.99 0.03
Y, [seJ / yr] 1,13E + 21 8.66 + 21 1,13E + 21 1,13E + 21
In open-pit mining, ecological services and emergy equivalent loss correspond to 86.99%
and 0.03% of the total emergy (Y1). What shows the substantial contribution of
environmental burden in the process generated mainly by emissions to water. This
environmental burden (ELR) goes from a value of 74.13 to 576.70, which makes the
process less sustainable and at the same time demands more imported resources (EYR
= 1.02), increasing the dependence on purchased instead of local resources, which
generates less competitiveness in the market (EIR = 61.66). On the other hand, the
process continues to have good economic returns for producers but a drastic reduction;
that is, the cost of ecological services for the dilution of pollutants in the water places the
process at the limit, so economic losses are generated that even the sale price of gold in

Chapter 3 187
Colombia is unable to withstand, a slight decrease of 4% in the price of gold makes the
project economically untenable (when EER = 1). In the same way, emergy efficiency
decreases, since more emergy is required to produce the same ton of gold (PUEV,
UEVE).
Quite the opposite happens in alluvial mining, ecological services and emergy loss have
an insignificant contribution to the total emergy, with values equal to 0.03% and 3.51E-
07% respectively, which do not change the economic sustainability of the process and
just a little (0.03%) the environmental load generated, seeing a change of only 1% in
global sustainability as seen in Table 3-13. This implies that the environmental burden
generated in this process is so insignificant that additional investment does not have to be
made to be managed.
3.4.3 Sensitiviy analysis
After the variation of emergy effiency (PUEV) for the two mining systems, no change was
observed in the Environmental Loading Ratio, Emergy Yield Ratio and Emergy
Sustainable indicator. Except in the Emergy Exchange Ratio, where there is a 50%
improvement in the indicator (EER directly proportional to PUEV), which implies greater
economic gain for producers being higher in open-pit mining process, as shown in Figure
3-3. This behavior is the same compared to the baseline (process without improvements).
Figure 3-3: Sensitivity analysis changing emergy efficiency a) open-pit mining b) alluvial mining.
a)
b)
Note: ELR=102, EYR=101.
0.00
0.10
0.20
0.30
0.40
0.50
0.60
0.70
0.80
B A S E L I N E E F F + 1 0 % E F F + 2 0 % E F F + 3 0 % E F F + 4 0 % E F F + 5 0 %
ELR EYR ESI EER
0.00
0.10
0.20
0.30
0.40
0.50
0.60
0.70
0.80
0.90
B A S E L I N E E F F + 1 0 % E F F + 2 0 % E F F + 3 0 % E F F + 4 0 % E F F + 5 0 %
ELR EYR ESI EER

188 Sustainability Assessment of Alluvial and Open Pit Mining Systems in Colombia: Life Cycle Assessment, Exergy Analysis, and Emergy Accounting
However, decreasing the amount of resources imported in both mining processes by 10,
20, .., 50%, in open-pit mining shows a variation of 44.5% in ELR at a rate of 8.9%, 43.9
% in EER at a rate of 8.9%, and 50.5% in ESI at a rate of 10.10%, not presenting a direct
proportionality for EYR whose total variation was 10.9%. This reaffirms how under the
emergy analysis, the environmental and economic sustainability of a process depends
directly on the consumption of renewable, non-renewable and imported resources, being
more sustainable the process that has a greater dependence on renewable resources
and not on purchased ones, it does not mean that a process whose consumption of
renewable inputs is 100% is more sustainable, because it would become an
underdeveloped process, there mst be a balance between the use of these two types of
resources.
In alluvial mining, the same scenario described above is presented. ELR and EER show a
variation of 24.2% and 23.8%, both at 4.8%, ESI at 50.3% at 10.1%, not presenting a
direct proportionality for EYR with a total change of 34.4%.
However, despite this reduction, the two extractive systems still have a high
environmental burden and dependence on imported resources, which is unsustainable in
the long term, with good economic returns due to the sale price of gold.
Figure 3-4: Sensitivity analysis changing emergy efficiency a) open-pit mining b) alluvial mining.
a) b)
Note: ELR=102, EYR=101
0.00
0.10
0.20
0.30
0.40
0.50
0.60
0.70
0.80
B A S E L I N E F - 1 0 % F - 2 0 % F - 3 0 % F - 4 0 % F - 5 0 %
ELR EYR ESI EER
0.00
0.10
0.20
0.30
0.40
0.50
0.60
0.70
0.80
0.90
B A S E L I N E F - 1 0 % F - 2 0 % F - 3 0 % F - 4 0 % F - 5 0 %
ELR EYR ESI EER

Chapter 3 189
3.5 Conclusions
Based on emergy diagrams, it can be concluded how productive systems require
renewable and non-renewable resources of the environment for producing goods and
services, generating not only a depletion of the resource due to its use, but also an
environmental burden (emissions and wastes released to air, water and soil) in the
manufacture and processing thereof. Treatment of these wastes can reduce
environmental degradation, but not without an additional energy cost, which also
generates an additional cost and depletion of the resource, resulting in less natural capital
that supports the economic production of a country. Therefore, there must be a
compensation between economic production and the use and degradation of the resource
since a bidirectional relationship is presented.
For these reasons, mining processes are not sustainable in the long term, due to the high
environmental burden caused by the use of resources; in its greater proportion imported
resources. Alluvial mining is slightly less unsustainable compared to open-pit mining, with
values of 0.04 and 0.02 in sustainability indicator (ESI) respectively, taking into account
only the use of resources in process sustainability. Now, using LCA as a complement to
EMA to include the environmental load generated in productive process, the difference in
sustainability between both systems increases. That is, open-pit mining demands 86.9%
of total emergy of the process in ecological services required for the dilution of pollutants
released mainly to water. While in alluvial system, it is unsustainable only because of the
environmental degradation caused by the use of resources and not by waste and
emissions generated (0.03% of total emergy of the process corresponds to ecological
services); that is, emergy sustainability indicators do not have a significant variation when
emissions and waste released into the environment are included.
However, in economic terms, the sale price of gold supports environmental degradation
both by the use of resources and the release of pollutants into the environment. In open-
pit mining, economic profitability is much higher compared with alluvial mining if costs
related to the ecological service are not considered due to the emissions and waste
generated, although total emergy required is the same for the two processes (1,13E) +21
seJ / yr to open-pit and alluvial mining). Alluvial system becoming more profitable when
additional dilution costs are included. Similarly, high productivity in open-pit mining leads

190 Sustainability Assessment of Alluvial and Open Pit Mining Systems in Colombia: Life Cycle Assessment, Exergy Analysis, and Emergy Accounting
to greater efficiency 5.91E + 19 seJ / ton vs 3.64E + 20 seJ / ton, which is substantially
affected if ecological dilution services and losses of human and natural capital are
included, although the latter do not have such a significant contribution (4.54E + 20 seJ /
yr vs 3.72E + 20 seJ / yr). This may be due to the fact that open-pit system has a higher
ore grade in the deposit, fewer resources have been extracted, so the gold law has not
decreased, more efficient technologies among other factors that are not within the scope
of study, which allows to have a greater production of gold; economic performance that is
affected by the emissions to water and air that characterize this type of extractive method.
The foregoing demonstrates the need to implement management policies that focus on a)
not having to deal with waste and emissions generated in this type of processes but
preventing their generation through the efficient use of resources, reuse strategies where
waste is converted in raw material within the process / other processes, more efficient
technologies, among other factors. b) Efficient use of resources, where processes that
have less dependence on imported resources and a high dependence on local renewable
resources (R) are more sustainable (H. Odum et al., 2000), being the main limiting factor
of mining processes because they are highly industrialized processes that demand a
large amount of resources purchased.
Finally, the complementarity of the two analysis methods (Em-LCA) is assessed; emergy
accounting as a donor-approach (quantification of cost that nature had in order to provide
the resources) and life cycle assessment is more user-oriented (quantification of the loss
of natural and human capital by the generated emissions and the cost of ecological
services for the dilution of pollutants or, in other words, which is known as environmental
liabilities) that allow a holistic assessment of the process sustainability, estimating not only
environmental burdens but also economic and social flows (Reza et al., 2014b ), not leaving
aside the improvements in the efficiency of the process by means of exergy indicators. It
requires a joint analysis of emergy and other concepts such as exergy and LCA, in order
to take into account the impacts of waste management investment and emissions.
3.6 Acknowledgments
This project was carried out as part of the Doctoral Program funded by the Department of
Science and Technology of Colombia (COLCIENCIAS). The authors thank the mining
companies (open-pit and alluvial mining technology) for the provided data and

Chapter 3 191
recommendations. This research was supported by the 1) School of Mines at the National
University of Colombia at Medellín; 2) Bioprocess and Reactive Flow Research Group.
3.7 Disclaimer
This research is focused on studying the sustainability of two different extraction mining
processes such as open pit and alluvial mining technologies. Data provided by mining
companies is confidential information used only to academic purposes.
References
Akpalu, W., Normanyo, A. K. (2017). Gold mining pollution and the cost of private healthcare: the case of Ghana. Ecol. Econ., 142, 104 e112.
Amaya, M. G. (2009). Exergy cost assessment of water resources: physical hidronomics. University of Zaragoza.
Arbault, D., Rugani, B., Marvuglia, A., Benetto, E., & Tiruta-Barna, L. (2014). Emergy evaluation using the calculation software SCALE: Case study, added value and potential improvements. Science of the Total Environment, 472. http://doi.org/10.1016/j.scitotenv.2013.11.087
Arbault, D., Rugani, B., Tiruta-Barna, L., & Benetto, E. (2014). A semantic study of the emergy sustainability index in the hybrid lifecycle-emergy framework. Ecological Indicators, 43, 252–261. http://doi.org/10.1016/j.ecolind.2014.02.029
Asamoah, E. F., Zhang, L., Liang, S., Pang, M., & Tang, S. (2017). Emergy perspectives on the environmental performance and sustainability of small-scale gold production systems in Ghana. Sustainability (Switzerland), 9(11). http://doi.org/10.3390/su9112034
Asner, G.P., Tupayachi, R. (2017). Accelerated losses of protected forests from gold mining in the Peruvian Amazon. Environ. Res., Lett. 12(094004).
Bakshi, B. . (2002). A thermodynamic framework for ecologically conscious process systems engineering. Comput. Chem. Eng, 26, 269–282.
Bakshi, B. R. (2000). A thermodynamic framework for ecologically conscious process systems engineering. Computers & Chemical Engineering, 24(2–7), 445–451.
Bargigli, S., Cigolotti, V., Pierini, D., Moreno, A., Iacobone, F., Ulgiati, S. (2010). Cogeneration of heat and electricity: a comparison of gas turbine, internal combustion engine, and MCFC/GT hybrid system alternatives. Journal of Fuel Cell Science and Technology, 7(1), 6 pages.
Bastianoni, S., Campbell, D. E., Ridolfi, R., & Pulselli, F. M. (2009). The solar transformity of petroleum fuels. Ecological Modelling, 220(1), 40–50. http://doi.org/10.1016/j.ecolmodel.2008.09.003
Brandt-williams, Sherry, L. (2002). Handbook of Emergy Evaluation A Compendium of Data for

192 Sustainability Assessment of Alluvial and Open Pit Mining Systems in Colombia: Life Cycle Assessment, Exergy Analysis, and Emergy Accounting
Emergy Computation Issued in a Series of Folios Folio # 4 ( 2nd printing ) Emergy of Florida Agriculture Sherry L . Brandt-Williams August 2001 Revised September 2002 Center for Environmental Policy E, 4(September), 40.
Brown, M. ., & Herendeen, R. . (1996). Embodied energy analysis and EMERGY analysis: a comparative view. Ecological Economics, 19(3), 219–235. http://doi.org/10.1016/S0921-8009(96)00046-8
Brown, M. T., & Bardi, E. (2001). Emergy of Ecosystems Folio #3. A Compendium of Data for
Emergy Computation, (July), 94.
Brown, M. T., Raugei, M., & Ulgiati, S. (2012). On boundaries and ‘investments’ in Emergy Synthesis and LCA: A case study on thermal vs. photovoltaic electricity. Ecological
Indicators, 15(1), 227–235. http://doi.org/10.1016/j.ecolind.2011.09.021
Brown, M. T., & Ulgiati, S. (2010). Updated evaluation of exergy and emergy driving the geobiosphere: A review and refinement of the emergy baseline. Ecological Modelling, 221(20), 2501–2508. http://doi.org/10.1016/j.ecolmodel.2010.06.027
Buitrago Soto, C. E. (2014). Sostenibilidad del Páramo de Guerrero. Una aproximación desde la emergía, 170.
Buonocore, E., Vanoli, L., Carotenuto, A., & Ulgiati, S. (2015). Integrating life cycle assessment and emergy synthesis for the evaluation of a dry steam geothermal power plant in Italy. Energy, 86, 476–487. http://doi.org/10.1016/j.energy.2015.04.048
Campbell, D. E. (2004). Global transition to sustainable development, 11–28.
Campbell, E. T. (2015). Emergy analysis of emerging methods of fossil fuel production. Ecological
Modelling, 315, 57–68. http://doi.org/10.1016/j.ecolmodel.2014.10.036
Cano Londoño, N. A., Ordoñez Loza, J., Posada, J., & Velásquez, H. I. (n.d.). Exergy Indicators Life Cycle Assessment in Colombian Gold Mining Sector: Case Study in Open-Pit and Alluvial Mining Process. Cleaner Production.
Cano Londoño, N. A., Suárez, D. G., Velásquez, H. I., & Ruiz-Mercado, G. J. (2017). Emergy analysis for the sustainable utilization of biosolids generated in a municipal wastewater treatment plant. Journal of Cleaner Production, 141. http://doi.org/10.1016/j.jclepro.2016.09.033
Cano, N. (n.d.). Sustainability Assessment of Gold Mining by Life Cycle Assessment: Open-pit Mining VS Alluvial Mining. Cleaner Production.
Cao, K., & Feng, X. (2007). The Emergy Analysis of Multi-Product Systems. Process Safety and
Environmental Protection, 85(5), 494–500. http://doi.org/10.1205/psep07007
Chen, W., Geng, Y., Hong, J., Dong, H., Cui, X., Sun, M., & Zhang, Q. (2018). Life cycle assessment of gold production in China. Journal of Cleaner Production, 179, 143–150. http://doi.org/10.1016/j.jclepro.2018.01.114
Chen, W., Liu, W., Geng, Y., Ohnishi, S., Sun, L., Han, W., … Zhong, S. (2016). Life cycle based

Chapter 3 193
emergy analysis on China’s cement production. Journal of Cleaner Production, 131, 272–279. http://doi.org/10.1016/j.jclepro.2016.05.036
Cohen, M. J., Brown, M. T., & Shepherd, K. D. (2006). Estimating the environmental costs of soil erosion at multiple scales in Kenya using emergy synthesis. Agriculture, Ecosystems &
Environment, 114(2–4), 249–269. http://doi.org/10.1016/j.agee.2005.10.021
Cohen, M. J., Sweeney, S., & Brown, M. T. (2007). Computing the Unit Emergy Value of Crustal Elements. Emergy Synthesis 4, (December), 16.1-16.12.
Comar, V., & Komori, O. M. (2007). Emergy synthesis 4: Theory and Applications of the Emergy Methodology. 7th Biennial Emergy Research Conference, (December), 11.
DANE. (2017). información estrategiaca titulo reloj de poblacion La población proyectada de
Colombia.
De Vilbiss, C. D., & Brown, M. T. (2015). New method to compute the emergy of crustal minerals. Ecological Modelling, 315, 108–115. http://doi.org/10.1016/j.ecolmodel.2015.04.007
De Wilbiss, C.; Brown,M.T.;Ma, C., & Ingwersen, W. (2015). Emergy Research for supply chain. Environ. Account.Manag., 3, 308–338.
G. Liu, Z. Yang, B. Chen, and L. Z. (2011). Analysis of resource and emission impacts: an emergy based multiple spatial scale framework for urban ecological and economic evaluation. Entropy, 13(1), 720–743.
G. Liu, Z. Yang, B. Chen, and S. U. (2011). Monitoring trends of urban development and environmental impact of Beijing, 1999-2006. Sci. Total Environ., 409(18), 3295– 308.
Geng, Y., Sarkis, J., Ulgiati, S. (2016). Sustainability, well-being, and the circular economy in China and worldwide. Science, (Special issue on Pushing the boundaries of scientific research: 120 years of addressing global issues.), 73–76.
Hischier, R., Weidema, B., Althaus, H.-J., Bauer, C., Doka, G., Dones, R., … Nemecek, T. (2010). Implementation of Life Cycle Impact Assessment Methods Data v2.2 (2010). Ecoinvent
Report No. 3, (3), 176.
Hossaini, N., & Hewage, K. (2013). Emergy accounting for regional studies: Case study of Canada and its provinces. Journal of Environmental Management, 118, 177–185. http://doi.org/10.1016/j.jenvman.2012.12.034
Ingwersen, W. W. (2011). Emergy as a Life Cycle Impact Assessment Indicator: A Gold Mining Case Study. Journal of Industrial Ecology, 15(4), 550–567. http://doi.org/10.1111/j.1530-9290.2011.00333.x
ISO, 14040. Environmental management-Life cycle assessment-Principles and framework. International Organisation for Standardisation, Geneva, Switzerland. (1998). Switzerland.
Kharrazi, A., Kraines, S., Hoang, L., & Yarime, M. (2014). Advancing quantification methods of sustainability: A critical examination emergy, exergy, ecological footprint, and ecological information-based approaches. Ecological Indicators, 37(PART A), 81–89.

194 Sustainability Assessment of Alluvial and Open Pit Mining Systems in Colombia: Life Cycle Assessment, Exergy Analysis, and Emergy Accounting
http://doi.org/10.1016/j.ecolind.2013.10.003
Kursun, B., Bakshi, B. R., Mahata, M., & Martin, J. F. (2015). Life cycle and emergy based design of energy systems in developing countries: Centralized and localized options. Ecological
Modelling, 305, 40–53. http://doi.org/10.1016/j.ecolmodel.2015.03.006
Lacarrière, B., Deutz, K. R., Jamali-Zghal, N., & Le Corre, O. (2015). Emergy assessment of the benefits of closed-loop recycling accounting for material losses. Ecological Modelling, 315, 77–87. http://doi.org/10.1016/j.ecolmodel.2015.01.015
Lan, S. F., Qin, P., & Lu, H. F. (2002). Emergy evaluation of eco-economic system. Chemical
Industry Press.
Le Corre, O., & Truffet, L. (2015). EMergy: A holistic paradigm for sustainability. Comptes Rendus
- Mecanique, 343(1), 13–17. http://doi.org/10.1016/j.crme.2014.09.007
Lou, B., Qiu, Y., & Ulgiati, S. (2015). Emergy-based indicators of regional environmental sustainability: A case study in Shanwei, Guangdong, China. Ecological Indicators, 57, 514–524. http://doi.org/10.1016/j.ecolind.2015.03.017
M. Raugei, Rugani, B., Benetto, E., & Ingwersen, W. (2012). Integrating emergy into LCA: Potential added value and lingering obstacles. Ecological Modelling, In Press.
Marvuglia, A., Benetto, E., Rios, G., & Rugani, B. (2013). SCALE: Software for CALculating Emergy based on life cycle inventories. Ecological Modelling, 248. http://doi.org/10.1016/j.ecolmodel.2012.09.013
Mikulčić, H., Cabezas, H., Vujanović, M., & Duić, N. (2016). Environmental assessment of different cement manufacturing processes based on Emergy and Ecological Footprint analysis. Journal of Cleaner Production, 130, 213–221. http://doi.org/10.1016/j.jclepro.2016.01.087
Ministerio de Ambiente y Desarrollo sostenible. (2017). Resolución No 2254.
Ministerio de la Protección Social, & Ministerio de Ambiente Vivienda y Desarrollo Territorial. (2017). Resolución Numero 2115. Minambiente, 23. http://doi.org/10.1017/CBO9781107415324.004
Nielsen, S.N., Bastianoni, S. (2007). A common framework for emergy and exergy based LCA in accordance with environ theory. Int. J. Ecodyn, 2, 170–185.
Odum, H. . (1996). Environmental Accounting: Emergy and Environmental Decision Making. (J. W. and Sons, Ed.). New York.
Odum, H., Brown, M., & Brandt-Williams, S. (2000). Handbook of emergy evaluation. Center for
Environmental Policy. Environmental Engineerging Sciences. (U. of F. Gainesville, Ed.). Florida.
ODUM, H. T. (2001). Environmental Accounting, Emergy and Decision Making. Colorado.
Odum, H. T., Brown, M. T., & Brandt-Williams, S. (2000). Handbook of Emergy Evaluation A Compendium of Data for Emergy Computation Issued in a Series of Folios - Folio #1 Introduction and Global Budget. Handbook of Emergy Evaluation, (May), 16.

Chapter 3 195
Odum, H. T., Brown, M. T., & Brandt-Williams, S. (2000). Handbook of emergy evaluation Folio #1: Introduction and global budget. University of Florida, Gainesville, (May).
Odum, H. T., & Odum, B. (2003). Concepts and methods of ecological engineering. Ecological
Engineering, 20(5), 339–361. http://doi.org/10.1016/j.ecoleng.2003.08.008
OECD. (2001). Environmental Strategy for the First Decade of the 21st Century.
Pan, H., Zhang, X., Wang, Y., Qi, Y., Wu, J., Lin, L., … Zhang, Y. (2016). Emergy evaluation of an industrial park in Sichuan Province, China: A modified emergy approach and its application. Journal of Cleaner Production, 135, 105–118. http://doi.org/10.1016/j.jclepro.2016.06.102
Pan, H., Zhang, X., Wu, J., Zhang, Y., Lin, L., Yang, G., … Peng, H. (2016). Sustainability evaluation of a steel production system in China based on emergy. Journal of Cleaner
Production, 112, 1498–1509. http://doi.org/10.1016/j.jclepro.2015.05.019
Pan, Y., & Li, H. (2016). Sustainability evaluation of end-of-life vehicle recycling based on emergy analysis: A case study of an end-of-life vehicle recycling enterprise in China. Journal of
Cleaner Production, 131, 219–227. http://doi.org/10.1016/j.jclepro.2016.05.045
Pulselli, R.M., Simoncini, E., Ridolfi, R., Bastianoni, S. (2008). Specific emergy of cement and concrete: an energy-based appraisal of building materials and their transport. Ecological
Indicators, 8, 647–656.
Reza, B., Sadiq, R., & Hewage, K. (2014a). Emergy-based life cycle assessment (Em-LCA) for sustainability appraisal of infrastructure systems: A case study on paved roads. Clean
Technologies and Environmental Policy, 16(2), 251–266. http://doi.org/10.1007/s10098-013-0615-5
Reza, B., Sadiq, R., & Hewage, K. (2014b). Emergy-based life cycle assessment (Em-LCA) of multi-unit and single-family residential buildings in Canada. International Journal of
Sustainable Built Environment, 3(2), 207–224. http://doi.org/10.1016/j.ijsbe.2014.09.001
Rugani, B. (2010). Advances towards a Comprehensive Evaluation of Emergy in Life Cycle
Assessment. Siena, Italy.
Rugani, B., Huijbregts, M. a J., Mutel, C., Bastianoni, S., & Hellweg, S. (2011). Solar energy demand (SED) of commodity life cycles: Supporting Information. Environmental Science &
Technology, 45(12), 5426–33. http://doi.org/10.1021/es103537f
Sciubba, E., & Ulgiati, S. (2005). Emergy and exergy analyses: Complementary methods or irreducible ideological options? Energy, 30(10), 1953–1988. http://doi.org/10.1016/j.energy.2004.08.003
Song, Q., Wang, Z., Li, J., & Duan, H. (2012). Sustainability evaluation of an e-waste treatment enterprise based on emergy analysis in China. Ecological Engineering, 42, 223–231. http://doi.org/10.1016/j.ecoleng.2012.02.016
Ulgiati, S., & Brown, M. T. (2002). Quantifying the environmental support for dilution and abatement of process emissions: the case of electricity production. Cleaner Production, 10(4), 335–348.

196 Sustainability Assessment of Alluvial and Open Pit Mining Systems in Colombia: Life Cycle Assessment, Exergy Analysis, and Emergy Accounting
Wall, G., & Gong, M. (2001). On exergy and sustainable development—Part 1: Conditions and
concepts. Exergy an Int J, 1(3), 128–45.
Yang, H., Li, Y., Shen, J., & Hu, S. (2003). Evaluating waste treatment, recycle and reuse in industrial system: an application of the eMergy approach. Ecological Modelling, 160(1–2), 13–21. http://doi.org/10.1016/S0304-3800(02)00288-0
Yu, X., Geng, Y., Dong, H., Fujita, T., & Liu, Z. (2016). Emergy-based sustainability assessment on natural resource utilization in 30 Chinese provinces. Journal of Cleaner Production, 133, 18–27. http://doi.org/10.1016/j.jclepro.2016.05.103
Yu, X., Geng, Y., Dong, H., Ulgiati, S., Liu, Z., Liu, Z., … Sun, L. (2016). Sustainability assessment of one industrial region: A combined method of emergy analysis and IPAT (Human Impact Population Affluence Technology). Energy, 107, 818–830. http://doi.org/10.1016/j.energy.2016.04.092
Zhang, L., Geng, Y., Dong, H., Zhong, Y., Fujita, T., Xue, B., Park, H.-S. (2016). Emergy based assessment on the brownfield redevelopment of one old industrial area: a case of Tiexi in China. Cleaner Production, 114, 150–159.
Zhang, X.H., Jiang, W.J., Deng, S.H., Peng, K. (2009). Emergy evaluation of the sustainability of Chinese steel production during 1998-2004. Cleaner Production, 17, 1030–1038.
Zhang, X.H., Pang, M.Y., Wang, C. . (2014). Emergy analysis of a small hydropower plant in southwestern China. Ecol. Indic., 38, 81–88.
Zhang, L. X., Yang, Z. F., & Chen, G. Q. (2007). Emergy analysis of cropping–grazing system in Inner Mongolia Autonomous Region, China. Energy Policy, 35(7), 3843–3855. http://doi.org/10.1016/j.enpol.2007.01.022
Zhang, X., Deng, S., Wu, J., & Jiang, W. (2010). A sustainability analysis of a municipal sewage treatment ecosystem based on emergy. Ecological Engineering, 36(5), 685–696. http://doi.org/10.1016/j.ecoleng.2009.12.010
Zhang, X. H., Deng, S., Jiang, W., Zhang, Y., Peng, H., Li, L., … Li, Y. (2010). Emergy evaluation of the sustainability of two industrial systems based on wastes exchanges. Resources,
Conservation and Recycling, 55(2), 182–195. http://doi.org/10.1016/j.resconrec.2010.09.007
Zhang, X., Shen, J., Wang, Y., Qi, Y., Liao, W., Shui, W., … Yu, X. (2017). An environmental sustainability assessment of China’s cement industry based on emergy. Ecological
Indicators, 72, 452–458. http://doi.org/10.1016/j.ecolind.2016.08.046
Zhelev, T. (2007). The conceptual design approach-a process integration approach on the move. Resour. Conserv. Recyl., 50, 143–157.
4. Exergy, emergy and life cycle sustainable indicators: Open-pit and alluvial mining
Abstract
In this chapter, a summary of sustainability indicators showed by each of the analysis
methodologies is presented; Life Cycle Assessment, Exergy and Emergy to open-pit and
alluvial mining using ternary and spider diagram. Stages of the process that generate
greater environmental impacts, exergy losses and lower overall emergy efficiency in the
entire productive chain were identified. Finishing with the identification of complementarity
or redundancy of results obtained by the three methodologies as a tool to inform decision
making in the mining sector.
Alluvial mining presents better sustainability indicators in the three methodologies
compared to open-pit mining. However, to determine which process is more sustainable
with respect to the other would be to make judgments a priori, since these analysis
methodologies cannot reflect other differentiating factors when determining how
sustainable one process is with respect to the other (resource types, abundance, location
in the earth, and access to land, ore sale price, extraction method, type of technology
implemented, etc).
The stages of the process subject to improvements based on the results of LCA are tails
and extraction in open-pit mining and stripping in alluvial mining. By exergy, stages are
tails, followed by stripping and extraction to open-pit mining; and to alluvial mining stages
are casting and molding, chemical separation, drying and separation and exploration.
Emergy eficciency is better to open-pit than to alluvial mining (5.95E+ 19 seJ/ton,

198 Sustainability Assessment of Alluvial and Open Pit Mining Systems in Colombia: Life Cycle Assessment, Exergy Analysis, and Emergy Accounting
3.71E+20 seJ/ton respectively); however, the latter has a higher index of emergy
sustainability.
Life Cycle Assessment, Exergy and Emergy Analysis have been addressed individually
for sustainability assessment in mining projects and in a complementary manner (not
necessarily in the mining sector), but to date it has not been addressed through an
integration of methodologies, being this the conclusive chapter of this doctoral thesis.
Keywords:
Life Cycle Assessment, Exergy Analysis, Emergy Accounting, alluvial mining, open-pit mining
HIGHLIGHTS
Emergy Accounting Donor-Side method
Life cycle Assesment and Exergy Analysis User-Side method
Sustainability "compatibility between energy, economics and environmental"
aspects
Alluvial mining presents better scores and indicators under LCA, Exergy and
Emergy Accounting
4.1 Introduction
Different methodological tools for sustainability assessment have been observed, some
oriented only to environmental sustainability based not only on the environmental burden
(generated in the Life Cycle Assesment production chain) but also on the use of direct
and indirect resources provided by nature for its manufacture, ending in the conception of
the final product (Emergy Analysis). And others that include process efficiency in terms of
entropy generated (Exergy Analysys), the investment and economic return that provides
social welfare (emergy analysis).
All these methodologies converge to the same point: tools that provide decision-makers
with indicators of environmental, economic or social sustainability for the formulation and
implementation of public policies. These indicators can be taken as individual or

Chapter 4 199
composite parameters; that is, synthetic aggregations of independent parameters,
reflecting the values of interested parties and considerations of the experts (Arbault,
Rugani, Tiruta-Barna, & Benetto, 2014). Regardless of whether individual or composite
indicators are taken, a sustainable process should present an energy and technical
feasibility that generates economic gains for social welfare with an acceptable
environmental burden, hence the need to make use of all tools for assessing this
sustainability, not as exchangeable but as complementary.
Throughout previous documents it has been addressed the sustainability assessment of
two mining processes developed in Colombia: open-pit and alluvial mining, under three
perspectives; Life cycle Assessment, Exergy and Emergy Analysis. In this chapter, in a
summarized way, 1) results are compiled by analyzing and comparing sustainability
indicators and / or environmental impact categories for each described methodology of
two gold extraction systems; 2) process stages are identified for each extractive system
that generate the greatest environmental impacts, greatest exergy losses, and lowest
overall emergy efficiency in the entire productive chain; 3) Finally, the complementarity or
redundancy of results obtained by the three methodologies is identified as a tool to inform
decision making in the mining sector. All these specific objectives were developed in
order to conceive a methodological integration that allow an expanded approach to be
applied, not only to mining sector but also to different economic sectors under the
estimation of a single sustainability index in the most objective way possible, which
involves different spatial and temporal scales with a divergent basis of analysis. It is clear
that the proposal of this methodological integration is not part of the scope of the present
doctoral thesis, but it was a latent need generated at the end of proposed objectives and
which could not be overlooked.
4.2 Methodology
The standardized methodology is followed and described in previous chapters for each
methodology implemented; LCA, Exergy and Emergy Analysis. Consistency of results:
the same set of data is used for both approaches (gold system), as well as system
boundaries (cradle to gate).

200 Sustainability Assessment of Alluvial and Open Pit Mining Systems in Colombia: Life Cycle Assessment, Exergy Analysis, and Emergy Accounting
4.2.1 Life cycle assessment, exergy and emergy indicators to open-pit and alluvial mining
This section summarizes Life Cycle Assessment, Exergy and Emergy indicators
estimated in chapters 1-3 for both mining processes.
Life Cycle Assessment under ISO 14040 (ISO, 1998) was developed by cradle to gate,
Recipe Methodology, Umberto NXT Universal software, Ecoinvent 3.1. Database,
Functional Unit 1kg gold, economic allocation. In exergy evaluation, thermodynamic data
and reference state were taken from Szargut et al. (Szargut, J.; Morris, DR; Steward,
1988). For the case of minerals, standard chemical exergy used values reported by
(Kotas, 1985); engraving, sands and clays were modeled by the most representative
compounds in order to take characteristic species (Wedepohl, 1995) and give a value of
chemical exergy. Emergy accounting was implemented under the methodology described
by Odum (Odum, 1996). These last two methodologies were also carried out from cradle
to gate.
Data was associated with first-hand data on an annual time scale by two mining
technologies combined with material and energy balances, no data was assumed. For
alluvial mining, the inventory was built from nominal values for a historical production of 6
years, while for open-pit mining it was built from mass and energy balance assuming the
average productivity over 11 years at extraction stage. Likewise for all analysis
methodologies implemented the same boundaries system (cradle to gate) was taken.
LCA indicators (Ecosystem quality, human health and resources), Emergy resources and
sustainable indicator (R, NR, F, EmSI respectively) were compared for the two mining
systems by ternary diagrams. The concept of ternary diagrams was proposed by Gibbs
and Roozeboom for analysing mixed components, and introduced into emergy synthesis
by Giannetti et al. (Giannetti, Barrella, & Almeida, 2006). The representation of this
indicators on ternary diagram allows a quick visualization of results and facilitates
comparison between systems.
Ternary emergy diagram has three components: R, N and F; each vertex of the triangle
represents a component and each side a binary system. The composition of any system
in a ternary diagram can be determined by reading zero along the previous baseline of
diagram to 100% of the other vertex of the triangle (Giannetti et al., 2006). Point sizes of
ternary diagram are proportional to the emergy used. The graphic tool allows to draw lines
indicating constant values of sustainability index, sustainability lines depart from N apex in

Chapter 4 201
direction of RF side allowing the division of the triangle into sustainability areas, which are
very useful to identify and compare processes sustainability (Li, Kuang, Huang, & Chang,
2014). Ternary diagram for LCA works in the same way, its components are: Ecosystem
quality, Resources and Human health, except sustainability lines. For Exergy Analysis,
Cumulative Exergy Demand, Exergy Efficiency and Exergy Sustainable Index were
related.
Sustainable indicators for each methodology were ploted by spider diagram. Indicators
were normalized based on the maximum value between two mining systems, with equal
weights (equally important) in order not to arbitrarily bias exposed results, and thus they
can be compared based on their spider diagram areas. Similarly, metrics of t hall
methodologies were plotted together to facilitate decision making.
Finally, Cumulative Energy Demand (CEnD), Cumulative Exergy Demand (CExD),
Cumulative Emergy Demand (CEmD) and Total Environmental Points (TEP) were
compared for each mining system. Other studies have compared CEmD with CEnD
(Frischknecht, R.; Wyss, F.; Büsser Knöpfel, S.; Lützkendorf, T.; Balouktsi, 2015) and
CExD (Bösch, M.E.; Hellweg, S.; Huijbregts, M.; Frischknecht, 2007). Respective
efficiencies shown by each analysis methodology were also compared.
4.2.2 Critical stages of open-pit and alluvial mining process
Based on the results discussed in chapters 1-3, the stages of each mining process with
greatest environmental impacts (Life Cycle Assessment), greatest exergy losses (Exergy
Assessment), and lowest overall emergy efficiency in the supply chain (Emergy
Accounting) are summarized. It is analyzed if all methodologies implemented converge in
the same results although they differ in their basis of analysis.
4.2.3 Doctoral contribution
The doctoral contribution of this research work lies in the implementation of each
evaluation methodology (LCA, Emergy Accounting and Exergy Analysis) to two mining
systems in order to assess each process sustainability.
Although Life Cycle Assessment has been implemented in open-pit system (W. Chen et
al., 2018) from cradle to gate, it has not been used in alluvial system as described in

202 Sustainability Assessment of Alluvial and Open Pit Mining Systems in Colombia: Life Cycle Assessment, Exergy Analysis, and Emergy Accounting
chapter 1 of this document, so it can be a good reference for future works where the
sustainability of gold mining by LCA (open-pit and alluvial mining) is to be valued.
Exergy analysis has been discussed extensively with a wide variety of minerals from
earth's crust (Valero & Valero, 2010). However, it has not been implemented as a tool for
evaluating the exergy cost of extractive process from cradle to gate in gold production,
nor as a methodology for sustainability assessment (sustainable indicator) in the
production of any mineral, but in other economic sectors (biofuels) (Ojeda, 2011).
Therefore, the document "Life Cycle Assessment of Exergy Indicators in Colombian Gold
Mining Sector: Case Study in Open-Pit and Alluvial Mining Process" presents a valuable
contribution to the topic, which also includes exergy indicators by LCA approach whose
calculation basis differs from that of thermodynamic approximation (Szargut, J., Morris,
DR, Steward, 1988, Szargut, 2005).
Emergy Accounting has been implemented in small-scale gold production in alluvial and
underground mining. However, in this study only emergy cost and process sustainability
are accounted based on the use of resources and does not consider ecological services
of airborne / waterborne dilution, emergy equivalent of natural loss due to discharge of
solid waste on land, nor emergy equivalent of human health and regional natural
resources due to emission, considerations of great importance in mining productivity. This
methodology has not been applied in open-pit mining process.
Initially, this doctoral work would end with the identification of complementarity or
redundancy of results obtained by the three methodologies as a tool to inform decision-
making in mining sector. However, it was decided to develop an approximation of an
integration model of the three methodologies for sustainability assessment, based on the
concept of sustainability as "the compatibility between energy, economics (maximum
performance) and environmental aspects" ((Redclift, 1987; Reza, Sadiq, & Hewage,
2014), all development projects especially those that threaten environmental integrity,
such as exploitation of natural resources and mining processes, should be focused on
being an economic use alternative that provides an energy yield with acceptable
environmental burden. This last section is not part of the objectives proposed in the
development of this thesis.

Chapter 4 203
The methodology implemented in indicators integration model, together with respective
statistical analysis will be described in chapter 5 of this thesis.
4.3 Results
4.3.1 Life cycle assessment, exergy and emergy indicators to open-pit and alluvial mining
This section summarizes sustainable indicators for each tool for sustainability assessment
implemented in this doctoral thesis.
Life cycle Assessment indicators: Open-pit and alluvial mining
In order to summarize the results and analyzes addressed in the first chapter of this
document (Cano, submitted.), it was decided to present these results through end-points
environmental indicators to two mining systems to make it more practical; although this
way of presenting results has discrepancies in academic community due to its reductionist
approach, which by using weighting factors to aggregate different environmental impact
categories analyzed by damage categories and then by endpoints, subjectivities can
incur, , due to often weighting scoring are based on expert judgment and can sometimes
be extremely biased (Klöpffer, W., Grah, 2014). It is possible to see how open-pit mining
has the greatest total impact (1.01, E + 04 points) being 4 times higher than alluvial
mining with 2.38, E + 03 points as shown in Table 4-1 and Figure 4-1. Damage categories
that contribute the most to total points are human health in open-pit mining with a
contribution of 89.18%, and ecosystem quality in alluvial mining with a contribution of
99.30%. It can be seen that under this perspective, sustainability of both mining
processes is more influenced by environmental burden than by the use of resources.
Note that these values were assigned only for gold production in the two extractive
systems, and impacts generated by co-products were not considered. This in order to
minimize the bias, not very significant in alluvial mining, this economic allocation of
impacts generated by ferrous metals compared to those generated by stocked material,

204 Sustainability Assessment of Alluvial and Open Pit Mining Systems in Colombia: Life Cycle Assessment, Exergy Analysis, and Emergy Accounting
silver and gold in open-pit mining, Table 4-2 shows environmental impact categories
allocation.
In spite of these marked results between one and another extractive system, there is no
easy answer to which of the evaluated mining systems has a better environmental
performance. Open pit mining system presents higher values in human health damage
category, whereas alluvial mining causes more damage on ecosystem quality. So it
cannot be said arbitrarily which damage category is more relevant with respect to the
other, if it had had a similar behavior in all these categories, it could have been concluded
more severely which system would have been more sustainable with respect to the other.
To get a clearer picture, it is proposed to invest in further research on the exact
composition and lixiviation of toxic substances in both mining systems, and on secondary
effects of land and water use most of all in alluvial mining. Based on more precise
information some recommendations could be formulated to optimize both mining systems
and to reach a well-founded decision on which mining system is preferable, taking into
account the local conditions of each mining site.
Table 4-1: LCA indicators. Open-pit and alluvial mining.
Indicator Open-pit mining
Alluvial mining
Fraction open-pit mining
Fraction Alluvial mining
Ecosystem quality [points] 6.02E + 02 2.37, E + 03 5.97 99.30 Human health [points] 8.98E + 03 9.35, E + 00 89,18 0.39 Resources [points] 4,88E + 02 7.43, E + 00 4.84 0.31
Total [points] 1.01, E + 04 2.38, E + 03 100.00 100.00
Figure 4-1: End-point environmental indicators ecosystem quality, human health, and resources in open-pit and alluvial mining technology.

Chapter 4 205
Table 4-2: Environmental impact categories allocation, Material deposit, silver, and gold in open-pit mining.
Damage categories Impact categories
Material deposit
(2,091.79 t) Silver (1.13
kg) Gold (1,00
kg)
Ecosystem
Natural land transformation, (m2/yr) 1,66, E + 01 3.03, E-01 1.96, E + 01 Terrestrial acidification (kg SO2 eq/yr) 1.26, E + 02 2.96, E + 00 1.91, E + 02
freshwater ecotoxicity (kg 1,4-DB eq/yr)
3.16, E + 03 1,14, E + 03 7.39, E + 04
Freshwater eutrophication (kg P-eq/m3) 2.13, E + 01 7.65, E + 00 4.94, E + 02 Marine ecotoxicity (kg 1,4-DB eq/yr) 9.25, E + 02 3.28, E + 02 2.12, E + 04 Marine eutrophication (kg N-eq/m3) 5.70, E + 01 1.32, E + 00 8.55, E + 01 Water depletion (m3/yr)4 4.99, E + 01 8.43, E + 00 5,45, E + 02
Resources Metal depletion 8.31E + 04 7.00E + 04
Fossil depletion, (kg oil eq/yr) 1.04, E + 03 4.14, E + 01 2.68, E + 03
Human health
Climate change kg CO 2 eq/yr 3.91, E + 03 1.96, E + 02 1.26, E + 04 Particulate matter formation (kg PM10 eq /yr) 7.88, E + 01 2.57, E + 00 1,66, E + 02 Photochemical oxidant formation (kg NMVOC/yr) 1.49, E + 02 3.31, E + 00 2.14, E + 02 Human toxicity (kg 1,4-DB eq/yr) 2.42, E + 04 8.61, E + 03 5.56, E + 05
4 It is not possible the normalization of the water depletion category impact because Recipe Methodology don’t have the characterization factor for this.

206 Sustainability Assessment of Alluvial and Open Pit Mining Systems in Colombia: Life Cycle Assessment, Exergy Analysis, and Emergy Accounting
Based on the described in this document, it can be concluded that Life Cycle Assessment
evaluates the concept of sustainability as the assessment of environmental burden from
waste and emissions to water, air and soil generated in production chain by the use of
energy resource, water resource and other inputs. Note that it does not involve the
economic dimension; and from social dimension, damage to human health category can
be considered as one indicator, this topic will be expanded in later sections.
Exergy indicators: Open-pit and alluvial mining
Based on thermodynamic perspective, cumulative exergy demand to open-pit mining from
cradle to gate was equal to 1.62E + 08 kW, out of which 98.43% was destroyed,
presenting an efficiency of 1.57% and a sustainability index (SI) equal to 1.02. While in
alluvial process, 69% of input exergy is destroyed (3.76E + 07 kW), with an exergy
efficiency of 27.75% and SI equal to 1.38 as shown in Table 4-3 and Figure 4-2. This
implies that alluvial mining process is more sustainable in exergy terms compared to
open-pit mining process, since the latter generates greater entropy due to thermodynamic
irreversibility of the process, causing a greater load to the receiving environment, which
reflects in different types of emissions / environmental to soil, water and air, determined
by other analysis methodologies such as Life Cycle Assessment (environmental impact
categories).
It is noteworthy that Exergy Cumulative Demand indicator counted the exergy of
deactivation waste generated in the process (decontamination exergy cost), being equal
to 1.87E + 09 kW to open-pit and 1.43E + 06 kW to alluvial mining. As can be seen in
LCA, in Exergy analysis the cost of waste treatment is higher in open-pit mining.
Table 4-3: Exergy indicators to open-pit and alluvial mining.
Indicator Open-pit mining
Alluvial mining
Energy Cumulative Demand [kW] 1,60E + 08 3,76E + 07 Exergy Cumulative Demand [kW] 1,62E + 08 5,20E + 07 Output Exergy [kW] 2,54E + 06 1,44E + 07 Destroyed Exergy [kW] 1,59E + 08 3,76E + 07 Exergy efficiency [%] 1.57 27.75 Energy efficiency [%] 0.89 0.61

Chapter 4 207
Sustainable Index [Dimensionalaless] 1.02 1.38
Figure 4-2: Relationships among Exergy Cumulative Demand, Efficiency and Sustainability in open-pit and alluvial mining.
Note: Exergy cumulative demand [108 kW], Sustainable index normalized based on the minimum value between two mining systems.
Based on the results above, it can be said that exergy analysis evaluates process
sustainability as the environmental burden associated with destroyed exergy with respect
to its reference environment. That is, it evaluates sustainability from quantification of
usable energy loss due to inherent irreversibility of the process and non-use of outputs
(waste and emissions) that contain usable energy and end up in the environment through
destroyed exergy. Note that under this analysis only the environmental dimension is
considered, no indicator of social and economic dimension is taken into account. Exergy
analysis is suitable for tracing the energy losses through the process, so it is beneficial for
process improvements and for gauging ecosystem stability.
Emergy indicators: Open-pit and alluvial mining
Table 4-4 and Figure 4-3 summarize emergy indicators, which allow to conclude under
this analysis methodology that both processes present a considerable environmental
0.0
0.5
1.0
1.5
2.0
Exergy Cumulative
Demand
Exergy efficiencySustainable Index
Open-pit mining technology Alluvial mining technology

208 Sustainability Assessment of Alluvial and Open Pit Mining Systems in Colombia: Life Cycle Assessment, Exergy Analysis, and Emergy Accounting
burden, plus low renewability, being more sustainable those systems with a low
dependence on non-renewable resources and provide a suitable yield to society.
Although both processes are not sustainable (SI is not within sustainability range 1 <SI <5
for both systems), greater viability can be seen in alluvial mining since it presents less
environmental burden and less investment of imported resources compared to open -pit
mining. However, open-pit mining presents greater emergy efficiency since it requires the
same amount of total emergy to produce the same amount of gold subject to mining law,
for this reason the latter has better economic returns; aspects not considered within the
sustainability index standardized by the methodology.
Table 4-4: Exergy indicators to open-pit and alluvial mining.
Indicator Open-pit mining
Alluvial mining
Enviromental Loading Ratio, ELR [Dimensionalaless] 7.46E + 01 6.07E + 01 Emergy Yield Ratio, EYR [Dimensionalaless] 1,14E + 00 2,10E + 00 Emergy Sustainable Indices, ESI [Dimensionalaless] 0.02 0.03 Emergy Exchange Ratio, EER [Dimensionalaless] 1,26E-01 7.86E-01 Emergy Value Gold Product Unit, PUEV [seJ/ton] 5,95E + 19 3.71E + 20 Renewable Ratio, R [%] 1.32 1.62
Figure 4-3: Sustainable ternary diagram in open-pit and alluvial mining. Renewable, non-renewable and purchased resources.

Chapter 4 209
Emergy analysis assesses the system sustainability as the environmental burden
associated with all direct and indirect inputs provided by nature for the generation of a
product or service (renewable resources, non-renewable resources and imported
resources), its added value is to assess process efficiency and "size" on the biosphere
scale (UEV and U respectively), and compare local versus imported flows (EYR),
nonrenewable versus renewable flows (ELR), and also provide a sustainability evaluation
based on the supply side of resources (ESI) instead of the usual user-side (emissions)
(Buonocore, E., Vanoli, L., Carotenuto, A., & Ulgiati, 2015). Traditional analysis does not
account for ecological services required for dilution of pollutants to air and water up to
permissible limits, nor the environmental burden generating ecosystem and human health
loss. However, it considers the human work and quality of life (Product Unit Emergy Value
Gold, PUEV) as indicators of social and economic dimensions through Emergy Yield
Ratio and Emergy Exchange Ratio. This results reinforcing emergy accounting as a
selfconsistent method with high robustness (Giannetti, B.F., Almeida, C.M.V.B., Bonilla,
S.H., Agostinho, F., Ulgiati, 2013; Giannetti, B.F., Demetrio, J.F.C., Bonilla, S.H.,
Agostinho, F. & Almeida, 2013) , this subject is explained in later sections.
Finally, Figure 4-4 presents spider diagram for all indicators of each analysis
methodology, for open-pit and alluvial mining processes and also in an integrated way (all
methodologies). Normalizations were done based on the maximum value of each index

210 Sustainability Assessment of Alluvial and Open Pit Mining Systems in Colombia: Life Cycle Assessment, Exergy Analysis, and Emergy Accounting
per both systems and product levels; therefore, product diagrams (a-1, a-2, a-3) can be
compared.
Figure 4-4: Spider diagram to open-pit and alluvial mining process by a) each methodology.
a-1) Life cycle assesment
a-2) Exergy analysis
1.00E-05
1.00E-04
1.00E-03
1.00E-02
1.00E-01
1.00E+00
Agricultural land
occupation, ALOP
Climate change,
GWP100
Fossil depletion, FDP
Freshwater ecotoxicity,
FETPinf
Freshwater
eutrophication, FEP
Human toxicity, HTPinf
Marine ecotoxicity,
METPinfMetal depletion, MDP
Natural land
transformation, NLTP
Particulate matter
formation, PMFP
Photochemical oxidant
formation, POFP
Terrestrial acidification,
TAP100
Water depletion, WDP
Open-pit mining Alluvial mining
1.00E-02
1.00E-01
1.00E+00Energy Cumulative Demand
Exergy Cumulative Demand
Output Exergy [kW]
Destroyed Exergy [kW]Exergy efficiency
Energy efficiency
Sustainable Index
Open-pit mining Alluvial mining

Chapter 4 211
a-3) Emergy accounting
Note: Diagram. Indicators were normalized based on the maximum value between two mining systems
Figure 4-5 and Figure 4-6 show Cumulative Exergy Demand (CExD), Cumulative Emergy
Demand (CEmD) and Total Environmental Points (TEP) in a comparative way (decir si se
normaliza o no o que se hace). CEnD and CExD indicator quantifies total energy, usable
energy and equivalent solar energy to sustain and provide goods or services along their
life-cycle (Rugani, 2010).
In general, the higher the total SED, the higher CExD and TEP, more than open-pit
mining with respect to alluvial mining in a ratio of 3 and 4 respectively; while CEmD is the
same for both mining processes with a value equal to 1.13E + 21 seJ / yr.
However, it is clear that CExD and CEmD are not comparable with CEnD, since the last
indicator does not evaluate non-energy resources such as minerals and metals. In this
sense, CExD is more useful than CEnD, because CExD provides information on the state
of system and its ability to perform a work in the future (Nielsen, SN, Bastianoni, 2007),
CEmD gives information on total energy used in formation of the resource (Rugani, 2010).
1.00E-06
1.00E-05
1.00E-04
1.00E-03
1.00E-02
1.00E-01
1.00E+00
Enviromental Loading
Ratio, ELR
Emergy Yield Ratio, EYR
Emergy Sustainable
Indices, ESI
Emergy Investment
Ratio, EIR
Renovabilidad Ratio,
Soil Emergy Cost, SEC
Emergy Exchange Ratio,
EER
Product Unit Emergy
Value Gold, PUEV
Unit Emergy Value Of
Economic Output, UEVE
Emergy equivalent loss,
EL
Emergy loss
percentage; ELP
Ecological services
Total emergy, Y
Open-pit mining Alluvial mining

212 Sustainability Assessment of Alluvial and Open Pit Mining Systems in Colombia: Life Cycle Assessment, Exergy Analysis, and Emergy Accounting
In this way, the objective of each indicator is demonstrated, while CEnD and CExD
quantify an accumulated (energy and usable energy respectively) for the production of a
good, CEmD enlarges the accounting for overall "free" energy that flows naturally into a
system (ie solar energy). Hence the explanation why CEmD> CExD> CEnD (1,13E + 21
seJ, 1,62E + 08 kW 1,60E + 08 kW to open-pit) (1,13E + 21 seJ, 5,20E + 07 kW, 3.76E +
07 kW to alluvial mining), although energy efficiency is greater with respect to exergy.
Figure 4-5: CExD, CEnD, CemD and TEP to open-pit and alluvial mining processes.
Regarding Energy, Exergy and Emergy Efficiency Figure 6 shows how open-pit mining
presents better energy and emergy efficiency; however, it has very low exergy efficiency
with respect to alluvial mining. This means that in open-pit mining, the process presents
good technological efficiency, however this energy transformation is not usable in its
largest proportion. That is, as anergy (energy not usable) increases, exergy decreases.
With respect to emergy efficiency, the more energy transformations contributing to a
product, the higher the transformation; the higher the transformity, the lower the efficiency
(more emergy is needed to produce the same amount of product). In fact, at each
transformation available energy is used up to produce a smaller amount of another form
0.00
0.50
1.00
1.50
2.00
Cumulative Exergy
Demand (CExD)
[kW*10^8]
Cumulative Emergy
Demand (CEmD) [seJ/yr
*10^21]
Total Environmental Points
(TEP) [Points*10^5]
Energy Cumulative
Demand *10^8
Open-Pit mining
Alluvial mining

Chapter 4 213
of energy: emergy increases and energy decreases, therefore emergy per unit of energy
increases sharply (Rugani, 2010) (Odum, 1996) (Odum, 1996). So, the same inversion of
emergy is required in both processes for a greater production in open-pit mining with
respect to alluvial mining. In the opposite case, where a different investment of emergy for
the two processes had been submitted, more emergy assigned to a process must be
interpreted as "appropriation of more environmental work to produce the used resources
and / or more work required to replace them (Ulgiati et al., 2011).
Figure 4-6: Energy, Exergy and Emergy efficiency to open-pit and alluvial mining process.
Note: energy efficiency was calculated under the first law of thermodynamics, exergy efficiency was calculated as ratio of output exergy and input Exergy; emergy efficiency was calculated as ratio of total emergy and total gold production.
Critical stages of open-pit and alluvial mining processes
This section briefly describes each mining process stages that generate greatest
environmental impacts, greatest exergy losses and lowest emergy efficiency; subject
described in detail in previous sessions.
Life Cycle Assesment
0.0100
0.1000
1.0000
Exergy Efficiency [%]
Emergy Efficiency seJ/ton
*10^21Energy Efficiency [%]
Open-Pit mining Alluvial mining
214 Sustainability Assessment of Alluvial and Open Pit Mining Systems in Colombia: Life Cycle Assessment, Exergy Analysis, and Emergy Accounting
In environmental terms, tails and extraction process were the most critical stages in open-
pit mining technology; where human toxicity and natural land transformation were the
most representative impact categories to tails, and particulate matter formation and
climate change to this extraction system. In alluvial mining technology it was stripping
stage, being natural transformation and agricultural land transformation some of the most
relevant environmental impact categories. These results are possibly influenced by a few
skews, since in open-pit mining, approximately 70 substances present in tails stage were
taken into account, unlike alluvial mining where only 17 substances were considered for
reasons of quality data. This are implications in the non-comparability of both mining
systems in this stage of the process. However, in alluvial mining technology, water
resource plays an important role in mineral benefit stage, avoiding the use of toxic
chemicals, implemented in minor concentrations, in comparison with open-pit mining
technology. To extend this information, see chapter 2 of this document.
Exergy assessment
The most critical stages (higher generation of entropy and therefore greater exergy
destroyed) in open-pit mining process based on exergy assessment are tails, followed by
stripping and extraction process, with an exergy efficiency of 0.050, 0.72 and 1.60%
respectively. Sustainability index is equal to 1.00 to tails, 1.01 to stripping and 1.02 to
extraction. Note that these stages were also the most critical under LCA perspective.
Unlike alluvial mining, where stages with lower exergy efficiency and therefore lower
sustainability index are casting and molding (eff = 4.4767E-06%), chemical separation (eff
= 0.01%), drying and separation (0.32%), and exploration stage (0.09%) with an SI of
1.00 for all the stages mentioned.
The similarity of exergy results in open- pit process compared to LCA results can be
produced because the environmental load generated in that process does not come from
the use of inefficient technologies, but rather from loads generated due to the use of
resources inherent to the process. On the other hand, in alluvial mining, the difference in
results is possibly subject to low efficiency of the technology used, which cannot be
valued by life cycle methodology; it makes the quantification of environmental impacts
caused by the use of resources and not by process efficiency, hence the reason why
stripping stage is the most critical under this analysis. This information can be extended in
chapter 3 of this document.
Chapter 4 215
Emergy assessment
Given that emergy accounting does not account for process sustainability in stages but in
a holistic way (Odum, 1996); it will not be analyzed the most critical stage of both
processes but the emergy efficiency already addressed in previous sections. Alluvial
process is less efficient with a value of 3.64E + 20 seJ / ton in relation of 5.91E + 19 to
open-pit process, because it has the same emergy demand to produce more gold in
open-pit mining with respect to alluvial mining. Hence the reason for good economic
returns obtained in the first system. This information can be extended in chapter 4 of this
document.
4.3.2 Complementarity or redundancy among analysis methodologies: LCA, ExA, EmA
Finally, complementarity or redundancy of the results obtained by the three
methodologies is identified as a tool to inform decision making in mining sector. To do
this, a literature review is first made for each analysis methodology implemented, then
complemented and corroborated with results obtained in this case study.
It is noteworthy that the objective of this thesis is not to evaluate, nor to question the
theoretical and scientific basis of each methodology. Its objective is to analyze indicators
generated by each methodology implemented for this specific case study and how
complementary or redundant they can be, resulting in the proposal of an integrated
sustainability analysis methodology as shown in chapter 5 of this thesis. Table 4-5
summarizes differences and similarities between each analysis methodology.
Emergy Accounting vs Exergy Analysis
- Emergy as an exergy function?
One of the most controversial issues among scientific community of exergists and
emergists is to reach a consensus on whether emergy can be expressed in terms of the
exergy or if both methodologies are completely opposed and complementary. In this
document, both points of view will be presented in a much summarized way; it is not the
scope of this study to demonstrate one or another position by any means, neither
qualitative nor quantitative, this is in the hands of the reader. However, a position must be
taken to be able to continue with the topic of analysis, making the proviso that to date a

216 Sustainability Assessment of Alluvial and Open Pit Mining Systems in Colombia: Life Cycle Assessment, Exergy Analysis, and Emergy Accounting
conciliation has not been achieved. For extending the arguments presented here
(mathematical basis), which is not the objective of this research work, either within the
scope of this study, please refer to "Emergy and exergy analysis: Complementary
methods or irreducible ideological options?" from (Sciubba & Ulgiati, 2005)
- Emergy is a function of exergy
First, the arguments of those who support the hypothesis that emergy is a function of
exergy as redundant and non-complementary methodologies will be presented, and then
arguments of the contradictors of this assertion.
Odum, creator of emergy accounting defines Solar emergy as "the available solar energy
used up to make a product or service in an ecological or economic system. Its unit is the
solar emjoule (abbreviated sej). Available energy is energy with the capacity to do work
sometimes called exergy” (ODUM, 2001); that is, solar emergy is assumed to be the
driving force for all transformations in nature and human economic activities (Pizzigallo
A.C.I., Granai C., 2008). Approach supported by Ulgiati and Bastionini who define emergy
as a concept based on the 2nd law of thermodynamics, and thus it follows the history of
available energy (exergy) use required to create a product or service (S. Bastianoni,
Campbell, Ridolfi, & Pulselli, 2009), in this way we can calculate emergy not as the total
energy but as the total available energy (exergy) directly or indirectly required for the
generation of a good or service (Brown & Ulgiati, 2010a). Thus emergy accounting is
equivalent to exergy analysis if its limits include ecosystems (Hau & Bakshi, 2003) and
only differ in the emergy algebra described in chapter 3 of this document (S. Bastianoni et
al., 2009).
With respect to the way transformities are calculated, whether in terms of exergy or
energy, Bastianoni et al. (2007) suggested an exergy correction factor in order to account
for the differences arising when flows are expressed by means of an energy or exergy
number as follows (Sciubba & Ulgiati, 2005):
Exergy of solar radiation, Exs, depends on the source (sun) and environment
temperatures TS and To (Petela, 1964), according to Eq.
(4.1): = ∗[ − ∗ ∗ + / ]

Chapter 4 217
(4.1)
Where s is a proportionality
constant (Stefan-Boltzmann constant, 5.6667 x 10⁻⁸ W*m-2*K-4). As a consequence, based
on average values for temperatures (TS=5800 K; To= 255 K) and solar radiation constant
(Es = 1360 W/m2) the solar exergy value is (Petela, 1964). See Eq. (4.2)
(4.2)
With a factor of 0.94 (∝ , which expresses the amount of useful energy present in solar
energy; an expression that relates emergy according to exergy (Em x )is obtained.
(4.3)
Eq. (4.3) shows that emergy can be derived as a function of exergy, but it has an
absolutely different meaning and reasoning; not all emergy is equal to exergy, that is, if
the amount of energy directly and indirectly required to produce a particular item is high
(after a selection process), it means that the item has high emergy and is valuable for the
system, regardless of the exergy it potentially carries (Nielsen, S.N., Bastianoni, 2007).
In Brown & Ulgiati, 2010b the calculation method of main driving emergy flows of the
geobiosphere to which all other flows are referenced is available. They form the baseline
for construction of tables of Unit Emergy Values (UEVs) to be used in emergy
evaluations.
- Emergy is not a function of exergy
Detractors argue that the definition of emergy as proposed by Odum differs greatly from
the conventional concepts of "Exergy" and "Energy"; while emergy is the available energy
of one kind used up directly and indirectly in transformations to make a product or service;
exergy is the maximum work that can be obtained from a system when it is brought from
its present state to the state of thermal, mechanical and chemical equilibrium with the
surrounding environment (S.A. Bastianoni, Facchini, Susani, & Tiezzi, 2007). The word
'Exergy' is firstly put forward in 1956 (Rant Z.), and is well discussed by many researchers
= ∗[ − ∗ ∗ + / ]
= . ∗
∝ =

218 Sustainability Assessment of Alluvial and Open Pit Mining Systems in Colombia: Life Cycle Assessment, Exergy Analysis, and Emergy Accounting
(Sciubba & Ulgiati, 2005). According to some authors (Patterson, 2012) it is the most
holistic expression of an energy theory of value.
In addition to conceptual vacuums, opponents of the hypothesis mathematically
demonstrated that transformicities (UEVs) calculated from baseline are inaccurate and
also affect all other flows calculated after them. Although inaccuracy is not very large in
most of the cases (also considering the uncertainty in estimates of global flows) there is a
theoretical inconsistency (S.A. Bastianoni et al., 2007; Sciubba, 2010; Sciubba & Ulgiati,
2005; among others).
Apart from that, continuing with the basis definition of emergy, it implies that the current
flows to a process are accounted for as "available energy" flows (or exergy). However,
most often such a definition is not implemented properly, and broadly UEVs that are not
consistent with basic principles of the method, as well as with those values that were
instead calculated on the basis of available energy flows (for example those for minerals
calculated by Gilliland et al., 1978 and by Gilliland and Eastman, 1981).
Assuming that UEVs were calculated based on energy flows instead of Exergy flows, this
is overestimated by 6%, (Sciubba, 2010a) noted that “because of Emergy hierarchical
arrangement of energy flows, this 6% difference propagates downstream, affecting
absolute values of all emergy content of material and immaterial goods in a measure that
depends on the structure of the production process”. Moreover, after pointing out that
exergy values of Earth flows were independently calculated by (G. Q. Chen, 2005;
Hermann, 2006; Szargut, J.; Morris, D.R.; Steward, 1988). Sciubba estimated that using
energy as a numeraire to quantify tidal potential and deep heat as in emergy Folio 2
(Odum, 1998) overestimates the incoming energy by about 28% (Sciubba, 2010b).
Another example why it cannot be taken as valid that Exergy Analysis and Emergy
Acoounting are equivalent is the following: an input of organic matter may carry very
different work potential depending on the water content percentage and its current
chemical composition; while mass (property that is only taken into account in emergy
analysis), even if dry matter, does not properly account for such differences, chemical
exergy does. For such a reason, mass and energy numeraires should be replaced by
exergy numeraire and all UEVs recalculated accordingly. This is not only because of the

Chapter 4 219
need of more accurate values, but is mainly aimed at re-establish the consistency with
basic principles, as well as among different databases UEVs (Sciubba & Ulgiati, 2005).
Based on the above, and discussed by Sciubba & Ulgiati, from here on the two methods
will be taken as complementary rather than competing, and respective results will have
some degree of uncertainty (not less for Exergy anlysis) accordingly to its foundation; It is
noteworthy that Odum never raised directly that exergy was equal to emergy, this
discussion occurred in recent years (Sciubba, 2010b). Scciuba demonstrates conclusively
that the term "available energy" used by Odum means "energy that can be used" instead
of exergy. In this way the claim that emergy is based on the second law of
thermodynamics is refuted. Emergy and exergy represented two thermodynamic and
holistic approaches of complementary utility (S.A. Bastianoni et al., 2007).
Both methods play an important role depending on the objective of the researcher, exergy
analysis for optimization of processes through improvements in exergy efficiency, and
emergy analysis provides better information for the evaluation of process interconnection
with environmental dynamics. There are undeniable differences between them; they use
different methods, have a different metric and provide different values, even for
apparently similar indicators, for this reason analyzes must be carefully separated and
implemented as a complementary goal function (Bakshi, 2002, S.A. Bastianoni et al.,
2007). Emergy and exergy represent two thermodynamic and holistic approaches of
complementary utility (Simone Bastianoni, Pulselli, & Rustici, 2006), and their integration
helps to understand the environmental status of the resources used by a system and its
efficiency level, by an assessment of flows consumption and savings (of energy and
matter) throughout production chain.
Life Cycle Assesment vs Emergy Accounting
There is no discussion as to whether donor-side view of Emergy Accounting (EA) may be
combined with user-side view of LCA for a more comprehensive analysis (Cherubini,
Bargigli, & Ulgiati, 2008; Kharrazi, Kraines, Hoang, & Yarime, 2014; M. Raugei, Rugani,
Benetto, & Ingwersen, 2012). Joint use of LCA and EA enlarges analysis boundary from
technosphere (human based) to biosphere (nature based, an indication of environment
work that would be needed to replace what was consumed) and can evaluate the impacts
at both scales (M. Raugei et al., 2012). These approaches are not mutually exclusive

220 Sustainability Assessment of Alluvial and Open Pit Mining Systems in Colombia: Life Cycle Assessment, Exergy Analysis, and Emergy Accounting
(competitive among themselves), and on the contrary, they should complement each
other (Brown, Raugei, & Ulgiati, 2012; Lacarrière, Deutz, Jamali-Zghal, & Le Corre, 2015).
It was shown that emergy could provide a complementary indicator for resources, as
‘aunified measure of environmental support provision, and an indication of the
environment work needed to replace what is consumed’ (M. Raugei et al., 2012).
While life cycle studies provide information about environmental impacts due to resource
consumption and emissions based on matter and energy flows, ignores flows outside
market dynamics and flows not associated to significant matter and energy carriers (such
as labor); also the work of ecosystems to provide ‘freely available’ services and products
(e.g. land restoration, rainfall, soil organic matter, etc.) are generally disregarded, and the
time needed for resource generation within natural cycles (that is a fundamental
parameter for their renewability) is not accounted either (Buonocore, Vanoli, Carotenuto,
& Ulgiati, 2015; M. Raugei et al., 2012). Thermodynamic “donor side” emergy analysis
evaluation technique enables us to evaluate environmental work invested to support
different processes. This method accounts free renewable inputs, different forms of
energy, materials, human labor and economic services on a common basis (solar
energy), offering greater potential to explore the sustainable interplay of environment and
economy (Buonocore et al., 2015).
An important contribution of LCA to EA has been the use of Inventory Life Cycle
Assessment (represents the cumulative amount of resources and emissions exchanged
between technosphere and natural environment (Arbault, Rugani, Marvuglia, Benetto, &
Tiruta-Barna, 2014)) as a database for EA development, which account for hundreds of
environmental interventions in thousands of common industrial processes, such as
Ecoinvent database (Hischier et al., 2010). Also, through LCI databases, emergy might
bring a complementary concept into LCA to assess from ecosystem services use as
addressed in the fourth chapter of this document.
Rugani in 2011, made an important contribution to LCI Ecoinvent database, where
cumulative Emergy Demand was used as Solar Energy Factor of natural resources to be
applied as characterization factor to LCI results (Arbault, Rugani, Marvuglia, et al., 2014),
although there are differences in conventions, system boundaries, and allocation rules
between emergy and LCA that require adjustments from the conventional application of
energy to achieve a consistent integration (Ingwersen, 2011).

Chapter 4 221
Considering what has been explained in chapter 2 and in this one, it is possible to see
how this attempts have had the character of a synoptic assessment where both
approaches have been used as complementary tools, rather than as a structural
integration (Ingwersen, 2011) which is intended in this doctoral contribution. Here,
measure downstream environmental burden is integrated effectively, eg, the impact of
emissions in the production chain (LCA), and upstream evaluating the work that nature
had to do to provide those resources (EA) when both approaches are integrated.
Life Cycle Assessment vs. Exergy Analysis
Both LCA and Exergy analysis are considered user-side approaches. Exergy Analysis
being approached as an extension of LCA to ExLCA (Exergy Analysis of the Life Cycle)
as complementary and not exchangeable tools and quantifying life cycle exergy
efficiencies, Cumulated Energy Demand (CEnD) and Cumulative Exergy Demand (CExD)
indicators. These indicators quantify energy / exergy used throughout life cycle,
distinguishing between renewable and non-renewable energy requirements (depict total
energy / exergy removal from nature to provide a product, summing up the exergy of all
resources required). That is, exergy indicators are additional to LCA whose calculation
method can differ from one methodology to another as explained in chapter three of this
document. Unlike exergy Analysis, LCA does not quantify the efficiency of the process but
could estimate the eco-efficiency as the relationship of the product with respect to the
impacts generated.
However, despite its relevance, both analysis methods, given that they are user oriented
do not include ecosystem's contribution to economic activities (resource costs of labor,
capital and environmental remediation) (Sciubba & Ulgiati, 2005). That is why it is
necessary to go beyond the traditional boundaries of these methods to include the
mentioned costs.
4.3.3 Limiting factors of each methodology
In this section, limitations of each methodology are summarized. It should be noted that
this study was developed under the bias presented by each methodology, since as any
analysis methodology presents inherent subjectivities to a lesser or greater extent,

222 Sustainability Assessment of Alluvial and Open Pit Mining Systems in Colombia: Life Cycle Assessment, Exergy Analysis, and Emergy Accounting
depending on its foundation. It is not the competence of this study to analyze these
limitations, nor to address possible solutions to minimize them.
Emergy Accounting
Regarding Emergy Accounting, it is indisputable that the main bias refers to UEV
calculations, two systems start and end at the same state, but the paths they traversed
were very different, thus their UEVs are different even though the output is the same
(Comar & Komori, 2007). This calculation can be tedious and emergy authors or
evaluators rely on published UEVs to be implemented in their study by assuming they are
still valid under different conditions of place and / or time. This assumption may be quite
subjective and creates doubts in readers or users (Comar & Komori, 2007; Rugani, 2010).
An incorrect choice of a transformity value may affect all other calculations and the
ultimate validity of results (Sciubba & Ulgiati, 2005). This could reduce the accuracy of
final indicators and the efficacy of convincing policy makers to prioritize emergy
evaluations, as they do with other traditional evaluation methods such as Life Cycle
Assessments, Material Flow Accounting, etc. (Comar & Komori, 2007).
However, great efforts of the International Society for the Advancement of Emergy
Research (ISAER), who analyze and maintain these values for different processes, can
give a little relief.
Matthew J. Cohen, Sharlynn Sweeney, and Mark T. Brown at the Fourth Biennial Emergy
Conference in Florida, computing Unit Emergy Value of crustal elements, assume that
UEV for an ore body is linearly related to its concentration (the more ore concentration the
less energy is required for its extraction); that is, specific emergies of dispersed minerals
are then inversely proportional to their abundance (Jamali-Zghal, Le Corre, & Lacarrière,
2014). It is also assumed that UEVs values interfere with the depth at which mineral is
found in earth's crust, for which Ore Grade Cutoffs - OGC (OGC = minimum grade
required for a mineral or metal to be economically mined (or processed) was taken into
account. Material found to be above this grade is considered to be ore, while material
below this grade is considered to be waste) for year 2000. Other models are based on the
chemical and concentration of the mineral, its condition in the mine and its abundance
(Jamali-Zghal et al., 2014). For extending the calculation method for UEVs, refer to the
citations referenced in this section. On the other hand, UEVs variability for different types

Chapter 4 223
of rock are relatively small (1.68 - 2.44 E9 sej / g) so in this study no distinction is made
among types of rock participating in both mining processes (Comar & Komori, 2007).
One of the limitations of the emergence is that indicators such as Emergy Exchange Ratio
(EER) depend on the market price of gold. While exergy analysis provides objective
information as it is not subject to monetary policy or currency speculation
Exergy Accounting
The value of calculated exergy and other exergy indicators can vary significantly
depending on the reference state taken, so data cannot be extrapolated; results of the
same exergy analysis in another geographic location will vary because environmental
conditions are different, however these variations are not significant. This state of
reference does not only depend on environmental conditions in which project is executed,
it also depends on the selection made by the person performing the analysis.
Exergy efficiencies of the process can also present variations, depending on whether they
are calculated in relation to exergy of resources, products or waste. The exergy of
resource is the one consumed to generate the product of interest, and exergy of the
residue is the one contained in flows without associated added value. In this way
efficiencies can be calculated as:
The relationship of product exergy and exergy of resources. Used for the valuation
of each product.
The relation of output exergy (product plus waste) and input exergy. Used for the
evaluation of process efficiency.
Cannot identify the causes of the irreversibilities.
Life Cycle Assesment
One of the main biases that can be present in this methodology is characterization
factors, which differ considerably depending on the analysis methodology to be used, as
well as normalization and weighting factors. These equivalence factors are very stylized
and generalized, just as they are not the same in all places, since they are influenced by
ecological, technological and economic factors, and spatial and temporal variation as well
(M. Patterson, McDonald, & Hardy, 2017).(M. Patterson, McDonald, & Hardy, 2017).

224 Sustainability Assessment of Alluvial and Open Pit Mining Systems in Colombia: Life Cycle Assessment, Exergy Analysis, and Emergy Accounting
There is also no level of detail in the calculation of these factors for the methodologies
used in this study (Recipe in LCA development, chapter two. Ecoindicator 99 for
calculating ecological services, and emergy equivalent loss by human health and
resources in emergy analysis, chapter 3).
LCA has the lack of reliable data to perform life cycle inventory of a complex process,
apart from the use of databases provided from case studies of specific locations with
different conditions for each case study (Kounina et al., 2013).
None of these approaches take into consideration that physical limits of human
exploitation of the planet may have been reached (Rockstrom, J., Steffen, W., Noone, K.,
et al., 2009) due to the increasing global population and technological improvements
(Moldan, B., Janou sková, S., Hák, 2012), in order to assess the impact of resource
scarcity, especially exhaustibles.
The generated impacts vary significantly depending on the type of Allocation carried out, if
it is economic or physical, and more in processes where the market price varies
considerably, in LCA and Exergy Analysis it was necessary to carry out this type of
allocation, being selected the economic Emergy Accounting does not present this
problem since the allocation of impacts is done under the guidelines of the emergy
algebra.
It can also be taken as a bias that none of the methodologies value ecological synergy;
that is, interrelation between environmental impacts and their possible magnification is not
considered as it is hierarchized in the productive chain.
There is a great limitation in the consideration of social and economic indicators, because
exergy analysis does not include any indicator and LCA only considers human health in
social dimension. Unlike emergy analysis that quantifies investment and economic return
together with human labor.
These three methodologies are developed in different time scales, which can bias
comparative results between the two systems evaluated for each one. LCA was carried
out under a hierarchical perspective, which assesses impact categories and

Chapter 4 225
environmental damage to 100 years (future time); Emergy Accountig bases its evaluation
on a non-human temporal scale (environmental burden associated with memory energy
embodied in the non-renewable and imported renewable resources used in the process
(past and present time, gives historical information); and Exergy Analysis involves
efficiency of the process in the current state (present time) in the calculation of
sustainability. Table 4-5 summarizes what has been discussed so far in this chapter by
comparing differences and similarities between analysis methodologies.

Chapter 4 226
Table 4-5: Summary of differences and similarities between Life cycle Assessment, Exergy Analysis and Emergy Accounting.
LCA Exergy Emergy
Evaluates environmental sustainability of the process based on the quantification of environmental impact caused by emissions generated in the process by the use of renewable and non-renewable resources necessary to provide that product or service.
Evaluates sustainability of the process based on the environmental burden associated with destroyed exergy with respect to its reference environment. That is, it evaluates sustainability from the quantification of usable energy loss due to inherent irreversibilities of the process and non-use of outputs (waste and emissions) ending up in the environment through destroyed exergy.
Evaluates sustainability of the process based on the environmental burden associated with the consumption of all direct and indirect inputs (renewable, non-renewable and imported resources) to provide that product or service.
LCA is a typical bottom up environmental tool, containing only up-stream and down-stream data of product or service. Thus, it cannot embody indirect flows outside system boundary (Dong, H.,Geng,Y., Sarkis, J., Fujita,T.,Okadera,T.,Xue, 2013). Indicators are based on user-side human preference values, while donor-side perspectives, namely nature investment, cannot be reflected, resulting in ignorance of ecosystem contribution to economic development.
"User-side" evaluation does not completely quantify the role of environment in the formation of energy and in absorption and processing of pollution (Brown and Herendeen, 1996).
Such a method provides a 'donor-side' evaluation and is able to reflect the quality of different inputs to one economic system. By assigning values to nature environmental efforts and investment to make and support flows, materials, and services. This method can evaluate the real contribution of natural ecosystem to the economic system (Yu et al., 2016).
Downstream impact (Ulgiati et al. 2006) Downstream impact Upstream impact
Accounting for environmental impacts based on boundaries system (technosphere).
It counts exergy required to carry out the process based on defined limits (Cumulative Exergy Demand) and how much of that available energy was used.
It accounts for, in solar joules, solar energy required and effort that nature had to make to provide that resource (Cumulative Emergy Demand).
It does not take into account the quality of resources consumed.
It takes into account the quality of resources consumed.
It takes into account the quality of resources consumed.
System boundaries on a human scale, physical limits (technosphere).
System boundaries on a human scale, physical limits (technosphere).
System boundary is geobiosphere.
Inventory of inputs and outputs
Inventory of inputs and outputs Inventory of inputs
Use characterization factors in order to bring all the emissions generated in the process to equivalent units for each impact category analyzed.
It uses the standard chemical and physical exergy of each compound to carry each of the mass and energy flows to exergy flows.
Use emergy equivalent units (EUV) or trasformity to pass energy, mass and monetary flows to common units (equivalent joules solar, sej), of all inputs required to carry out the process.

Chapter 4 227
These characterization factors represent Kg equivalent to the reference substance, which multiplied by its flow results in equivalent kg of the respective category of environmental impact evaluated.
Physical and chemical exergy represent usable energy content of each current when brought into equilibrium with its reference environment. Each mass and energy flow is multiplied by its physical and chemical exergy to bring it to terms of energy quality.
Each mass flow, monetary or energy is multiplied by its respective transformity factor to take it to solar joule equivalents.
It does not have a common unit of measurement.
Mass and energy flows pass to a common base unit of usable energy
Mass, energy and monetary flows pass to solar equivalents.
Does not discretize in non-renewable and imported renewable inputs.
Does not make differences between all kinds of energy resources (renewable, non-renewable and imported); meanwhile, different flows of energies, materials and services are usually not comparable due to their different functions.
Discretizes non-renewable and imported renewable inputs.
This method does not consider environmental contribution to human economic system (sunlight, soil, detrital matter, pollination service, fishery, nitrogen and phosphorus mineralization, and nitrogen deposition).
This method does not consider environmental contribution to human economic system (sunlight, soil, detrital matter, pollination service, fishery, nitrogen and phosphorus mineralization, and nitrogen deposition).
Accounting renewable ecosystem goods and services such as sunlight, soil, detrital matter, pollination service, fishery, nitrogen and phosphorus mineralization, and nitrogen deposition.
Social LCA, Environmental LCA, Economic LCA.
Thermoeconomy, Exergy Cost. Ecological Cumulative Exergy Consumption.
It depends on the analysis methodology implemented. Results also depend on human preferences.
It depends on a reference environment (destroyed exergy depends on environment and reference taken).
It depends on the baseline taken and UEVs taken in the process (different UEVs for the same resource).
------ Reference environment is defined by the researcher
Total annual emergy input to the biosphere, derived from solar radiation, tidal momentum and geothermal energy, is called emergy baseline (Zhang, XH, Pang, MY, Wang, 2014). However, related indicators or ratios will not change as long as the same emergy baseline is used in this research. Therefore, whichever emergy baseline will not affect final study results.
Allocation (economic / physical). Allocation (economic / physical).
Allocation (economic / physical).
It takes into account stress and availability of It depends on reference environment. It depends on the baseline and therefore on the

228 Sustainability Assessment of Alluvial and Open Pit Mining Systems in Colombia: Life Cycle Assessment, Exergy Analysis, and Emergy Accounting
resource depending on geographical location.
transformity adopted
Future, depending on the perspective implemented (20, 100, 500 years).
Present
Gives historical information, past and present (is extended in time to include the environmental work needed for resource formation and human activities).
Results cannot be extrapolated.
Results cannot be extrapolated, unless there is an equal reference status
Results cannot be extrapolated.

229 Sustainability Assessment of Alluvial and Open Pit Mining Systems in Colombia: Life Cycle Assessment, Exergy Analysis, and Emergy Accounting
4.4 Outlook
● Life Cycle Assessment: To get a clearer picture it is proposed to invest in further
research on the exact composition and lixiviation of toxic substances in both mining
systems, and on secondary effects of land and water use most of all in alluvial mining.
Based on more precise information some recommendations could be formulated to
optimize them and to reach a well-founded decision on which is preferable, taking into
account local conditions of each mining site.
● Life Cycle Assesment: To get a clearer picture of the impacts caused by the sulfidic
tailings, it is proposed to do a more profound study on this issue with an equal set of
substances analyzed in both mining systems, and performing a sensitivity analysis on
percentages of substances released to ground water. As in open pit mining the set of
substances analyzed in slurry tailing was more extensive than in alluvial mining, a direct
comparison does not seem valid.
● Exergy Analysis: It is necessary to use methodologies complementary to exergy
analysis such as thermoeconomic analysis, which allows to justify exergy and economic
cost through gold market price; that is, gold market price is the one that internalizes the
externalities generated in the process. This market price bears exergy losses of the
process and, in turn, allows recovering natural and human capital invested from cradle to
gate.
● This research did not consider important factors that can be taken into account in future
work:
Interrelation between environmental impacts and their possible magnification
as they are hierarchized in the productive chain (ecological synergy).
Account directly (community, employees and other directly affected) damage to
human health generated by extractive activity.
Expand social and economic indicators, quite limited in all analyzed
methodologies, the ideal is to be able to complement Environmental LCA (E-LCA)
developed in this study with Social and Socio-Economic LCA (S-LCA) and Exergy
Analysis with thermoeconomic; methods beyond the scope of this study but whose
realization would provide a stronger support in terms of social and economic
indicators.

230 Sustainability Assessment of Alluvial and Open Pit Mining Systems in Colombia: Life Cycle Assessment, Exergy Analysis, and Emergy Accounting
4.5 Conclusiones
Emergy analysis is a donor-side method. Therefore, it values sustainability by accounting
for the use of direct or indirect resources that support gold production systems,
independent of the real demand, and are not captured by other existing analysis methods
such as LCA and Exergy Analysis, focusing on nature investment on the work performed
by biosphere to generate resources and services, and / or the effort invested by nature to
replace those resources. This method is not good for measuring environmental pollution
(a user-side problem), since emergy cost would be much higher if environmental burden
was involved, as demonstrated in chapter 4 of this document. Hence the need to involve
analytical methodologies that can provide a more systematic accounting of negative
impacts environmental costs to human wellbeing and ecosystem.
Here is the key difference between the three analysis methodologies; LCA and Exergy
Analysis are "User-Side" methods while Emergy Accounting has a "Donor-Side"
perspective, providing a more complete and integrated image for environmental decision
making. Exergy Analysis represents a single process by taking into account the maximum
amount of work from direct support of material and energy use. Energy Evaluation
focuses on the use of renewable / non- renewable energy, and LCA evaluates the
environmental impacts associated with emissions generated by the use of resources. The
last three methods cannot address the contribution of natural ecosystem to economic
development.
It is indisputable that for addressing environmental sustainability through Life Cycle
Assessment and Exergy Analysis, the role of ecological goods and services must be
included, as they form the basis of planetary activities and human wellbeing. This implies
that system boundaries must be large enough to account for all the ecosystem goods and
services that support process activities in life cycle.
Exergy analysis is a very useful tool when the goal to measure the efficient use of energy
incorporated in resources, and therefore relative measures of thermodynamic efficiency of
the system, analyze together with utility loss of resources that participate in the process.
The exergy associated with polluting emissions can be seen as a potential harm to the

Chapter 4 231
environment. The waste, not being in balance with the environment, has a high potential
to produce unfavorable changes in the environment of the analyzed system. Normally, the
exergy emitted in the waste causes damage to the environment. Despite the "similarity"
between exergy and emergy, results obtained as CExD and CEmD differ significantly.
This shows that contribution sources of exergy are quite different from those of emergy.
Exergy more precisely measure embodied energy consumption, whereas emergy is a
measure of energy throughput, and could be better described as measuring use than
consumption (Gössling-Reisemann, 2007). Also, exergy describes the available energy in
substances (including the chemical energy in minerals), which is not the same as the
amount of energy used directly and indirectly in their creation in the environment.
The miner’s choice of a production system does not depend only on the economic inputs
to outputs ratio or the exacerbation of environmental loads and environmental
sustainability, it also depends on resource types, abundance, location in the earth, and
access to land, mineral sale price, extraction method, type of technology implemented,
among other determining factors.
For this reason, determining which process is more sustainable with respect to the other
would be to give a priori judgments, that even though all analysis methodologies point to
the same (alluvial mining on open-pit in terms of sustainability) under the same foundation
of calculation and boundaries systems, it cannot cover all the factors mentioned above
and which play a decisive role when defining which mining process is more sustainable
with respect to the other. Neither the spirit of this thesis is to generate controversy in
mining sector. It is only intended to show the implementation of analysis methodologies
that make the process much more sustainable, which entails linking efforts among
different stakeholders in order to make the concept of sustainable development a reality;
promote economic growth limited to an acceptable environmental burden whose ultimate
goal is to provide social welfare, not having a scope as a limit, but a continuous effort.
Since sustainability has no numerical borders and the goal is to ensure that processes are
increasingly sustainable subject to ecological, social, cultural and political dynamism of
the environment where it is implemented.
Likewise, the objective of this section is not to determine which sustainability assessment
methodology is better with respect to the other, far less try to solve the limitations of each

232 Sustainability Assessment of Alluvial and Open Pit Mining Systems in Colombia: Life Cycle Assessment, Exergy Analysis, and Emergy Accounting
analysis tool and biases that may be incurred under its implementation. As any
methodological assessment has something of subjectivity, where the important thing is to
make aware of it or in order to make a better interpretation of results. It is undeniable that
each of them provides factors of analysis that the other one does not, and that their
complementarity becomes necessary as has been addressed in latest advances in the
subject, highlighting that to date they have not been addressed in full three
methodological tools under a new methodological proposal of analysis, which allows to
have more and more valuation of sustainability methodologies, much more robust and
objective that do not depend so much on policy makers but on a much more solid
theoretical foundation, which can make environmental decision making more reliable.
4.6 Acknowledgments
This project was carried out as part of the Doctoral Program funded by the Department of
Science and Technology of Colombia (COLCIENCIAS). The authors thank the mining
companies (open-pit and alluvial mining technology) for the provided data and
recommendations. This research was supported by the 1) School of Mines at the National
University of Colombia at Medellín; 2) Bioprocess and Reactive Flow Research Group; 3)
Faculty of Applied sciences, Department of Biotechnology at Delft University of
Technology; 4) Biotechnology and Society Research Group.
4.7 Disclaimer
This research is focused on studying the sustainability of two different extraction mining
processes such as open pit and alluvial mining technologies. Data provided by mining
companies is confidential information used only for academic purposes.
References
Arbault, D., Rugani, B., Marvuglia, A., Benetto, E., & Tiruta-Barna, L. (2014). Emergy evaluation using the calculation software SCALE: Case study, added value and potential improvements. Science of the Total Environment, 472. http://doi.org/10.1016/j.scitotenv.2013.11.087
Arbault, D., Rugani, B., Tiruta-Barna, L., & Benetto, E. (2014). A semantic study of the emergy

Chapter 4 233
sustainability index in the hybrid lifecycle-emergy framework. Ecological Indicators, 43, 252–261. http://doi.org/10.1016/j.ecolind.2014.02.029
Bakshi, B. . (2002). A thermodynamic framework for ecologically conscious process systems engineering. Comput. Chem. Eng, 26, 269–282.
Bastianoni, S. Ã., Facchini, A., Susani, L., & Tiezzi, E. (2007). Emergy as a function of exergy, 32, 1158–1162. http://doi.org/10.1016/j.energy.2006.08.009
Bastianoni, S., Campbell, D. E., Ridolfi, R., & Pulselli, F. M. (2009). The solar transformity of petroleum fuels. Ecological Modelling, 220(1), 40–50. http://doi.org/10.1016/j.ecolmodel.2008.09.003
Bastianoni, S., Pulselli, F. M., & Rustici, M. (2006). Exergy versus emergy flow in ecosystems: Is there an order in maximizations? Ecological Indicators, 6(1), 58–62. http://doi.org/10.1016/j.ecolind.2005.08.005
Bösch, M.E.; Hellweg, S.; Huijbregts, M.; Frischknecht, R. (2007). Applying cumulative exergy demand (CExD) indicators to the ecoinvent database. The International Journal of Life Cycle
Assessment, 12, 181–190.
Brown, M. T., Raugei, M., & Ulgiati, S. (2012). On boundaries and ‘investments’ in Emergy Synthesis and LCA: A case study on thermal vs. photovoltaic electricity. Ecological
Indicators, 15(1), 227–235. http://doi.org/10.1016/j.ecolind.2011.09.021
Brown, M. T., & Ulgiati, S. (2010a). Updated evaluation of exergy and emergy driving the geobiosphere: A review and refinement of the emergy baseline. Ecological Modelling, 221(20), 2501–2508. http://doi.org/10.1016/j.ecolmodel.2010.06.027
Brown, M. T., & Ulgiati, S. (2010b). Updated evaluation of exergy and emergy driving the geobiosphere: A review and refinement of the emergy baseline. Ecological Modelling, 221(20), 2501–2508. http://doi.org/10.1016/j.ecolmodel.2010.06.027
Buonocore, E., Vanoli, L., Carotenuto, A., & Ulgiati, S. (2015). Integrating life cycle assessment and emergy synthesis for the evaluation of a dry steam geothermal power plant in Italy. Energy, 86, 476–487.
Buonocore, E., Vanoli, L., Carotenuto, A., & Ulgiati, S. (2015). Integrating life cycle assessment and emergy synthesis for the evaluation of a dry steam geothermal power plant in Italy. Energy, 86, 476–487. http://doi.org/10.1016/j.energy.2015.04.048
Cano, N. (n.d.). Sustainability Assessment of Gold Mining by Life Cycle Assessment: Open-pit Mining VS Alluvial Mining. Cleaner Production.
Chen, G. Q. (2005). Exergy consumption of the Earth. Ecological Modelling, 184, 363–380.
Chen, W., Geng, Y., Hong, J., Dong, H., Cui, X., Sun, M., & Zhang, Q. (2018). Life cycle assessment of gold production in China. Journal of Cleaner Production, 179, 143–150. http://doi.org/10.1016/j.jclepro.2018.01.114
Cherubini, F., Bargigli, S., & Ulgiati, S. (2008). Life cycle assessment of urban waste management:

234 Sustainability Assessment of Alluvial and Open Pit Mining Systems in Colombia: Life Cycle Assessment, Exergy Analysis, and Emergy Accounting
energy performances and environmental impacts. The case of Rome, Italy. Waste
Management (New York, N.Y.), 28(12), 2552–64. http://doi.org/10.1016/j.wasman.2007.11.011
Comar, V., & Komori, O. M. (2007). Emergy synthesis 4: Theory and Applications of the Emergy Methodology. 7th Biennial Emergy Research Conference, (December), 11.
Dong, H.,Geng,Y., Sarkis, J., Fujita,T.,Okadera,T.,Xue, B. (2013). Regionalwater footprint evaluation in China: a case of Liaoning. Science of the Total Environment, 442, 215–224.
Frischknecht, R.; Wyss, F.; Büsser Knöpfel, S.; Lützkendorf, T.; Balouktsi, M. (2015). Cumulative energy demand in LCA: the energy harvested approach. International Journal of Life Cycle
Assessment, 20, 957–969.
Giannetti, B. F., Barrella, F. a., & Almeida, C. M. V. B. (2006). A combined tool for environmental scientists and decision makers: ternary diagrams and emergy accounting. Journal of Cleaner
Production, 14(2), 201–210. http://doi.org/10.1016/j.jclepro.2004.09.002
Giannetti, B.F., Almeida, C.M.V.B., Bonilla, S.H., Agostinho, F., Ulgiati, S. (2013). Primary evidences on the robustness of environmental accounting from emergy. J. Environ. Account.
Manag, 1, 203–212.
Giannetti, B.F., Dem _ etrio, J.F.C., Bonilla, S.H., Agostinho, F., & Almeida, C. M. (2013). Emergy diagnosis and reflections towards Brazilian sustainable development. Energy Policy, 63, 1002–1012.
Gössling-Reisemann, S. (2007). Combining LCA with thermodynamics. In Information
Technologies in Environmental Engineering. (C. Marx Gomez, J., Sonnenschein, M., Müller, M., Welsch, H., Rautenstrauch, Ed.) (Springer). Heidelberg, Germany.
Hau, J. L., & Bakshi, B. R. (2003). Promise and problems of emergy analysis, 178(2004), 215–225. http://doi.org/10.1016/j.ecolmodel.2003.12.016
Hermann, W. A. (2006). Quantifying global exergy resources. Energy, (31), 1685–1702.
Hischier, R., Weidema, B., Althaus, H.-J., Bauer, C., Doka, G., Dones, R., … Nemecek, T. (2010). Implementation of Life Cycle Impact Assessment Methods Data v2.2 (2010). Ecoinvent
Report No. 3, (3), 176.
Ingwersen, W. W. (2011). Emergy as a Life Cycle Impact Assessment Indicator: A Gold Mining Case Study. Journal of Industrial Ecology, 15(4), 550–567. http://doi.org/10.1111/j.1530-9290.2011.00333.x
ISO, 14040. Environmental management-Life cycle assessment-Principles and framework. International Organisation for Standardisation, Geneva, Switzerland. (1998). Switzerland.
Jamali-Zghal, N., Le Corre, O., & Lacarrière, B. (2014). Mineral resource assessment: Compliance between emergy and exergy respecting Odum’s hierarchy concept. Ecological Modelling, 272, 208–219. http://doi.org/10.1016/j.ecolmodel.2013.09.017
Kharrazi, A., Kraines, S., Hoang, L., & Yarime, M. (2014). Advancing quantification methods of

Chapter 4 235
sustainability: A critical examination emergy, exergy, ecological footprint, and ecological information-based approaches. Ecological Indicators, 37(PART A), 81–89. http://doi.org/10.1016/j.ecolind.2013.10.003
Klöpffer, W., Grah, B. (2014). Life Cycle Assessment (LCA): A Guide to Best Practice. In John Wiley & Sons (Ed.), (p. 480).
Kotas, T. J. (1985). The Exergy Method of Thermal Plant Analysis. Malabar, Florida: Krieger Publishing Company.
Lacarrière, B., Deutz, K. R., Jamali-Zghal, N., & Le Corre, O. (2015). Emergy assessment of the benefits of closed-loop recycling accounting for material losses. Ecological Modelling, 315, 77–87. http://doi.org/10.1016/j.ecolmodel.2015.01.015
Li, G., Kuang, Y., Huang, N., & Chang, X. (2014). Emergy synthesis and regional sustainability assessment: Case study of pan-pearl river delta in China. Sustainability (Switzerland), 6(8), 5203–5230. http://doi.org/10.3390/su6085203
M. Raugei, Rugani, B., Benetto, E., & Ingwersen, W. (2012). Integrating emergy into LCA: Potential added value and lingering obstacles. Ecological Modelling, In Press.
Moldan, B., Janouˇ sková, S., Hák, T. (2012). How to understand and measure environ- mental sustainability: indicators and targets. Ecological Indicators, 17, 4–13.
Nielsen, S.N., Bastianoni, S. (2007). A common framework for emergy and exergy based LCA in accordance with environ theory. Int. J. Ecodyn, 2, 170–185.
Odum, H. . (1996). Environmental Accounting: Emergy and Environmental Decision Making. (J. W. and Sons, Ed.). New York.
Odum, H. . (1998). EMergy evaluation. In: Proc. II Int. W. Shop on advances in energy studies:
energy flows in ecology and economy. , Porto Venere, Italy.
ODUM, H. T. (2001). Environmental Accounting, Emergy and Decision Making. Colorado.
Ojeda, K. (2011). Aplicación de análisis exergético para la evaluación de procesos de producción de bioetanol de segunda generación, 33–45.
Patterson, M. G. (2012). Are all processes equally efficient from an emergy perspective? Ecological Modelling, 226, 77–91. http://doi.org/10.1016/j.ecolmodel.2011.11.016
Patterson, M., McDonald, G., & Hardy, D. (2017). Is there more in common than we think? Convergence of ecological footprinting, emergy analysis, life cycle assessment and other methods of environmental accounting. Ecological Modelling, 362, 19–36. http://doi.org/10.1016/j.ecolmodel.2017.07.022
Petela, R. (1964). Exergy of heat radiation. Journal of Heat Transfer, 86(2), 187–192.
Pizzigallo A.C.I., Granai C., B. S. (2008). The joint use of LCA and emergy evaluation for the analysis of two Italian wine farms. Journal of Environmental Management, 86(2), 396–406.
Redclift, M. (1987). Sustainable Development: Exploring the Contradictions. London, Methuen.

236 Sustainability Assessment of Alluvial and Open Pit Mining Systems in Colombia: Life Cycle Assessment, Exergy Analysis, and Emergy Accounting
SAGOFF.
Reza, B., Sadiq, R., & Hewage, K. (2014). Emergy-based life cycle assessment (Em-LCA) of multi-unit and single-family residential buildings in Canada. International Journal of Sustainable
Built Environment, 3(2), 207–224. http://doi.org/10.1016/j.ijsbe.2014.09.001
Rockstrom, J., Steffen, W., Noone, K., et al. (2009). A safe operating space for humanity. Nature, 461, 472–475.
Rugani, B. (2010). Advances towards a Comprehensive Evaluation of Emergy in Life Cycle
Assessment. Siena, Italy.
Sciubba, E. (2010a). On the Second-Law inconsistency of Emergy Analysis. Energy, 35(9), 3696–3706. http://doi.org/10.1016/j.energy.2010.05.015
Sciubba, E. (2010b). On the Second-Law inconsistency of Emergy Analysis. Energy, 35(9), 3696–3706. http://doi.org/10.1016/j.energy.2010.05.015
Sciubba, E., & Ulgiati, S. (2005). Emergy and exergy analyses: Complementary methods or irreducible ideological options? Energy, 30(10), 1953–1988. http://doi.org/10.1016/j.energy.2004.08.003
Szargut, J.; Morris, D.R.; Steward, F. R. (1988). Exergy Analysis of Thermal, Chemical and
Metallurgical Processes. (Hemisphere, Ed.). New York, NY, USA.
Szargut, J. (2005). Exergy method: Technical and ecological applications. (S. WIT Press, Ed.).
Ulgiati, S., Ascione, M., Bargigli, S., Cherubini, F., Franzese, P. P., Raugei, M., … Zucaro, a. (2011). Material, energy and environmental performance of technological and social systems under a Life Cycle Assessment perspective. Ecological Modelling, 222(1), 176–189. http://doi.org/10.1016/j.ecolmodel.2010.09.005
Valero, A., & Valero, A. (2010). Physical geonomics: Combining the exergy and Hubbert peak analysis for predicting mineral resources depletion. Resources, Conservation and Recycling, 54(12), 1074–1083. http://doi.org/10.1016/j.resconrec.2010.02.010
Wedepohl, K. H. (1995). INGERSON LECTURE The composition of the continental crust. Geochimica et Cosmochimica Acta, 59(7), 1217–1232. http://doi.org/10.1016/0016-7037(95)00038-2
Yu, X., Geng, Y., Dong, H., Ulgiati, S., Liu, Z., Liu, Z., … Sun, L. (2016). Sustainability assessment of one industrial region: A combined method of emergy analysis and IPAT (Human Impact Population Affluence Technology). Energy, 107, 818–830. http://doi.org/10.1016/j.energy.2016.04.092
Zhang, X.H., Pang, M.Y., Wang, C. . (2014). Emergy analysis of a small hydropower plant in southwestern China. Ecol. Indic., 38, 81–88.

5. Life Cycle Assessment, exergy analysis and emergy integration
5.1 Introduction
When environmental decision-making is done through the use of any of the
aforementioned valuation methodologies individually it can deceive policy makers, whose
basis of analysis differs substantially from one another and in turn, as well as they
contribute in an important way to this objective, also present limitations and
methodological biases which leads to incurring non-objective decision making. That is
why it has been proposed that economic, ecological and social systems relate to each
other, so ecological products and services are taken into account for sustaining economic
activity (Bakshi, 2002), and sustainability becomes a prerequisite when designing a
development project (Barrett, J., Scott, 2001).
This integration allows an expanded approach through the development of sustainability
indicators involving different spatial and temporal scales with a divergent basis of
analysis, providing a much more complete picture of the entire process. As it was seen in
previous sections, analysis methodologies have been implemented as a complement
(Exergy Analysis with Life Cycle Assessment, Emergy Accounting with Life Cycle
Assessment, Emergy Accounting with Exergy Analysis). However, they have not been
integrated with each other, which is intended to be developed in the analysis model
proposed in this doctoral thesis.
In this way, the objective of this paper is to propose a sustainability assessment
framework based on emergy accounting, Exergy analysis, and LCA, to obtain a unified

238 Sustainability Assessment of Alluvial and Open Pit Mining Systems in Colombia: Life Cycle Assessment, Exergy Analysis, and Emergy Accounting
performance metric (Integrated Sustainability Index) to assess Triple Bottom Line - TBL over life
cycle of mining system that can be used in other production systems. Some of the main problems
faced by both designers and decision makers are precision and uncertainty in the calculation of
these integrated indexes, this document presents step by step the proposed methodology to
achieve the desired clarity and transparency.
5.2 Background
5.2.1 Sustainability
The word sustainable is a controversial concept because it has been defined in different
ways by many disciplines. However, as of the 1980s, the word is used to refer to an
appropriate management of natural resources, in such a way as to allow future
generations the access to resources, used or not at present, this definition was the
illustration of Brundtland Report (Commission, 1987). In Brutland Report, the idea that a
sustainability analysis interrelating economic development and environment is developed.
Later, at 2005 World Summit on Social Development, objectives of sustainable
development were identified: economic development, social development and
environmental protection, also known as the three pillars of sustainability (United Nations
General Assembly, 2005). Nearly all governments have committed themselves to
sustainable development by integrating economic welfare, environmental quality, and
social coherence (Böhringer, C., Jochem, 2007). The preservation of the natural
environment is a prerequisite for a well-functioning economy and social justice.
In this way, sustainable development, if it is not to be stripped of analytical content,
means something more than the compromise between natural environment and pursuit of
economic growth (Reza, Sadiq, & Hewage, 2014a). It means a definition of development
which recognizes that sustainability limits have a structural origin both (economic) and
natural.
Figure 5-1 summarizes part of chapter 4 of this document, where it was concluded that
emergy accounting evaluates process sustainability from a 'donor-side' perspective, by
assigning values to the environmental efforts and investment of nature to make and
support flows, materials and services; that is, boundaries system is geosphere. Exergy

Chapter 5 239
evaluates sustainability through exergy efficiency under "user-side" evaluation process
(system boundary is technosphere). And Life Cycle Assessment evaluates it based on the
quantification of environmental impact by water, soil and air emissions, caused by the use
and processing of resources to provide such product or service as a "user-side" method.
By integrating these three analysis methodologies under a unified sustainability
assessment methodology, the process will be evaluated holistically as shown in Figure 1.
Emergy Accounting considering Level A + B + C, Exergy Analysis and LCA considering
Level B + C.
Figure 5-1: Sustainability integration evaluation by Emergy Accounting, Exergy Analysis and Life Cycle Assessment. (Modified Reza, Sadiq, & Hewage, 2014b).
In this way, challenges for a productive process to be more sustainable range from the
efficient use of resources, using strategies that lead to their minimization such as circular
economy (de-sterilization of productive system through reuse, recycling / realization of [a ]
closed loop material flow in the whole economic system (Stahel, W., Reday, 1976);
functional substitutes (substitution of resource for a less scarce one that fulfills the same
functionality (Henckens, van Ierland, Driessen, & Worrell, 2016)); and/or promoting the
use of renewable resources to minimize dependence on non-renewable, making the
system more productive (ODUM, 2001). Going through productive process optimization,
by identifying those stages where greatest destroyed exergy is generated, and being able
to make decisions for improvement such as change in technology, reduction of input
resources (using only resources necessary to carry out the process), giving an added

240 Sustainability Assessment of Alluvial and Open Pit Mining Systems in Colombia: Life Cycle Assessment, Exergy Analysis, and Emergy Accounting
value to those streams considered waste/emissions turning them into raw material, thus
having as a response a minimization of waste generated and a maximization of resources
used. Figure 5-2 summarizes what was discussed in this section.
Figure 5-2: Challenges in the productive process to make it more sustainable.
Table 5-1 summarizes the indicators calculated for each analysis methodology (LCA,
Exergy Analysis and Emergy Accounting) for the case study developed in this doctoral
thesis: open-pit and alluvial mining.
Table 5-1: Summary of indicators calculated for each analysis methodology.
Indicators Open-pit
mining Alluvial
mining Unit Expression
LCA5
Agricultural land occupation, ALOP 2,65E + 02 1,81E + 04 m2 a/yr Recipe Mehodology
Climate change, GWP100 1,51E + 04 1,66E + 02 kg CO2 eq/yr Recipe Mehodology
Fossil depletion, FDP 3,94E + 03 4.29E + 01 kg oil eq/yr Recipe Mehodology
Freshwater ecotoxicity, FETPinf
7.39E + 04 1,30E + 01 (kg 1,4-DB eq yr Recipe Mehodology (ReCiPe, 2016)
Freshwater eutrophication, FEP 4.94E + 02 4,20E-02 kg P-eq /m3 Recipe Mehodology (ReCiPe, 2016)
Human toxicity, HTPinf 5,56E + 05 7.63E + 01 kg 1,4-DB eq/yr Recipe Mehodology (ReCiPe, 2016)
5 The definition and formulas of the LCA categories (mid-point, end-point) are detailed in chapter 2.

Chapter 5 241
Marine ecotoxicity, METPinf 2,11E + 04 1,15E + 01 kg N-eq /m 3 Recipe Mehodology (ReCiPe, 2016)
Metal depletion, MDP 8.29E + 04 7.00E + 04 kg Fe-eq Recipe Mehodology (ReCiPe, 2016)
Natural land transformation, NLTP
1.93E + 01 4.64E + 02 m2/yr Recipe Mehodology (ReCiPe, 2016)
Particulate matter formation, PMFP
1,65E + 02 6.91E-01 kg PM10 eq/ yr Recipe Mehodology (ReCiPe, 2016)
Photochemical oxidant formation, POFP
2,18E + 02 7.86E-01 kg NMVOC/yr Recipe Mehodology (ReCiPe, 2016)
Terrestrial acidification, TAP100
2.07E + 02 8,05E-01 (kg SO2 eq /yr Recipe Mehodology (ReCiPe, 2016)
Water depletion, WDP 4.91E + 02 2.82E + 04 m3/yr Recipe Mehodology (ReCiPe, 2016)
Ecosystem quality, HQ 6.02E + 02 2.37, E + 03 Points Recipe Mehodology (ReCiPe, 2016)
Human health, HH 8.98E + 03 9.35, E + 00 Points Recipe Mehodology (ReCiPe, 2016)
Resources, R 4,88E + 02 7.43, E + 00 Points Recipe Mehodology (ReCiPe, 2016)
Total 1.01, E +
04 2.38, E + 03 Points Recipe Mehodology (ReCiPe, 2016)
Exergy
6
Energy Cumulative Demand, CEnD
1,60E + 08 37592438,42 kW ∑ =
Exergy Cumulative Demand,
1,62E + 08 5,20E + 07 kW ∑ =
Output Exergy, OE 2,54E + 06 14438506,4 kW By exergy balance
Destroyed Exergy, 1,59E + 08 37593899,75 kW By exergy balance
Exergy efficiency, β 2% 28% % = −
Energy efficiency, ƞ 0.89 0.61 % Eficiencia de primera ley
Sustainable Index, ExSI 1.02 1,384065142 Dimensional = =
Emerg
y7 Enviromental Loading Ratio, ELR
7.46E + 01 6.07E + 01 Dimensional = +
6The definition and formulas of the exergy indicators are detailed in chapter 3. 7 The definition and formulas of the emerging indicators are detailed in chapter 4 of this document.

242 Sustainability Assessment of Alluvial and Open Pit Mining Systems in Colombia: Life Cycle Assessment, Exergy Analysis, and Emergy Accounting
Emergy Yield Ratio, EYR 1,14E + 00 2,10E + 00 Dimensional 𝑌 = + +
Emergy Sustainable Indices, ESI
0.02 0.03 Dimensional = 𝑌
Emergy Investment Ratio, EIR 7.21E + 00 9,09E-01 Dimensional = +
Renewability Index 1.32 1.62 % = + +
Soil Emergy Cost, SEC 1.09E-01 5,08E-01 % = + +
Emergy Exchange Ratio, EER 1,26E-01 7.86E-01 Dimensional = + + ∗ Product Unit Emergy Value Gold, PUEV
5,95E + 19 3.71E + 20 seJ/ton = 𝑌
Unit Emergy Value Of Economic Output, UEVE
3,984E + 09
4.08E + 09 seJ/USD = 𝑌
Emergy Equivalent Loss, EL 2.63E + 18 3.97E + 12 seJ/yr = 𝑌
Emergy Loss Percentage; ELP 3.04E-02 3,44E-07 % = 𝑌 ×
Ecological services, ES 8.69E + 01 2,76E-02 % 𝐿 = + +
Human labor*, HL 1,20E+18 5,03E+18 seJ/yr
Total emergy, 1,13E + 21 1,13E + 21 seJ/yr 𝑌 = + +
Note: underlined indicators were the ones selected for developing this integration methodology as detailed below. * (Human energy KJ/hr) (Number of employees, dimensionless) (Worked hours hr/yr) (1000 J/KJ)
Depending on how the exchange between natural, economic and social capital is
considered, the sustainability of a system can be weak, medium or strong.
• Weak sustainability, the interaction between human and natural systems occurs
through separate and unlimited compartments (Giannetti, Agostinho, Almeida, &
Huisingh, 2015, Neumayer, 2010), this implies that the depletion of some capital
can be replaced by another. Type of capital e.g. depletion of natural resources can
be replaced by human and social capital.
• Medium sustainability, is an improvement over weak sustainability, but its main
weakness is that it is complex, if not impossible, to identify critical limits for each
capital. Indicators add scores on environmental and social indicators make the

Chapter 5 243
implicit assumption that substitutability between capitals is possible but limited
(Giannetti et al., 2015, Neumayer, 2010). LCA is considered a medium
sustainability methodology (Giannetti et al., 2015).
• Strong sustainability, under the concept of strong sustainability, natural capital
cannot be substituted by human and social capitals (Neumayer, 2010). Indicators
under strong sustainability perspective make implicit that natural capital and built
assets are complements (as opposed to substitutes). Only by maintaining both
stocks intact, long-term economic welfare can be guaranteed. Emergy and exergy
analysis are considered strong sustainability methodologies (Giannetti et al.,
2015).
5.2.2 Definition of elements
Indicators
Estimated indicators "(...) can provide crucial guidance for decision-making in a variety of
ways. They can translate physical and social science knowledge into manageable units of
information which facilitate decision-making process. They can help measuring and
calibrating progress towards Sustainable Development goals. They can provide an early
warning, ringing the alarm in time to prevent economic, social and environmental damage.
They are also important tools to communicate ideas, thoughts and values because as one
authority said, “We measure what we value, and value what we measure.”" (UN, 2001).
Categories and dimensions
Categories can be defined as the aggregation of different indicators under a well-
developed and pre-determined methodology into more general and reduced categories,
depending on the formulation made from a theoretical point of view. Categories are
powerful and communicative tools that can be a significant aid to planners and decision
makers providing robust and reliable information for decision making (Gasparatos, El-
Haram, & Horner, 2008). In turn these categories can be added in a smaller and more
general group called dimensions, fulfilling the same objective.
Integrated index
Finally, dimensions are grouped into a single number or weighted final integrated index
derived from different values of unweighted indicators. The advantage of this integrated

244 Sustainability Assessment of Alluvial and Open Pit Mining Systems in Colombia: Life Cycle Assessment, Exergy Analysis, and Emergy Accounting
indicator is that it summarizes multiple indicators through an easy and simple
interpretation, facilitating results communication to the general public and promoting their
accounting.
Now, this also leads to some criticism, since it falls into a reductionist character, being
able to hide serious flaws in some dimensions and to increase the difficulty to identify
appropriate corrective actions, or promoting simplistic political conclusions. The above
can communicate misleading policy messages if they are poorly constructed or can easily
support a desired policy if the construction is not transparent and lacks of solid statistical
or conceptual principles. Indicators and weights selection could be objective of political
challenge (Gasparatos et al., 2008). Figure 5-3 summarizes by categories the elements
described here.
Figure 5-3: Pyramide methodology.
5.3 Integrated sustainability index methodology based on LCA, Exergy, and Emergy
5.3.1 Aggregation indices into four categories and their contribution to sustainability dimensions
Classic methodologies have contributed a series of indicators that allow to evaluate the
damage or affectation to environmental, social and / or economic dimensions (Triple
Bottom Line); areas that have been established for process sustainability evaluation.
However, these methodological tools (LCA, Emergy Accounting, Exergy Analysis) have
been implemented in isolation, or at best, in a complementary manner, evidencing the
need for a methodological tool that allows their integration to evaluate process
alternatives in a sustainable way that considers indices such as use of resources,

Chapter 5 245
environmental burden, damage to human health, human labor, quality of life, economic
investment, and economic performance. Together with this grouped information of
existing methodologies, it is also possible to quantify the contribution of each factor to
sustainability dimensions in order to offer a unified and useful sustainability index for
those stakeholders exercising some type of control, regulation and / or supervision in
decision making. This sustainability index is also calculated in a discrete manner in each
analysis dimension, with the aim that policy makers can make decisions taking into
account contributions of each dimension to global index, allowing to evaluate
improvement options.
Below, index aggregations derived from Life Cycle Assessment, Exergy Analysis and
Emergy Accounting methodologies in use of resources, environmental burden, damage to
human health, human labor, quality of life, economic investment, and economic
performance categories is justified as shown in Table 5-2 and Figure 5-5. It is noteworthy
that not all indicators calculated for each methodology summarized in the study were
selected for the integration method, since many of them presented a double accounting
among methodologies or within the same methodology as explained below.
5.3.2 Definition of categories
The first question the reader asks is why these categories were selected to be grouped in
environmental, social and economic dimension. In this section, this question will be
addressed by returning to the definition of sustainability as compatibility between
economic and environmental aspect (TBL); environmental protection, economic
prosperity, and social acceptability. It is noteworthy that selection of categories
contributing to each dimension is limited to the indicators generated by each analysis
methodology based on its basis of analysis, the scope of this study is not to take
indicators different from those calculated throughout this doctoral thesis, nor to enter into
detail of limitations or biases presented by each one.
Environmental dimension
In order to materialize the environmental sustainability of a productive process, it is
necessary to make an efficient use of resources and a minimization of waste / emissions

246 Sustainability Assessment of Alluvial and Open Pit Mining Systems in Colombia: Life Cycle Assessment, Exergy Analysis, and Emergy Accounting
generated in the process (Dincer, I. & Rosen, 2007) through different strategies such as
process optimization, use of efficient technologies, efficient use of resources, among
others. Thus, environmental dimension will depend both on efficient use of resources and
on environmental load generated (waste / emissions).
Environmental load 𝑳 For this methodology, environmental load is considered as the environmental impact
caused by emissions and waste released to air, soil and water, due to resources
processing for the production of a good or service (Odum, 1996; ReCiPe, 2016). The
following describes how each analysis methodology considers and contributes to the
environmental load generated.
The damage category shown by LCA contributing to environmental load due to the
generation of waste and emissions is Ecosystem quality. It is important to note that impact
categories such as climate change (GWP), fossil depletion (FDP), freshwater ecotoxicity
(FETP), etc., are not considered directly in this methodological proposal, since they are
grouped in damage to Ecosystem quality, Human health and Resources categories,
which are taken into account, otherwise it would enter into a double accounting of the
impacts shown by LCA. The lower this category of impact, the less environmental stress
the process generates (ReCiPe, 2016).
Out of the indicators calculated by Exergy Analysis, Detroyed Exergy is the one that
represents environmental load generated in the process as detailed in chapter 3 of this
document. This methodology evaluates sustainability from the quantification of usable
energy loss due to inherent irreversibilities of the process and non-use of energy outputs
(waste and emissions) which ends in the environment by destroyed exergy, thus
contributing to environmental burden) (Dincer & Rosen, 2015; Kanoglu, M., Dincer, I.,
Cengel, 2008; Niembro & Gonzalez, 2012). While less destroyed exergy is produced, less
environmental load is generated by the process.
Finally, Emergy Accounting contributes to this category through Environmental Loading
Ratio (ELR), which is the default indicator in this methodology and contributes to
environmental load defined as the relationship between inputs of non-renewable and
imported resources to the use of renewable resources by the system (Odum, 1996,

Chapter 5 247
ODUM, 2001). Generating a greater environmental load due to the high dependence on
non-renewable and imported resources, and not on renewable resources as described in
chapter 3 of this document.
It is worth noting that Emergy Accounting only takes into account traditional methodology
indicators, and not those calculated based on Em-LCA, this is for avoiding double
accounting of impacts by the use of indicators whose basis of calculation is data obtained
from LCA and which were already quantified under the latter methodology indicators;
Emergy equivalent of human health loss (ELHH), Emergy equivalent of loss in support of local
ecological resources, Emergy equivalent of natural loss due to discharge of solid waste on land
(ELSW).
Use of resources, C U
For this methodology, use of resources is defined as the demand for all renewable, non-
renewable, and imported resources required to generate a product or service, in other
words, natural capital.
LCA presents Resources category by default as the accounting for the extraction cost of
mineral resources and energy cost (oil, gas, coal) along the productive chain (ReCiPe,
2016). Renewable resources are not taken into account since this methodology does not
consider the work that nature had to do to provide them, user-side method.
Exergy cumulative Demand represents user-side methods as the total exergy
consumption from nature to provide a given good or service, summing up the exergy of all
resources required. Unlike resources considered in LCA, Exergy Analysis assesses the
quality of energy demand and includes exergy of energy carriers as well as of non-energy
materials (Dincer, I. & Rosen, 2007, Szargut, 2005).
Emergy analysis quantifies the natural capital necessary for generating a product or
service (Kharrazi, Kraines, Hoang, & Yarime, 2014), discretized in renewable, non-
renewable and imported sources by calculating Total Emergy (Y); providing emergy
indexes to assess sustainability from an ecocentric perspective (bridge between
economic and ecological parameters). In this category, ecological services provided by

248 Sustainability Assessment of Alluvial and Open Pit Mining Systems in Colombia: Life Cycle Assessment, Exergy Analysis, and Emergy Accounting
the environment (water and air resource) for the dilution of waterborne / airborne
generated in the process are taken into account in terms of solar joules equivalents. It is
important to remember that although ecological services is an indicator which calculation
base comes from LCA, it is included in this category since damage categories of LCA do
not consider ecological services of dilution, so there is no double impact accounting.
Social dimension
In this doctoral thesis, all that promotes improvement of social conditions throughout the
life cycle of a product is considered as social sustainability, whose ultimate goal is to
achieve human well-being (UNEP / SETAC, 2009). Now the question is, what is human
well-being? Many conceptualizations coexist in this respect, the most common are quality
of life, standards of life, and human development, but the following terms can also be
used: well-being, satisfaction with life, satisfaction of basic human needs, human
development, happiness, and utility (UNEP / SETAC, 2009). For this reason, dimensions
are diverse and cover aspects ranging from knowledge, friendship, self-expression,
affiliation, bodily integrity, health, economic security, human labor, freedom, affection,
wealth, and leisure (Alkire, 2002).
As it can be seen, categories in this dimension can be quite numerous and valid, so their
selection is limited to the indicators generated by the three analysis methodologies
implemented in this study. Only LCA and Emergy Accounting provide indicators within this
social dimension; human health in LCA, and human labor and Unit Emergy Value of
Economic Output (UEVE) in Emergy Accounting as shown below.
It is important to clarify that in this dimension no distinction is made between the
stakeholders for whom indices are calculated under each category of analysis, although
other methodologies such as Social Life cycle Asesment - SLCA can do it.
Damage to human health, CH
This category is represented by the years lost or that a person is disabled due to a
disease caused by emissions and waste generated in the productive chain. This category
only includes damage generated by Life Cycle Assessment in metric units of DALYs
(Disability Adjusted Life Years) (ReCiPe, 2016). For extending information on this
category, refer to chapter 1 of this document.

Chapter 5 249
Human labor, 𝐿 This category is represented by the human capital necessary to carry out the process in
terms of number of people hired per year. Emergy Accounting addresses this indicator in
terms of solar juoles per year (seJ / yr), the calculation of this imported resource is shown
in detail in Appendix A of Chapter 2.
Quality of life (well-being) , 𝐿
It is clear that the GDP (Gross Domestic Product) of a nation as an indicator cannot only
measure overall progress or wellbeing, because it does not take into account factors such
as social equity, natural and human capital (Giannetti et al., 2015). It is necessary to
integrate this economic indicator to those factors through different methodologies as
described in Giannetti et al., 2015 so the assessment of human well-being is made in a
more objective way. Many governments and non-governmental organizations have taken
the initiative and developed their own indices for that purpose; most of them are
composite indexes merging different measures into a single number consisting of GDP
plus social and environmental concerns.
A debatable aspect of emergy synthesis is its approach towards connecting
environmental resources and their economic use (Giannetti et al., 2015). Real wealth
derives from environmental resources while the income required for progress depends on
how much real wealth (measured in emergy) is available. Dividing emergy use by GDP of
an economy, it would be possible to define the real buying power of money in a given
country, and consequently, the optimal income to support progress and wellbeing (Odum,
1996). This indicator is Unit Emergy Value of Economic Output, UEVE. It relates
renewable, non-renewable and imported resources to carry out the process in solar joules
equivalents and GDP (Gross Domestic Product), which measures the economic growth
through production and final demand for goods and services of a country or region during
a given period, thus assessing the quality of life of its inhabitants. The higher this indicator
is, comparing two processes / alternatives, the less sustainable the system in
socioeconomic terms; since this means more resources would be used to generate the
same amount of money, thus providing a social welfare.
Economic Dimension

250 Sustainability Assessment of Alluvial and Open Pit Mining Systems in Colombia: Life Cycle Assessment, Exergy Analysis, and Emergy Accounting
Since economy is an open system that dissipates energy and materials for standing or
growing, its sustainability depends on the availability of energy and materials it consumes
(Lomas & Martín-lópez, 2005).
For this method, economic sustainability is understood as the process capable of self-
sustaining economically, which in turn generates economic profitability, quantifying the
economic capital necessary to carry it out. That is, an economically sustainable process is
the one whose production costs are less than its profitability; said profitability depends on
the sale price of product, that can vary depending on economy dynamism of the region
where the project is being executed (UNEP / SETAC, 2009). Sale price of product must
support not only the economic investment the process entails, but also mitigation and
compensation of environmental and social impacts.
In this dimension it is very important to consider the type of resources consumed. If
society generates structures requiring large flows of energy from natural resources and
large fossil energy storage, and concentrations of these resources are consumed and
exhausted, then society must dispense with these structures or face a forced decline
(Odum, 2001). In this way, sustainability or unsustainability of modern societies will be
given as they depend on non-renewable natural resource consuming structures.
Sustainability pattern in general terms, will be given by those societies operating under a
consumption of renewable energies and materials.
In other words, the sustainability of a society or a project depends mainly on the types of
resources or energies intervening in them; being sustainable their dependence on
renewable resources and not on non-renewable.
It is noteworthy that economic dimension is only addressed from producers side. The
categories that contribute to this dimension are investment and economic performance,
these categories are the result of calculating emergy indicators, since it is the only
methodology that contemplates this dimension.
Economic inversión,
This indicator shows the dependence of productive process on resources that have to be
purchased and on free resources found in nature (renewable and non-renewable) and
which only cost is extraction. Being more sustainable those processes with a low

Chapter 5 251
dependence on these imported resources. Product generated from a process with a high
dependence on imported resources must have a high value in the market, which
internalizes the low contribution of renewable natural capital in process economy.
Economic performance, 𝑌 This indicator evaluates what economic return is with respect to the economic capital
invested, showing economic benefit for producers versus consumers. Relational total
inverted emergy with respect to product's sale price and emergy money ratio (Known as
emergy-money or emergy exchange, is the amount that can be purchased in one country
with a unit of money (one dollar) in a specific year). Obtaining greater economic
performance when less total emergy is invested. This indicator can be extended in
chapter 3.
Figure 5-4 summarizes what is addressed in this document. Sustainable trilemma (Triple
Bottom Line (TBL)) is defined as the criteria of sustainability assessment that include
environmental protection, economic prosperity, and social acceptability. Each dimension
is approached from different categories, each analysis methodology contributing to said
indicators; the three methodologies contribute to environmental dimension (enviromental
load and use resources) overlapping each other, LCA and Emergy Accounting are
superimposed, giving rise to social dimension categories (damage to human health,
human labor, quality of life) and, finally only Emergy Accounting contributes to economic
dimension categories (economic investment, economic performance).
Therefore, in the formulation of public policies for regulation and control of any productive
process, social, environmental and economic aspects can not be considered in isolation;
but in an integrated and related way in order to really value the sustainability of some
projects, avoiding decisions and formulating biased and subjective regulations; or
otherwise short-term policies that address immediate solutions, contributing to social,
economic and environmental problems in the long term.

252 Sustainability Assessment of Alluvial and Open Pit Mining Systems in Colombia: Life Cycle Assessment, Exergy Analysis, and Emergy Accounting
Figure 5-4: Sustainable trilemma LCA, Emergy and Exergy.

Table 5-2: Aggregation methodology indicators in categories and dimension of analysis.
Indicator Methodology
of origin Description Category Dimension
SU
ST
AIN
AB
ILIT
Y
Ecosystem quality, Eq LCA 𝒒: Damage to ecosystem (soil, air, water)
Environmental load 𝐿
Environment
Destroyed Exergy, DE Exergy : Environmental load generated by emissions and waste released in imbalance with their reference environment
Enviromental Loading Ratio,
ELR
Emergy 𝑳 : Relationship between inputs of non-renewable and
imported resources to the use of renewable resources by the
system
Resources, R LCA : Extraction cost and energy cost
Use of resources
Exergy Cumulative Demand Exergy 𝒙: Total energy and non-energy resources
Total emergy, Y Emergy 𝒎: Renewable, non-renewable and total imported resources
Ecological services Emergy : Water / air needed for dilution of pollutants
released
Human health, HH LCA : Increase in respiratory disease, various types of
cancer, malnutrition, diseases.
Damage to human health
Social Human labor Emergy 𝑳: Human energy in solar joules equivalents
Human labor 𝐿
Unit Emergy Value Of
Economic Output, UEVE Emergy
: Total invested resources with respect to national GDP
Quality of life 𝐿
Emergy Yield Ratio, EYR Emergy 𝒀 : How many times are resources imported with
respect to resources invested in solar joules equivalent..
Economic inversion
Economic
Emergy Exchange Ratio, EER Emergy : Provides a measure of who won during trading
between consumers and producers
Economic performance 𝑌

254 Sustainability Assessment of Alluvial and Open Pit Mining Systems in Colombia: Life Cycle Assessment, Exergy Analysis, and Emergy Accounting
Figure 5-5: Structural model of sustainable development for the proposed methodology.

Chapter 5 255
5.3.3 Mathematical description of the methodology
Seven categories were proposed, each of them is calculated based on indices coming
from LCA, Exergy and Emergy methodologies 𝐿 = + + 𝐿 𝐿 = + + + =
𝐿 = 𝐿 𝐿
𝐿 = = 𝑌 𝑌
𝑌 =
In previous expressions each index has its own units, different according to its nature; to
be able to group them it is necessary to normalize using a reference value. In this case,
the reference value for the series is the best value of the series, thus the constant is
defined.
with = , , , , , , , , , , 𝑌 , .
= ( , ) = {min( , )… = , , , , , , , , ,max … = , 𝑌 }
, , = [ , … , ] =
5.3.4 Category characteristics
Indexes derived from LCA, EXERGY and EMERGY methodologies can be interpreted as
Max and Min depending on how they affect sustainability:
● Max: corresponds to an index that positively affects sustainability when it is
greater.
● Min: corresponds to an index that positively affects sustainability when it is lower.

256 Sustainability Assessment of Alluvial and Open Pit Mining Systems in Colombia: Life Cycle Assessment, Exergy Analysis, and Emergy Accounting
Categories are proportional additions of carefully selected indexes with the same
interpretation of Max or Min to avoid ambiguities. Thus the characteristic of each category
is the common factor of interpretations of indices that constitute it. Characteristics for
each indicator are presented in the table.
5.3.5 Reference value of the category
Each category, used to compare several process or technology options, requires a
reference value as a measurement scale. For this, it is assumed that if only one option is
analyzed with this methodology, it will be the best one. In this case the product of the
factor in each category, what gives us the reference value for each category is equal to
the number of indicators that contribute to that category. Reference values for each
category are presented in Table 5-3.
Table 5-3: Reference value for each category.
Category Reference
value Best value
Environmental load 3 min
Use of resources 4 min
Damage to human health 1 min
Human labor 1 max
Quality of life 1 min
Economic inversion 1 max
Economic profit 1 min
5.3.6 Analysis of results by category
Case 1: category with minimum characteristic
A category with Min characteristic, as it is the case of environmental load, use of
resources, damage to human health, quality of life and economic profit. In the best case it
will take a value equal to the reference (number of indicators that contribute to that
category), and in the worst case it will be much higher than the reference value, this is

Chapter 5 257
because the best option of indices it contributes to each category will always be the
lowest of indexes among comparison options.
Case 2: category with maximum characteristic
A category with Max characteristic, as is the case of human labor and economic
investment. In the best case it will take a value equal to the reference (number of
indicators that contribute to that category), and in the worst case it will be close to zero,
this is because the best option of indexes it contributes to each category will always be
the largest index among comparison options.
5.3.7 Normalization with reference and redirection of categories
Since categories can have Max or Min characteristics according to their indicators, for
aggregation them in sustainability dimensions it is necessary to normalize them and
eliminate differences in analysis directions (Max or Min), to do so the following procedure
was followed:
Case 1: category with minimum characteristic
A category with Min characteristic such as the case of environmental load, use of
resources, damage to human health, quality of life, and economic profit. It is normalized
and redirected (0 as minimum value and 1 as maximum value), determining the
relationship between the reference value of , category and value of category for
each option , = , /
Case 2: category with maximum characteristic
A category with a max characteristic such as the case of human labor and economic
investment. It is normalized and redirected (0 as minimum value and 1 as maximum
value), determining the relationship between the value of category and the reference
value of , category
, = / ,

258 Sustainability Assessment of Alluvial and Open Pit Mining Systems in Colombia: Life Cycle Assessment, Exergy Analysis, and Emergy Accounting
5.3.8 Aggregation categories into sustainability dimensions
As previously explained, categories are grouped into three dimensions: environmental,
social and economic, previously defined.
Environmental dimension
In the proposed methodology, the environmental dimension is defined as the equal
percentage contribution of standardized categories of resource use and environmental
burden = 𝐿, + ,
Social dimension
In the proposed methodology, social dimension is defined as the equal percentage
contribution of normalized categories of human labor, damage to human health and
quality of life. = , + 𝐿, + 𝐿 ,
Economic dimension
In the proposed methodology, economic dimension is defined as the equal percentage
contribution of standardized categories of economic investment and economic profit. = , + 𝑌,
5.3.9 Reference value of dimensions.
Each dimension is the equal percentage contribution of several standardized categories.
The maximum value that each dimension can take is equal to the number of categories
that constitute it, since they can take the unit as maximum value.
Figure 5-6: Reference value of each dimension.
Dimension Reference
Dimension
Environment 2
Social 3
Economic 2

Chapter 5 259
5.3.10 Normalization of dimensions using reference value
Dimensions are normalized using reference values. = / ,
5.3.11 Sustainability index by Aggregation dimensions.
Average sustainability index.
The average sustainability index was calculated as the contribution of the three
dimensions
= + +
Average sustainability index compares two processes using indicators from LCA,
Exergy and Emergy metodologies; however, this indicator does not take into account
changes in Environmental, Social and Economic baseline of the place where the project
was established. To account for these influences, two alternatives to Average
Sustainability Index are presented: the first is to use weighting factors for each
dimension; and the second is to include a category that quantifies the modifications to
environmental, social and economic baseline in the calculation of each dimension, due to
the presence of the process Average Adjusted Sustainability Index.
Weighted average sustainability index.
Weighted average sustainability index was calculated using the weights for each
dimension , , = + +
Weighting factors correspond to the importance of each dimension, these importance
factors must be a consensus of all stakeholders. Example: requirements of external
regulatory bodies, influence on affected community, internal policies of a company,
among others.
Average Adjusted sustainability index.

260 Sustainability Assessment of Alluvial and Open Pit Mining Systems in Colombia: Life Cycle Assessment, Exergy Analysis, and Emergy Accounting
Average Adjusted Sustainability Index was calculated adding one new category in each
dimension (Environmental Changes in Line Base 𝐿 , Social changes in line base 𝐿 , and Economic changes in line base 𝐿 ). , = 𝐿, + , + 𝐿
, = , + 𝐿, + 𝐿 , + 𝐿
, = , + 𝑌, + 𝐿
To normalized dimension is defined as: = / ,
( , = , , = , , = ) and Average Adjusted
sustainability index as
= ( , + , + , ) To determine values between 0 and 1 of new categories that reflect the environmental,
social and economic change of the environment with respect to a baseline, it is necessary
to have a working group constituted by an interdisciplinary group of experts; researchers,
academics, government, environmental authorities; as well as representatives of the
community and the company that can objectively assess changes in baseline generated
by the incursion of the project; a null modification with values equal to zero, and the
highest modification of the environment with values equal to 1. Estimating these values is
not within the scope of this study, but it is necessary to take it into account.
5.4 Results
The proposed integration methodology is implemented for the two mining processes as a
case study; open-pit and alluvial mining as follows:
● The proposed Average Integrated Sustainability Index is calculated to compare
the sustainability of two processes; this implies that each dimension contributes in
an equal percentage, this index is not affected by weightings of environmental,
social and economic dimensions because it is designed to make comparisons of
technologies or processes in the same frame of reference.

Chapter 5 261
● It evaluates indices that take into account conditions external to the analysis
process (change in environmental modifications in environmental, economic and
social terms with respect to a baseline). Specifically, a Monte Carlo analysis was
carried out to study how variations in weighting factors affect the case of weighted
average sustainability index and, in the case of A verage Adjusted sustainability
index how it is affected when each change category in the baseline take random
values between zero and one.
First and second approximation are addressed by case 1 and case 2 respectively as
shown below.
5.4.1 Case 1: Open-pit Vs Alluvial mining
As in this first case the aim is to compare two different mining systems, we proceed to
develop the proposed integration methodology step by step until the calculation of
Weighted Average Sustainability Index. Results are discretized by indices, categories and
dimensions up to integrated sustainability index.
Index from each methodology
The first column from Table 5-4 presents the name of each selected index of the
impemented analysis methodologies; LCA, Exergy and Emergy Analysis.Second and
third columns present values of each index whose interpretation is described below. The
fourth column from Table 5-4 shows the reference value used to normalize the indices
described. Reference value is the inverse of the best index value of the two compared
processes. Followed by fifth column which indicates the way how it contributes to
environmental, social and economic sustainability of the process; that is, the process is
more sustainable at minimum or maximum values of each calculated index. Sixth and
seventh columns are values of the normalized indices for each productive system to be
compared (multiplication of the values of indices with by reference value).
As shown in Table 5-4, for the three indicators contributing to environmental load
category, alluvial mining presents lower values with respect to open-pit mining in the
Destroyed Exergy and Environmental Loading Ratio indices, except for Ecosystem

262 Sustainability Assessment of Alluvial and Open Pit Mining Systems in Colombia: Life Cycle Assessment, Exergy Analysis, and Emergy Accounting
Quality. This means that, alluvial process causes greater damage to the quality of
ecosystem (due to the intensive use of water and large tracts of land extracted) by
presenting higher values for this indicator. However, more exergy is destroyed in open-pit
mining; exergy contained in waste / emissions contains energy available that, since it is
not in equilibrium with the environment, generally has the potential to damage it,
generating significant environmental burdens. The lower the values of these three indices,
the more sustainable the process is in environmental terms; these results can be
extended in the previous chapters of this doctoral thesis.
Table 5-4: Summary of indicators from LCA, Exergy and Emergy Analysis for open-pit and alluvial mining.
Index name Index Normalized index
Open-pit
mining
Alluvial
mining
Reference
value
Best
value
Open-pit
mining
Alluvial
mining
Ecosystem Quality, 𝒒 [points] 6,018,E+02 2,366,E+03 1,66E-03 min 1,000 3,932
Destroyed Exergy, [kW] 1,594,E+08 3,759,E+07 2,66E-08 min 4,241 1,000
Enviromental Loading Ratio 𝑳 , [Dimensionaless]
7,463,E+01 6,067,E+01 1,65E-02 min 1,230 1,000
Resources, [points] 4,878,E+02 7,430,E+00 1,35E-01 min 65,648 1,000
Exergy Cumulative Demand, 𝒙 [kW] 1,620,E+08 5,203,E+07 1,92E-08 min 3,113 1,000
Total emergy, 𝒎 [seJ/yr] 1,125,E+21 1,130,E+21 8,89E-22 min 1,000 1,004
Ecological services , [%] 86,92 0,03 3,33E+01 min 2897,204 1,000
Human health, [points] 8,982,E+03 9,345,E+00 1,07E-01 min 961,192 1,000
Human labor, 𝑳 [seJ/yr] 1,200,E+18 5,030,E+18 1,99E-19 max 0,239 1,000
Unit Emergy Value Of Economic Output,
[seJ/USD] 3,984E+09 4,079,E+09 2,49E-10 min 1,000 1,024
Emergy Yield Ratio, 𝒀 [Dimensionaless] 1,140,E+00 2,150,E+00 4,65E-01 min 0,530 1,000
Emergy Exchange Ratio, [Dimensionaless]
1,257,E-01 7,856,E-01 7,95E+00 min 1,000 6,247
The resource use category, is given by Resources, Exergy Cumulative Demand and Total
Emergy indices, required to carry out both mining processes, the lower these indices the
more sustainable the process is environmentally. As can be seen in Table 5, open-pit
mining makes greater use of resources compared to alluvial mining. However, the total
demand of emergy (consumption of renewable, non-renewable and imported resources)
is slightly lower for open-pit, but in this process a more intensive use of imported
resources is made with 88% in relation to local resources, which makes the process more
environmentally untenable; while in alluvial mining this ratio is 47%.
Given that greater emissions to the air and water are generated in open-pit mining, nature

Chapter 5 263
has to make a greater effort to dilute these pollutants to the levels required by the national
regulation, for this reason ecological services for this mining system are higher compared
to alluvial mining as presented in Table 5-4. The lower these values are, the better the
behavior of the system in environmental terms.
Due mainly to the particulate material emitted in open-pit process, Human Health index is
much higher for this process with respect to alluvial mining, generating greater health
conditions. The lower this indicator is, the more sustainable the process is socially (Table
5-4).
Human Labor index does not present a very significant difference between both
processes, being better for alluvial mining where there is more employment generation to
carry out the productive process. The higher this index the more sustainable the process
is socially.
Unit Emergy Value Of Economic Output contributes positively to social sustainability of
the process when it is lower, being a bit better for open-pit process. It can be said that
both systems obtained good economic efficiency (EER), where the consumption of
resources is reasonable in relation to economic productivity, presenting an efficient use
(fair amount) without generating cost overruns for useless losses (the amount of
resources used is enough, there is not an oversize) contributing to social welfare of the
population. This behavior is due to the fact that open-pit mining consumes less renewable
resources, non-renewable resources are imported; the difference with the mining process
to be compared with is not very significant.
Finally, higher Emergy Yield Ratio and lower Emergy Exchange Ratio values contribute to
making the system more sustainable economically. Open-pit presents better results for
EER; greater economic benefit of producers with respect to consumers, because in this
productive system they invest almost the same amount of resources to obtain more
quantity of gold (approximately 19 tons of gold) in relation to alluvial mining (3 tons of
gold) approximately). While EYR shows a high dependence of both processes on
imported resources and not on local, alluvial mining system is better due to the explained
above.

264 Sustainability Assessment of Alluvial and Open Pit Mining Systems in Colombia: Life Cycle Assessment, Exergy Analysis, and Emergy Accounting
● Categories
The aggregation of indices in each category of analysis is made for the reasons described
in the methodology, as shown in Table 5-5.Table 5-5 is composed as follows: the first
column is the name of each category indices are grouped into, column two indicates how
each category contributes to environmental, social and economic sustainability of the
process; that is, the process is more sustainable at minimum or maximum values of each
of the calculated categories. Third column indicates the reference value for each category
(it is equal to the number of indicators contributing to that category); this reference value
is used for the normalization of categories, in order to eliminate differences in directions of
analysis (Max or Min) as explained in methodology. Columns 4 and 5, values of each
category, followed by columns 6 and 7 where values of the standardized categories are
presented (ratio of category value with respect to category reference value if the best
value of the indicator is a maximum or, ratio of reference value with respect to the
category value if the best value of the indicator is a minimum).
Redirecting the maximum and minimum through normalization, it is observed that when
values of each normalized category are higher, the process is more sustainable. Alluvial
mining presents better values in all categories except quality of life and economic profit.
In open-pit mining, 65% of the environmental load comes from exergy destroyed in the
process, while in alluvial mining the quality of ecosystem is the one that contributes most
to this category with 66%. Better results were obtained for alluvial than for open-pit mining
with values equal to 0.464 and 0.506 respectively.
The index that contributes most to the use of resources in open-pit mining is ecological
services for the dilution of pollutants (airborne / waterborne) with 98%. In alluvial mining
this contribution is fairly distributed, with an average contribution of 25% for each index.
Alluvial mining presents better results for this category with a value equal to 0.999 in
relation to the value presented for open-pit mining 0.001.
Damage to human health, human labor and quality of life categories by default are only
influenced by a single indicator as it was addressed in methodology. The first two
indicators are better for alluvial mining than for open-pit mining due to the reasons stated

Chapter 5 265
throughout the document. Open pit process is slightly better in quality of life with respect
to the comparison process.
In the same way, investment and economic profit categories are only influenced by
default by their respective index. Presenting greater economic profit in open-pit process
despite requiring greater economic investment compared to alluvial mining.
Table 5-5: Impact categories for open-pit and alluvial mining.
Category Normalized Category
Category name* Best value Category reference
value
Open-pit mining
Alluvial mining
Open-pit mining
Alluvial mining
Carga ambiental min 3 6,471 5,932 0,464 0,506
Uso de recursos min 4 2966,965 4,004 0,001 0,999
Daño a la salud humana min 1 961,192 1,000 0,001 1,000
Labor humana max 1 0,239 1,000 0,239 1,000
Calidad de vida min 1 1,000 1,024 1,000 0,977
Inversión económica max 1 0,530 1,000 0,530 1,000
Ganancia económica min 1 1,000 6,247 1,000 0,160
*[Dimensionless]
Dimensions
Finally, categories are grouped in each dimension of sustainability (environment, social
and economic) with equal percentage values for each. Environmental load and use of
resources to the environmental dimension; damage to human health, human labor and
quality of life to the social dimension; investment and economic gain to the economic
dimension.
Table 5-6 is distributed as follows; first column indicates the name of the dimension,
followed by values of the dimensions for each process to be compared (column 2 and 3);
The higher the values of each dimension, the more sustainable the process. Column 4
presents the dimension reference value (maximum value that each dimension can take, is
equal to the number of categories that constitute it). Columns 5 and 6 represent the
normalized value for each dimension from 0 to 100, with zero being the worst value and
100 being the best value.
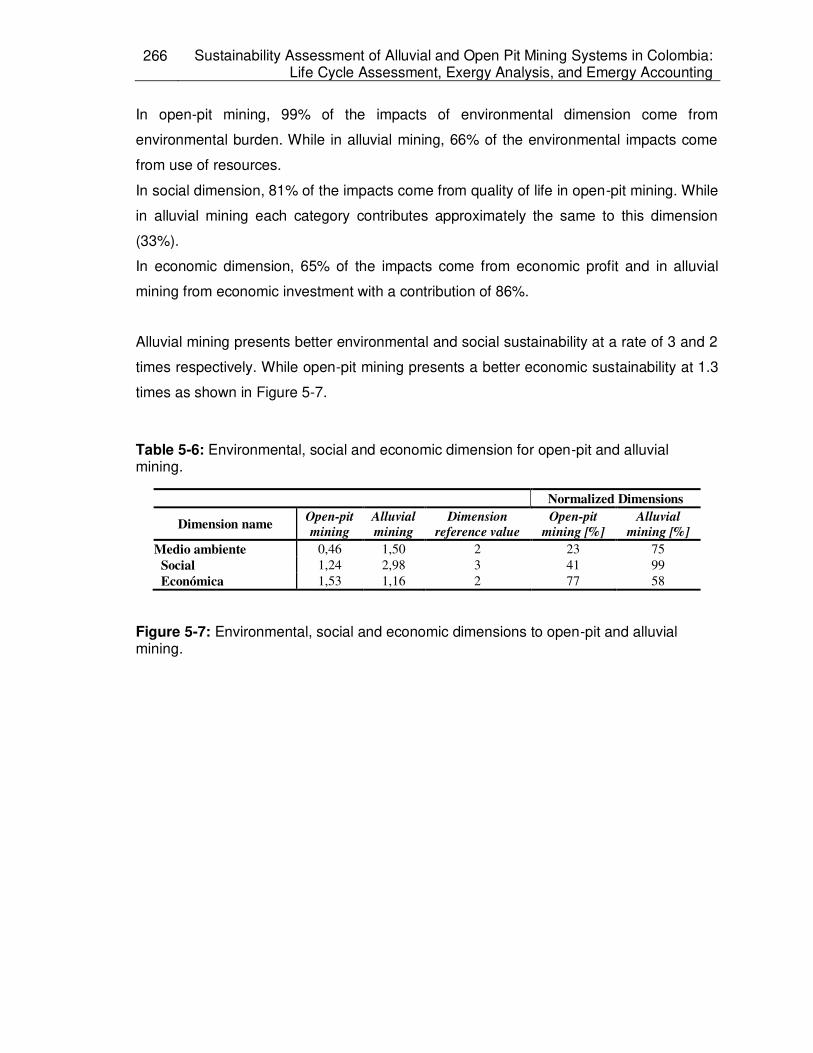
266 Sustainability Assessment of Alluvial and Open Pit Mining Systems in Colombia: Life Cycle Assessment, Exergy Analysis, and Emergy Accounting
In open-pit mining, 99% of the impacts of environmental dimension come from
environmental burden. While in alluvial mining, 66% of the environmental impacts come
from use of resources.
In social dimension, 81% of the impacts come from quality of life in open-pit mining. While
in alluvial mining each category contributes approximately the same to this dimension
(33%).
In economic dimension, 65% of the impacts come from economic profit and in alluvial
mining from economic investment with a contribution of 86%.
Alluvial mining presents better environmental and social sustainability at a rate of 3 and 2
times respectively. While open-pit mining presents a better economic sustainability at 1.3
times as shown in Figure 5-7.
Table 5-6: Environmental, social and economic dimension for open-pit and alluvial mining.
Normalized Dimensions
Dimension name Open-pit
mining
Alluvial
mining
Dimension
reference value
Open-pit
mining [%]
Alluvial
mining [%]
Medio ambiente 0,46 1,50 2 23 75
Social 1,24 2,98 3 41 99
Económica 1,53 1,16 2 77 58
Figure 5-7: Environmental, social and economic dimensions to open-pit and alluvial mining.

Chapter 5 267
Spider diagram (Figure 5-8) shows the indicators selected for this integration method.
Alluvial mining presents better values for all the evaluated indices, except for ecosystem
quality and Emergy Yield Ratio.
Figure 5-8: Spider diagram to open-pit and alluvial mining process to all selected indicators.
0%
20%
40%
60%
80%
100%Environmental
SocialEconomic
Open-pit mining Alluvial mining

268 Sustainability Assessment of Alluvial and Open Pit Mining Systems in Colombia: Life Cycle Assessment, Exergy Analysis, and Emergy Accounting
Integrated Average Sustainability Index
The trade-offs between the three dimensions of sustainability need to be addressed with
utmost care in order to keep a sustainable balance. For this first case, where two different
productive systems are compared, it is not necessary to give a weight to each dimension,
so the integrated sustainability index is calculated as the average of the three dimensions.
As shown in Figure 5-9, alluvial mining presents better sustainability compared to open-pit
mining with values equal to 0.774742 and 0.470265 respectively, given that alluvial
process presents a better environmental and social sustainability for the reasons
discussed throughout this doctoral thesis.
Figure 5-9: Sustainable exergy/emergy/integrated index to open-pit and alluvial mining.
0,000
0,000
0,000
0,001
0,010Ecosystem quality, HQ
Destroyed Exergy [kW]
Enviromental Loading
Ratio, ELR
Resources, R [*100]
Exergy Cumulative
Demand
Total emergy, Y [*1000]
Ecological services
Human health,
HH[*1000]
Human labor
Unit Emergy Value Of
Economic Output,
UEVE
Emergy Yield Ratio,
EYR
Emergy Exchange Ratio,
EER
Open-pit mining
Alluvial miningEnviromentSocialEconomic

Chapter 5 269
5.4.1 Case 2: sensitivity for Weighted Average Sustainability Index (WASI) and Average Adjusted Sustainability Index (AASI) applied to open-pit and alluvial mining.
While it is not recommend to do weight the three sustainability dimensions into a single-
score, the following schemes still allow to do that in a transparent rather than an implicit
way (Finkbeiner, Schau, Lehmann, & Traverso, 2010), if the decision-makers decide to
apply quantitative weighting can follow the procedure described in the methodology for
calculation of WASI and AASI .
To carry out the analysis of Weighted Average Sustainability Index (WASI) under the
scenario of uncertainty in weighting factors, a Monte Carlo analysis was carried out with
5000 simulations. Weight values for each dimension P vir ta , P cia , P c ic were
randomly distributed with uniform probability fulfilling the balance that the sum of the three
factors is equal to one. Results of the simulation are presented in Figure 5-10, where
histograms of the simulations performed and adjustment to log-normal distributions are
presented.
Figure 5-10: WASI index montecarlo and lognormal fit resume for Open-pit and Alluvial mining.
0.00 0.20 0.40 0.60 0.80 1.00 1.20 1.40 1.60
Exergy Sustainable Index (ExSI)
Emergy Sustainable Index (EmSI*10)
Integrated Sustainable Index (ISI)
Alluvial mining Open-Pit mining

270 Sustainability Assessment of Alluvial and Open Pit Mining Systems in Colombia: Life Cycle Assessment, Exergy Analysis, and Emergy Accounting
Parameters of each distribution are summarized in Table 5-7, it can be seen that the
value of the distribution mean for the case of open-pit mining is greater than the average
sustainability index without weights, contrary to this behavior occurs with the case of
indicators for alluvial mining. It can be seen that the use of weighting factors increases the
average value of weighted sustainability indicators with low values but punish the
indicator that has shown a better ASI.
In the case of analysis of Average Adjusted Sustainability Index (AASI), Environmental
Changes in Base Line Line 𝐿 , Social changes in Base Line Line 𝐿 and
Economic changes in Base Line 𝐿 categories are randomly distributed evenly
between zero and one, and dimensions and sustainability index were calculated. Results
of the simulations are shown in Figure 5-11 where adjustment to normal functions is also
presented.
Figure 5-11: AASI index montecarlo and lognormal fit resume for Open-pit and Alluvial mining.

Chapter 5 271
For this case of analysis, the index for open-pit mining with respect to the average value
without weights was increased, and the indicator for alluvial mining was reduced. This
means that the use of categories to represent a change in baseline of the three
dimensions studied punished the best option and improved the index for the worst
option.As the value taken by these categories correspond to a consensus, it can be
subject to personal subjectivities or interests, however the use of this methodology to
calculate an index that includes externalities has been shown to be flexible to the values
these categories take, in this in particular, distributions adjusted for AASI Open Pit and
AASI Alluvial are equalized by an AASI value = 0.589, the probability that AASI Open pit
takes that value is 1.43%, and for AASI Alluvial it is 1.58% with a confidence (confidence
bounds) of 95%. However for the case WASI Open Pit and WASI Alluvial they are
equalized by a value of WASI = 0.632, and the probability that WASI Open pit takes that
value is 10.71%, and for WASI Alluvial it is 4.49% with a confidence (confidence bounds)
of 95%. This means that the probability of WASI Open Pit indicator is equal to or greater
than WASI Alluvial indicator is 10 times greater than the probability that AASI Open Pit is
equal to or greater than AASI Alluvial indicator; in this way, whatever the value categories
take, there is a very low probability of modifying the comparative evaluation of two
processes by reducing the subjectivity associated with the assignment of values to
quantify process externalities.

272 Sustainability Assessment of Alluvial and Open Pit Mining Systems in Colombia: Life Cycle Assessment, Exergy Analysis, and Emergy Accounting
Table 5-7: Summary of statistics for SI, AASI and WASI indices.
Integrated Average Sustainability Index
AASI (normal distribution)
WASI (LOGnormal distribution)
Process SI Mean Variance Mean Variance Open Pit 0.470265 0.477676 0.002586 0.500759 0.01067
Alluvial 0.774742 0.698687 0.002604 0.752913 0.005728
Two of the three proposed methodologies ( AASI and WASI ), both carry a degree of
subjectivity for the weighting factors and for the values allocated to the categories of
changes in base line ; however, the nature of weighting punishes the rigorous analysis of
categories constructed with the analysis of LCA, emergy and exergy indicators, in this
way, on the other hand the index of adjusted average, requires the relation of three
categories and values agreed upon by a multidisciplinary work table in order to have a
representative value. Statistically, as can be seen in Table 5-7, which summarizes
statistical data for the compared indices, AASI index has a lower variance in the face of
changes in subjective categories, this gives an idea that the indicator is not as sensitive to
changes in the value of the category and that will allow the subjective value to play a
smaller role in the decision making.
5.5 Final Comments
It should be noted that, in general, in integration methodologies, weighting scoring
systems are often based on expert judgment and can sometimes be extremely biased
(Klöpffer, W., Grah, 2014). Moreover, weighting aggregation techniques usually ignore the
fundamental essence and usefulness of different indicators that contribute to each
category or dimension, which grouped together generate a single index of integrated
sustainability. For this reason, in this study, to the calculate of Integrated Average
Sustainability Index weights or values of importance were taken to the indicators, neither
to categories nor to dimensions in order to minimize this bias.
For implementing this proposed integration methodology, either in mining or in another
economic sector, it is necessary to start calculating indicators from emergy, exergy and
LCA. That is, without calculating the appropriate indices it is not possible to continue with
the implementation of the proposed methodology. If exergy had been taken as a function

Chapter 5 273
of emergy, this complementary integration analysis could not have been done, since it
would incur a double accounting of impacts or benefits if it is the case.
Given the limitations of the scope of this doctoral thesis, validation of the model with
another productive system was not carried out, so it is recommended to apply this
methodology in an alternative productive system. This implementation is expected to be
carried out on the study made by Cano et al., 2017, where emergy analysis was
implemented to evaluate the use of biosolids generated in a wastewater treatment plant
for electrical generation and as fertilizer in silvopastoral soils (Cano Londoño, Suárez,
Velásquez, & Ruiz-Mercado, 2017); exergy indexes were calculated to these same
productive systems in Cano, Céspedes, & Gallego, submitted, so it is only necessary to
calculate damage categories by LCA and thus validate the proposed methodology.
When aggregation the indicators generated by each analysis methodology (LCA, exergy
and emergy) into categories, and from categories to dimensions, the possibility of
assigning weights to each of these indicators / categories is left open. This weighting must
be subject to a rigorous consensus among all stakeholders intervening in the supply chain
(community, company, workers, state, among the most representative). Figure 5-12
shows step by step the implementation of this proposed integration methodology for the
assessment of sustainability in development projects.
Variations of these indices (WASI, AASI) correspond to the weight given to each
category, in this methodology, externalities to the process not captured by LCA
methodologies, Exergy and Emergy are estimated by the appearance of a category that
quantifies the impact to the baseline analysis; that is, how much on a scale of zero to one
has the project impacted on its surroundings in three dimensions: Environmental, Social
and Economic.Surely these categories should be included in environmental regulation by
external entities or by internal policies of an organization.
Figure 5-12: Sustainability assessment framework.

274 Sustainability Assessment of Alluvial and Open Pit Mining Systems in Colombia: Life Cycle Assessment, Exergy Analysis, and Emergy Accounting
5.6 Conclusiones
It can be seen how Emergy Accounting is an analytical methodology that develops a
circle between economy and ecological systems (Hau & Bakshi, 2004), allowing to
evaluate the contribution of environmental, economic and social factors in the estimation
of value of an unbiased integrated sustainability index. While LCA is an analysis
methodology that only contributes to environmental and social factors, and Exergy
Analysis to environmental factors, speaking in TBL terms.

Chapter 5 275
Through complementarity and integration of the three analysis methodologies under a
common framework, an adequate evaluation of the study system was achieved;
environmental, economic and social support provided by the biosphere and geobiosphere
necessary for the generation of the product.
The reductionism performed when presenting a single index of integrated sustainability,
has been one of the main criticisms presented by the methodologies that evaluate
sustainability. However, as discussed in this document, there are advantages, being the
main one the holistic approach given to the evaluation of the process (environmental,
economic, social), and the ease of interpretation by the general public for decision
making. It is necessary to be careful and not to use these indexes indiscriminately, trying
to make this analysis methodology strong, robust and accurate enough so that the risks
that may be incurred in making decisions do not depend on politicians preferences or
priorities given to environmental, social and economic interests. Rather, the risks are
subject to methodological causes that can be recognized to make improvements to
minimize these risks.
It is possible to see how different methodological tools implemented in this doctoral thesis
differ from their foundation, and under this pragmaticity each of them give different indices
to each sustainability dimension, presenting valuable information to be taken into account
without falling into subjective comparisons.
In order not to fall into the reductionism described above, this methodology proposes to
make an interpretation from the most general to the most specific; that is, to compare
different scenarios to be evaluated from integrated sustainability indicator in order to have
a general overview of alternatives / processes to be compared; followed by analysis of
dimensions (environmental, social, and economic) that allow to address which dimensions
are subject to improvements by determining those specific indices that make the process
not so sustainable. In this way, a holistic evaluation of the process can be reached,
focusing on those critical points subject to improvement. This allows developing better
sustainability planning and evaluation policies, both in projects already underway and in
those in the design or improvement phase by predicting future conditions under different
scenarios.

276 Sustainability Assessment of Alluvial and Open Pit Mining Systems in Colombia: Life Cycle Assessment, Exergy Analysis, and Emergy Accounting
The three analysis methodologies implemented for the evaluation of sustainability of two
mining processes; open-pit and alluvial mining, agree that alluvial mining can present a
better sustainability compared to open-pit mining; not meaning that open-pit mining is an
unsustainable process, since results obtained in this investigative work only allow us to
analyze the behavior of the sustainability of the process to make decisions that do not
correspond to the scope of this research work.Results of the proposed integration
methodology corroborate these results; alluvial mining presents the best values for
environmental and social dimensions, and open-pit for economic dimension, with the rest
of dimensions subject to better for both processes.
The proposed sustainability index presents a comprehensible hierarchic structure
determined by support methodologies such as LCA, Emergy, and Exergy which have
regulatory and academic validity. Scientific support that provides the calculation of exergy
and emergetic indicators allows to ensure that proposed categories and subsequent
dimensions compile the most representative information of each methodology. The
integration of social, environmental and economic components in an index that also
allows the subjective adjustment of externalities reducing the risk of subjectivity,
overshadowing rigorous work, is a new approach to assess sustainability in development
projects.
5.7 Acknowledgments
This project was carried out as part of the Doctoral Program funded by the Department of
Science and Technology of Colombia (COLCIENCIAS). The authors thank the mining
companies (open-pit and alluvial mining technology) for the provided data and
recommendations. This research was supported by the 1) School of Mines at the National
University of Colombia at Medellin; 2) Bioprocess and Reactive Flow Research Group.
References
Alkire, S. Dimensions of Human Development. World Development (2002).
Bakshi, B. . (2002). A thermodynamic framework for ecologically conscious process systems engineering. Comput. Chem. Eng, 26, 269–282.

Chapter 5 277
Barrett, J., Scott, A. (2001). The ecological footprint: a metric for corporate sustain- ability. Corporate Environmental Strategy, 8, 316–325.
Böhringer, C.; Jochem, P. E. P. (2007). No TitleMeasuring the immeasurable—A survey of sustainability indices. Ecol. Econ., 63, 1–8.
Brown, M. T., Raugei, M., & Ulgiati, S. (2012). On boundaries and ‘investments’ in Emergy Synthesis and LCA: A case study on thermal vs. photovoltaic electricity. Ecological
Indicators, 15(1), 227–235. http://doi.org/10.1016/j.ecolind.2011.09.021
Cano Londoño, N. A., Suárez, D. G., Velásquez, H. I., & Ruiz-Mercado, G. J. (2017). Emergy analysis for the sustainable utilization of biosolids generated in a municipal wastewater treatment plant. Journal of Cleaner Production, 141, 182–193. http://doi.org/10.1016/j.jclepro.2016.09.033
Cano, N., Céspedes, S., & Gallego, D. (n.d.). Exergy analysis as a complement to emergy for the assessment of sustainability of the use of the biosolids generated in a wastewater treatment plant. Cleaner Production.
Castellani, V., Sala, S. (2012). Ecological footprint and life cycle assessment in the sustain- ability assessment of tourism activities. Ecol. Indic., 16, 135–147.
Commission, B. (1987). Our Common Future.
Devuyst, D. (2001). How Green is the City? Sustainability Assessment and the Management of
Urban Environments (EC-JRC (20). New York: Columbia University Press.
Dincer, I. & Rosen, M. A. (2007). Exergy, energy, environment and sustainable development (1a. Ed.). Elsevier.
Dincer, I., & Rosen, M. A. (2015). Chapter 1 - Exergy and its Ties to the Environment, Economics,
and Sustainability. Exergy Analysis of Heating, Refrigerating and Air Conditioning. Methods
and Applications. http://doi.org/http://dx.doi.org/10.1016/B978-0-12-417203-6.00001-6
Elkington, J. (1997). Cannibals with Forks: the Triple Bottom Line of 21st Century.
Finkbeiner, M., Schau, E. M., Lehmann, A., & Traverso, M. (2010). Towards life cycle sustainability assessment. Sustainability, 2(10), 3309–3322. http://doi.org/10.3390/su2103309
Gasparatos, A., El-Haram, M., & Horner, M. (2008). A critical review of reductionist approaches for assessing the progress towards sustainability. Environmental Impact Assessment Review. http://doi.org/10.1016/j.eiar.2007.09.002
Giannetti, B. F., Agostinho, F., Almeida, C. M. V. B., & Huisingh, D. (2015). A review of limitations of GDP and alternative indices to monitor human wellbeing and to manage eco-system functionality. Journal of Cleaner Production, 87(1), 11–25. http://doi.org/10.1016/j.jclepro.2014.10.051
Hau, J. L., & Bakshi, B. R. (2004). Expanding Exergy Analysis to Account for Ecosystem Products and Services Expanding Exergy Analysis to Account for Ecosystem Products and Services. Environmental Science & Technology, 38(13), 3768–3777. http://doi.org/10.1021/es034513s

278 Sustainability Assessment of Alluvial and Open Pit Mining Systems in Colombia: Life Cycle Assessment, Exergy Analysis, and Emergy Accounting
Henckens, M. L. C. M., van Ierland, E. C., Driessen, P. P. J., & Worrell, E. (2016). Mineral
resources: Geological scarcity, market price trends, and future generations. Resources
Policy, 49. http://doi.org/10.1016/j.resourpol.2016.04.012
Kanoglu, M., Dincer, I., Cengel, Y. (2008). Exergy for better environment and sustainability. In Environment, Development and Sustainability. http://doi.org/10.1007/s10668-008-9162-3.
Kharrazi, A., Kraines, S., Hoang, L., & Yarime, M. (2014). Advancing quantification methods of sustainability: A critical examination emergy, exergy, ecological footprint, and ecological information-based approaches. Ecological Indicators, 37(PART A), 81–89. http://doi.org/10.1016/j.ecolind.2013.10.003
Klöpffer, W., Grah, B. (2014). Life Cycle Assessment (LCA): A Guide to Best Practice. In John Wiley & Sons (Ed.), (p. 480).
Lomas, P. L., & Martín-lópez, M. B. (2005). El Sistema de Evaluación Emergética ( Emergy Synthesis ). Integrando Energía , Ecología y Economía, (January).
Neumayer, E. (2010). Weak Versus Strong Sustainability: Exploring the Limits of Two Opposing
Paradigms. (Edward Elgar, Ed.) (third ed.). Cheltenham, UK.
Niembro, I., & Gonzalez, M. (2012). Energía y Exergía : Enfoques hacia la Sostenibilidad mediante el Análisis de Ciclo de Vida. Congreso Nacional Del Medio Ambiente.
Odum, H. . (1996). Environmental Accounting: Emergy and Environmental Decision Making. (J. W. and Sons, Ed.). New York.
ODUM, H. T. (2001). Environmental Accounting, Emergy and Decision Making. Colorado.
ReCiPe. (2016). A harmonized life cycle impact assessment method at midpoint and endpoint level
Report I: Characterization RIVM Report 2016-0104.
Reza, B., Sadiq, R., & Hewage, K. (2014a). Emergy-based life cycle assessment (Em-LCA) for sustainability appraisal of infrastructure systems: A case study on paved roads. Clean
Technologies and Environmental Policy, 16(2), 251–266. http://doi.org/10.1007/s10098-013-0615-5
Reza, B., Sadiq, R., & Hewage, K. (2014b). Emergy-based life cycle assessment (Em-LCA) of multi-unit and single-family residential buildings in Canada. International Journal of
Sustainable Built Environment, 3(2), 207–224. http://doi.org/10.1016/j.ijsbe.2014.09.001
Stahel, W., Reday, G. (1976). The Potential for Substituting Manpower for Energy, Report to the Commission of the European Communities.
Szargut, J. (2005). Exergy method: Technical and ecological applications. (S. WIT Press, Ed.).
UN. (2001). Indicators of sustainable development: guidelines and methodologies. New York.
UNEP/SETAC. (2009). Guidelines for Social Life Cycle Assessment of Products. United Nations
Environment Programme. Paris.
United Nations General Assembly. World Summit Outcome (2005). New York, USA.

Chapter 5 279
Wickson, F., Carew, A.L., Russell, A. W. (2006). Transdisciplinary research: characteristics, quandaries and quality. Futures, 38, 1046–1059.

6. Overall Conclusions
Apart from the specific conclusions presented by each specific objective
developed in this doctoral thesis, found at the end of each chapter, this section
addresses the most general conclusions so as not to fall into meaningless
repetitions.
According to Brundtland, sustainable development is the one that meets the needs
of the present without compromising the ability of future generations to meet their
own needs (Commission, 1987). Mining activity diverges of sustainable
development concept for being an activity based on the extraction of non-
renewable resources?. If the extraction of non-renewable resources is avoided in
the present, the concept of sustainability would break down, since it would prevent
present generations from meeting their needs and, if these resources are scarce
in the future, the same situation would occur to them. When we talk about
sustainability of non-renewable resources, we are talking about present and future
generations enjoying the functionality it provides, but not having the resource itself
in its original form. In these terms, mining developed under TBL principle would be
a sustainable activity, since it would work for economic welfare, environmental
quality, and social coherence; and in turn, present and future generations would
always satisfy their needs through functional substitutes. Certainly, for the
extraction of these resources parameters such as abundant, scarce or stress
resources should be taken into account, in order to give them a special extraction,
management and use to extend their durability over time such as increase the
price of the scarcest mineral resources, thus promoting accelerated substitution
and recycling and safeguarding a sufficient supply of the geologically scarcest
mineral resources for future generations.

Conclusions 281
Resource efficiency, environmental burden and process efficiency can be
considered one of the interpretations/consequences of Brundtland's definition of
sustainable development. The integration methodology proposed here accounts
for the use of all the resources required for the generation of a product or service.
At the same time it assesses the environmental degradation caused by waste
and/or emissions inherent to process efficiency; as well as the management that
can be given to them so that the process is economically profitable and socially
viable, under parameters such as damage to human health, human labor and
quality of life. Hence the integration of Life Cycle Assessment, Exergy Analysis
and Emergy Accounting; LCA evaluates process sustainability based on the
environmental impacts generated by waste and emissions released to the
environment, Emergy based on the use of the necessary resources to carry out
the process, and Exergy based on process efficiency.
To evaluate the sustainability of a process, it is necessary to cover all its life cycle
as much as possible. The role of ecosystem goods and services must be taken
into account, since they form the basis of planetary activities and human welfare.
Consequently, the system boundary must be large enough to account for all the
ecosystem goods and services that support technological activities during life
cycle. Exergy and LCA do not consider the environmental contribution to human
economic system, not meaning that Emergy is able to consider all ecosystem
services, hence the need to complement and / or integrate analysis
methodologies.
There are no exact limits to define sustainability. In contrast, the border between
sustainable and unsustainable is blurred, which means that it is often not possible
to determine exact reference values for what is sustainable and what is not. That
is why it is necessary to compare sustainability between systems, since it is rarely
possible to define if a process is sustainable with a simple number. For this
reason, in this integration method, a value between 0 and 1 was defined, being 0 a
0% sustainable process, and 1 a 100% sustainable.

282 Sustainability Assessment of Alluvial and Open Pit Mining Systems in Colombia: Life Cycle Assessment, Exergy Analysis, and Emergy Accounting
In terms of Life Cycle Assessment, it is not easy to answer which out of the two
mining systems evaluated has a better environmental performance. Open pit
mining system presents higher values in human health damage category, whereas
alluvial mining causes more damage on ecosystem quality, this latter process
having the least total impacts measured in points. On the other hand, based on
the proposed integration method, alluvial mining presents a better environmental
and social behaviour, while open-pit mining presents it in the economic dimension,
although it has a lower sustainability indicator with respect to the reference
system. These results are corroborated by Exergy Analysis; alluvial mining
process is more sustainable in exergy terms compared to open-pit mining process,
since the latter generates greater entropy due to its thermodynamic
irreversibilities, causing a greater load to the receiving environment, reflected in
different types of emissions/ environmental impacts to soil, water and air. Finally,
in emergy terms, both extractive systems are unsustainable in the long term,
alluvial mining having a better index of sustainability; however, it is not possible to
determine if the system is more sustainable with respect to the other because the
difference between indices is not very significant.
As previously stated, process sustainability improvement lies in making efficient
use of the resources together with the optimization of process efficiency, which
leads to the reduction of emissions and waste generated, thus reducing also the
pollution to the environment. With these strategies, virgin resources are
diminished, which implies a lower extraction. Waste that cannot be avoided
because it is inherent to the process must have a new use through recycling and
reuse strategies. A brief breakdown of each of these items is made below.
Efficient us of resources
Waste cascading, may be described in thermodynamic terms as using
outputs from one or more consumptive processes as inputs to others
requiring equal or lower Exergy. Waste cascading reduces resource in two
ways: by reducing the rate of exergy loss caused by the dissipation of
potentially useful wastes in the environment, and by reducing the need to
refine virgin resources (Dincer, I. & Rosen, 2007).

Conclusions 283
Selection of appropriate process technologies to minimize the consumption
of water and energy in mining processes, especially in benefit and
transport stages.
Promote dependence on renewable sources and not on non-renewable
and imported resources. A system is sustainable if it is able to adapt to
available energy sources, and to replace those energy sources with others
in case the original sources of energy are no longer available.
Design the processes thinking of a loop economy; strategy for waste
prevention by a regenerative system in which resource input and waste,
emission, and energy leakage are minimized by slowing, closing, and
narrowing material and energy loops (Stahel, W., Reday, 1976),
encouraging reuse, remanufacturing, refurbishing, and recycling. However,
primary metals will be still required throughout the transition towards a
more sustainable society, and it would be unreasonable to think that
recycling of endof-life (EoL) products will replace primary extraction
entirely, in the near or distant future (Allwood, 2014).
To make a special management in the extraction of non-renewable
resources, it is necessary to determine which is the priority for the
reduction of the extraction rate (scarcest minerals), how critical is a mineral
for the society, its economic importance, the stability of its delivery, its
substitutability and its recycling potential. By determining these
parameters, strategies can be adopted such as: substitution of the
resource for another less scarce resource, increasing material efficiency
and more recycling (Henckens et al., 2016)
Process efficiency
Increasing exergy efficiency. One way to reduce resource depletion
associated with cycling is to reduce the losses that accompany the transfer
of exergy to consumed resources, increasing the efficiency of exergy
transfer between resources (Dincer, I. & Rosen, 2007). This is less
extraction of energy resources from the environment, such as fossil fuels,
and additionally an increased efficiency also reduces exergy emissions,
which also can represent a potential to harm the environment.

284 Sustainability Assessment of Alluvial and Open Pit Mining Systems in Colombia: Life Cycle Assessment, Exergy Analysis, and Emergy Accounting
Scientific methods to assess mining sector sustainability in Colombia currently
lack of an effective public mining policy to support them; since factors such as
social, economic and environment have not achieved full integration in order to
guarantee a sustainability over time that allows negotiations around the concept of
sustainable development. Proof of this are the different popular consultations on
mining that have taken place in Colombia, ignoring that through the concept of
sustainable development it is possible to structure a solid public policy, which finds
a legal approach in the Political Constitution and Internationals Treaties
subscribed by this country. That is why the evaluative integration method
proposed in this thesis, is undoubtedly a necessary element to take into account
within a public policy in order to achieve the desired integration of the three
dimensions, since with this, different environmental authorities will not only be able
to exercise effective control within the scope of their competence, but will also
serve as a guide to confer different environmental licenses in order to exercise a
mining operation in a responsible manner, more friendly to the environment,
avoiding the ignorance of the society of the immeasurable opportunity that the
Colombian topography gives us in terms of exploitation of the mining sector,
represented in a significant contribution worldwide in different markets.
Outook
In addition to the Outlook presented in section 4 of the fourth chapter, the following is
suggested:
Compare the critical part of the mining sector (energy and water) with others
economic sectors that also makes intensive use of these resources such as agriculture
and livestock, to be a valid comparison; scope and functional unit must be comparable.
Apply theories of elasticity to calculate the global exergy efficiency of the process
based on exergy efficiencies of individual processes, this would allow to reduce the
calculation time.
Exergy analysis based on the inventory of resources with no need to stocktacking
as emergy.
Carry out another exergy scenario, where accumulated exergy demand is
calculated as an inventory list of consumptions of renewable, non-renewable and

Conclusions 285
imported resources, similar to how the cumulative emergy demand is calculated but in
terms of exergy.
To get a clearer picture of the impacts caused by the sulfidic tailings, it is proposed
to do a more profound study on this issue with an equal set of substances analyzed in
both mining systems, and performing a sensitivity analysis of substance percentages
released to ground water and how they affect ecosystems and human health.
Evaluate possible methodologies for the objective assessment of weight
importance of dimensions for the calculation of WASI, as well as those of impact
categories for the calculation of AASI, where all stakeholders participating throughout the
entire productive cycle
Expand this study to subsequent stages at the end of the mine lifespan; this is the
closure stage and mining post-closure phase.
Address technical and environmental improvements in those stages where results
were the most critical inside the supply chain. Such as tails, stripping and extraction
stages in open-pit; and stripping, casting and molding in alluvial mining.
To implement the proposed integration methodology by stages and not globally, in
order to determine which stages of the process should have greater importance to
improve their sustainability. This would involve making emergy analysis also by stages.
FINANCIAL SUPPORT
Doctoral Program funded by the Department of Science and Technology of Colombia
(COLCIENCIAS).
National call for supporting research projects and artistic creation of the UNIVERSIDAD
NACIONAL DE COLOMBIA 2017-2018.
ENLAZA MUNDOS program 2017. Higher Education Agency of Medellín-SAPIENCIA and
Mayor's Office of Medellín.

7. Appendix
Data provided by mining companies is confidential information used only to academic.
purposes. Any data request please contact me at [email protected]