Embed Size (px)
Citation preview
Sustainability – driven by Supplier Management
Jan Grönvall
26th of March 2014 @ CIPS
JG/26 March 2014
JG/26 March 2014 / 2
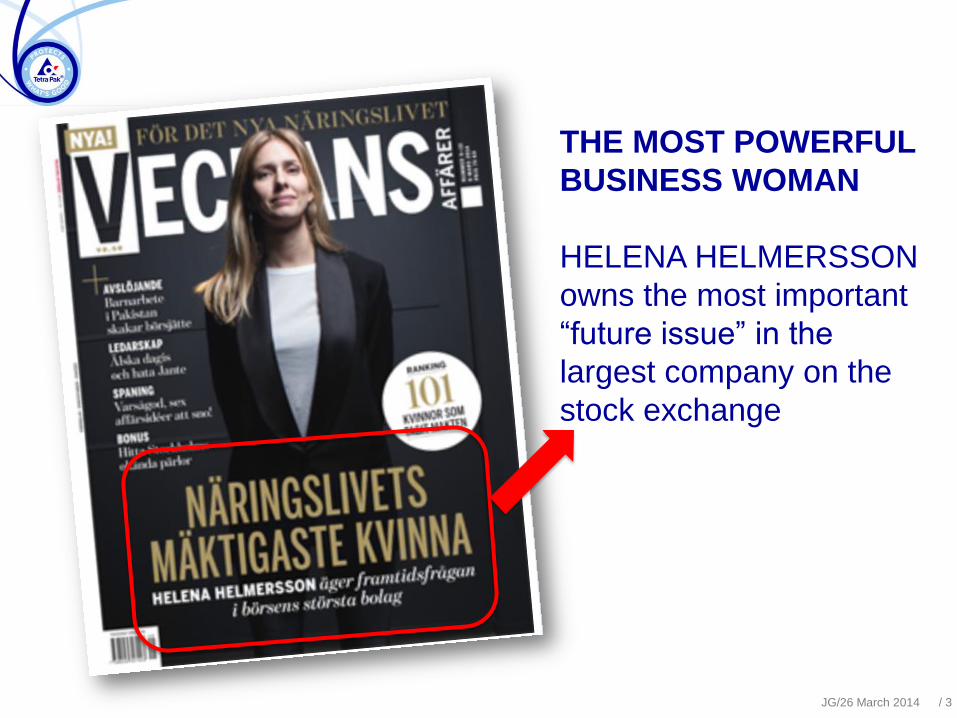
THE MOST POWERFUL
BUSINESS WOMAN
HELENA HELMERSSON
owns the most important
“future issue” in the
largest company on the
stock exchange
JG/26 March 2014 / 3
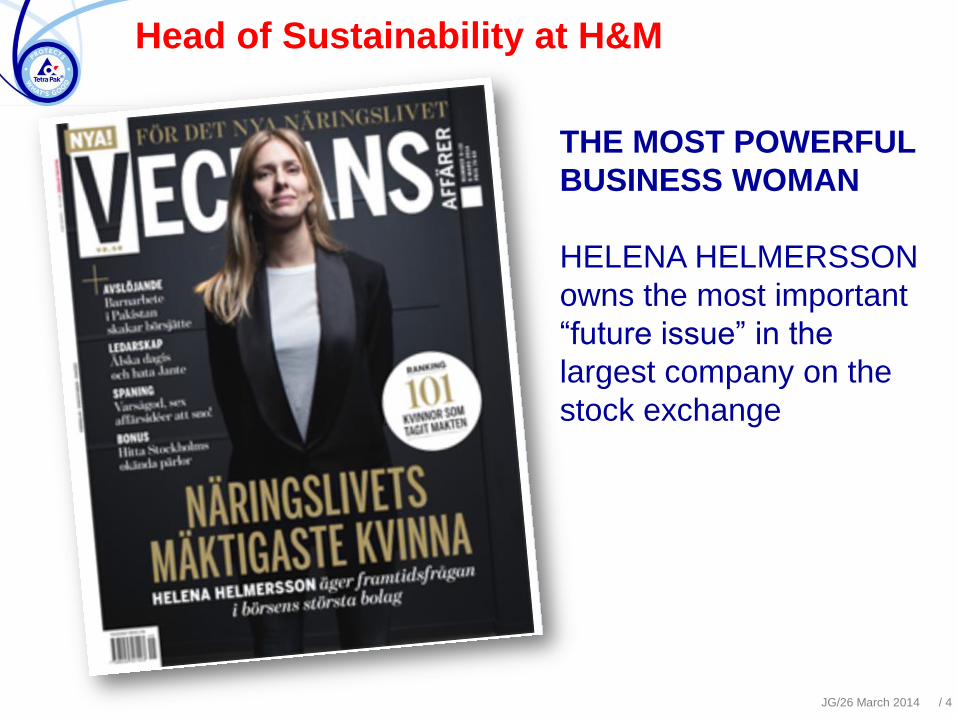
Head of Sustainability at H&M
THE MOST POWERFUL
BUSINESS WOMAN
HELENA HELMERSSON
owns the most important
“future issue” in the
largest company on the
stock exchange
JG/26 March 2014 / 4
“You are what you talk”
Who in your company is on stage when the subject
is sustainability?
Maybe we all have to take a bigger responsibility
here?
JG/26 March 2014 / 5
JG/26 March 2014 / 6
JG/26 March 2014 / 7
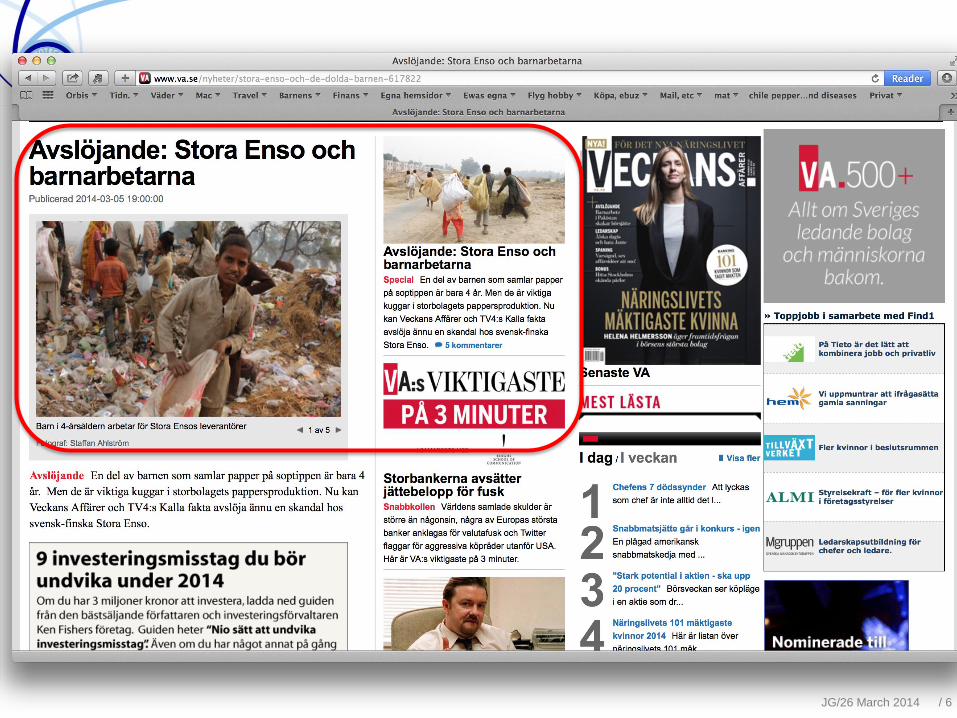
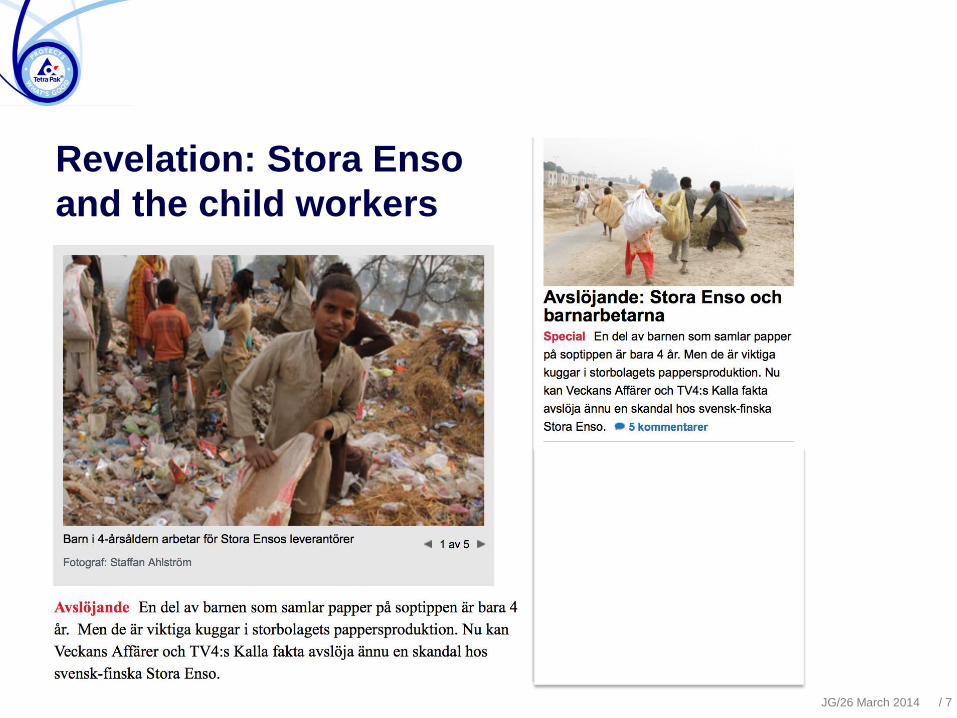
Revelation: Stora Enso
and the child workers
Questions to ask ourselves
How far up the supply chain does our responsibility go?
Do we do enough to protect our brands – and the world?
Is NOT sourcing in your biggest market sustainable?
…. etc.
JG/26 March 2014 / 8
About myself….
Jan Grönvall
M. Sc. Chemical Engineering, Lund, Sweden
M. BA, Lund, Sweden
Sweden, the first 28 years + 3 years
Other countries 31 years
34 years in Tetra Pak:
- Factory Management
- Global Manufacturing
- Global R&D, Tech Service
- Group Purchasing
- Global Leadership Team
This is Tetra Pak
JG/26 March 2014
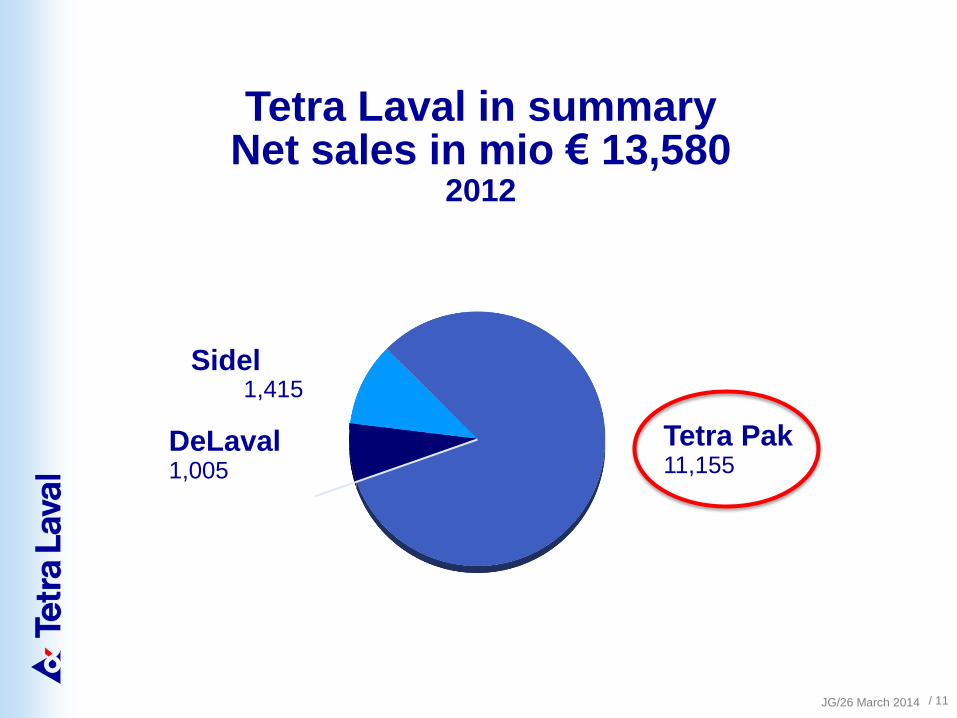
Tetra Pak 11,155
DeLaval 1,005
Sidel 1,415
Tetra Laval in summary Net sales in mio € 13,580
2012
/ 11 JG/26 March 2014
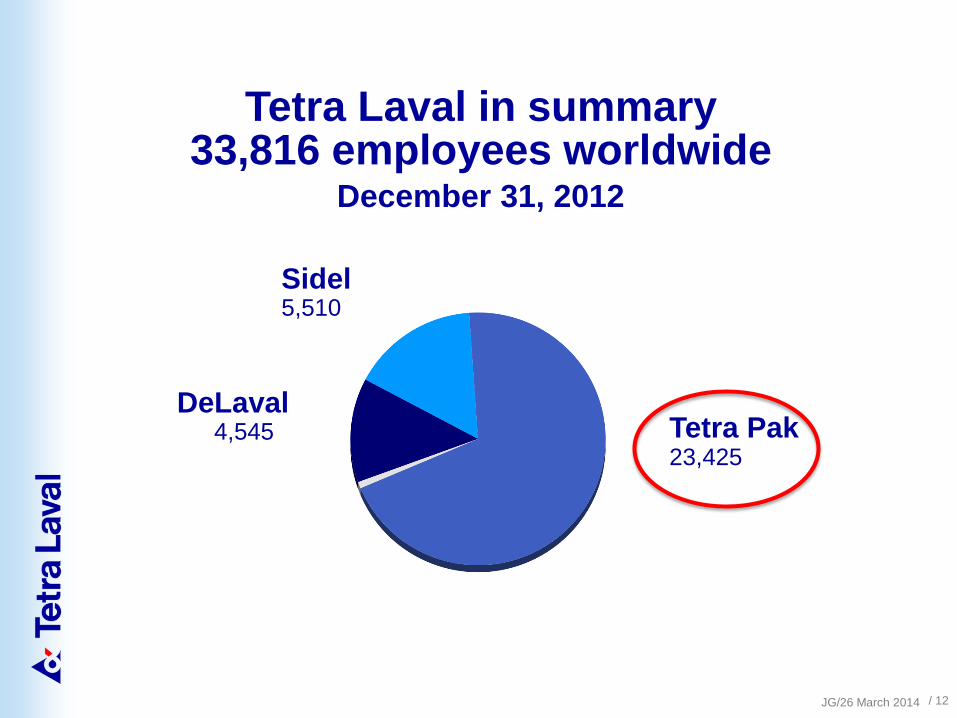
Tetra Pak 23,425
DeLaval 4,545
Sidel 5,510
Tetra Laval in summary 33,816 employees worldwide
December 31, 2012
/ 12 JG/26 March 2014
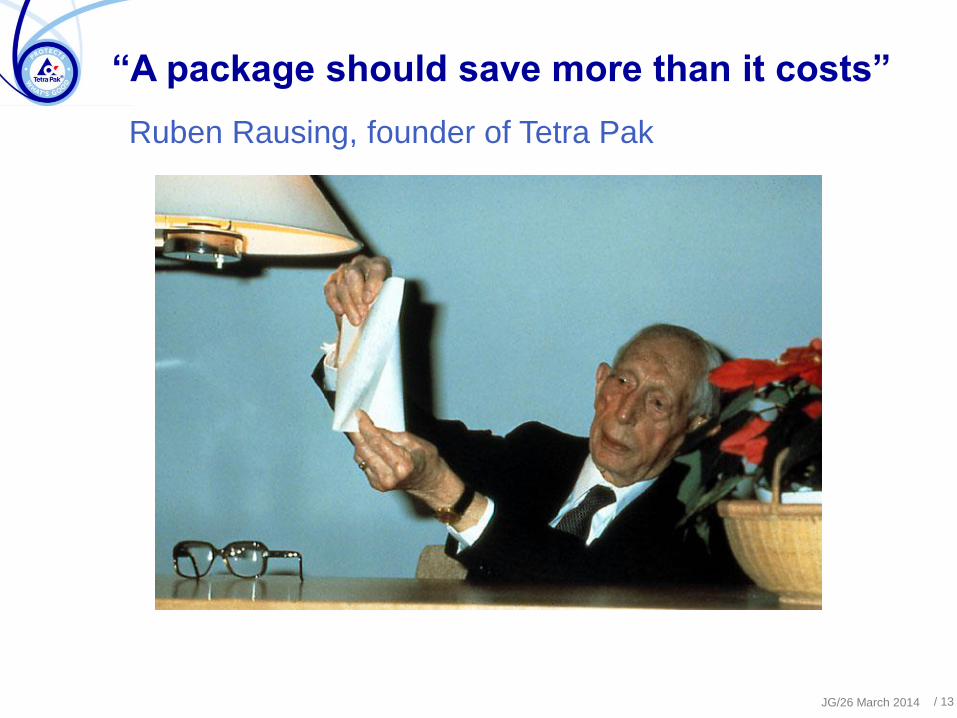
Ruben Rausing, founder of Tetra Pak
“A package should save more than it costs”
/ 13 JG/26 March 2014
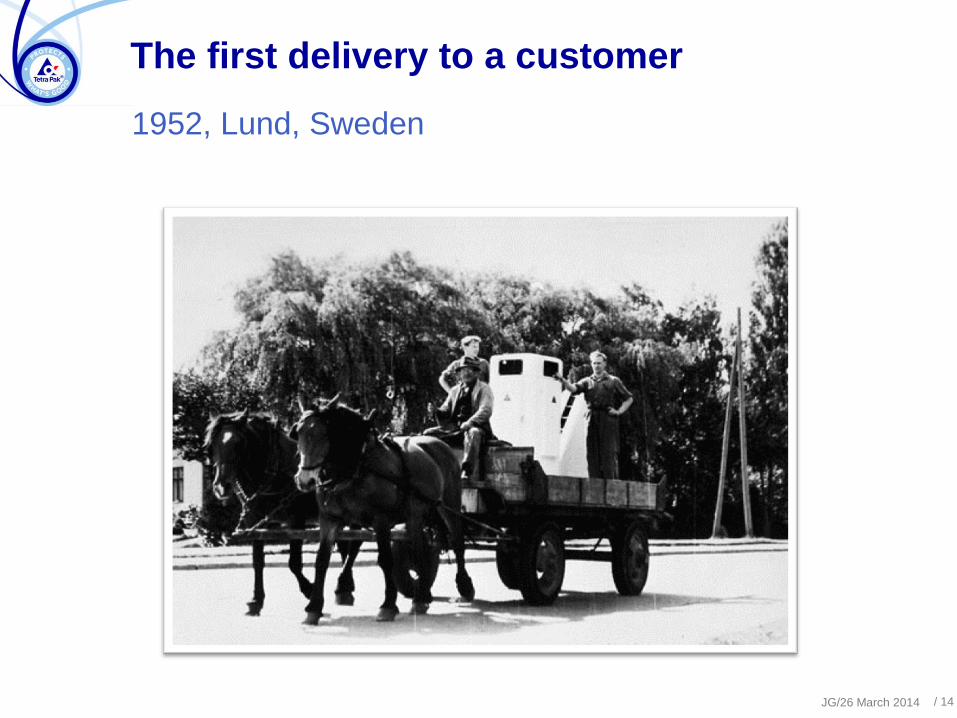
1952, Lund, Sweden
The first delivery to a customer
/ 14 JG/26 March 2014
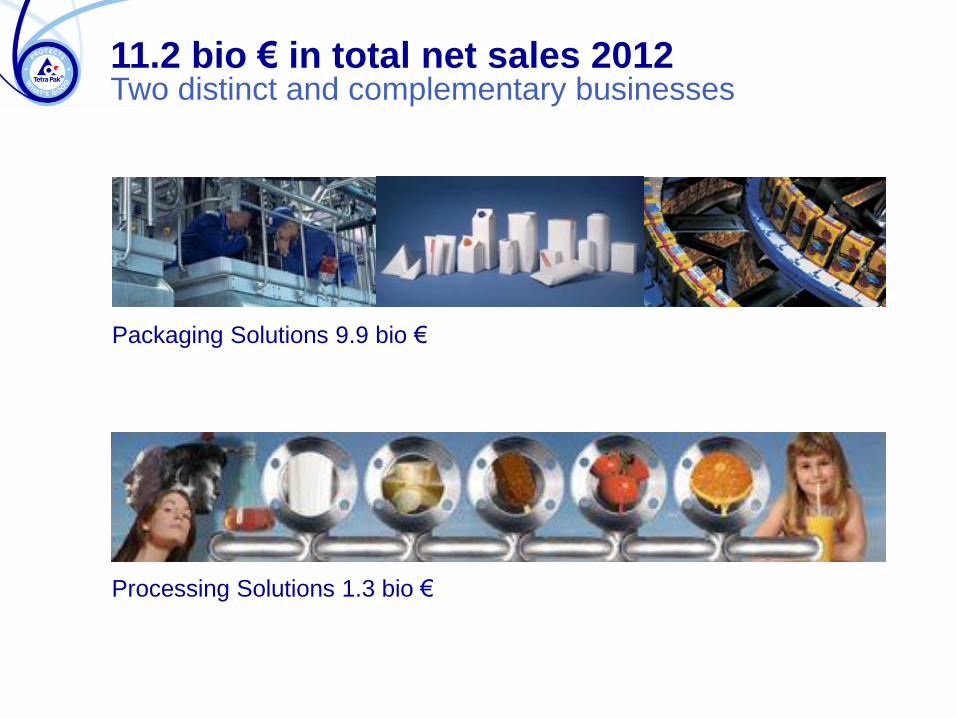
Packaging Solutions 9.9 bio €
Processing Solutions 1.3 bio €
11.2 bio € in total net sales 2012 Two distinct and complementary businesses
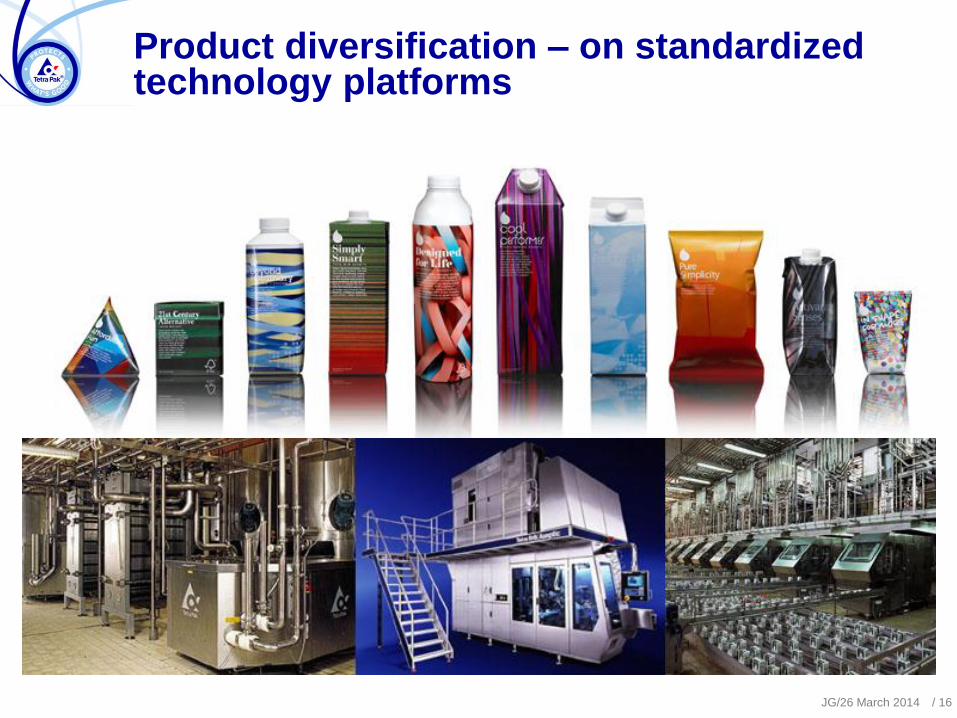
Product diversification – on standardized technology platforms
JG/26 March 2014 / 16
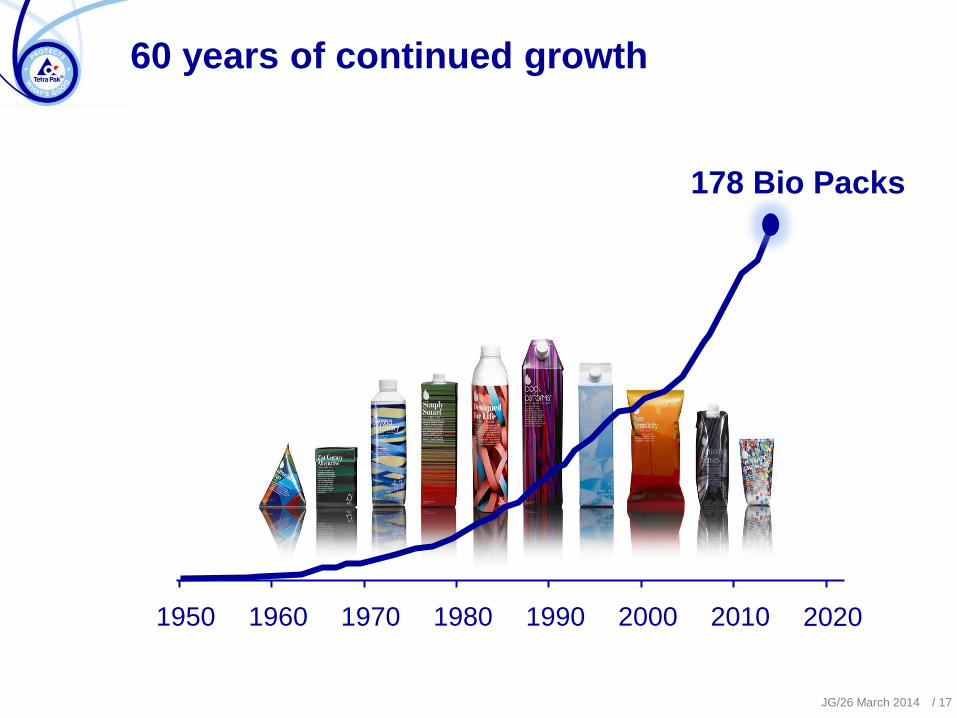
60 years of continued growth
1950 1960 1970 1980 1990 2000 2010 2020
178 Bio Packs
JG/26 March 2014 / 17
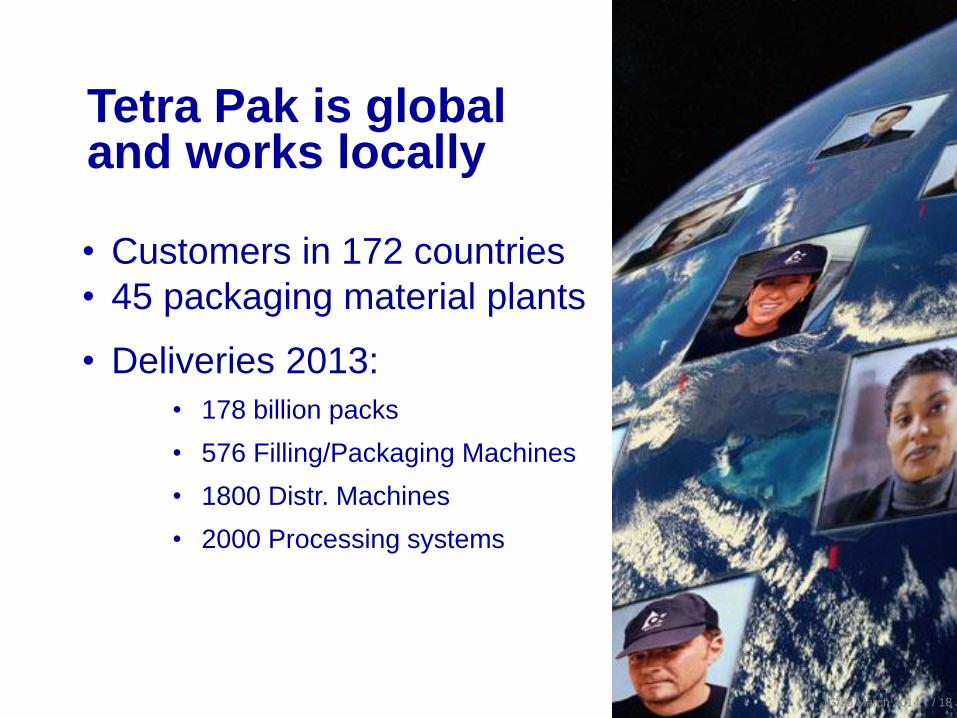
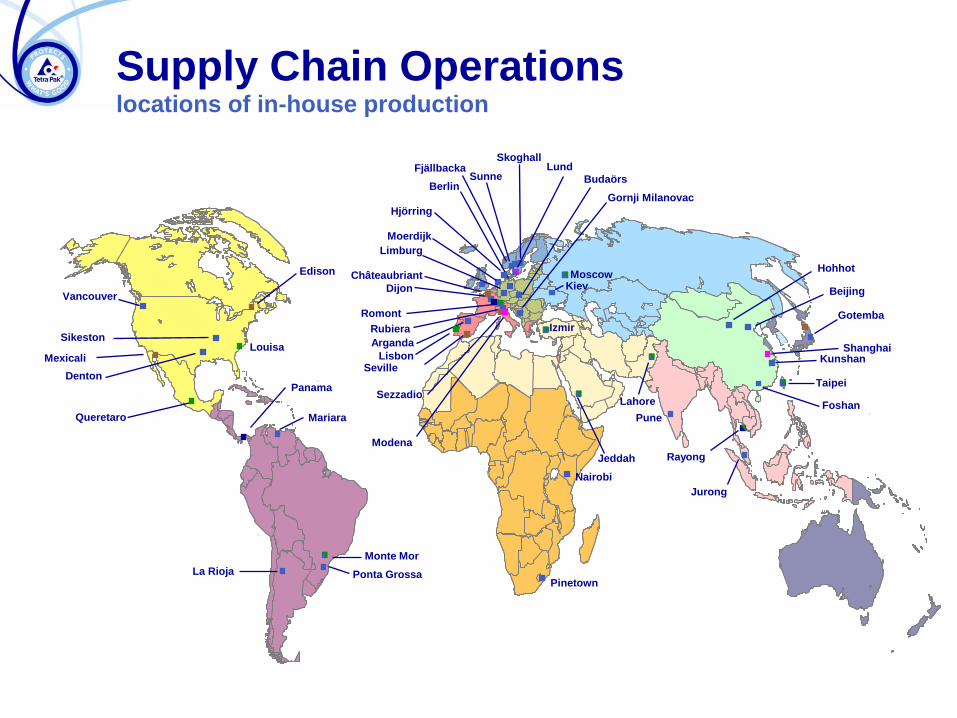
• Customers in 172 countries
• 45 packaging material plants
• Deliveries 2013:
• 178 billion packs
• 576 Filling/Packaging Machines
• 1800 Distr. Machines
• 2000 Processing systems
Tetra Pak is global and works locally
JG/26 March 2014 / 18
Queretaro
Denton
Mariara
Vancouver
Sikeston
Ponta Grossa
Monte Mor
La Rioja
Skoghall
Sunne
Limburg
Moerdijk
Berlin
Dijon
Romont
Rubiera
Arganda
Nairobi
Lund
Pinetown
Jeddah
Pune
Budaörs
Izmir
Lahore
Kiev Moscow
Gornji Milanovac
Taipei
Beijing
Gotemba
Kunshan
Jurong
Foshan
Hohhot
Supply Chain Operations locations of in-house production
Hjörring
Fjällbacka
Rayong
Lisbon Louisa
Mexicali
Edison
Seville
Sezzadio
Châteaubriant
Shanghai
Modena
Panama
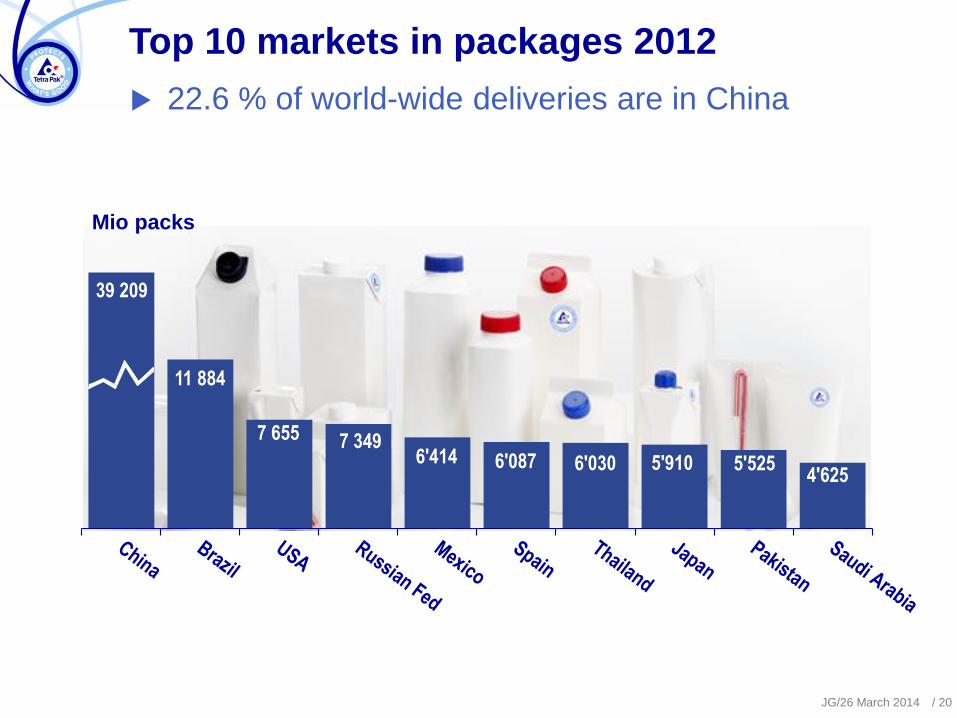
39 209
11 884
7 655 7 349 6'414 6'087 6'030 5'910 5'525
4'625
22.6 % of world-wide deliveries are in China
Top 10 markets in packages 2012
Mio packs
JG/26 March 2014 / 20
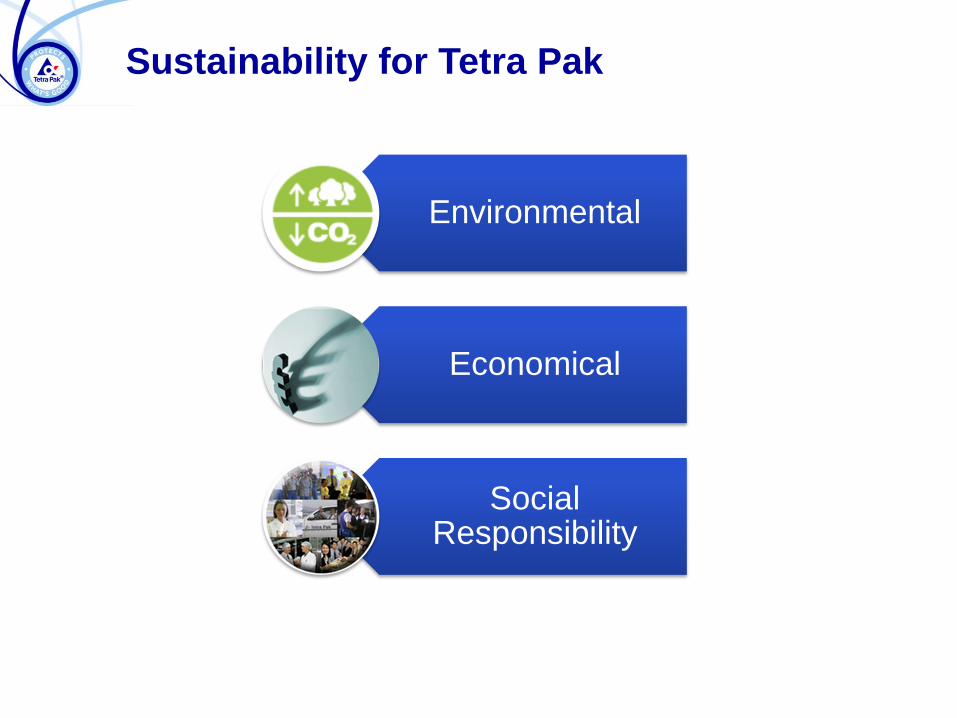
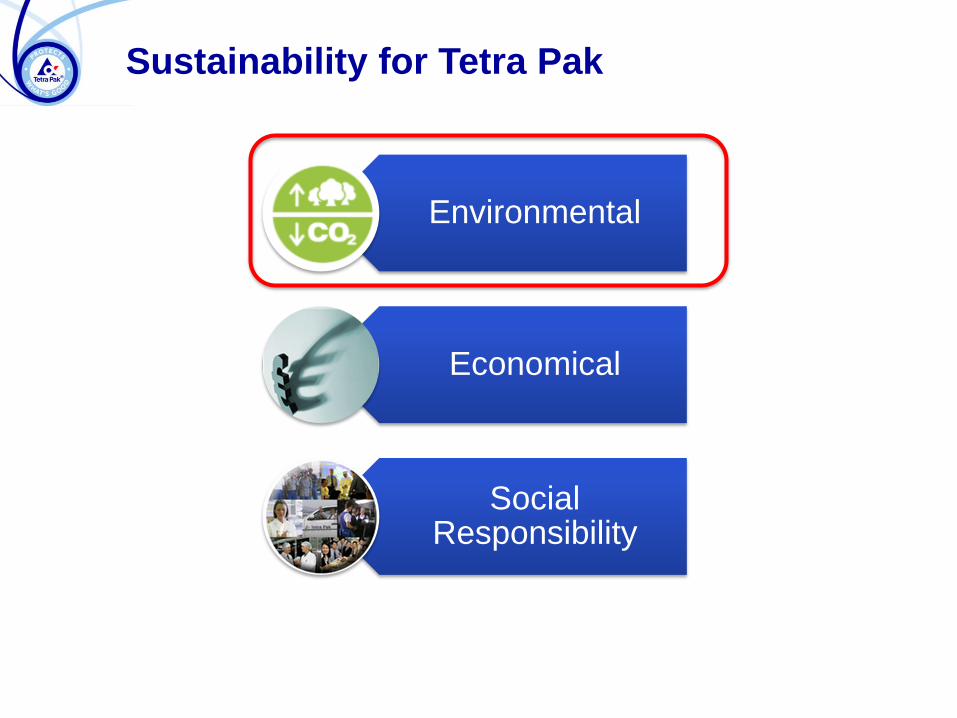
Sustainability for Tetra Pak
Environmental
Economical
Social Responsibility
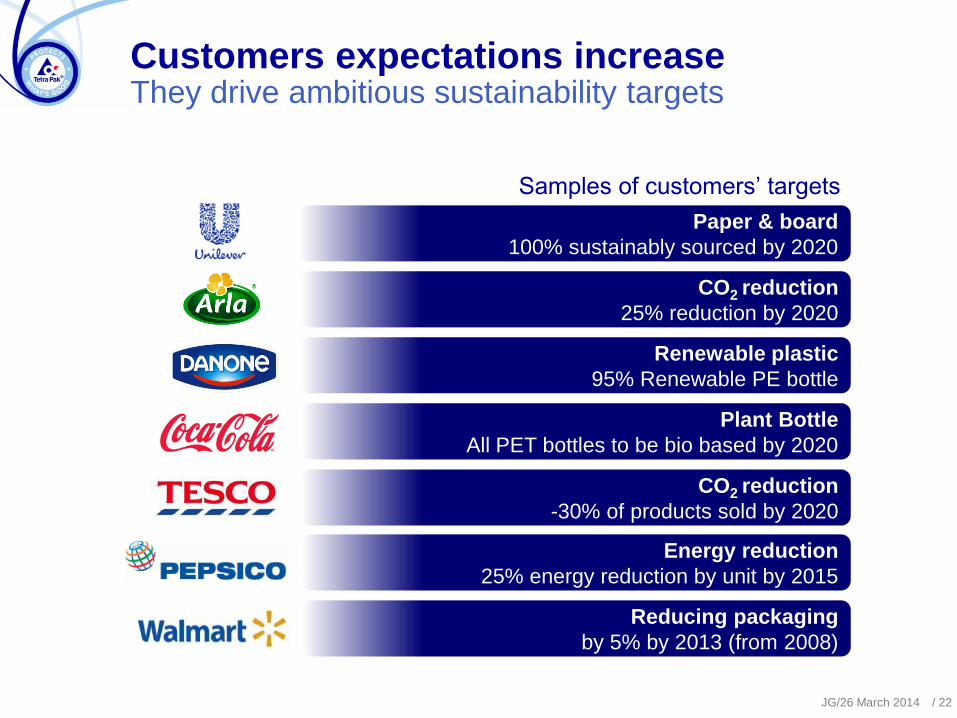
They drive ambitious sustainability targets Customers expectations increase
Plant Bottle
All PET bottles to be bio based by 2020
CO2 reduction
25% reduction by 2020
CO2 reduction
-30% of products sold by 2020
Paper & board
100% sustainably sourced by 2020
Energy reduction
25% energy reduction by unit by 2015
Renewable plastic
95% Renewable PE bottle
Reducing packaging
by 5% by 2013 (from 2008)
Samples of customers’ targets
JG/26 March 2014 / 22
Sustainability for Tetra Pak
Environmental
Economical
Social Responsibility
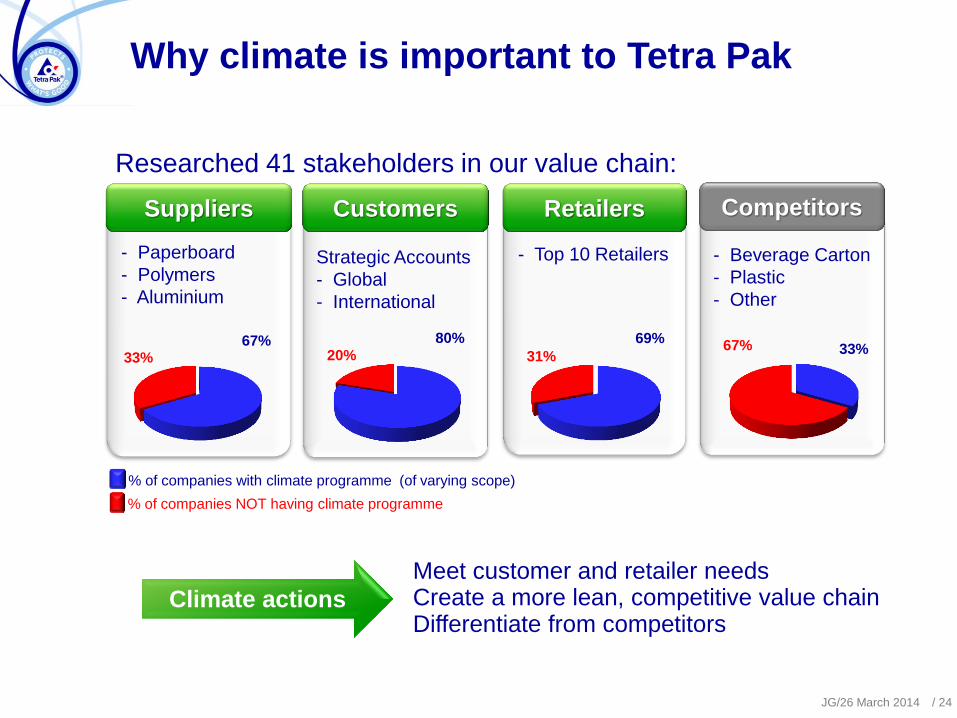
- Beverage Carton
- Plastic
- Other
Competitors
Why climate is important to Tetra Pak
Meet customer and retailer needs Create a more lean, competitive value chain Differentiate from competitors
Researched 41 stakeholders in our value chain:
- Paperboard
- Polymers
- Aluminium
Strategic Accounts
- Global
- International
- Top 10 Retailers
Customers Retailers Suppliers
67% 33%
33% 67% 69%
31%
80%
20%
% of companies with climate programme (of varying scope)
% of companies NOT having climate programme
Climate actions
JG/26 March 2014 / 24
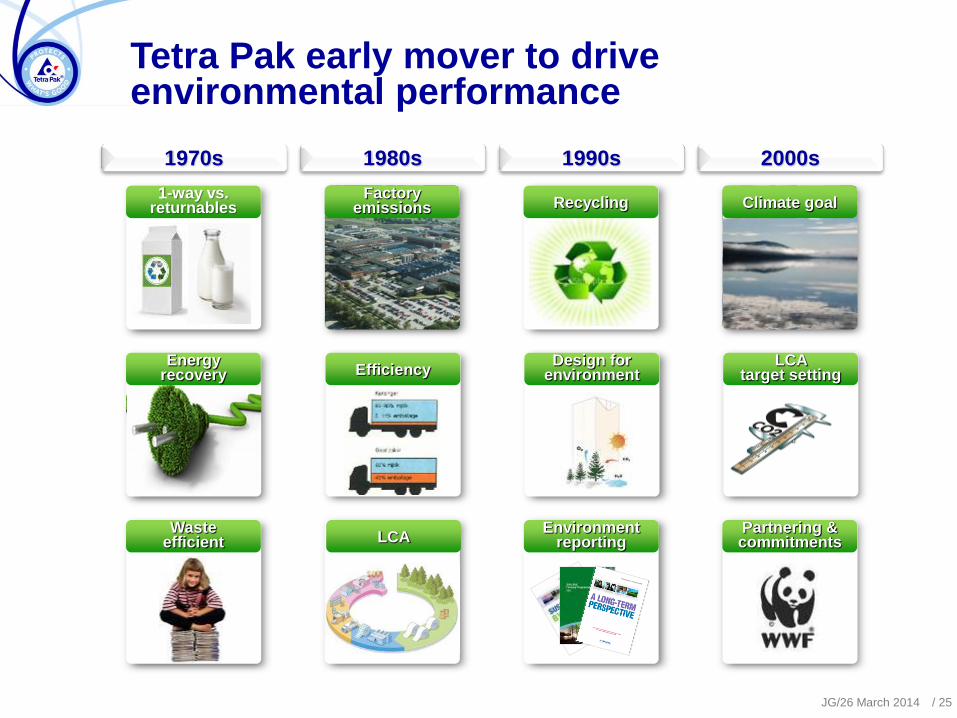
Tetra Pak early mover to drive environmental performance
1970s 1980s 1990s 2000s
1-way vs. returnables
Waste efficient
Energy recovery Efficiency
LCA
Factory emissions
Design for environment
Recycling
Environment reporting
Climate goal
LCA target setting
Partnering & commitments
JG/26 March 2014 / 25
1-way vs. returnables
Waste efficient
Energy recovery Efficiency
LCA
Factory emissions
Design for environment
Recycling
Environment reporting
Climate goal
LCA target setting
Partnering & commitments
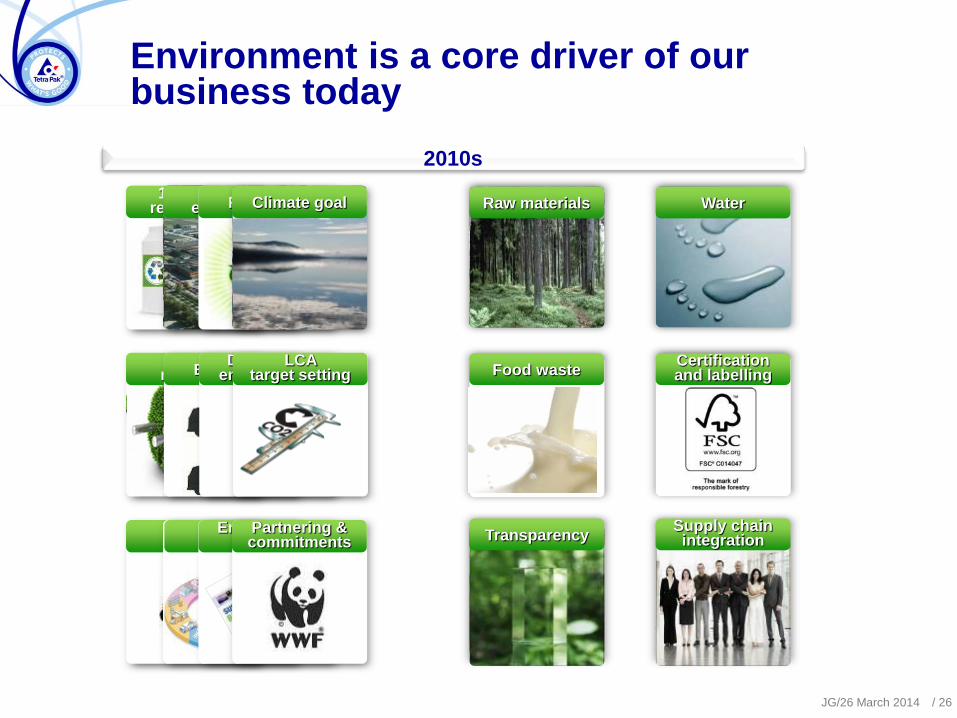
Environment is a core driver of our business today
2010s
Raw materials
Transparency
Water
Food waste
Supply chain integration
Certification and labelling
JG/26 March 2014 / 26
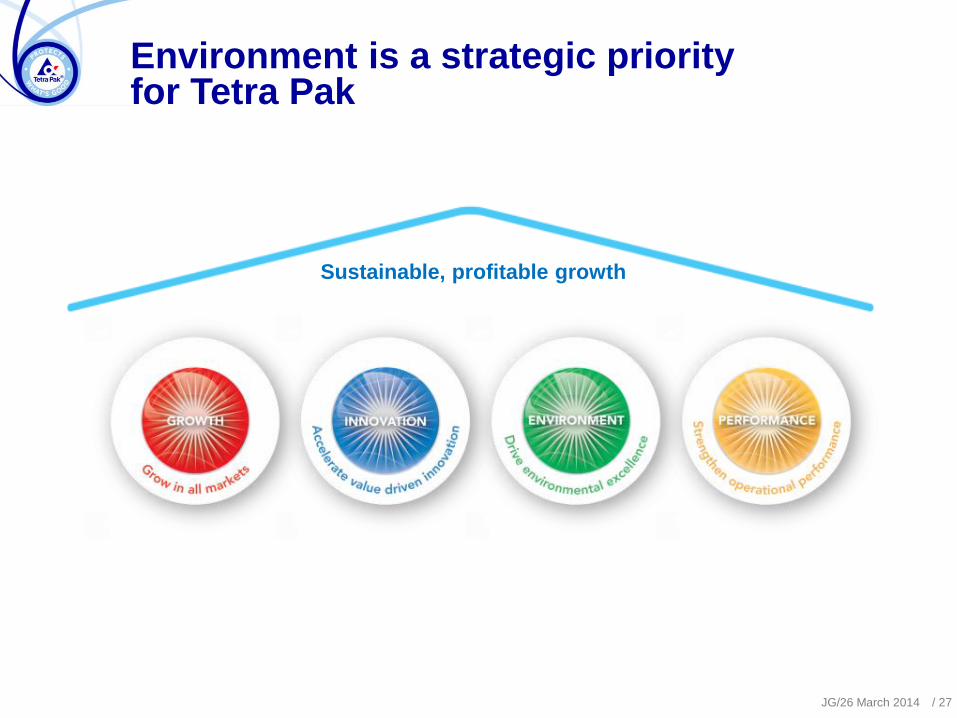
Environment is a strategic priority for Tetra Pak
Sustainable, profitable growth
JG/26 March 2014 / 27
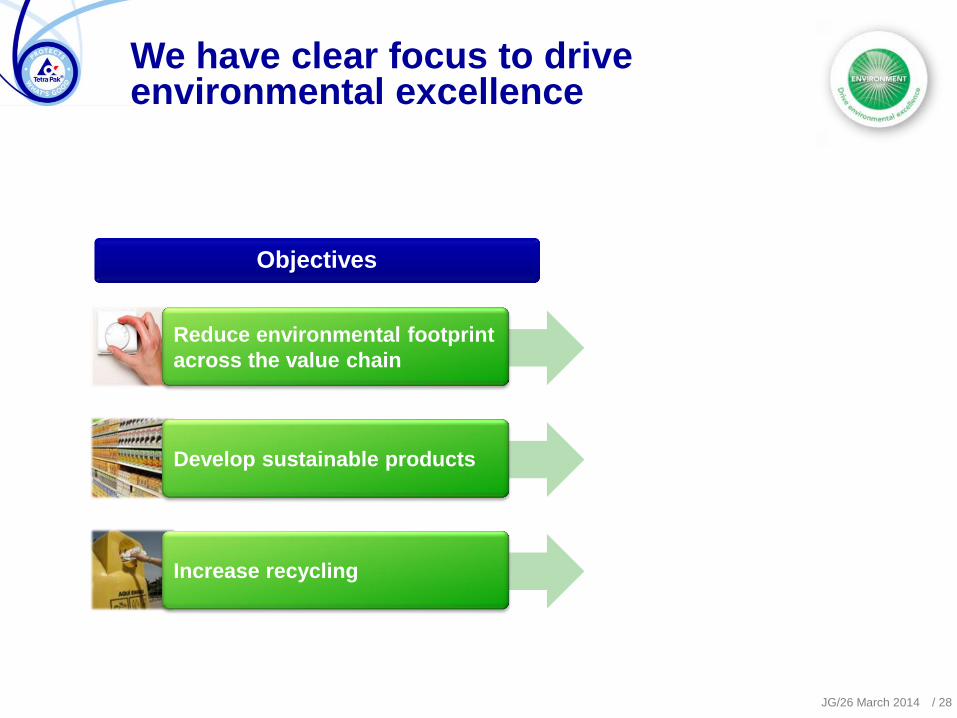
We have clear focus to drive environmental excellence
Reduce environmental footprint
across the value chain
Develop sustainable products
Increase recycling
Objectives
JG/26 March 2014 / 28
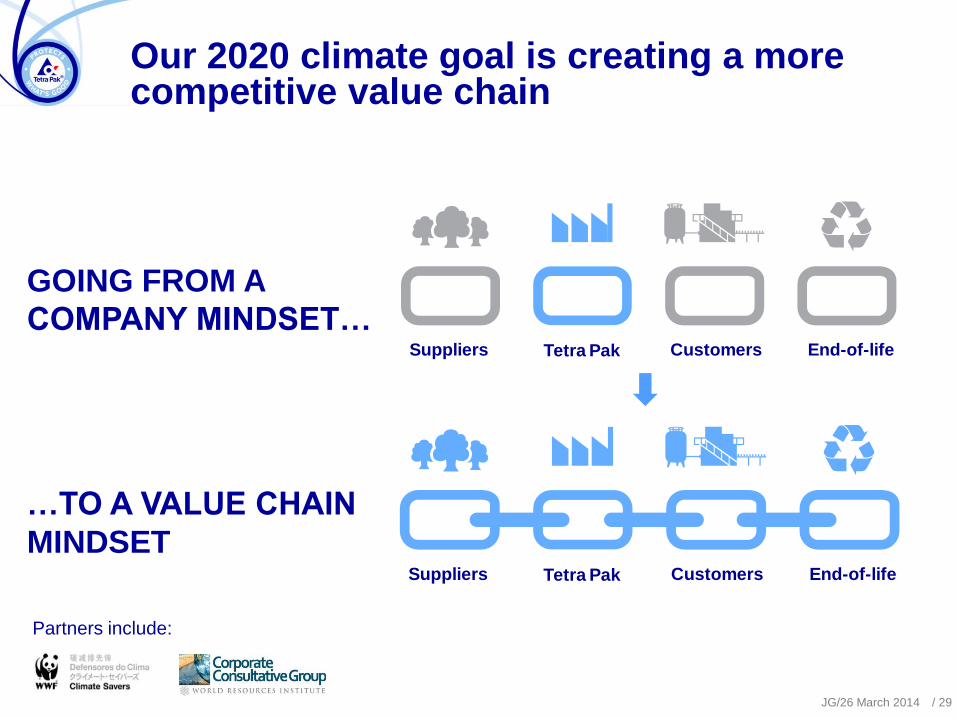
Tetra PakSuppliers Customers End-of-life
Our 2020 climate goal is creating a more competitive value chain
GOING FROM A
COMPANY MINDSET…
…TO A VALUE CHAIN
MINDSET
Tetra PakSuppliers Customers End-of-life
Partners include:
JG/26 March 2014 / 29
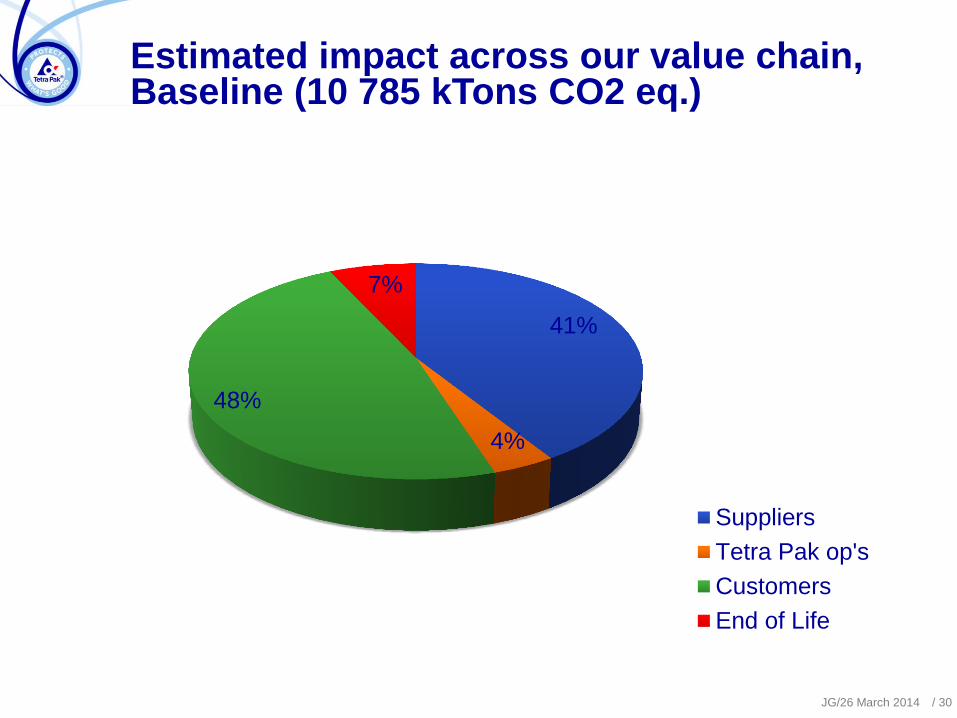
Estimated impact across our value chain, Baseline (10 785 kTons CO2 eq.)
41%
4%
48%
7%
Suppliers
Tetra Pak op's
Customers
End of Life
JG/26 March 2014 / 30
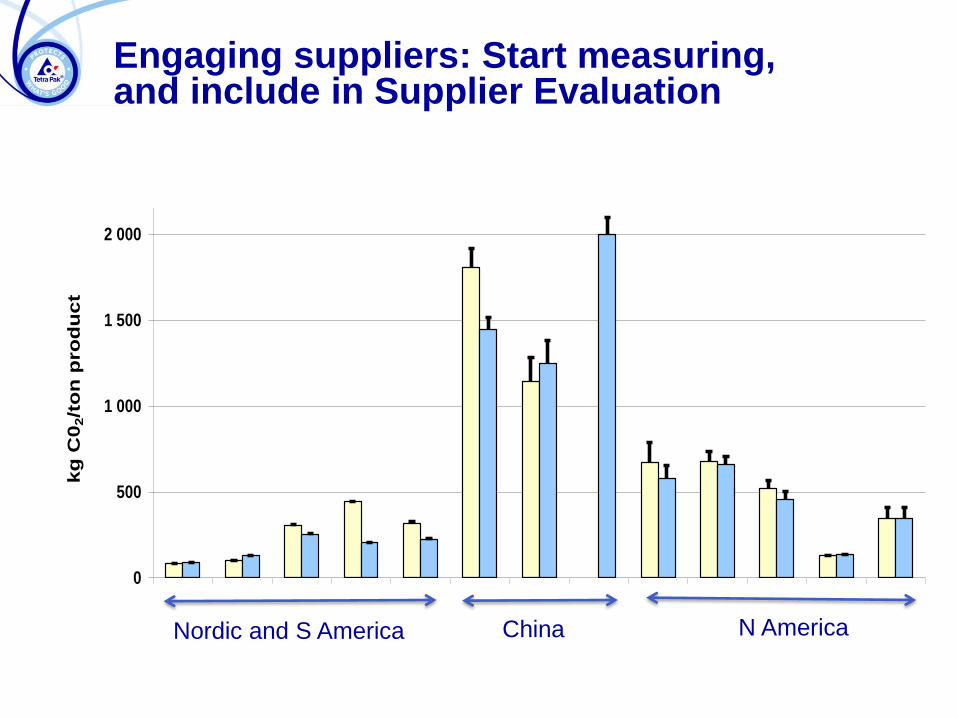
Engaging suppliers: Start measuring, and include in Supplier Evaluation
CO2 emission from suppliers
0
500
1 000
1 500
2 000
Kors
näs
Gäv
le
Kors
näs
Frö
vi
Sto
ra E
nso
Tainio
nko
ski
Sto
ra E
nso
Sko
ghall
Klabin
IP S
veto
gors
k
IP A
ugust
a
IP C
hin
a
Mea
dW
estv
aco E
vadale
Eve
rgre
en
Wey
erhae
use
r
Biller
ud
Potla
tch
kg
C0
2/t
on
pro
du
ct
2005 2010
T=extra emissions
due to higher
grammage than
benchmark
Nordic and S America China N America
What is needed to make it happen?
Buy less – innovation at Tetra Pak and at suppliers
Engage suppliers to improve their performance
Optimise supplier mix/volumes
But……Many paradoxes and dilemmas to work on − Shall we buy paperboard in China and USA?
− How can we get big polymer companies interested?
− Is the aluminium industry interested?
JG/26 March 2014 / 32
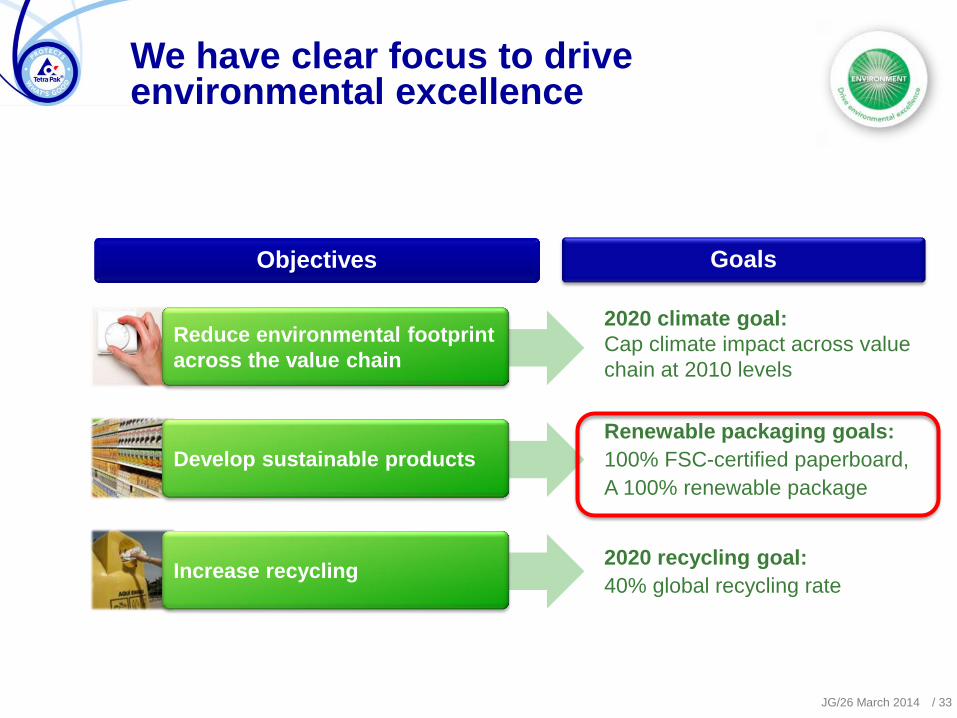
We have clear focus to drive environmental excellence
Reduce environmental footprint
across the value chain
Develop sustainable products
Increase recycling
Objectives Goals Objectives
2020 climate goal:
Cap climate impact across value
chain at 2010 levels
Renewable packaging goals:
100% FSC-certified paperboard,
A 100% renewable package
2020 recycling goal:
40% global recycling rate
JG/26 March 2014 / 33
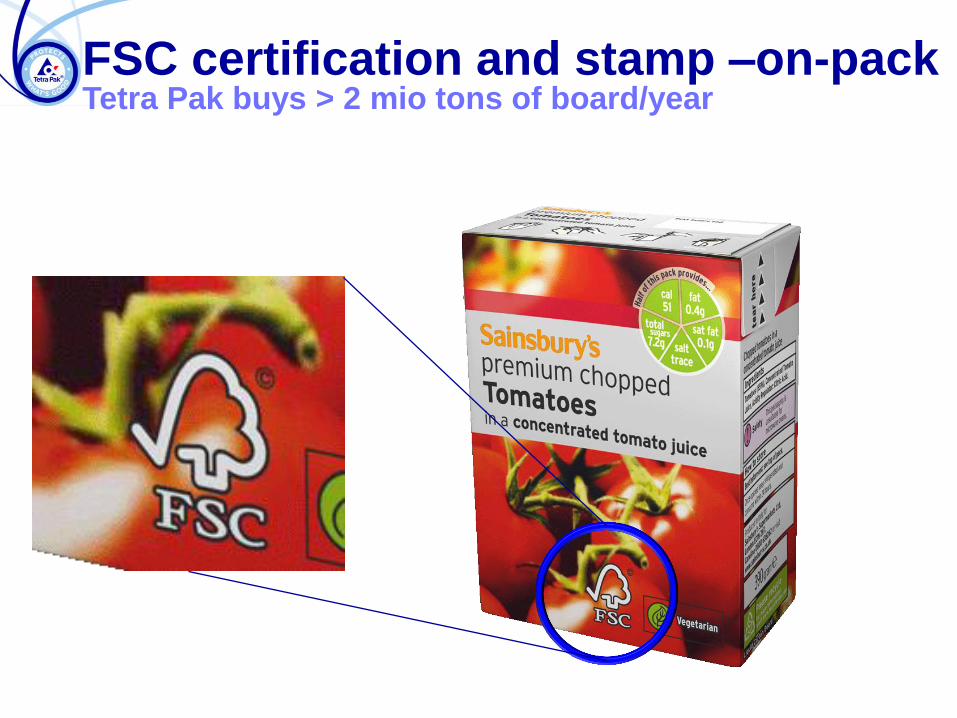
FSC certification and stamp –on-pack Tetra Pak buys > 2 mio tons of board/year
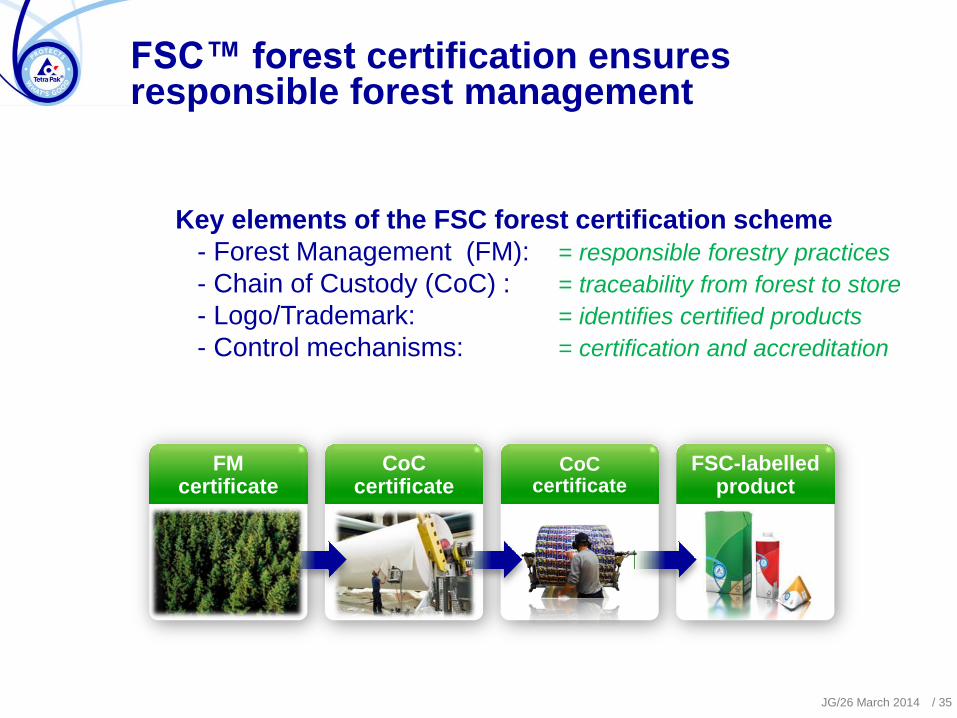
FSC™ forest certification ensures responsible forest management
Key elements of the FSC forest certification scheme
- Forest Management (FM): = responsible forestry practices
- Chain of Custody (CoC) : = traceability from forest to store
- Logo/Trademark: = identifies certified products
- Control mechanisms: = certification and accreditation
FM certificate
CoC certificate
CoC certificate
FSC-labelled product
JG/26 March 2014 / 35
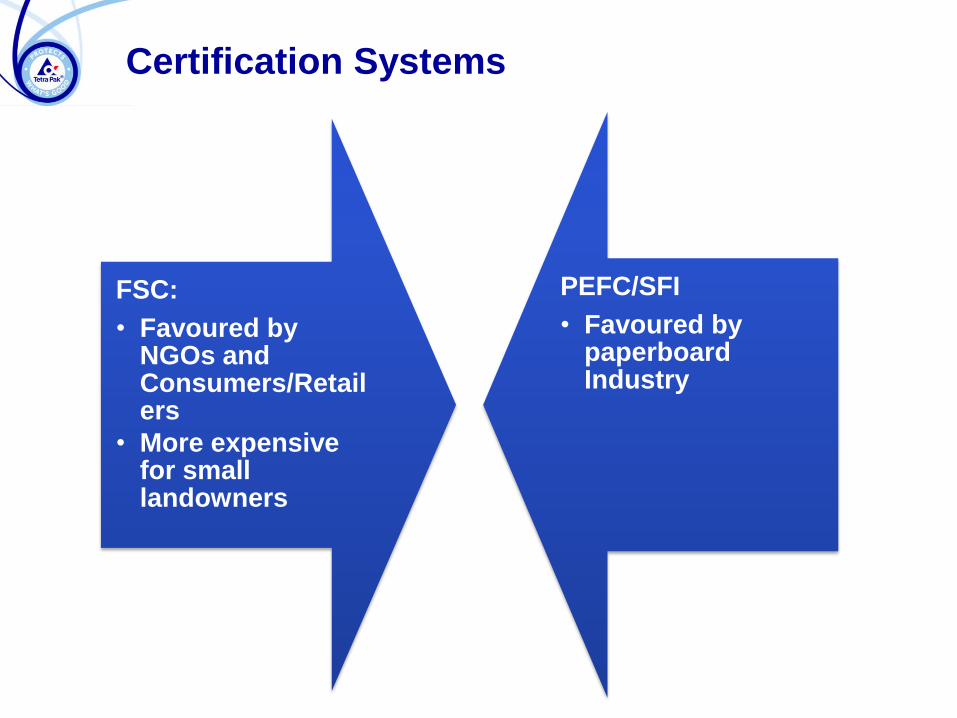
Certification Systems
FSC:
• Favoured by NGOs and Consumers/Retailers
• More expensive for small landowners
PEFC/SFI
• Favoured by paperboard Industry
JG/26 March 2014
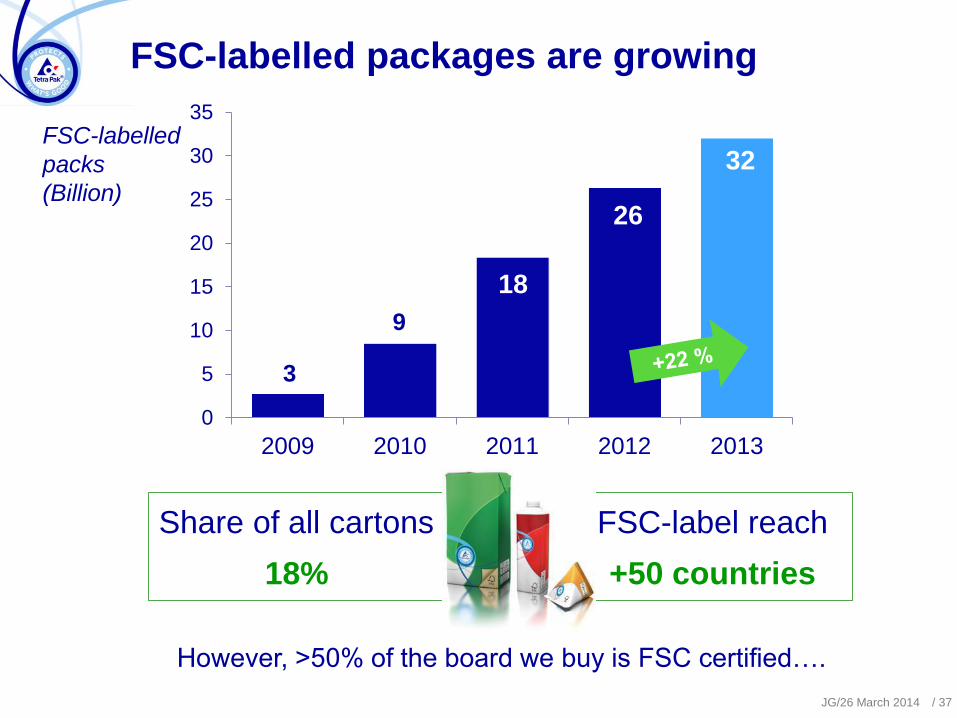
3
9
18
26
32
0
5
10
15
20
25
30
35
2009 2010 2011 2012 2013
FSC-labelled
packs
(Billion)
FSC-labelled packages are growing
Share of all cartons
18%
FSC-label reach
+50 countries
/ 37
However, >50% of the board we buy is FSC certified….
JG/26 March 2014 / 38
What made it happen?
We communicated our 100% ambition
We paid an upcharge to some suppliers in the beginning
We bought as much as we could
Dilemmas:
Industry preferences
North America unwillingness to embrace FSC
Internal Chain of Custody admin system/forecasting
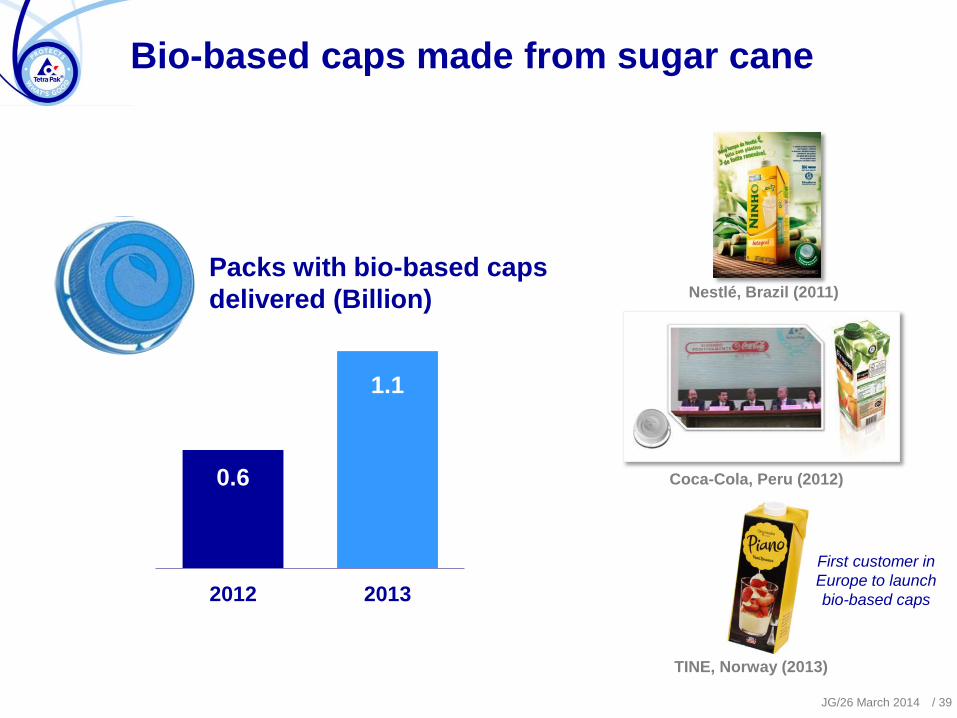
Bio-based caps made from sugar cane
Nestlé, Brazil (2011)
Packs with bio-based caps
delivered (Billion)
0.6
1.1
2012 2013
Coca-Cola, Peru (2012)
First customer in
Europe to launch
bio-based caps
TINE, Norway (2013)
JG/26 March 2014 / 39
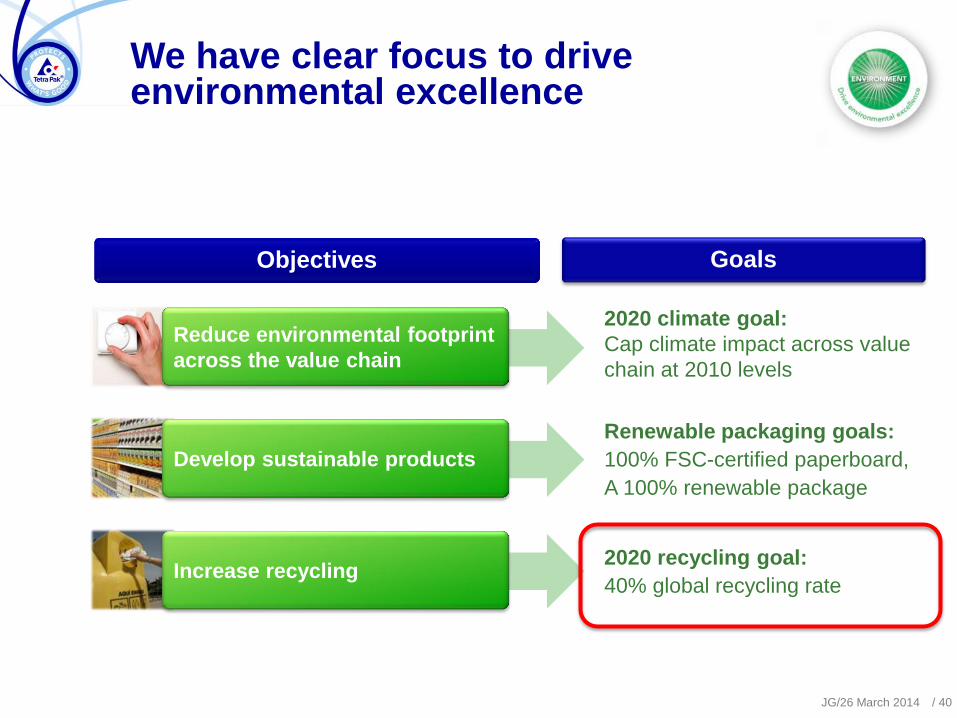
We have clear focus to drive environmental excellence
Reduce environmental footprint
across the value chain
Develop sustainable products
Increase recycling
Objectives Goals Objectives
2020 climate goal:
Cap climate impact across value
chain at 2010 levels
Renewable packaging goals:
100% FSC-certified paperboard,
A 100% renewable package
2020 recycling goal:
40% global recycling rate
JG/26 March 2014 / 40
JG/26 March 2014
Recycling is not our own business…
Market …but it’s our business to make recycling work
/ 41
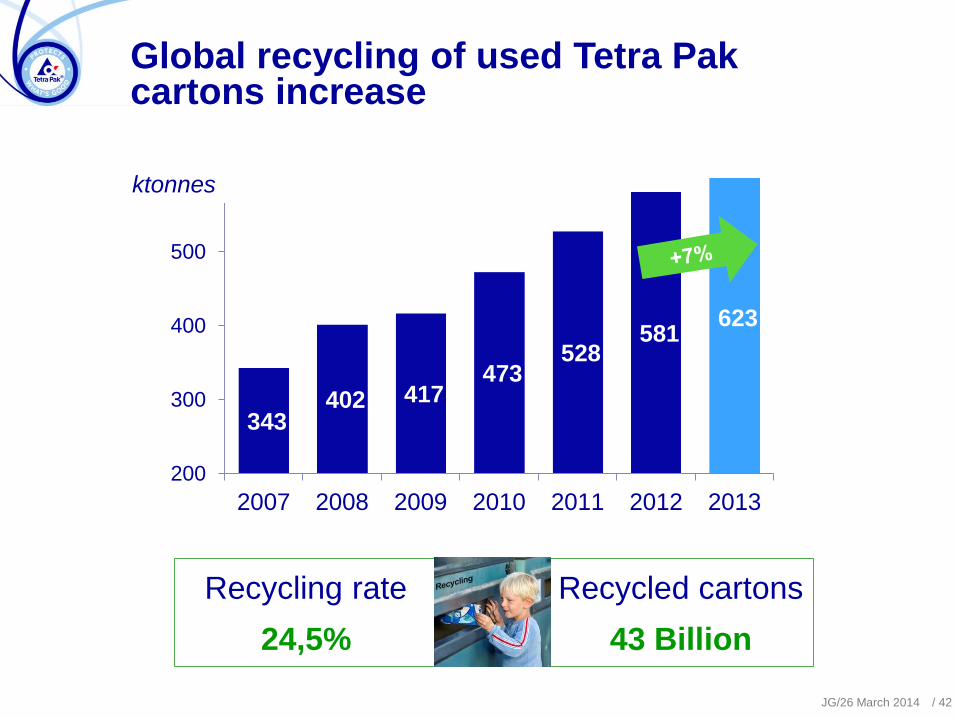
343 402 417
473 528
581 623
200
300
400
500
600
2007 2008 2009 2010 2011 2012 2013
ktonnes
Global recycling of used Tetra Pak cartons increase
Recycling rate
24,5%
Recycled cartons
43 Billion
JG/26 March 2014 / 42
Sustainability for Tetra Pak
Environmental
Economical
Social Responsibility
Customer focus & Long-Term
View
Symmetry & Balance
Trust & Mutual Advantage
Integrity & Respect
Openness & Responsiveness
Supplier Relation Cornerstones The Values
Economic sustainability
Be the best Customer
Mandatory procedure of how to manage Strategic Suppliers,
with the aim to have a long term relation
Short and medium term risk management
Risk Management
• Yearly process
• 6-weekly process to get early warnings
Assisting a supplier early is always cheaper
than doing it late – or too late
Sustainability for Tetra Pak
Environmental
Economical
Social Responsibility
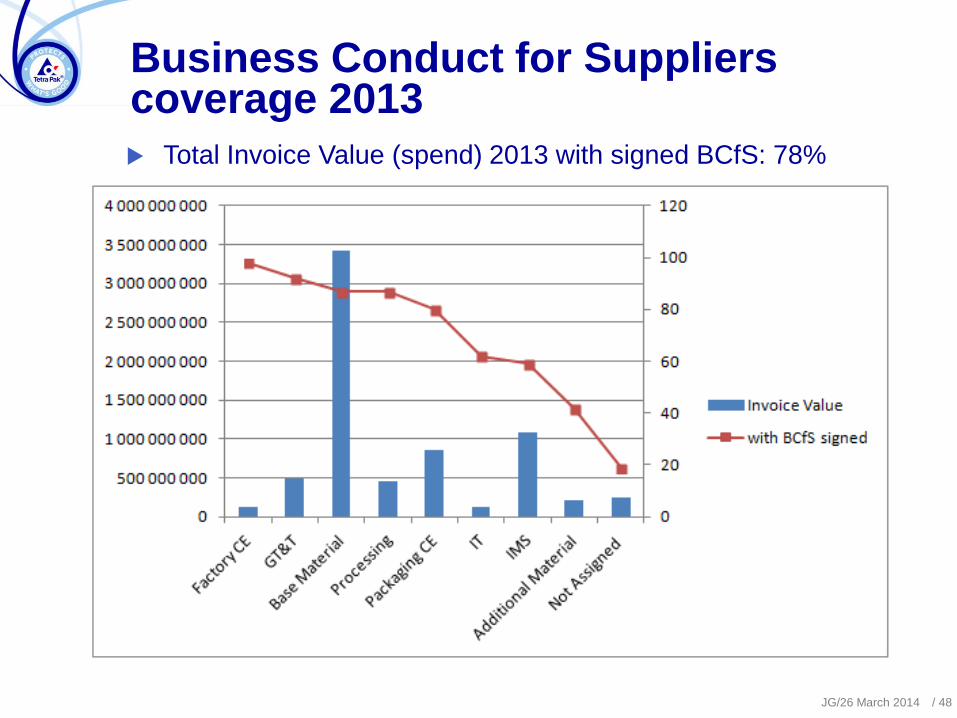
Business Conduct for Suppliers coverage 2013
Total Invoice Value (spend) 2013 with signed BCfS: 78%
JG/26 March 2014 / 48
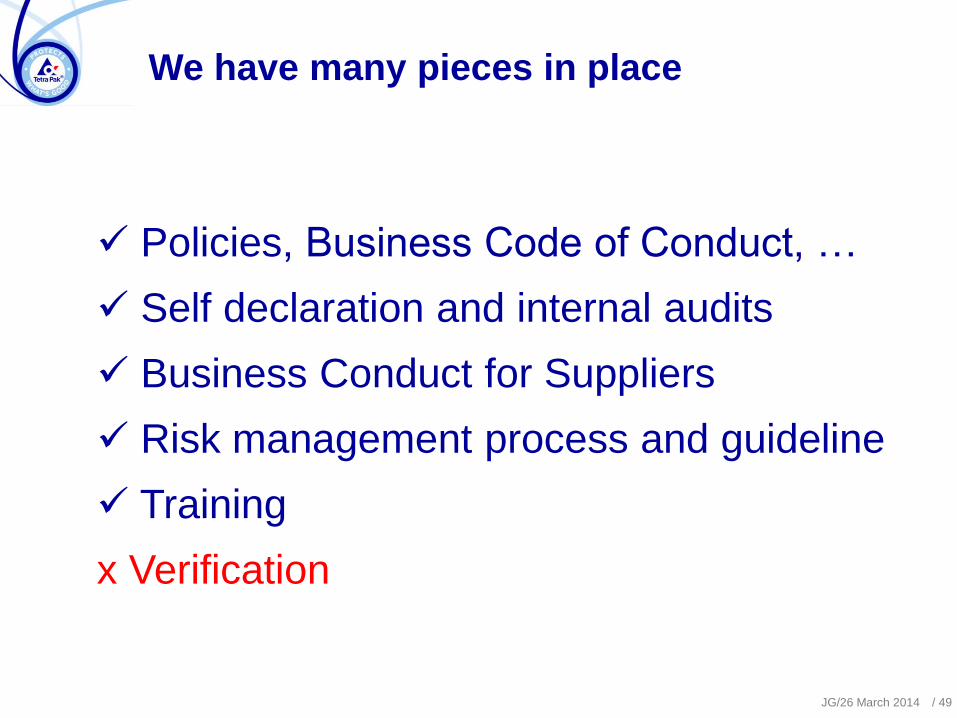
We have many pieces in place
Policies, Business Code of Conduct, …
Self declaration and internal audits
Business Conduct for Suppliers
Risk management process and guideline
Training
x Verification
JG/26 March 2014 / 49
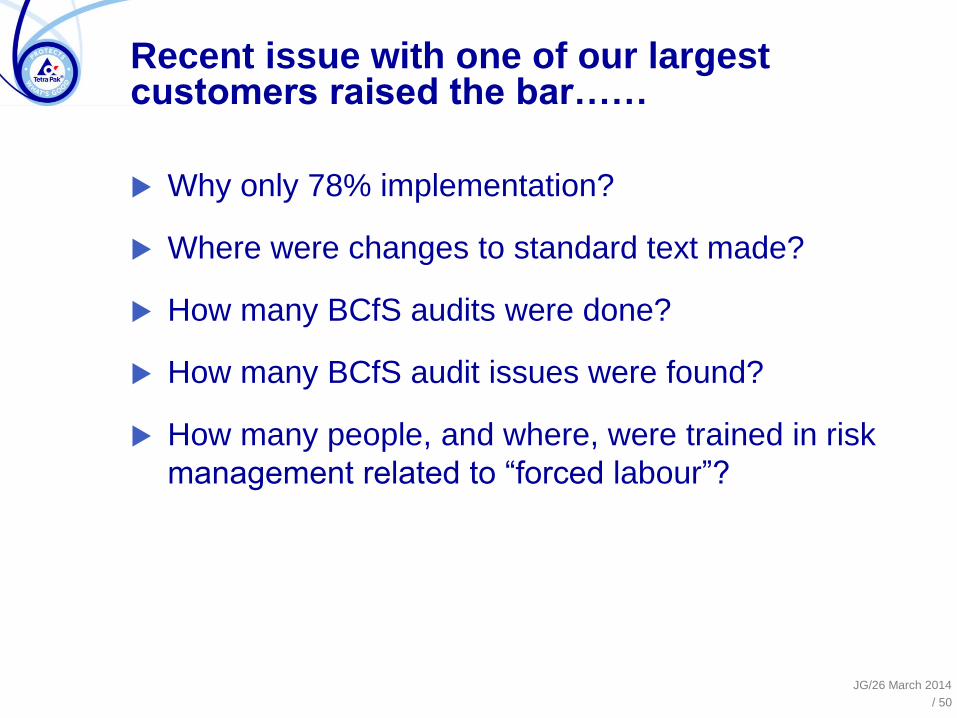
Recent issue with one of our largest customers raised the bar……
Why only 78% implementation?
Where were changes to standard text made?
How many BCfS audits were done?
How many BCfS audit issues were found?
How many people, and where, were trained in risk
management related to “forced labour”?
JG/26 March 2014
/ 50
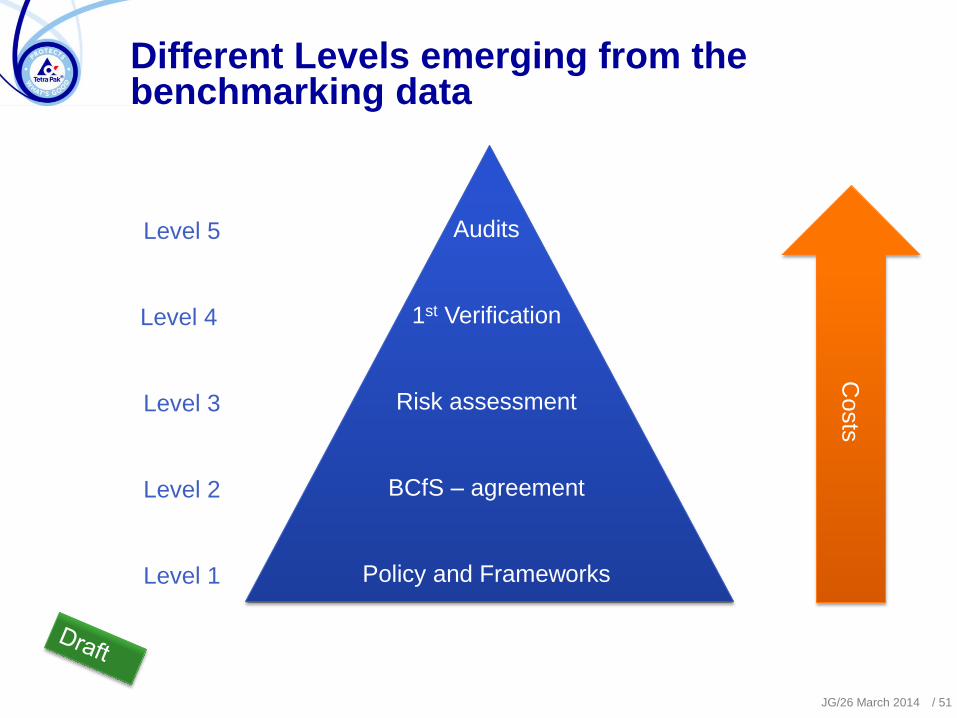
Different Levels emerging from the benchmarking data
JG/26 March 2014 / 51
Audits
1st Verification
Risk assessment
BCfS – agreement
Policy and Frameworks
Level 5
Level 4
Level 3
Level 2
Level 1
Costs
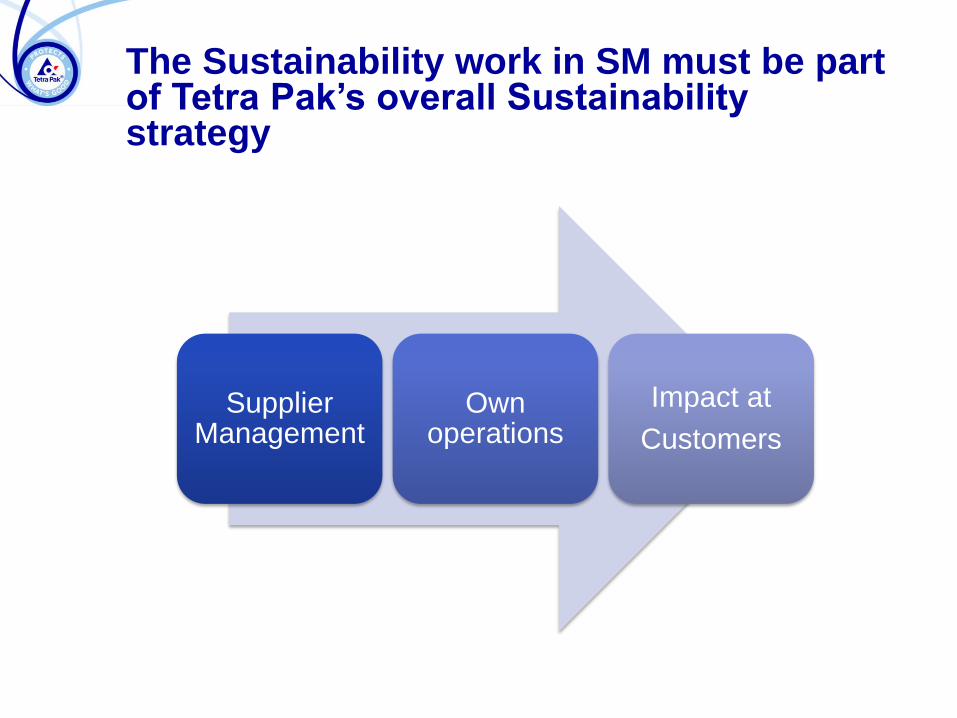
The Sustainability work in SM must be part of Tetra Pak’s overall Sustainability strategy
Supplier Management
Own operations
Impact at
Customers
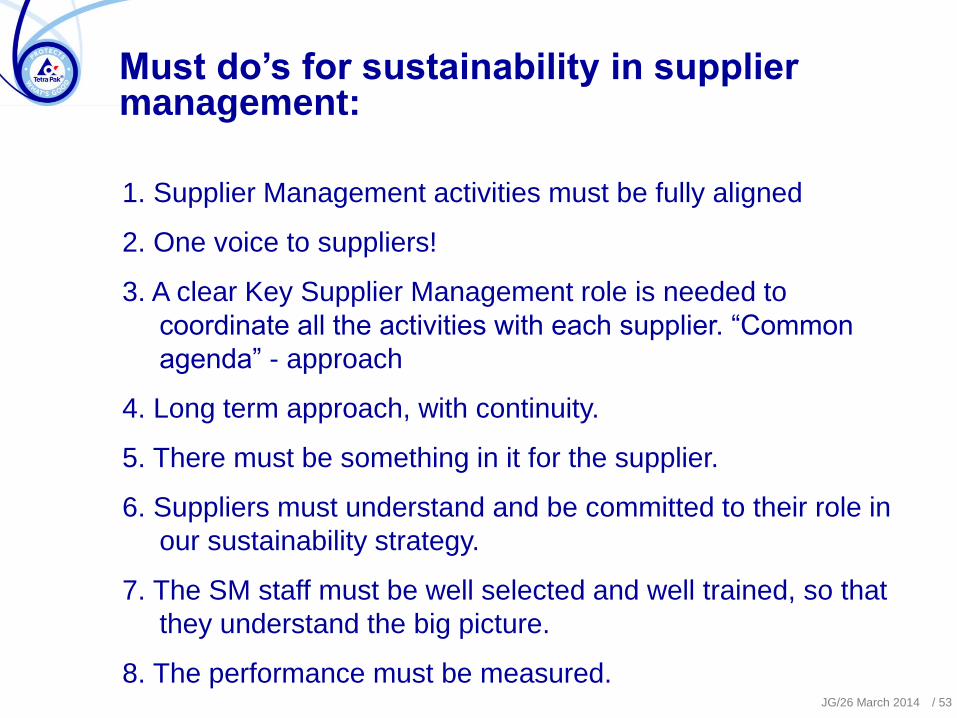
Must do’s for sustainability in supplier management:
1. Supplier Management activities must be fully aligned
2. One voice to suppliers!
3. A clear Key Supplier Management role is needed to
coordinate all the activities with each supplier. “Common
agenda” - approach
4. Long term approach, with continuity.
5. There must be something in it for the supplier.
6. Suppliers must understand and be committed to their role in
our sustainability strategy.
7. The SM staff must be well selected and well trained, so that
they understand the big picture.
8. The performance must be measured.
JG/26 March 2014 / 53
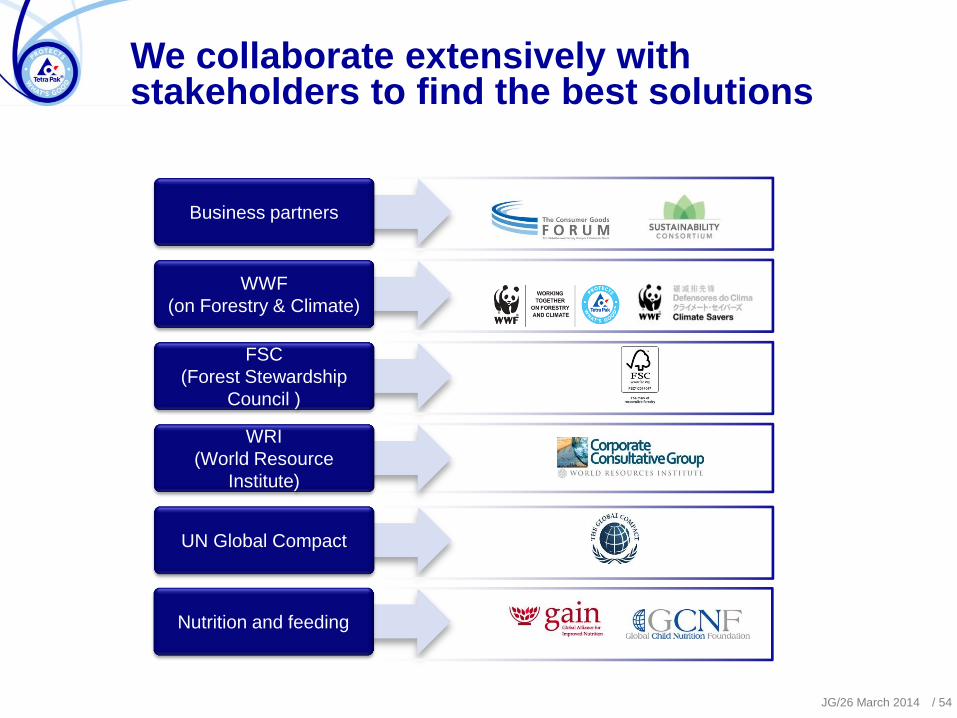
We collaborate extensively with stakeholders to find the best solutions
Business partners
FSC
(Forest Stewardship
Council )
UN Global Compact
WWF
(on Forestry & Climate)
WRI
(World Resource
Institute)
Nutrition and feeding
JG/26 March 2014 / 54
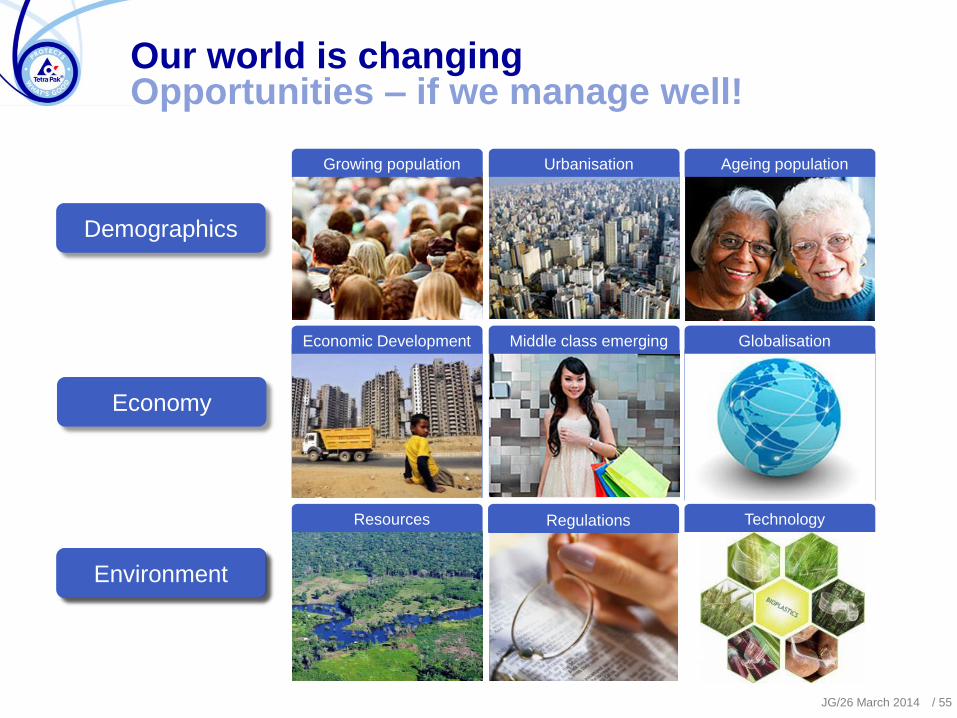
Our world is changing Opportunities – if we manage well!
Growing population Urbanisation Ageing population
Demographics
Environment
Sustainability
Globalisation Middle class emerging
Economy
Economic Development
Environment
Regulations Technology Resources
JG/26 March 2014 / 55
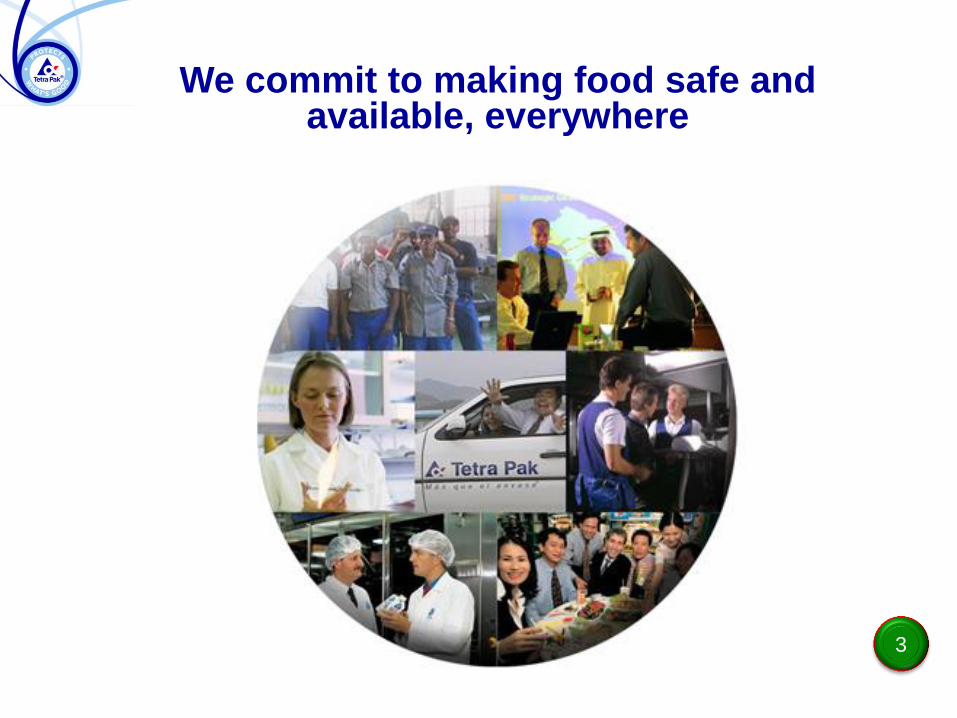
We commit to making food safe and available, everywhere
3


![Supplier Sustainability Guidelines and Expectationssuppliers.safeway.com/docs/supplier_sustainability...Supplier Sustainability Expectations [7] 2/18/2020 Where feasible and applicable](https://img.pdfslide.net/doc/110x75/5f3f28a287ed1c305f46070b/supplier-sustainability-guidelines-and-e-supplier-sustainability-expectations.jpg)


![Supplier sustainability assess[1]](https://img.pdfslide.net/doc/110x75/5551cee6b4c905922b8b4f69/supplier-sustainability-assess1.jpg)