Embed Size (px)
Citation preview

Energies 2012, 5, 4870-4891; doi:10.3390/en5114870
energies ISSN 1996-1073
www.mdpi.com/journal/energies
Article
Sustainability Impact Assessment on the Production and Use of Different Wood and Fossil Fuels Employed for Energy Production in North Karelia, Finland
Michael den Herder 1,*, Marja Kolström 1,2, Marcus Lindner 1, Tommi Suominen 1,
Diana Tuomasjukka 1 and Matias Pekkanen 1,3
1 European Forest Institute, Torikatu 34, Joensuu FI-80100, Finland;
E-Mails: [email protected] (M.L.); [email protected] (T.S.);
[email protected] (D.T.) 2 Current address: Mekrijärvi Research Station, Faculty of Science and Forestry, University of
Eastern Finland, Yliopistontie 4, Ilomantsi FI-82900, Finland; E-Mail: [email protected] 3 Current address: Indufor Oy, Töölönkatu 11A, Helsinki FI-00100, Finland;
E-Mail: [email protected]
* Author to whom correspondence should be addressed; E-Mail: [email protected];
Tel.: +358-10-773-4343; Fax: +358-10-773-4377.
Received: 6 September 2012; in revised form: 2 November 2012 / Accepted: 13 November 2012 /
Published: 21 November 2012
Abstract: The utilization rate of woody biomass in eastern Finland is high and expected to
increase further in the near future as set out in several regional, national and European
policies and strategies. The aim of this study was to assess the sustainability impacts of
changes in fuel consumption patterns. We investigated fossil and woody biomass-based
energy production chains in the region of North Karelia, focusing on some economic,
environmental and social indicators. Indicators were selected based on stakeholder
preferences and evaluated using the Tool for Sustainability Impact Assessment (ToSIA).
The analysis was based on representative values from National Forest Inventory data,
scientific publications, national and regional statistics, databases, published policy targets
and expert opinion. From the results it became evident that shifting from fossil to
wood-based energy production implies some trade-offs. Replacing oil with woody biomass
in energy production would increase the local value added remaining in the region, create
employment opportunities and would reduce total GHG emissions. However, firewood,
wood chips from small-diameter trees from early thinning and wood pellets have high
production costs. Moreover, large greenhouse gas emission resulted from wood pellet
OPEN ACCESS

Energies 2012, 5 4871
production. The case study generated valuable reference data for future sustainability
assessments and demonstrated the usefulness of ToSIA as a tool presenting existing
knowledge on sustainability impacts of alternative energy supply chains to inform
decision making.
Keywords: heavy fuel oil; light heating oil; woody biomass; energy production;
sustainability indicators; decision support systems; regional decision making; social;
economic and environmental indicators
1. Introduction
In Finland, about 28% of the total energy consumption comes from renewable sources of which
woody biomass (with 21% of the total energy consumption) is currently the most important source of
renewable energy [1]. The share of woody biomass in the region of North Karelia in eastern Finland is
even higher than the national average, and has, with 34%, one of the highest utilization rates of woody
biomass in heat and power generation in Europe [2]. Moreover, utilization of woody biomass is
expected to increase in the future as set out in the Finnish Long-term Climate and Energy Strategy [3]
and by local policy [4]. The main drivers to this development are increasing prices of heating oil and
the political will to base regional development on regional natural resources [5].
In the North Karelian Forest Programme and the Climate and Energy Programme of North Karelia a
large potential increase in the use of wood chips in energy generation is envisioned, where the use of
wood chips will about triple [4,6]. The most significant increase in energy wood harvest is expected to
come for a large part from small-diameter trees harvested by thinning of young stands. Harvest
residues (tops and branches) and stumps are also increasingly utilized in wood chip production.
Small-diameter trees, harvest residues and stumps are renewable resources. However, this does not
necessarily mean that their use is sustainable.
During the past decades, Life Cycle Analysis (LCA) has been developed and has been the most
widely applied approach for studying environmental impacts of a broad range of production chains [7,8].
However, LCA studies are usually restricted to the environmental impacts of production chains and do
not necessarily take into account the social and economic dimensions of sustainability. Sustainability
impact assessment (SIA) evaluates how changes like different policies, land-use management or
alternative scenarios for future economic development affect the sustainability of a sector and provides
information for decision makers on which decisions can be based [9–11]. A review of existing
assessment methods was presented by Päivinen et al. [11] and this study also presented a new approach
to assess sustainability impacts of alternative production chains of the forest sector. The approach
describes the forest sector as a set of processes by which forest resources are used to produce biomass
which is then converted to products, while at the same time delivering other ecosystem services. In
their approach [11], each process is characterized by a set of indicators, describing the environmental,
social and economic dimensions of sustainable development. In this paper we investigate fossil and
wood-based energy production chains in North Karelia, focusing on some economic, environmental
and social indicators. This is important since in the near future, the use of forest biomass for energy

Energies 2012, 5 4872
production is expected to gain an even greater share compared to today and the use of oil is expected to
decrease. The Climate Change North Karelia project proposed for the region a 2020 target situation,
where the transition from fossil fuels to renewable energy in heating and electricity production has
taken place, with municipalities and cities leading the way. Greenhouse gas emissions have been reduced
by 20% from the 1990-level, with 20% of the traffic fuels coming from a renewable origin [12].
The overall aim of this case study is to inform land management and policy decision makers on
sustainability impacts of changes in fuel consumption patterns. In order to get a broad picture of the
implications of changing from fossil to renewable fuel sources, we have made an analysis of several
heat and energy production chains. To get an idea where the biggest changes are about to take place
and where the biggest benefits can be obtained, we have studied these production chains at the process
level. In that way, similar processes in different production chains can be compared. In this particular
study we focus on utilization of forests resources in North Karelia with special emphasis on the use of
firewood, wood chips and pellets in heat and power generation. An oil production chain was constructed
focusing on the production and use of heavy fuel oil and light heating oil in order to compare different
processes related to energy production from fossil and renewable sources. Different economic, social
and ecological indicators were selected through stakeholder involvement during the Northern ToSIA
project [13] and evaluated using ToSIA, the Tool for Sustainability Impact Assessment [14,15].
2. Material and Methods
2.1. Forest Wood and Oil Production Chain
Three forest wood chains and two oil production chains were compared in this study (Figure 1),
representing a sequence of processes taking place during bioenergy and oil production and its use for
energy generation.
Energy Wood Chain: This chain includes thinning of small-diameter trees and extracting of harvest
residues and stumps from final felling for the production of wood chips which are used for heat and
electricity production at district heating and power plants.
Firewood Chain: This chain includes thinning of small diameter trees which are processed and sold
by local forest entrepreneurs as commercial firewood which is used for heating of small-sized
dwellings (e.g., farms, private apartments). A large part of the firewood is collected and processed by
private-forest owners themselves.
Pellet chain: Pellet production from sawdust and cutter shavings from the sawmilling process.
Pellets are used for heating residential homes and other small private and public buildings.
Oil Chain: This chain includes extraction, transportation and refining of crude oil to heavy fuel oil
and light heating oil. Heavy fuel oil is used for heat and electricity production in district heating and
power plants and light heating oil is generally used to heat residential homes, farms, schools and other
private and public buildings which are not connected to a district heating network.
Energies 2012, 5 4873
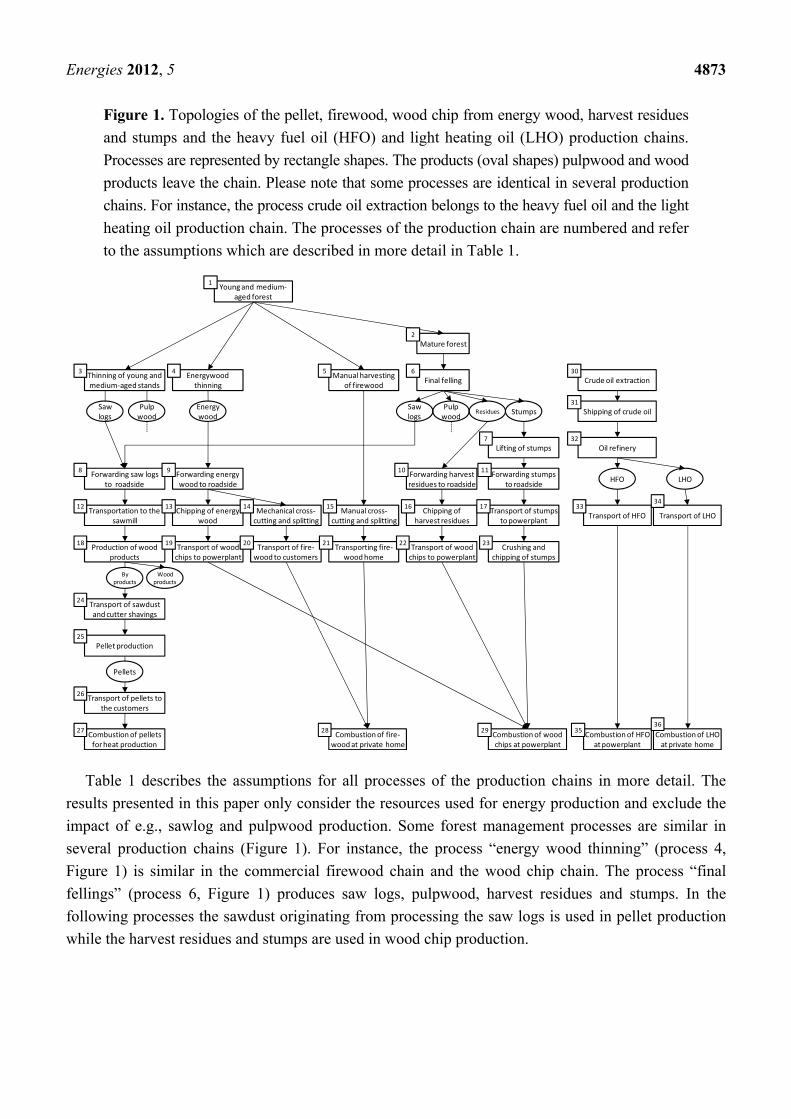
Figure 1. Topologies of the pellet, firewood, wood chip from energy wood, harvest residues
and stumps and the heavy fuel oil (HFO) and light heating oil (LHO) production chains.
Processes are represented by rectangle shapes. The products (oval shapes) pulpwood and wood
products leave the chain. Please note that some processes are identical in several production
chains. For instance, the process crude oil extraction belongs to the heavy fuel oil and the light
heating oil production chain. The processes of the production chain are numbered and refer
to the assumptions which are described in more detail in Table 1.
Table 1 describes the assumptions for all processes of the production chains in more detail. The
results presented in this paper only consider the resources used for energy production and exclude the
impact of e.g., sawlog and pulpwood production. Some forest management processes are similar in
several production chains (Figure 1). For instance, the process “energy wood thinning” (process 4,
Figure 1) is similar in the commercial firewood chain and the wood chip chain. The process “final
fellings” (process 6, Figure 1) produces saw logs, pulpwood, harvest residues and stumps. In the
following processes the sawdust originating from processing the saw logs is used in pellet production
while the harvest residues and stumps are used in wood chip production.
Transport of woodchips to powerplant
Young and medium‐aged forest
Mature forest
Final felling
1
Energywoodthinning
Thinning of young and medium‐aged stands
Pulpwood
Sawlogs
Energy wood
Forwarding saw logsto roadside
Forwarding energywood to roadside
Transportation to the sawmill
Production of woodproducts
Wood products
Transport of sawdustand cutter shavings
Pellet production
Transport of pellets to the customers
Combustionof pelletsfor heat production
By products
Pellets
Chipping of energywood
Transport of woodchips to powerplant
Combustionof woodchips at powerplant
Sawlogs
Pulpwood
Residues Stumps
Lifting of stumps
Forwarding harvestresidues to roadside
Forwarding stumpsto roadside
Chipping of harvest residues
Crushing and chipping of stumps
Transport of stumpsto powerplant
Mechanical cross‐cutting and splitting
Manual cross‐cutting and splitting
Transport of fire‐wood to customers
Transporting fire‐woodhome
Combustionof fire‐woodat private home
Manual harvestingof firewood
Crude oil extraction
Shipping of crude oil
Oil refinery
Transport of HFO
HFO LHO
Transport of LHO
Combustionof HFO at powerplant
Combustionof LHO at private home
2018
171615141312
11109
7
8
306543
2
3635
3433
32
31
292827
26
25
24
23222119

Energies 2012, 5 4874
Table 1. Assumption for all processes of the bioenergy and oil production chains.
Processes Assumptions
1 Young- and medium-aged forest includes open regeneration areas, young seedling stands, advanced seedling stands, young thinning stands and advanced thinning stands. In 2005, the area of young- and medium-aged forest was 1,271,000 ha [16] with a standing volume of 127 million m3.
2 Mature forest is defined here as mature forest and also includes the categories seed tree stands and shelterwood stands as mature trees are the main component of these stands. In 2005, the area of mature forest was 144,000 ha [16] with a standing volume of 33.6 million m3.
3 Includes 1st, 2nd and 3rd thinning by machine. Harvested trees are used as pulpwood (±90%) or sawlogs (±10%). In 2005, 1.536 million m3 of roundwood were harvested during thinning [6].
4 Whole trees are harvested as energy wood by machine. In 2005, 296,000 m3 were harvested as energy wood [16].
5 Motor-manual harvesting of firewood with a chainsaw by private-forest owner. 6 Clear-cut harvesting of mature stands. In 2005, 3.121 million m3 of roundwood were harvested in
final fellings [6]. 7 Stumps are lifted by excavator about one year after clear-cutting. In 2005, about 21,250 m3 of stumps
were extracted [17]. 8 Saw logs are forwarded to the roadside. 9 Whole trees are forwarded to the roadside. Average forwarding distance is 220 m. Data based on
national averages from Kariniemi et al. [18]. 10 Harvest residues are collected and forwarded to the roadside. Average forwarding distance is 250 m.
Data based on national averages from Kariniemi et al. [18]. 11 Forwarding of stumps to the roadside. Average forwarding distance was 250 m and about 60 m3/ha
of stumps were harvested [19]. 12 Transportation of saw logs to the saw mill by 60 t timber truck. 13 Road-side chipping of small-diameter trees from thinnings. Trees are chipped by a tractor-driven or
truck-mounted chipper and blown into 110 m3 trailer-truck. Forest chip suppliers can apply for KEMERA-chipping subsidy. Data based on national averages from Kariniemi et al. [18].
14 Mechanical cross-cutting and splitting of firewood using a Palax Combi (Ylistaron terästakomo Oy, Ylistaro, Finland) firewood-processor by a forest entrepreneur. Data based on average productivity [20].
15 Motor-manual cross-cutting with a chainsaw and splitting of firewood with an axe by private forest-owner.
16 Road-side chipping of harvest residues. Trees are chipped by a tractor-driven or truck-mounted chipper and blown into 110 m3 trailer-truck. Data based on national averages from Kariniemi et al. [18].
17 Stumps are transported to the power plant by a 110 m3 trailer-truck. Data based on national averages from Kariniemi et al. [18].
18 The production of wood products includes the sawmilling and the production of plywood. It is assumed that the conversion of 2.3 m3 of timber produces 1 m3 of solid wood products and 1.3 m3 of solid by-products such as sawdust and cutter-shavings.
19 Transport of woodchips to the power plant by 110 m3 trailer-truck. Average distance to the power plant is 40 km. The moisture content of wood chips is on average 38% for small plants and 48% for large plants [21]. Data based on national averages from Kariniemi et al. [18].
20 Delivery of firewood sold by forest entrepreneur to private households. Generally firewood is transported to private houses by small truck or farm tractor/pick-up truck trailer combination. Average distance is set at 14 km and the average load is 10 m3 loose.

Energies 2012, 5 4875
Table 1. Cont.
Processes Assumptions
21 Firewood is transported home by private-person by private car with a trailer. Average distance is 14 km and the average load is 1.4 m3 loose.
22 Wood chips from harvest residues are transported to the power plant by a 110 m3 trailer truck. Average distance to the power plant is 40 km. The moisture content of wood chips is on average 38% for small plants and 48% for large plants [22]. Data based on national averages from Kariniemi et al. [18].
23 Stumps and roots are transported to a terminal or directly to the power plant were they are crushed or chipped by large movable or stationary crushers/chippers. Annual productivity of a terminal chipper for stumps is set at 80,800 m3/year [23].
24 Sawdust and cutter shavings are transported from the saw mill to the pellet mill in North Karelia. Average transport distance is 75 km.
25 Pellet production includes many processes such as dying the raw material, grinding the raw material, compressing pellets and screening and cooling of the wood pellets. The moisture content of the sawdust is reduced from approximately 50% to 10% [24].
26 Pellets are transported from the pellet mill to the customers. Average transport distance is 50 km and average load is 5 t [25].
27 Pellets are combusted for heat production in private houses or public buildings. 28 Firewood is combusted in private houses for heat production. 29 Wood chips are combusted at the power plant for heat production. 30 Overseas extraction of crude oil. 31 Transportation of crude oil by large tanker ship. About 95% of the crude oil imported to Finland
comes from Russia and about 5% from Norway [26]. Transportation distance from Norway is set at 2000 km and the transportation distance from Russia at 200 km.
32 Crude oil is processed at an industrial process plant and refined into more useful petroleum products, such as gasoline, diesel fuel, asphalt base, heating oil, kerosene and liquefied petroleum gas. Only emissions and costs related to the production of light heating oil and heavy fuel oil are taken into account.
33 Heavy fuel oil is transported by 60 t tanker-truck from the refinery to the power plant. Transportation distance is set at 320 km.
34 Light heating oil is transported by 60 t tanker-truck from the refinery to the oil deposit and from there distributed to the customers. Total transportation distance is set at 347 km.
35 Heavy fuel oil is combusted at the power plant for energy generation. 36 Light heating oil is combusted at private houses and other private and public buildings.
2.2. ToSIA Tool Description
In our assessment we used the Tool for Sustainability Impact Assessment (ToSIA version 2.0) which
was developed for the EFORWOOD project [27] and later expanded in the Northern ToSIA project [13].
In our assessment the whole value chain of different products of an Energy Wood, Firewood and Oil Chain
in North Karelia was evaluated, from planting trees and extracting oil to the end use of products. ToSIA
assesses sustainability impact by quantifying changes in the material flow which are linked to the processes
of a production chain. In this way, comparisons can be made of changes inside production chains, between
different chains and to future scenarios. A more detailed description of the ToSIA tool, the methodology
and its possible applications has been given by Lindner et al. [15]. Each process of a production chain has
an input and an output product. For instance, in the Energy Wood Chain the process “chipping of harvest

Energies 2012, 5 4876
residues” has “harvest residues” as input product and “wood chips from harvest residues” as an output
product. In a process, an area, a material, substance or product changes its appearance or moves to another
location. Processes of a simple Energy Wood Chain might for example include planting trees, tree growth,
harvesting, forwarding, chipping, transportation and heat production. The start of the Energy Wood,
Firewood and Pellet Chain was set to young and medium aged forest and the Oil Chain started with oil
extraction. All three chains end with energy consumption in private households. ToSIA calculates the
material flow through the processes of the production chains and combines these calculated material flows
process-by-process with sustainability indicators reported per unit of material flow, e.g., production costs
in €/m3. Conversion factors are used when the unit of the material flow changes, for instance from cubic
meters of wood chips to kWh in the combustion process at the power plant. In the production chains
presented in this paper, ToSIA tracks the (organic) carbon in products, and as such each product should
at least have a conversion factor to tons of carbon. In the Heavy Fuel Oil Chain fossil carbon is used
instead. Water may evaporate, other materials may be appended to a wood-based product, but all additions
or removals of carbon from products must be accounted for. Conversion factors for wood, wood-based
biofuel and heavy fuel oil were obtained from Alakangas [28].
2.3. Data Collection
The data on forest resources, harvested round-wood volumes, wood chip and firewood consumption
for the year 2005 were taken from the Finnish Statistical Yearbooks of Forestry [16,17] (Table 2).
Table 2. General data on forest resources, wood products and wood-based energy and oil
consumption in North Karelia in 2005.
Process Amount Unit Forest resources
Area of young- and medium-aged forest 1,271,000 ha Area of mature forest 144,000 ha Standing volume young and medium-aged forest 130,508,000 m3 Standing volume mature forest 34,596,000 m3
Fellings Intermediate fellings 1,536,009 m3 Regeneration fellings 3,205,998 m3
Products Sawlogs 1,991,999 m3 Pulpwood 2,369,006 m3 Energy wood (small-diameter trees) 296,000 m3 Woodchips 170,968 m3 Wood pellets 36,373 t Firewood 294,000 m3
Energy generation Wood chips 376 GWh Wood pellets 173 GWh Firewood 544 GWh Heavy fuel oil 708 GWh Light heating oil 365 GWh

Energies 2012, 5 4877
It is estimated that about 294,000 m3 of traditional firewood were used in North Karelia in 2005 [17].
Since the amount of energy wood, stumps and harvest residues removed from the forest was much larger
than what was actually used by the power plants, we assumed that a large proportion of small-sized trees
harvested as energy wood during thinning operations was apparently sold as firewood (±210,000 m3)
by forest entrepreneurs. The remainder (84,000 m3), was estimated to be collected by private forest
owners themselves. Data on heavy fuel oil and light heating oil consumption were taken from the
North Karelian Bio-energy Programme [4] (Table 2).
2.4. Sustainability Indicators
In this study, indicators were selected from the indicator framework which was developed in the
EFORWOOD project [29,30] and in one case, an adaptation of these indicators was requested to suit the
stakeholders’ regional interest (instead of GVA, only the economic impact remaining in the region was of
particular interest as “local value added”). Economic, social and environmental indicators were selected
through stakeholder involvement during working group meetings which were arranged for the North
Karelian Climate and Energy Programme [12]. In this way the stakeholder’s interests and potential
problems could be identified. During meetings with the North Karelian Climate and Energy programme
working group it became clear that the stakeholders, who represented research and education, regional
authorities, NGOs, energy production business, state-run enterprise and corporation of expert services,
were most interested in the following indicators: production costs, local value added, employment and
greenhouse gas emissions (Table 3).
Table 3. Indicators used in the study, their units and definitions.
Indicator Unit Definition
Economic Production costs Euro Labor costs (costs incurred by the employer), energy costs (e.g., fuel
costs), other productive costs (maintenance, general industrial costs, administrative costs, sales expenditures, etc.) and non-productive costs (corporate taxes, capital charges, VAT and other taxes and charges)
Local Value Added Euro Local Value Added is defined the Gross Value Added remaining in North Karelia (imports, exports, product and value which stay in the region). It is calculated as: Local Value Added = consumer price of the finished product − production costs + subsidies
Social Employment Person-years Absolute number (in full-time equivalents per year) which can be
allocated to the particular process Environmental Greenhouse gas emissions from machinery
Kilograms of CO2 equivalent
Emissions from machinery used in energy production calculated as Global Warming Potential (GWP) for 100 years according to the IPCC [31] guidelines.
Greenhouse gas emissions from fuel combustion
Kilograms of CO2 equivalent
Emissions from combustion of fossil and wood-based fuel calculated as Global Warming Potential (GWP) for 100 years according to the IPCC [31] guidelines.

Energies 2012, 5 4878
The analysis was mainly based on collection of representative average values from literature. The
indicator data collected in this paper were mainly from three sources: Scientific publications, regional
and national statistics, databases, published policy targets and expert opinion. A list of the indicators
with references to the source material is presented in Appendix Table A1.
System boundaries for the different chosen indicators were defined individually, because of the
geographical scope of this study. Greenhouse gas emissions are included for all processes of the
studied chains since their effect on climate is on a global scale and not bound to national or regional
borders. Other indicators such as employment or local value added are given a more narrow spatial
definition, and focus in particular on the region of North Karelia. This focus on local impacts of
employment and local value added was one of the stakeholders’ main wishes. Unlike in LCA, we do
not cover production of machinery used in processes, such as harvesting equipment, oil drilling
equipment, the manufacture of trucks or ships or building and maintaining infrastructure such as roads
or shipping lanes, as this is not in the nature of SIA. SIA has clearly defined system boundaries and
only direct impacts of the modeled processes are expressed as indicators reflecting economic,
environmental and social aspects of sustainability. This principle is applied through-out the data
collection and unless otherwise indicated, the indicators collected for the chains will express only the
direct impacts of the process itself.
2.4.1. Production Costs
Production costs are calculated by summing the costs of all processes needed to manufacture the
finished product. Production costs include the price of the raw material, labor, energy, other productive
costs (maintenance, administrative costs) and non-productive costs (e.g., VAT and any other taxes or
charges). Production costs data were obtained from many different sources and more detailed source
information is presented in Appendix Table A1.
2.4.2. Local Value Added
During the preparation of the North Karelian Climate and Energy Programme the work group
participants were interested in the added value which remains in North Karelia, because regional
development is an important aspect in the program. Therefore we used the term “local value added”.
Local value added can in this case be defined as Gross Value Added remaining in North Karelia. For
locally produced fuels such as wood chips, firewood and pellets local value added is calculated as:
Local Value Added = Consumer Price of the Finished Product − Production Costs + Subsidies (1)
For oil products, similarly, local added value was calculated as the value which stays in the area.
Since all oil products in North Karelia are imported from abroad, no production costs are added inside
North Karelia. Therefore, the local added value of oil is the same as the consumer price. The local added
value of oil products can be expressed by a negative value since all oil products are bought from outside
the area and the entire sum paid will leave the area. More detailed source information on the local value
added indicator is presented in Appendix Table A1.

Energies 2012, 5 4879
2.4.3. Local Employment
The social indicator employment represents the employment effect (number of person-years) that is
created in the processes along the production chains. Employment figures related to wood chip production
of small-diameter trees and harvest residues were taken from Ahonen [32] and Paananen [33], which
are case studies from central and western Finland but which presumably give a good indicator for the
employment situation in eastern Finland as well. There were no statistics available on the employment
of crosscutting and splitting and home delivery of commercial firewood by local firewood entrepreneurs.
Therefore we made our own estimation based on the average productivity of a tractor-driven firewood
processor (5 m3 loose/h) [20]. One person-year of work was set at 1732 h/year. Average distance for
firewood transportation was set at 14 km and the average speed was set at 54 km/h.
Oil extraction, overseas transportation and the refinery process take place outside the region of North
Karelia and were thus outside the system boundaries and are therefore not examined any further.
Employment figures of domestic transportation by truck were estimated with the EFORWOOD FCBA
transport tool [34]. Employment at the heating and power plants related to the combustion of heavy fuel
oil are assumed to be similar to employment created by combustion of wood chips.
2.4.4. Greenhouse Gas Emissions
The environmental indicator greenhouse gas (GHG) emission quantifies carbon dioxide (CO2), methane
(CH4) and nitrous oxide (N2O) released during the processes of the wood chip, pellet, firewood and oil
production chain. The indicator is divided into two sub-indicators: GHG emissions from production
processes and emissions from fuel combustion. The GHG calculations from combustion follow the
Intergovernmental Panel on Climate Change regulations [31] and are calculated as Global Warming
Potential (GWP) for 100 years. However, CO2 emitted through woodchip, pellet and firewood combustion
is highlighted differently in the results than CO2 from oil combustion since emissions from woody
biomass are sequestered again in vegetation re-growth.
Greenhouse gas emissions from machinery used in wood chip production from small-diameter trees,
harvest residues and stumps were obtained from Kariniemi et al. [18]. GHG emissions for all processes
in this study are based on national averages for Finland which are also representative for North Karelia.
There were very few data available in the literature on GHG emissions from mechanical crosscutting and
splitting of commercially sold firewood. Therefore, we made our own estimate based on the average
productivity of a tractor-driven firewood processor (5 m3 loose/h)[20], average fuel consumption
(8.9 L/h) and average GHG emissions of farm tractors (2686 g CO2 eq./L)[35], which is a similar
approach which was used in an LCA study on domestic firewood production in Australia [36].
Commercial firewood is generally delivered to private homes by farm tractor or a small truck while
firewood collected by private forest owners is normally transported by a private car with trailer. The
average travelling distance (one way, loaded) for transporting firewood was set at 14 km. Emission
factors for private cars and small trucks were taken from the Technical Research Centre of
Finland [35] and added were greenhouse gas emissions from the unloaded return trip.

Energies 2012, 5 4880
GHG emissions from the oil extraction and refinery process were taken from Wihersaari [37]. Most
of the crude oil comes from Primorsk in Russia (±200 km) or Stavanger in Norway (±2,000 km) and
enters Finland in the harbor of Skoldvik near Porvoo where the crude oil is refined to more useful
products [38]. From there it is transported by ship to Naantali (±300 km) where the components of
heavy fuel oil are blended. The refined products are then transported by ship to the terminal in Hamina
(±400 km) from where they are distributed mostly by 60 t tanker trucks (max. load 40 t) to the heating
and power plants in Finland (Hamina-Joensuu 320 km). Emissions from tanker ships and tanker trucks
were obtained from the Technical Research Centre of Finland [35]. For tanker trucks we assumed a
100% empty back haulage. For tanker ships we calculated only the emissions from a one-way trip
since in some cases they transport other cargo and as far as we know no information is publicly
available if tanker ships usually return to the same port from where they departed. In general, shipping
logistics are optimized and sailing unloaded is avoided.
3. Results
3.1. Production Costs
Wood pellets, light heating oil and heavy fuel oil have the highest production costs (Figure 2). Sold
firewood has relatively high production costs compared to wood chips which are the cheapest to
produce. Wood pellets have high transportation costs and also the processes required in making pellets
are expensive. Oil is relatively cheap to produce. However, the price of the raw material (crude oil) is
high and makes up more than half of the production costs of heavy fuel oil and light heating oil.
Figure 2. Production costs (€/MWh) of wood chips, pellets, firewood and oil in 2005. Note
that the production costs for oil procurement occur outside North Karelia.
0
5
10
15
20
25
30
35
40
45
50
Production costs (€/M
Wh) Oil refinery
Crude oil extraction
Croscutting and splitting
Chipping
Pellet production
Overseas transportation
Domestic transportation
Forwarding
Lifting of stumps
Harvesting
Raw material

Energies 2012, 5 4881
3.2. Local Added Value
Local added value (the value remaining in the region of North Karelia) is the lowest for oil; all oil
products are imported and thus the total amount spent on oil procurement leaves the region (Figure 3).
Wood chips have a positive although small local added value. Wood pellets and sold firewood have the
highest local added value.
Figure 3. Local added value (€/MWh) of different wood-based and fossil fuels for energy
production in North Karelia. The Local added value is defined here as the gross added
value remaining in the region of North Karelia. Oil is imported from outside the region and
therefore the entire amount which is spent on the procurement of oil is represented by a
negative value.
3.3. Employment
Production of firewood and wood chips from small-diameter trees is relatively labor intensive and
need a high input of labor (Figure 4) and thus offer good employment opportunities. Especially
harvesting of small-diameter trees requires much labor input which is similar for wood chips from
small trees as for firewood. Oil requires very little labor as most of the production takes place outside
North Karelia and thus adds very little benefits to regional employment.
3.4. GHG Emissions
Greenhouse gas emissions per unit of energy produced from oil production were remarkably higher
compared to most wood-based fuels (Figure 5). However, pellet production caused relatively more
greenhouse gas emissions compared to oil. Of the other wood-based fuels, woodchips from stumps
and firewood sold by a forest entrepreneur (Figure 5) had relatively high emissions from machinery.
Wood chips from harvest residues and self-gathered firewood had the lowest emissions per unit of
energy produced.
‐70
‐60
‐50
‐40
‐30
‐20
‐10
0
10
20
30
Local V
alue Added (€/M
Wh)
LVA
LVA (incl.subsidies)

Energies 2012, 5 4882
Figure 4. Relative employment (man years/GWh) related to wood chip, wood pellet,
firewood and oil production and its use in North Karelia.
Figure 5. Greenhouse gas emissions (kg CO2 eq./MWh) from machinery used in wood chip,
wood pellet, firewood and oil production.
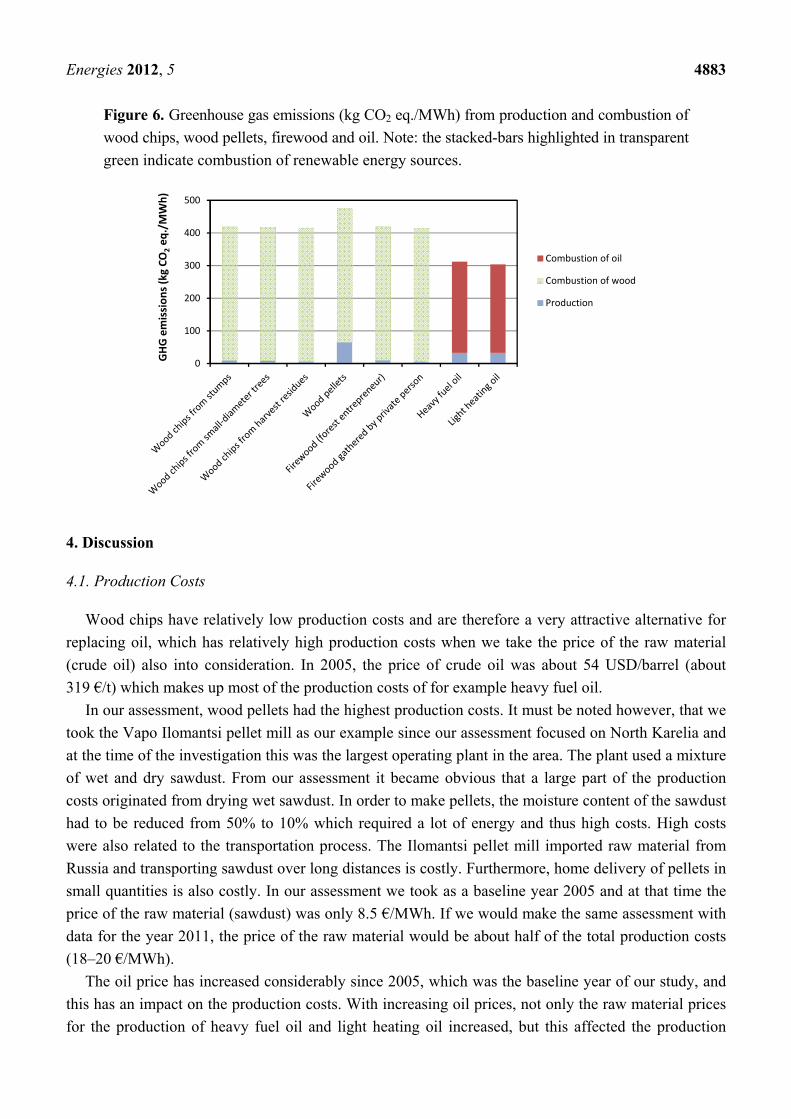
Most emissions, however, come from fuel combustion and emissions from machinery are actually
only a very small part of the total emissions (Figure 6). Wood-based fuels and especially wood pellets have
higher total emissions compared to oil. Nevertheless, it must be noted that the emissions caused by
wood-based fuels are from renewable sources and taken up again by re-growth of the vegetation during
a ±100-year period [39,40].
0.0
0.1
0.2
0.3
0.4
0.5
0.6Em
ploym
ent (m
an years/GWh) Power plant
Croscutting and splitting
Chipping
Pellet production
Transport
Forwarding
Lifting of stumps
Harvesting
0
10
20
30
40
50
60
70
GHG emissions (kg CO2eq./MWh)
Oil refinery
Crude oil extraction
Croscutting and splitting
Chipping
Pellet production
Overseas transportation
Domestic transportation
Forwarding
Lifting of stumps
Harvesting
Energies 2012, 5 4883
Figure 6. Greenhouse gas emissions (kg CO2 eq./MWh) from production and combustion of
wood chips, wood pellets, firewood and oil. Note: the stacked-bars highlighted in transparent
green indicate combustion of renewable energy sources.
4. Discussion
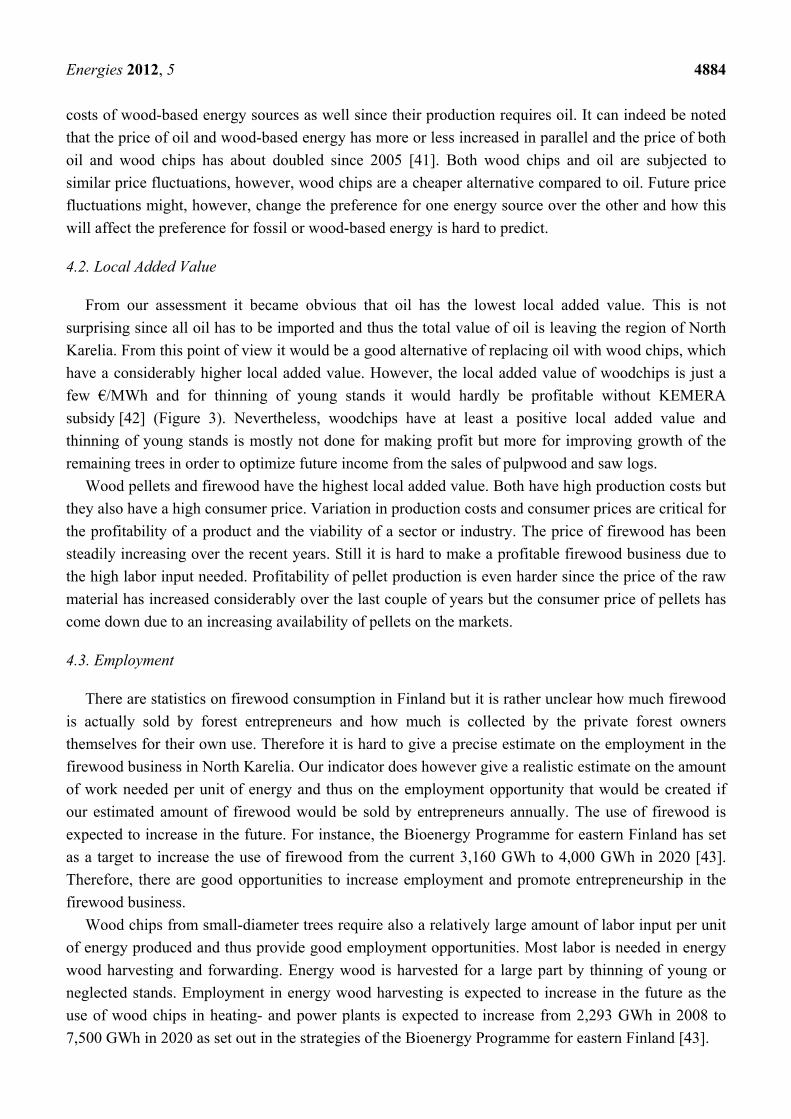
4.1. Production Costs
Wood chips have relatively low production costs and are therefore a very attractive alternative for
replacing oil, which has relatively high production costs when we take the price of the raw material
(crude oil) also into consideration. In 2005, the price of crude oil was about 54 USD/barrel (about
319 €/t) which makes up most of the production costs of for example heavy fuel oil.
In our assessment, wood pellets had the highest production costs. It must be noted however, that we
took the Vapo Ilomantsi pellet mill as our example since our assessment focused on North Karelia and
at the time of the investigation this was the largest operating plant in the area. The plant used a mixture
of wet and dry sawdust. From our assessment it became obvious that a large part of the production
costs originated from drying wet sawdust. In order to make pellets, the moisture content of the sawdust
had to be reduced from 50% to 10% which required a lot of energy and thus high costs. High costs
were also related to the transportation process. The Ilomantsi pellet mill imported raw material from
Russia and transporting sawdust over long distances is costly. Furthermore, home delivery of pellets in
small quantities is also costly. In our assessment we took as a baseline year 2005 and at that time the
price of the raw material (sawdust) was only 8.5 €/MWh. If we would make the same assessment with
data for the year 2011, the price of the raw material would be about half of the total production costs
(18–20 €/MWh).
The oil price has increased considerably since 2005, which was the baseline year of our study, and
this has an impact on the production costs. With increasing oil prices, not only the raw material prices
for the production of heavy fuel oil and light heating oil increased, but this affected the production
0
100
200
300
400
500
GHG emissions (kg CO2eq./MWh)
Combustion of oil
Combustion of wood
Production
Energies 2012, 5 4884
costs of wood-based energy sources as well since their production requires oil. It can indeed be noted
that the price of oil and wood-based energy has more or less increased in parallel and the price of both
oil and wood chips has about doubled since 2005 [41]. Both wood chips and oil are subjected to
similar price fluctuations, however, wood chips are a cheaper alternative compared to oil. Future price
fluctuations might, however, change the preference for one energy source over the other and how this
will affect the preference for fossil or wood-based energy is hard to predict.
4.2. Local Added Value
From our assessment it became obvious that oil has the lowest local added value. This is not
surprising since all oil has to be imported and thus the total value of oil is leaving the region of North
Karelia. From this point of view it would be a good alternative of replacing oil with wood chips, which
have a considerably higher local added value. However, the local added value of woodchips is just a
few €/MWh and for thinning of young stands it would hardly be profitable without KEMERA
subsidy [42] (Figure 3). Nevertheless, woodchips have at least a positive local added value and
thinning of young stands is mostly not done for making profit but more for improving growth of the
remaining trees in order to optimize future income from the sales of pulpwood and saw logs.
Wood pellets and firewood have the highest local added value. Both have high production costs but
they also have a high consumer price. Variation in production costs and consumer prices are critical for
the profitability of a product and the viability of a sector or industry. The price of firewood has been
steadily increasing over the recent years. Still it is hard to make a profitable firewood business due to
the high labor input needed. Profitability of pellet production is even harder since the price of the raw
material has increased considerably over the last couple of years but the consumer price of pellets has
come down due to an increasing availability of pellets on the markets.
4.3. Employment
There are statistics on firewood consumption in Finland but it is rather unclear how much firewood
is actually sold by forest entrepreneurs and how much is collected by the private forest owners
themselves for their own use. Therefore it is hard to give a precise estimate on the employment in the
firewood business in North Karelia. Our indicator does however give a realistic estimate on the amount
of work needed per unit of energy and thus on the employment opportunity that would be created if
our estimated amount of firewood would be sold by entrepreneurs annually. The use of firewood is
expected to increase in the future. For instance, the Bioenergy Programme for eastern Finland has set
as a target to increase the use of firewood from the current 3,160 GWh to 4,000 GWh in 2020 [43].
Therefore, there are good opportunities to increase employment and promote entrepreneurship in the
firewood business.
Wood chips from small-diameter trees require also a relatively large amount of labor input per unit
of energy produced and thus provide good employment opportunities. Most labor is needed in energy
wood harvesting and forwarding. Energy wood is harvested for a large part by thinning of young or
neglected stands. Employment in energy wood harvesting is expected to increase in the future as the
use of wood chips in heating- and power plants is expected to increase from 2,293 GWh in 2008 to
7,500 GWh in 2020 as set out in the strategies of the Bioenergy Programme for eastern Finland [43].
Energies 2012, 5 4885
Pellet production also requires a relatively large labor input and seems to offer good employment
opportunities. However, recently it was decided to make an end to the activities of the Vapo pellet mill
in Ilomantsi [44]. About 15 persons were employed by this mill and its closure had an impact on local
employment which is especially important for rural and remote areas.
4.4. GHG Emissions
In our assessment, the production of pellets had the highest GHG emission per unit of energy
produced. However, these high emissions do not necessarily give a representative picture of the
impacts of pellet production in general. In our assessment, we used the Vapo pellet plant in Ilomantsi
as an example which required large amount of energy to dry wet sawdust that was used in mixture with
dry sawdust as pellet raw material [25]. GHG emissions were also high as long as energy was
generated from non-renewable sources. Another reason for the relatively high emission resulting from
pellet production was caused by the long transportation distance of the raw material mainly from
Russia (±75 km). Additionally, the home delivery to the customers in relatively small loads (±5 t on
average) was another source of emissions. GHG emissions and production costs for pellet production
would be improved considerably if the pellet plant would use mainly dry sawdust as raw material.
Moreover, synergies can be created by locating a pellet plant next to a sawmill. This would reduce
emissions and production costs even further.
Heavy fuel oil and light heating oil had relatively high GHG emissions per unit of energy produced
(Figure 5). This is mainly caused by the extraction (drilling) and refinery process which requires a lot
of energy. Long distance overseas and domestic road transportation almost had no influence on GHG
emissions per unit of energy produced and seems to be even more efficient in terms of emissions
compared to wood chip transportation. Combustion of oil results in high emission values if we would
consider the emissions from wood-based fuels to be zero as it comes from a renewable resource. The
same amount of CO2 which is released during combustion of woody biomass will be taken up again as
new trees regenerate in the same place where they were harvested.
Firewood from local forest entrepreneurs had slightly higher emissions per unit of energy produced
than self-gathered firewood since it requires processes such as mechanical harvesting, forwarding,
crosscutting and splitting which are done by hand or chainsaw by the private-forest owner.
Almost all GHG emissions from self-gathered firewood came from the transportation process.
Firewood collected by private persons is normally transported by a private car with a trailer which can
carry about 1.4 m3 loose. These are very small amounts compared to what is normally transported by a
forest chip truck (about 100–115 m3) to the heating and power plants in North Karelia. Thus, even
though small cars consume quite little compared to large trucks, the small transportation load makes
them very inefficient.
5. Conclusions
The aim of this study was not to give recommendations on which energy source is the most
sustainable but more to provide information to decision makers on which they could base decisions.
This study focused in more detail on the different processes in energy supply chains with the aim of
better understanding the impacts of each specific process. Moreover, we compared similar processes in

Energies 2012, 5 4886
different production chains. In this case study, targets to reduce oil consumption, to increase the share
of woodchips in energy generation and to replace oil with renewable sources had already been set [4,6].
Nevertheless, a sustainability impact assessment can also be used to verify a decision. Considering the
indicators assessed in this study, we can pose the question if it was indeed a sensible choice to make a
shift from fossil fuel based energy to wood-based energy? To answer this question, one has to keep in
mind the local perspective of this study. In regional strategies and by regional decision makers [43],
local employment is ranked highly. Some of the indicators indicated low efficiency and high costs, for
instance in the pellet chain and the wood chips from small diameter trees. It is quite evident that
favoring local employment and local added value results in some negative trade-offs. For instance,
pellet production creates local employment but the production costs and GHG emission are high. If the
assessment would have been carried out in a different region, preferences of local stakeholders may
have been very different. For instance, labor intensive supply chains would not be very viable in a
region with very high labor costs or shortage of work force. Finally, to answer the question if it was a
sensible choice to make a shift from fossil to wood based energy, we can take the fossil fuel chain as a
“baseline” that was there before the use of biomass increased. Based on the indicator results for the
different value chains, it can be concluded that a shift from oil to wood-based energy had a positive
impact on all of the investigated economic, social and environmental indicators.
However, only four indicators were assessed in our case study. In future assessments, it would be
good to include more indicators, for instance a biodiversity indicator would add another dimension to
the environmental sustainability assessment. There is still little evidence on the effect of biomass
removal on forest biodiversity. Some recent studies indicate that biodiversity may be negatively
affected by more intense biomass extraction [21,45]. Considering the rapidly growing use of woody
biomass for energy, knowledge on the effects on decreasing amounts of dead wood left in the forest on
biodiversity would be very important. In the most recent assessment of red listed species in Finland,
forest management and decreasing amounts of dead and decaying wood were identified as the
most important threats to species living in forested habitats [46]. Increased harvesting of woody
forest-biomass for energy is unlike to improve this situation.
In future assessments, it would also be important to include other social, economic and
environmental indicators such as for instance impacts on berries and mushrooms, recreational value,
timber products, soil carbon balance and soil protection and fertility. This study included the choice of
most preferred indicators of some regional stakeholders who were directly involved in the study.
However, the stakeholder consultation could have been broader with more diverse interest groups,
including the general public like ordinary citizens of North Karelia without business or political
interests. Moreover, if we would consider a broader geographical scope in a study without a regional
focus, it would be quite likely that decisions would have been made differently. Still, the study
demonstrated that ToSIA was a useful tool to present the existing knowledge on sustainability impacts
of alternative energy supply chains to decision makers, to facilitate quantified and better informed
decision-making, in this case on the local to regional level.

Energies 2012, 5 4887
Acknowledgments
The work was part of the Northern ToSIA project funded by The Northern Periphery Programme
(NPP). We would like to thank all involved project partners and associate partners. Special thanks go
to the stakeholders for their active participation and feedback during workshops and seminars organized
for the Northern ToSIA project.
Appendix
Table A1. Input data for the calculation of the indicators with references to the original
sources (databases, scientific literature, official statistics, branch statistics or expert
opinion). Indicator data are given per process unit, e.g., in process number 4 “energy wood
thinning” production costs are 8.62 €/m3.
Process by
number Indicator
Forest and other
wooded land area
(Hectare)
Production
costs (Euro)
Local Added
Value (Euro)
Employment
(Person-years)
Greenhouse gas
emissions (kg of
CO2 equivalent)
Reference
1 ha 1,271,000 [16]
2 ha 144,000 [16]
3 m3 8.62 4.1 × 10⁻⁴ [17,32,33]
4 m3 8.62 4.1 × 10⁻⁴ 6 [12,17,18,33]
5 m3 0.33 0.25 [35]
6 m3 4.11 0.56 [17,18]
7 m3 5.9 8.7 × 10⁻⁵ 8.1 [18,23,47]
8 m3 4.14 [17]
9 m3 10 2.1 × 10⁻⁴ 5.2 [18,32,33,48]
10 m3 8.1 7.4 × 10⁻⁵ 4.2 [18,32,33,48]
11 m3 7.5 5.1 × 10⁻⁵ 5.13 [18,19,23]
12 m3 5.68 8.4 × 10⁻⁵ 13.2 [17,34]
13 m3 7 1.1 × 10⁻⁴ 3.6 [18,32,33,48]
14 m3 10 2.9 × 10⁻⁴ 4.79 [20,35]
15 m3 0.33 0.25 [35]
16 m3 5.3 3.9 × 10⁻⁵ 3.92 [18,32,33,47]
17 m3 6.99 1.3 × 10⁻⁴ 4.86 [18,19,32,33]
18 m3 Outside system boundaries
19 m3 8.15 −5.43(3.78)* 1.3 × 10−4 3.2 [18,32,33,48]
20 m3 13.55 45.33 1.5 × 10⁻⁴ 2.32 [34,35]
21 m3 5.14 9.43 [35]
22 m3 6.40 8.54 1.3 × 10⁻⁴ 2.8 [18,34,41]
23 m3 3.50 4.44 1.2 × 10⁻⁵ 5.4 [18,23,41,47]
24 m3 10.71 7.2 × 10⁻⁵ 8.32 [34]
25 tonnes 155.90 3.7 × 10⁻⁴ 239 [24,49]
26 tonnes 27.36 93.90 3.7 × 10⁻⁴ 11.71 [25,34]
27 kWh 0.41 [31]
28 kWh 0.41 [31]
29 kWh 4.3 × 10⁻⁸ 0.41 [18,31]
30 tonnes 62.03 169 [36,50]

Energies 2012, 5 4888
Table A1. Cont.
Process by
number Indicator
Forest and other
wooded land area
(Hectare)
Production
costs (Euro)
Local Added
Value (Euro)
Employment
(Person-years)
Greenhouse gas
emissions (kg of
CO2 equivalent)
Reference
31 tonnes 8.93 6.04 [35,51]
32 tonnes 82.90 177 [36]
33 tonnes 22.78 −402.28 2.0 × 10⁻⁴ 17.9 [33,35,48]
34 tonnes 24.70 −715.24 2.2 × 10⁻⁴ 19.4 [33,35,48]
35 kWh 4.3 × 10⁻⁸ 0.28 [18,34]
36 kWh 0.27 [52]
Note: * The Local Value Added including subsidies for management of young stands and chipping of energy
wood is represented between parentheses.
References and Notes
1. Statistics Finland. Statistical Yearbook of Finland, 2008; Statistics Finland (Tilastokeskus):
Helsinki, Finland, 2008.
2. United Nations Economic Commission for Europe (UNECE). Forestry and Timber Section.
Online Data and Statistics, 2010. Available online: http://www.unece.org/ (accessed on 30
November 2010).
3. Ministry of Economic Affairs of Finland. Finnish Long-Term Climate and Energy Strategy [in
Finnish]; Ministry of Economic Affairs of Finland: Helsinki, Finland, 2008.
4. Regional Council of North Karelia. North Karelian Bio-Energy Programme 2015 [in Finnish];
Pohjois-Karjalan Maakuntaliitto: Joensuu, Finland, 2007.
5. Regional Council of North Karelia. Pohjois-Karjalan Maakuntaohjelma 2011–2014 (POKAT
2014) [in Finnish]; Publications of Regional Council of North Karelia 128; Pohjois-Karjalan
Maakuntaliitto: Joensuu, Finland, 2010.
6. North Karelian Forestry Centre. North Karelian Forest Programme 2006–2010; North Karelian
Forestry Centre: Joensuu, Finland, 2005.
7. Frühwald, A.; Solberg, B. Life-Cycle Analysis—A Challenge for Forestry and Forest Industry;
EFI Proceedings 8; European Forest Institute: Joensuu, Finland, 1995.
8. ISO 14040:2006 Environmental Management—Life Cycle Assessment—Principles and Framework;
International Organization for Standardization (ISO): Geneva, Switzerland, 2006.
9. Tscherning, K.; König, B.; Schößer, B.; Helming, K.; Sieber, S. Ex-ante Impact Assessments (IA)
in the European Commission—An overview. In Sustainability Impact Assessment of Land Use
Changes; Helming, K., Pérez-Soba, M., Tabbush, P., Eds.; Springer: Berlin, Germany, 2008.
10. Helming, K.; Diehl, K.; Bach, H.; Dilly, O.; König, B.; Kuhlman, T.; Perez-Soba, M.; Sieber, S.;
Tabbush, P.; Tscherning, K.; Wascher, D.; Wiggering, H. Ex-ante impact assessment of policies
affecting land use—Part A: Analytical framework. Ecol. Soc. 2011, 16, 27–44.
11. Päivinen, R.; Lindner, M.; Rosén, K.; Lexer, M.J. A concept for assessing sustainability impacts
of forestry-wood chains. Eur. J. For. Res. 2012, 131, 7–19.

Energies 2012, 5 4889
12. Regional Council of North Karelia. Climate Change as a Possibility for North-Karelia: Climate
Change North Karelia—Project [in Finnish]; Pohjois-Karjalan Maakuntaliitto: Joensuu,
Finland, 2009.
13. Northern Tosia Home Page. Available online: http://www.northerntosia.org (accessed on 5
November 2012).
14. Lindner, M.; Suominen, T.; Palosuo, T.; Garcia-Gonzales, J.; Verweij, P.; Zudin, S.; Päivinen, R.
ToSIA—A tool for sustainability impact assessment of forest-wood-chains. Ecol. Model. 2010,
221, 2197–2205.
15. Lindner, M.; Werhahn-Mees, W.; Suominen, T.; Vötter, D.; Pekkanen, M.; Zudin, S.; Roubalova, M.;
Kneblik, P.; Brüchert, F.; Valinger, E.; Guinard, L.; Pizzirani, S.; Päivinen, R. Conducting
sustainability impact assessments of forestry-wood chains—Examples of ToSIA applications. Eur. J.
For. Res. 2012, 131, 21–34.
16. Finnish Forest Research Institute. Finnish Statistical Yearbook of Forestry 2007; Finnish Forest
Research Institute: Helsinki, Finland, 2007.
17. Finnish Forest Research Institute. Finnish Statistical Yearbook of Forestry 2006; Finnish Forest
Research Institute: Helsinki, Finland, 2006.
18. Kariniemi, A.; Kärhä, K.; Heikka, T.; Niininen, M. Feedstock supply chain CO2-eq emissions: A case
study on forest biomass for 2nd generation liquid traffic fuel. Metsätehon Kats. 2009, 38, 1–4.
Available online: http://www.metsateho.fi (accessed on 30 November 2010).
19. Laitila, J.; Ala-Fossi, A.; Vartiamäki, T.; Ranta, T.; Asikainen, A. Productivity of extraction and
forwarding of stumps [in Finnish]. Metla Work. Pap. 2007, 46, 1–26.
20. Jouhiaho, A.; Kouki, J.; Kärhä, K.; Mutikainen, A.; Oksanen, E.; Seppänen, A. The Management
and Development of the Chopped Firewood Production Process—PUUY 2003. In Wood Energy
Technology Yearbook 2002 [In Finnish], Proceedings of the Annual Seminar of the Wood Energy
Technology Programme (Puuenergian teknologiaohjelman vuosiseminaari), Joensuu, Finland, 18–19
September 2002; Alakangas, E., Ed.; pp. 413–427.
21. Eggers, J.; Tröltzsch, K.; Falcucci, A.; Maiorano, L.; Verburg, P.H.; Framstad, E.; Louette, G.;
Maes, D.; Nagy, S.; Ozinga, W.; Delbaere, B. Is biofuel policy harming biodiversity in Europe?
Glob. Chang. Biol. Bioenergy 2009, 1, 18–34.
22. Hakkila, P. Developing Technologies for Large-Scale Production of Forest Chips. Wood Energy
Technology Programme 1999–2003, Final Report; Tekes, Technology Programme Report 6/2004;
The Finnish Funding Agency for Development and Innovation (TEKES): Helsinki, Finland, 2004.
23. Kärhä, K.; Strandström, M.; Lahtinen, P.; Elo, J. Resource Needs for Wood Chip Production
in Finland in 2020 [in Finnish]. Available online: http://www.metsateho.fi (accessed on 1 October
2011).
24. Ihalainen, T.; Sikanen, L. Effect of costs factors in pellet production value chains [in Finnish]
Metla Work. Pap. 2010, 181, 1–31.
25. Selkimäki, M.; Röser, D. Pellet Logistics and Transportation of Raw Materials in Finland; Pelletime:
Joensuu, Finland, 2010. Available online: http://www.pelletime.fi (accessed on 1 December 2011).
26. Statistics Finland. Energy Imports by Country of Origin; Statistics Finland (Tilastokeskus):
Helsinki, Finland, 2010. Available online: http://www.stat.fi (accessed on 2 January 2012).

Energies 2012, 5 4890
27. EFORWOOD. EFORWOOD—ToSIA a Tool for Sustainability Impact Assessment of the
Forest-Wood Chain; Final Report of the EFORWOOD Project; Skogforsk: Uppsala, Sweden,
2009. Available online: http://87.192.2.62/Eforwood (accessed on 1 December 2011).
28. Alakangas, E. Properties of Fuels Used in Finland [in Finnish]; VTT Research Notes 2045;
Technical Research Centre of Finland (VTT): Espoo, Finland, 2000.
29. Rametsteiner, E.; Berg, S.; Laurijssen, J.; Le-Net, E.; Lindner, M.; Peuhkuri, L.; Prokofiewa, I.;
Schweinle, J.; Vötter, D.; Carnus, J.-M.; Edwards, D.; Jactel, H.; Raulund-Rasmussen, K.; Tomé,
M. EFORWOOD Project Deliverable 1.1.6: Revised FWC-sustainability indicator set document;
Universität für Bodenkultur Wien (Boku): Vienna, Austria, 2008.
30. Pülzl, H.; Prokofieva, I.; Berg, S.; Rametsteiner, E.; Aggestam, F.; Wolfslehner, B. Indicator
development in sustainability impact assessment: balancing theory and practice. Eur. J. For. Res.
2012, 131, 35–46.
31. Intergovernmental Panel on Climate Change (IPCC). IPCC Guidelines for National Greenhouse
Gas Inventories, Volume 2: Energy; IPCC: Kanakawa, Japan, 2006.
32. Ahonen, A. Energy Use of Forest Chips, Employment and Income Effects—Case Studies [in
Finnish]; Working Papers 47; Research and Development Centre of Kajaani (REDEC): Kajaani,
Finland, 2004.
33. Paananen, M. Employment in Forest Chip Production in Central Finland 1995–2004 [in Finnish];
Jyväskylän Teknologiakeskus Oy (Jyväskylä Technology Centre Ltd.), Bioenergiakeskuksen
julkaisusarja (BDC-Publications): Jyväskylä, Finland, 2005; Nro. 18.
34. Chesneau, J.B.; Le Net, E.; Berg, S. A transport tool to evaluate sustainability impacts of transport
processes within the Forest Wood Chain. Eur. J. For. Res. 2012, 131, 73–80.
35. Technical Research Centre of Finland. Lipasto—A Calculation System for Traffic Exhaust
Emissions and Energy Consumption in Finland; Technical Research Centre of Finland (VTT):
Espoo, Finland, 2011. Available online: http://lipasto.vtt.fi (accessed on 1 November 2011).
36. Paul, K.; Booth, T.; Elliott, A.; Jovanovic, T.; Polglase, P.; Kirschbaum, M. Greenhouse
Gas Emissions from Firewood Production Systems; Australian Greenhouse Office: Parkes,
Australia, 2003.
37. Wihersaari, M. Biofuels and the Environment [in Finnish]; Studies and Reports from the Ministry
of Trade and Industry 17/1996; Ministry of Trade and Industry: Helsinki, Finland, 1996.
38. Neste Oil Oyj. Espoo, Finland. Personal communication, 2010.
39. Zanchi, G.; Pena, N.; Bird, N. Is woody bioenergy carbon neutral? A comparative assessment of
emissions from consumption of woody bioenergy and fossil fuel. Glob. Chang. Biol. Bioenergy
2011, 4, 761–772.
40. Poudel, B.C.; Sathre, R.; Bergh, J.; Gustavsson, L.; Lundström, A.; Hyvönen, R. Potential effects
of intensive forestry on biomass production and total carbon balance in north-central Sweden.
Environ. Sci. Policy 2012, 15, 106–124.
41. Statistics Finland. Energy Prices; Statistics Finland (Tilastokeskus): Helsinki, Finland, 2011.
Available online: http://www.stat.fi (accessed on 2 January 2012).
42. In Finland, private forest owners and forest entrepreneurs can apply for KEMERA subsidy which
aims at supporting sustainable management of young forest stands. KEMERA subsidy is also
awarded to forest entrepreneurs for chipping energy wood.
Energies 2012, 5 4891
43. Bioenergy Programme for Eastern Finland 2020 [In Finnish]; Regional Council of North Karelia:
Joensuu, Finland, 2011 Available online: http://www.isbeo2020.fi (accessed on 1 December 2011).
44. Virnes, L. Ilomantsin Pellettitehdas: Tehtaan Hautajaiset [In Finnish]. Karjalainen, 30 November
2011, p. 11.
45. Verkerk, P.J.; Lindner, M.; Zanchi, G.; Zudin, S. Assessing impacts of intensified biomass
removal on deadwood in European forests. Ecol. Indic. 2011, 11, 27–35.
46. Rassi, P.; Hyvärinen, E.; Juslén, A.; Mannerkoski, I. The 2010 Red List of Finnish Species;
Ympäristöministeriö & Suomen Ympäristökeskus: Helsinki, Finland, 2010.
47. Laitila, J. Cost and sensitive analysis tools for forest energy procurement chains. For. Stud. 2006,
45, 5–10.
48. Ihalainen, T.; Niskanen, A. Effect of cost factors in bioenergy production chains [in Finnish].
Metla Work. Pap. 2010, 166, 1–54.
49. Suomi, U.; Hietaniemi, J.; Hellgrén, M. Calculation of CO2 Emissions and Guidance on Emission
Factors [in Finnish]; Motiva Oy: Helsinki, Finland, 2004. Available online: http://www.motiva.fi
(accesses 20 February 2012).
50. Hanninen, S.; Rytkönen, J. Oil Transportation and Terminal Development in the Gulf of Finland;
VTT Publications 547; Technical Research Centre of Finland (VTT): Espoo, Finland, 2004.
51. Information on the Oil and Gas Industry; Petrostrategies Inc.: Plano, Texas, USA, 2011.
Available online: http://www.petrostrategies.org (accessed on 12 March 2012).
52. Pyöry Finland Oy. Emission Calculations from Heating [in Finnish]; Final Report; Pyöry Finland:
Espoo, Finland, 2010. Available online: http://www.oil.fi (accessed on 13 March 2012).
© 2012 by the authors; licensee MDPI, Basel, Switzerland. This article is an open access article
distributed under the terms and conditions of the Creative Commons Attribution license
(http://creativecommons.org/licenses/by/3.0/).