Embed Size (px)
Citation preview

16/11/07
1
Sustainability Metrics for the Assessment of Textile Value Chains in South Africa 1st South African LCA Colloquium, 7 November 2016 Pippa Notten & Ilhaam Patel
OUTLINE
Introduction The Development Process
• Background research • Stakeholder engagement
Proposed set of sustainability metrics and its application: • The environmental and socio-economic impacts of a textile value chain in
South Africa
Conclusions: Key insights and recommendations

16/11/07
2
INTRODUCTION
Why a life cycle assessment of South African cotton? Seek a competitive advantage through sustainable products
• Many global apparel companies and retailers using LCA to enhance their brand and identify supply chain risks, e.g. Nike, Levi Strauss & Co., Patagonia, Adidas, Hugo Boss, H&M and Walmart
Operational: Improve the sustainability of South African cotton products
• Identify hotspots and biggest wins • Benchmark current performance
Strategic: Drive the SA textile sector towards most sustainable options
• Explore trade-offs between economic, environmental and social benefits/impacts
Sustainable = efficient (lower cost, lower risk)
INTRODUCTION
Within a LCSA, the set of environmental and socio-economic metrics provide the basis for the life cycle model. These will be used in: Benchmarking the current environmental and social performance of
textile value chains; Identifying “hotspots” of positive or negative impacts; Tracking changes in sustainability performance as a result of
interventions; and Exploring trade-offs between economic, environmental and social
benefits and impacts of different value chains, both within a particular value chain, as well as across different value chains.
16/11/07
3
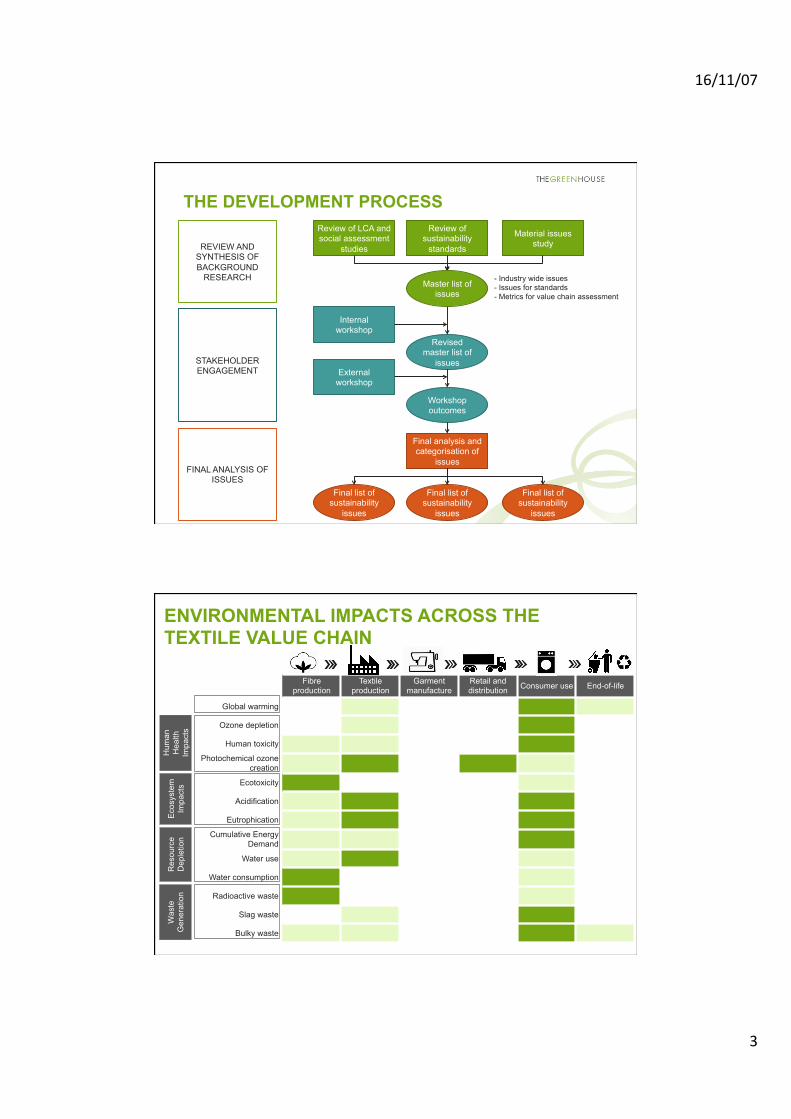
THE DEVELOPMENT PROCESS Review of LCA and social assessment
studies
Review of sustainability
standards
Material issues study REVIEW AND
SYNTHESIS OF BACKGROUND
RESEARCH
Internal workshop
External workshop
STAKEHOLDER ENGAGEMENT
Master list of issues
Revised master list of
issues
Final list of sustainability
issues
FINAL ANALYSIS OF ISSUES
Final analysis and categorisation of
issues
- Industry wide issues - Issues for standards - Metrics for value chain assessment
Workshop outcomes
Final list of sustainability
issues
Final list of sustainability
issues
ENVIRONMENTAL IMPACTS ACROSS THE TEXTILE VALUE CHAIN
Fibre production
Textile production
Garment manufacture
Retail and distribution Consumer use End-of-life
Global warming
Ozone depletion
Human toxicity
Photochemical ozone creation
Ecotoxicity
Acidification
Eutrophication
Cumulative Energy Demand
Water use
Water consumption
Radioactive waste
Slag waste
Bulky waste
Hum
an
Hea
lth
Impa
cts
Eco
syst
em
Impa
cts
Res
ourc
e D
eple
tion
Was
te
Gen
erat
ion

16/11/07
4
Fibre production
Textile production
Garment manufacture
Retail and distribution
Consumer use End-of-life
Child labour
Forced labour
Indebtedness/ agrarian distress
Gender discrimination
Low wages
Communication/ work environment
Working hours
Freedom of association & collective bargaining
Occupational H&S
Training, education and awareness
Employment opportunity
Destruction of cultural heritage
Gross domestic product or economic well-being
Worker Rights
Worker Health & Safety
Poverty Alleviation
Cultural impacts
SOCIAL CONCERNS ACROSS THE COTTON VALUE CHAIN
Economic Impacts
ISSUES RAISED IN GLOBAL SUSTAINABILITY STANDARDS
Social impact groups Issue categories Human rights Treatment of workers
Social dialogue Compensation and benefits Discrimination Employment terms Labour management Minor protection Voluntary employment Working hours Worker training and development
Worker health and safety Occupational health and safety Resource and environmental management
Resource management Energy management Water management Chemical management Pollution management Crop management Soil management Solid waste management Environmental management Climate change
Compliance, governance and product integrity
Business ethics and anti-corruption Compliance Community engagement Product integrity Supplier accountability
16/11/07
5
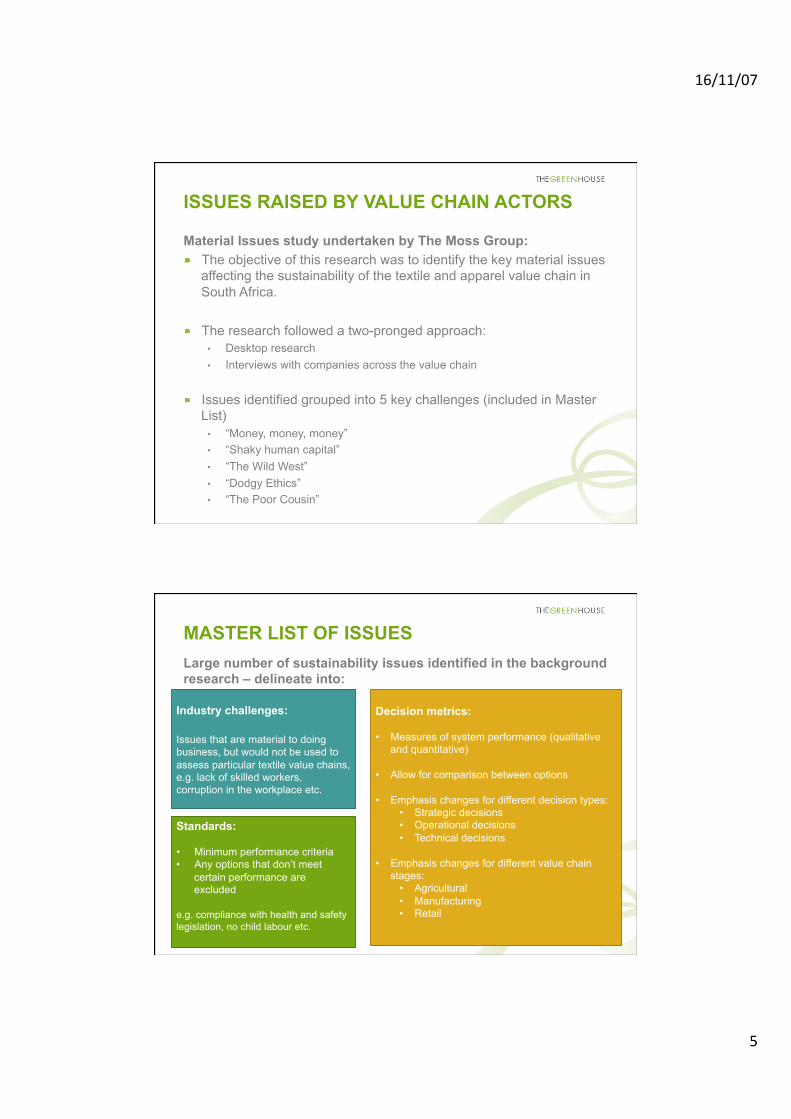
ISSUES RAISED BY VALUE CHAIN ACTORS
Material Issues study undertaken by The Moss Group: The objective of this research was to identify the key material issues
affecting the sustainability of the textile and apparel value chain in South Africa.
The research followed a two-pronged approach:
• Desktop research • Interviews with companies across the value chain
Issues identified grouped into 5 key challenges (included in Master List)
• “Money, money, money” • “Shaky human capital” • “The Wild West” • “Dodgy Ethics” • “The Poor Cousin”
MASTER LIST OF ISSUES
Decision metrics: • Measures of system performance (qualitative
and quantitative)
• Allow for comparison between options
• Emphasis changes for different decision types: • Strategic decisions • Operational decisions • Technical decisions
• Emphasis changes for different value chain stages:
• Agricultural • Manufacturing • Retail
Industry challenges: Issues that are material to doing business, but would not be used to assess particular textile value chains, e.g. lack of skilled workers, corruption in the workplace etc.
Standards: • Minimum performance criteria • Any options that don’t meet
certain performance are excluded
e.g. compliance with health and safety legislation, no child labour etc.
Large number of sustainability issues identified in the background research – delineate into:

16/11/07
6
ELICITING STAKEHOLDER INPUT
Value chain actors
Workers
Local community Society
Consumers
• Buy-in critical for ensuring acceptability of outcomes
• Identify anything you may have missed
• Provide data
ELICITING STAKEHOLDER INPUT
Two half-day workshops were held to gain outside input into the sustainability metrics set. Internal workshop – held for members of wider project team
• allowed the project team to test their approach and to gain feedback • gain input on sustainability issues from those with a different perspective to
the immediate project team
The external workshop – involved stakeholders of textile industry • aimed to identify stakeholder input regarding what is important in assessing
the environmental, social and economic sustainability of the textile industry in South Africa.

16/11/07
7
HIGH LEVEL SUMMARY OF MASTER LIST (1) Category
Sustainability Issue Issue raised in:
(Appendix section number) Standards Life cycle textile
studies Material Issues study Stakeholder workshop
Human health & ecosystem damage Climate change
M, S
(A.1) Water pollution (effluent)
M, S
Air pollution Solid waste M, S Use of toxic substances M, S Land use, biodiversity and soil Biodiversity
M, S
(A.2) Soil fertility M, S Food security,
competition for land
M
Resource depletion; access to resources (A.3)
Water scarcity M, S Use of fossil fuels & mineral resources
Labour rights & decent work
Decent work, attractive work
M, S
(A.4) Training, education, skills development
M, S, I
Wages and benefits M, S Diversity & equal
opportunities
Labour/management relations S, I
Treatment of workers & minors
S
Job creation & community development (A.5)
Job creation (number, type)
M, S, I
Effect on local communities
M, S, I
Health & safety (A.6) Safe, hygienic & healthy working conditions
S
HIGH LEVEL SUMMARY OF MASTER LIST (2) Category
Sustainability Issue Issue raised in:
(Appendix section number) Standards Life cycle textile
studies Material Issues study Stakeholder workshop
Consumers & society (A.7)
Consumer health & safety
M, S, I
Affordability & availability of textiles
M
Compliance & governance
Business ethics & anti-corruption S, I
(A.8) Compliance with laws & legislation S, I
Supplier accountability M, S, I
Economic sustainability (A.9)
Indebtedness and cash flow M, S, I
Economic risks, energy security M, S, I
Strategic direction & competitiveness (A.10)
Government support for industry I
Industry competitiveness M, I
Key to shading and symbols used in the table:
Indicates issues was raised through this channel
Indicates issue was raised in 10 or more standards or studies
Indicates issue was raised in 20 or more standards
Indicates issue was raised in 30 or more standards
M Issue raised as a “Sustainability metric”
S Issue raised as an “Issue for standards”
I Issue raised as an “industry-wide issue”
16/11/07
8
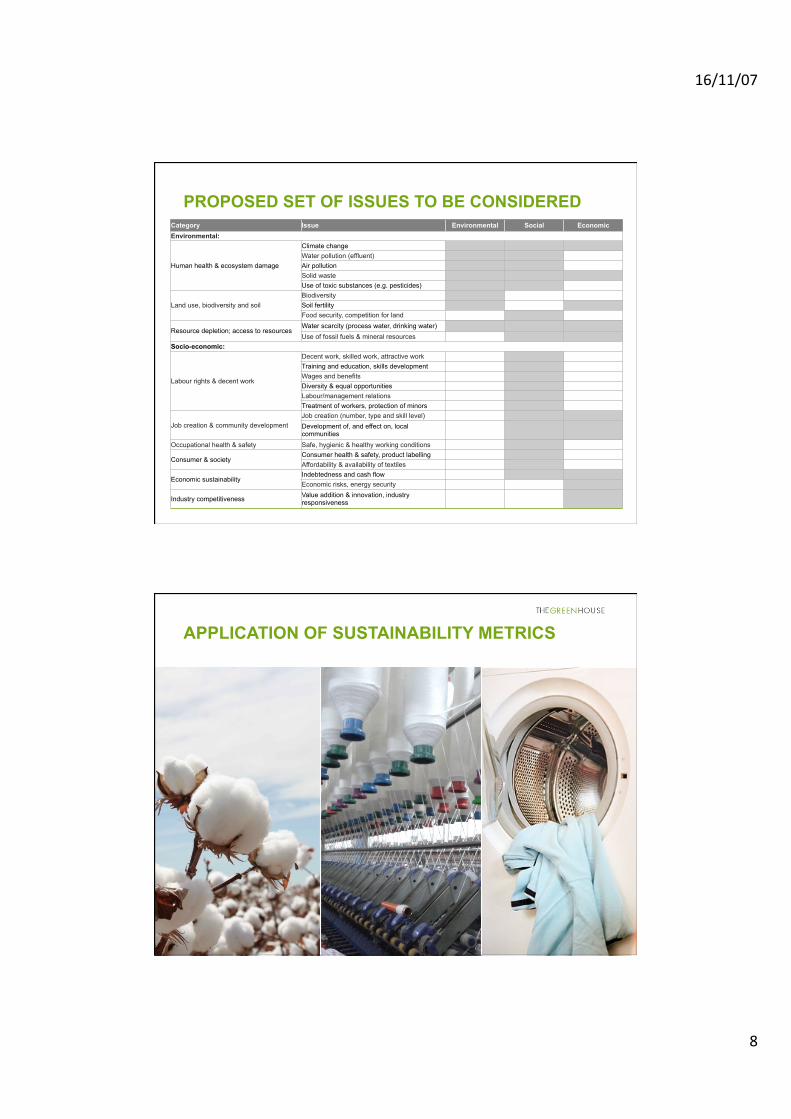
PROPOSED SET OF ISSUES TO BE CONSIDERED Category Issue Environmental Social Economic Environmental:
Human health & ecosystem damage
Climate change
Water pollution (effluent)
Air pollution
Solid waste
Use of toxic substances (e.g. pesticides)
Land use, biodiversity and soil Biodiversity
Soil fertility
Food security, competition for land
Resource depletion; access to resources Water scarcity (process water, drinking water)
Use of fossil fuels & mineral resources
Socio-economic:
Labour rights & decent work
Decent work, skilled work, attractive work
Training and education, skills development
Wages and benefits
Diversity & equal opportunities Labour/management relations Treatment of workers, protection of minors
Job creation & community development Job creation (number, type and skill level)
Development of, and effect on, local communities
Occupational health & safety Safe, hygienic & healthy working conditions
Consumer & society Consumer health & safety, product labelling
Affordability & availability of textiles
Economic sustainability Indebtedness and cash flow Economic risks, energy security
Industry competitiveness Value addition & innovation, industry responsiveness
APPLICATION OF SUSTAINABILITY METRICS

16/11/07
9
THE LIFE CYCLE MODEL
Important considerations: Goal and scope of the study
• Two pilot value chains of Integrated Supply Chain project: t-shirt and towel
The life cycle product system • Cotton product system boundary: what is included, what is excluded? • Data collection and data sources • Modelling choices (allocation)
Sustainability impact categories • Environmental impact categories and models • Socio-economic impact categories • Methods chosen for aggregation and interpretation
Smallholder dryland farm
Cotton gin
Spinner
Knitter
Dyehouse
CMT
Consumer use (washing,
drying, ironing)
Retail & distribution
Commercial irrigated
farm
Commercialdryland farm
Cotton fibre production
Integrated mill: weaver,
dyehouse, CMT
Consumer use (washing,
drying, ironing)
Retail & distribution
Yarn production
T-shirt production
Towel production
Land
Water
Fossil fuel resources
Mineral resources
Emissions to air
Emissions to soil
Emissions to water
Manufactured materials:
agro-chemicals; chemicals for textile refinement; dyes; packaging; etc.
End-of-life (disposal)
End-of-life (disposal)
Landfill of textile wastes
Energy inputs:
electricity; diesel; petrol; LPG; heavy fuel oil
LEGEND
From/to environment Processed inputs to systems Textile waste streams Transport steps
COTTON LIFE CYCLE SYSTEM BOUNDARY

16/11/07
10
Labour rights and decent work • Hours of work • Training and education • Skills development • Wages and benefits • Freedom of association and collective
bargaining • Labour-management relations • Protection of minors and vulnerable
persons • Diversity and equal opportunity
Job creation and community development
• Magnitude and stability of employment • Poverty reduction and impact on the
local community • Impact on community health and safety
Occupational health and safety • Safe, hygienic and healthy working
conditions • Commitment to occupational health
and safety
Product quality and economic sustainability
• Product labelling and certification • Feedback mechanisms and customer
satisfaction • Value addition and innovation • Indebtedness and cash flow • Economic risk
Socio-economic impacts
SUSTAINABILITY INDICATORS
EMPLOYMENT INTENSITY (T-SHIRT VALUE CHAIN)
0.0
0.2
0.4
0.6
0.8
1.0
1.2
1.4
1.6
1.8
2.0
Permanent Temporary Full-time equivalent
Num
ber o
f job
s
Number of jobs per 10,000 t-shirts
Retail
CMT
Dyeing
Knitting
Spinning
Ginning
Farming
• Full-time equivalence assumes temporary jobs are 10 weeks in duration
• T-shirt mass of 150 g

16/11/07
11
GENDER DIVERSITY IN EMPLOYMENT (T-SHIRT VALUE CHAIN)
0.00
0.05
0.10
0.15
0.20
0.25
0.30
0.35
Men Women
Num
ber o
f job
s
Permanent jobs, per 10,000 t-shirts
Retail
CMT
Dyeing
Knitting
Spinning
Ginning
Farming
0.0
0.2
0.4
0.6
0.8
1.0
1.2
1.4
1.6
1.8
Men Women N
umbe
r of j
obs
Temporary jobs, per 10,000 t-shirts
AGGREGATION OF IMPACT CATEGORIES
Constructed scales serve a number of purposes: Condense the large number of socio-economic indicators so as to provide a
visual overview Protect data confidentiality Synthesize inconsistent and/or data deficient data sets into a consistent output
Defined in this study Four sets with a colour rating system, intention is to highlight the socio-
economic strengths and weaknesses across the supply chain Should ideally be constructed together with stakeholders and decision-makers
GOOD FAIR WEAK POOR NO INFO
GIVEN
16/11/07
12
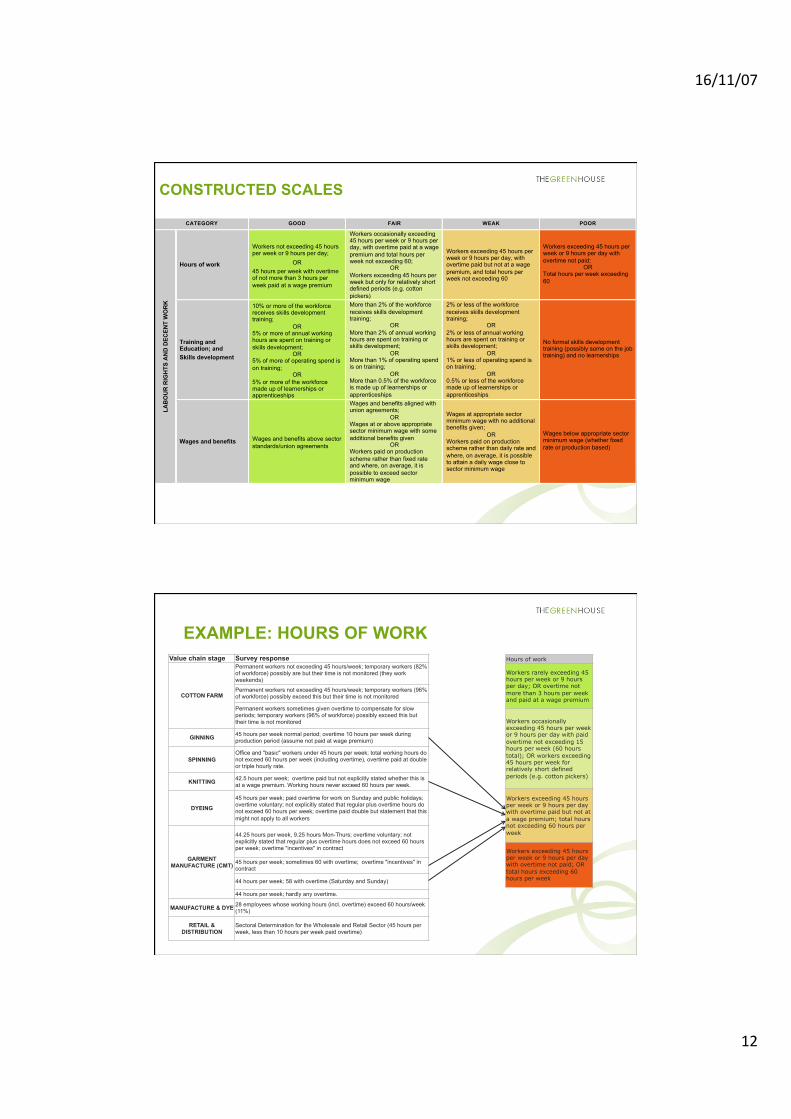
CONSTRUCTED SCALES
CATEGORY GOOD FAIR WEAK POOR
LAB
OU
R R
IGH
TS A
ND
DEC
ENT
WO
RK
Hours of work
Workers not exceeding 45 hours per week or 9 hours per day;
OR 45 hours per week with overtime of not more than 3 hours per week paid at a wage premium
Workers occasionally exceeding 45 hours per week or 9 hours per day, with overtime paid at a wage premium and total hours per week not exceeding 60;
OR Workers exceeding 45 hours per week but only for relatively short defined periods (e.g. cotton pickers)
Workers exceeding 45 hours per week or 9 hours per day, with overtime paid but not at a wage premium, and total hours per week not exceeding 60
Workers exceeding 45 hours per week or 9 hours per day with overtime not paid;
OR Total hours per week exceeding 60
Training and Education; and Skills development
10% or more of the workforce receives skills development training;
OR 5% or more of annual working hours are spent on training or skiils development;
OR 5% of more of operating spend is on training;
OR 5% or more of the workforce made up of learnerships or apprenticeships
More than 2% of the workforce receives skills development training;
OR More than 2% of annual working hours are spent on training or skills development;
OR More than 1% of operating spend is on training;
OR More than 0.5% of the workforce is made up of learnerships or apprenticeships
2% or less of the workforce receives skills development training;
OR 2% or less of annual working hours are spent on training or skills development;
OR 1% or less of operating spend is on training;
OR 0.5% or less of the workforce made up of learnerships or apprenticeships
No formal skills development training (possibly some on the job training) and no learnerships
Wages and benefits Wages and benefits above sector standards/union agreements
Wages and benefits aligned with union agreements;
OR Wages at or above appropriate sector minimum wage with some additional benefits given
OR Workers paid on production scheme rather than fixed rate and where, on average, it is possible to exceed sector minimum wage
Wages at appropriate sector minimum wage with no additional benefits given;
OR Workers paid on production scheme rather than daily rate and where, on average, it is possible to attain a daily wage close to sector minimum wage
Wages below appropriate sector minimum wage (whether fixed rate or production based)
EXAMPLE: HOURS OF WORK Value chain stage Survey response
COTTON FARM
Permanent workers not exceeding 45 hours/week; temporary workers (82% of workforce) possibly are but their time is not monitored (they work weekends)
Permanent workers not exceeding 45 hours/week; temporary workers (96% of workforce) possibly exceed this but their time is not monitored
Permanent workers sometimes given overtime to compensate for slow periods; temporary workers (96% of workforce) possibly exceed this but their time is not monitored
GINNING 45 hours per week normal period; overtime 10 hours per week during production period (assume not paid at wage premium)
SPINNING Office and "basic" workers under 45 hours per week; total working hours do not exceed 60 hours per week (including overtime), overtime paid at double or triple hourly rate.
KNITTING 42.5 hours per week; overtime paid but not explicitly stated whether this is at a wage premium. Working hours never exceed 60 hours per week.
DYEING
45 hours per week; paid overtime for work on Sunday and public holidays; overtime voluntary; not explicitly stated that regular plus overtime hours do not exceed 60 hours per week; overtime paid double but statement that this might not apply to all workers
GARMENT MANUFACTURE (CMT)
44.25 hours per week, 9.25 hours Mon-Thurs; overtime voluntary; not explicitly stated that regular plus overtime hours does not exceed 60 hours per week; overtime "incentives" in contract
45 hours per week; sometimes 60 with overtime; overtime "incentives" in contract
44 hours per week; 58 with overtime (Saturday and Sunday)
44 hours per week; hardly any overtime.
MANUFACTURE & DYE 28 employees whose working hours (incl. overtime) exceed 60 hours/week (11%)
RETAIL & DISTRIBUTION
Sectoral Determination for the Wholesale and Retail Sector (45 hours per week, less than 10 hours per week paid overtime)
Hours of work
Workers rarely exceeding 45 hours per week or 9 hours per day; OR overtime not more than 3 hours per week and paid at a wage premium
Workers occasionally exceeding 45 hours per week or 9 hours per day with paid overtime not exceeding 15 hours per week (60 hours total); OR workers exceeding 45 hours per week for relatively short defined periods (e.g. cotton pickers)
Workers exceeding 45 hours per week or 9 hours per day with overtime paid but not at a wage premium; total hours not exceeding 60 hours per week
Workers exceeding 45 hours per week or 9 hours per day with overtime not paid; OR total hours exceeding 60 hours per week

16/11/07
13
EXAMPLE: HOURS OF WORK Value chain stage Survey response
COTTON FARM
Permanent workers not exceeding 45 hours/week; temporary workers (82% of workforce) possibly are but their time is not monitored (they work weekends)
Permanent workers not exceeding 45 hours/week; temporary workers (96% of workforce) possibly exceed this but their time is not monitored
Permanent workers sometimes given overtime to compensate for slow periods; temporary workers (96% of workforce) possibly exceed this but their time is not monitored
GINNING 45 hours per week normal period; overtime 10 hours per week during production period (assume not paid at wage premium)
SPINNING Office and "basic" workers under 45 hours per week; total working hours do not exceed 60 hours per week (including overtime), overtime paid at double or triple hourly rate.
KNITTING 42.5 hours per week; overtime paid but not explicitly stated whether this is at a wage premium. Working hours never exceed 60 hours per week.
DYEING
45 hours per week; paid overtime for work on Sunday and public holidays; overtime voluntary; not explicitly stated that regular plus overtime hours do not exceed 60 hours per week; overtime paid double but statement that this might not apply to all workers
GARMENT MANUFACTURE (CMT)
44.25 hours per week, 9.25 hours Mon-Thurs; overtime voluntary; not explicitly stated that regular plus overtime hours does not exceed 60 hours per week; overtime "incentives" in contract
45 hours per week; sometimes 60 with overtime; overtime "incentives" in contract
44 hours per week; 58 with overtime (Saturday and Sunday)
44 hours per week; hardly any overtime.
MANUFACTURE & DYE 28 employees whose working hours (incl. overtime) exceed 60 hours/week (11%)
RETAIL & DISTRIBUTION
Sectoral Determination for the Wholesale and Retail Sector (45 hours per week, less than 10 hours per week paid overtime)
Hours of work
Workers rarely exceeding 45 hours per week or 9 hours per day; OR overtime not more than 3 hours per week and paid at a wage premium
Workers occasionally exceeding 45 hours per week or 9 hours per day with paid overtime not exceeding 15 hours per week (60 hours total); OR workers exceeding 45 hours per week for relatively short defined periods (e.g. cotton pickers)
Workers exceeding 45 hours per week or 9 hours per day with overtime paid but not at a wage premium; total hours not exceeding 60 hours per week
Workers exceeding 45 hours per week or 9 hours per day with overtime not paid; OR total hours exceeding 60 hours per week
Potential damage to human health • Substances toxic to humans (cancer
and non-cancer effects) • Substances that destroy the ozone
layer • Substances that cause smog and lead
to respiratory illnesses
Potential damage to ecosystems • Substances toxic to ecosystems • Acidifying substances • Excessive macronutrients (nitrogen and
phosphate) Global warming potential
• Greenhouse gases leading to climate change
Water scarcity • Water use that deprives others of
freshwater
Land use • Potential biodiversity loss • Loss of biotic production potential (soil
organic carbon)
Non-renewable resource depletion • Use of fossil fuels • Use of mineral resources
Energy use • Cumulative energy demand
Environmental impacts
SUSTAINABILITY INDICATORS
16/11/07
14
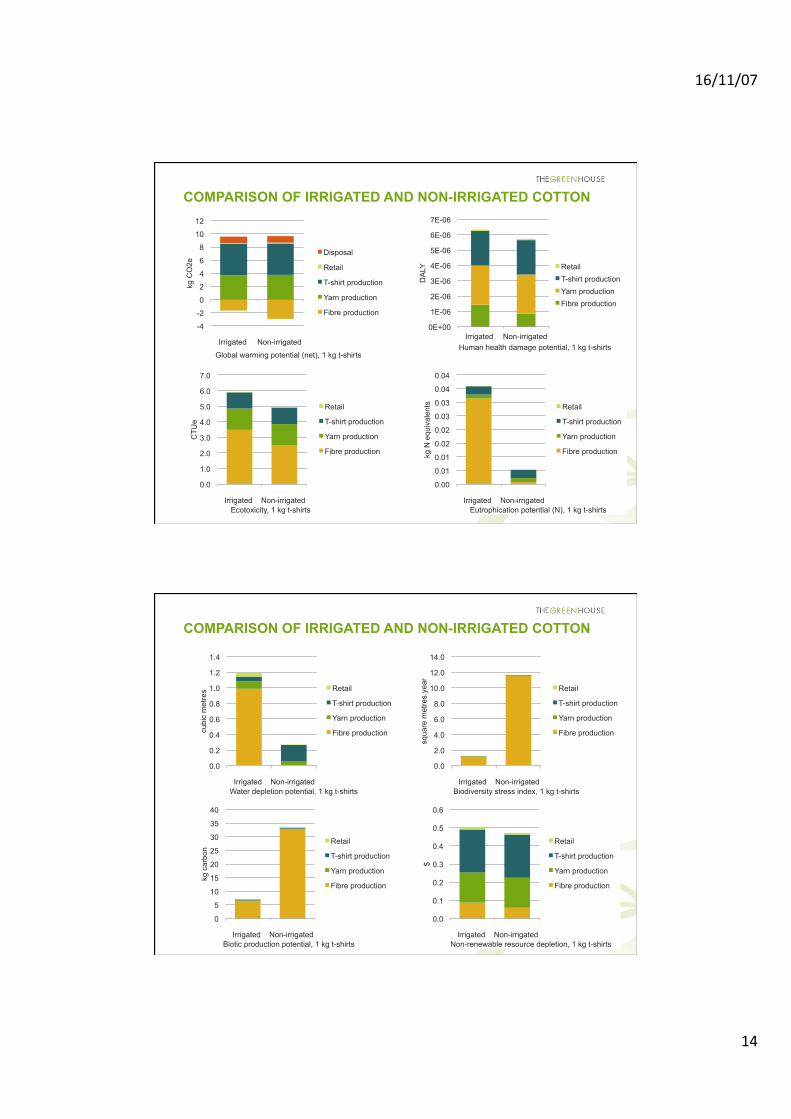
COMPARISON OF IRRIGATED AND NON-IRRIGATED COTTON
-4
-2
0
2
4
6
8
10
12
Irrigated Non-irrigated
kg C
O2e
Global warming potential (net), 1 kg t-shirts
Disposal
Retail
T-shirt production
Yarn production
Fibre production
0E+00
1E-06
2E-06
3E-06
4E-06
5E-06
6E-06
7E-06
Irrigated Non-irrigated
DA
LY
Human health damage potential, 1 kg t-shirts
Retail T-shirt production Yarn production Fibre production
0.0
1.0
2.0
3.0
4.0
5.0
6.0
7.0
Irrigated Non-irrigated
CTU
e
Ecotoxicity, 1 kg t-shirts
Retail
T-shirt production
Yarn production
Fibre production
0.00
0.01
0.01
0.02
0.02
0.03
0.03
0.04
0.04
Irrigated Non-irrigated
kg N
equ
ival
ents
Eutrophication potential (N), 1 kg t-shirts
Retail
T-shirt production
Yarn production
Fibre production
COMPARISON OF IRRIGATED AND NON-IRRIGATED COTTON
0.0
0.2
0.4
0.6
0.8
1.0
1.2
1.4
Irrigated Non-irrigated
cubi
c m
etre
s
Water depletion potential, 1 kg t-shirts
Retail
T-shirt production
Yarn production
Fibre production
0.0
2.0
4.0
6.0
8.0
10.0
12.0
14.0
Irrigated Non-irrigated
squa
re m
etre
s.ye
ar
Biodiversity stress index, 1 kg t-shirts
Retail
T-shirt production
Yarn production
Fibre production
0
5
10
15
20
25
30
35
40
Irrigated Non-irrigated
kg c
arbo
n
Biotic production potential, 1 kg t-shirts
Retail
T-shirt production
Yarn production
Fibre production
0.0
0.1
0.2
0.3
0.4
0.5
0.6
Irrigated Non-irrigated
$
Non-renewable resource depletion, 1 kg t-shirts
Retail
T-shirt production
Yarn production
Fibre production

16/11/07
15
AGGREGATION OF IMPACT CATEGORIES
Constructed scales There are four sets with a colour rating system, consistent with that used for
socio-economic impact categories
Significance of environmental impacts – based on normalised results using the ReCiPe LCIA method (Goedkoop et al., 2009).
Category Significance Fossil Carbon Footprint Moderate Human toxicity High Particulate matter formation Moderate Terrestrial acidification (in SA) High Freshwater ecotoxicity Moderate Freshwater eutrophication Very high Marine eutrophication Very high Water Stress Index, SA (SA data) Very high Fossil fuel depletion High Land & biodiversity Minor
Relative size / significance of the impact Contribution of stage/process to overall supply chain impact
Small / minor significance <2% 2 - 5 % 5 - 10 % > 10% Moderate significance <5% 5 - 10 % 10 - 25 % >25% High signficance <10% 10 - 25 % 25 - 75 % > 75% Large / very significant <20% 20 - 50 % 50 - 90 % > 90%
SIGNIFICANCE AND CAUSES OF ENVIRONMENTAL IMPACTS

16/11/07
16
COMPARISON OF THREE COTTON FARMS
Sustainability Indicator Cotton farms
Commercial, irrigated
Commercial, non-irrigated
Smallholder, non-irrigated
Environmental: Human health and ecosystems Impact on global climate change Potential human health effects Potential impacts on ecosystems Environmental: Resources Consumption of scarce water resources Impact on land resources Consumption of non-renewable resources Socio-economic: Labour rights and decent work Hours of work Training, education & skills development Wages and benefits Collective bargaining; labour relations Diversity and equal opportunity Socio-economic: Job creation and community development Magnitude and stability of employment Poverty reduction and community impact Socio-economic: Commitment to occupational health and safety Working conditions, commitment to OHS Socio-economic: Product quality and economic sustainability Product quality and innovation Indebtedness and cash flow Energy, water and waste cost sensitivity
KEY GOOD FAIR WEAK POOR
Overview of sustainability performance
CONCLUSIONS
16/11/07
17
KEY LEARNINGS
Collecting sustainability information is challenging • Little or no appetite for sustainability initiatives (especially environmental) • Challenges included long turn-around times, information gaps and language
barriers • Indicators need to be kept to a minimum and tailored, where possible, to existing
record-keeping • Data needs thorough auditing and checking Socio-economic information has its own challenges • Possibly high biases by engaging only with business owners and management • Often information not available or no standard format for recording • Reluctance to divulge costs and other financial information
FUTURE DIRECTIONS
Usefulness of life cycle approach to capture sustainability performance of textile value chains demonstrated Larger sample size needed for results to represent SA’s textile industry Indicators point to interesting trade-offs between different regions and farming
approaches that could be explored with a larger sample size Possible model improvements, e.g. chemical compositions, wastes Wider-ranging interviews for more robust benchmarking of socio-economic
performance Taking the life cycle model forward Further refinement of sustainabilty indicators
16/11/07
18
THANK YOU www.tgh.co.za | [email protected] Tel: +27 (0) 21 671 2161 | Fax: 086 638 3692
Ubunye House, 70 Rosmead Ave,
Kenilworth, 7708, South Africa


![Textile Technology [Read-Only]textile.yazd.ac.ir/ms.ahmadi/Downloads/Textile Technology/Textile... · Textile Technology (Pictures) Edited by: M. S. Ahmadi Textile Technology 1 Yazd](https://img.pdfslide.net/doc/110x75/5e786641131316263558e076/textile-technology-read-only-technologytextile-textile-technology-pictures.jpg)