Embed Size (px)
Citation preview

2012SUSTAINABILITY REPORT

Incitec Pivot Limited Sustainability Report 2012 2
Simsbury
Graham
DinamitaWolf Lake
Salt Lake City Port Ewen
Ormstown
North Bay
DuffieldCarthage
St Helens
Donora
Louisiana
Barry
Cheyenne
Brooksville
Mount Wright
BoisbriandMaitland
EkatiMeadowbank
Gomez Palacios
CalgaryTumbler Ridge
Diavik
Guadalajara
Biwabik
KalgoorliePerth
Lihir
Moranbah
Helidon
Batu Arang (TKEB)
Moura(Queensland Nitrates)
MelbourneGeelong
Townsville
Mt IsaPhosphate Hill
Portland
Gibson Island
AnkaraSoma
Tanjung TabalongJakarta
Hong Kong
Sibolga
Port Adelaide
Port Hedland
Johannesburg (SASOL Dyno Nobel)
Johannesburg (DetNet)
New Delhi
Lausanne
BucharestTirana
Linyi (Fabchem)
Batu Kajang
Kooragang Island
Devonport
BerauTenggarongMuara Tuhup
SantiagoLa Serena
INDIA
PAKISTAN
LATINAMERICA
MEXICO
USA
AUSTRALIA
TURKEY
CANADA
CHINA
SOUTHAFRICA
INDONESIA
PAPUA NEW GUINEA
About Incitec Pivot
Incitec Pivot Limited (IPL) is a leading global company headquartered in Melbourne, Australia,which manufactures, markets and distributes arange of industrial explosives, fertilisers, relatedproducts and services to customers around theworld. A leader in its chosen markets, the Companyholds a portfolio of recognised and trusted brandsand is the number one supplier of fertilisers inAustralia and the number one supplier of industrialexplosives, related products and services in North America.
The Company is a public company, trading on the Australian Securities Exchange as IPL. It operates two major businesses, Dyno Nobel and Incitec Pivot Fertilisers. Dyno Nobel, with sites in the USA and
Australia supplies explosives, related products and services to mining, quarrying and construction customers in North America, the Asia Pacific including Australia, and other countries. The business includes Dyno Consult, a specialist team of drill and blast consultants and Dyno Nobel Transport, a full-service carrier, transporting explosives and hazardous materials throughout the United States and Canada.
Incitec Pivot Fertilisers manufactures and distributes a range of plant nutrients in Australia and sources and distributes internationally through Southern Cross International and its Hong Kong-based joint venture Quantum Fertilisers.
Our approach to sustainability
Our sustainability agenda is driven by our Vision and seven Values, which all employees live by.
We recognise that sustainable growth requires us to balance our economic performance with ourenvironmental and social responsibilities. Thoseresponsibilities include being a good corporate citizen and operating ethically. They include ensuring good governance in our day-to-day business activities and behaving with honesty and integrity in our interactions with communities, our employees,customers, and the environment.
Our approach to sustainability includes the areas of: workplace health and safety, environmental impacts and resource efficiency, community impact and engagement, labour practices and our products & services.
Joint venture operations, including in South Africa, Malaysia, China and India*
*Refer to page 38 for details
IPL owns and operates manufacturing plants in the USA, Canada, Turkey, Australia, Mexico, Chile, Indonesia and Papua New Guinea
Annual sales revenue of $3,500.9 million for 2011/12 financial year
S&P/ASX Top 50 Company (ASX: IPL)
Listed on the Australian Securities Exchange (ASX code: IPL) since 2003

3
Simsbury
Graham
DinamitaWolf Lake
Salt Lake City Port Ewen
Ormstown
North Bay
DuffieldCarthage
St Helens
Donora
Louisiana
Barry
Cheyenne
Brooksville
Mount Wright
BoisbriandMaitland
EkatiMeadowbank
Gomez Palacios
CalgaryTumbler Ridge
Diavik
Guadalajara
Biwabik
KalgoorliePerth
Lihir
Moranbah
Helidon
Batu Arang (TKEB)
Moura(Queensland Nitrates)
MelbourneGeelong
Townsville
Mt IsaPhosphate Hill
Portland
Gibson Island
AnkaraSoma
Tanjung TabalongJakarta
Hong Kong
Sibolga
Port Adelaide
Port Hedland
Johannesburg (SASOL Dyno Nobel)
Johannesburg (DetNet)
New Delhi
Lausanne
BucharestTirana
Linyi (Fabchem)
Batu Kajang
Kooragang Island
Devonport
BerauTenggarongMuara Tuhup
SantiagoLa Serena
INDIA
PAKISTAN
LATINAMERICA
MEXICO
USA
AUSTRALIA
TURKEY
CANADA
CHINA
SOUTHAFRICA
INDONESIA
PAPUA NEW GUINEA
Contents
Our sustainability performance 4
A message from the CEO 5
Our approach 6
How we operate 8
Workplace Health & Safety 10
Community 16
Environment 20
Products & Services 26
People 34
About the data 38
GRI table 39
Incitec Pivot LimitedCompany Headquarters
Incitec Pivot Fertilisers
Quantum Fertilisers
Corporate OfficeManufacturing/Distribution
Dyno NobelCorporate OfficeManufacturing/DistributionJoint Ventures/Investments
About this Report
This Report covers the 12 month period from 1 October 2011 to 30 September 2012, IPL’s financial year. We publish an annual sustainability report so that stakeholders can better understand our social, environmental and safety focus and performance. The last report was published in January 2012.
This Report covers the performance of IPL and our wholly owned subsidiaries and the activities over which we have operational control for all or part of the financial year ended 30 September 2012. Together, the 2012 Sustainability Report and the 2012 Annual Report provide the full account of IPL’s performance for the period.
Previous reports are available for download at www.incitecpivot.com.au. We recognise the need to report on issues most relevant to our business and our key stakeholders, and we welcome feedback on this Report and our sustainability progress. Please direct any questions or comments regarding this Report or its content to us via [email protected].
Over 5,000 employees at 30 September 2012
As at 30 September 2012, 11.8% females in management roles
Supply approximately 2 million tonnes of fertiliser per annum
Supply approximately 1.5 million tonnes of ammonium nitrate explosive per annum
Provide agronomic services in Australia, completing 68,000 soil and plant tests each year
Front cover: image 3, Cheyenne, Wyoming, USA

Incitec Pivot Limited Sustainability Report 2012 4
Indicator Unit of measure
2010/11 2011/12
Environment
Emissions
Direct GHG emissions (Scope 1) Million 1.9 2.0
Indirect GHG emissions (Scope 2) tonnes CO2e 0.4 0.4
Total GHG emissions1 2.3 2.4
Proportion of energy derived from fossil fuels2 % 95% approx 95% approx
EnergyGlobal direct energy consumption GJ – 36,159,511
WaterGlobal water use GL – 16.0 Australian water use GL 10.93 11.9Global water discharge GL – 30.4
WasteGlobal solid waste kt – 8.3 Australian solid waste kt 4.33 3.7Global solid chemical waste kt – 2305.3 Australian solid chemical waste kt 2,289.0 2305.0Global liquid waste GL – 19.6 Australian liquid waste GL 14.7 15.0
Environmental complianceEnvironmental licence non-compliance incidents (category 2+)4 9 13Loss of containment (category 2+)4 11 14
SafetyTotal Recordable Injury Frequency Rate 1.24 1.45
Fatalities 0 0
PeopleTotal workforce (excluding contractors) 4,887 5,162Americas 2,723 2,786Asia Pacific 1,873 2,121Europe 291 255
Gender – Diversity (% of women)Board 12% 14.3%Executive 10% 12.5%Management 13.7% 11.8%Global 14.2% 13.6%
Economic value generatedA. Direct economic – Revenues $Mil 3,587.5 3,533.1
B. Economic value distributed 3,381.8 3539.1 Operating costs, including payments to suppliers, non-strategic investments
and royalties2,629.53 2,694.6
Employee wages and benefits: total monetary outflows for employees (current payments, not future commitments)
538.9 523.4
Payments to providers of capital, including dividends and interest 151.4 187.3 Government taxes (income tax, payroll tax, Australian goods and services,
fringe benefits taxes and Australian fuel tax credits.)62.0 133.8
Voluntary community investments (including donations of cash, in-kind support and employee time)
0.8 0.4
C. Economic value retained (A–B) 205.73 (6.0)
The Sustainability Scorecard shows our performance across a range of economic, social and environmental indicators for the financial years 2010/11 and 2011/12.
1 Scope 1 + 2. 2 Excluding natural gas used as production raw material. 3 Restated, refer to page 38 for details. 4 Refer to description of categories on page 25.
Keystone Project
1. Implement targets to reduce use of non-renewable resources in our manufacturing operations. Status – On track. Read more on page 23
2. Create guidelines for our community investment activity, and implement internal and external reporting process. Status – Complete. Read more on page 19
3. Encourage a more diverse workforce by setting up a global indigenous employment program and support framework to facilitate participation in customer or government programs in remote regions. Status – Complete. Read more on page 36
4. In our Fertilisers business, develop a joint research project on enhanced fertilisers to reduce environmental impacts of fertiliser use. Status – On track. Read more on page 28
5. In our Explosives business, develop products that use recycled waste oil and encourage responsible use. Status – On track. Read more on page 33
Sustainability keystone projects
Five projects were identified in 2010 as the foundation of the sustainability agenda, underpinning our commitment to sustainability. These projects are progressing well and status updates are provided below and in the Report.
Our sustainability performance
Sustainability Scorecard

5
As you’ll see in this Report, our journey has taken us much further than we could have imagined two years ago. There have been some great successes. However, there have been and will continue to be challenges along the way. Like everyone at IPL, I am responsible for delivering on our Value of “Zero Harm for Everyone Everywhere”. The safety of our people is my number one priority as CEO and an area in which our performance must improve.
While it was pleasing to note that 72% of our sites had zero recordable injuries for the past 12 months, I was disappointed in our overall safety performance this year, with our Total Recordable Injury Frequency Rate increasing marginally on the previous year. While the severity of the incidents was reduced, I recognise that we must make positive progress each year if we are to attain our goal of Zero Harm. To meet this challenge, we are implementing a comprehensive five-year Health, Safety and Environment Strategy. This strategy was approved by both the Board and my Executive Team, reinforcing our commitment to Zero Harm at the highest levels.
The projects that we started in 2010 to support our sustainability agenda are either complete or well on their way. One delivered our first global Community Investment Framework which establishes a number of programs to support and encourage employees and sites to develop closer ties with their communities.
Another established resource efficiency targets for our Australian operations and, despite the complexity of our dispersed operations, we are measuring and managing our greenhouse gas emissions, water and natural gas use and waste generation from our global operations. We are now well placed to commence reporting against targets next year.
Further to these projects, we’ve implemented a diversity agenda that aims to build an inclusive and accessible organisation through the development of a culture that embraces diversity. Additionally, our new Indigenous Employment Strategy will build on our commitment to working in partnership with Indigenous Australians, improving employment opportunities. Finally, our scientists and engineers have been hard at work, partnering with universities on multiple research projects aimed at reducing the environmental impacts of our products. This research has been very successful, resulting in several patent applications this year.
Our sustainability agenda prepared us well for the introduction of the Australian Government’s Clean Energy Legislative Package, which came into effect on 1 July 2012. Our focus on resource efficiency meant that the measurement systems and processes are in place to understand our carbon footprint. Our work on improving the sustainability of our products across their life cycle will continue as we strive to meet the needs of our customers who are increasingly looking to their supply chain to improve their own environmental and social performance.
All our hard work has not gone unnoticed. I was delighted to learn of our first time inclusion in the Dow Jones Sustainability Asia Pacific Index, a significant milestone and recognition of our improving sustainability performance.
A message from the CEO
Our inclusion will build credibility with our customers and communities and will motivate our employees to continue our journey.
In 2013, we will plot the course of the next phase of our sustainability journey. We will continue on the road to Zero Harm. We will consolidate our targets, measurement systems and plans for reducing our environmental and social impacts; and focus on engaging our employees, stakeholders and partners who will help us along the way.
Driven by our Vision “to be the best in our markets, delivering Zero Harm and outstanding performance through our people, our culture and our customer focus” and our seven Values, our sustainability journey will be accelerated by Business Excellence (BEx). BEx, described on the next page, will drive long term culture change and is embracing continuous improvement across all levels. BEx will help drive an integrated approach to sustainability across the Group, empowering our people to take responsibility for sustainability within their working areas.
Over the past two years, sustainability has increasingly become part of the way we do business at IPL. Through the combined efforts of our people, empowered by BEx, I am confident in our ability to continue to grow our business sustainably, throughout the years ahead.
James FazzinoManaging Director & CEO
Two years ago our Board and Executive Team approved our first sustainability agenda. The agenda aimed to address specific aspects of our environmental and social performance, specifically: the efficiency of our use of non-renewable resources, how we engaged with the communities in which we operate and the sustainability of our products over their life cycle.

Incitec Pivot Limited Sustainability Report 2012 6
Our approach
Our Vision and seven Values drive our approach to sustainability.
Our approach to sustainabilityIn 2010, IPL’s Board and Executive Team approved a sustainability strategy to use ‘sustainability’ as a tool to think more broadly across all aspects of our business. This enabled us to focus on specific sustainable and value-creating actions in line with our business objectives. Our sustainability journey came to life in the form of five keystone projects, developed to deliver specific measurable objectives for the business by September 2013 and kick start our sustainability journey. The projects were selected to progress three initial focus areas that we refer to as our ‘Use Less, Get Close, Be Responsible’ agenda. These five projects, and our progress for each, are detailed in the performance table on page 4.
We recognise that sustainable growth requires us to balance our economic performance with our environmental and social responsibilities. These responsibilities include being a good corporate citizen and operating ethically. They include ensuring good governance in our day-to-day business activities and behaving with
honesty and integrity in our interactions with communities, our employees, customers, and the environment.
We’ve now matured in our approach in line with the long term culture change being undertaken as part of BEx, our approach to continuous improvement (refer below).
BEx will help drive an integrated approach to sustainability across the Group making sustainability everyone’s responsibility and delivering greater business value. More specifically, business value will come from more efficient use of costly resources, closer community engagement in our areas of operation, attracting, engaging and empowering the best talent, product innovation and a wider consideration of business risks.
Our approach to sustainability includes the areas of: workplace health and safety, environmental impacts and resource efficiency community impact and engagement, labour practices and our products & services, and we’ve structured our plans, data collection and reporting around these.
VALUES
What is BEx?Business Excellence (BEx) is IPL’s system for continuously improving the way we work. Through process discipline and investing in our people, we will transform our company to achieve outstanding and sustainable business performance.
BEx is employee-led by our people on the factory floor, mine bench and farm. Based on LEAN principles, BEx is strongly underpinned by workplace health and safety, environment management and sustainability.
In 2012, BEx commenced in 16 of our operations and across our broader value chain in our Fertiliser and Explosives businesses and key functional areas such as Human Resources, Procurement and Logistics.
During the year, key activities undertaken to establish the foundations for the cultural change included the employment of BEx facilitators, employee education programs, baseline site assessments and first stage action plans, and most importantly, a drive to move the business culture to one that embraces a structured methodology around business process and efficiency.
We expect meaningful improvements within our Value Chain for example:
Manufacturing
• Improved plant reliability and production quality
• Lower waste on input costs (fixed and variable)
• Increased efficiency in sustenance capital spend
• Reduction of maintenance costs
• Reduction in production spares costs
Supply Chain & Logistics
• Optimised freight spend
• Optimised warehousing capacity
• Improved customer service
• Reduced inventory holdings and cash conversion
VISION STATEMENT
To be the best in our markets, delivering Zero Harm and outstanding business performance through our people, our culture and our customer focus.

7
We have been included in the Dow Jones Sustainability Indexes (DJSI) since 2010 and our performance is benchmarked against peers in the global ‘Chemicals’ sector. Our results show an improvement year on year and this year, for the first time, we have been included in the Dow Jones Sustainability Asia Pacific Index, a significant milestone and recognition of our improving sustainability performance. The DJSI is widely recognised as the leading reference point in the growing field of sustainability investing due to the robustness of the assessment process.
Dimension 2010 2011 2012
Economic 61 61 59
Environmental 51 50 51
Social 37 45 63
Total for IPL 49 51 58
Average for the ‘Chemicals’ sector 55 57 55
DJSI Corporate Sustainability Assessment Results (%)
Our approach to reporting This Report covers the 12 month period from 1 October 2011 to 30 September 2012, our financial year. We publish an annual sustainability report so that stakeholders can better understand our social, environmental and safety focus and performance. The last report was published in January 2012.
This Report covers the performance of IPL and our wholly owned subsidiaries and the activities over which we have operational control for all or part of the financial year ended 30 September 2012. Together, the 2012 Sustainability Report and the 2012 Annual Report provide the full account of IPL’s performance for the period.
During the year we also provide information to organisations that help investors understand the economic, social and environmental performance of our company, including the Dow Jones Sustainability Indexes and Carbon Disclosure Project.
Content selection processOur reporting focuses on five areas: workplace health and safety, environmental impacts and resource efficiency, community impact and engagement, labour practices and our products & services. Within each of these areas we used the content selection process below to determine the topics most important to our stakeholders and our business:
1. IDENTIFY – We identified the stakeholders who have a direct relationship to, or are impacted by, our business. These were: customers, joint venture partners, employees & contractors, government & regulators, local communities, suppliers and investors.
2. COLLECT – We collected information by researching publicly available information, business communications and engagement with these stakeholders. We also identified topics of significance to our business by utilising established internal processes.
3. ANALYSE – The information was analysed to understand the topics important to different stakeholder groups.
4. PRIORITISE – The topics were prioritised according to the level of importance to stakeholders and to our business.
5. RATIFY – Our Executive Team then reviewed and ratified the identified topics.
6. REPORT – This Report, together with our Annual Report and website (collectively, our public reporting), covers the topics of medium and high relevance to our stakeholders and our business.
Sign
ifica
nce
to s
take
hold
ers
Significanceto our business
Notreported
Included inpublic reporting
Included inpublic reporting
High
High importance
Low
Hig
hLo
w
Medium importance
Low importance
Our sustainability performance recognised
Source: DJSI Corporate Sustainability Assessment Results from the relevant years
Moranbah, Queensland, Australia

Incitec Pivot Limited Sustainability Report 2012 8
How we operate
GovernanceOur highest governing body is the Board of Directors. The Board is responsible for charting the direction, policies, strategies and financial objectives of the Company. The Board serves the interests of the Company and its shareholders, as well as our other stakeholders such as employees, customers and the community, in a manner designed to create and continue to build sustainable value.
The Board operates in accordance with the principles set out in its Board Charter. A copy of the Board Charter is available on the corporate governance section of the Company’s website, www.incitecpivot.com.au/Corporate_ Governance.
The Charter sets out the Board’s own tasks and activities, as well as the matters it has reserved for its own consideration and decision-making.
To assist the Board in meeting its responsibilities, the Board currently has the following four Committees:
• the Audit and Risk Management Committee;
• the Nominations Committee;
• the Remuneration Committee; and
• the Health, Safety, Environment and Community Committee
Day-to-day management of Company affairs and the implementation of the corporate strategy and policy initiatives are formally delegated to the Managing Director & CEO.
The Managing Director & CEO and his direct reports form the Executive Team. This team has two sub-committees: the Zero Harm Council and People and Values Committee.
Responsibility for sustainability strategy and governance resides with the Executive Team, advised by the Corporate Sustainability Team. The Corporate Sustainability Team is led by the Vice President, Sustainability who reports to the Chief Financial Officer, thereby providing alignment with the financial performance for the Company and overall risk management.
The team’s responsibilities include sustainability reporting and advocacy, supporting the development of sustainability strategy and policy and liaising with everyone in the business to ensure sustainable practices are implemented globally.
Operational responsibility for our priority areas of: workplace health and safety, environmental impacts and resource efficiency, community impact and engagement, labour practices and our products & services resides with functional areas throughout the business.
We are committed to achieving and demonstrating the highest standards of corporate governance.
Our governance framework and practices are consistent with the Australian Securities Exchange (ASX) Corporate Governance Council’s Corporate Governance Principles and Recommendations, revisions to which were released by the ASX Corporate Governance Council on 30 June 2010 and which are applicable to financial years commencing on or after 1 January 2011 (ASX Recommendations).
Read more in our 2012 Annual Report, available on our website, www.incitecpivot.com.au.
9
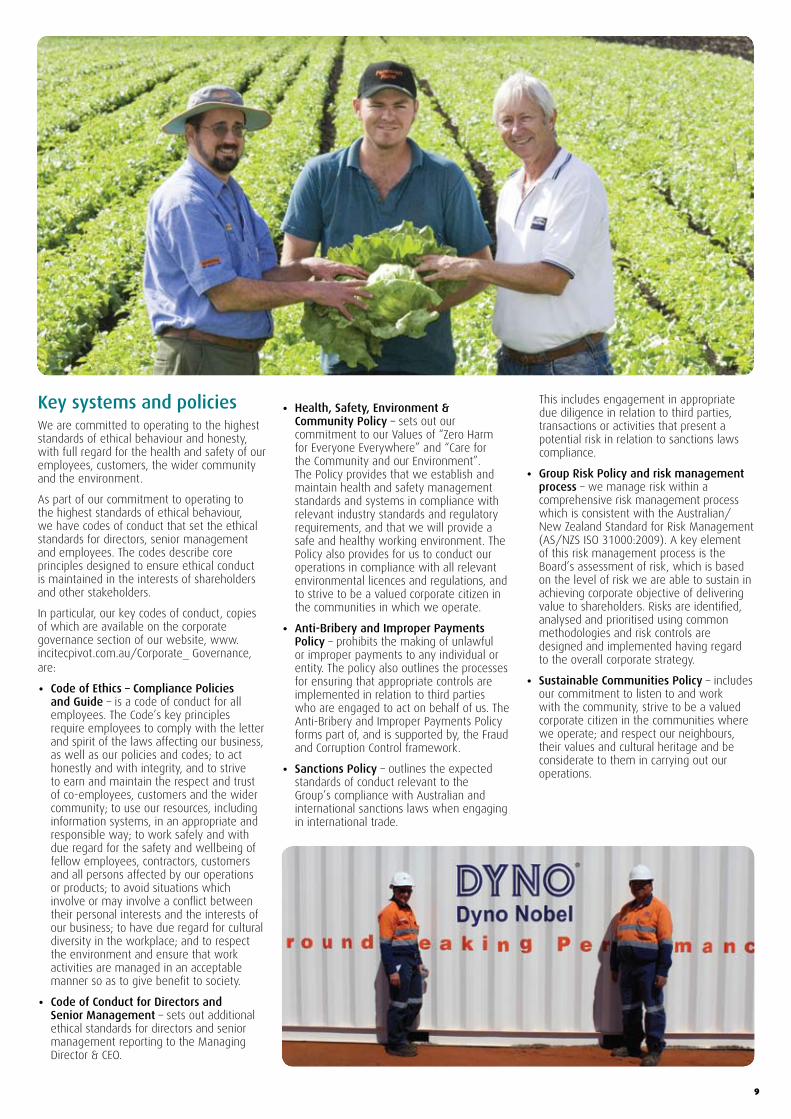
Key systems and policiesWe are committed to operating to the highest standards of ethical behaviour and honesty, with full regard for the health and safety of our employees, customers, the wider community and the environment.
As part of our commitment to operating to the highest standards of ethical behaviour, we have codes of conduct that set the ethical standards for directors, senior management and employees. The codes describe core principles designed to ensure ethical conduct is maintained in the interests of shareholders and other stakeholders.
In particular, our key codes of conduct, copies of which are available on the corporate governance section of our website, www.incitecpivot.com.au/Corporate_ Governance, are:
• Code of Ethics – Compliance Policies and Guide – is a code of conduct for all employees. The Code’s key principles require employees to comply with the letter and spirit of the laws affecting our business, as well as our policies and codes; to act honestly and with integrity, and to strive to earn and maintain the respect and trust of co-employees, customers and the wider community; to use our resources, including information systems, in an appropriate and responsible way; to work safely and with due regard for the safety and wellbeing of fellow employees, contractors, customers and all persons affected by our operations or products; to avoid situations which involve or may involve a conflict between their personal interests and the interests of our business; to have due regard for cultural diversity in the workplace; and to respect the environment and ensure that work activities are managed in an acceptable manner so as to give benefit to society.
• Code of Conduct for Directors and Senior Management – sets out additional ethical standards for directors and senior management reporting to the Managing Director & CEO.
• Health, Safety, Environment & Community Policy – sets out our commitment to our Values of “Zero Harm for Everyone Everywhere” and “Care for the Community and our Environment”. The Policy provides that we establish and maintain health and safety management standards and systems in compliance with relevant industry standards and regulatory requirements, and that we will provide a safe and healthy working environment. The Policy also provides for us to conduct our operations in compliance with all relevant environmental licences and regulations, and to strive to be a valued corporate citizen in the communities in which we operate.
• Anti-Bribery and Improper Payments Policy – prohibits the making of unlawful or improper payments to any individual or entity. The policy also outlines the processes for ensuring that appropriate controls are implemented in relation to third parties who are engaged to act on behalf of us. The Anti-Bribery and Improper Payments Policy forms part of, and is supported by, the Fraud and Corruption Control framework.
• Sanctions Policy – outlines the expected standards of conduct relevant to the Group’s compliance with Australian and international sanctions laws when engaging in international trade.
This includes engagement in appropriate due diligence in relation to third parties, transactions or activities that present a potential risk in relation to sanctions laws compliance.
• Group Risk Policy and risk management process – we manage risk within a comprehensive risk management process which is consistent with the Australian/New Zealand Standard for Risk Management (AS/NZS ISO 31000:2009). A key element of this risk management process is the Board’s assessment of risk, which is based on the level of risk we are able to sustain in achieving corporate objective of delivering value to shareholders. Risks are identified, analysed and prioritised using common methodologies and risk controls are designed and implemented having regard to the overall corporate strategy.
• Sustainable Communities Policy – includes our commitment to listen to and work with the community, strive to be a valued corporate citizen in the communities where we operate; and respect our neighbours, their values and cultural heritage and be considerate to them in carrying out our operations.

10 Incitec Pivot Limited Sustainability Report 2012
Workplace health and safety
Our performance• Our Total Recordable Injury Frequency Rate
was 1.45. While the severity of incidents has reduced, this represents an almost 17% increase over last year’s result, which is disappointing (discussed further on page 13).
• We consolidated our approach to workplace health and safety and developed a new five year Health, Safety and Environment (HSE) Strategy designed to prevent all workplace injuries, illnesses and environmental incidents. This was approved by both the Board and Executive Team, with new leadership positions and governance structures created to support its implementation.
• We developed Group-wide safety targets and a requirement for each business unit to have corresponding targets and action plans to support these global targets.
Key challenges and opportunitiesOur key workplace health and safety challenges and opportunities include:
• Improving the safety mindset of employees at all levels of the organisation through transformational leadership.
• Achieving an excellent safety culture.
• Continuing to decrease our rate of injuries and recordable cases.
What’s next?We aspire to become one of the best performing companies in the world in workplace health and safety. This will be possible if we make a step-change in our approach as an organisation and as individuals. Our approach to health and safety underpins Business Excellence (BEx), (discussed on page 6) reinforcing that health and safety is an integral part of how we work.
To be one of the best performing organisations, we are focussing on:
• Implementing a consistent approach to the 4Ps of our HSE Strategy: Passionate Leadership, People, Procedures and Plant.
• Continuing to build our safety leadership skills and our safety culture.
• Standardising our safety processes, training, targets and reporting.
• Developing strategies, action plans and targets at each level of the business to support our Group-wide targets.
Why is this an area of focus?Achieving “Zero Harm for Everyone Everywhere” is our number one priority as a business, and one of our Values.
This Value reflects our commitment to the highest standards of health and safety performance and the emphasis we place on health and safety across our business. We want to ensure the wellbeing of our people, both at work and at home.
Zero Harm for Everyone Everywhere
11
HEA
LTH &
SAFETY
COM
MU
NITY
ENVIRO
NM
ENT
PROD
UCTS &
SERVICESPEO
PLE & CU
LTURE
WO
RKPLACE
HEA
LTH &
SAFETY
PassionateLeadership
ZeroHarm
Culture
Plant
People Procedures
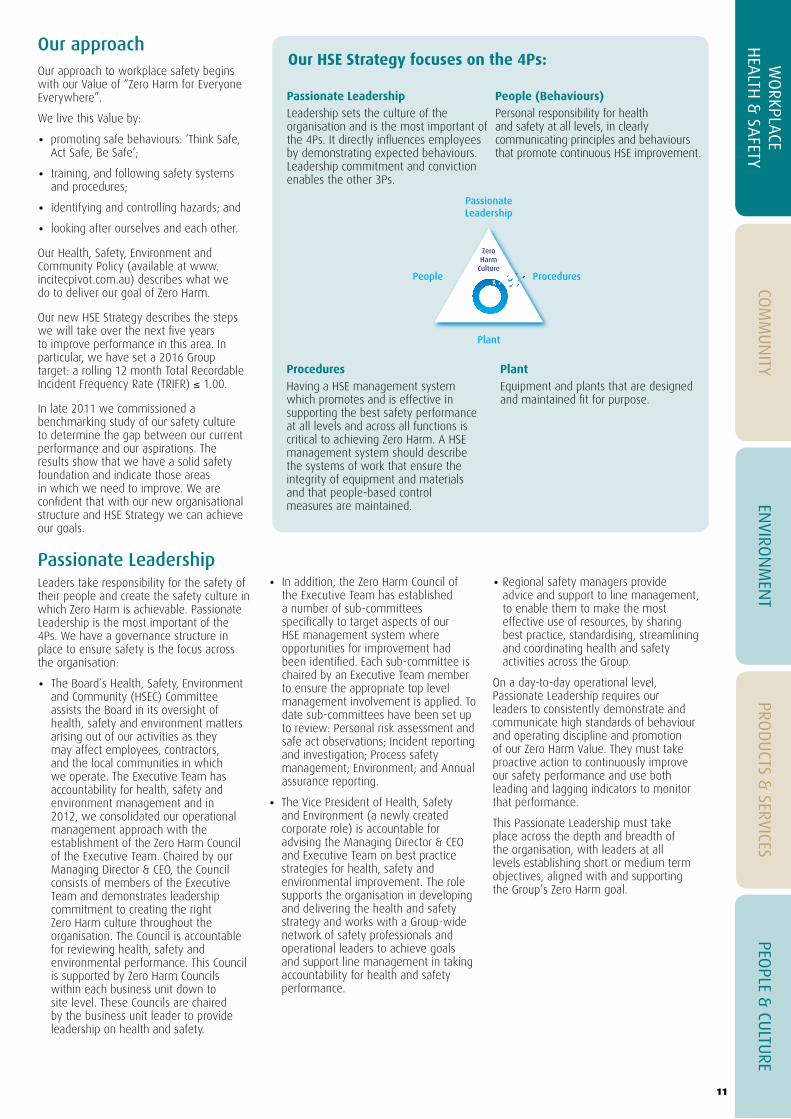
People (Behaviours) Personal responsibility for health and safety at all levels, in clearly communicating principles and behaviours that promote continuous HSE improvement.
Our approach Our approach to workplace safety begins with our Value of “Zero Harm for Everyone Everywhere”.
We live this Value by:
• promoting safe behaviours: ‘Think Safe, Act Safe, Be Safe’;
• training, and following safety systems and procedures;
• identifying and controlling hazards; and
• looking after ourselves and each other.
Our Health, Safety, Environment and Community Policy (available at www.incitecpivot.com.au) describes what we do to deliver our goal of Zero Harm.
Our new HSE Strategy describes the steps we will take over the next five years to improve performance in this area. In particular, we have set a 2016 Group target: a rolling 12 month Total Recordable Incident Frequency Rate (TRIFR) ≤ 1.00.
In late 2011 we commissioned a benchmarking study of our safety culture to determine the gap between our current performance and our aspirations. The results show that we have a solid safety foundation and indicate those areas in which we need to improve. We are confident that with our new organisational structure and HSE Strategy we can achieve our goals.
Passionate Leadership Leaders take responsibility for the safety of their people and create the safety culture in which Zero Harm is achievable. Passionate Leadership is the most important of the 4Ps. We have a governance structure in place to ensure safety is the focus across the organisation:
• The Board’s Health, Safety, Environment and Community (HSEC) Committee assists the Board in its oversight of health, safety and environment matters arising out of our activities as they may affect employees, contractors, and the local communities in which we operate. The Executive Team has accountability for health, safety and environment management and in 2012, we consolidated our operational management approach with the establishment of the Zero Harm Council of the Executive Team. Chaired by our Managing Director & CEO, the Council consists of members of the Executive Team and demonstrates leadership commitment to creating the right Zero Harm culture throughout the organisation. The Council is accountable for reviewing health, safety and environmental performance. This Council is supported by Zero Harm Councils within each business unit down to site level. These Councils are chaired by the business unit leader to provide leadership on health and safety.
• In addition, the Zero Harm Council of the Executive Team has established a number of sub-committees specifically to target aspects of our HSE management system where opportunities for improvement had been identified. Each sub-committee is chaired by an Executive Team member to ensure the appropriate top level management involvement is applied. To date sub-committees have been set up to review: Personal risk assessment and safe act observations; Incident reporting and investigation; Process safety management; Environment; and Annual assurance reporting.
• The Vice President of Health, Safety and Environment (a newly created corporate role) is accountable for advising the Managing Director & CEO and Executive Team on best practice strategies for health, safety and environmental improvement. The role supports the organisation in developing and delivering the health and safety strategy and works with a Group-wide network of safety professionals and operational leaders to achieve goals and support line management in taking accountability for health and safety performance.
• Regional safety managers provide advice and support to line management, to enable them to make the most effective use of resources, by sharing best practice, standardising, streamlining and coordinating health and safety activities across the Group.
On a day-to-day operational level, Passionate Leadership requires our leaders to consistently demonstrate and communicate high standards of behaviour and operating discipline and promotion of our Zero Harm Value. They must take proactive action to continuously improve our safety performance and use both leading and lagging indicators to monitor that performance.
This Passionate Leadership must take place across the depth and breadth of the organisation, with leaders at all levels establishing short or medium term objectives, aligned with and supporting the Group’s Zero Harm goal.
Our HSE Strategy focuses on the 4Ps:
Plant Equipment and plants that are designed and maintained fit for purpose.
Passionate LeadershipLeadership sets the culture of the organisation and is the most important of the 4Ps. It directly influences employees by demonstrating expected behaviours. Leadership commitment and conviction enables the other 3Ps.
Procedures Having a HSE management system which promotes and is effective in supporting the best safety performance at all levels and across all functions is critical to achieving Zero Harm. A HSE management system should describe the systems of work that ensure the integrity of equipment and materials and that people-based control measures are maintained.

Incitec Pivot Limited Sustainability Report 201212
WORKPLACE HEALTH & SAFETY
People (behaviours) Personal responsibility at all levels is integral to promoting continuous health and safety improvement across the Group. We are embedding this culture through BEx and specific training, which will be supplemented with the use of techniques such as safety observations, and incident and near miss investigations to share learnings. In addition to this, to drive continued improvement in health and safety, the Short Term Incentive (STI) plan applicable to Executives and other employees for 2012/13 will include a safety measure requiring an improved Total Recordable Injury Frequency Rate (TRIFR) at the end of the 2013 financial year. Further, if a fatality or life threatening incident occurs, the extent of the impact of that incident on the achievement of the safety measure will be assessed by the Board having regard to the particular circumstances of the incident and may result in part of the STI being forfeited.
An extensive safety training program has been in place for some years, managed at a Business unit level. As part of our new five year HSE Strategy we are implementing a globally consistent approach to safety training.
During the past financial year, a wide range of safety training was undertaken across the Group including:
• As part of our induction process, which is compulsory for all new employees (including contractors whose duration of engagement exceeds 40 hours). The first day of this process includes site safety information as well as discussion and sign off on our Health, Safety, Environment and Community Charter. Our ‘safety non-negotiables’ as described in the ‘Rules to Live By’ are clearly communicated at induction and reinforced by managers.
• A ‘Safety Leadership Training’ course is included in our Global Leadership Development curriculum (read more about the Leadership Development program on page 36). It aims to improve safety leadership skills across the organisation to support the ‘Passionate Leadership’ component of our 4Ps approach to safety.
• A two to four day ZIP (Zero Incident Process) behavioural safety training program. A total of 1,348 employees and leaders completed ZIP training in the past year. ZIP Coach training also began in February and March 2012, providing knowledge and skills to assist the business in transitioning from the training phase to embedding ZIP concepts into the business and sites.
We also use the ‘5S’ approach to workplace efficiency and safety hazard removal. 5S is just one of the business improvement training programs associated with BEx.
Our ‘Take5!’ personal hazard assessment tool is also used to encourage employees to consider their actions prior to commencing a task in order to avoid accidents. It encourages them to stop and think about potential hazards before acting.
Procedures Our HSE management system is a key tool underpinning safety performance at all levels and across all functions.
In the past year, individual business units were tasked with developing targets and action plans based on their own situation to achieve our safety goals. These will flow down to the development of site-level plans during the next financial year and then onto individual metrics and action plans, so there is a clear linkage between the HSE Strategy and the expectations for each employee.
To track and monitor our performance, we use a global HSE reporting system. Incidents are recorded in the reporting system at each site. Reports are generated from this database and provided to the Board and Executive Team on a monthly basis. This year, we reviewed our incident reporting and investigation process to add more rigour to the process to capture learnings thereby enabling us to effect improvements in our practices and procedures. A Letter of Assurance is presented to the Board on an annual basis. The Letter of Assurance process requires line management to self-assess their sites’ compliance with IPL’s HSE management system, including outcomes from audits conducted throughout the year, and which in turn allows the Executive Team and Managing Director & CEO to provide assurance to the Board.
Plant Given the nature of the risks involved, ensuring the safety and integrity of our major chemical manufacturing facilities is paramount. This means making sure our facilities are well designed, safely operated, and properly inspected and maintained, and meet all regulatory requirements.
We are also defining and documenting globally-consistent Operational Risk (Process Safety) Standards. These standards will become the systemic platform upon which the operating units can achieve compliance, as well as common understanding and excellence in auditing.
We regularly audit our equipment and plants and have established a rigorous Risk and Reliability Program, assessing risks to safety performance as well as overall performance. The audit cycle and this Risk and Reliability Program informs our maintenance program.
Sulphuric acid plant, Mount Isa, Queensland, Australia

13
WO
RKPLACE
HEA
LTH &
SAFETY
COM
MU
NITY
ENVIRO
NM
ENT
PROD
UCTS &
SERVICESPEO
PLE & CU
LTURE
Our Safety Performance
Personal SafetyOur safety performance is measured using a range of leading and lagging indicators, including Total Recordable Injury Frequency Rate (TRIFR), which is calculated as the number of injuries for the year x 200,000 man-hours worked. The TRIFR measure is based on the US Department of Occupational Safety and Health Administration (OSHA) criteria for recordability. The metric includes contractors.
Our TRIFR for 2011/12 was 1.45. While the severity of incidents reduced during the reporting period, this represents an almost 17% increase over last year’s result which is disappointing. We recognise that we must make positive progress each year in order to attain our goal of Zero Harm.
2006
/07
2007
/08
2009
/10
2010
/11
2008
/09
0
1.5
2.0 TRIFR
1.0
0.5
2005
/06
0.80 0.
98
1.33
1.79
1.24
2011
/12
1.451.
53
Total Recordable Injury Frequency Rate over time (TRIFR)
(Note that the acquisition of Dyno Nobel was completed in 2008.)
Process Safety We have dedicated process safety engineers at our major manufacturing sites, and the sites are also supported by global technology and asset integrity specialists.
During 2011/12, we recorded 10 tier 1 process safety incidents. Tier 1 process safety incidents, as defined by the American Institute of Chemical Engineers (AIChE) Center for Chemical Process Safety (CCPS), are unplanned or uncontrolled releases of any material or energy from a process that results in one or more of the consequences listed below:
• An employee or contractor lost time injury and/or fatality;
• An officially declared community evacuation or community shelter-in-place;
• Fires or explosions resulting in more than $25,000 of direct costs; or
• An acute release of flammable, combustible, or toxic chemicals greater than specified release threshold quantities.
Our 10 tier 1 process safety incidents were lost time incidents only. Each of these incidents is fully investigated to identify root causes and corrective actions are implemented to prevent them occurring again.
We implemented a number of process safety initiatives during 2011/12. These include developing Global Process Safety Management (PSM) metrics; updating process safety information; conducting process hazard studies; implementing actions from 3rd party PSM audits; and completing statutory Major Hazard Facility Safety Cases.
Incitec Pivot Limited Sustainability Report 2012 14
WORKPLACE HEALTH & SAFETY
INDIA
PAKISTAN
LATINAMERICA
MEXICO
USA
AUSTRALIA
TURKEY
CANADA
CHINA
SOUTHAFRICA
INDONESIA
PAPUA NEW GUINEA
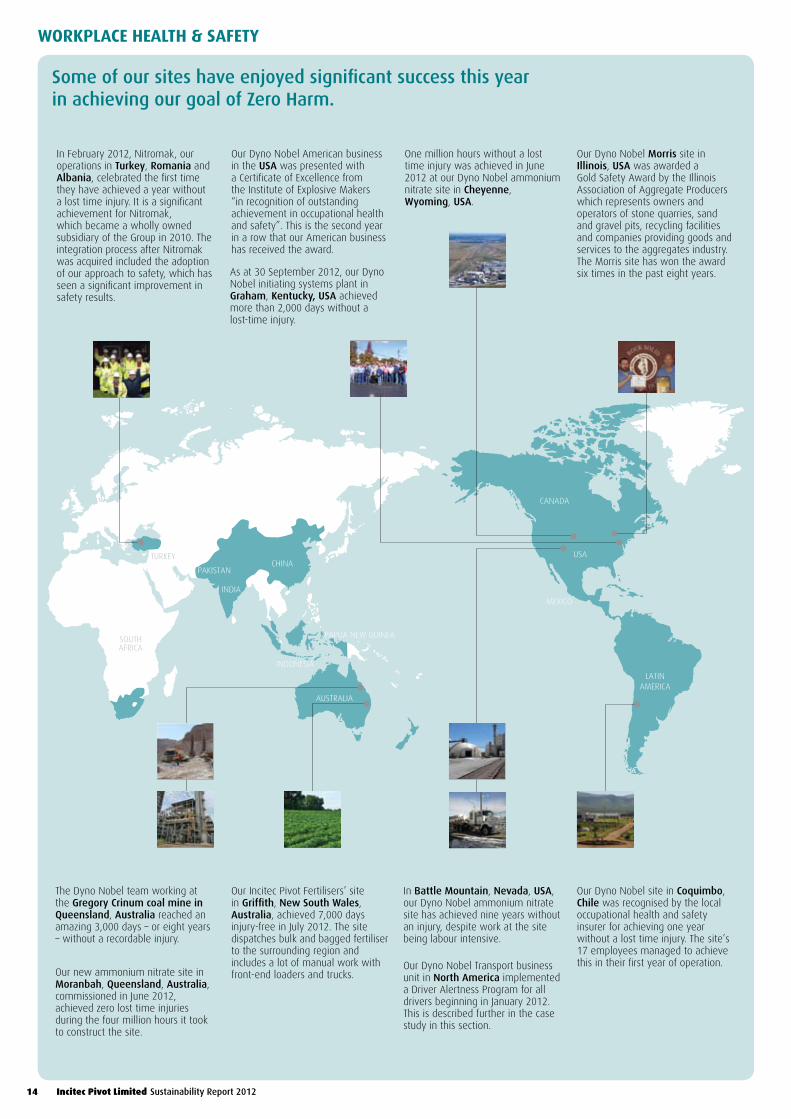
Some of our sites have enjoyed significant success this year in achieving our goal of Zero Harm.
The Dyno Nobel team working at the Gregory Crinum coal mine in Queensland, Australia reached an amazing 3,000 days – or eight years – without a recordable injury.
In Battle Mountain, Nevada, USA, our Dyno Nobel ammonium nitrate site has achieved nine years without an injury, despite work at the site being labour intensive.
Our Dyno Nobel site in Coquimbo, Chile was recognised by the local occupational health and safety insurer for achieving one year without a lost time injury. The site’s 17 employees managed to achieve this in their first year of operation.
Our Dyno Nobel Morris site in Illinois, USA was awarded a Gold Safety Award by the Illinois Association of Aggregate Producers which represents owners and operators of stone quarries, sand and gravel pits, recycling facilities and companies providing goods and services to the aggregates industry. The Morris site has won the award six times in the past eight years.
Our Dyno Nobel Transport business unit in North America implemented a Driver Alertness Program for all drivers beginning in January 2012. This is described further in the case study in this section.
Our new ammonium nitrate site in Moranbah, Queensland, Australia, commissioned in June 2012, achieved zero lost time injuries during the four million hours it took to construct the site.
As at 30 September 2012, our Dyno Nobel initiating systems plant in Graham, Kentucky, USA achieved more than 2,000 days without a lost-time injury.
Our Incitec Pivot Fertilisers’ site in Griffith, New South Wales, Australia, achieved 7,000 days injury-free in July 2012. The site dispatches bulk and bagged fertiliser to the surrounding region and includes a lot of manual work with front-end loaders and trucks.
Our Dyno Nobel American business in the USA was presented with a Certificate of Excellence from the Institute of Explosive Makers “in recognition of outstanding achievement in occupational health and safety”. This is the second year in a row that our American business has received the award.
One million hours without a lost time injury was achieved in June 2012 at our Dyno Nobel ammonium nitrate site in Cheyenne, Wyoming, USA.
In February 2012, Nitromak, our operations in Turkey, Romania and Albania, celebrated the first time they have achieved a year without a lost time injury. It is a significant achievement for Nitromak, which became a wholly owned subsidiary of the Group in 2010. The integration process after Nitromak was acquired included the adoption of our approach to safety, which has seen a significant improvement in safety results.

15
WO
RKPLACE
HEA
LTH &
SAFETY
COM
MU
NITY
ENVIRO
NM
ENT
PROD
UCTS &
SERVICESPEO
PLE & CU
LTURE
Dyno Nobel Transportation Inc. (DNTI) Driver Alertness Program has demonstrated a range of safety, productivity and personal wellbeing benefits this year.
A Fatigue Management Policy was launched last year in response to our concern for driver safety after an increase in the number of driver fatigue-related vehicle incidents.
Experts estimate 1 in 5 Americans have some form of sleep apnoea. Shift workers and those in the transportation industry have been identified as having a higher than normal rate of sleep apnoea. At any given time, DNTI has 160 drivers on the road and clocks up some 12 million miles per year.
An employee survey to determine the potential for fatigue (in particular sleep disorders) supported the Policy launch. Results indicated that 50% of respondents probably suffered from some form of sleep disorder, so training was promptly implemented for all drivers and their managers to address the widespread issue.
Management then worked with the Injury Prevention and Management Specialist to identify the most cost effective, least invasive testing and treatment program for sleep apnoea. We implemented a program called SleepWell, starting with 20 volunteers from
the Carthage Terminal. The response from the volunteer group was overwhelmingly positive and other drivers requested they be part of future programs.
A full roll out of the Driver Alertness program was implemented in January 2012 for the remaining drivers and senior managers. Participation was voluntary and all costs were covered by the business. In total 191 drivers have been screened to date with 86% showing some risk; of those at risk 75% were positive for some level of sleep apnoea.
The cost of implementing the Driver Alertness Program to date has been less than half of the cost of one fatigue related incident without injury/fatality.
The Driver Alertness Program was supported by two other initiatives, implemented to address risks associated with driving. The Smiths System® focuses on driver awareness and ZIP (Zero Incident Process) helps drivers make safe choices when on the road. Together, these initiatives resulted in the number of fatigue related incidents being reduced to zero.
Since the implementation of the Program, our drivers’ health indicators for blood pressure, blood sugar and cholesterol have improved and our drivers are now more engaged and taking ownership for their own health and safety. The business benefits are also positive with reduced number of driving accidents and decreased driver absenteeism and turnover.
Driver Alertness Program
Health and wellbeing programs Each business unit and, frequently, each site, offers health and wellbeing programs appropriate for local needs and to suit local regulatory and cultural requirements.
Examples of the types of programs available include:
All Australian and US employees have access to an Employee Assistance Program. In Australia, this program provides up to five confidential specialist counselling sessions each year, available 24 hours per day. It offers support for work and personal issues either face-to-face, over the telephone, in writing, via the internet or by video conferencing. The counselling can help with managing conflict, coping with change, stress, grief, career transitions, relationship issues, gambling, alcohol/substance abuse, parenting conflict, pain, trauma, anxiety, depression and many types of emotional difficulties.
At various sites across the world, campaigns were conducted to address: nutrition awareness, manual handling, prevention and management of eye injuries, hearing conservation, fatigue management, body stretching and strengthening.
Further, a Group-wide health self assessment program is being progressively rolled out. Some sites are provided with training and monitoring equipment to regularly self-monitor blood pressure and cholesterol. Quit smoking programs are also offered on an ongoing basis.
Stress management information and/or training is instigated at a site level as needs are identified by the relevant site manager. This may take the form of site wide training, training for specific work groups, or referral for an individual needing assistance in this manner. Counselling or other support services is also available in response to specific events e.g. a natural disaster.
Some of our sites in Australia, such as Phosphate Hill, have access to a range of health and fitness support facilities and services such as a gymnasium, other sport and recreational facilities and lifestyle, nutrition, health and fitness professional support and advice. Many other sites offer a subsidy towards gym membership or other fitness programs as well as site occupational health assessments.
CASE STUDY

Incitec Pivot Limited Sustainability Report 2012 16
Community
Be proactively involved with our communities
Our performance• We released our first Community Investment
Framework which establishes investment guidelines and a consistent approach across our sites.
• We increased our community contributions by 38% over last year (excluding one-off disaster relief spend).
• We developed systems and processes to capture and report community investments, allowing us to communicate key facts to our stakeholder groups.
• We established two new community investment programs – the Community Fund and Dollar for Dollar (a corporate/employee donation matching program).
• We had constructive dialogue with the communities neighbouring our major development projects in Australia and the USA.
• As part of our diversity approach, we expanded and further developed our indigenous employment programs.
Key challenges and opportunitiesOur key community challenges and opportunities include:
• Maintaining our social licence to operate, with the inherent risks of chemical manufacture.
• Building our reputation in the community to support our aim of being an employer of choice.
• Standardising and formalising our approach to community consultation.
• Reliably gathering information about all of our community activities from across our global operations.
What’s next?We will continue to improve our approach to community relations, including:
• Continuing to develop a Group-wide approach to community relations and embedding principles of community engagement at all sites (through the roll out of the sustainability component of the Business Excellence (BEx) transformation, read more on page 6).
• Embedding the Community Investment Framework across our global operations.
• Engaging employees to make a difference in their communities.
• Understanding and managing the impacts we have on our communities to enable the development and implementation of programs that deliver mutual benefits.
Why is this an area of focus?We understand that long term and meaningful relationships with our communities are fundamental to maintaining our social licence to operate and we believe we have an economic and social responsibility to make a positive contribution.
As a global chemical company with operations in many countries, our approach to communities varies widely, depending on where our sites are located. For example, in remote sites, such as Phosphate Hill in outback Queensland, Australia we have few neighbours. In regional towns we are often a major employer and customer and, in industrial estates, we are one of many other manufacturing or distribution businesses.
Sulphuric acid plant, Mount Isa, Queensland, Australia

17
WO
RKPLACE
HEA
LTH &
SAFETY
COM
MU
NITY
ENVIRO
NM
ENT
PROD
UCTS &
SERVICESPEO
PLE & CU
LTURE
Our approach We are committed to building long term and meaningful relationships with the communities in which we operate in accordance with our Group Value of “Care for the Community & our Environment”. We actively engage with community members and representatives of national and international charities, regulators, Governments and grass-roots community organisations including resident groups, councils, farmers, sporting clubs and environmental groups. Our sites comply with appropriate local, state and federal regulations and we undertake environmental and community impact assessments on feasibility and development projects where required.
We aim to have a positive impact through working closely with community representatives, providing local employment and selecting local suppliers. Typically, our employees who live and work within a community are best placed to engage and communicate with that community, mitigating negative impacts and creating positive perceptions and outcomes.
Our Sustainable Communities Policy (available at www.incitecpivot.com.au) defines our approach to community relations, including commitments to:
• Listen to and work with the community;
• Strive to be a valued corporate citizen; and
• Respect our neighbours, their values and cultural heritage, and be considerate to them in carrying out our operations.
Community consultation on major development projectsAppropriately, most of our community consultation activity is in support of major development projects. These construction projects are typically multi-million dollar developments, taking place over months and years. The local community, understandably, has questions and concerns about how such developments may impact them. We employ stakeholder and community engagement specialists to support the project teams and our local people to ensure timely, transparent communications throughout a project’s life cycle.
Some examples include:
Kooragang Island Project, Australia
During 2011/12, we commenced a feasibility study into building an ammonium nitrate operation on our site at Kooragang Island in the Hunter Valley, New South Wales, Australia. In September 2012, we announced this study was suspended and that a decision on whether to proceed with the development would be deferred for at least two years, reflecting the anticipated reduction in demand for ammonium nitrate and the high cost of construction in Australia.
Community consultation began in October 2011 and included establishing a community liaison group with an independent Chairperson, conducting community information sessions, three letter drops to 10,000 residents, advertisements in local newspapers and conducting an independent telephone survey of 663 community members. The study also involved consultation with environmental and emergency regulators and state and local Governments.
A project website and online forum was created to provide regular updates and respond to community feedback (www.iplkooragang.com.au).
We are continuing to seek regulatory approvals, with the next steps being completing an Environmental Impact Assessment. We will continue to keep the community informed as we move to seek final determination of the planning approval from New South Wales Government in early 2013.
Port Hedland Project, Australia
Our Explosives business has built a new A$40 million emulsion plant at Port Hedland, the main port within the Pilbara region of Western Australia. The new plant will have a capacity of 100,000 tonnes per year and will supplement product from Kalgoorlie, Western Australia, shortening the supply chain for our customers and reducing exposure to extreme weather events.
During earthworks, the site was closely monitored for any items of potential indigenous significance. The monitoring was conducted by the project team in conjunction with the construction contractors and representation from the Kariyarra aboriginal traditional owner group.
Our Indigenous Programs Manager visited the site this year and met with the Kariyarra traditional owners. The visit was part of stakeholder consultation for our Indigenous Employment Strategy (described in the case study on page 36).
Louisiana Project, USA
Our Explosives business is also conducting a US$30 million feasibility study into the construction of a world-scale ammonia plant in Waggaman, Louisiana, USA. The site for the proposed plant is located at an existing complex on the west bank of the Mississippi River. Stakeholder and community engagement is being undertaken to inform the community of the next steps in the feasibility study. The study is expected to be complete in the first half of 2013, and a decision on whether to proceed with the project is expected to be made in that first half.
Moranbah Project, Australia
Our A$1bn ammonium nitrate site in Moranbah, Queensland, Australia covers an area of 280 hectares and is located 4.5 km north-west of Moranbah, close to the major Bowen Basin coal mines. Moranbah is the sixth ammonia plant in the Group and when it reaches full production, will make 360,000 tonnes of ammonium nitrate a year in prill form.
Moranbah is a coal mining town of approximately 10,000 people. The project has employed around 600 people throughout the construction phase and employs approximately 100 people now that it is fully operational. Our Moranbah team is actively participating in local community life and has formed a Community Engagement Team to promote positive community relationships. The team identifies opportunities to assist local organisations with in-kind support and, if appropriate, targeted Group funding.
A scheme has also been introduced to help ease the shortage of day child care facilities in town. The scheme encourages partners of our employees to establish home-based family day care services in Company-owned housing. In addition to providing much needed day care places in the community, financial assistance was also provided, to assist families in starting their own day care businesses.

Incitec Pivot Limited Sustainability Report 2012 18
COMMUNITY
Our site at Cheyenne, Wyoming, USA, manufactures ammonium nitrate solution and prill, ammonia, UAN (a liquid fertiliser made with urea and ammonium nitrate) and urea and is situated 3.5 miles west of Cheyenne. Cheyenne is the closest manufacturer of ammonium nitrate to the largest coal fields in North America.
The site employs approximately 150 people and employees are supported and encouraged to volunteer within the local community. This results in many team activities, ranging from providing
Thanksgiving meals to needy families to supplying 2,500 sack lunches through the “Friday Food Bag Project” for elementary school aged children. Employees also volunteered to support a project to donate school supplies and backpacks to more than 1,000 families with school aged children.
The site also sponsors fundraising events and sponsors employees and their children who participate in athletic, music, and academic events each year in the Community of Cheyenne.
Many of our operational sites have community engagement programs in place to facilitate two-way communication between the site and the local community.
For example, our fertiliser manufacturing site in Geelong, Victoria, Australia conducts 3–4 community meetings a year. Local residents and community groups are notified of the meeting via email or letter drop. During the meetings, site representatives present data about the site, such as the results of ongoing environmental monitoring. Community leaders are provided with the telephone numbers of key site employees and are able to notify them of issues, such as dust being emitted from the site, when they arise.
Together with some of our mining customers we participate in community forums about new mine sites. These educational sessions
explain how the blasting process works and potential post-blast impacts. Attendees can ask questions of our technical experts in these forums.
We understand that communicating with neighbours and the local community is an important element in managing the response to any crisis at our sites. During the year we conducted a number of in-house training courses in North America and Australia with operational and head office employees on reputation and crisis management of incidents. A Reputation and Crisis Management manual, including tools and templates, has been developed to complement existing site emergency response and business continuity plans. The manual assists crisis management teams to effectively manage communication and engagement during an incident.
Our Fertiliser business engages with some of their communities online at www.incitecpivotfertilisers.com.au. We operate two online communities for farmers and advisors which focus on providing resources and support, particularly for those in remote locations.
• The Farmer Community provides Australian farmers with valuable agricultural and industry information to assist with agronomic and fertiliser decision making. The Community was developed in response to a growing need for readily accessible information including new product information, agronomic advice and information about global fertiliser dynamics.
Ongoing community engagement at site level
Building online communities
• The Agronomy Community is a specialist nutrition website, bringing together Australia’s leading agronomists. It is a comprehensive resource for plant nutrition agronomy and a community where members are invited to participate, interact and network with their peers. The site includes a wealth of plant nutrition information including trials data and reports, videos of fertiliser trials and photo galleries, industry journals, advice and articles.
This year, the focus was on building the information that is available in these online communities, making them a central repository for technical information such as fertiliser field trial results and other research data.
Supporting the local community in Cheyenne
CASE STUDY

19
WO
RKPLACE
HEA
LTH &
SAFETY
COM
MU
NITY
ENVIRO
NM
ENT
PROD
UCTS &
SERVICESPEO
PLE & CU
LTURE
Community investmentOur approach to Community investment matured this year, with the development and release of a Community Investment Framework. The Framework, one of our sustainability keystone projects, will help us to build lasting, sustainable and meaningful relationships with local communities and improve the level of engagement with our employees, as they are empowered to make a difference within their local communities. It also sets minimum standards all businesses and sites within the Group are required to uphold when administering community spend, ensuring a consistent global approach. Importantly, the Framework also allows each IPL business and site to respond to the distinct needs of their stakeholders and circumstances with localised approaches.
A set of ‘Principles for Giving’ support the implementation of the Framework and ensure a strategic focus across the Group. The principles focus our support on activities that provide solutions to challenges and opportunities in the communities in which we operate for mutual benefit. We have agreed three priority areas for investment for the Group which are: education, health and community development.
To support the implementation of the Community Investment Framework, a number of new programs have been initiated, including a Community Fund (providing money to support existing or new community investment programs) and a standardising and broadening of the Matching programs that are already in place including a new program called Dollar for Dollar, which sees employee and site donations matched by the Group.
We measure our community investment using the London Benchmarking Group (LBG) methodology – a global standard for reporting community investment. In 2011/12, our total community investment was $389,894 including cash, time, in-kind support and management costs.
This is a decrease in overall community investment from 2010/11, but represents an increase of approximately 38% over last
year if large once-off disaster emergency relief contributions made during 2010/11 are removed from the calculation.
These investments were largely controlled at site-level, with local employees deciding which local programs and organisations to support, and were made to a diverse range of initiatives and programs through charity campaigns, sponsorships, partnerships, volunteering and product donations, traineeships, conferences and other community services.
• Our Simsbury, Connecticut, USA site manufactures detonators for our Explosives business. The plant employs 190 people who live in the community and regularly supports the local Simsbury Volunteer fire department, police and school through donations of both cash and in-kind support, for example, providing school equipment such as laboratory coats and clipboards and patrol bicycles for the police.
• Our North American Explosives business, which is headquartered in Salt Lake City, supports a multitude of community programs by providing donations to such charities as the American Red Cross and United Way.
• In Australia, our Fertiliser business sponsors a number of organisations and programs which focus on soil health, development of skills and resources in agriculture and promoting the agricultural industry.
• Our Nitromak business has a site located in Soma, Turkey that supports local community development by working with the Soma Asayisi Destekleme Dernegi (Soma’s Public Security Support Foundation), which supports security and safety works in the town.
• Employees at our site in Gibson Island, Queensland, Australia are active in fundraising for their local community, with numerous employee fundraising events such as charity walks and bike rides taking place over the past financial year to fundraise for health charities.
• In Australia, we also sponsor a number of health, education and community development programs, for example, we are a regular contributor to the work of the Royal Flying Doctors and other emergency relief organisations, and local football, rugby league and netball teams.
Some examples of community investment activities across the Group include:
Community investment by geographic region
1% Arts & Culture
18% Environment
27% Education & Young People
1% Emergency Relief
23% Health
30% Social Welfare
66% Australia
21% USA
1% Indonesia
7% Canada
5% Turkey

Incitec Pivot Limited Sustainability Report 201220
Our performance• We established reduction targets for
greenhouse gas emissions, water use, natural gas use for energy and waste to landfill for our Australian manufacturing operations.
• We gathered data from our global operations for energy use, water use and waste for the first time. This will also enable us to establish a baseline for future efficiency targets.
• Our absolute Scope 1 and 2 GHG emissions from our global operations increased this year to 2.4 million tonnes.
• We renewed focus on environmental management with the establishment of the Zero Harm Council of the Executive Team and a new five year Health, Safety and Environment (HSE) Strategy to focus on environmental compliance and management.
Key challenges and opportunitiesOur key environmental challenges and opportunities include:
• Consolidating resource efficiency targets for all our sites and implementing a globally consistent reporting process.
• Identifying and prioritising resource inefficiencies to work towards our reduction targets.
• Continuing to improve our environmental compliance and management systems and performance.
• Responding to climate change risks and opportunities.
• Developing relationships with the community and other stakeholders to build our reputation and licence to operate (discussed further in the Community section of this Report).
What’s next?We will continue to drive forward in terms of our environmental performance, with an immediate focus on:
• Roll out of the sustainability component of Business Excellence (BEx) across all areas of our business.
• Increased education and training, embedding principles of sustainable resource use, environmental best practice and community engagement at sites, leading to improved economic, social and environmental performance.
• Developing and implementing North American resource efficiency targets.
• Implementing a continuous and globally consistent reporting process for key environmental performance data.
• Continuing to improve environmental governance, aiming for integrated and multidisciplinary ownership of environmental issues and legacies.
.
Why is this an area of focus?As an international manufacturer of industrial explosives and fertilisers, our operations rely on resources such as natural gas and water and have the potential to impact the environment through emissions of Greenhouse Gases (GHG), waste generation and contamination of soil and groundwater. We take our environmental responsibility seriously and are committed to our Value of “Care for the Community & our Environment”.
We have in place and continue to improve the management processes and systems to make our operations and products more environmentally sustainable and seek to respond to our stakeholders in regard to our environmental impacts and dependencies.
Environment
Minimise environmental impacts and leave no legacies

21
WO
RKPLACE
HEA
LTH &
SAFETY
COM
MU
NITY
ENVIRO
NM
ENT
PROD
UCTS &
SERVICESPEO
PLE & CU
LTURE
Our approach As per our Value of “Care for the Community & our Environment”, we apply a continuous improvement approach to management of environmental matters, focusing on the efficient use of non-renewable resources, environmental management at our sites and the rehabilitation and remediation of contaminated sites.
Our Health, Safety, Environment and Community Policy states that we will:
• conduct our operations in compliance with all relevant environmental licences and regulations;
• promote the efficient use of resources and energy; and
• strive to minimise our impact on the environment.
Our sustainability agenda includes a strong focus on progressively increasing resource efficiency. This requires us to go beyond compliance and actively reduce our energy and water use as well as our use of other non-renewable resources. Our site-based approach to environmental and social sustainability will expand to include our entire value chain as our sustainability approach matures.
Targets for GHG emissions, natural gas use, water use and waste to landfill have been established for our Australian manufacturing operations. Read more about these targets and target setting in the case study on page 23. We are working towards establishing targets for all other operations.
The risks and opportunities associated with climate change have been assessed. These are described in our Carbon Disclosure Project submission, a copy of which is available at www.incitecpivot.com.au
We have a governance structure in place across the organisation to ensure a continuous approach to management of environmental impacts:
• The Board’s Health, Safety, Environment and Community (HSEC) Committee assists the Board in its oversight of health, safety and environment matters arising out of our activities as they may affect employees, contractors, and the local communities in which we operate.
• The Executive Team has accountability for health, safety and environment management and, in 2012, we added renewed focus with the establishment of the Zero Harm Council of the Executive Team. Led by our Managing Director & CEO, the Council consists of members of the Executive Team and demonstrates leadership commitment to creating the right Zero Harm culture throughout the organisation. The Council is accountable for reviewing health, safety and environmental performance. This Council is supported by Zero Harm Councils within each business unit, down to site level. These Councils are chaired by the business unit leader to provide leadership on health, safety and environment.
• In addition, the Zero Harm Council of the Executive Team established a number of sub-committees specifically to target aspects of our HSE management system where opportunities for improvement had been identified, including environment. This sub-committee is charged with identifying the environmental issues, risks and opportunities and developing action plans.
• Within each of our business units, operations staff and project teams are responsible for preparing and executing plans to support targets and strategies.
• Site managers are responsible for the operation of their site, including their environmental performance. Environmental managers within the business provide site managers with expertise to support the day-to-day environmental management of sites.
• Four working groups within our Australian manufacturing operations regularly meet to report progress against targets, share knowledge and identify hurdles. These working groups consist of the site personnel with direct responsibilities for resource reductions. The four working groups are:
1. Major Energy – this group is concentrating on reducing energy use at our large, energy intensive sites.
2. Minor Energy – this group aims to achieve energy use reductions at our smaller manufacturing sites.
3. Water – working on reducing water use and managing storm water and discharge.
4. Waste – working to reduce the impacts and costs associated with all types of waste.
Our induction process includes discussion and sign off on our Health, Safety, Environment and Community Charter for all new employees.
At our Australian sites, a central reporting system collects energy use, water use and waste data from all manned sites. The data is obtained from utility bills, except where electricity is generated on site. Electricity generated from natural gas at remote sites is metered on site and this is also entered into the database. Municipal water use is obtained from water bills, whereas volumes for storm water, river water, recycled process water or ground water are typically metered on site. The data is then consolidated and checked for reporting purposes. It is planned that data will be centrally collected in a similar way from sites in North America in 2012/13. Energy use, water use and waste data for our sites in North America and Europe were supplied separately this year.
Phosphate Hill site in Queensland, Australia
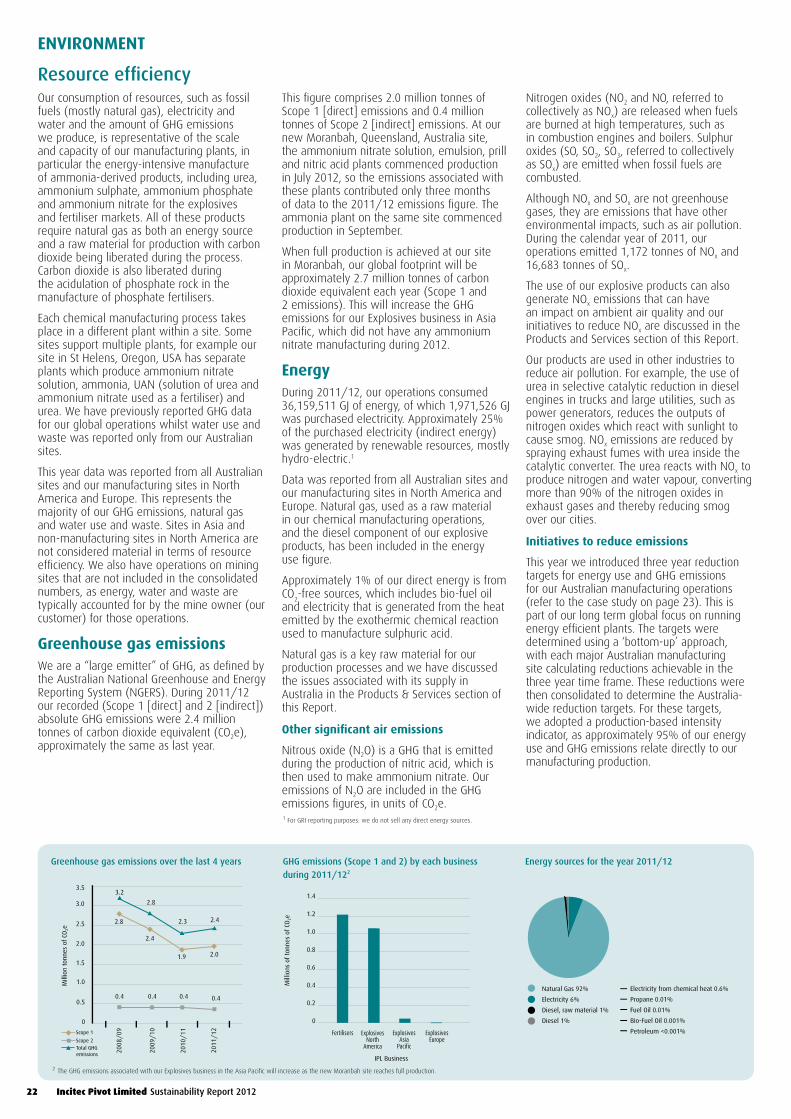
Incitec Pivot Limited Sustainability Report 201222
Our consumption of resources, such as fossil fuels (mostly natural gas), electricity and water and the amount of GHG emissions we produce, is representative of the scale and capacity of our manufacturing plants, in particular the energy-intensive manufacture of ammonia-derived products, including urea, ammonium sulphate, ammonium phosphate and ammonium nitrate for the explosives and fertiliser markets. All of these products require natural gas as both an energy source and a raw material for production with carbon dioxide being liberated during the process. Carbon dioxide is also liberated during the acidulation of phosphate rock in the manufacture of phosphate fertilisers.
Each chemical manufacturing process takes place in a different plant within a site. Some sites support multiple plants, for example our site in St Helens, Oregon, USA has separate plants which produce ammonium nitrate solution, ammonia, UAN (solution of urea and ammonium nitrate used as a fertiliser) and urea. We have previously reported GHG data for our global operations whilst water use and waste was reported only from our Australian sites.
This year data was reported from all Australian sites and our manufacturing sites in North America and Europe. This represents the majority of our GHG emissions, natural gas and water use and waste. Sites in Asia and non-manufacturing sites in North America are not considered material in terms of resource efficiency. We also have operations on mining sites that are not included in the consolidated numbers, as energy, water and waste are typically accounted for by the mine owner (our customer) for those operations.
Greenhouse gas emissionsWe are a “large emitter” of GHG, as defined by the Australian National Greenhouse and Energy Reporting System (NGERS). During 2011/12 our recorded (Scope 1 [direct] and 2 [indirect]) absolute GHG emissions were 2.4 million tonnes of carbon dioxide equivalent (CO2e), approximately the same as last year.
This figure comprises 2.0 million tonnes of Scope 1 [direct] emissions and 0.4 million tonnes of Scope 2 [indirect] emissions. At our new Moranbah, Queensland, Australia site, the ammonium nitrate solution, emulsion, prill and nitric acid plants commenced production in July 2012, so the emissions associated with these plants contributed only three months of data to the 2011/12 emissions figure. The ammonia plant on the same site commenced production in September.
When full production is achieved at our site in Moranbah, our global footprint will be approximately 2.7 million tonnes of carbon dioxide equivalent each year (Scope 1 and 2 emissions). This will increase the GHG emissions for our Explosives business in Asia Pacific, which did not have any ammonium nitrate manufacturing during 2012.
EnergyDuring 2011/12, our operations consumed 36,159,511 GJ of energy, of which 1,971,526 GJ was purchased electricity. Approximately 25% of the purchased electricity (indirect energy) was generated by renewable resources, mostly hydro-electric.1
Data was reported from all Australian sites and our manufacturing sites in North America and Europe. Natural gas, used as a raw material in our chemical manufacturing operations, and the diesel component of our explosive products, has been included in the energy use figure.
Approximately 1% of our direct energy is from CO
2-free sources, which includes bio-fuel oil
and electricity that is generated from the heat emitted by the exothermic chemical reaction used to manufacture sulphuric acid.
Natural gas is a key raw material for our production processes and we have discussed the issues associated with its supply in Australia in the Products & Services section of this Report.
Other significant air emissions
Nitrous oxide (N2O) is a GHG that is emitted during the production of nitric acid, which is then used to make ammonium nitrate. Our emissions of N2O are included in the GHG emissions figures, in units of CO2e.
Nitrogen oxides (NO2 and NO, referred to collectively as NOx) are released when fuels are burned at high temperatures, such as in combustion engines and boilers. Sulphur oxides (SO, SO2, SO3, referred to collectively as SOx) are emitted when fossil fuels are combusted.
Although NOx and SOx are not greenhouse gases, they are emissions that have other environmental impacts, such as air pollution. During the calendar year of 2011, our operations emitted 1,172 tonnes of NOx and 16,683 tonnes of SOx.
The use of our explosive products can also generate NOx emissions that can have an impact on ambient air quality and our initiatives to reduce NOx are discussed in the Products and Services section of this Report.
Our products are used in other industries to reduce air pollution. For example, the use of urea in selective catalytic reduction in diesel engines in trucks and large utilities, such as power generators, reduces the outputs of nitrogen oxides which react with sunlight to cause smog. NOx emissions are reduced by spraying exhaust fumes with urea inside the catalytic converter. The urea reacts with NOx to produce nitrogen and water vapour, converting more than 90% of the nitrogen oxides in exhaust gases and thereby reducing smog over our cities.
Initiatives to reduce emissions
This year we introduced three year reduction targets for energy use and GHG emissions for our Australian manufacturing operations (refer to the case study on page 23). This is part of our long term global focus on running energy efficient plants. The targets were determined using a ‘bottom-up’ approach, with each major Australian manufacturing site calculating reductions achievable in the three year time frame. These reductions were then consolidated to determine the Australia-wide reduction targets. For these targets, we adopted a production-based intensity indicator, as approximately 95% of our energy use and GHG emissions relate directly to our manufacturing production.
1.0
0.5
0
3.0
3.53.2
2.8
2.4
1.9 2.0
0.4 0.4 0.4 0.4
2.8
2.3 2.42.5
2.0
1.5
2008
/09
2009
/10
2010
/11
2011
/12
Mill
ion
tonn
es o
f CO
2e
Scope 1
Scope 2Total GHG emissions
Greenhouse gas emissions over the last 4 years
0
0.8
1.0
1.2
1.4
0.6
0.2
0.4
Fertilisers ExplosivesNorth
America
ExplosivesAsia
Pacific
Mill
ions
of
tonn
es o
f CO
2e
IPL Business
ExplosivesEurope
GHG emissions (Scope 1 and 2) by each business
during 2011/122
Natural Gas 92%
Electricity 6%
Diesel, raw material 1%
Diesel 1%
–
––––
Electricity from chemical heat 0.6%
Propane 0.01%
Fuel Oil 0.01%
Bio-Fuel Oil 0.001%
Petroleum <0.001%
Energy sources for the year 2011/12
1 For GRI reporting purposes: we do not sell any direct energy sources.
Resource efficiency
2 The GHG emissions associated with our Explosives business in the Asia Pacific will increase as the new Moranbah site reaches full production.
ENVIRONMENT

23
WO
RKPLACE
HEA
LTH &
SAFETY
COM
MU
NITY
ENVIRO
NM
ENT
PROD
UCTS &
SERVICESPEO
PLE & CU
LTURE
In Australia, we are part of the Australian Government’s Energy Efficiency Opportunities program and have been recognised by the Government as a “Best Practice” participant. Our case study appears on the Government website at www.ret.gov.au.
All of the nitric acid plants we currently operate have NOx abatement technology in place except our Louisiana, Missouri, USA plant. Investigations into appropriate abatement technology for the Louisiana plant are underway. The particular technology in place at our other nitric acid plants abates nitrous oxide to significantly reduce GHG emissions. The new Moranbah plant in Queensland, Australia, has N2O (GHG) abatement.
Each site determines the best way to achieve energy reduction for that site, with many now undertaking energy audits to identify possible ways to reduce energy consumption.
Some of our energy reduction activities during the year included:
• At our site in St Helens, Oregon, USA, we replaced the catalyst baskets in the Synthesis Loop with an axial-radial flow basket that reduced the system pressure in the Synthesis Loop. The drop in pressure reduced the amp load on the make-up gas and booster compressors in the Synthesis Loop resulting in an estimated 9.1% energy savings per year.
One of our focus areas of our sustainability agenda has been to use less non-renewable resources in our operations. We have established reduction targets for our Australian manufacturing sites and we will announce and report against these for the first time next year, once we finalise our reporting methodology.
Corporate Environmental Sustainability Manager, Karen Durand, said the targets were aligned with the focus on running lean, energy efficient plants while at the same time monitoring how environmentally efficient our operations are at converting raw materials into final product.
“A number of working groups were established across Australia to research, consult and develop their own site targets with more than 75 site specific initiatives identified and agreed to by our local site managers,” said Karen.
While there is a substantial amount of work to be done to achieve these targets, some of our sites are already starting to see results that are both cost-effective and environmentally responsible.
For example Dyno Nobel Asia Pacific’s Warkworth site, in the Hunter Valley New South Wales, achieved its target to divert all ammonium nitrate bags from landfill by the end of 2013, saving approximately $46,000 per year and making approximately 70 tonnes of plastic available to be recycled.
Each year 30,000 bags were stored on site before being transported to landfill. In March 2012, staff were trained to use a bag baler which meant the bags could be baled and collected by a recycler at very little cost. This recycling project is being implemented at several other Australian sites which also empty ammonium nitrate bags, and will produce similar recycled plastic tonnages and savings.
Another recycling project at Dyno Nobel’s Bajool site in Queensland is delivering a win-win scenario for our business and a local farmer.
Previously, the explosives storage and distribution site had to store and safely dispose of approximately four tonnes of floor sweepings of ammonium nitrate which were lost in the bagging process every six months.
Three employees developed a cost-effective and safe solution to the problem. By combining 60 per cent sand with 40 per cent ammonium nitrate, the spill is converted to a safe non-explosive form of nutrient that can be used as a nutrient rich topsoil. A local farmer accredited to handle ammonium nitrate uses the topsoil on his property.
A third project involves two solar power trials at Dyno Nobel sites in Queensland. These trials are implementing innovative energy saving offices from Blue Planet Buildings at Lady Loretta Mine near Mt Isa and the Ernest Henry Mine at Clonclurry.
The flat pack solar buildings can be used in any remote location as long as there is sun. With six buildings fitting onto one semi-trailer, the freight cost is greatly reduced and buildings can be quickly mobilised. They are also rated to the highest Australian Standard cyclone rating.
The 2014 environment targets and initiatives will be measured, monitored and audited through our reporting system which has been implemented across Asia Pacific manufacturing and distribution sites. The next step is to set targets and roll out a central reporting system in our North American operations.
Implementing our plan to use less at Australian manufacturing sites
CASE STUDY
• Our site in Carthage, Missouri, USA, instituted a program for steam trap monitoring and the repair/replacement of failed traps that is saving approximately 433,100 kilowatt hours (kWh) of energy per year. Steam traps are used on the outlet of steam using devices, allowing only liquids to pass, therefore trapping the gaseous steam in the device until it changes to a liquid, releasing the useful heat energy. If the steam trap is not functioning properly, it will allow gaseous steam to flow through it, thus wasting the energy associated with the condensation process. A similar steam trap maintenance and repair project was also conducted at Donora and Cheyenne, resulting in additional energy savings at these sites.
• In Lehi, Utah, USA, our research and development pilot plant was reconfigured, reducing energy consumption by approximately 40%. This will result in annual savings of approximately $60,000 on boiler fuel alone.
• At our site in Helidon in Queensland, Australia, which manufactures non-electric detonators, plant operation temperatures were optimised. This has reduced the average energy consumption per 1,000 units manufactured by approximately 14 kWh, saving $9,400 per year in electricity costs and reducing Scope 2 emissions by 116 tonnes of CO2e per year.
Climate change regulation
The Australian Government’s Clean Energy Legislative Package came into effect on 1 July 2012. It impacts our Australian operations, which contribute approximately 66% of our sales revenue. These sites generate approximately 1.2 tonnes of Scope 1 emissions as classified under the carbon pricing scheme.
We recognise that the Australian Government is committed to reducing Australian GHG emissions and helping shape a global solution. In this context, we support a well-considered and appropriately designed scheme noting that:
• In the absence of an international framework, any pricing mechanism must provide assistance to trade-exposed commodity businesses.
• Lack of appropriate assistance will result in the offshore migration of manufacturing investment and jobs to countries without domestic carbon regulation which will not achieve a net reduction in global emissions.
We have reviewed the potential impact on our Australian operations under the three-year fixed price scheme and assessed the profit impact to be less than $10M per annum.
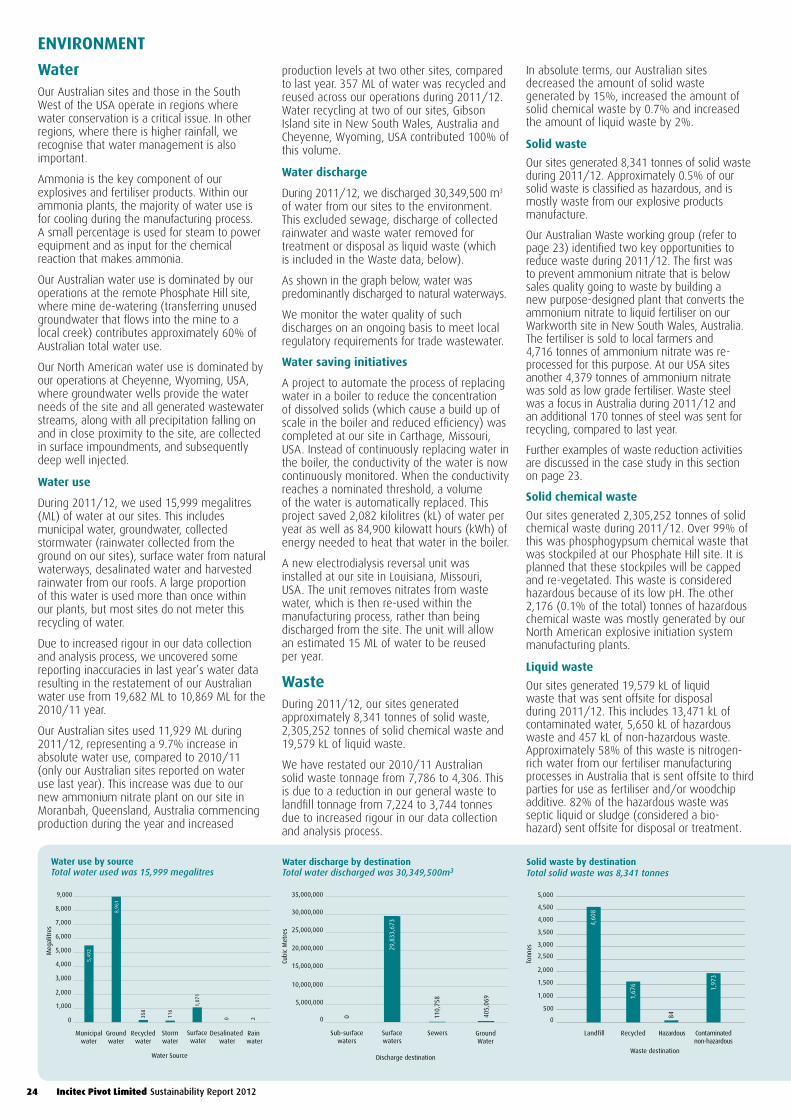
Incitec Pivot Limited Sustainability Report 201224
1,000
0
5,000
6,000
7,000
8,000
9,000
10,000
4,000
2,000
3,000
Municipalwater
Groundwater
Recycledwater
Stormwater
Surface water
Desalinated water
Rain water
Meg
alitr
es
Water Source
116
1,07
1
0 2358
5,49
2
8,96
1
Water use by source Total water used was 15,999 megalitres
5,000,000
0
25,000,000
30,000,000
35,000,000
20,000,000
10,000,000
15,000,000
Cubi
c M
etre
s
Discharge destination
Sub-surfacewaters
Surfacewaters
Sewers
0
29,8
33,6
73
110,
758
GroundWater
405,
069
Water discharge by destination Total water discharged was 30,349,500m3
500
0
2,500
3,000
3,500
4,000
4,500
5,000
2,000
1,000
1,500
Tonn
es
Waste destination
Landfill Recycled Hazardous
4,60
8
1,67
6
84
Contaminatednon-hazardous
1,97
3
Solid waste by destination Total solid waste was 8,341 tonnes
Water Our Australian sites and those in the South West of the USA operate in regions where water conservation is a critical issue. In other regions, where there is higher rainfall, we recognise that water management is also important.
Ammonia is the key component of our explosives and fertiliser products. Within our ammonia plants, the majority of water use is for cooling during the manufacturing process. A small percentage is used for steam to power equipment and as input for the chemical reaction that makes ammonia.
Our Australian water use is dominated by our operations at the remote Phosphate Hill site, where mine de-watering (transferring unused groundwater that flows into the mine to a local creek) contributes approximately 60% of Australian total water use.
Our North American water use is dominated by our operations at Cheyenne, Wyoming, USA, where groundwater wells provide the water needs of the site and all generated wastewater streams, along with all precipitation falling on and in close proximity to the site, are collected in surface impoundments, and subsequently deep well injected.
Water use
During 2011/12, we used 15,999 megalitres (ML) of water at our sites. This includes municipal water, groundwater, collected stormwater (rainwater collected from the ground on our sites), surface water from natural waterways, desalinated water and harvested rainwater from our roofs. A large proportion of this water is used more than once within our plants, but most sites do not meter this recycling of water.
Due to increased rigour in our data collection and analysis process, we uncovered some reporting inaccuracies in last year’s water data resulting in the restatement of our Australian water use from 19,682 ML to 10,869 ML for the 2010/11 year.
Our Australian sites used 11,929 ML during 2011/12, representing a 9.7% increase in absolute water use, compared to 2010/11 (only our Australian sites reported on water use last year). This increase was due to our new ammonium nitrate plant on our site in Moranbah, Queensland, Australia commencing production during the year and increased
production levels at two other sites, compared to last year. 357 ML of water was recycled and reused across our operations during 2011/12. Water recycling at two of our sites, Gibson Island site in New South Wales, Australia and Cheyenne, Wyoming, USA contributed 100% of this volume.
Water discharge
During 2011/12, we discharged 30,349,500 m3 of water from our sites to the environment. This excluded sewage, discharge of collected rainwater and waste water removed for treatment or disposal as liquid waste (which is included in the Waste data, below).
As shown in the graph below, water was predominantly discharged to natural waterways.
We monitor the water quality of such discharges on an ongoing basis to meet local regulatory requirements for trade wastewater.
Water saving initiatives
A project to automate the process of replacing water in a boiler to reduce the concentration of dissolved solids (which cause a build up of scale in the boiler and reduced efficiency) was completed at our site in Carthage, Missouri, USA. Instead of continuously replacing water in the boiler, the conductivity of the water is now continuously monitored. When the conductivity reaches a nominated threshold, a volume of the water is automatically replaced. This project saved 2,082 kilolitres (kL) of water per year as well as 84,900 kilowatt hours (kWh) of energy needed to heat that water in the boiler.
A new electrodialysis reversal unit was installed at our site in Louisiana, Missouri, USA. The unit removes nitrates from waste water, which is then re-used within the manufacturing process, rather than being discharged from the site. The unit will allow an estimated 15 ML of water to be reused per year.
WasteDuring 2011/12, our sites generated approximately 8,341 tonnes of solid waste, 2,305,252 tonnes of solid chemical waste and 19,579 kL of liquid waste.
We have restated our 2010/11 Australian solid waste tonnage from 7,786 to 4,306. This is due to a reduction in our general waste to landfill tonnage from 7,224 to 3,744 tonnes due to increased rigour in our data collection and analysis process.
In absolute terms, our Australian sites decreased the amount of solid waste generated by 15%, increased the amount of solid chemical waste by 0.7% and increased the amount of liquid waste by 2%.
Solid waste
Our sites generated 8,341 tonnes of solid waste during 2011/12. Approximately 0.5% of our solid waste is classified as hazardous, and is mostly waste from our explosive products manufacture.
Our Australian Waste working group (refer to page 23) identified two key opportunities to reduce waste during 2011/12. The first was to prevent ammonium nitrate that is below sales quality going to waste by building a new purpose-designed plant that converts the ammonium nitrate to liquid fertiliser on our Warkworth site in New South Wales, Australia. The fertiliser is sold to local farmers and 4,716 tonnes of ammonium nitrate was re-processed for this purpose. At our USA sites another 4,379 tonnes of ammonium nitrate was sold as low grade fertiliser. Waste steel was a focus in Australia during 2011/12 and an additional 170 tonnes of steel was sent for recycling, compared to last year.
Further examples of waste reduction activities are discussed in the case study in this section on page 23.
Solid chemical waste
Our sites generated 2,305,252 tonnes of solid chemical waste during 2011/12. Over 99% of this was phosphogypsum chemical waste that was stockpiled at our Phosphate Hill site. It is planned that these stockpiles will be capped and re-vegetated. This waste is considered hazardous because of its low pH. The other 2,176 (0.1% of the total) tonnes of hazardous chemical waste was mostly generated by our North American explosive initiation system manufacturing plants.
Liquid waste
Our sites generated 19,579 kL of liquid waste that was sent offsite for disposal during 2011/12. This includes 13,471 kL of contaminated water, 5,650 kL of hazardous waste and 457 kL of non-hazardous waste. Approximately 58% of this waste is nitrogen-rich water from our fertiliser manufacturing processes in Australia that is sent offsite to third parties for use as fertiliser and/or woodchip additive. 82% of the hazardous waste was septic liquid or sludge (considered a bio-hazard) sent offsite for disposal or treatment.
ENVIRONMENT

25
As previously noted, we are defined as a “large emitter” under the Australian National Greenhouse and Energy Reporting System (NGERS) and we are required to report annually on energy and GHG emissions associated with more than 50 sites throughout Australia. Direct and indirect emissions from our Australian operations are reported to the Government under this national initiative, which began in 2009.
As part of our review of internal controls and reporting procedures, assurance was obtained over our Australian GHG emissions, energy consumption and production figures for the period 1 July 2011 to 30 June 2012. The third party issued an unqualified opinion over our reported emissions, energy production and energy consumption.
We supply data regarding our Australian energy consumption and the gas emissions associated with the manufacture of fertiliser to the Fertilizer Industry Federation of Australia (www.fifa.asn.au) each year, which is published as part of their annual consolidated Public Environment Report. Details of emissions are also supplied to the International Fertilizer Association (www.fertilizer.org) for consolidated public reporting.
We report environmental release and discharge data to the National Pollutants Inventory in Australia, the Toxic Release Inventory in the United States, the National Pollutant Release Inventory in Canada and the Register of Pollutant Release and Transfer in Mexico.
In 2011, in New South Wales (NSW), Australia, the Protection of the Environment Operations Act 1997 was amended to require holders of Environment Protection Licences who undertake pollution monitoring as a result of a licence condition after 31 March 2012 are required to publish monitoring data on their corporate website. Of the five Environment Protection Licences which we hold for our NSW sites, there are two which require us to undertake pollution monitoring (Kooragang Island & Cockle Creek).
Non-compliance incidentsOur operations are subject to environmental regulation under the jurisdiction of the countries in which our operations are conducted. The environmental laws and regulations generally address the potential aspects and impacts of our activities in relation to, among other things, air and noise quality, soil, water, biodiversity and wildlife.
In certain jurisdictions, we hold licences for some of our operations and activities from the relevant environmental regulator and we measure compliance with such licences and report statutory non-compliances as required.
We categorise our environmental incidents using 4 categories:
• Category 1 – Insignificant or minor
• Category 2 – Moderate
• Category 3 – Major
• Category 4 – Catastrophic
During the 2011/12 financial year, there were no major or catastrophic incidents. However, there were 13 Category 2 environmental licence non-compliances and 14 Category 2 losses of containment.
For these purposes:
• a Category 2 environmental licence non-compliance is a moderate excursion outside statutory discharge or emission limits as set out in the relevant licence and as measured in a scheduled test; and
• a Category 2 loss of containment is an incident where there is an unplanned release or spill on a site of material from a vessel, tank, pipe pump, container or package in which it was designed to be contained and such incident causes moderate injury or damage, impacts the environment or causes concern in the surrounding community.
Site remediationWe are addressing a number of legacy contamination issues caused by our long term operations, as well as issues inherited from predecessors or neighbouring operations. Remediation is being undertaken at a number of sites for which financial provisions have been made and which are considered to be material. Most of these properties have long operational histories and a legacy of contamination that needs to be remediated to today’s standards. Several sites now require only periodic monitoring, while others have either immaterial impacts or are undergoing active phases of remediation.
Wallaroo in South Australia is an example of one of the sites under remediation. The site was used by IPL as a Fertiliser Distribution Centre and was closed in 2006, having previously been the site for a copper smelter. Since closure, we have invested over $20 million to remediate on site soil and groundwater. An area of historical significance on the site was identified and will be handed over to the local council, with the design of the heritage site currently underway.
WO
RKPLACE
HEA
LTH &
SAFETY
COM
MU
NITY
ENVIRO
NM
ENT
PROD
UCTS &
SERVICESPEO
PLE & CU
LTURE
2
0
10
12
14
16
8
4
6
2007
/08
2008
/09
2009
/10
2010
/11
2011
/12
Num
ber
of n
on-c
ompl
ianc
es
Environmental licence non-compliances
2006
/07
Losses of containment
Dyno Nobel business included from 01/07/08
Environmental non-compliance incidents of category 2+
Environmental compliance
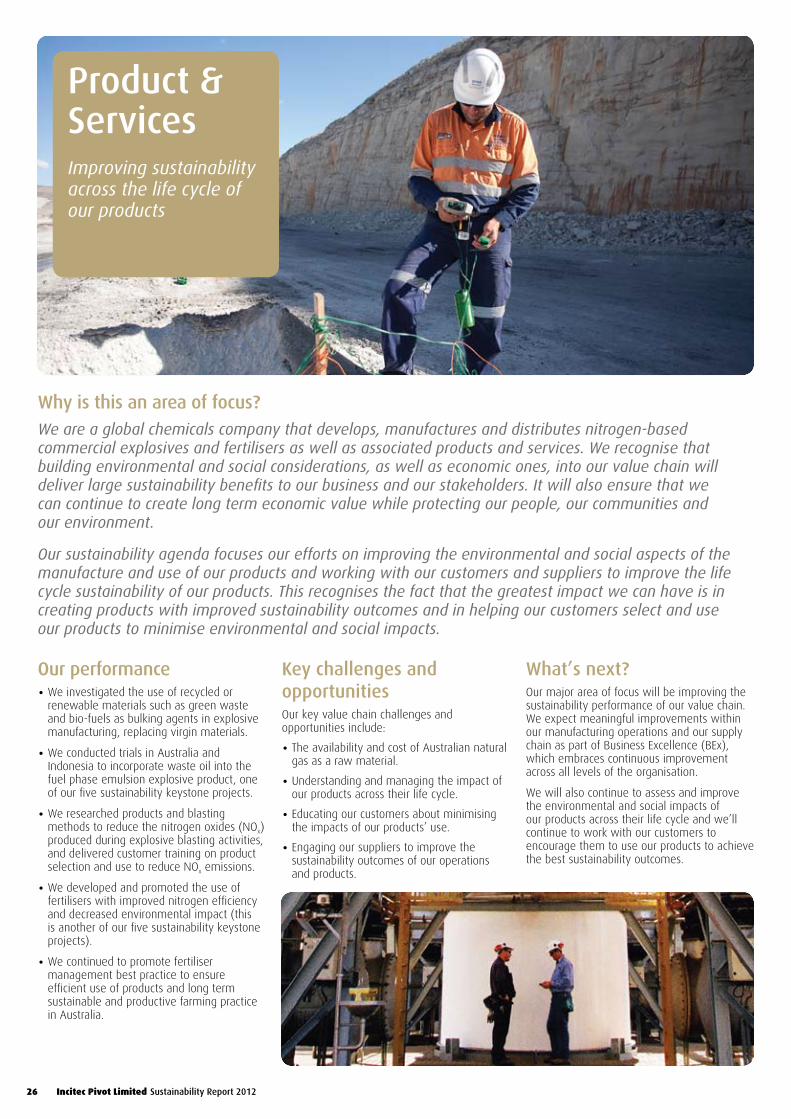
Incitec Pivot Limited Sustainability Report 201226
Our performance• We investigated the use of recycled or
renewable materials such as green waste and bio-fuels as bulking agents in explosive manufacturing, replacing virgin materials.
• We conducted trials in Australia and Indonesia to incorporate waste oil into the fuel phase emulsion explosive product, one of our five sustainability keystone projects.
• We researched products and blasting methods to reduce the nitrogen oxides (NOx) produced during explosive blasting activities, and delivered customer training on product selection and use to reduce NOx emissions.
• We developed and promoted the use of fertilisers with improved nitrogen efficiency and decreased environmental impact (this is another of our five sustainability keystone projects).
• We continued to promote fertiliser management best practice to ensure efficient use of products and long term sustainable and productive farming practice in Australia.
Key challenges and opportunitiesOur key value chain challenges and opportunities include:
• The availability and cost of Australian natural gas as a raw material.
• Understanding and managing the impact of our products across their life cycle.
• Educating our customers about minimising the impacts of our products’ use.
• Engaging our suppliers to improve the sustainability outcomes of our operations and products.
What’s next? Our major area of focus will be improving the sustainability performance of our value chain. We expect meaningful improvements within our manufacturing operations and our supply chain as part of Business Excellence (BEx), which embraces continuous improvement across all levels of the organisation.
We will also continue to assess and improve the environmental and social impacts of our products across their life cycle and we’ll continue to work with our customers to encourage them to use our products to achieve the best sustainability outcomes.
Why is this an area of focus?We are a global chemicals company that develops, manufactures and distributes nitrogen-based commercial explosives and fertilisers as well as associated products and services. We recognise that building environmental and social considerations, as well as economic ones, into our value chain will deliver large sustainability benefits to our business and our stakeholders. It will also ensure that we can continue to create long term economic value while protecting our people, our communities and our environment.
Our sustainability agenda focuses our efforts on improving the environmental and social aspects of the manufacture and use of our products and working with our customers and suppliers to improve the life cycle sustainability of our products. This recognises the fact that the greatest impact we can have is in creating products with improved sustainability outcomes and in helping our customers select and use our products to minimise environmental and social impacts.
Product & Services Improving sustainability across the life cycle of our products

27
WO
RKPLACE
HEA
LTH &
SAFETY
COM
MU
NITY
ENVIRO
NM
ENT
PROD
UCTS &
SERVICESPEO
PLE & CU
LTURE
Our Fertiliser business supplies approximately two million tonnes of fertiliser per year across Eastern and Southern Australia. We distribute fertilisers manufactured in one of our four manufacturing operations in Australia as well as imported fertilisers. Our product range includes products such as urea, ammonium phosphates, single superphosphates, anhydrous ammonia as well as speciality products such as those treated with urease and nitrification inhibitors. Blending facilities for solid fertilisers are located at strategic centres throughout the market place, offering a range of blends and, for farmers who request them, individual custom blends tailored to specific needs.
In our Fertiliser business, our sustainability focus within the value chain is on ensuring that the health, safety and environmental impact of products, product packaging and services are considered and managed responsibly and ethically throughout the product life cycle, with a particular emphasis on the effective use of fertilisers.
Our efforts to mitigate the environmental impacts of our fertiliser products include:
• Reducing the greenhouse gas emissions, water use and waste associated with the manufacturing and transport of our fertilisers (discussed in the Environment section of this Report).
• Developing and promoting enhanced efficiency fertilisers.
• Maintaining product quality, including monitoring impurities that could impact soil health.
• Adopting the Fertcare principles and code of practice, a joint initiative between the Fertilizer Industry Federation of Australia Inc. (FIFA) and the Australian Fertiliser Services Association.
Product Stewardship is the responsibility of the Marketing function within the Fertiliser business and our approach is defined in our Product Design and Stewardship Standard, included in our Health, Safety and Environment Management System. The Standard requires that “health, safety and environmental impact of products, product packaging and services are considered and managed responsibly and ethically throughout the product life cycle. The product life cycle includes research and development; purchase of raw materials, intermediates and finished products; manufacture; formulation; packaging; labelling; storage; sale; transport; use and the disposal of damaged products, waste and packaging.”
Many industry issues concerning agricultural fertilisers are not confined to individual suppliers. These are addressed at the industry level through FIFA. As Australia’s largest fertiliser supplier, we are a key member of FIFA and actively engage in FIFA Product Stewardship activities.
Raw materialsSupplier engagement
Our approach to sustainability with suppliers currently focuses on product quality and workplace safety, in line with our goal of Zero Harm. For example some of our contracts with suppliers include requirements regarding workplace health and safety standards and we have conducted audits of the ports we use for bulk shipments, which have resulted in port authorities implementing changes to improve workplace health and safety.
Supply of natural gas
Energy is an important issue for our business, particularly the supply of gas, which is used as both an energy source and as a raw material in the production of ammonia, a prerequisite for the production of nitrogen fertilisers, such as urea and ammonium phosphates, and for ammonium nitrate, for use as an explosive. Natural gas accounts for approximately 70–80% of the cost of ammonia manufacture.
In Australia, access to competitively priced gas is an emerging challenge for manufacturing industry. Despite the extensive development of non-conventional gas resources in Eastern Australia, the commitment by gas companies to long term export gas contracts has created a short term supply issue and rapidly moved Eastern Australian gas supply contracts to Export Parity Pricing, trebling the price of current gas contract rates.
Among gas-rich countries, Australia is unique in not maximising the national benefit of abundant gas supplies by balancing the comparatively small domestic demand with export gas contracts.
We believe it is essential that Australia has a coherent energy vision which harnesses Australia’s international competitive advantage in abundant natural gas to sustain and build value-added manufacturing.
Fertilisers
Ammonia – based products manufactured at our sites
UreaFertiliser
AmmoniumNitrate
Explosives
AmmoniumPhosphate
Fertiliser
AmmoniaSales
Ammonia (NH )3
AmmoniumSulphate
Fertiliser
Carbon DioxideSalesCarbon DioxideNitric AcidPhosphoric Acid Sulphuric Acid
from the airNatural Gas (CH4)
raw materialNitrogen (N2)
Nitrogen–based products manufactured at our sites

Incitec Pivot Limited Sustainability Report 201228
PRODUCTS & SERVICES
Phosphate rock
In the production of both single superphosphate fertilisers (SSP) and ammonium phosphate fertilisers, we use phosphate rock, a naturally occurring mineral rock.
We operate two SSP Manufacturing plants in Australia, at Geelong, Victoria and at Portland, also in Victoria.
The composition of phosphate rock, as a naturally occurring material, varies according to place of origin and presents therefore with varying levels of available phosphorus, cadmium, odour and reactivity, that is, the capability of the rock to react with sulphuric acid and release available phosphorus.
Our plants are configured to produce SSP using a blend of phosphate rock from different sources thereby balancing the above factors to produce a product that meets Australia’s regulations with regards to available phosphorus.
In 2012, we produced approximately 400,000 tonnes of SSP using a blend of phosphate rock from Nauru and Christmas Island, and from our supplier, Phosphates de Boucraa SA, (a wholly owned subsidiary of Officè Cherifien des Phosphates), which included rock sourced from the Non Self Governing Territory of Western Sahara, with the latter comprising approximately one third of the rock blend used.
We continue to monitor the ongoing developments with regard to the Non Self Governing Territory of Western Sahara, and have full regard to our legal and ethical obligations as they may relate to sourcing arrangements for phosphate rock, in respect of which we remain satisfied that we are not in breach of either Australian law nor International law.
At our plant at Phosphate Hill in Queensland, Australia we produce ammonium phosphate fertilisers, namely, mono-ammonium phosphate (MAP) and di-ammonium phosphate (DAP). We source the phosphate rock for MAP and DAP from our own phosphate rock mine which is adjacent to the plant. In 2012, we produced approximately 900,000 tonnes of ammonium phosphates.
Sulphuric Acid
We use sulphuric acid in the manufacture of SSP, MAP and DAP. We produce sulphuric acid at our plant at Mount Isa in Queensland, Australia which is used in the plant at Phosphate Hill, and we source additional acid, including for our SSP plants, from both domestic and international suppliers.
Product qualityFertilisers contain various impurities. These are mostly derived from the raw materials used in fertiliser manufacture.
We are committed to providing products and services that meet customer needs. Our Quality Policy, available on www.incitecpivotfertilisers.com.au outlines our commitment to primary producers in the production of clean and safe food. We manufacture a wide range of fertilisers in Australia, and source products from other Australian suppliers and overseas to offer a comprehensive product range.
In Australia, fertilisers must meet certain standards and are labelled in accordance with relevant statutory requirements and FIFA National Code of Practice for Fertilizer Description and Labelling. We have set specifications for domestically manufactured and imported fertilisers that meet these standards. Routine laboratory analyses are performed to ensure products meet these specifications.
Our manufacturing is monitored by our own Quality Control Laboratories. All of our product imports are sourced in compliance with the FIFA Purchasing Code of Practice. Product Specifications are set that meet statutory limits and market needs. Certificates of Analysis are sought from suppliers. The delivered products are then analysed through our own Quality Control Laboratories to ensure they are within specification, e.g. maximum limits of heavy metal impurities such as cadmium, lead and mercury. We declare the impurity content of fertilisers on the product label.
Research and DevelopmentThe focus of extension and research programs is on how to use existing fertiliser products more effectively. Considerable emphasis is placed on applying these products in the right place and at the right time. Soil and plant tissue analysis are used to better predict the rates at which fertilisers should be applied, and the use of computer based decision support tools to fine tune fertiliser programs is gaining favour within the industry.
We operate one of the largest commercial plant nutrition research and development programs in Australia, with more than 30 replicated research trials per annum, often in conjunction with customers, independent organisations and agronomists. Our long term program aims to produce insights that benefit Australian farmers and allow them to improve fertiliser use efficiency and adopt sustainable fertiliser practices.
We are also committed to helping farmers improve productivity and profitability through expanding and developing our range of products and services. The development of new fertilisers is driven by the needs of farmers and is focused on improving nutrient-use efficiency, flexibility and environmental performance.
One of our sustainability keystone projects is the establishment of a joint research partnership to study nitrogen losses from enhanced efficiency fertilisers to reduce environmental impacts of fertiliser use.
IPL offers two enhanced efficiency fertilisers:
• Green Urea™ is a top dressing fertiliser, recommended where volatilisation losses of ammonia are likely. Green Urea products contain urea treated with the urease inhibitor, N-(n-butyl) thiophosphoric triamide (NBPT), and are aimed at delaying hydrolysis of urea into unstable forms that may be lost to the atmosphere, thereby reducing emissions related to fertiliser usage.
• Entec® is a treatment that retains nitrogen in the stable ammonium form for an extended period. While still available to plants as a nitrogen source, ammonium nitrogen is not subject to leaching or denitrification losses.
In 2012, we commenced research on two new projects with the University of Melbourne:
• Mitigation of indirect greenhouse gases in intensive agricultural production systems with the use of inhibitors.
• Reducing nitrous oxide emissions from applied nitrogen with nitrification inhibitors through identification of key drivers of performance.

29
WO
RKPLACE
HEA
LTH &
SAFETY
COM
MU
NITY
ENVIRO
NM
ENT
PROD
UCTS &
SERVICESPEO
PLE & CU
LTURE
These projects are jointly funded by the Australian Government’s Department of Agriculture, Fisheries and Forestry and continue our long standing association with the University of Melbourne. We are also funding research into enhanced efficiency fertilisers in cereals, grass pastures, sugar, potatoes, bananas and brassicas. We are also in the process of filing a provisional patent for a new urease inhibitor.
Product labelling and information Our Fertiliser business complies with Australian state-based product labelling legislation and follows the National Code of Practice for Fertilizer Description and Labelling, developed by FIFA. This code of practice aims to achieve uniform description and labelling of fertilisers across Australia.
We provide documentation and advice to our customers about:
• Product content, particularly with regard to substances that might produce an environmental or social impact, including human health and safety.
• Safe use, storage and handling of the product.
• Disposal of the product and environmental/social impacts, as required by the appropriate laws in the countries in to which we supply fertilisers.
This advice is supplied on our website, on the product label, in the Safety Data Sheet (SDS) or directly to the customer. Our SDSs comply with the requirements of Safe Work Australia.
The sourcing of components of the product is not typically included in product documentation or labelling, unless a specific requirement exists under legislation.
Initiatives to reduce packaging wasteOver 80% of our fertiliser is supplied in bulk. 15% is distributed in bulk bags, 95% of which are returnable and are typically used five times, subject to quality inspections upon each return, before being taken out of service. At the end of their life we export them to China for recycling. Only a small percentage of our total fertiliser product (5%) is distributed in small packs and we continue to investigate recyclable packaging that meets our product specifications.
We are signatories to the Australian Packaging Covenant, a voluntary initiative by the Government and Industry to reduce the environmental effects of packaging. Our five year plan and commitments under the APC are available on our website www.incitecpivot.com.au.
Security of fertiliser productsSome of the fertilisers we manufacture and distribute are classified as security-sensitive and/or dangerous goods and as such, their storage, distribution and sale is regulated by Federal, State and sometimes local governments in Australia and the United States. We meet our regulatory compliance and licensing obligations surrounding those products, with internal procedures and training in place for our employees. In addition our sites are also managed under our own strict health, safety and environmental management system.
Best fertiliser management practicesFertilisers are essential to productive farming, allowing farmers to grow more food on a decreased area of arable land. High yields are necessary to support the world’s growing population.
To maximise fertiliser-use efficiency and return on investment, attention must be paid to how, when and where fertilisers are applied. It is also important that fertilisers are applied at appropriate rates. Too little, and crop and pasture yields may be sacrificed and produce quality affected.
Too much, and the nutrients applied in excess of crop demands may be lost, either to the atmosphere or to waterways. Nutrient enrichment of waterways can stimulate weed and algal growth, and change ecosystems.
To maximise nutrient-use efficiency, it is important that fertilisers are used at appropriate rates and in a responsible manner. Our Fertiliser business is an active member of the International Plant Nutrition Institute and promotes their 4R nutrient stewardship: Right source; Right rate; Right time; and Right place.
FIFA has a similar approach, which we also promote.
To support this, our analytical laboratory (Nutrient Advantage) offers specialist soil, plant and water testing to advisors and farmers. This, together with professional advice from our team of agronomists and our computerised decision-support system, Nutrient Advantage Advice, provides the diagnostic data, best practice information and advice farmers need to choose the right fertilisers and apply them correctly, in order to optimise nutrient use efficiency. The system is audited by FIFA every two years to ensure it complies with their fertiliser management best practice recommendations.

Incitec Pivot Limited Sustainability Report 201230
PRODUCTS & SERVICES
Our laboratory processes approximately 68,000 samples each year, servicing farmers in every state of Australia, except Western Australia. Nutrient Advantage is accredited by the Australian Soil and Plant Analysis Council and by Fertcare, an Australian fertiliser industry product stewardship program that includes training, quality assurance, certification and accreditation. The soil testing laboratory is also National Association of Testing Authorities, Australia certified.
During 2011/12, agronomy logic and functionality to support cotton farming was completely reviewed and updated in our Nutrient Advantage Advice tool. Work was also undertaken to support the growing of potatoes, carrots, onions, fruiting vegetables, leafy vegetables, brassica vegetables, poppies and temperate pastures. We also revamped our training offering with the introduction of a travelling classroom and webinars, making it easier for agronomists (who are typically located in regional and remote areas) to receive training in the use of the software program and obtain accreditation in Agronomy in Practice (Agronomy Advantage). Most sales and marketing managers and plant nutrition advisor roles within our Fertiliser business are Fertcare Accredited.
Carbon farmingWe support, in principle, the Carbon Farming Initiative (CFI), legislation which was passed by the Australian Government in August 2011. However, to generate maximum carbon offsets, we believe the CFI must create economic value for farmers and must not impact food security.
Food securityTo provide the food our growing global population demands, farmers are seeking to increase production on their land while minimising environmental impacts. We support this effort by working with researchers to grow more food using best management practices and new technologies such as controlled-release fertilisers.
We provide agronomy services and fertiliser products to help Australian farmers increase their on-farm efficiency and productivity, making their business more sustainable in a competitive global market.
Our Fertiliser business responded to the Australian Government’s call for public submissions into a National Food Plan.
Our submission included information about the opportunity for the Australian food industry to meet the changing global dietary patterns towards more livestock products, fruits and vegetables.
The submission also pointed out that Australia’s ability to produce affordable nutritional and plentiful food for its own citizens and for other countries would be vastly enhanced by the surety of a domestic capacity to produce vital inputs such as fertiliser. This, in turn, requires access to competitively priced Australian natural gas, to ensure supply for the manufacture of fertilisers, as described in the ‘Raw materials’ section above.
Geelong operations, Victoria, Australia

31
WO
RKPLACE
HEA
LTH &
SAFETY
COM
MU
NITY
ENVIRO
NM
ENT
PROD
UCTS &
SERVICESPEO
PLE & CU
LTURE
Our Explosives business, Dyno Nobel, operates in the Americas, Europe, Australia and the Asia Pacific. It manufactures, distributes and sells bulk and packaged ammonium nitrate-based explosives and blasting supplies and services to customers in the mining, quarry, construction, pipeline and geophysical exploration industries.
Within our Explosives business, efforts to mitigate the environmental impacts of our products continue to be focused on improving the sustainability of the input materials we use to manufacture the product, as well as the impacts resulting from its use. This includes activities such as:
• Substituting higher impact raw materials such as perchlorate contaminated sodium nitrate with cleaner synthetic materials.
• Replacing traditional bulking agents with renewable or recycled materials.
• Recycling product that did not meet final specifications, has been returned by customers or was used during experimental work to manufacture new product. This product was previous treated as waste and burnt.
• Replacing virgin petrochemicals with oils from renewable and waste sources.
• Researching and developing explosives to minimise post-blast NO
x fumes.
• Researching blast designs and products to reduce nitrate leaching and other post-blast impacts.
We are also reducing the greenhouse gas emissions, water use and waste associated with the manufacturing and transport of our explosives products (discussed in the Environment section of this report).
New or modified products are typically developed by our research and development team in conjunction with specific customers. As such, the life cycle stages in which health and safety impacts of those products are assessed are dependent upon the customer’s requirements. For explosives products, typically this would be focused on the impact of product use, with the assessment included in trials.
With an increasingly diverse and international supply chain, we recognise that other sustainability considerations should be taken into account across the whole value chain, and have plans to commence scoping this area in 2012/2013 as part of our BEx Value Chain transformation (read more about BEx on page 6).
Raw materialsSupplier engagement
Our approach to sustainability with suppliers is discussed in the ‘Fertilisers’ section on page 27.
Supply of natural gas
The availability and supply of natural gas as a raw material is discussed in the ‘Fertilisers’ section on page 27.
Research and developmentBulking agents
Bulking agents are used in explosives to reduce the amount of energy per volume available, making explosives suitable for use in relatively soft ground.
We have been investigating the use of recycled or renewable materials that have the technical characteristics required to be bulking agents. These would replace the materials, such as virgin expanded polystyrene beads, currently used. The proposed recycled bulking materials would typically be considered as waste within the industries that generate them, so an additional benefit of this project is a reduction in waste across other supply chains.
This year, in North America, our research was focused on the use of green waste such as sawdust. We are currently undertaking field trials of products manufactured using different types of green waste as the bulking agent in explosives.
In Australia, we are developing new technology for an explosive composition in which recycled or renewable materials are being used as a bulking agent mixed with an emulsion product for use as a fume-reducing product in wet, soft ground.
Small scale trials of the product are underway in the Hunter Valley, New South Wales, Australia, with subsequent larger scale trials planned to be completed in Queensland, Australia. We are applying for patent protection for aspects of this new technology.
Replacing virgin petrochemicals with bio-fuels and waste oils
In North America, we have developed technology that allows the use of bio-fuels and bio-fuel by-products as an alternative to petroleum-derived hydrocarbons for the manufacture of blasting agents and bulk emulsion products. The logistics and costs associated with using bio-fuels is high unless the mine site is located close by. We anticipate implementation of the technology when a site that is in close proximity to sources of bio-fuels becomes available.
We are also working with customers to introduce technologies that use petrochemicals extracted from waste materials as part of the explosive composition. Waste materials such as discarded tyres and waste oil from machinery are ideal candidates for use, particularly at remote mine sites where trucking virgin materials in and waste materials out consumes resources and time.
One of our sustainability keystone projects in our Explosives business was to develop products that use reduced waste oil and encouraging responsible use. Read more about our research and development programs in the case study on page 33.
Explosives
Moranbah facility, Queensland, Australia
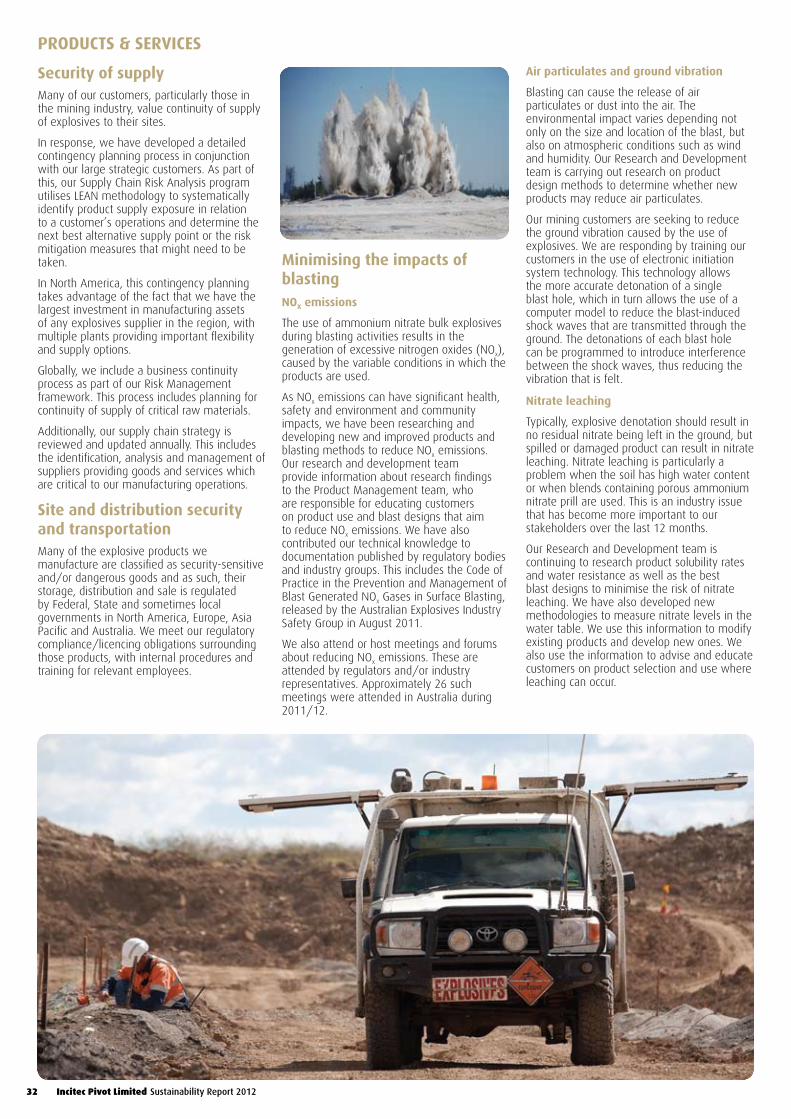
Incitec Pivot Limited Sustainability Report 2012 32
Security of supplyMany of our customers, particularly those in the mining industry, value continuity of supply of explosives to their sites.
In response, we have developed a detailed contingency planning process in conjunction with our large strategic customers. As part of this, our Supply Chain Risk Analysis program utilises LEAN methodology to systematically identify product supply exposure in relation to a customer’s operations and determine the next best alternative supply point or the risk mitigation measures that might need to be taken.
In North America, this contingency planning takes advantage of the fact that we have the largest investment in manufacturing assets of any explosives supplier in the region, with multiple plants providing important flexibility and supply options.
Globally, we include a business continuity process as part of our Risk Management framework. This process includes planning for continuity of supply of critical raw materials.
Additionally, our supply chain strategy is reviewed and updated annually. This includes the identification, analysis and management of suppliers providing goods and services which are critical to our manufacturing operations.
Site and distribution security and transportationMany of the explosive products we manufacture are classified as security-sensitive and/or dangerous goods and as such, their storage, distribution and sale is regulated by Federal, State and sometimes local governments in North America, Europe, Asia Pacific and Australia. We meet our regulatory compliance/licencing obligations surrounding those products, with internal procedures and training for relevant employees.
Minimising the impacts of blastingNOx emissions
The use of ammonium nitrate bulk explosives during blasting activities results in the generation of excessive nitrogen oxides (NOx), caused by the variable conditions in which the products are used.
As NOx emissions can have significant health, safety and environment and community impacts, we have been researching and developing new and improved products and blasting methods to reduce NOx emissions. Our research and development team provide information about research findings to the Product Management team, who are responsible for educating customers on product use and blast designs that aim to reduce NOx emissions. We have also contributed our technical knowledge to documentation published by regulatory bodies and industry groups. This includes the Code of Practice in the Prevention and Management of Blast Generated NOx Gases in Surface Blasting, released by the Australian Explosives Industry Safety Group in August 2011.
We also attend or host meetings and forums about reducing NOx emissions. These are attended by regulators and/or industry representatives. Approximately 26 such meetings were attended in Australia during 2011/12.
Air particulates and ground vibration
Blasting can cause the release of air particulates or dust into the air. The environmental impact varies depending not only on the size and location of the blast, but also on atmospheric conditions such as wind and humidity. Our Research and Development team is carrying out research on product design methods to determine whether new products may reduce air particulates.
Our mining customers are seeking to reduce the ground vibration caused by the use of explosives. We are responding by training our customers in the use of electronic initiation system technology. This technology allows the more accurate detonation of a single blast hole, which in turn allows the use of a computer model to reduce the blast-induced shock waves that are transmitted through the ground. The detonations of each blast hole can be programmed to introduce interference between the shock waves, thus reducing the vibration that is felt.
Nitrate leaching
Typically, explosive denotation should result in no residual nitrate being left in the ground, but spilled or damaged product can result in nitrate leaching. Nitrate leaching is particularly a problem when the soil has high water content or when blends containing porous ammonium nitrate prill are used. This is an industry issue that has become more important to our stakeholders over the last 12 months.
Our Research and Development team is continuing to research product solubility rates and water resistance as well as the best blast designs to minimise the risk of nitrate leaching. We have also developed new methodologies to measure nitrate levels in the water table. We use this information to modify existing products and develop new ones. We also use the information to advise and educate customers on product selection and use where leaching can occur.
PRODUCTS & SERVICES

33
WO
RKPLACE
HEA
LTH &
SAFETY
COM
MU
NITY
ENVIRO
NM
ENT
PROD
UCTS &
SERVICESPEO
PLE & CU
LTURE
As a manufacturer of nitrogen-based commercial explosives, investment in research and development is integral to our goal to use less non-renewable resources. Innovative and environmentally responsible products and services developed and distributed by our organisation, can also have a flow on effect of helping our customers to improve the sustainability of their own operations.
Jeff Gore, Research and Development Manager, says that our Technical Centre at Mount Thorley in New South Wales, Australia has been working on a number of research and development projects to improve the sustainability of the input products we use to manufacture explosives.
“It’s pleasing to see that these projects have the ability to deliver cost efficiencies as well as improved sustainability outcomes for both our business and our customers,” says Jeff.
One of these projects includes a proposal that waste oil could be used to produce a stable emulsion explosive product. Waste oil is generated from mining equipment and typically collected and processed off site, requiring transport logistics and processing at a treatment plant.
A series of trials were completed at the Technical Centre in Mount Thorley to test whether waste oil could replace virgin materials, such as diesel and mineral oils.
The tests found that using waste oil delivered a product with improved sustainability outcomes while maintaining product quality and blasting reliability.
Successful field trials on the use of waste oil to manufacture emulsion were performed at an Indonesian mine site during 2011/12, where the project delivered cost reductions and increased mine production, as well as environmental benefits. The technology is now ready for commercial release.
While the key benefit of using waste oil is improved sustainability for both our business and our customers, it also significantly reduced the costs associated with transport logistics, waste oil treatment and diesel consumption. In addition, using waste oil would be especially beneficial to remote mine sites where the cost of a small scale waste oil treatment plant more than off-sets the transport costs associated with waste oil.
At our North American operations, waste oil has been incorporated into our manufacturing processes for some time. Approximately 982,700 kg of waste oil was used during 2011/12 in the manufacture of explosive emulsions.
Also at our Mount Thorley Technical Centre in Australia, a new explosives product is under development that incorporates recycled or renewable materials mixed with ammonium nitrate emulsion.
A number of tests have been conducted using a recycled waste plastic at the Warkworth Depot in the Hunter Valley, New South Wales, Australia. The tests have demonstrated that the recycled waste plastic bulking agent is compatible with our standard Mobile Processing Unit (MPU) delivery systems.
Further trials have been scheduled and it is envisaged that tests will be run on a larger scale in Queensland, Australia subject to an agreement with the manufacturer. This is a new technology we are working on.
Another technology that may reduce post blast NOx generation has also been developed at Mount Thorley. By the addition of an additive to ammonium nitrate emulsion explosive blends, water associated with excessive NOx generation. Trials of the technology are scheduled in both New South Wales and Queensland. We are obtaining patent protection for some of this new technology.
In addition, Dyno Nobel Asia Pacific and an Australian university have been provided funding by the Australian Research Council to study the “Mitigation of NOx during blasting with Ammonium Nitrate Explosives.”
Support and educating customers
We continuously educate our customers about choosing the right product and blast plan to minimise environmental impacts.
In addition to providing information about the technical aspects of the use of our explosives products, our technical support teams and our Dyno Consult business provide documentation and advice to our customers about:
• Product content, particularly with regard to substances that might produce an environmental or social impact, including human health and safety.
• Safe use, storage and handling of the product.
• Disposal of the product as required by applicable law.
This advice is supplied on our websites, on the product label, in the Safety Data Sheet (SDS) or directly to the customer.
In Australia, our SDSs comply with the requirements of Safe Work Australia. SDSs for products that are supplied in the United States comply with the Mine Safety and Health Administration (MSHA) for products destined for the mining industry as well as the requirements of the Globally Harmonized System of Classification and Labelling of Chemicals.
The sourcing of components of the product is not typically included in product documentation or labelling.
In North America, our Dyno Nobel business operates the ‘Quarry Academy’, a training centre for stone quarry operators. The curriculum includes training on the benefits of the chemical crushing of stone, versus traditional mechanical crushing. These benefits include lower costs, less electricity usage and improved environmental and social impacts e.g. lower dust production. In Australia, our teams run ‘NOx forums’ for customers onsite to educate them about the factors associated with NOx production and how to minimise it.
Additionally, courses in optimum blasting techniques for both surface mining and another for underground mining are offered to customers.
Product end of lifeProduct that doesn’t meet final specification or is returned by customers is used by our Research and Development team for product development purposes or is incorporated back into our emulsion manufacturing. For example, in the United States, during 2011/12, approximately seven million kilograms of such material was used in manufacturing, replacing approximately 4% of raw materials in select product lines for bulk emulsion.
Initiatives to reduce packaging wasteSeveral of our Explosives sites have enjoyed considerable success in reducing their package waste. This is discussed further in the case study in the ‘Environment’ section of this Report.
Developing sustainable products for the future
CASE STUDY

34 Incitec Pivot Limited Sustainability Report 2012
Our performance• We matured our learning management
approach, including expanding our leadership development curriculum and introducing a new global learning job framework. The global framework is the basis for our implementation of a new Learning Management System.
• We refined our leadership competencies to support the cultural transformation we are enabling through BEx (refer to page 6 for more information) and to deliver our strategic priorities.
• We developed a Diversity Strategy which will be implemented in a phased approach, starting with Australia and followed by the US and Canada, with the intention for a global approach to be in place by 2014/15.
• During the year, as a percentage of total hires, the number of female employees increased from 17% to 21%. We also recruited five female graduates as part of our 2013 graduate recruitment program, presenting over a third of the total graduate intake. This is significant as no female graduates were recruited for the 2012 program.
• Our learning and development programs were aligned to support the roll out of our BEx transformation and provided more than 1,800 days of training, with more than 1,500 employees trained in leadership and coaching skills.
Key challenges and opportunitiesOur key workforce challenges and opportunities include:
• Ensuring that we have skilled, diverse and ready talent to meet future demands. This is a major industry challenge, not one facing our business alone.
• Attracting and retaining talented people.
• Being an inclusive and accessible organisation through the development of a culture that embraces diversity.
• Enhancing our learning and development programs to reduce the time required for our employees to have all the skills and experience they need to be fully competent.
• Improving our succession planning process to ensure that we have a pipeline of employees with the right skills and experience to safeguard critical roles from vacancy.
What’s next?We will focus building the capabilities required to support BEx and this includes the following key elements:
• Developing robust human resources foundations and governance systems.
• Attracting and retaining talented people.
• Building an inclusive and accessible organisation through the development of a culture that embraces diversity.
• Creating employee capability and engagement to perform and deliver our goals.
Why is this an area of focus?The essence of a sustainable company lies in its people. Attracting, developing and maintaining a highly talented and diverse workforce comes from our Value of “Value People – Respect, Recognise & Reward” and is a key enabler for achieving our business objectives.
We recognise that developing the skills of our leaders and those of all employees is critical to achieving the high performance culture that is required in a global company.
People & Culture
Having the right people with the right skills, at the right time.
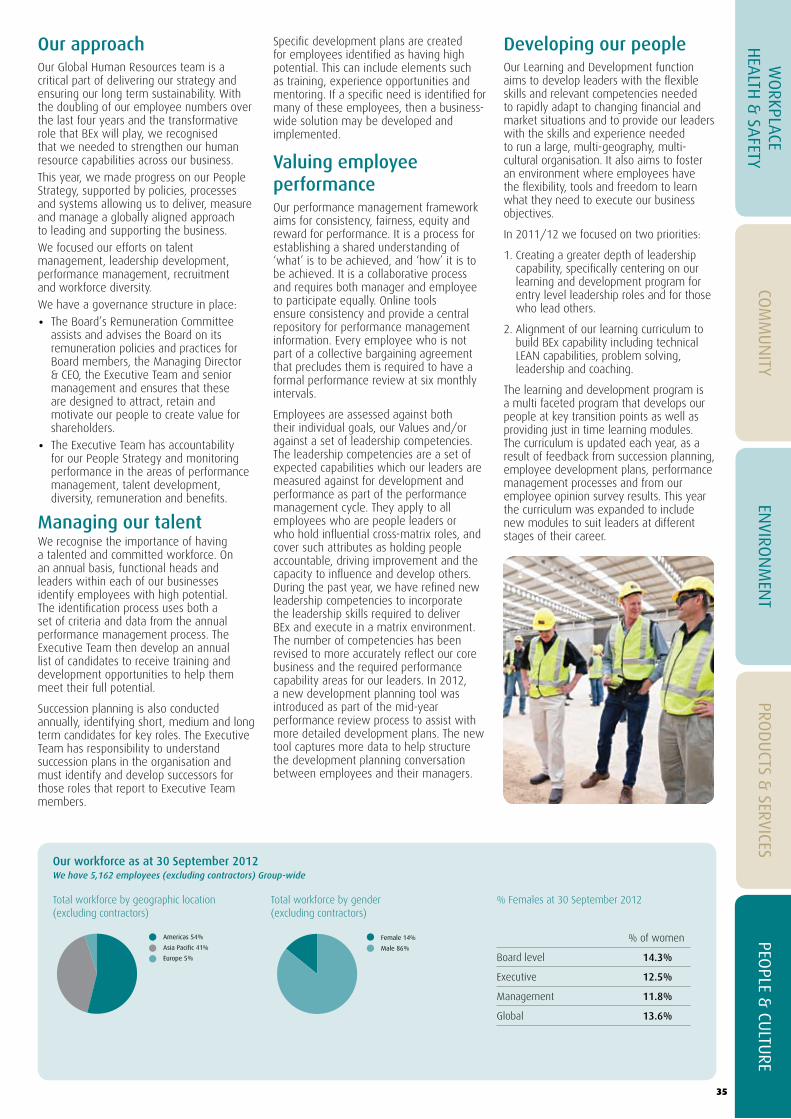
Our approachOur Global Human Resources team is a critical part of delivering our strategy and ensuring our long term sustainability. With the doubling of our employee numbers over the last four years and the transformative role that BEx will play, we recognised that we needed to strengthen our human resource capabilities across our business.
This year, we made progress on our People Strategy, supported by policies, processes and systems allowing us to deliver, measure and manage a globally aligned approach to leading and supporting the business.
We focused our efforts on talent management, leadership development, performance management, recruitment and workforce diversity.
We have a governance structure in place:
• The Board’s Remuneration Committee assists and advises the Board on its remuneration policies and practices for Board members, the Managing Director & CEO, the Executive Team and senior management and ensures that these are designed to attract, retain and motivate our people to create value for shareholders.
• The Executive Team has accountability for our People Strategy and monitoring performance in the areas of performance management, talent development, diversity, remuneration and benefits.
Managing our talent We recognise the importance of having a talented and committed workforce. On an annual basis, functional heads and leaders within each of our businesses identify employees with high potential. The identification process uses both a set of criteria and data from the annual performance management process. The Executive Team then develop an annual list of candidates to receive training and development opportunities to help them meet their full potential.
Succession planning is also conducted annually, identifying short, medium and long term candidates for key roles. The Executive Team has responsibility to understand succession plans in the organisation and must identify and develop successors for those roles that report to Executive Team members.
WO
RKPLACE
HEA
LTH &
SAFETY
COM
MU
NITY
ENVIRO
NM
ENT
PROD
UCTS &
SERVICESPEO
PLE & CU
LTURE
35
Our workforce as at 30 September 2012 We have 5,162 employees (excluding contractors) Group-wide
Total workforce by geographic location (excluding contractors)
Total workforce by gender (excluding contractors)
% Females at 30 September 2012
Americas 54%
Asia Pacific 41%
Europe 5%
Female 14%
Male 86%
Americas 54%
Asia Pacific 41%
Europe 5%
Female 14%
Male 86%
% of women
Board level 14.3%
Executive 12.5%
Management 11.8%
Global 13.6%
Specific development plans are created for employees identified as having high potential. This can include elements such as training, experience opportunities and mentoring. If a specific need is identified for many of these employees, then a business-wide solution may be developed and implemented.
Valuing employee performance Our performance management framework aims for consistency, fairness, equity and reward for performance. It is a process for establishing a shared understanding of ‘what’ is to be achieved, and ‘how’ it is to be achieved. It is a collaborative process and requires both manager and employee to participate equally. Online tools ensure consistency and provide a central repository for performance management information. Every employee who is not part of a collective bargaining agreement that precludes them is required to have a formal performance review at six monthly intervals.
Employees are assessed against both their individual goals, our Values and/or against a set of leadership competencies.The leadership competencies are a set of expected capabilities which our leaders are measured against for development and performance as part of the performance management cycle. They apply to all employees who are people leaders or who hold influential cross-matrix roles, and cover such attributes as holding people accountable, driving improvement and the capacity to influence and develop others. During the past year, we have refined new leadership competencies to incorporate the leadership skills required to deliver BEx and execute in a matrix environment. The number of competencies has been revised to more accurately reflect our core business and the required performance capability areas for our leaders. In 2012, a new development planning tool was introduced as part of the mid-year performance review process to assist with more detailed development plans. The new tool captures more data to help structure the development planning conversation between employees and their managers.
Developing our people Our Learning and Development function aims to develop leaders with the flexible skills and relevant competencies needed to rapidly adapt to changing financial and market situations and to provide our leaders with the skills and experience needed to run a large, multi-geography, multi-cultural organisation. It also aims to foster an environment where employees have the flexibility, tools and freedom to learn what they need to execute our business objectives.
In 2011/12 we focused on two priorities:
1. Creating a greater depth of leadership capability, specifically centering on our learning and development program for entry level leadership roles and for those who lead others.
2. Alignment of our learning curriculum to build BEx capability including technical LEAN capabilities, problem solving, leadership and coaching.
The learning and development program is a multi faceted program that develops our people at key transition points as well as providing just in time learning modules. The curriculum is updated each year, as a result of feedback from succession planning, employee development plans, performance management processes and from our employee opinion survey results. This year the curriculum was expanded to include new modules to suit leaders at different stages of their career.

36 Incitec Pivot Limited Sustainability Report 2012
PEOPLE & CULTURE
Three core streams are now available:
• Essential Leader (New People Leaders) – for those new to leadership, providing skills such as how to manage the transition from peer to manager.
• Creating Outstanding Leaders (Leader of Leaders) – for those managers who manage other managers
• Executive Leaders – for the senior leaders in the Company.
We also extended the program timing, allowing participants to embed the new behaviours they learn in the program.
In addition to these core leadership programs we designed a series of just in time modules to develop specific soft skills. We will further expand on this series next year.
A Leadership Transition Toolkit has been developed. The toolkit is designed to be an on-demand aid, particularly for those new to management roles or new to IPL who may not be able to attend a course immediately when they take on the role.
Metrics measuring the success of our Leadership Development program are compiled every six months and presented to the Managing Director & CEO. These include completion rate and contents of development plans for participants in the leadership program and improvement in individual performance on leadership competencies that are part of the program(s) and the performance management process. During the last 12 months, 1,500 employees have received leadership and soft skill development (excluding BEx), representing 1,800 days of training.
We continued to track our programs through a Net Promoter Score with an average rating on +90 and commenced measuring the transfer of learning into the workplace.
During 2011/12, we commenced implementation of a new Learning Management System. This included mapping the training requirements of each role in our manufacturing, Fertiliser and Explosives sites. With this major piece of work completed, the system is being rolled out, starting with our Australian business followed by the rest of the organisation next year. It provides a central, global database of the training requirements for each role and will allow us to better manage our regulatory requirements and will identify and manage capability gaps. It will also enable employees to determine what capabilities and training they require to be considered for other roles in the Group. The system also includes e-Learning functionality which provides a framework for the global provision of online learning.
A new online employee induction program was also released in 2011/12. The program can be accessed online prior to a new employee commencing work. The program introduces our business, our Values, culture and priorities. Site-based and role-based induction is conducted once the employee starts their new job.
One of the major challenges in our industry is to attract and retain a skilled, diverse and ready workforce.
Our workforce also needs to better reflect the diversity of the communities in which we operate.
Our Australian Indigenous Employment Strategy is helping to address these challenges. The Strategy was approved for implementation in September 2012 and aims to deliver meaningful employment outcomes for indigenous Australians and to contribute to closing the gap on social disparity between indigenous and non-indigenous Australians.
The Strategy builds on our experience with the Phosphate Hill Indigenous Traineeship Program in Queensland, Australia and the engagement of indigenous employees from local indigenous communities within our Dyno Nobel mine site operations.
Graduate of the Phosphate Hill program, Josh Campbell, worked his way from an Indigenous Traineeship in 2004 to Process Plant Team Leader at the Mount Isa Sulphuric Acid Plant.
“I’ve really enjoyed my experience working with IPL and I’m keen to see the Company expand opportunities to engage with and employ more indigenous Australians,” says Josh.
The Strategy will be piloted in the Pilbara region and the Mt Isa Region with a view to expand Australia-wide and then globally. It was developed following robust and comprehensive benchmarking, research and stakeholder consultation with employees, Aboriginal elders and communities.
A new Australian Indigenous Programs Manager, Mary McCabe, was appointed in January 2012 to focus on improving our internal organisational cultural capability and to lead the development and implementation of the Strategy and initiatives.
IPL has set an aspirational target to employ 20 indigenous Australians as part of its commitment to the Australian Employment Covenant. In addition, Dyno Nobel and a major customer in the Pilbara, have jointly set a target to achieve six per cent indigenous employment within Pilbara operations by the end of 2013. The AEC is a national industry-led initiative to help close the gap between indigenous and non-indigenous Australians in employment opportunities.
Our Business in Canada, Dyno Nobel Canada Inc, has also developed an Aboriginal Alliance Strategy which includes a commitment to hiring local aboriginals. Dyno Nobel Canada Inc. pioneered aboriginal alliances within the explosives industry in 2001 with the creation of a joint venture to supply explosives and services to the Diavik Diamond Mine in Canada’s Northwest Territories.
Joint ventures with First Nations groups have gained prominence in Canada in response to the increasing number of Impact and Benefit Agreements (IBAs) between aboriginal groups and mining companies. The IBAs often include commitments around direct employment of local aboriginal people as well as ‘preferred supplier’ status to First Nations joint venture companies.
Dyno Nobel has established eight First Nations partnerships to service current and potential mining projects in Canada. These joint venture agreements commit to employment opportunities for local aboriginal people as well as economic benefits for the local communities. The Business has had 33 aboriginal employees over the last ten years and currently there are two First Nations employees at the Diavik mine in the Northwest Territories and two Inuit employees at the Meadowbank mine in Nunavut.
Global indigenous employment program
CASE STUDY

37
WO
RKPLACE
HEA
LTH &
SAFETY
COM
MU
NITY
ENVIRO
NM
ENT
PROD
UCTS &
SERVICESPEO
PLE & CU
LTURE
Engaging our employees We undertake employee opinion surveys to determine how the business is perceived internally and the effectiveness of organisational development strategies. The last Group-wide employee engagement survey was undertaken in 2011 and a number of initiatives were undertaken in response to the results of that survey, including:
• Ensuring our performance management systems and processes hold everyone accountable and differentiate performance amongst individuals (discussed on page 35).
• Career progression and opportunities including over 100 new roles enabling our BEx transformation.
• Expanding our Leadership Development program (described in the Developing our People section on page 35).
Feedback is currently being gathered and a reassessment of the survey methodology is being undertaken to ensure continuous improvement of the surveying process in preparation for our next survey.
Examples of employee engagement activities include both our Values Awards program and our Community Investment Framework. The Values Awards program recognises employees who have demonstrated one or more of our Values. The Community Investment Framework contributes to employee engagement through the creation of a positive social agenda and the ability for employees to have their contributions to their local communities recognised and matched.
Responding to skills shortagesThe skills shortage within Australia is a well-documented problem facing many employers, one that is predicted to extend across the geographies in which we operate. There is competition for talent that we must respond to with employee attraction and sourcing strategies as well as a focus on employee retention and development and on strategic workforce planning.
In the Americas we also face a workforce gap, with a shortage of suitably qualified and experienced potential employees in the regions in which we operate.
A range of strategies are being implemented to meet these challenges, including:
• Providing market competitive remuneration, alongside merit-based performance management.
• Developing an Employee Value Proposition that conveys to potential and existing employees what we offer as an employer.
• Building our learning and development capabilities to up-skill our employees.
In 2011/12 we refreshed our graduate program in Australia, with the primary goal of attracting and employing graduate engineers to participate in the two-year program. Upon conclusion of the program, we aim to have talented and skilled employees who are then able to transition into permanent roles within our business.
The Australian manufacturing graduate program recruits final year engineering students. The graduates are placed at our manufacturing sites in Queensland and Victoria and receive two site-based rotations, allowing them to convert their theoretical learning into hands on experience. We also run a vacation program for students in the penultimate year of their engineering degrees. We recruited five female graduates as part of our 2013 graduate recruitment program, presenting over a third of the total graduate intake. This is significant as no female graduates were recruited for the 2012 program.
During the year, as a percentage of total hires, the number of female employees increased from 17% to 21%. We offer scholarships and support to engineering students in several universities in the United States, and James Cook University and the University of Queensland in Australia.
Our Australian Explosives business has also implemented a workforce planning strategy to address the workforce requirements unique to that industry by identifying key roles and forward planning to meet customer demands.
DiversityWith operations spanning the globe, we recognise that a diverse and inclusive workforce will result in improved organisational engagement which, in turn, will improve our performance.
In the 2011/12 financial year, we adopted a Diversity Policy together with a Diversity Strategy. The Diversity Policy outlines our Diversity Vision, which is to be an inclusive and accessible organisation through the development of a culture that embraces diversity. The Policy also provides guidance for the Diversity Strategy and its relevant policies, programs and initiatives, and will be implemented in a phased approach, starting with Australia and followed by the United States and Canada, with the intention for a global approach to be in place by 2014/15.
The focus in 2011/12 was on gender diversity and indigenous employment with a number of objectives, including:
• Raising awareness of our approach to diversity amongst our senior leaders, with anti-discrimination and anti-harassment training launched in Australia to support this objective.
• Increasing the number of women in leadership roles, as well as in the talent pipeline, in particular engineering and operational roles, with this year’s focus being on recruitment. During the year, as a percentage of total hires, the number of female employees increased from 17% to 21%.
• Developing best practice parental leave arrangements and flexible work arrangements, with revised policies and a new parental leave program developed to support this objective; and
• Establishing an indigenous employment program in Australia (read more about this in the case study on page 36).
For 2012/13, each of the Australian business units and functions will develop and implement diversity plans based on the Diversity Principles.
The Diversity Principles are:
• “Respecting our Differences”
• “Shaping our Future Organisation”
• “Building a Flexible Organisation”
In North America, the business units and functions will undertake a diversity diagnostic so that detailed diversity plans can be developed and implemented across the North American operations.
Further details on our Diversity Policy, Strategy and progress are available in our 2012 Annual Report and at www.incitecpivot.com.au.

Incitec Pivot Limited Sustainability Report 2012 38
Scope This Report covers wholly owned subsidiaries of Incitec Pivot Limited, Australian Company Number 42 004 080 264. The Company is a public company, trading on the Australian Securities Exchange as IPL.
In accordance with Global Reporting Initiative (GRI) Sustainability Reporting Guidelines, this Report covers all entities that generate significant sustainability impacts (actual and potential) and over which we exercise control or significant influence with regard to financial and operating policies and practices.
The statistics in this Report are for global sites wholly owned by IPL during that period. Joint ventures are not covered in this Report, unless indicated, nor are the activities of suppliers, customers or outsourced operations.
The Company participates in many joint ventures with varying levels of ownership interest. A list is provided in the 2012 Annual Report.
All financial figures in the Report are in Australian dollars, unless otherwise indicated.
The financial year ending 30 September 2012 is indicated as ‘2011/12’ in this Report.
Data measurement and calculationsFinancial data
Financial figures are derived from our audited accounts, which are prepared according to the International Financial Reporting Standards (IFRS).
Environmental dataScope 1 and 2 greenhouse gas emissions are calculated based on the Greenhouse Gas Protocol: A Corporate Accounting and Reporting Standard (Revised Edition).
Scope 1 and 2 emissions factors are sourced as follows:
Australia
• National Greenhouse and Energy Reporting (Measurement) Determination 2008
• National Greenhouse Accounts (NGA) Factors (2010).
Americas
• USA Electricity: eGRID2007 Version 1.1 Year 2005 GHG Annual Output Emission Rates
• USA Fuels: IPCC, Guidelines for National Greenhouse Gas Inventories (2006)
• Canada Fuels: Default CO2 Emission Factors:
Environment Canada, National Inventory Report, 1990–2007: Greenhouse Gas Sources and Sinks in Canada (2009), Annex 12: Emission Factors, Table A12-5 (1998–2007 data); Default Heat Content: Statistics Canada, Report on Energy Supply-demand in Canada, 2007 (2009)
• Canada Electricity: Greenhouse Gas Division, Environment Canada (2006 data)
• Mexico Electricity: Emission rates include emissions of CO
2, CH
4, and N
2O. Factors are
a national average of all the power plants operating and delivering electricity to the National Electric System and do not include transmission and distribution losses. Source: Asociación de Técnicos y Profesionistas en Aplicación Energética (ATPAE), 2003, Metodologías para calcular el Coeficiente de Emisión Adecuado para Determinar las Reducciones de GEI Atribuibles a Proyectos de EE/ER – Justificación para la selección de la Metodología, versión final 4.1 (junio de 2003), proyecto auspiciado por la Agencia Internacional de Estados Unidos para el Desarrollo Internacional, México, D.F., México.
Europe
• 2011 Guidelines to DEFRA/DECC’s GHG Conversion Factors for Company Reporting – Produced by AEA for the Department of Energy and Climate Change (DECC) and the Department for Environment, Food and Rural Affairs (DEFRA) in the UK. Version: 1.2
Changes during the reporting period This year energy and water use and waste data was supplied by our North American and European operations for the first time. Our description of our environmental impacts now covers all material operations globally. There were no changes to the organisational structure or size during the reporting period.
Restatements We have restated our 2010/11 Australian water use from 19,682 ML to 10,869 ML.
We have restated our 2010/11 Australian solid waste tonnage from 7,786 to 4,306. This is due to a reduction in our general waste to landfill tonnage from 7,224 to 3,744 tonnes due to increased rigour in our data collection and analysis process.
Our previous sustainability reports are available for download from www.incitecpivot.com.au.
Assurance and data integrity We aim to ensure that the information we publish is accurate, complete and material and therefore contributes to building trust and credibility with stakeholders. To achieve this, we improved our internal processes for verifying non-financial management information and for reviewing and approving the content of this Report.
Our Australian greenhouse gas emissions, energy consumption and production figures for the period 1 July 2011 to 30 June 2012 were assured by a third party.
Our community investments are verified by the London Benchmarking Group.
We have plans in place to increase third party verification over the entire sustainability report in the coming years.
About the data
Glossary BExBEx is IPL’s system for continuously improving the way we work and is a long term cultural transformation across the entire organisation. BEx is further described on page 6.
CO2 equivalent (CO2e)The universal unit of measurement to indicate the global warming potential (GWP) of each of the six greenhouse gases, expressed in terms of the GWP of one unit of carbon dioxide. It is used to evaluate releasing (or avoiding releasing) different greenhouse gases against a common basis.
GroupThis is the term for the company, collectively consisting of several business units and its wholly owned subsidiaries.
PlantThe equipment used to manufacture a specific product e.g. ammonium nitrate. There may be several plants on a single IPL site.
Scope 1 emissionsDirect GHG emissions occur from sources that are owned or controlled by the Group, for example, emissions from combustion in owned or controlled boilers, furnaces, vehicles etc., emissions from chemical production in owned or controlled process equipment.
Scope 2 emissionsScope 2 accounts for GHG emissions from the generation of purchased electricity consumed by the Group. Purchased electricity is defined as electricity that is purchased or otherwise brought into the organisational boundary of the Group. Scope 2 emissions physically occur at the facility where electricity is generated.
Scope 3 emissionsScope 3 is a reporting category that allows for the treatment of all other indirect emissions. Scope 3 emissions are a consequence of the activities of the Group, but occur from sources not owned or controlled by the Group. IPL does not currently collect data on Scope 3 emissions.
SiteA single geographic location where IPL operations take place.
Supply ChainOur supply chain is a sub-set of our value chain, referring to the companies who supply the inputs to our operations, such as raw materials for manufacturing, service providers and providers of other inputs such as electricity and water.
Value ChainOur value chain includes our suppliers (and potentially their suppliers), our operations, our distribution channels, and our customers, who are the end users of our products. Our supply chain (described above) is a subset of this.

39
GRI Item Description Coverage Response or reference
1.1 Statement from the most senior decision-maker of the organisation Page 52.1–2.8 Organisational profile Page 22.9 Significant changes during the reporting period Page 382.10 Awards received DJSI on page 73.1–3.4 Report parameters Page 33.5 Process for defining report content Page 73.6 Boundary of the report Page 383.7–3.8 Report parameters (continued) Page 383.10–3.11 Restatements and significant changes from previous reporting periods Page 383.12 Table identifying the location of the Standard Disclosures in the report This table4.1 Governance structure of the organisation Page 8 & page
VI of the Annual Report
4.2 Is the Chair of the highest governance body also an executive officer? No4.3 Independent and/or non-executive members of the board Annual Report,
page VI4.4 Mechanisms for shareholders and employees to provide recommendations or direction to the highest
governance body See footnote 1
4.13 Memberships in associations On website4.14 List of stakeholder groups engaged by the organisation Page 74.15 Basis for identification and selection of stakeholders Page 7STANDARD DISCLOSURES PART II: Disclosures on Management Approach (DMAs)DMA EC Disclosure on Management Approach EC Annual ReportDMA EN Disclosure on Management Approach EN Pages 21, 27, 31DMA LA Disclosure on Management Approach LA Pages 35-37, 11DMA HR Disclosure on Management Approach HR – DMA SO Disclosure on Management Approach SO Pages 17, 9DMA PR Disclosure on Management Approach PR Pages 27, 31STANDARD DISCLOSURES PART III: Performance IndicatorsEconomicEC1 Direct economic value generated and distributed Page 4EC2 Financial implications and other risks and opportunities for the organisation’s activities due to climate change CDP submission
on websiteEnvironmentalEN03 Direct energy consumption by primary energy source Page 22EN04 Indirect energy consumption by primary source Page 22EN08 Total water withdrawn by source Page 24EN10 Percentage and total volume of water recycled and reused Page 24EN16 Total direct and indirect greenhouse gas emissions by weight Page 22EN18 Initiatives to reduce GHG emissions and reductions achieved Page 23EN20 NO, SO and other significant air emissions by type and weight Page 22EN21 Total water discharge by quality and destination Page 24EN22 Total weight of waste by type and disposal method Page 24EN23 Total number and volume of significant spills Page 25EN26 Initiatives to mitigate environmental impacts of products and services, and extent of impact mitigation Pages 28-33EN28 Monetary value of significant fines and total number of non-monetary sanctions for non-compliance
with environmental laws and regulations Aggregated total
of $60,000Social: Labour Practices and Decent Work StandardsLA1 Total workforce by employment type, employment contract, and region, broken down by gender Page 4LA7 Rates of injury, occupational diseases, lost days, and absenteeism, and number of work-related
fatalities by region Page 13
LA8 Education, training, counselling, prevention, and risk-control programs in place to assist workforce members, their families, or community members regarding serious diseases
Page 15
LA13 Composition of governance bodies and breakdown of employees per category according to gender, age group, minority group membership, and other indicators of diversity
Pages 4. Only gender data is collected
Social: SocietySO1 Percentage of operations with implemented community impact, development and engagement programs Page 17SO5 Public policy positions and participation in public policy development and lobbying Pages 27,30SO10 Prevention and mitigation measures implemented in operations with significant potential or actual
negative impacts on local communities Page 17
Social: Product Responsibility PR1 Life cycle stages in which health and safety impacts of products and services are assessed for
improvement, and percentage of significant products and services categories subject to such procedures Pages 27
PR3 Product labelling required by procedures and % of products complying with requirements. Pages 28, 33
Our 2012 Sustainability Report has been prepared in accordance with the Global Reporting Initiative (GRI) Sustainability Reporting Guidelines, Version 3.1. The Report is self-declared as a GRI C application level.
The following table details the GRI Indicators covered by this Report. Read more about GRI at www.globalreporting.org.
Key
Full coverage Partial coverage Not covered
Global Reporting Initiative (GRI) Index
1 Shareholders can communicate with the Board at our Annual General Meeting or by writing, care of the Company Secretary at the Registered Office, Incitec Pivot Limited, GPO Box 1322, Melbourne Victoria 3001. Employees can communicate via employee engagement surveys or via their manager. Employees are able to report suspected misconduct via a Whistleblower hotline.
website = www.incitecpivot.com.au

This publication has been printed in Australia by an ISO 14001 environmental management system (EMS) and ISO 9001 quality management system (QMS) certified printer using vegetable based inks and a 100% alcohol free printing process. It is manufactured using an independently audited carbon neutral process. The paper is Revive Pure Silk 100% Recycled which is certified carbon neutral
and FSC® 100% Recycled certified. It is manufactured process chlorine free (PCF) at an ISO 14001 certified mill.
Incitec Pivot LimitedABN 42 004 080 264
Level 8, 28 Freshwater Place, Southbank Victoria 3006, Australia
Postal Address Incitec Pivot Limited GPO Box 1322, Melbourne Victoria 3001, Australia
Telephone: +61 3 8695 4400 Facsimile: +61 3 8695 4419 www.incitecpivot.com.au