Embed Size (px)
Citation preview

i
Sustainability Reporting of Airlines: Performances and Driving
Factors in Environmental Aspect
by
Xudong Chen
A Thesis submitted to the Faculty of Graduate Studies of The
University of Manitoba
in partial fulfilment of the requirements of the degree of
MASTER OF SCIENCE
Department of Supply Chain Management
I.H. Asper School of Business
University of Manitoba
Winnipeg, Manitoba, Canada
Copyright © 2021 by Xudong Chen

ii
Abstract
In recent years, sustainable development has become a critical area of concern in the aviation
industry. The number of airlines that incorporate sustainability into their business is increasing to
enhance their market positions and profitability. Sustainability reporting is an efficient and
straightforward way to understand how airlines do in related fields. In this paper, we develop a
scoring system for the environmental components in airlines’ sustainability reports. Then we
build a statistical model to test the relationships between airlines’ sustainability reporting
performance and multiple factors. The thesis finds that the size of an airline (RPK) and the
environmental performance index (EPI) of its home country are both positively correlated with
the airline’s sustainability reporting performance. Besides, if an airline is listed in any market, it
has better reporting performance. Furthermore, Star Alliance members have a better chance to
perform better than other airlines in their sustainability reporting. Contradictory to intuition, full-
service carriers and low-cost carriers are not significantly different in terms of their reporting
performances.
Key words: sustainability reporting; airline; environmental performance index; alliance

iii
Acknowledge
Throughout the past few years of study and writing of this thesis, I have received a great deal of
unprecedented assistance and support.
I would first like to thank my advisor, Dr. Changmin Jiang, and my co-advisor, Professor Paul
Larson, whose expertise helped me in building this research questions. Your assistance and
suggestions pushed me to see many subtle but important deficiencies that were overlooked in the
thesis.
I would like to thank my committee members for your great support and carful and sincere
advice during my writing. Your different voices had given me many insights from different
angles and let me see the tremendous power of the teamwork.
Besides, I also would like to specially thank Ms. Claire Venevongsa and the lot of you who had
provided great help in my life. I believe that your support is the necessary motivation and
encouragement for me to go further.
iv
Table of Contents
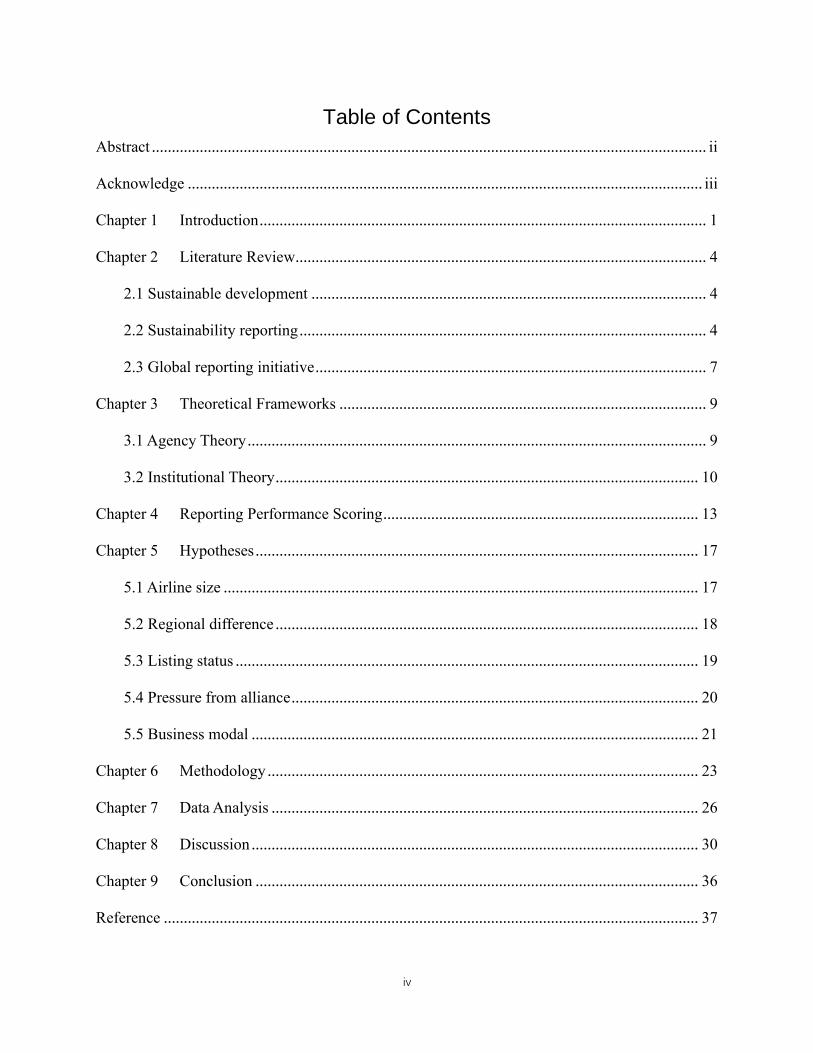
Abstract ........................................................................................................................................... ii
Acknowledge ................................................................................................................................. iii
Chapter 1 Introduction ................................................................................................................ 1
Chapter 2 Literature Review....................................................................................................... 4
2.1 Sustainable development ................................................................................................... 4
2.2 Sustainability reporting ...................................................................................................... 4
2.3 Global reporting initiative .................................................................................................. 7
Chapter 3 Theoretical Frameworks ............................................................................................ 9
3.1 Agency Theory ................................................................................................................... 9
3.2 Institutional Theory .......................................................................................................... 10
Chapter 4 Reporting Performance Scoring ............................................................................... 13
Chapter 5 Hypotheses ............................................................................................................... 17
5.1 Airline size ....................................................................................................................... 17
5.2 Regional difference .......................................................................................................... 18
5.3 Listing status .................................................................................................................... 19
5.4 Pressure from alliance ...................................................................................................... 20
5.5 Business modal ................................................................................................................ 21
Chapter 6 Methodology ............................................................................................................ 23
Chapter 7 Data Analysis ........................................................................................................... 26
Chapter 8 Discussion ................................................................................................................ 30
Chapter 9 Conclusion ............................................................................................................... 36
Reference ...................................................................................................................................... 37
v
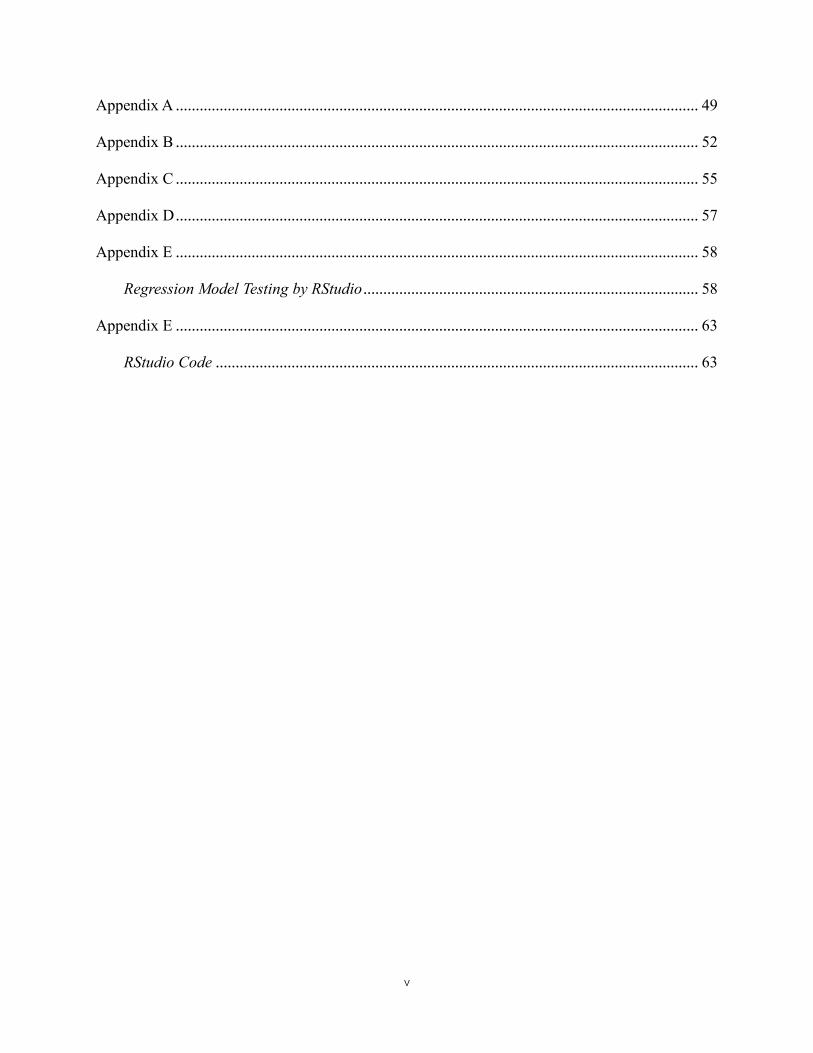
Appendix A ................................................................................................................................... 49
Appendix B ................................................................................................................................... 52
Appendix C ................................................................................................................................... 55
Appendix D ................................................................................................................................... 57
Appendix E ................................................................................................................................... 58
Regression Model Testing by RStudio .................................................................................... 58
Appendix E ................................................................................................................................... 63
RStudio Code ......................................................................................................................... 63
vi
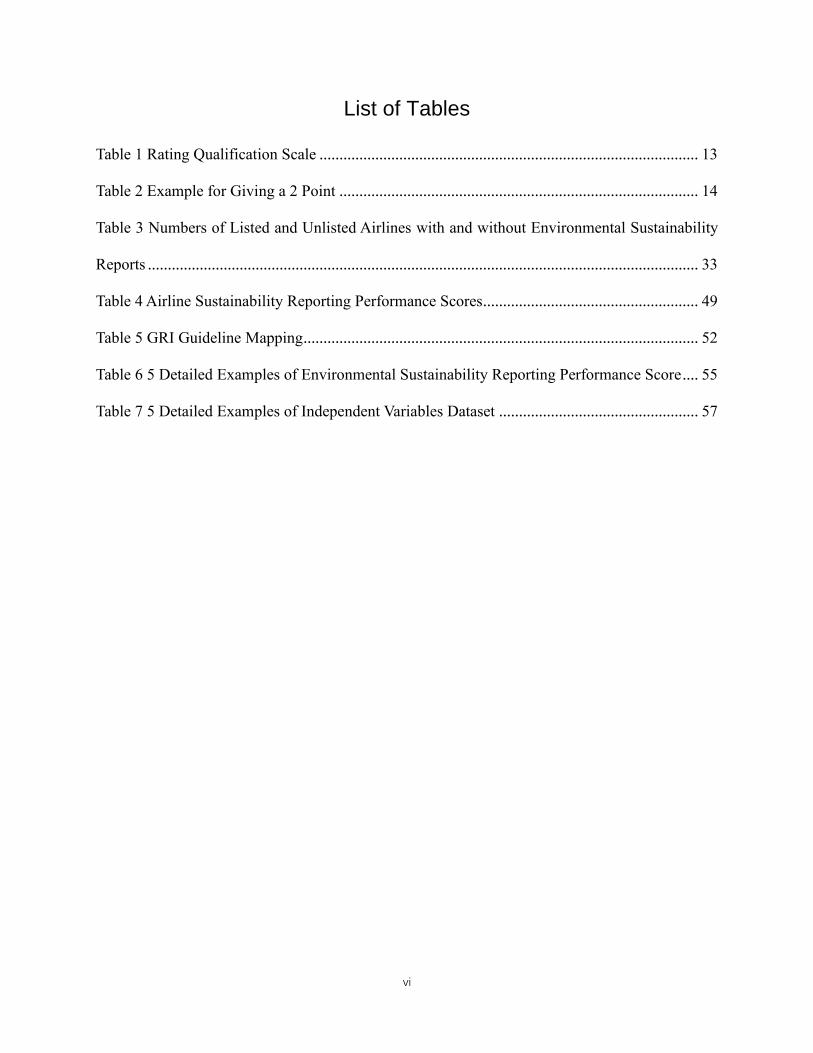
List of Tables
Table 1 Rating Qualification Scale ............................................................................................... 13
Table 2 Example for Giving a 2 Point .......................................................................................... 14
Table 3 Numbers of Listed and Unlisted Airlines with and without Environmental Sustainability
Reports .......................................................................................................................................... 33
Table 4 Airline Sustainability Reporting Performance Scores...................................................... 49
Table 5 GRI Guideline Mapping ................................................................................................... 52
Table 6 5 Detailed Examples of Environmental Sustainability Reporting Performance Score .... 55
Table 7 5 Detailed Examples of Independent Variables Dataset .................................................. 57
vii
Table of Figures
Figure 1 Example for Giving a 3 Point ......................................................................................... 14
Figure 2 Proportion of Reports According to GRI Guideline ....................................................... 16
Figure 3 Distributions of Scores Among Different Reporting Guidelines ................................... 16
Figure 4 Distribution of Samples According to Its Region........................................................... 23
Figure 5 Distribution of Samples According to Its Business Model ............................................ 24
Figure 6 Environmental Sustainability Reporting Performance Score by EPI ............................. 31
Figure 7 The EPI Ranking Map for Headquarters in the Dataset ................................................. 32
Figure 8 National Cultural Values vs. Environmental Reporting Performance Score .................. 32
Figure 9 The Numbers of Alliance Members in Dataset .............................................................. 34
Figure 10 Diagnostic Plots of R egression .................................................................................... 60
Figure 11 Adjusted R for Subsets Regression ............................................................................... 62
1
Chapter 1 Introduction
Environmental degradation, resource depletion, global warming, climate change, and
human rights violations have become four increasingly concerning topics and prompted more
and more companies to engage in socially responsible business practices (Mayer, 2007). Those
issues forced organizations to pay attention to and solve these problems (Butler et al., 2011). A
business approach, sustainable development, considers the company’s responsibility to the
society based on what previously focused only on economic development. While a company is
generating profits, it should also desire to give back to employees’ families, the environment, and
the society. Such a sustainable practice benefits all the parties interested in a company and is the
prerequisite for the survival and development of a company (Rajnović et al., 2019). In addition,
stakeholders’ requirements for accountability make multinational companies more aware of the
call and importance of sustainable development (Dodds & Kuehnel, 2010). This makes
publishing a separate sustainability report a dedicating tool for companies to demonstrate
corporate social responsibility and environmental protection initiatives (Farooque et al., 2017).
Among all industries, tourism, transportation, mining, and energy industries, because of
their substantial impacts on the environment and the society, have become the main concern of
sustainability research. As one of the main transportation modes, aviation contributes significant
impact not only on economic development, but also on the environment. The gross domestic
product (GDP) of world aviation industry has achieved around 691.3 billion dollars (ATAG,
2020). However, it has discharged 915 million tonnes of CO2 in 2019 worldwide, contributing to
2% of the total CO2 emission globally (ATAG, 2020). Together with non-CO2 emissions, its
contribution to the global warming approximately doubles. Because of the surging demand for
air transportation, global aviation could account for 22% overall CO2 emission by 2050 (Cames
2
et al., 2015). Meanwhile, climate change itself is and will still be an increased focus area for both
business and politics (Seignette, 2019), which has a direct correlation to airline performance
(Leamon et al., 2019).
Although airlines are starting to renovate their fleets with new technology (Caetano &
Alves, 2019), reducing greenhouse gas (GHG) emission is still a big challenge (Smith & Rodger,
2008; Leamon et al., 2019). Many airlines are pursuing sustainability by switching from regular
fossil fuels to biofuels and other methods to achieve a more continuous and self-recovering
social and environmental atmosphere. Aircrafts also cause noise pollution and energy wastage
(Schäfer & Waitz, 2014). To make the issue more complex, aviation is linked to a wide-range
group of stakeholders whose interests may conflict with each other (Ndolo & Njagi, 2016). A
suitable strategic goal must be set to meet all stakeholders’ benefits. Therefore, a clear and
transparent sustainability report may be an effective and essential way to present the balance of
interests of all stakeholders(Simoni et al., 2020). Consequently, airlines should have strong
incentives to devote funds and resources to pursue ideal sustainability reports. However, the fact
is that the qualities of sustainability reports from different airlines are uneven. At the moment,
sustainability reporting is not yet a common practice among airlines, although more and more
airlines publish their sustainability reports (Kuo et al., 2016). This variation in reporting quality
suggests that there must be some driving factors affecting the performance of airlines’
sustainability reporting, motivating the reporting behaviour, and making the attitudes towards
sustainability reporting different. Meanwhile, to have a deeper understanding of the reasons
behind and to improve readers’ understanding of the performance of sustainability reports in
aviation industry, it is meaningful to examine what factors affect airlines’ reporting performance
and how they work.

3
This thesis firstly develops a scoring system for the environmental disclosures in airlines’
sustainability reports. The world’s top 100 airlines are scored based on their revenue passenger
kilometers (RPK) in the year of 2017. Then a regression test is carried out to test the
relationships between the airline’s sustainability reporting performance and multiple factors,
including the size of the airline, its home country’s EPI, its home country’s GDP, its continent, its
business model (full-service carrier vs. low-cost carrier), whether it is listed, and whether it
belongs to one of the global airline alliances. The thesis finds that the size of an airline (RPK)
and the environmental performance index (EPI) of its home country are both positively
correlated with the airline’s sustainability reporting performance. Besides, if an airline is listed in
any market, it has better reporting performance. Furthermore, Star Alliance members have a
better chance to perform better than other airlines in their sustainability reporting. Contradictory
to intuition, full-service carriers and low-cost carriers are not significantly different in terms of
their reporting performances.
The contribution of this paper is two-fold. First, as far as we know, this is a pioneer paper to
evaluate airlines’ sustainability performances, which can serve as a good start point for assessing
how well each airline publicizes its effort in sustainability environmental practices. Second, it is
also the first paper to endeavour in finding out the factors that affect sustainability environmental
reporting performance, through which we can obtain a better understanding regarding what are
behind the different reporting qualities within the aviation industry.

4
Chapter 2 Literature Review
2.1 Sustainable development
At the very beginning, the concept of sustainable development was based on the
development of society. However, more and more companies are starting to consider it by taking
the corporation as a unit (Steurer et al., 2005). If sustainable development is defined as a
continuous growth in material consumption, this concept cannot be fairly interpreted when we
meet the ultimate limit to usable recourses exist (Brundtland, 1987). The sustainable
development then was defined as a growth in social welfare because a growth in economic
output does not necessarily mean the growth in physical materials (Pezzey, 1989) when it is
focused on the economic side. A widely accepted definition is “the development meets the needs
of the present without compromising the ability of future generations to meet their own needs
(WCED, 1987).” This definition sets the cornerstone for sustainable development. However, a
better definition should be more precise in its concept and allow more diverse and flexible
methods in developing strategies that may lead society, economy and environment to a self-
sufficiency (Lele, 1991).
This concept from WCED (1987) has been generally accepted by different industries, such
as manufacturing, mining, transportation. (Environment Canada, 2010).
2.2 Sustainability reporting
The predecessor of sustainability report is corporate social responsibility (CSR), which
mainly focus on one corporation’s responsibility on non-financial aspects (Rob et al., 1995). In
aviation, some airlines consider sustainability as a part in CSR, while others use sustainability
reports to replace CSR or even integrate sustainable development chapter into their financial
report. The reason why these airlines are reporting the sustainability aspect differently is not
5
clear yet. According to sustainability triple bottom line perspective, sustainable development
needs to consider social (ethical), ecological and business development simultaneously (Slaper &
Hall, 2011). Thus, airlines need to touch these parts financially and ideologically no matter
whether it is spontaneous or is under the pressure from its stakeholders. In the process of this
report development, different airlines are on different phases. Therefore, we can notice this
difference in their ways of reporting from reports.
There are two goals of sustainability reporting. One is to picture a corporation’s expectation
of future impact on social, economic, and environmental aspects. The other is to present
achievements in those three sustainability aspects in the last year (Satterfield et al., 2009).
Sustainability reports also present corporate’s sustainability development phase and strategy to
interior and exterior stakeholders (Massa et al., 2015). Sustainability reporting could be an
annual assessment about a corporation’s economic, environmental and social implementation
(Dissanayake et al., 2016). It’s also a tactical statement affecting environment, economy and
society, which declares the tasks, chances and concerns in the sustainable development (Geng et
al., 2017). Therefore, sustainability reports can be a way to show that companies can maintain
their business competitiveness with environmental and social responsibilities.
In the process of producing sustainability reports, employees from different departments are
trying to perform how they are collaborating to construct a more sustainable atmosphere in the
company. On the other hand, all stakeholders are essentially involved and receive information
from the corporation through sustainability reports. Hence, they can estimate corporation’s
performance in sustainable development and determine the sustainability level of this
corporation among others (Leszczynska, 2012). In a corporation’s perspective, the goal of
sustainable development should be consistent with its long-term goal so that the corporation can
6
achieve a both sustainable and healthy development in all three sustainable aspects. Considering
the short-term goal of sustainable development is always changing due to the reality, a company
must pay more attention on the short-term goals to meet the needs of every stakeholder timely.
Some extant research have done valuable work on the sustainability reporting in the
aviation industry. A series of studies examined independent reports issued by airlines to
determine their sustainability practices and disclosures. Cowper-smith and Grosbois (2011)
explored the CSR through qualitative content analysis. Their research shows that airlines are
concerned with environmental issues, not social or economic dimensions of CSR. Wang et al.
(2013) evaluate the CSR performance of eight Chinese airlines using entropy weight and grey
relation analysis. They found that corporate social responsibility disclosure is positively related
with firm size, media exposure, share ownership concentration and institutional shareholding.
Some studies conducted surveys or case studies to explore the factors that influence airlines’
CSR practices. For instance, Sheldon and Park (2011) conducted a survey-based study to explore
the CSR concepts and practices of the US tourism industry, including some airlines. Kuo et al.
(2016) also conduct a survey and confirmatory interviews to determine the incentives and
difficulties of CSR practices in the aviation industry. Lynes and Andrachuk (2008) applied an in-
depth case study approach to Scandinavian airlines to determine why companies are committed
to corporate social and environmental reasonability practice. Kearins and Fryer (2011) also used
case study methods to study how sustainability theory relates to practice of Auckland Airport.
Lee and Park (2010) studied the impact of CSR on the performance of seven airlines, including a
46-year annual company observation.
On the other hand, previous researches are mainly focused on issues or topics about how to
offset or reduce GHG emission (Johnson & Gonzalez, 2013). However, those driving factors

7
behind sustainability reporting performance are overlooked. Those factors may not have direct
influence on reporting activity. Because there are sustainability reports with different reporting
qualities and disclosure extent in the aviation industry, those factors should be found out to
understand why those factors have influence on it, and how they can affect reporting behaviour.
Therefore, more attention should be paid on finding out what driving factors behind
sustainability reporting performance are. This thesis will fill in the research gap by investigating
these factors and their roles and influence.
2.3 Global reporting initiative
Inclusive announcement through appropriate social documents helps airlines maintain and
reinforce connection with stakeholders. Since sustainability report is a way for airline
corporations to communicate with other stakeholders, a mature standard is necessary. Some
guidelines (such as ISO 2600, GRI) provide a clear and neat construction for airlines. GRI
Guideline was issued in 1999 to help companies to construct an exhaustive and clear
sustainability report and created a standard for corporations worldwide to improve the
sustainability reporting performance. The sustainability reporting performance can be greatly
improved if companies can follow it thoroughly (Fonseca et al., 2012). Nowadays more and
more corporations start to use GRI Guideline as the template of their sustainability reports,
although not all sections mentioned in GRI Guideline is suitable for airlines to improve their
sustainability reporting performance. The main goal of GRI is to establish its reporting
procedures as a globally recognized framework that promotes comparability in sustainability
reporting (Einwiller et al., 2015). According to GRI Guideline, a basic disclosure should include
economic, environmental and social categories (GRI, 2018). In this paper, GRI environmental

8
aspect is used as the guideline to score the reports collected from airlines’ website.
9
Chapter 3 Theoretical Frameworks
3.1 Agency Theory
Agency theory was originally proposed by Jensen & Meckling in 1976. It was established in
the information economics literature to explains the relationships between principals and agents
under the assumption of information asymmetry and conflicts of interests (Eisenhardt, 1989).
This theory later developed into a contracting cost theory. The contracting cost theory assumes
that an enterprise consists of a series of contracts, including contractual relationships between
providers of capital (shareholders and creditors, etc.) and capital operators (management
authorities), enterprises and lenders, enterprises and customers, and enterprises and employees.
The agency theory mainly involves the contractual relationship between the provider of the
enterprise resource and the user of the resource. According to agency theory, the owner of
economic resources is the principle: the manager responsible for the use and control of these
resources is the agent. The agency theory holds that when the managers themselves are the
owners of the resources, they have all the residual claims of the enterprise, and the managers will
work hard for it and for himself. In this environment, there is no principle-agency problem.
However, when managers draw new resources from the outside, managers will have a motivation
to increase on-the-job consumption, relax themselves and reduce work intensity. Obviously, if
the manager of the company is a homo economicus. His behaviour will be significantly different.
Jensen & Meckling separated agency costs into monitoring costs, bonding costs, and residual
losses. The monitoring costs refer to the expenses incurred by external shareholders to supervise
the excessive consumption or self-relaxation of the managers; the self-constrained expenditures
incurred by the agents in order to obtain the trust of the external shareholders (such as regularly
reporting the operation to the client, hiring an external independent audit) is called the bonding

10
costs; Other losses due to inconsistent interests of the principal and the agent are residual losses.
Meanwhile, information asymmetry exists because managers can deal with superior
information about current and future financial and non-financial information about company
performance, but company shareholders can not (Ho & Taylor, 2013). To eliminate information
asymmetry between companies and shareholders, companies would use some different
communication channels to inform shareholders (Brammer & Pavelin, 2008). Therefore, in
aviation, airlines would like to conduct sustainability reports with GRI as a guideline to reduce
the agency problems brought by information asymmetry and reducing agency cost.
3.2 Institutional Theory
The institutional theory offers an advantageous framework for understanding how and why
institutional effects occur within and around organizations, explaining how social choices are
shaped, promoted, and guided through the influence of institutional environments (Contrafatto,
2014). These organizations are located in a recognized area which has key suppliers, resource
and product consumers, regulatory agencies and other organizations that produce similar services
or products (P. J. DiMaggio & Powell, 1983). In this organizational fields, organizations are
rewarded for staying in the border through legitimacy, resources and survival capabilities (Scott,
1987). Once this border is formed, various powers will force organizations within the field to
become similar to each other. Scott (1995) introduced a valuable approach to understanding
institutional influence by identifying three key critical elements: regulative, normative and
cultural-cognitive. These elements are considered to deliver stability and meaning to
organizations. The regulatory system involves rulemaking, monitoring and sanctioning activities
that limit and regulated behaviour. The normative system includes social values and norms,
creating social expectations in pursuit of organizational goals and objectives. These values and

11
norms are inherently normative and set expectations for shaping the behaviour of organizational
actors. The cultural cognition system includes assumptions that are taken for granted and a
common understanding through the other organizations in the same environment.
Powell & DiMaggio (2012) believe that modern organizations show great similarities in
form and practice. Once the organizational field is formed, there will be a great momentum of
homogeneity. To understand this homogeneity, the most appropriate concept is an institutional
isomorphism, which refers to the similarity between structure and practice of an organization and
other organizations in the same environment. The concept of institutional isomorphism is a
useful tool for understanding politics and rituals that permeate the life of modern organizations.
Institutional isomorphism consists of three basic forms:
1. Coercion isomorphism. Coercion isomorphism stems from the formal or informal
pressure exerted by other organizations on which it depends and social and cultural expectations.
2. Imitate isomorphism. Not all institutional isomorphism comes from coercion
isomorphism. Uncertainty is a powerful force that encourages imitation. When organizational
skills are difficult to understand, goals are blurred, or when the environment creates symbolic
uncertainty, organizations can shape themselves in the form of other organizations. Although
they are looking for diversity, there are only a few variables to choose from. The phenomenon of
the new organization imitating the old organization exists throughout the economic field, and
managers are actively looking for models that can be imitated.
3. Normative isomorphism. Normative isomorphism is mainly derived from
professionalism, that is, formal education based on the cognition created by the university, and
the development and deepening of professional networks that can spread new models rapidly
across organizations.

12
As Powell & DiMaggio (2012) say, institutional theory helps explain the facts we observed
that organizations become more and more homogeneous, and at the same time, enable people to
understand the irrationality which is common in organizations and lack of innovation. Focusing
on the isomorphism of the system can also strengthen the view on political struggle for
organizational power and survival. Thinking about the isomorphism process also makes us focus
on power and its application in modern politics.
The institutional theory for sustainability reporting argues that sustainability reporting is not
necessarily an organizational act with clear reasons, but rather mimics seemingly more
successful and legitimate peer organizations (Bebbington et al., 2009; Islam & Deegan, 2008).
Different regulatory systems effect the evolution of sustainability reporting. For instance,
environmental regulations and industry legislation that are prevalent in some countries act as
mandatory pressures, forcing companies to comply with their structures and rules to ensure
legitimacy. Researchers have found that global institutional pressures tend to replace local
influences (Islam & Deegan, 2008; Kamla, 2007; Kuasirikun & Sherer, 2004). The process of
global institutionalization is mainly achieved through GRI (Brown et al., 2009). Importantly,
GRI does not specify how metrics must be reported, but provides guidelines on the content of
reports and the quality principles that should be sought. GRI adoption will help airlines to gain
their legitimacy as a responsible member in organizational field by following the norms.
Participants in the GRI include multilateral organizations such as the United Nations
Environment Programme (UNEP), large multinational corporations, international consulting
firms (AccountAbility, SustainAbility) and large accounting firms. These participants and their
levels of engagement with the GRI, together with their interactions with one another, stimulate
the field of sustainability reporting and lead to standardisation.
13
Chapter 4 Reporting Performance Scoring
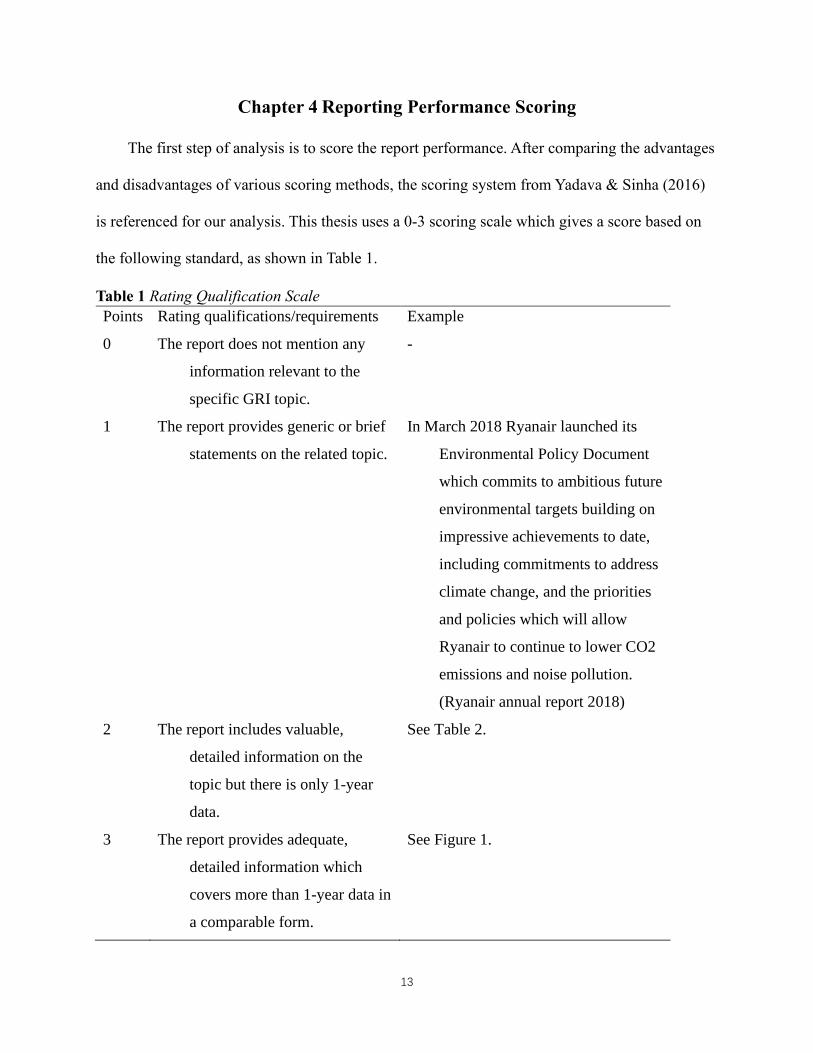
The first step of analysis is to score the report performance. After comparing the advantages
and disadvantages of various scoring methods, the scoring system from Yadava & Sinha (2016)
is referenced for our analysis. This thesis uses a 0-3 scoring scale which gives a score based on
the following standard, as shown in Table 1.
Table 1 Rating Qualification Scale
Points Rating qualifications/requirements Example
0 The report does not mention any
information relevant to the
specific GRI topic.
-
1 The report provides generic or brief
statements on the related topic.
In March 2018 Ryanair launched its
Environmental Policy Document
which commits to ambitious future
environmental targets building on
impressive achievements to date,
including commitments to address
climate change, and the priorities
and policies which will allow
Ryanair to continue to lower CO2
emissions and noise pollution.
(Ryanair annual report 2018)
2 The report includes valuable,
detailed information on the
topic but there is only 1-year
data.
See Table 2.
3 The report provides adequate,
detailed information which
covers more than 1-year data in
a comparable form.
See Figure 1.
14
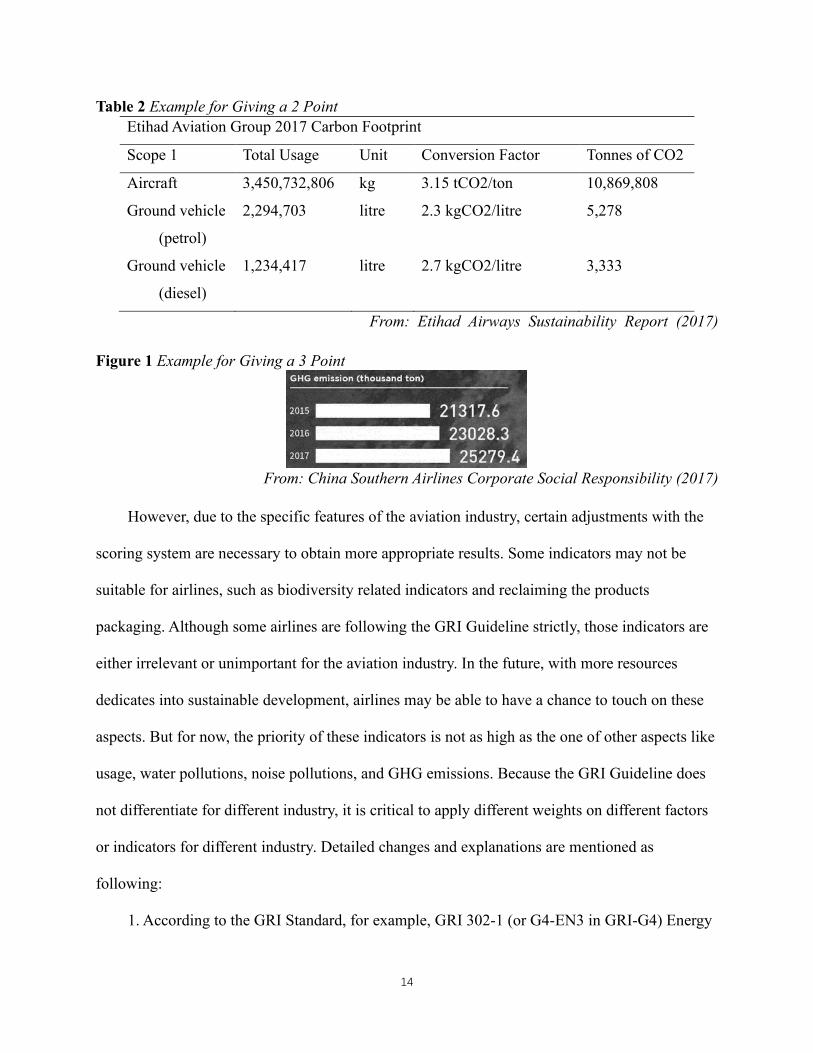
Table 2 Example for Giving a 2 Point
Etihad Aviation Group 2017 Carbon Footprint
Scope 1 Total Usage Unit Conversion Factor Tonnes of CO2
Aircraft 3,450,732,806 kg 3.15 tCO2/ton 10,869,808
Ground vehicle
(petrol)
2,294,703 litre 2.3 kgCO2/litre 5,278
Ground vehicle
(diesel)
1,234,417 litre 2.7 kgCO2/litre 3,333
From: Etihad Airways Sustainability Report (2017)
Figure 1 Example for Giving a 3 Point
From: China Southern Airlines Corporate Social Responsibility (2017)
However, due to the specific features of the aviation industry, certain adjustments with the
scoring system are necessary to obtain more appropriate results. Some indicators may not be
suitable for airlines, such as biodiversity related indicators and reclaiming the products
packaging. Although some airlines are following the GRI Guideline strictly, those indicators are
either irrelevant or unimportant for the aviation industry. In the future, with more resources
dedicates into sustainable development, airlines may be able to have a chance to touch on these
aspects. But for now, the priority of these indicators is not as high as the one of other aspects like
usage, water pollutions, noise pollutions, and GHG emissions. Because the GRI Guideline does
not differentiate for different industry, it is critical to apply different weights on different factors
or indicators for different industry. Detailed changes and explanations are mentioned as
following:
1. According to the GRI Standard, for example, GRI 302-1 (or G4-EN3 in GRI-G4) Energy

15
Consumption Within the Organization asked organization to report the total fuel consumption
from non-renewable sources, even including electricity and cooling energy consumption. As the
actual fuel consumption in the aviation industry is mainly aviation fuel. In the scoring process, if
the company mentions only one sort of consumption from non-renewable fuel sources, mainly
the jet fuel, it can be considered as reported. And if the data provided are more than 1 year, it is
given a 3 point.
2. The aspects that can be reported and included in the sustainability reports are different
among different airlines due to their ability to reach those data. If the information provided by
airlines are like ‘we are not able to do it right now’ or ‘we don’t have this kind of concern’ or ‘we
are not able to track the data now’, it is treated as a not-reported and given a 0 score.
3. For GRI 306-3 (or G4-EN24 in GRI-G4), total number and volume of significant spills, if
it is mentioned in the reports that ‘there is no fine or noise complain’ in last financial year, it will
be given a 2 because it can be considered as a zero in fine.
We use the system introduced in above to score the world’s top 100 airlines according to
their traffic volumes (RPKs) in 2017. The scores are presented in Table 4 (See Appendix A).
Insert Table 4 about here
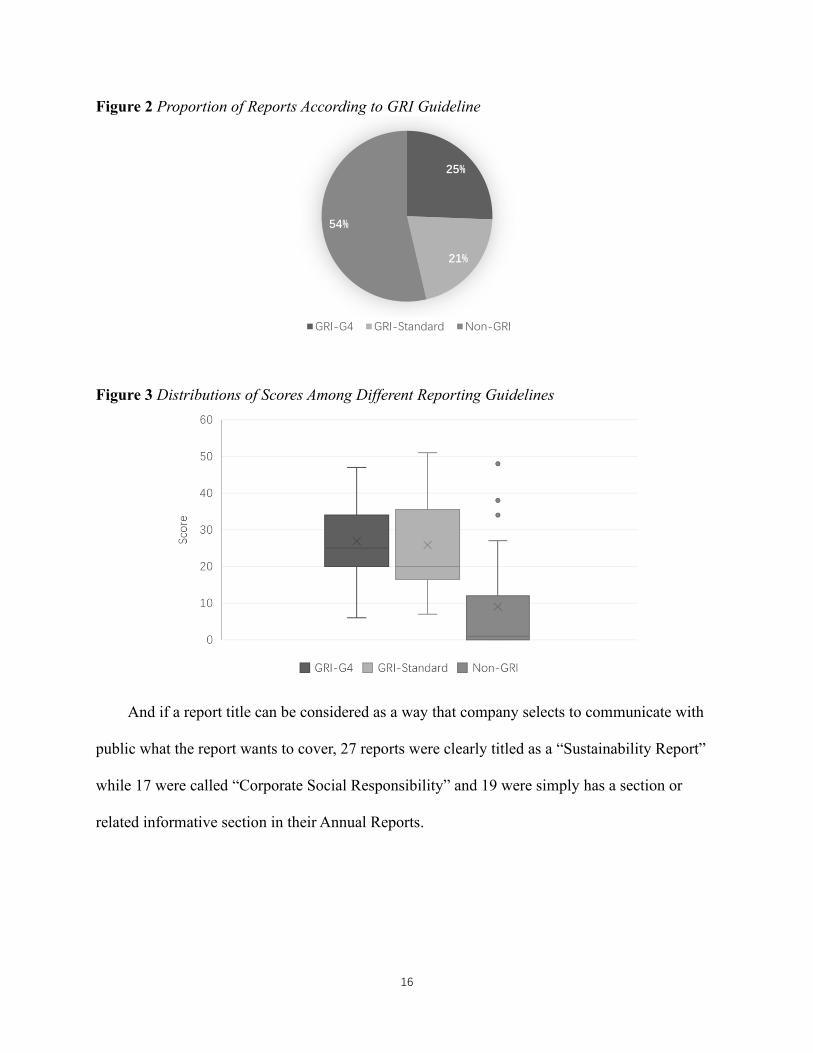
There are 100 airlines on the list. By searching each company's website, a total of 82 related
reports were collected. Among these 82 reports, 17 were using GRI Standard as a reporting
guideline. 21 were using GRI G4, and 44 were not referring any GRI reporting guideline.
16
Figure 2 Proportion of Reports According to GRI Guideline
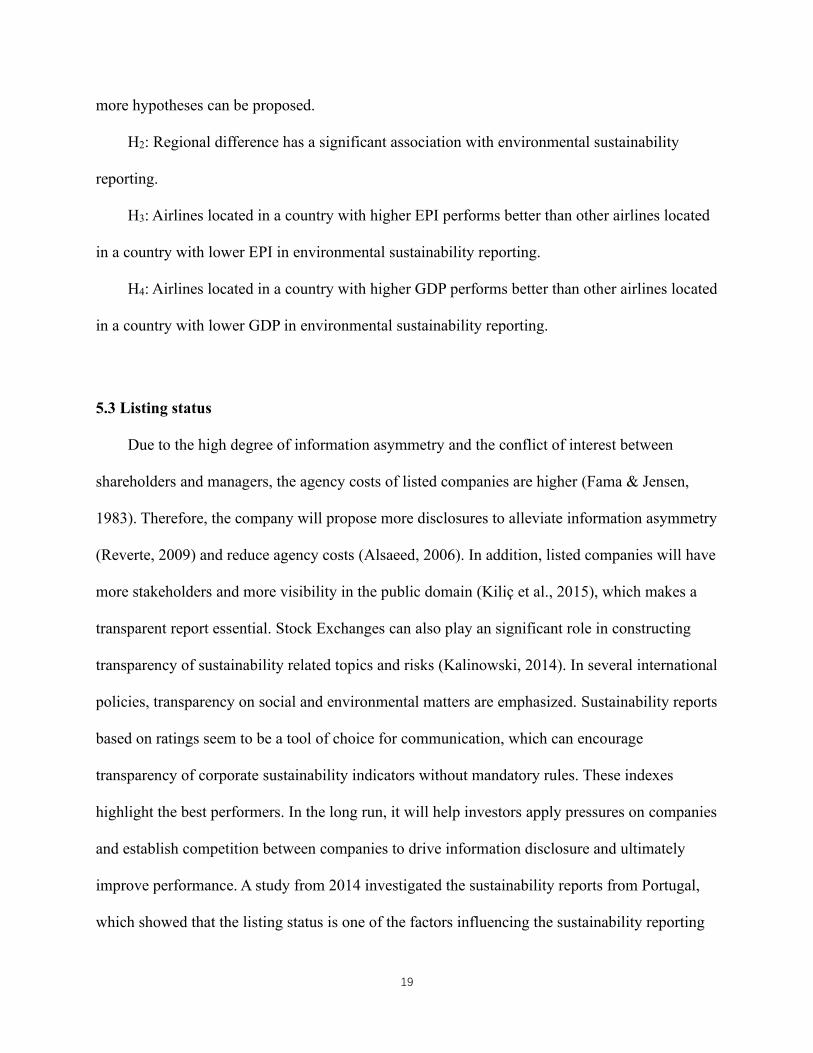
Figure 3 Distributions of Scores Among Different Reporting Guidelines
And if a report title can be considered as a way that company selects to communicate with
public what the report wants to cover, 27 reports were clearly titled as a “Sustainability Report”
while 17 were called “Corporate Social Responsibility” and 19 were simply has a section or
related informative section in their Annual Reports.
25%
21%
54%
GRI-G4 GRI-Standard Non-GRI

17
Chapter 5 Hypotheses
5.1 Airline size
Company size is one of the most commonly used variable for understanding corporate
social and environmental reporting practices (Skouloudis et al., 2011; Ho & Taylor, 2013; Nazari
et al., 2015;). Several reasons can be identified for those positive relationships. First, agency
theory states that large companies have higher agency costs due to more information asymmetry
between managers and shareholders (Jensen & Meckling, 1976b). Intuitively, large companies
will disclose more information to reduce agency costs than small companies will. Therefore, the
sustainability report will provide a platform for large companies to report other information
about their operations, thereby reducing information asymmetry with shareholders. Second,
larger companies may be more inclined to disclose their CSR practices because they may suffer
more losses due to lack of legitimacy (Delen et al., 2013). Furthermore, large companies are
scrutinized by public and are expected to face stronger pressures from groups that advocate a
green environment and improve social welfare (Naser et al., 2006). To alleviate this pressure,
large companies are more inclined to volunteer to participate in socially and environmentally
responsible activities (Veronica Siregar & Bachtiar, 2010). As a result, small companies avoid
voluntary disclosure of information about their business because they fear losing their
competitive advantage. In the aviation industry, revenue passenger kilometers (RPK) measures
actual demand for transportation. It could also be referred as airline traffic, so RPK can be used
as a measure for company size. Based on the above discussion, we raise the following
hypothesis.
H1: Airline size has a significantly positive association with environmental sustainability
reporting performance.

18
5.2 Regional difference
Regional differences are more about emphasizing areas among continents or among cultural
blocks. The cultural practices could be one of the source of institutional pressures (P. DiMaggio
& Powell, 1983). The cultural cognition systems can be considered as a system built based on
geographical difference, which means airlines located in the same area would probably have
similar behaviour on their reporting process and similar understanding about environmental
sustainability reports. The same reason can also be applied to customers’ side. Customers from
same area or close areas may have a very high possibility to have a similar prospect of view or
focus when looking at the related issues. In addition to the cultural background, regional
normative restrictions are one of the considerations. Some of previous researches have already
shown the link between characteristics of the country where the company located and
sustainability assurance statements (Paulo Perego, 2009; Kolk & Perego, 2010; Paolo Perego &
Kolk, 2012; Fernandez‐Feijoo et al., 2015). Moreover, local regulations may also have an
influence on the requirements of sustainability reporting. Sustainability policies are different
from city to city as well (Karlenzig, 2008). Based on cultural similarities, this research divided
regions into North America, Europe, Asia Pacific, Middle East, Latin America, and Africa. The
environmental performance index (EPI) is a quantitative measure of environmental performance
in national policies (Wendling et al., 2018). The EPI is calculated through a framework that
contains 32 indicators with different weights from 11 categories which are based on two policy
objectives, environmental health, and ecosystem vitality(Wendling et al., 2018). It is used, in the
thesis, to assess issues related to environmental sustainability in countries. To present the
difference more accurately, EPI categorized by countries are also included to show the impact on
these airlines from their mother countries as well as GDP. Following the above discussion, three
19
more hypotheses can be proposed.
H2: Regional difference has a significant association with environmental sustainability
reporting.
H3: Airlines located in a country with higher EPI performs better than other airlines located
in a country with lower EPI in environmental sustainability reporting.
H4: Airlines located in a country with higher GDP performs better than other airlines located
in a country with lower GDP in environmental sustainability reporting.
5.3 Listing status
Due to the high degree of information asymmetry and the conflict of interest between
shareholders and managers, the agency costs of listed companies are higher (Fama & Jensen,
1983). Therefore, the company will propose more disclosures to alleviate information asymmetry
(Reverte, 2009) and reduce agency costs (Alsaeed, 2006). In addition, listed companies will have
more stakeholders and more visibility in the public domain (Kiliç et al., 2015), which makes a
transparent report essential. Stock Exchanges can also play an significant role in constructing
transparency of sustainability related topics and risks (Kalinowski, 2014). In several international
policies, transparency on social and environmental matters are emphasized. Sustainability reports
based on ratings seem to be a tool of choice for communication, which can encourage
transparency of corporate sustainability indicators without mandatory rules. These indexes
highlight the best performers. In the long run, it will help investors apply pressures on companies
and establish competition between companies to drive information disclosure and ultimately
improve performance. A study from 2014 investigated the sustainability reports from Portugal,
which showed that the listing status is one of the factors influencing the sustainability reporting

20
assurance (Branco et al., 2014). In contrast, non-listed companies will be less willing to disclose
voluntary information because these shareholders can get information directly from the company
(Naser et al., 2006; Reverte, 2009). In addition, listed companies are more likely to incorporate
environmentally responsible practices into their strategies to attract more investors.
Consequently, we develop the following hypothesis.
H5: Listed airlines have better sustainability reporting performance than those are not listed
in environmental aspect.
5.4 Pressure from alliance
In the institutional theory, it is mentioned that in the same market environment, members
tend to make similar decisions due to uncertainty and legitimacy. The institutional theory is also
used for explain why companies adopt such green practices in supply chain (González et al.,
2008; Wu et al., 2012). Normative, coercive and mimetic pressures are three forms of
institutional pressures that are responsible for driving isomorphism and lead organization to what
is legitimate (P. DiMaggio & Powell, 1983). Normative institutions can be trade associations,
professional associations and accreditation bodies, as they build guides of appropriate conduct
(Grewal & Dharwadkar, 2002). Industry associations promote their associational reputation
which can lead to a similar standard and spread to association members (Grewal & Dharwadkar,
2002; Castka & Balzarova, 2008). Sustainability standards adoption is a response from a
company under the close attention from social and environmental ombudsmen (Wijen, 2014).
The greater an association’s involvement is, the most likely a member will resemble those in the
association (P. J. DiMaggio & Powell, 1983). It has been found that an industry peer can make a
huge influence on a company’s environmental strategy (Bansal & Roth, 2000; Park-Poaps &
21
Rees, 2010). From an airline perspective, it may be beneficial to form or join an alliance for
several reasons. First, the airline can extend its operating network coverage to achieve economies
of scale and density. Second, the alliance has established close ties among member companies,
which helps to form more forms of cooperation, such as joint ventures, franchises and even
mergers. Among the different alliances, there are members from different countries. These
members indirectly influence and limit the behaviours of other members in the alliance. These
cultural identities come from different airlines. To maintain alliances, alliance members must
yield to influential alliance members for more recourse. Currently the three main aviation
alliances are Oneworld, Sky Team, and Star Alliance. Star Alliance has the most members,
followed by Sky Team and finally Oneworld. Therefore, we recommend the following
assumptions:
H6: Alliance members have a better sustainability reporting performance than non-alliance
members in environmental aspect.
H7: Different alliances have a significant association with environmental sustainability
reporting performance.
5.5 Business modal
A business model can be considered as a conceptual tool that includes a bunch of elements
and relationships that describe a company’s logic for establishing the company, doing their
business and delivering their values (Magretta, 2002; Osterwalder & Pigneur, 2010; Teece,
2010). A business model can also give a company ability to adapt itself to the industrial
environment (Teece, 2010). It can be very crucial for a business model in practicing
sustainability and improving the sustainability values that is delivering by this company (Stubbs
& Cocklin, 2008). Airline companies can be roughly separated into two different business

22
models, full-service carriers, and low-cost carriers. As the name suggests, the low-cost carrier
business model includes several characteristics. Low-cost carriers primarily run point-to-point
short-haul routes, focus on price-sensitive passengers, offers low average fares, and only own a
fleet of just one or two aircraft types, comparing with full-service carriers. The products they are
offering, their company structure and operational procedures can be totally different from full-
service carriers. Basically, they are focusing on two different types of passengers which may
have different needs and views. On the other side, to achieve a low-cost, airlines must cut
unnecessary cost and dedicate all the resources on the primary service. This could lead to a
totally different attitude on sustainable development aspect.
H8: Full-service carriers perform better than lower cost carriers in environmental
sustainability reporting.

23
Chapter 6 Methodology
To have a better understanding of those driving factors, top 100 airlines ranked by Revenue
Passenger Kilometres (RPK) in 2017 are selected as a sample. The RPK is an airline industry
metric that shows the number of kilometres travelled by paying passengers. It is calculated as the
number of revenue passengers multiplied by the total distance traveled measuring the actual
demand for air transportation. On the other hand, RPK also reflects the traffic operated by those
airline companies. Those airlines selected are from North America (16%), Europe (27%), Asia
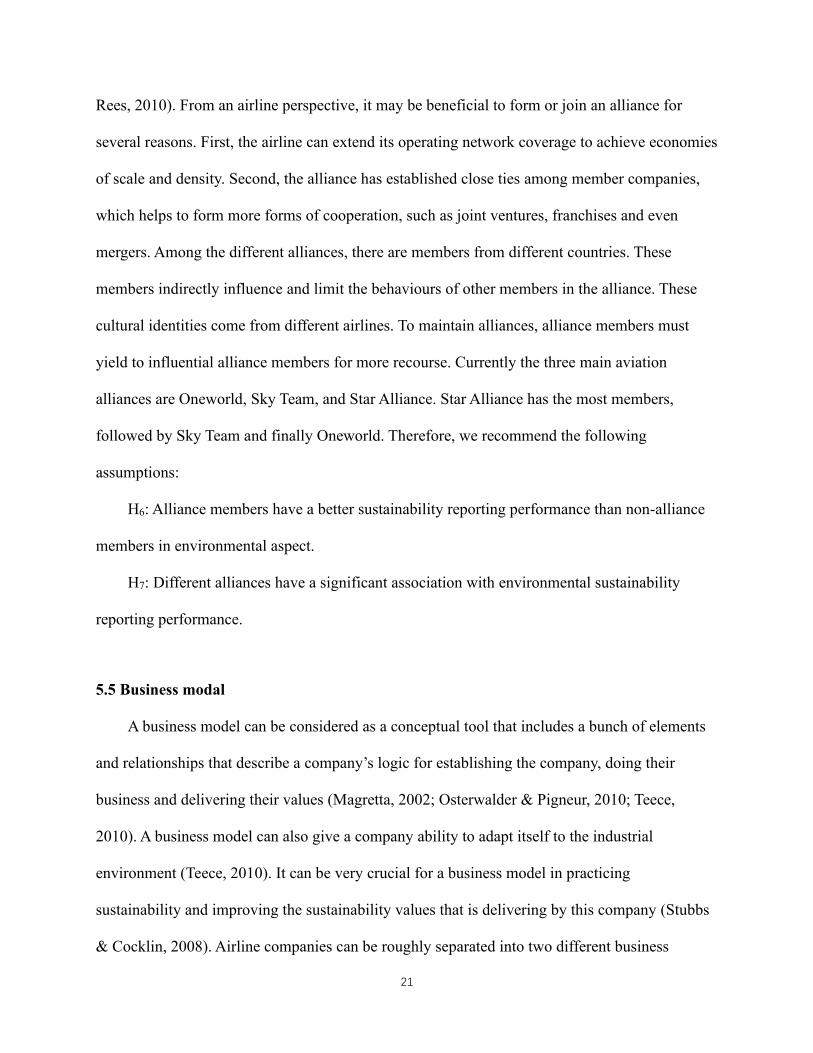
Pacific (38%), Middle East (9%), Latin America (8%) and Africa (2%). Business model is
divided into full-service carriers (69.70%) and low-cost carriers (30.30%).
Figure 4 Distribution of Samples According to Its Region
16%
27%
38%
9%
8% 2%
North America Europe Asia Pacific Middle East Latin America Africa
24
Figure 5 Distribution of Samples According to Its Business Model
Reports are collected from the airlines’ websites, including annual reports, corporate social
responsibility reports, integrated reports, environmental reports, and sustainability reports.
Annual reports are included in this thesis because some airlines integrate sustainability sections
into their annual reports.
Because the RPK ranking was published and ranked in 2017, this research selects the most
recent reports that can be found on their websites. Because this research is digging into the
reporting performance, collected reports are not necessary to be describing the same period.
Besides, the financial year of different airlines are defined differently. Reports were all collected
between Dec. 24, 2018 and Dec. 31, 2018 to obtain the most accurate data to describe the
situation of a certain airlines in that time. Data for those driving factors are collected from their
own reports or websites or from other sources. Data about alliance status can be found from
airline alliance websites, such as Oneworld.com, Skyteam.com and Staralliance.com. Some
airline alliances, such as Vanilla Alliance, U-FLY Alliance, and Value Alliance, are not included
in this research because they focus more on regional markets. Moreover, data related to the
business model (Low-cost carrier or full-service carrier) are collected through a list of low-cost
carriers from International Civil Aviation Organization (ICAO). If a certain airline is not found
69.70%
30.30%
Full-service carriers Low-cost carriers

25
on the list, then it is considered as a full-service carrier.
26
Chapter 7 Data Analysis
RStudio (1.3.959) is used to test the hypotheses in this research. The code is shown in the
Appendix D. Packages used in the model testing are car (3.0-10), carData (3.0-4), and leaps
(3.1).
In this research, the independent variables that need to be tested are revenue passenger
kilometers (RPK), locations of airlines’ headquarters, environmental performance index (EPI),
listing status, business model, alliance status and gross domestic product (GDP) of their mother
countries. And the dependent variable is the scores based on their environmental sustainability
reporting performance according to the scoring standard mentioned in Chapter 4. An example
dataset can be found in Appendix D and E.
The original formula and regression results are as following:
𝑒𝑛𝑣𝑠𝑐𝑜𝑟𝑒 = 𝛽1 × 𝑟𝑝𝑘 + 𝛽2 × 𝑛𝑜𝑟𝑡ℎ𝑎𝑚𝑒𝑟𝑖𝑐𝑎 + 𝛽3 × 𝑎𝑠𝑖𝑎 + 𝛽4 × 𝑜𝑐𝑒𝑎𝑛𝑖𝑎
+ 𝛽5 × 𝑚𝑖𝑑𝑒𝑎𝑠𝑡 + 𝛽6 × 𝑙𝑎𝑡𝑖𝑛 + 𝛽7 × 𝑎𝑓𝑟𝑖𝑐𝑎 + 𝛽8 × 𝑒𝑝𝑖 + 𝛽9 × 𝑠𝑡𝑜𝑐𝑘
+ 𝛽10 × 𝑓𝑠𝑐 + 𝛽11 × 𝑜𝑛𝑒𝑤𝑜𝑟𝑙𝑑 + 𝛽12 × 𝑠𝑘𝑦𝑡𝑒𝑎𝑚 + 𝛽13 × 𝑠𝑡𝑎𝑟𝑎𝑙𝑙𝑖𝑎𝑛𝑐𝑒
+ 𝛽14 × 𝑔𝑑𝑝𝑛𝑜𝑚𝑖𝑛𝑎𝑙 + 𝛽15 × 𝑔𝑑𝑝𝑝𝑝𝑝 + 𝛽0+𝜇0
After several arounds of testing and tuning, the final formula is as following:
𝑠𝑞𝑟𝑡(𝑒𝑛𝑣𝑠𝑐𝑜𝑟𝑒)
= 𝛽1 × 𝑟𝑝𝑘 + 𝛽2 × 𝑛𝑜𝑟𝑡ℎ𝑎𝑚𝑒𝑟𝑖𝑐𝑎 + 𝛽3 × 𝑎𝑠𝑖𝑎 + 𝛽4 × 𝑜𝑐𝑒𝑎𝑛𝑖𝑎
+ 𝛽5 × 𝑚𝑖𝑑𝑒𝑎𝑠𝑡 + 𝛽6 × 𝑙𝑎𝑡𝑖𝑛 + 𝛽7 × 𝑎𝑓𝑟𝑖𝑐𝑎 + 𝛽8 × 𝑒𝑝𝑖 + 𝛽9 × 𝑠𝑡𝑜𝑐𝑘
+ 𝛽10 × 𝑓𝑠𝑐 + 𝛽11 × 𝑜𝑛𝑒𝑤𝑜𝑟𝑙𝑑 + 𝛽12 × 𝑠𝑘𝑦𝑡𝑒𝑎𝑚 + 𝛽13 × 𝑠𝑡𝑎𝑟_𝑎𝑙𝑙𝑖𝑎𝑛𝑐𝑒
+ 𝛽14 × 𝑔𝑑𝑝𝑛𝑜𝑚𝑖𝑛𝑎𝑙 + 𝛽15 × 𝑔𝑑𝑝𝑝𝑝𝑝 + 𝛽0+𝜇0
Two multiple linear regressions were calculated to see the changes of environmental
reporting performance scores based on revenue passenger kilometers (RPK), locations of
airlines’ headquarters, environmental performance index (EPI), listing status, business model,
27
alliance status and gross domestic product (GDP) of their mother countries. The whole process
can be found in Appendix C. A significant regression equation was found (F (15, 83) = 6.541, p
< .000), with an 𝑅2 of 0.5417 and adjusted 𝑅2 = 0.4589. The root square of participants’
predicted environmental reporting score is equal to 4.676 × 10⁻⁵ × 𝑟𝑝𝑘 + 0.3268 ×
𝑛𝑜𝑟𝑡ℎ𝑎𝑚𝑒𝑟𝑖𝑐𝑎 + 4.137 × 𝑎𝑠𝑖𝑎 − 4.386 × 𝑜𝑐𝑒𝑎𝑛𝑖𝑎 − 1.535 × 10⁻¹ × 𝑚𝑖𝑑𝑒𝑎𝑠𝑡 +
7.243 × 𝑙𝑎𝑡𝑖𝑛 − 3.116 × 𝑎𝑓𝑟𝑖𝑐𝑎 + 0.4037 × 𝑒𝑝𝑖 + 8.604 × 𝑠𝑡𝑜𝑐𝑘 − 2.896 × 𝑓𝑠𝑐 +
6.152 × 𝑜𝑛𝑒𝑤𝑜𝑟𝑙𝑑 + 3.803 × 𝑠𝑘𝑦𝑡𝑒𝑎𝑚 + 7.381 × 𝑠𝑡𝑎𝑟_𝑎𝑙𝑙𝑖𝑎𝑛𝑐𝑒 − 1.902 × 10⁻⁴ ×
𝑔𝑑𝑝_𝑛𝑜𝑚𝑖𝑛𝑎𝑙 + 2.306 × 10⁻⁴ × 𝑔𝑑𝑝_𝑝𝑝𝑝 − 26.41, where rpk, gdps are measured in
US$millions, and northamerica, asia, oceania, mideast, latin and africa are a set of dummy
variables, oneworld, skyteam and star_alliance are a set of dummy variables, epi is a score
based on a series of calculation and stock and fsc are two dummy variables as well.
And in the second regression equation, the (F (15, 83) = 7.583, p < .000), with an 𝑅2 of
0.5781 and adjusted 𝑅2 = 0.5019. The root square of participants’ predicted environmental
reporting score is equal to 9.612 × 10⁻⁶ × 𝑟𝑝𝑘 − 0.6847 × 𝑛𝑜𝑟𝑡ℎ𝑎𝑚𝑒𝑟𝑖𝑐𝑎 +
0.2791 × 𝑎𝑠𝑖𝑎 − 0.3629 × 𝑜𝑐𝑒𝑎𝑛𝑖𝑎 − 6.159 × 10⁻² × 𝑚𝑖𝑑𝑒𝑎𝑠𝑡 + 0.9884 × 𝑙𝑎𝑡𝑖𝑛 −
0.7163 × 𝑎𝑓𝑟𝑖𝑐𝑎 + 6.689 × 10⁻² × 𝑒𝑝𝑖 + 1.741 × 𝑠𝑡𝑜𝑐𝑘 − 0.2606 × 𝑓𝑠𝑐 + 0.5479 ×
𝑜𝑛𝑒𝑤𝑜𝑟𝑙𝑑 + 0.3462 × 𝑠𝑘𝑦𝑡𝑒𝑎𝑚 + 1.186 × 𝑠𝑡𝑎𝑟_𝑎𝑙𝑙𝑖𝑎𝑛𝑐𝑒 − 2.385 × 10⁻⁵ × 𝑔𝑑𝑝_𝑛𝑜𝑚𝑖𝑛𝑎𝑙 +
2.747 × 10⁻⁵ × 𝑔𝑑𝑝_𝑝𝑝𝑝 − 3.699. The measurement here in this equation is the same as the
previous one. Since the adjusted 𝑅2 goes higher while 𝑅2 goes lower, it can be concluded that
this equation explains the differences of dependent variable better.
It goes without saying that it seems unreasonable to drop those variables, like business
models and GDP related variables, because the purpose of this thesis is to test them. However, in
the first round of testing, their relationships have already shown clearly in the regression result.

28
The reason for the following testing and regression model tuning is trying to present a more
accurate relationship between significant independent variables and the dependent variable and
see if those rest of independent variables can give a more accurate explanation to the difference
in the dependant variable. As the result shown, RPK is highly significant throughout the
optimizing process and consistently exhibits a positive correlation with environmental scores.
Therefore, Hypothesis 1 is supported.
In terms of regional differences, regions do not present any significance. Therefore
Hypothesis 2 cannot be supported. But EPI reflects a positive significant throughout the process.
From this, the location of the airline's headquarters does have an impact on the performance of
the airline's environmental sustainability report. However, the reason why such a strong
significance is not reflected in regional difference may be because the division of regions is too
general. But the reason behind this still needs to be checked closely because, intuitively, the
regional culture has an impact on a region's perception of an issue.
At the same time, it can be found in the process of optimization that GDP has produced
multiple collinearities for EPI. It can also be seen that GDP has a certain linear relationship with
the country's EPI. From the EPI official website, scholars also found this correlation in the
newest 2020 data. The Hypothesis 3 and 4 are supported here. The reason may be similar to the
H1. In countries with economic advantages, there will be more resources to invest in
environmental issues. But the specific content has yet to be verified.
Listed airlines do have a better performance in environmental sustainability reporting,
which means Hypothesis 5 is supported. As mentioned earlier, there are many motivations for
listed companies to do so. For the listed company itself, to be able to provide more transparent
information to shareholders, a well-prepared sustainability report can be a good choice. This not

29
only provides information to current shareholders, but also establishes a responsible image and
attracts more investors to invest in.
In terms of aviation alliances, the independent variable star_alliance is significant from
beginning to end. But the other two aviation alliances’ variables do not show any level of
significance. It can, therefore, be concluded that whether to join an alliance has no impact on the
environmental sustainability reporting performance. It is worth noting that Star Alliance is an
exception among those three, which means members in Star Alliance did do a better job than
other airlines which no matter are in other alliance or not in any of alliance.
Last but not the least, for the business model, it does not show any significance in the result.
This goes against the previous conclusions because in general a full-service carrier is more likely
to have a larger company size than a low-cost carrier has. It comes with the last statement that
they seem to have more resources and more approaches to monitor and achieve a sustainable
development, and, of cause, are much more willing to and easier for them to improve their
environmental sustainability reporting performance. Although, by observing the data, a low-cost
carrier is more likely to be a lower-RPK airlines than a full-service carrier is, the distribution of
these two is relatively balanced, which means a high-RPK airline can be a low-cost carrier while
a low-RPK airline is operating as a full-service carrier. Therefore, taking this into account,
previous conclusions of larger airlines that have better performance in reporting is still
supported.

30
Chapter 8 Discussion
Revenue passenger kilometers (RPK) shows the number of kilometers traveled by paying
passengers, and it is usually an airline traffic statistic. Revenue passenger kilometers are
calculated by multiplying the number of paying passengers by the travel distance. The airline’s
traffic statistics will help the airline formulate a forward business strategy to attract passengers in
a highly competitive market. As an airline with a relative higher RPK can achieve higher
profitability than an airline with a lower RPK. Meanwhile, low profit margins and high costs
may plague the aviation industry which means that most efforts to maintain the aviation industry
sustainability are driven by the desire for cost-effectiveness. With the advance of new aircraft
(such as Boeing 787 Dreamliner, A380), the fuel consumption of a latest aircraft can be reduced
up to 20% compared with an old aircraft (IATA, 2020). The newer fleets can not only save
aviation fuel, but also require less power for lights, better air filtration systems and generally
better use of the space. Based on the incentive to lower the cost and increase the profit margin,
airlines will be glad to upgrade their fleets once they can find an outlet for their old fleets.
On the other side, although the topic of biofuels is not without controversy, it is exciting to
see that the aviation industry is taking steps to move away from traditional petroleum fuel, and
three airlines are already using biofuels as a part of their aviation fuel in commercial flights.
KLM is a leading airline in innovations in this field and is the airline that uses biofuels for the
longest flight tests. There is no doubt that this is cost-driven, and if biofuels can be produced
sustainably, then this is a very positive step for the industry. Disappointingly, Emirates has taken
almost no action in fuel innovation, further reiterating the role of cost in this process.
An interesting result can be noticed from the regression is that regional factors’ null
hypothesis cannot be rejected. On the other words, if airline headquarters are grouped according

31
to their regions (continental level), there is no evidence showing that airline headquarters in a
certain continent are having a better environmental sustainability reporting performance than
other airlines in other continents. However, the EPI, which is calculated by countries, are
showing high significance level to this reporting performance. Therefore, it can be found that if
airline headquarters are grouped by countries, there are a certain group of airlines are doing
better than others.
As it is defined by several researchers, culture is the beliefs and values that are broadly
shared in a specific society at a specific point of time (Ralston et al., 1993), as shared behavior
patterns (Mead et al., 1973) and a collective programming of the mindset that distinguishes one
group of people from another (Hofstede, 2001). Meanwhile, when we look back at those data
(Figure 6), it can be noticed that with the EPI ranking goes behind, the variation of score is
smaller and approaching to a lower level.
Figure 6 Environmental Sustainability Reporting Performance Score by EPI
In the map shown in Figure 7, the darker the country is, the higher EPI they have.
According to the previous national cultural value researches, countries which have low power
distance, low individualism, low masculinity and focus on long-term benefits are more likely
hold stronger beliefs about the importance of sustainability (Tata & Prasad, 2015). When the
0
10
20
30
40
50
60
0 20 40 60 80 100 120
Sco
re
EPI ranking
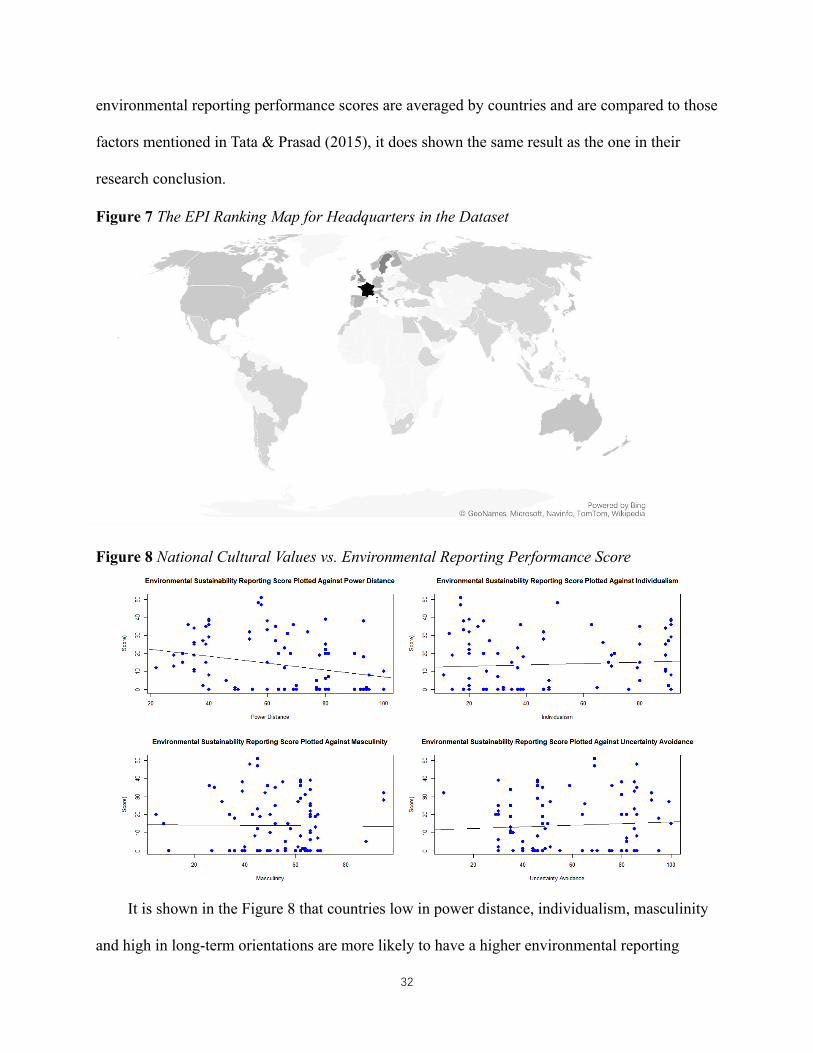
32
environmental reporting performance scores are averaged by countries and are compared to those
factors mentioned in Tata & Prasad (2015), it does shown the same result as the one in their
research conclusion.
Figure 7 The EPI Ranking Map for Headquarters in the Dataset
Figure 8 National Cultural Values vs. Environmental Reporting Performance Score
It is shown in the Figure 8 that countries low in power distance, individualism, masculinity
and high in long-term orientations are more likely to have a higher environmental reporting

33
performance scores in its aviation industry. That can be one of the reasons why EPI shows a
significant result in the regression, but regions separated by markets are not.
As for the stock market, it is desperate for investors to gain as much information about the
company they invested in as possible. That information could be their basis of investment
decision. Previous researches are mainly focus on the relationship between Stock Price Crash
Risk (SPCR) and sustainability reports (Carnevale & Mazzuca, 2014; Harmadji et al., 2020).
Stand-alone sustainability reports with effective strategy, high quality and excellent practice can
negatively affect SPCR (Harmadji et al., 2020). The disclosure of sustainability reports produces
a positive effects on stock price (Carnevale & Mazzuca, 2014). Here in this research, it can be
observed that if a target airline is a listed company, no matter which stock market it is at, it will
have a relatively higher environmental sustainability reporting performance.
Table 3 Numbers of Listed and Unlisted Airlines with and without Environmental Sustainability
Reports
Listed airlines Unlisted airlines Total
Disclosed
environmental
sustainability
reports
34 26 60
Undisclosed
environmental
sustainability
reports
6 33 39
Total 40 59 99
As it is noticed in the dataset, 34% of listed airlines disclosed their environmental
sustainability reports while 33% of unlisted airlines did not disclose their reports. Comparing to
unlisted airlines, only 15% of listed airlines did not disclose their environmental sustainability
reports when 55% of unlisted airlines did not do that. When it comes to the precedence, in the
listed 40 airlines from the database, 33 of them released their first sustainability report after their

34
time to market. 6 of them had sustainability reports before their time to market. 4 of them got
their sustainability report at the same year of time to market while 10 had not been having their
sustainability report since their time to market. Although it could be because the sustainability
report is a relatively fresher concept than being listed in the market, the reality is most of airlines
discloses their sustainability reports after being public listed. Being listed could be the reason for
airlines to prepare for their sustainability reports because that would provide information to
shareholders to make information based investing decisions about the efficiency and impact of
sustainability decisions and actions and provide a signal of transparency and enhance the
reputation and social profile (Deegan, 2004; Deegan et al., 2006; Simnett et al., 2009).
Meanwhile, the market could provide airlines positive motivations to invest more resources in
reporting performance, which could lead the company to gain a higher market capital. Besides
the reporting performance itself, these motivations also could enhance the governance and other
aspects in the company making the company a more competitive candidate in the industry.
Figure 9 The Numbers of Alliance Members in Dataset
From Figure 9, there are 20 out of 26 Star Alliance members, 12 out of 13 Oneworld
members and 13 out of 19 SkyTeam included in the dataset. From the dataset, leading by Star
Alliance members, 85% of members in the dataset published their sustainability report, while
Star Alliance Oneworld SkyTeam

35
67% of Oneworld members and 69% of SkyTeam members published theirs. However, when
looking at the aspect of reporting performance scores they received, the average scores receive
by Star Alliance members (excluded no-report members) (24.53) is lower than the average scores
received by Oneworld members (excluded no-report members) (33.5) and SkyTeam members
(excluded no-report members) (28.3). This result is showing that the Star Alliance is winning
because the percentage of members who published sustainability reports is more than other two.
But by talking about environmental reporting performance, members from SkyTeam are
performing in a leading position in the comparison among those three. Regarding the
geographical distribution of the members, there is no particular aspect that needs to be
mentioned.
36
Chapter 9 Conclusion
As a conclusion, higher revenue passenger kilometers give airlines much more resources to
approach a sustainable development which will lead to a cost-efficiency future. This will
increase the profitability with lower cost. A sustainability endeavour gives capital-qualified
companies a huge advance to dig out more profits. Larger airlines have better performance in
environmental sustainability reporting. On one hand it may be because it has more resources to
support such reporting activities. There could be many potential reasons behind this. This can be
an interesting topic and angel to examine it. Meanwhile, sustainability reports can give potential
investors and shareholders a much clearer view and more confidence in the future profitability of
this company, which makes airlines more willing to release more detailed and continuous
information in their sustainability-related reports.
Other than these reasons and factors which are as the starting point of a company itself,
local governments and airline alliances are playing a big role to urge airlines to disclosure more
detailed and more comprehensive information to their stakeholders. It can be boldly suggested
that governments or any other regulators are able to have the power and influence in supervising
these airlines to have more sustainable operating processes and results. Airlines may be affected
by their interests or pressure from these organizations because eventually staying competitive
and generating more profits are the core for a for-profit organisation to exist.
Recently in Wellington, New Zealand, there is a supermarket where all items are free. At the
same time, many countries in the world are also discussing and experimenting on
implementation of a minimum monthly subsidy policy for citizens. Sustainability development is
the common goal of the whole mankind. Hope these good wishes will inspire and support
airlines to make well-being their top goal.
37
Reference
Adams, C. A., & Frost, G. R. (2008). Integrating Sustainability Reporting into Management
Practices. Accounting Forum, 32, 2007–2009. https://doi.org/10.1016/j.accfor.2008.05.002
Alsaeed, K. (2006). The Association Between Firm-Specific Characteristics and Disclosure: The
Case of Saudi Arabia. Managerial Auditing Journal, 21(5), 476–496.
ATAG. (2018). Benefits Beyond Borders.
Bansal, P., & Roth, K. (2000). Why Companies Go Green: A Model of Ecological
Responsiveness. Academy of Management Journal, 43(4), 717–736.
Bebbington, J., Higgins, C., & Frame, B. (2009). Initiating Sustainable Development Reporting:
Evidence from New Zealand. Accounting, Auditing and Accountability Journal, 22(4), 588–
625. https://doi.org/10.1108/09513570910955452
Brammer, S., & Pavelin, S. (2008). Factors Influencing the Quality of Corporate Environmental
Disclosure. Business Strategy and the Environment, 136(July 2006), 120–136.
Branco, M. C., Delgado, C., Gomes, S. F., & Eugénio, T. C. (2014). Factors Influencing the
Assurance of Sustainability Reports in the Context of the Economic Crisis in Portugal.
Managerial Auditing Journal, 29(3), 237–252. https://doi.org/10.1108/MAJ-07-2013-0905
Brown, H. S., Jong, M. De, & Levy, D. L. (2009). Building Institutions Based on Information
Disclosure : Lessons from GRI’S Sustainability Reporting. Journal of Cleaner Production,
17(6), 571–580. https://doi.org/10.1016/j.jclepro.2008.12.009
Brundtland, G. H. (1987). Our Common Future: Report of the World Commission on
Environment and Development. Medicine, Conflict and Survival, 4(1), 300.

38
https://doi.org/10.1080/07488008808408783
Butler, J. B., Henderson, S. C., & Raiborn, C. (2011). Sustainability and the Balanced Scorecard:
Integrating Green Measures Into Business Reporting. Management Accounting Quarterly,
12(2), 1.
Caetano, M., & Alves, C. J. P. (2019). Innovation System in Air Transport Management.
JISTEM-Journal of Information Systems and Technology Management, 16.
Cames, M., Graichen, J., Siemons, A., & Cook, V. (2015). Emission Reduction Targets for
International Aviation and Shipping. European Parliament - Policy Department, 1, 1–52.
http://www.europarl.europa.eu/RegData/etudes/STUD/2015/569964/IPOL_STU%282015%
29569964_EN.pdf
Carnevale, C., & Mazzuca, M. (2014). Sustainability Report and Bank Valuation: Evidence
From European Stock Markets. Business Ethics: A European Review, 23(1), 69–90.
Castka, P., & Balzarova, M. A. (2008). ISO 26000 and Supply Chains—on the Diffusion of the
Social Responsibility Standard. International Journal of Production Economics, 111(2),
274–286.
Contrafatto, M. (2014). Accounting , Organizations and Society the Institutionalization of Social
and Environmental Reporting : An Italian Narrative. Accounting, Organizations and
Society, 39(6), 414–432. https://doi.org/10.1016/j.aos.2014.01.002
Cowper-smith, A., & Grosbois, D. De. (2011). The Adoption of Corporate Social Responsibility
Practices in the Airline Industry. Journal of Sustainable Tourism, 9582.
https://doi.org/10.1080/09669582.2010.498918

39
Deegan, C. (2004). Environmental Disclosures and Share Prices—a Discussion About Efforts to
Study This Relationship. Accounting Forum, 28(1), 87–97.
Deegan, C., Cooper, B. J., & Shelly, M. (2006). An Investigation of TBL Report Assurance
Statements: UK and European Evidence. Managerial Auditing Journal.
Delen, D., Kuzey, C., & Uyar, A. (2013). Measuring Firm Performance Using Financial Ratios :
A Decision Tree Approach. Expert Systems With Applications, 40(10), 3970–3983.
https://doi.org/10.1016/j.eswa.2013.01.012
Development. (1987). Our Common Future. Oxford University Press.
DiMaggio, P. J., & Powell, W. W. (1983). The IRON Cage Revisited: Institutional Isomorphism
and Collective Rationality in Organizational Fields. American Sociological Review, 147–
160.
DiMaggio, P., & Powell, W. W. (1983). The Iron Cage Revisited: Collective Rationality and
Institutional Isomorphism in Organizational Fields. American Sociological Review, 48(2),
147–160.
Dissanayake, D., Tilt, C., & Xydias-Lobo, M. (2016). Sustainability reporting by publicly listed
companies in Sri Lanka. Journal of Cleaner Production, 129, 169–182.
https://doi.org/10.1016/j.jclepro.2016.04.086
Dodds, R., & Kuehnel, J. (2010). CSR among Canadian mass tour operators : good awareness
but little action. 22(2), 221–244. https://doi.org/10.1108/09596111011018205
Einwiller, S., Ruppel, C., & Schnauber, A. (2015). Harmonization and Differences in CSR
Reporting of US and German Companies. Corporate Communication: An International

40
Journal, 1995. https://doi.org/10.1108/CCIJ-09-2014-0062
Eisenhardt, K. M. (1989). Agency Theory: An Assessment and Review. The Academy of
Management Review, 14(1), 57–75.
Environment Canada. (2010). Planning for a Sustainable Future : A Federal Sustainable
Development (Issue October).
Fama, E. F., & Jensen, M. C. (1983). Separation of Ownership and Control. The Journal of Law
and Economicsaw and Economics, 26(2), 301–325.
Farooque, O. Al, Ahulu, H., & Farooque, O. Al. (2017). Determinants of Social and Economic
Reportings Evidence from Australia, the UK and South African Multinational Enterprises.
International Journal of Accounting and Information Management.
https://doi.org/10.1108/IJAIM-01-2016-0003
Fernandez‐Feijoo, B., Romero, S., & Ruiz, S. (2015). Multilevel Approach to Sustainability
Report Assurance Decisions. Australian Accounting Review, 25(4), 346–358.
Fonseca, A., McAllister, M. L., & Fitzpatrick, P. (2012). Sustainability reporting among mining
corporations: A constructive critique of the GRI approach. Journal of Cleaner Production,
84(1), 70–83. https://doi.org/10.1016/j.jclepro.2012.11.050
Geng, D., Liu, J., & Zhu, Q. (2017). Motivating sustainable consumption among Chinese
adolescents: An empirical examination. Journal of Cleaner Production, 141, 315–322.
https://doi.org/10.1016/j.jclepro.2016.09.113
González, P., Sarkis, J., & Adenso‐Díaz, B. (2008). Environmental Management System
Certification and Its Influence on Corporate Practices. International Journal of Operations
41
& Production Management.
Grewal, R., & Dharwadkar, R. (2002). The Role of the Institutional Environment in Marketing
Channels. Journal of Marketing, 66(3), 82–97.
GRI. (2018). G4 Guideline.
Harmadji, D. E., Subroto, B., Saraswati, E., & Prihatiningtias, Y. W. (2020). Strategy, Practice
and Quality of Sustainability Reports on Stock Price Crash Risk. International Journal of
Research in Business and Social Science (2147-4478), 9(3), 34–49.
Ho, P.-L., & Taylor, G. (2013). Corporate Governance and Different Types of Voluntary
Disclosure: Evidence from Malaysian Listed Firms. Paacific Accounting Review, 25(1), 4–
29.
Hofstede, G. (2001). Culture’s Consequences: Comparing Values, Behaviors, Institutions and
Organizations Across Nations. Sage publications.
International Air Transport Association (IATA). (2020). Aircraft Technology Roadmap to 2050.
Islam, M. A., & Deegan, C. (2008). Motivations for an Organisation Within a Developing
Country to Report Social Responsibility Information : Evidence from Bangladesh.
Accounting, Auditing & Accountability Journal, 21(6), 850–874.
Jensen, M. C., & Meckling, W. H. (1976a). Theory of the Firm: Managerial Behavior, Agency
Costs and Ownership Structure. Journal of Financial Economics, 3(4), 305–360.
Jensen, M. C., & Meckling, W. H. (1976b). Theory of the Firm: Mangerial Behavior, Agency
Costs adn Ownership Structure. Journal of Finanicial, 3, 305–360.
Johnson, M. E., & Gonzalez, A. (2013). Effects of a Carbon Emissions Trading System on
42
Aviation Financial Decisions. Journal of Aviation Technology & Engineering, 2(2), 24–31.
http://search.ebscohost.com/login.aspx?direct=true&db=egs&AN=86972118&lang=es&site
=ehost-live
Kalinowski, M. (2014). Stock Exchanges Sustainability Support Assessment. Copernican
Journal of Finance & Accounting, 3(2), 37–48.
Kamla, R. (2007). Critically Appreciating Social Accounting and Reporting in the Arab
Middleeast: A Postcolonial Perspective. Advances in International Accounting, 20, 105–
177.
Karlenzig, W. (2008). What Makes Today’s Green City? Growing Greener Cities: Urban
Sustainability in the Twenty-First Century, 346.
Kearins, K., & Fryer, M. (2011). Relating Sustainability Theory to Practice at Auckland Airport:
An Engaged Scholarship Endeavour Involving Students. Corporate Social Responsibility
and Environmental Management, 161, 151–161.
Kiliç, M., Kuzey, C., & Uyar, A. (2015). The Impact of Ownership and Board Structure on
Corporate Social Responsibility(CSR) Reporting in the Turkish Banking Industry.
Corporate Governance, 15(3), 357–374.
Kolk, A., & Perego, P. (2010). Determinants of the Adoption of Sustainability Assurance
Statements: An International investigation. Business Strategy and the Environment, 19(3),
182–198.
Kuasirikun, N., & Sherer, M. (2004). Corporate Social Accounting Disclosure in Thailand.
Corporate Social Accounting Disclosure, 17(4), 629–660.

43
https://doi.org/10.1108/09513570410554588
Kuo, T. C., Kremer, G. E. O., Phuong, N. T., & Hsu, C. W. (2016). Motivations and barriers for
corporate social responsibility reporting: Evidence from the airline industry. Journal of Air
Transport Management, 57, 184–195. https://doi.org/10.1016/j.jairtraman.2016.08.003
Leamon, M. A., Rincon, E. J., Robillard, N. M., & Sutherland, J. J. (2019). Sustainable Skies:
How the Airline Industry Is Addressing Climate Change. Journal of Strategic Innovation
and Sustainability, 14(2), 85–112.
Lee, S., & Park, S. (2010). Financial Impacts of Socially Responsible Activities on Airline
Companies. International Council on Hetel, Restaurant and Institutional Education, 34(2),
185–203. https://doi.org/10.1177/1096348009349822
Lele, S. M. (1991). Sustainable Development: A Critical Review. World Development, 19(6),
607–621.
Leszczynska, A. (2012). Towards Shareholders’ Value: An Analysis of Sustainability Reports.
Industrial Management & Data Systems, 112(5–6), 911–928.
https://doi.org/10.1108/02635571211238518
Lynes, J. K., & Andrachuk, M. (2008). Motivations for Corporate Social and Environmental
Responsibility : A Case Study of Scandinavian Airlines. Journal of International
Management, 14(4), 377–390. https://doi.org/10.1016/j.intman.2007.09.004
Magretta, J. (2002). Why Business Models Matter. Harvard Business School Boston, MA.
Massa, L., Farneti, F., & Scappini, B. (2015). Developing a Sustainability Report in a Small to
Medium Enterprise: Process and Consequences. In Meditari Accountancy Research (Vol.

44
23, Issue 1). https://doi.org/10.1108/MEDAR-02-2014-0030
Mayer, D. (2007). Corporate Citizenship and Trustworthy Capitalism: Cocreating a More
Peaceful Planet. Am. Bus. LJ, 44, 237.
Mead, M., Sieben, A., & Straub, J. (1973). Coming of Age in Samoa. Penguin New York.
Naser, K., Al-Hussaini, A., Al-Kwari, D., & Nuseibeh, R. (2006). Determinants of Corporate
Social Disclosure in Developing Countries: The Case of Qatar. Advances in International
Accounting, 19, 1–23.
Nazari, J. A., Herremans, I. M., & Warsame, H. A. (2015). Sustainability Reporting: External
Motivators and Internal Facilitators. Corporate Governance (Bingley), 15(3), 375–390.
https://doi.org/10.1108/CG-01-2014-0003
Ndolo, J., & Njagi, E. (2016). Balancing Conflicting Supply Chain Stakeholder Interests : The
Big Procurement Practioner ’ s Dilemma. 4(6), 400–404.
Osterwalder, A., & Pigneur, Y. (2010). Business Model Canvas. Self Published. Last.
Park-Poaps, H., & Rees, K. (2010). Stakeholder Forces of Socially Responsible Supply Chain
Management Orientation. Journal of Business Ethics, 92(2), 305–322.
Perego, Paolo, & Kolk, A. (2012). Multinationals’ Accountability on Sustainability: The
Evolution of Third-party Assurance of Sustainability Reports. Journal of Business Ethics,
110(2), 173–190.
Perego, Paulo. (2009). Causes and Consequences of Choosing Different Assurance Providers :
An International Study of Sustainability Reporting. International Journal of Management,
26(3), 412–425.

45
Pezzey, J. (1989). Economic Analysis of Sustainable Growth and Sustainable Development.
World Bank, Washington, DC (EUA). Environment Dept.
Powell, W. W., & DiMaggio, P. J. (2012). The New Institutionalism in Organizational Analysis.
University of Chicago press.
Rajnović, L., Cico, S., & Eremić-Đorđić, J. (2019). Sustainable Operations as a Strategy of
Management of Companies, With a Review in the Field of Agriculture. Економика
Пољопривреде, 66(2).
Ralston, D. A., Gustafson, D. J., Cheung, F. M., & Terpstra, R. H. (1993). Differences in
Managerial Values: A Study of US, Hong Kong and Prc Managers. Journal of International
Business Studies, 24(2), 249–275.
Reverte, C. (2009). Determinants of Corporate Social Responsibility Disclosure Ratings by
Spanish Listed Firms Carmelo Reverte. Journal of Business Ethics, 88, 351–366.
https://doi.org/10.1007/s10551-008-9968-9
Rob, G., Reza, K., & Simon, L. (1995). Corporate Social and Environmental Reporting: A
Review of the Literature and a Longitudinal Study of UK Disclosure. Accounting, Auditing
& Accountability Journal, 8(2), 47–77. https://doi.org/10.1108/09513579510146996
Satterfield, M. B., Kolb, C. E., Peoples, R., Adams, G. L., Schuster, D. S., Ramsey, H. C.,
Stechel, E., Wood-Black, F., Garant, R. J., & Abraham, M. A. (2009). Overcoming
nontechnical barriers to the implementation of sustainable solutions in industry.
Environmental Science and Technology, 43(12), 4221–4226.
https://doi.org/10.1021/es802980j
46
Schäfer, A. W., & Waitz, I. A. (2014). Air transportation and the environment. Transport Policy,
34, 1–4. https://doi.org/10.1016/j.tranpol.2014.02.012
Scott, W. R. (1987). The Adolescence of Institutional Theory. Administrative Science Quarterly,
493–511.
Scott, W. R. (1995). Institutions and Organizations. Foundations for Organizational Science.
London: A Sage Publication Series.
Seignette, E. (2019). 3 Focus Areas According to Sustainability Experts.
Sheldon, P. J., & Park, S. (2011). An Exploratory Study of Corporate Social Responsibility in the
U.S. Travel Industry. Journal of Travel Reserach, 50(4), 392–407.
https://doi.org/10.1177/0047287510371230
Simnett, R., Vanstraelen, A., & Chua, W. F. (2009). Assurance on Sustainability Reports: An
International Comparison. The Accounting Review, 84(3), 937–967.
Simoni, L., Bini, L., & Bellucci, M. (2020). Effects of Social, Environmental, and Institutional
Factors on Sustainability Report Assurance: Evidence From European Countries. Meditari
Accountancy Research.
Skouloudis, A., Evangelinos, K., & Moraitis, S. (2011). Accountability and Stakeholder
Engagement in the Airport Industry: An Assessment of Airports’ CSR Reports. Journal of
Transport Management, 18, 16–20. https://doi.org/10.1016/j.jairtraman.2011.06.001
Slaper, T. F., & Hall, T. J. (2011). The Triple Bottom Line: What Is It and How Does It Work.
Indiana Business Review, 86(1), 4–8.
Smith, I. J., & Rodger, C. J. (2008). Carbon Emission Offsets for Aviation-Generated Emissions
47
Due to International Travel to and from New Zealand. Energy Policy, December, 1–39.
https://doi.org/10.1016/j.enpol.2008.10.046
Steurer, R., Langer, M. E., Konrad, A., & Martinuzzi, A. (2005). Corporations, stakeholders and
sustainable development I: A theoretical exploration of business-society relations. Journal
of Business Ethics, 61(3), 263–281. https://doi.org/10.1007/s10551-005-7054-0
Stubbs, W., & Cocklin, C. (2008). Conceptualizing a “Sustainability Business Model.”
Organization & Environment, 21(2), 103–127.
Tata, J., & Prasad, S. (2015). National Cultural Values, Sustainability Beliefs, and
Organizational Initiatives. Cross Cultural Management.
Teece, D. J. (2010). Business Models, Business Strategy and Innovation. Long Range Planning,
43(2–3), 172–194.
Veronica Siregar, S., & Bachtiar, Y. (2010). Corporate Social Reporting: Empirical Evidence
from Indonesia Stock Exchange. International Journal of Islamic and Middle Eastern
Finance and Management, 3(3), 241–252.
Wang, J., Song, L., & Yao, S. (2013). The Determinants of Corporate Social Responsibility
Disclosure: Evidence from China. The Journal of Applied Business Research, 29(6), 1833–
1848.
Wendling, Z. A., Emerson, J. W., Esty, D. C., Levy, M. A., & De Sherbinin, A. (2018).
Environmental Performance Index. New Haven, CT: Yale Center for Environmental Law &
Policy. Yale Center for Environmental Law & Policy, Yale University.
Wijen, F. (2014). Means Versus Ends in Opaque Institutional Fields: Trading off Compliance

48
and Achievement in Sustainability Standard Adoption. Academy of Management Review,
39(3), 302–323.
World Commission on Environment and Development. (1987). Our Common Future. Oxford
University Press.
Wu, G.-C., Ding, J.-H., & Chen, P.-S. (2012). The Effects of GSCM Drivers and Institutional
Pressures on GSCM Practices in Taiwan’s Textile and Apparel Industry. International
Journal of Production Economics, 135(2), 618–636.
Yadava, R. N., & Sinha, B. (2016). Scoring Sustainability Reports Using GRI 2011 Guidelines
for Assessing Environmental, Economic, and Social Dimensions of Leading Public and
Private Indian Companies. Journal of Business Ethics, 138(3), 549–558.
https://doi.org/10.1007/s10551-015-2597-1

49
Appendix A
Table 4 Airline Sustainability Reporting Performance Scores
Airline/Group Country Reporting Performance Scores
American Airlines Group USA 36
Delta Air Lines Group USA 39
United Continental USA 29
Emirates Airline UAE 20
Lufthansa Group Germany 26
IAG UK 25
Air France-KLM France 20
China Southern Airlines China 22
Southwest Airlines USA 39
Air China Group China 25
China Eastern Airlines China 20
Ryanair Ireland 13
Qatar Airways Qatar 38
Air Canada Group Canada 35
Turkish Airlines Turkey 23
Aeroflot Group Russia 18
Singapore Airlines Singapore 32
Cathay Pacific Group Hong Kong 39
Hainan Airlines Group China 22
Qantas Group Australia 27
LATAM Airlines Group Chile 35
Etihad Airways UAE 20
EasyJet UK 11
ANA Holdings Japan 28
Alaska Air Group USA 38
Korean Air South Korea 33
JetBlue Airways USA 8
Thai Airways International Thailand 20
Japan Airlines Group Japan 32
Norwegian Norway 15
Saudia Saudi Arabia 0
Thomas Cook Group UK 10
IndiGo India 5
AirAsia Group Malaysia 10
Wizz Air Hungary 5
Jet Airways India 0
Garuda Indonesia Indonesia 19
EVA Air Taiwan 47
Table continues

50
Airline/Group Country Reporting Performance Scores
SkyWest Inc USA 0
Air India India 0
Asiana Airlines South Korea 38
Lion Group Indonesia 0
Sichuan Airlines China 6
WestJet Canada 25
Avianca Colombia 31
China Airlines China 51
SAS Sweden 20
Grupo Aeromexico Mexico 7
Spirit Airlines USA 0
Virgin Australia Holdings Australia 2
Gol Brazil 36
TUI Airways UK 19
Philippine Airlines Philippine 0
Virgin Atlantic Airways UK 34
Alitalia Italy 0
Ethiopian Airlines Ethiopia 0
Air New Zealand New Zealand 12
TAP Air Portugal Portugal 27
Vietnam Airlines Vietnam 0
Shandong Airlines China 0
Malaysia Airlines Malaysia 0
Copa Airlines Panama 8
Finnair Finland 36
Frontier Airlines USA 0
Spring Airlines China 0
S7 Airlines Group Russia 0
Pegasus Turkey 12
Juneyao Airlines China 0
Hawaiian Airlines USA 0
Capital Airlines China 0
Volaris Mexico 20
Air Europa Spain 48
AirAsia X Malaysia 0
El Al Israel 19
Oman Air Oman 0
Cebu Pacific Air Philippines 1
Azul Brazil 0
Jet2 UK 0
Aerolineas Argentinas Argentina 0
Table continues
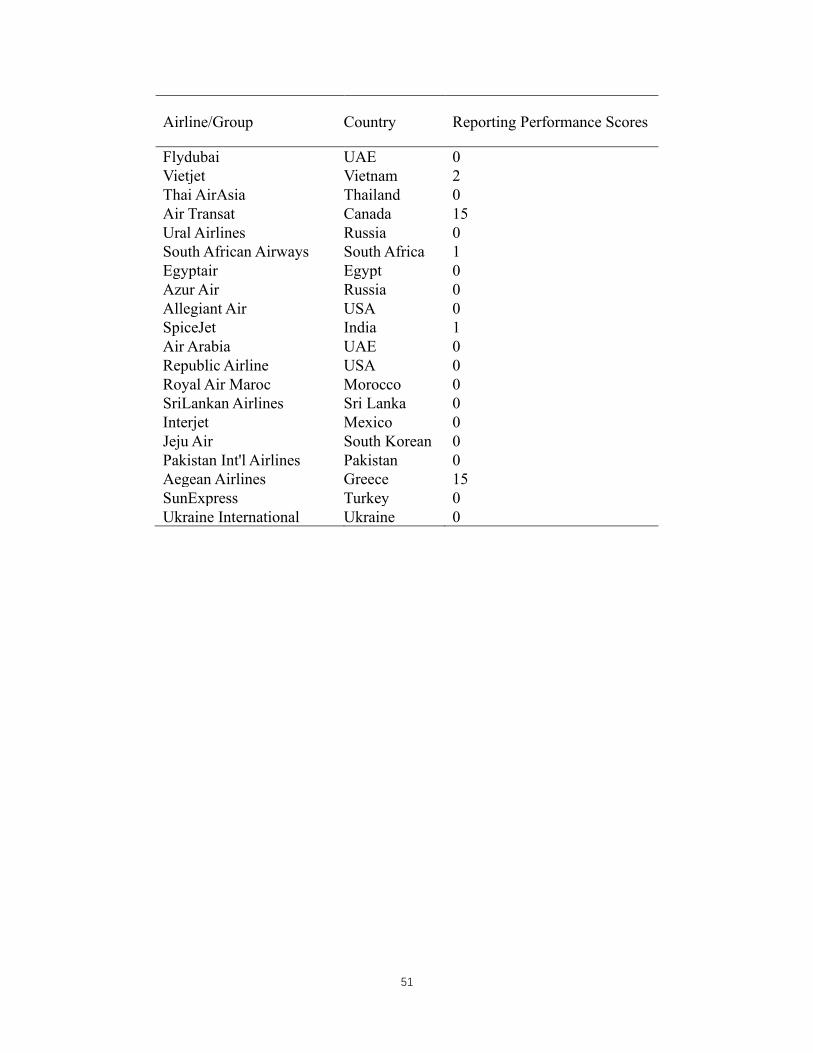
51
Airline/Group Country Reporting Performance Scores
Flydubai UAE 0
Vietjet Vietnam 2
Thai AirAsia Thailand 0
Air Transat Canada 15
Ural Airlines Russia 0
South African Airways South Africa 1
Egyptair Egypt 0
Azur Air Russia 0
Allegiant Air USA 0
SpiceJet India 1
Air Arabia UAE 0
Republic Airline USA 0
Royal Air Maroc Morocco 0
SriLankan Airlines Sri Lanka 0
Interjet Mexico 0
Jeju Air South Korean 0
Pakistan Int'l Airlines Pakistan 0
Aegean Airlines Greece 15
SunExpress Turkey 0
Ukraine International Ukraine 0
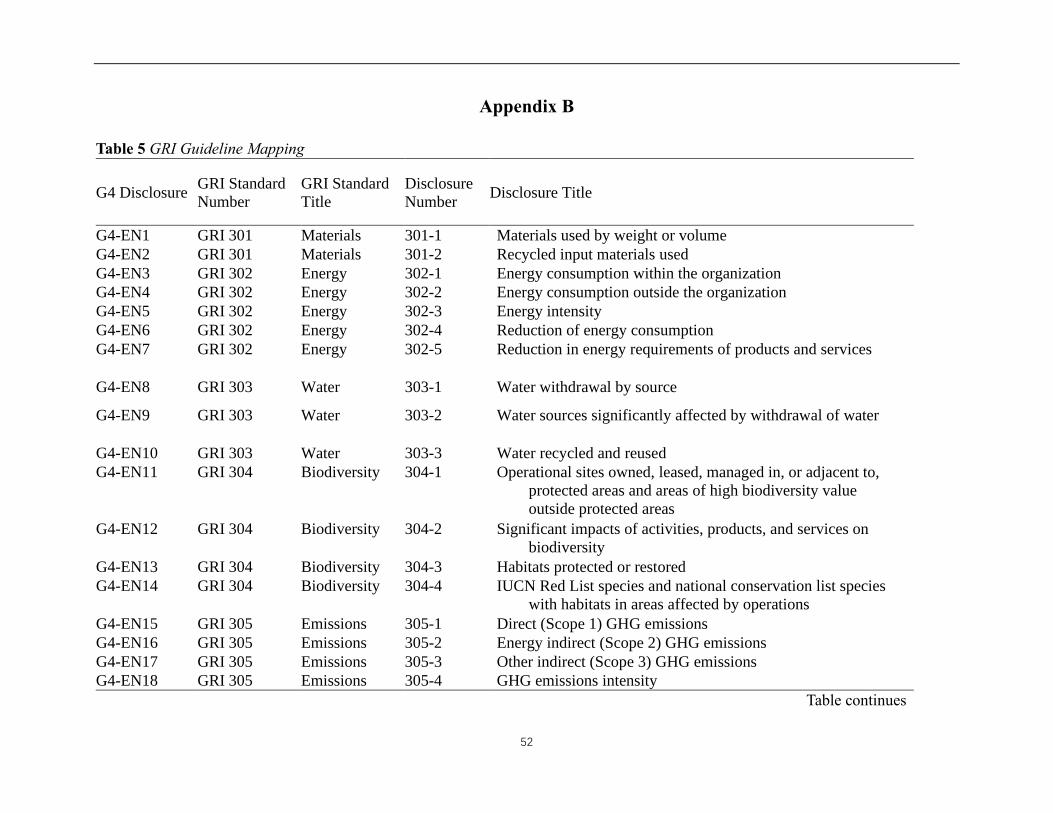
52
Appendix B
Table 5 GRI Guideline Mapping
G4 Disclosure GRI Standard
Number
GRI Standard
Title
Disclosure
Number Disclosure Title
G4-EN1 GRI 301 Materials 301-1 Materials used by weight or volume
G4-EN2 GRI 301 Materials 301-2 Recycled input materials used
G4-EN3 GRI 302 Energy 302-1 Energy consumption within the organization
G4-EN4 GRI 302 Energy 302-2 Energy consumption outside the organization
G4-EN5 GRI 302 Energy 302-3 Energy intensity
G4-EN6 GRI 302 Energy 302-4 Reduction of energy consumption
G4-EN7 GRI 302 Energy 302-5 Reduction in energy requirements of products and services
G4-EN8 GRI 303 Water 303-1 Water withdrawal by source
G4-EN9 GRI 303 Water 303-2 Water sources significantly affected by withdrawal of water
G4-EN10 GRI 303 Water 303-3 Water recycled and reused
G4-EN11 GRI 304 Biodiversity 304-1 Operational sites owned, leased, managed in, or adjacent to,
protected areas and areas of high biodiversity value
outside protected areas
G4-EN12 GRI 304 Biodiversity 304-2 Significant impacts of activities, products, and services on
biodiversity
G4-EN13 GRI 304 Biodiversity 304-3 Habitats protected or restored
G4-EN14 GRI 304 Biodiversity 304-4 IUCN Red List species and national conservation list species
with habitats in areas affected by operations
G4-EN15 GRI 305 Emissions 305-1 Direct (Scope 1) GHG emissions
G4-EN16 GRI 305 Emissions 305-2 Energy indirect (Scope 2) GHG emissions
G4-EN17 GRI 305 Emissions 305-3 Other indirect (Scope 3) GHG emissions
G4-EN18 GRI 305 Emissions 305-4 GHG emissions intensity
Table continues
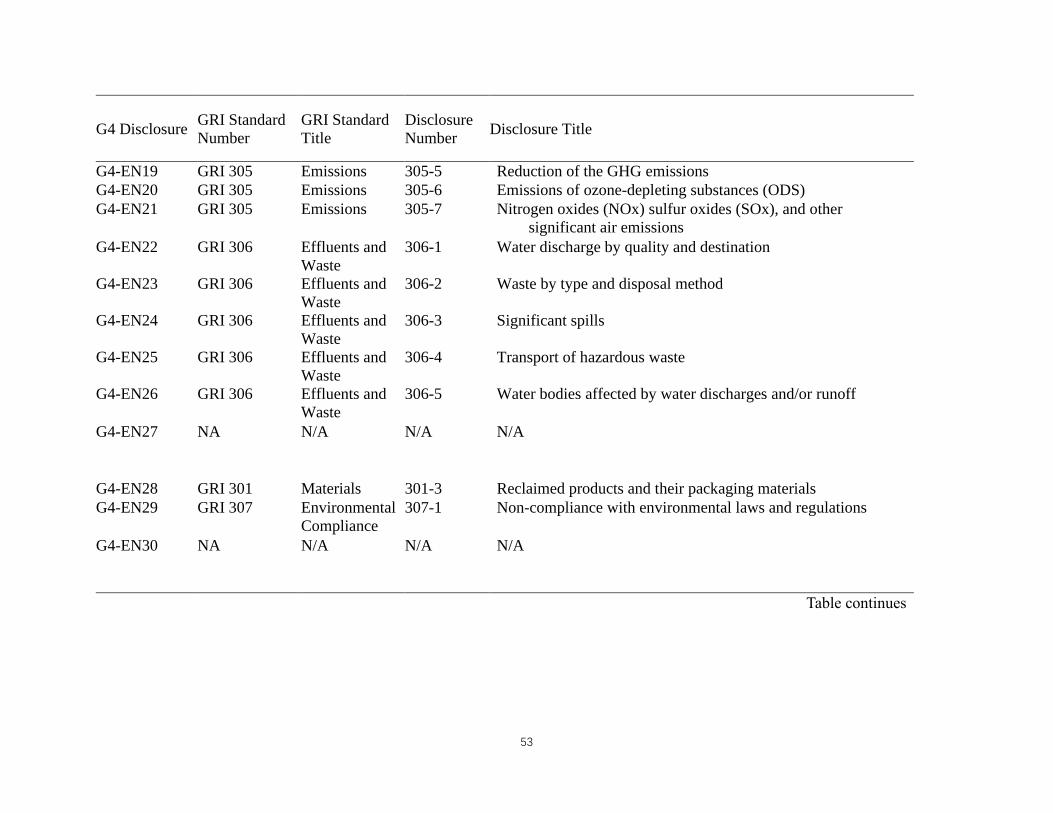
53
G4 Disclosure GRI Standard
Number
GRI Standard
Title
Disclosure
Number Disclosure Title
G4-EN19 GRI 305 Emissions 305-5 Reduction of the GHG emissions
G4-EN20 GRI 305 Emissions 305-6 Emissions of ozone-depleting substances (ODS)
G4-EN21 GRI 305 Emissions 305-7 Nitrogen oxides (NOx) sulfur oxides (SOx), and other
significant air emissions
G4-EN22 GRI 306 Effluents and
Waste
306-1 Water discharge by quality and destination
G4-EN23 GRI 306 Effluents and
Waste
306-2 Waste by type and disposal method
G4-EN24 GRI 306 Effluents and
Waste
306-3 Significant spills
G4-EN25 GRI 306 Effluents and
Waste
306-4 Transport of hazardous waste
G4-EN26 GRI 306 Effluents and
Waste
306-5 Water bodies affected by water discharges and/or runoff
G4-EN27 NA N/A N/A N/A
G4-EN28 GRI 301 Materials 301-3 Reclaimed products and their packaging materials
G4-EN29 GRI 307 Environmental
Compliance
307-1 Non-compliance with environmental laws and regulations
G4-EN30 NA N/A N/A N/A
Table continues
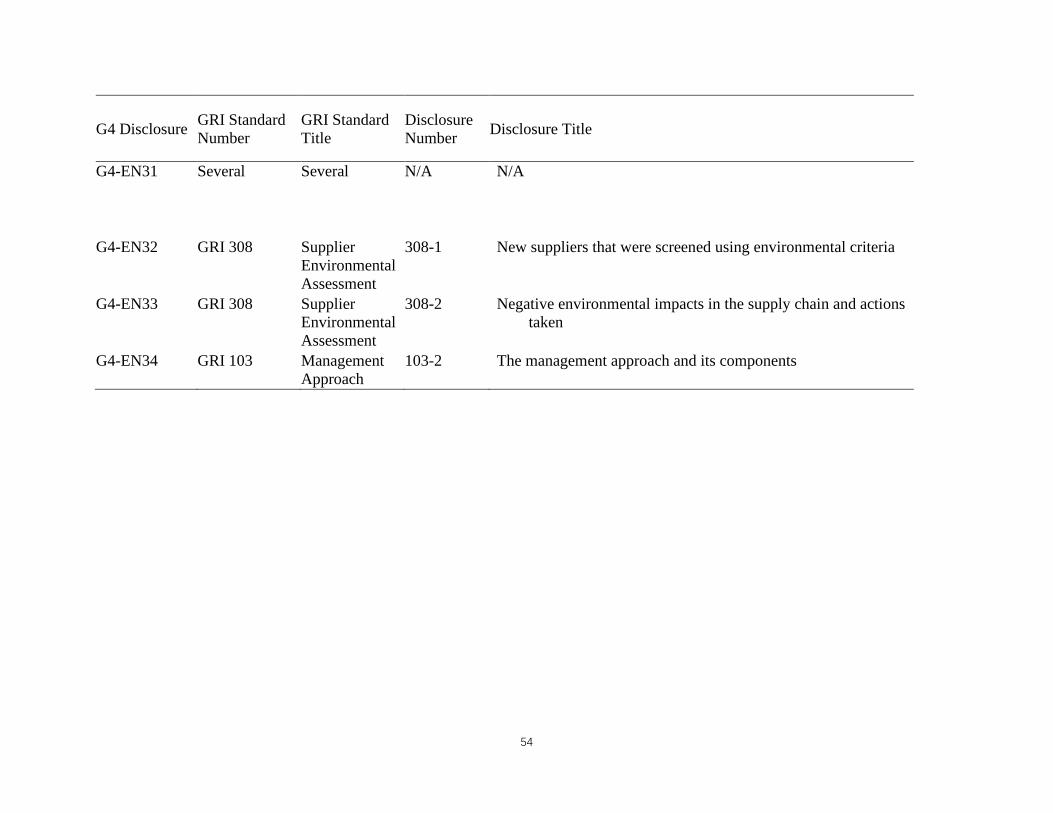
54
G4 Disclosure GRI Standard
Number
GRI Standard
Title
Disclosure
Number Disclosure Title
G4-EN31 Several Several N/A N/A
G4-EN32 GRI 308 Supplier
Environmental
Assessment
308-1 New suppliers that were screened using environmental criteria
G4-EN33 GRI 308 Supplier
Environmental
Assessment
308-2 Negative environmental impacts in the supply chain and actions
taken
G4-EN34 GRI 103 Management
Approach
103-2 The management approach and its components

55
Appendix C
Table 6 5 Detailed Examples of Environmental Sustainability Reporting Performance Score
G4
Disclosure
Disclosure
Number
American
Airlines
Group
Delta Air
Lines
Group
United
Continental
Emirates
Airline
Lufthansa
Group
EN-1 301-1 0 0 0 0 0
EN-2 301-2 0 0 0 0 0
EN-3 302-1 3 3 2 3 3
EN-4 302-2 0 1 3 0 0
EN-5 302-3 3 3 2 3 1
EN-6 302-4 1 1 3 0 2
EN-7 302-5 1 1 2 0 2
EN-8 303-1 3 0 0 0 0
EN-9 303-2 0 0 0 0 0
EN-10 303-3 0 0 0 0 0 303-4 0 0 0 0 303-5 0 0 0 0
EN-11 304-1 0 0 0 0 0
EN-12 304-2 0 0 0 0 0
EN-13 304-3 0 0 0 2 0
EN-14 304-4 0 0 0 0 0
EN-15 305-1 3 3 0 3 3
EN-16 305-2 3 3 3 3 3
EN-17 305-3 3 3 3 0 3
EN-18 305-4 3 1 3 3 2
EN-19 305-5 1 1 0 0 2
EN-20 305-6 3 3 2 0 0
EN-21 305-7 3 3 0 3 0
EN-22 306-1 0 1 0 0 0
EN-23 306-2 3 3 3 0 0
EN-24 306-3 0 3 0 0 0
EN-25 306-4 0 1 0 0 0
EN-26 306-5 0 1 3 0 0
EN-27 0
EN-28 301-3 0 0 0 0 0
EN-29 307-1 3 1 0 0 0
EN-30 0
EN-31 0
EN-32 308-1 0 0 0 0 2
EN-33 308-2 0 0 0 0 0

56
G4
Disclosure
Disclosure
Number
American
Airlines
Group
Delta Air
Lines
Group
United
Continental
Emirates
Airline
Lufthansa
Group
EN-34 103-2 0
103-1 0 1 0 1 103-2 0 1 0 1 103-3 0 1 0 1
Total 36 39 29 20 26
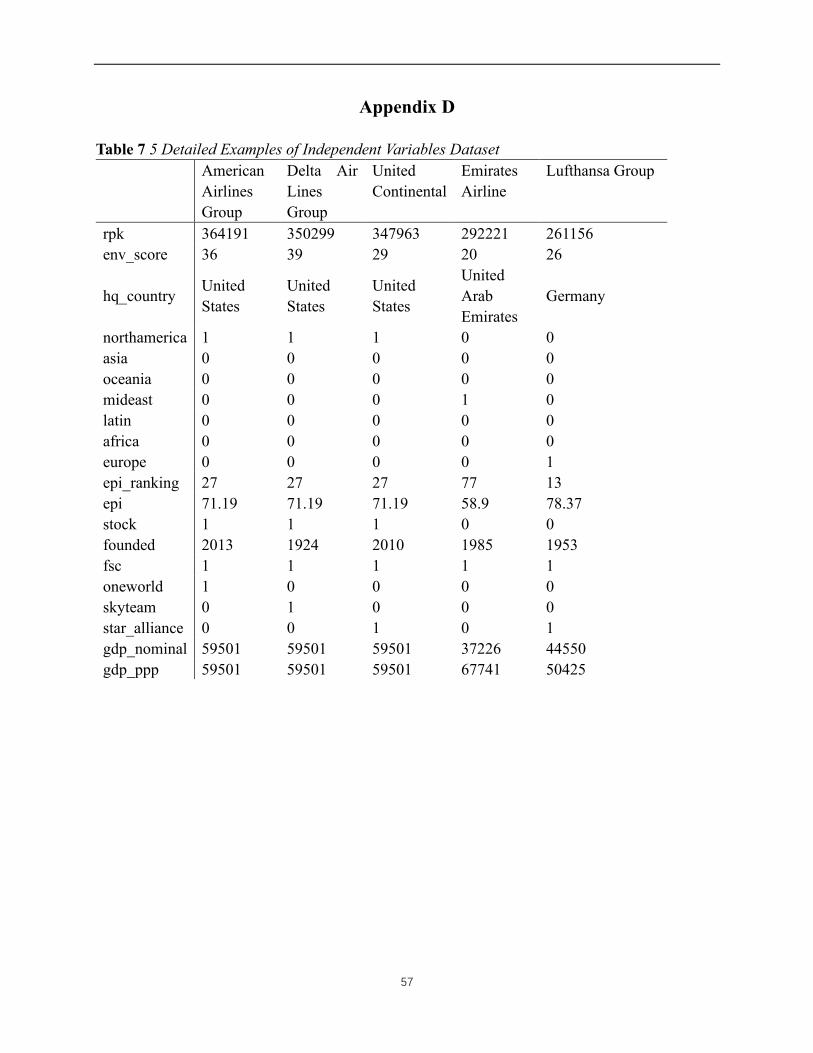
57
Appendix D
Table 7 5 Detailed Examples of Independent Variables Dataset
American
Airlines
Group
Delta Air
Lines
Group
United
Continental
Emirates
Airline
Lufthansa Group
rpk 364191 350299 347963 292221 261156
env_score 36 39 29 20 26
hq_country United
States
United
States
United
States
United
Arab
Emirates
Germany
northamerica 1 1 1 0 0
asia 0 0 0 0 0
oceania 0 0 0 0 0
mideast 0 0 0 1 0
latin 0 0 0 0 0
africa 0 0 0 0 0
europe 0 0 0 0 1
epi_ranking 27 27 27 77 13
epi 71.19 71.19 71.19 58.9 78.37
stock 1 1 1 0 0
founded 2013 1924 2010 1985 1953
fsc 1 1 1 1 1
oneworld 1 0 0 0 0
skyteam 0 1 0 0 0
star_alliance 0 0 1 0 1
gdp_nominal 59501 59501 59501 37226 44550
gdp_ppp 59501 59501 59501 67741 50425

58
Appendix E
Regression Model Testing by RStudio
In the initial linear regression, all dummy variables (region, business model, alliance) are
included in the model to test if there is any mistake made in the data about those variables which
should have perfect collinearity among them. And as the result shown below, Europe, lcc(low
cost carrier), and no_alliance are not defined because of singularities, which means data of
locations of airlines’ headquarters, business model and alliance status are perfectly collinear.
Formula:
𝑒𝑛𝑣_𝑠𝑐𝑜𝑟𝑒 = 𝛽1 × 𝑟𝑝𝑘 + 𝛽2 × 𝑛𝑜𝑟𝑡ℎ𝑎𝑚𝑒𝑟𝑖𝑐𝑎 + 𝛽3 × 𝑎𝑠𝑖𝑎 + 𝛽4 × 𝑜𝑐𝑒𝑎𝑛𝑖𝑎
+ 𝛽5 × 𝑚𝑖𝑑𝑒𝑎𝑠𝑡 + 𝛽6 × 𝑙𝑎𝑡𝑖𝑛 + 𝛽7 × 𝑎𝑓𝑟𝑖𝑐𝑎 + 𝛽8 × 𝑒𝑢𝑟𝑜𝑝𝑒 + 𝛽9 × 𝑒𝑝𝑖
+ 𝛽10 × 𝑠𝑡𝑜𝑐𝑘 + 𝛽11 × 𝑓𝑠𝑐 + 𝛽12 × 𝑙𝑐𝑐 + 𝛽13 × 𝑜𝑛𝑒𝑤𝑜𝑟𝑙𝑑
+ 𝛽14 × 𝑠𝑘𝑦𝑡𝑒𝑎𝑚 + 𝛽15 × 𝑠𝑡𝑎𝑟_𝑎𝑙𝑙𝑖𝑎𝑛𝑐𝑒 + 𝛽16 × 𝑛𝑜_𝑎𝑙𝑙𝑖𝑎𝑛𝑐𝑒
+ 𝛽17 × 𝑔𝑑𝑝𝑛𝑜𝑚𝑖𝑛𝑎𝑙 + 𝛽18 × 𝑔𝑑𝑝𝑝𝑝𝑝 + 𝛽0+𝜇0
Residuals:
Min 1Q Median 3Q Max
-15.651 -7.570 -1.181 5.569 34.344
Coefficients: (3 not defined because of singularities)
Estimate Std. Error t value Pr(>|t|)
(Intercept) -2.641e+01 1.156e+01 -2.284 0.02493 *
rpk 4.676e-05 1.728e-05 2.706 0.00826 **
northamerica 3.268e-01 4.765e+00 0.069 0.94549
asia 4.137e+00 4.809e+00 0.860 0.39214
oceania -4.386e+00 7.430e+00 -0.590 0.55659
mideast -1.535e-01 6.034e+00 -0.025 0.97977
latin 7.243e+00 5.443e+00 1.331 0.18696 .
africa -3.116e+00 8.342e+00 -0.374 0.70966
europe NA NA NA NA
epi 4.037e-01 1.732e-01 2.331 0.02217 *
stock 8.604e+00 2.642e+00 3.256 0.00164 **
fsc -2.896e+00 3.119e+00 -0.928 0.35589
lcc NA NA NA NA

59
oneworld 6.152e+00 4.316e+00 1.425 0.15779
skyteam 3.803e+00 4.084e+00 0.931 0.35488
star_alliance 7.381e+00 3.619e+00 2.040 0.04458 *
no_alliance NA NA NA NA
gdp_nominal -1.902e-04 2.209e-04 -0.861 0.39176
gdp_ppp 2.306e-04 1.628e-04 1.417 0.16034
---
Signif. codes: 0 ‘***’ 0.001 ‘**’ 0.01 ‘*’ 0.05 ‘.’ 0.1 ‘ ’ 1
Residual standard error: 10.95 on 83 degrees of freedom
Multiple R-squared: 0.5417, Adjusted R-squared: 0.4589
F-statistic: 6.541 on 15 and 83 DF, p-value: 5.646e-09
As shown in the upper right corner of the figure 10, most of the points in the graph fall on a
straight line at a 45-degree angle, which means it meets the assumption of normality. The
Residual vs Fitted graph is shown on the top left corner of the figure 9, where curvilinear
relationship exists but not obvious. For the independence of dependent variables, there is no
priori reason to believe that there is a relationship between an airline's environmental
sustainability reporting performance score and another airline's score. Some of those airlines may
come from a same alliance, but they are still independent company on operational level.
Therefore, it is reasonable to believe that those reports are written and finished independently.
Subsequently, homoskedasticity will be tested.
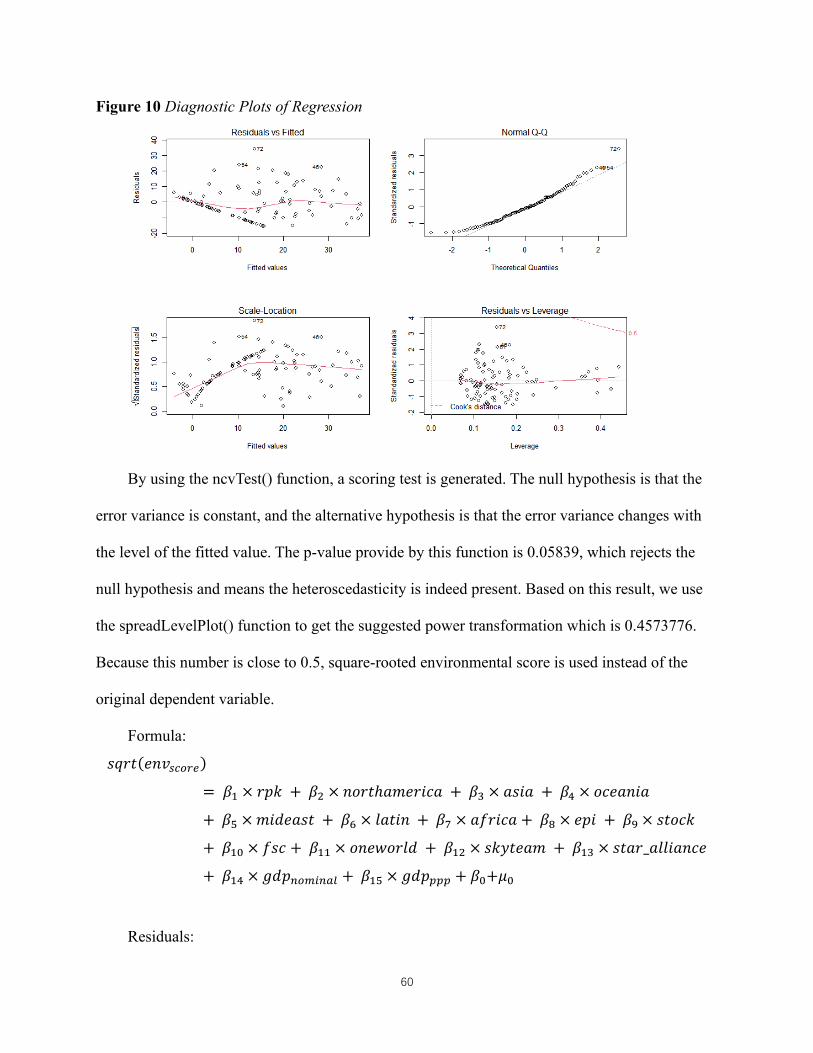
60
Figure 10 Diagnostic Plots of Regression
By using the ncvTest() function, a scoring test is generated. The null hypothesis is that the
error variance is constant, and the alternative hypothesis is that the error variance changes with
the level of the fitted value. The p-value provide by this function is 0.05839, which rejects the
null hypothesis and means the heteroscedasticity is indeed present. Based on this result, we use
the spreadLevelPlot() function to get the suggested power transformation which is 0.4573776.
Because this number is close to 0.5, square-rooted environmental score is used instead of the
original dependent variable.
Formula:
𝑠𝑞𝑟𝑡(𝑒𝑛𝑣𝑠𝑐𝑜𝑟𝑒)
= 𝛽1 × 𝑟𝑝𝑘 + 𝛽2 × 𝑛𝑜𝑟𝑡ℎ𝑎𝑚𝑒𝑟𝑖𝑐𝑎 + 𝛽3 × 𝑎𝑠𝑖𝑎 + 𝛽4 × 𝑜𝑐𝑒𝑎𝑛𝑖𝑎
+ 𝛽5 × 𝑚𝑖𝑑𝑒𝑎𝑠𝑡 + 𝛽6 × 𝑙𝑎𝑡𝑖𝑛 + 𝛽7 × 𝑎𝑓𝑟𝑖𝑐𝑎 + 𝛽8 × 𝑒𝑝𝑖 + 𝛽9 × 𝑠𝑡𝑜𝑐𝑘
+ 𝛽10 × 𝑓𝑠𝑐 + 𝛽11 × 𝑜𝑛𝑒𝑤𝑜𝑟𝑙𝑑 + 𝛽12 × 𝑠𝑘𝑦𝑡𝑒𝑎𝑚 + 𝛽13 × 𝑠𝑡𝑎𝑟_𝑎𝑙𝑙𝑖𝑎𝑛𝑐𝑒
+ 𝛽14 × 𝑔𝑑𝑝𝑛𝑜𝑚𝑖𝑛𝑎𝑙 + 𝛽15 × 𝑔𝑑𝑝𝑝𝑝𝑝 + 𝛽0+𝜇0
Residuals:
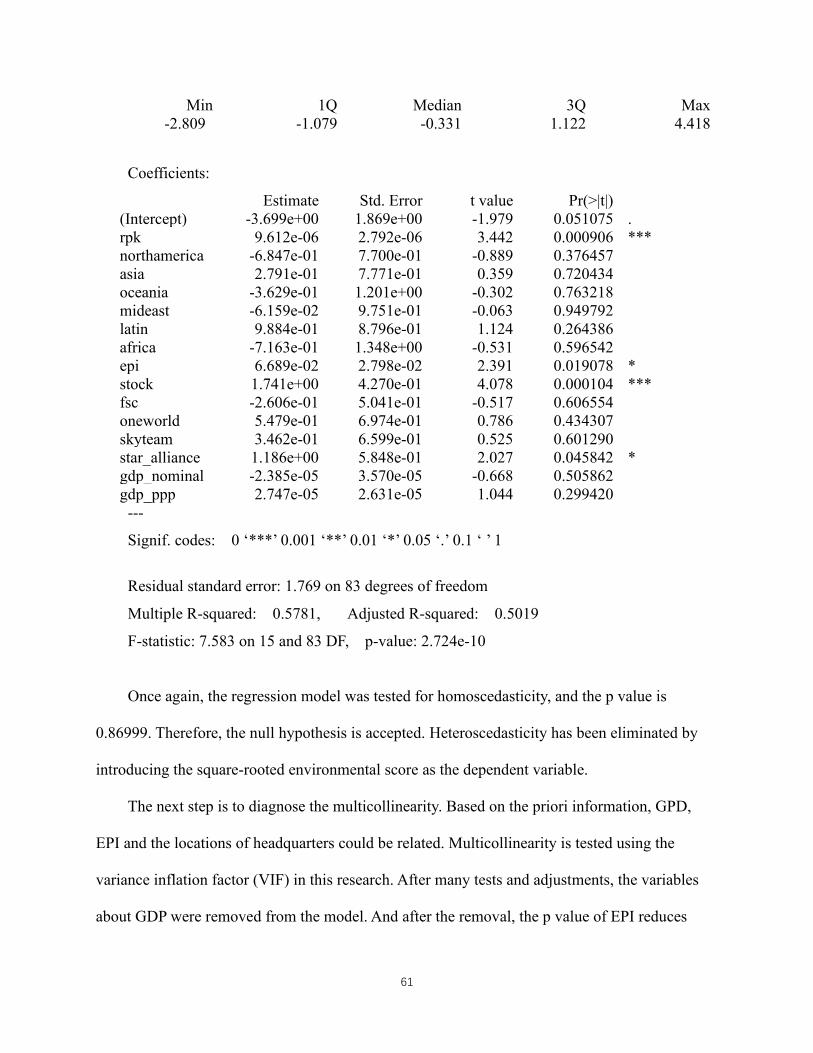
61
Min 1Q Median 3Q Max
-2.809 -1.079 -0.331 1.122 4.418
Coefficients:
Estimate Std. Error t value Pr(>|t|)
(Intercept) -3.699e+00 1.869e+00 -1.979 0.051075 .
rpk 9.612e-06 2.792e-06 3.442 0.000906 ***
northamerica -6.847e-01 7.700e-01 -0.889 0.376457
asia 2.791e-01 7.771e-01 0.359 0.720434
oceania -3.629e-01 1.201e+00 -0.302 0.763218
mideast -6.159e-02 9.751e-01 -0.063 0.949792
latin 9.884e-01 8.796e-01 1.124 0.264386
africa -7.163e-01 1.348e+00 -0.531 0.596542
epi 6.689e-02 2.798e-02 2.391 0.019078 *
stock 1.741e+00 4.270e-01 4.078 0.000104 ***
fsc -2.606e-01 5.041e-01 -0.517 0.606554
oneworld 5.479e-01 6.974e-01 0.786 0.434307
skyteam 3.462e-01 6.599e-01 0.525 0.601290
star_alliance 1.186e+00 5.848e-01 2.027 0.045842 *
gdp_nominal -2.385e-05 3.570e-05 -0.668 0.505862
gdp_ppp 2.747e-05 2.631e-05 1.044 0.299420
---
Signif. codes: 0 ‘***’ 0.001 ‘**’ 0.01 ‘*’ 0.05 ‘.’ 0.1 ‘ ’ 1
Residual standard error: 1.769 on 83 degrees of freedom
Multiple R-squared: 0.5781, Adjusted R-squared: 0.5019
F-statistic: 7.583 on 15 and 83 DF, p-value: 2.724e-10
Once again, the regression model was tested for homoscedasticity, and the p value is
0.86999. Therefore, the null hypothesis is accepted. Heteroscedasticity has been eliminated by
introducing the square-rooted environmental score as the dependent variable.
The next step is to diagnose the multicollinearity. Based on the priori information, GPD,
EPI and the locations of headquarters could be related. Multicollinearity is tested using the
variance inflation factor (VIF) in this research. After many tests and adjustments, the variables
about GDP were removed from the model. And after the removal, the p value of EPI reduces
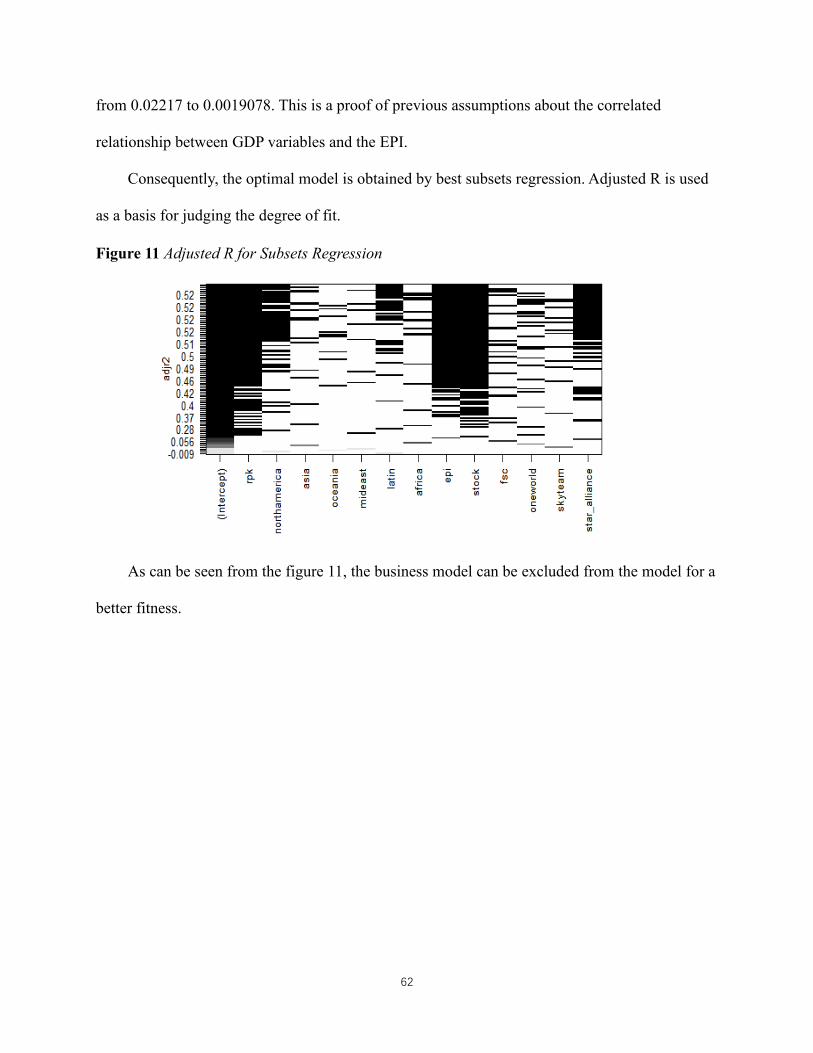
62
from 0.02217 to 0.0019078. This is a proof of previous assumptions about the correlated
relationship between GDP variables and the EPI.
Consequently, the optimal model is obtained by best subsets regression. Adjusted R is used
as a basis for judging the degree of fit.
Figure 11 Adjusted R for Subsets Regression
As can be seen from the figure 11, the business model can be excluded from the model for a
better fitness.
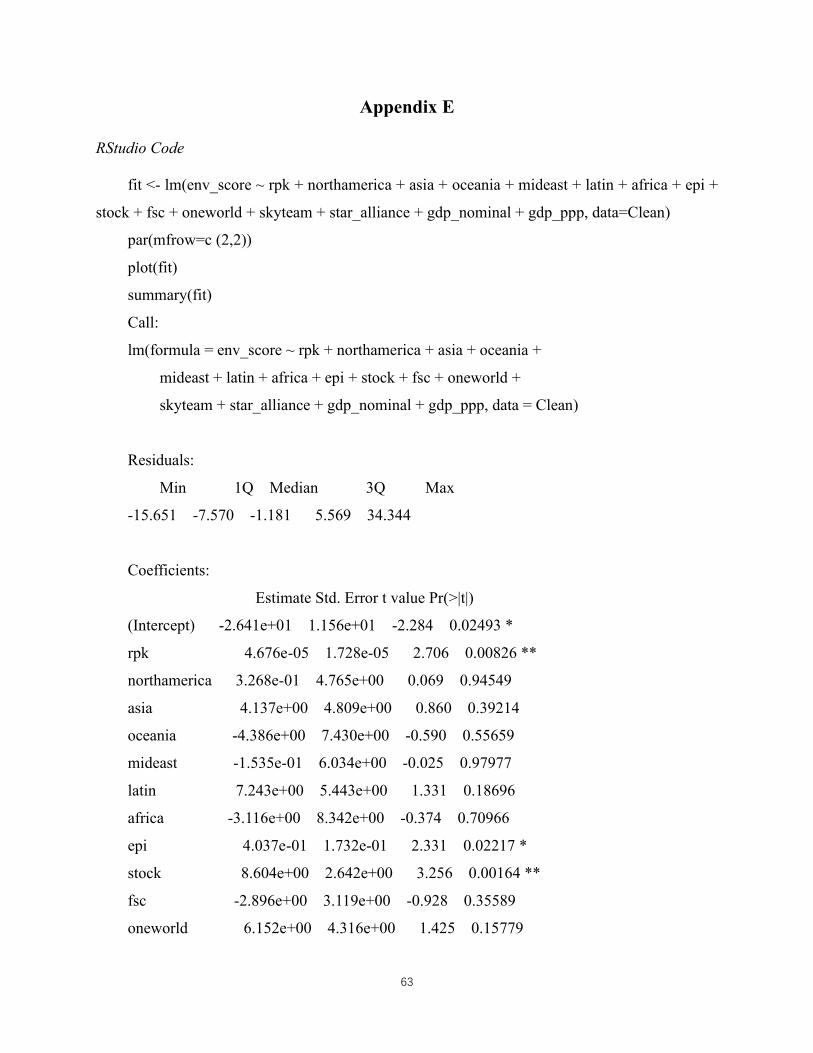
63
Appendix E
RStudio Code
fit <- lm(env_score ~ rpk + northamerica + asia + oceania + mideast + latin + africa + epi +
stock + fsc + oneworld + skyteam + star_alliance + gdp_nominal + gdp_ppp, data=Clean)
par(mfrow=c (2,2))
plot(fit)
summary(fit)
Call:
lm(formula = env_score ~ rpk + northamerica + asia + oceania +
mideast + latin + africa + epi + stock + fsc + oneworld +
skyteam + star_alliance + gdp_nominal + gdp_ppp, data = Clean)
Residuals:
Min 1Q Median 3Q Max
-15.651 -7.570 -1.181 5.569 34.344
Coefficients:
Estimate Std. Error t value Pr(>|t|)
(Intercept) -2.641e+01 1.156e+01 -2.284 0.02493 *
rpk 4.676e-05 1.728e-05 2.706 0.00826 **
northamerica 3.268e-01 4.765e+00 0.069 0.94549
asia 4.137e+00 4.809e+00 0.860 0.39214
oceania -4.386e+00 7.430e+00 -0.590 0.55659
mideast -1.535e-01 6.034e+00 -0.025 0.97977
latin 7.243e+00 5.443e+00 1.331 0.18696
africa -3.116e+00 8.342e+00 -0.374 0.70966
epi 4.037e-01 1.732e-01 2.331 0.02217 *
stock 8.604e+00 2.642e+00 3.256 0.00164 **
fsc -2.896e+00 3.119e+00 -0.928 0.35589
oneworld 6.152e+00 4.316e+00 1.425 0.15779
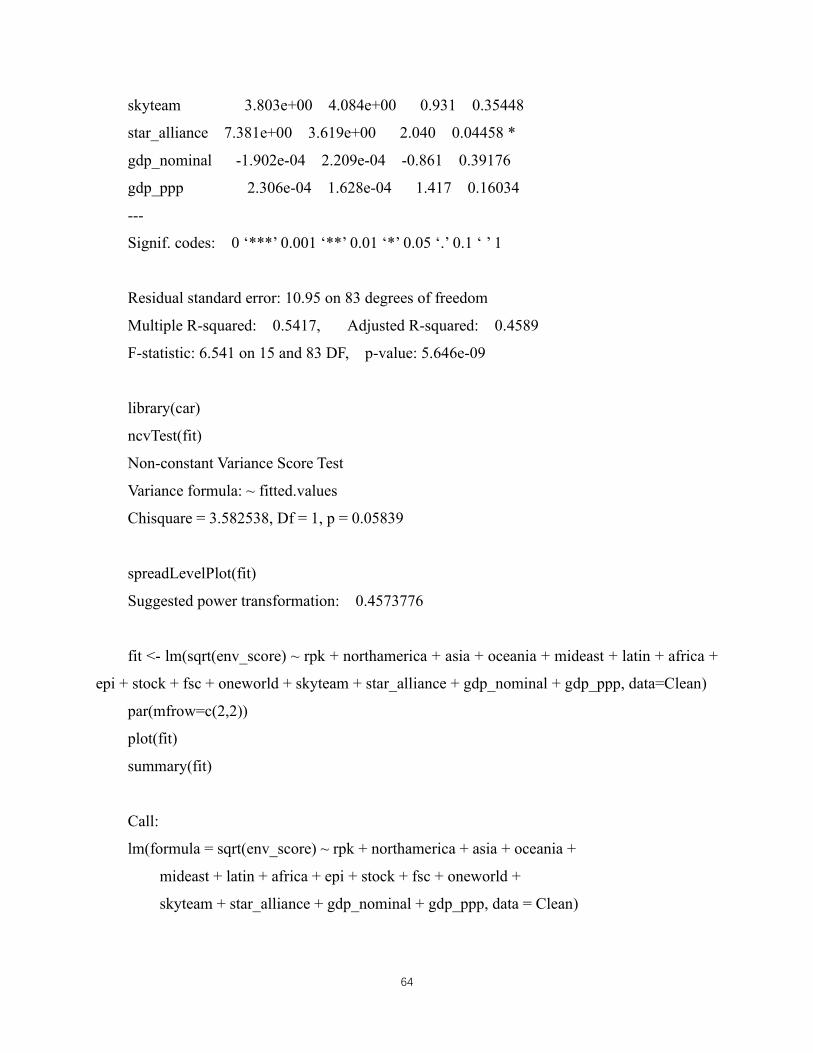
64
skyteam 3.803e+00 4.084e+00 0.931 0.35448
star_alliance 7.381e+00 3.619e+00 2.040 0.04458 *
gdp_nominal -1.902e-04 2.209e-04 -0.861 0.39176
gdp_ppp 2.306e-04 1.628e-04 1.417 0.16034
---
Signif. codes: 0 ‘***’ 0.001 ‘**’ 0.01 ‘*’ 0.05 ‘.’ 0.1 ‘ ’ 1
Residual standard error: 10.95 on 83 degrees of freedom
Multiple R-squared: 0.5417, Adjusted R-squared: 0.4589
F-statistic: 6.541 on 15 and 83 DF, p-value: 5.646e-09
library(car)
ncvTest(fit)
Non-constant Variance Score Test
Variance formula: ~ fitted.values
Chisquare = 3.582538, Df = 1, p = 0.05839
spreadLevelPlot(fit)
Suggested power transformation: 0.4573776
fit <- lm(sqrt(env_score) ~ rpk + northamerica + asia + oceania + mideast + latin + africa +
epi + stock + fsc + oneworld + skyteam + star_alliance + gdp_nominal + gdp_ppp, data=Clean)
par(mfrow=c(2,2))
plot(fit)
summary(fit)
Call:
lm(formula = sqrt(env_score) ~ rpk + northamerica + asia + oceania +
mideast + latin + africa + epi + stock + fsc + oneworld +
skyteam + star_alliance + gdp_nominal + gdp_ppp, data = Clean)

65
Residuals:
Min 1Q Median 3Q Max
-2.809 -1.079 -0.331 1.122 4.418
Coefficients:
Estimate Std. Error t value Pr(>|t|)
(Intercept) -3.699e+00 1.869e+00 -1.979 0.051075 .
rpk 9.612e-06 2.792e-06 3.442 0.000906 ***
northamerica -6.847e-01 7.700e-01 -0.889 0.376457
asia 2.791e-01 7.771e-01 0.359 0.720434
oceania -3.629e-01 1.201e+00 -0.302 0.763218
mideast -6.159e-02 9.751e-01 -0.063 0.949792
latin 9.884e-01 8.796e-01 1.124 0.264386
africa -7.163e-01 1.348e+00 -0.531 0.596542
epi 6.689e-02 2.798e-02 2.391 0.019078 *
stock 1.741e+00 4.270e-01 4.078 0.000104 ***
fsc -2.606e-01 5.041e-01 -0.517 0.606554
oneworld 5.479e-01 6.974e-01 0.786 0.434307
skyteam 3.462e-01 6.599e-01 0.525 0.601290
star_alliance 1.186e+00 5.848e-01 2.027 0.045842 *
gdp_nominal -2.385e-05 3.570e-05 -0.668 0.505862
gdp_ppp 2.747e-05 2.631e-05 1.044 0.299420
---
Signif. codes: 0 ‘***’ 0.001 ‘**’ 0.01 ‘*’ 0.05 ‘.’ 0.1 ‘ ’ 1
Residual standard error: 1.769 on 83 degrees of freedom
Multiple R-squared: 0.5781, Adjusted R-squared: 0.5019
F-statistic: 7.583 on 15 and 83 DF, p-value: 2.724e-10
ncvTest(fit)
Non-constant Variance Score Test

66
Variance formula: ~ fitted.values
Chisquare = 0.02678925, Df = 1, p = 0.86999
fit <- lm(sqrt(env_score) ~ rpk + northamerica + asia + oceania + mideast + latin + africa +
epi + stock + fsc + oneworld + skyteam +star_alliance + gdp_nominal + gdp_ppp, data=Clean)
vif(fit)
rpk northamerica asia oceania
1.565850 2.541006 4.560780 1.339828
mideast latin africa epi
3.203664 2.022598 1.688868 3.783838
stock fsc oneworld skyteam
1.434715 1.697566 1.638931 1.571404
star_alliance gdp_nominal gdp_ppp
1.743996 18.647633 10.740433
sqrt(vif(fit)) > 2 # problem?
rpk northamerica asia oceania
FALSE FALSE TRUE FALSE
mideast latin africa epi
FALSE FALSE FALSE FALSE
stock fsc oneworld skyteam
FALSE FALSE FALSE FALSE
star_alliance gdp_nominal gdp_ppp
FALSE TRUE TRUE
fit <- lm(sqrt(env_score) ~ rpk + northamerica + asia + oceania + mideast + latin + africa +
epi + stock + fsc + oneworld + skyteam +star_alliance, data=Clean)
par(mfrow=c(2,2))
plot(fit)
summary(fit)
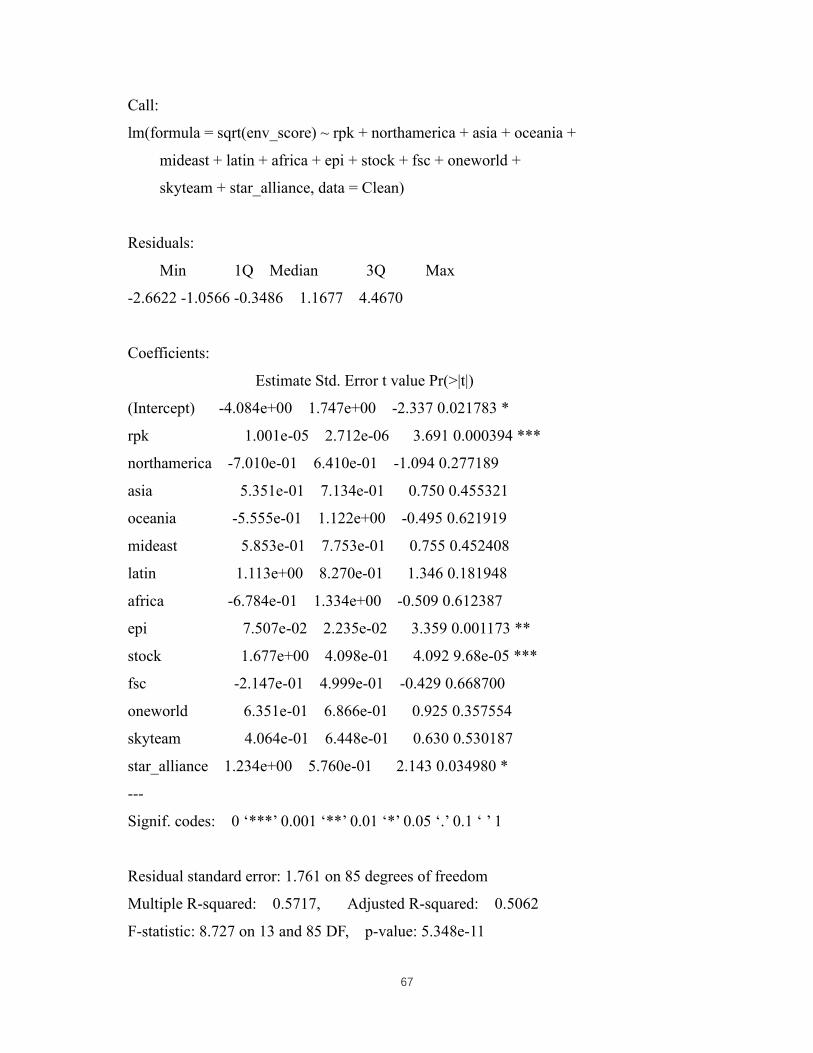
67
Call:
lm(formula = sqrt(env_score) ~ rpk + northamerica + asia + oceania +
mideast + latin + africa + epi + stock + fsc + oneworld +
skyteam + star_alliance, data = Clean)
Residuals:
Min 1Q Median 3Q Max
-2.6622 -1.0566 -0.3486 1.1677 4.4670
Coefficients:
Estimate Std. Error t value Pr(>|t|)
(Intercept) -4.084e+00 1.747e+00 -2.337 0.021783 *
rpk 1.001e-05 2.712e-06 3.691 0.000394 ***
northamerica -7.010e-01 6.410e-01 -1.094 0.277189
asia 5.351e-01 7.134e-01 0.750 0.455321
oceania -5.555e-01 1.122e+00 -0.495 0.621919
mideast 5.853e-01 7.753e-01 0.755 0.452408
latin 1.113e+00 8.270e-01 1.346 0.181948
africa -6.784e-01 1.334e+00 -0.509 0.612387
epi 7.507e-02 2.235e-02 3.359 0.001173 **
stock 1.677e+00 4.098e-01 4.092 9.68e-05 ***
fsc -2.147e-01 4.999e-01 -0.429 0.668700
oneworld 6.351e-01 6.866e-01 0.925 0.357554
skyteam 4.064e-01 6.448e-01 0.630 0.530187
star_alliance 1.234e+00 5.760e-01 2.143 0.034980 *
---
Signif. codes: 0 ‘***’ 0.001 ‘**’ 0.01 ‘*’ 0.05 ‘.’ 0.1 ‘ ’ 1
Residual standard error: 1.761 on 85 degrees of freedom
Multiple R-squared: 0.5717, Adjusted R-squared: 0.5062
F-statistic: 8.727 on 13 and 85 DF, p-value: 5.348e-11

68
library(leaps)
leaps <- regsubsets(sqrt(env_score) ~ rpk + northamerica + asia + oceania + mideast + latin
+ africa + epi + stock + fsc + oneworld + skyteam +star_alliance, data=Clean, nbest=14)
plot(leaps, scale = "adjr2")
fit <- lm(sqrt(env_score) ~ rpk + epi + stock, data=Clean)
summary(fit)
Call:
lm(formula = sqrt(env_score) ~ rpk + epi + stock, data = Clean)
Residuals:
Min 1Q Median 3Q Max
-3.7660 -1.2664 -0.4754 1.3148 4.6684
Coefficients:
Estimate Std. Error t value Pr(>|t|)
(Intercept) -2.510e+00 9.507e-01 -2.640 0.009692 **
rpk 1.060e-05 2.553e-06 4.151 7.21e-05 ***
epi 5.742e-02 1.529e-02 3.755 0.000299 ***
stock 1.738e+00 4.042e-01 4.300 4.14e-05 ***
---
Signif. codes: 0 ‘***’ 0.001 ‘**’ 0.01 ‘*’ 0.05 ‘.’ 0.1 ‘ ’ 1
Residual standard error: 1.833 on 95 degrees of freedom
Multiple R-squared: 0.4817, Adjusted R-squared: 0.4653
F-statistic: 29.43 on 3 and 95 DF, p-value: 1.525e-13
relweights <- function(fit, ...) {
R <- cor(fit$model)
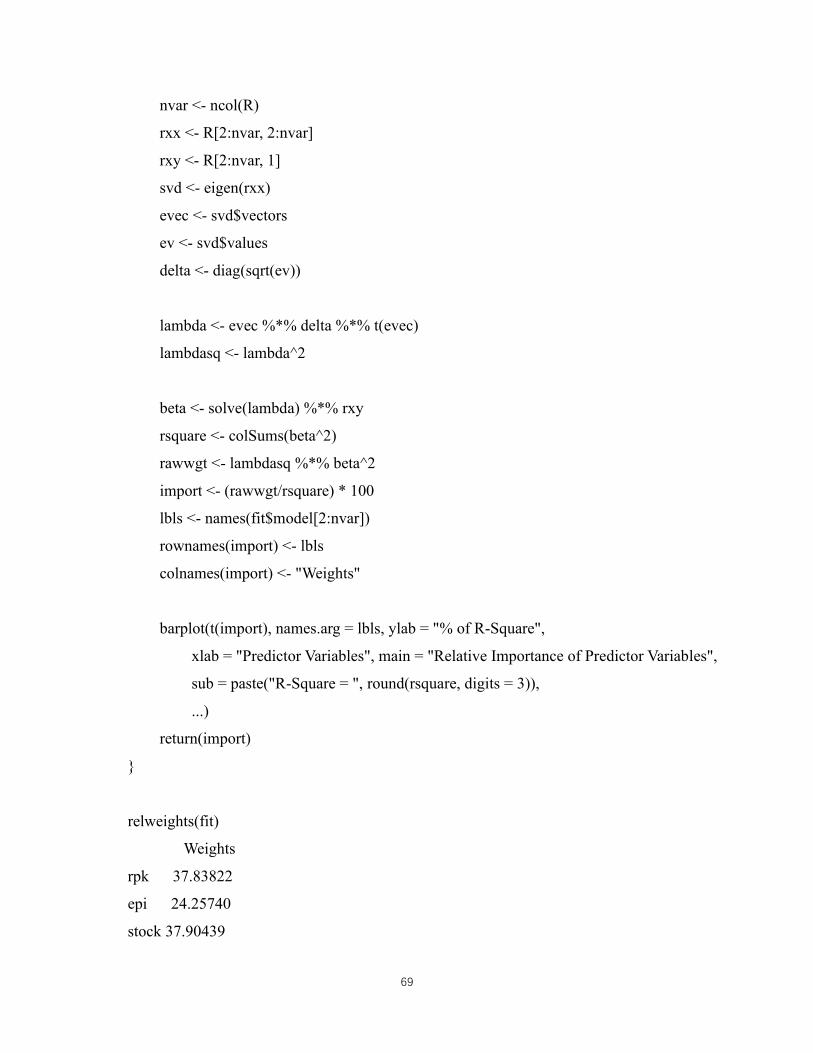
69
nvar <- ncol(R)
rxx <- R[2:nvar, 2:nvar]
rxy <- R[2:nvar, 1]
svd <- eigen(rxx)
evec <- svd$vectors
ev <- svd$values
delta <- diag(sqrt(ev))
lambda <- evec %*% delta %*% t(evec)
lambdasq <- lambda^2
beta <- solve(lambda) %*% rxy
rsquare <- colSums(beta^2)
rawwgt <- lambdasq %*% beta^2
import <- (rawwgt/rsquare) * 100
lbls <- names(fit$model[2:nvar])
rownames(import) <- lbls
colnames(import) <- "Weights"
barplot(t(import), names.arg = lbls, ylab = "% of R-Square",
xlab = "Predictor Variables", main = "Relative Importance of Predictor Variables",
sub = paste("R-Square = ", round(rsquare, digits = 3)),
...)
return(import)
}
relweights(fit)
Weights
rpk 37.83822
epi 24.25740
stock 37.90439
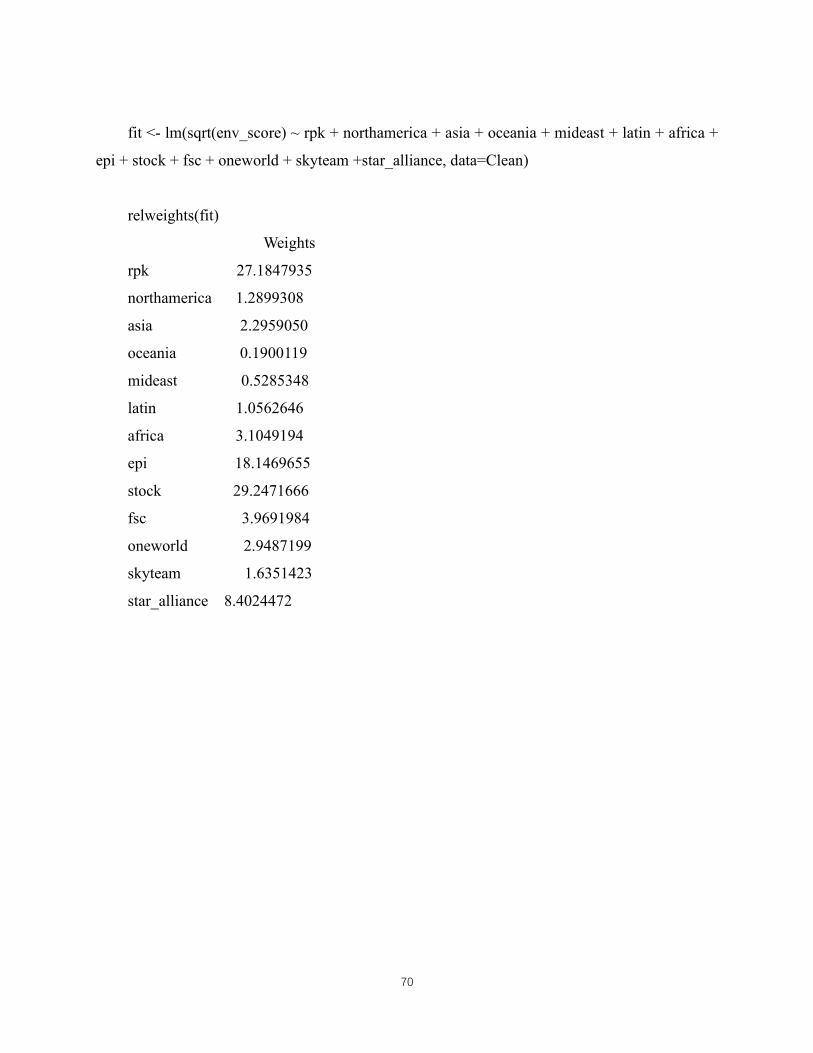
70
fit <- lm(sqrt(env_score) ~ rpk + northamerica + asia + oceania + mideast + latin + africa +
epi + stock + fsc + oneworld + skyteam +star_alliance, data=Clean)
relweights(fit)
Weights
rpk 27.1847935
northamerica 1.2899308
asia 2.2959050
oceania 0.1900119
mideast 0.5285348
latin 1.0562646
africa 3.1049194
epi 18.1469655
stock 29.2471666
fsc 3.9691984
oneworld 2.9487199
skyteam 1.6351423
star_alliance 8.4024472