Embed Size (px)
Citation preview
Sustainability transparency in financial reporting Facilitators: Terry Hudgins, Ernst & Young LLP Chris Doherty, Ernst & Young LLP
Solution Set – Session B
Sustainability transparency in financial reporting Real Estate Investment Trusts Sector Insights
Page 2
Disclaimer
► EY refers to the global organization, and may refer to one or more of the member firms of Ernst & Young Global Limited, each of which is a separate legal entity. Ernst & Young LLP is a client-serving member firm of Ernst & Young Global Limited operating in the U.S.
► This presentation is © 2015 Ernst & Young LLP. All rights reserved. No part of this document may be reproduced, transmitted or otherwise distributed in any form or by any means, electronic or mechanical, including by photocopying, facsimile transmission, recording, rekeying, or using any information storage and retrieval system, without written permission from Ernst & Young LLP. Any reproduction, transmission or distribution of this form or any of the material herein is prohibited and is in violation of U.S. and international law. Ernst & Young LLP expressly disclaims any liability in connection with use of this presentation or its contents by any third party.
► Views expressed in this presentation are those of the speakers and do not necessarily represent the views of Ernst & Young LLP.
► This presentation is provided solely for the purpose of enhancing knowledge on tax matters. It does not provide tax advice to any taxpayer because it does not take into account any specific taxpayer’s facts and circumstances
► These slides are for educational purposes only and are not intended, and should not be relied upon, as accounting advice.
Page 3
Topics
► What is sustainability (non-financial) reporting ► Real Estate sector trends and drivers
► Institutional Investors—raising the sustainability bar
► Beyond reporting – realizing value ► Shareholder Value
► “Brown discounts” & “Green premiums” reach Earnings Parody-TIAA-CREF’s Report; May-2015 ► Reduced:
► Energy, Water, Waste, Carbon ► Improved:
► Net Operating Income, Asset Valuation ► Leveraging federal, state and utility incentives
► EY – Integration of GRESB, Green Buildings & Incentives
Page 4
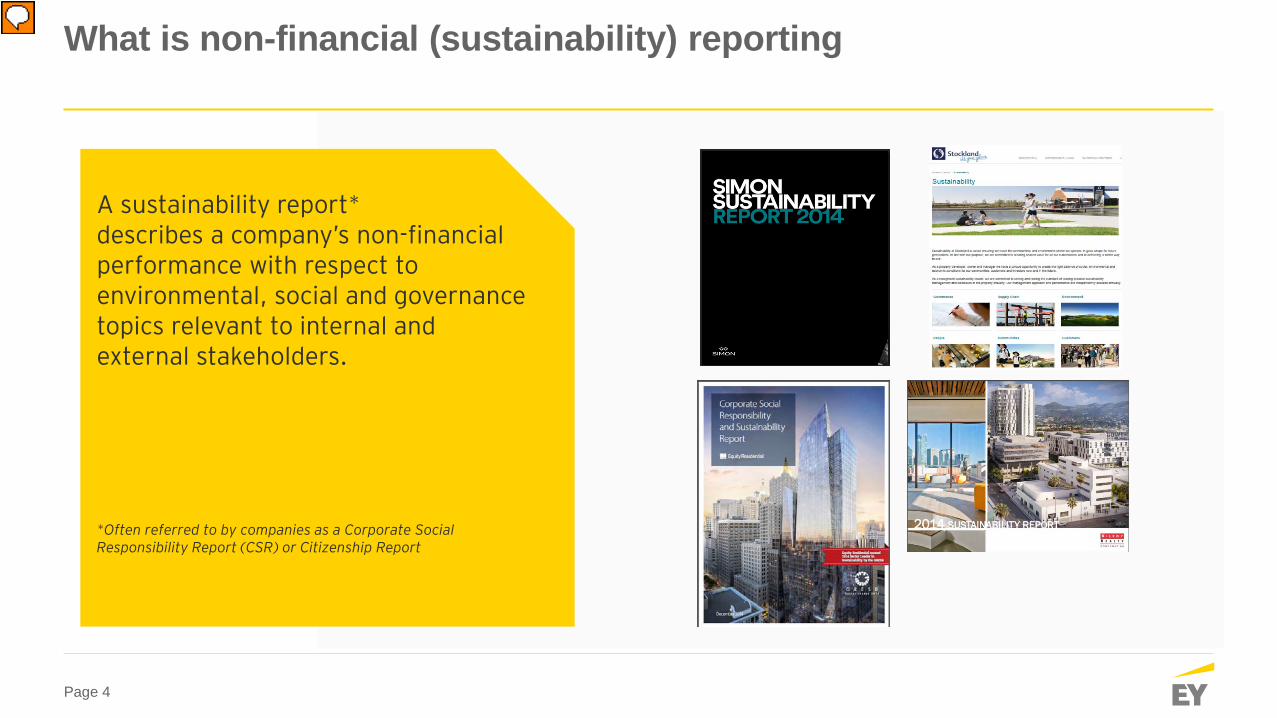
What is non-financial (sustainability) reporting
A sustainability report* describes a company’s non-financial performance with respect to environmental, social and governance topics relevant to internal and external stakeholders.
*Often referred to by companies as a Corporate Social Responsibility Report (CSR) or Citizenship Report
Page 5
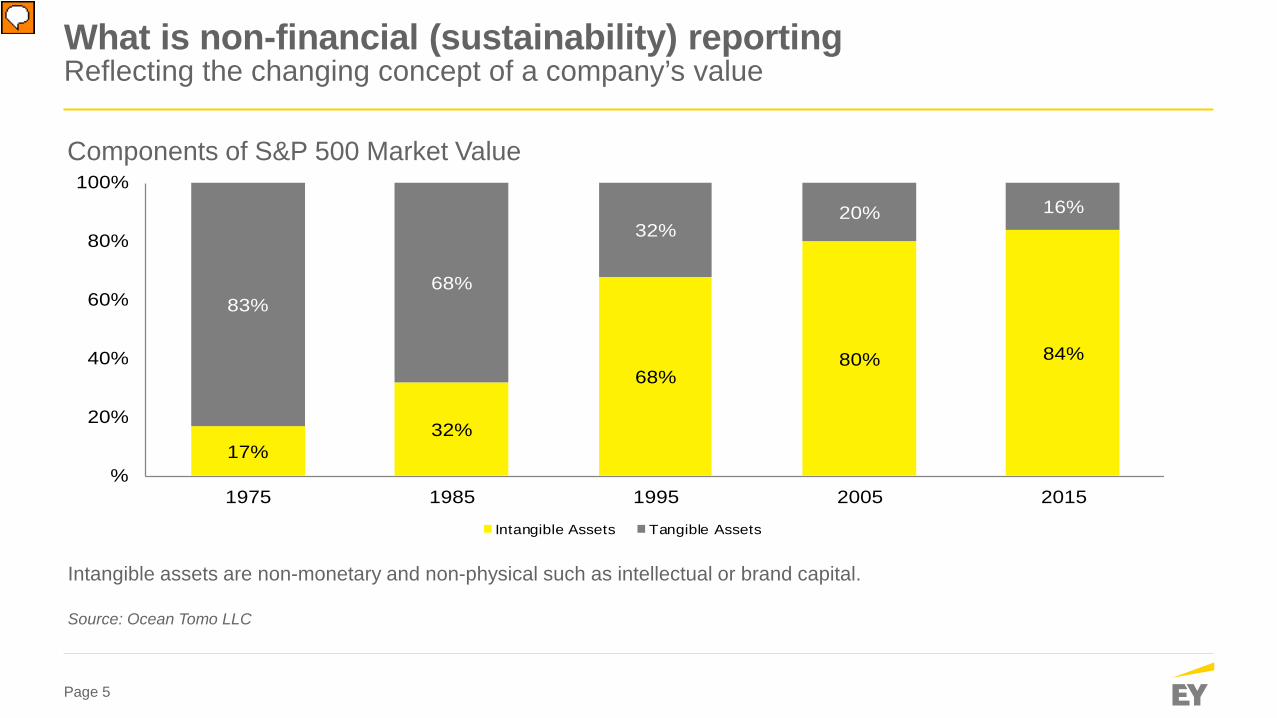
What is non-financial (sustainability) reporting Reflecting the changing concept of a company’s value
Components of S&P 500 Market Value
17%32%
68%80% 84%
83%68%
32%20% 16%
%
20%
40%
60%
80%
100%
1975 1985 1995 2005 2015
Intangible Assets Tangible Assets
Intangible assets are non-monetary and non-physical such as intellectual or brand capital. Source: Ocean Tomo LLC
Page 6
Drivers of sustainability reporting Shareholder proposals focusing on ESG (environment, social, governance) continue to increase
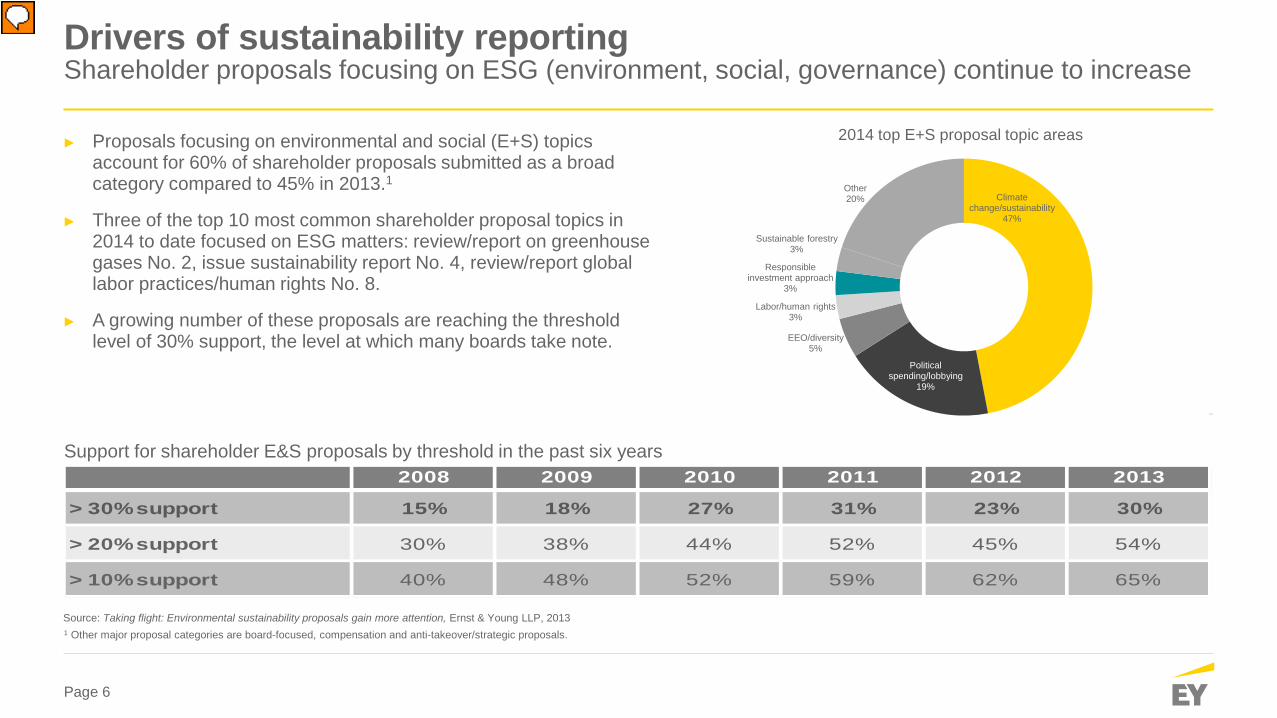
► Proposals focusing on environmental and social (E+S) topics account for 60% of shareholder proposals submitted as a broad category compared to 45% in 2013.1
► Three of the top 10 most common shareholder proposal topics in 2014 to date focused on ESG matters: review/report on greenhouse gases No. 2, issue sustainability report No. 4, review/report global labor practices/human rights No. 8.
► A growing number of these proposals are reaching the threshold level of 30% support, the level at which many boards take note.
Source: Taking flight: Environmental sustainability proposals gain more attention, Ernst & Young LLP, 2013 1 Other major proposal categories are board-focused, compensation and anti-takeover/strategic proposals.
Support for shareholder environmental and social (E+S) proposals by threshold in the past six years2008 2009 2010 2011 2012 2013
> 30% support 15% 18% 27% 31% 23% 30%
> 20% support 30% 38% 44% 52% 45% 54%
> 10% support 40% 48% 52% 59% 62% 65%
Support for shareholder E&S proposals by threshold in the past six years
2014 top E+S proposal topic areas
Climate change/sustainability
47%
Political spending/lobbying
19%
EEO/diversity 5%
Labor/human rights 3%
Responsible investment approach
3%
Sustainable forestry 3%
Other 20%
Page 7
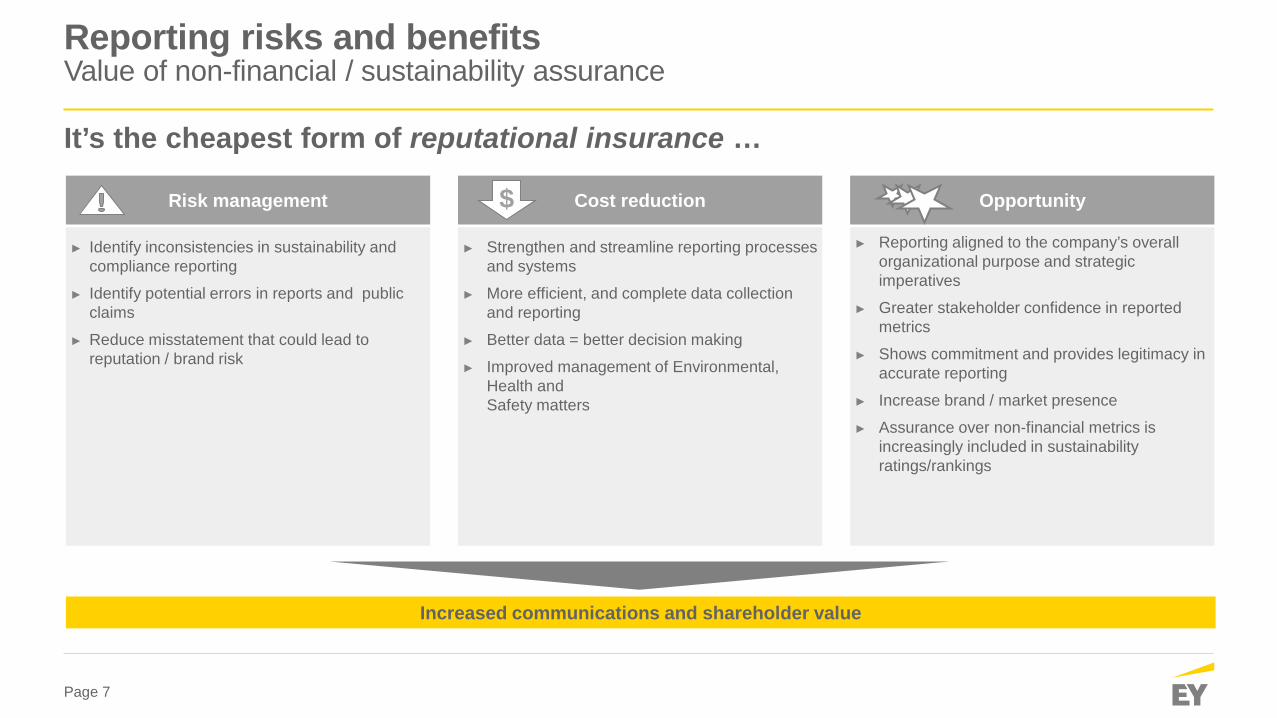
It’s the cheapest form of reputational insurance …
Reporting risks and benefits Value of non-financial / sustainability assurance
Cost reduction Opportunity Risk management
► Strengthen and streamline reporting processes and systems
► More efficient, and complete data collection and reporting
► Better data = better decision making
► Improved management of Environmental, Health and Safety matters
► Reporting aligned to the company’s overall organizational purpose and strategic imperatives
► Greater stakeholder confidence in reported metrics
► Shows commitment and provides legitimacy in accurate reporting
► Increase brand / market presence
► Assurance over non-financial metrics is increasingly included in sustainability ratings/rankings
► Identify inconsistencies in sustainability and compliance reporting
► Identify potential errors in reports and public claims
► Reduce misstatement that could lead to reputation / brand risk
Increased communications and shareholder value
$
Page 8
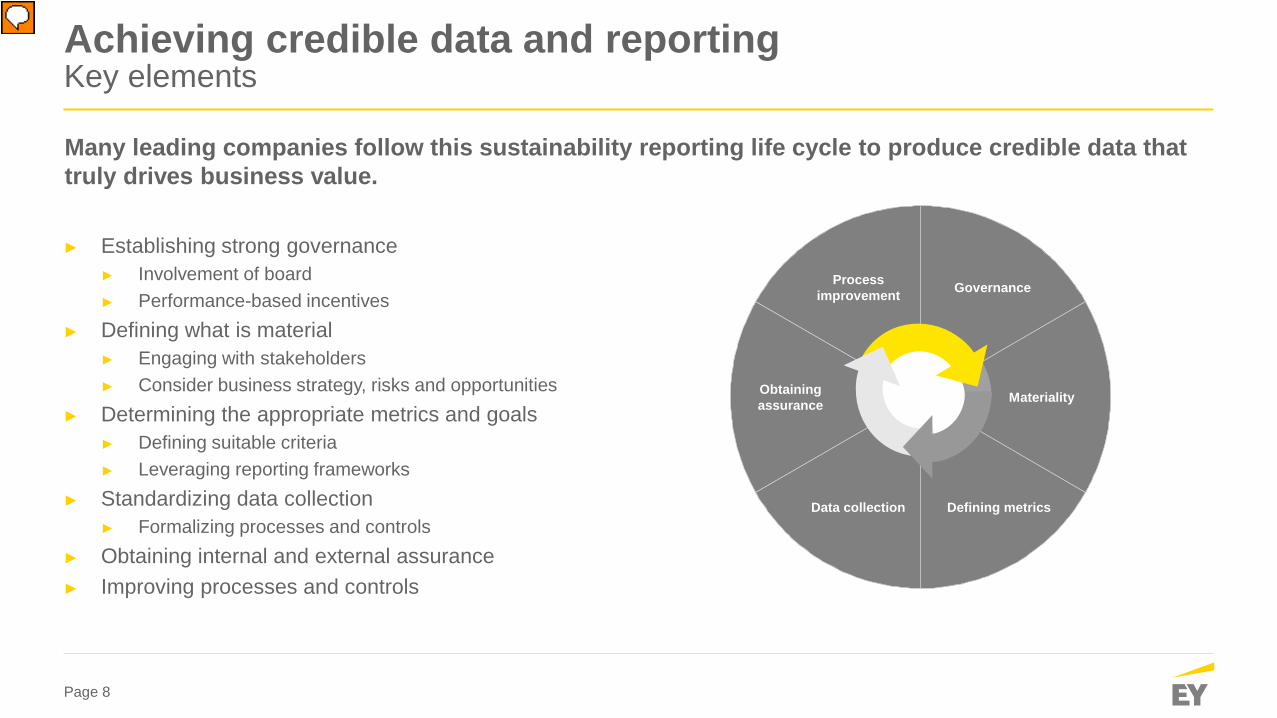
Achieving credible data and reporting Key elements
► Establishing strong governance ► Involvement of board ► Performance-based incentives
► Defining what is material ► Engaging with stakeholders ► Consider business strategy, risks and opportunities
► Determining the appropriate metrics and goals ► Defining suitable criteria ► Leveraging reporting frameworks
► Standardizing data collection ► Formalizing processes and controls
► Obtaining internal and external assurance ► Improving processes and controls
Many leading companies follow this sustainability reporting life cycle to produce credible data that truly drives business value.
Obtaining assurance Materiality
Defining metrics Data collection
Governance Process improvement
Page 9
Real Estate sector trends and drivers
Page 10
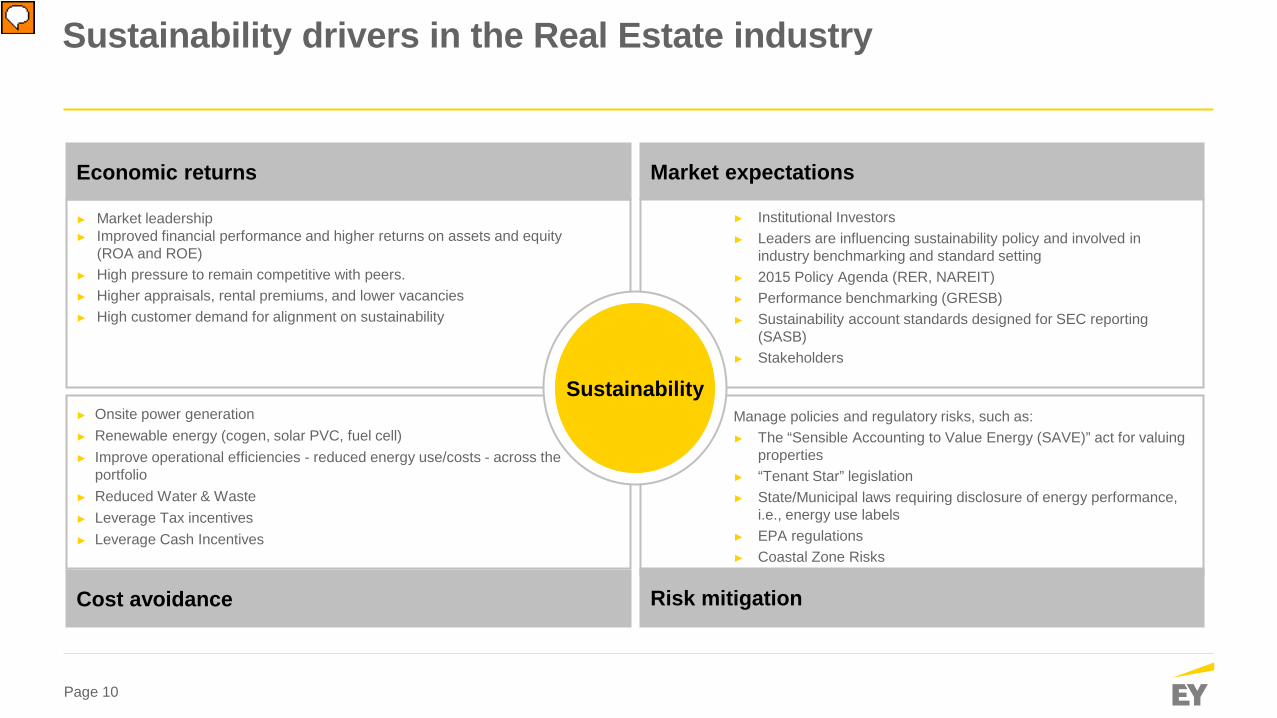
Sustainability drivers in the Real Estate industry
► Onsite power generation ► Renewable energy (cogen, solar PVC, fuel cell) ► Improve operational efficiencies - reduced energy use/costs - across the
portfolio ► Reduced Water & Waste ► Leverage Tax incentives ► Leverage Cash Incentives
Manage policies and regulatory risks, such as: ► The “Sensible Accounting to Value Energy (SAVE)” act for valuing
properties ► “Tenant Star” legislation ► State/Municipal laws requiring disclosure of energy performance,
i.e., energy use labels ► EPA regulations ► Coastal Zone Risks
► Market leadership ► Improved financial performance and higher returns on assets and equity
(ROA and ROE) ► High pressure to remain competitive with peers. ► Higher appraisals, rental premiums, and lower vacancies ► High customer demand for alignment on sustainability
► Institutional Investors ► Leaders are influencing sustainability policy and involved in
industry benchmarking and standard setting ► 2015 Policy Agenda (RER, NAREIT) ► Performance benchmarking (GRESB) ► Sustainability account standards designed for SEC reporting
(SASB) ► Stakeholders
Market expectations Economic returns
Risk mitigation Cost avoidance
Channel 2 Prospects
Sustainability
Page 11
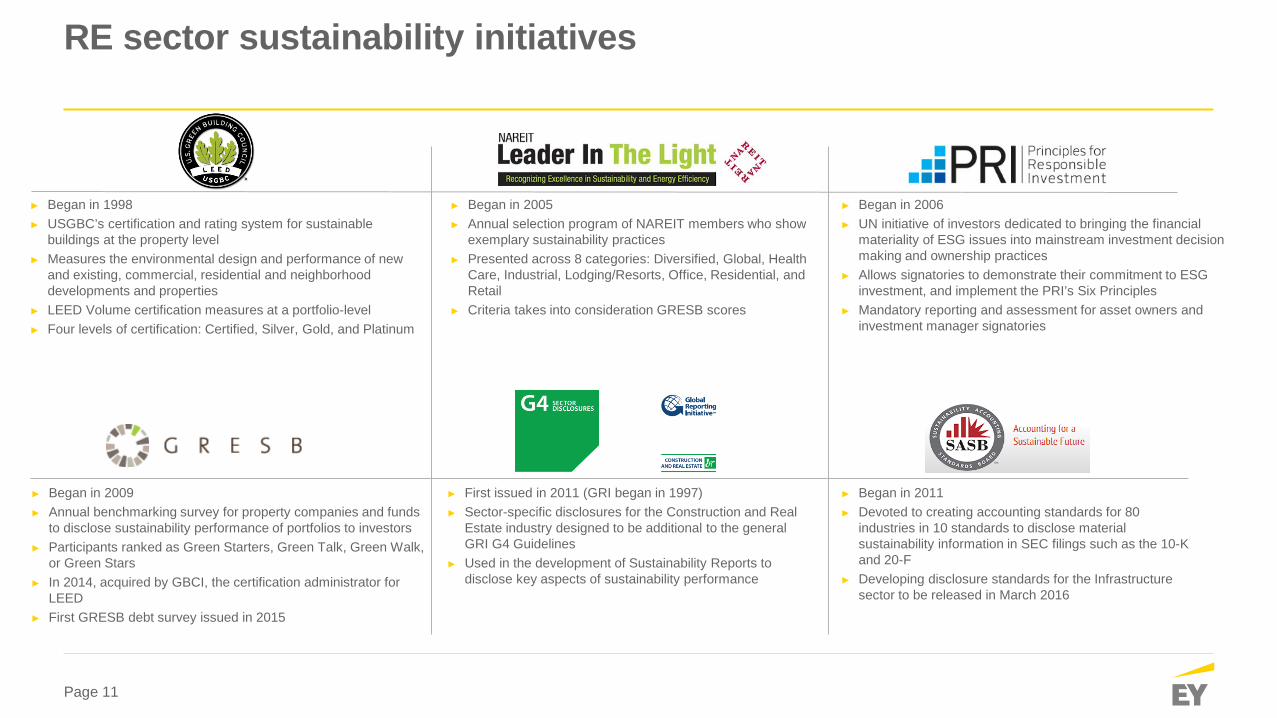
RE sector sustainability initiatives
► Began in 2005 ► Annual selection program of NAREIT members who show
exemplary sustainability practices ► Presented across 8 categories: Diversified, Global, Health
Care, Industrial, Lodging/Resorts, Office, Residential, and Retail
► Criteria takes into consideration GRESB scores
► Began in 2006 ► UN initiative of investors dedicated to bringing the financial
materiality of ESG issues into mainstream investment decision making and ownership practices
► Allows signatories to demonstrate their commitment to ESG investment, and implement the PRI’s Six Principles
► Mandatory reporting and assessment for asset owners and investment manager signatories
► Began in 2009 ► Annual benchmarking survey for property companies and funds
to disclose sustainability performance of portfolios to investors ► Participants ranked as Green Starters, Green Talk, Green Walk,
or Green Stars ► In 2014, acquired by GBCI, the certification administrator for
LEED ► First GRESB debt survey issued in 2015
► First issued in 2011 (GRI began in 1997) ► Sector-specific disclosures for the Construction and Real
Estate industry designed to be additional to the general GRI G4 Guidelines
► Used in the development of Sustainability Reports to disclose key aspects of sustainability performance
► Began in 2011 ► Devoted to creating accounting standards for 80
industries in 10 standards to disclose material sustainability information in SEC filings such as the 10-K and 20-F
► Developing disclosure standards for the Infrastructure sector to be released in March 2016
► Began in 1998 ► USGBC’s certification and rating system for sustainable
buildings at the property level ► Measures the environmental design and performance of new
and existing, commercial, residential and neighborhood developments and properties
► LEED Volume certification measures at a portfolio-level ► Four levels of certification: Certified, Silver, Gold, and Platinum
Page 12
Management
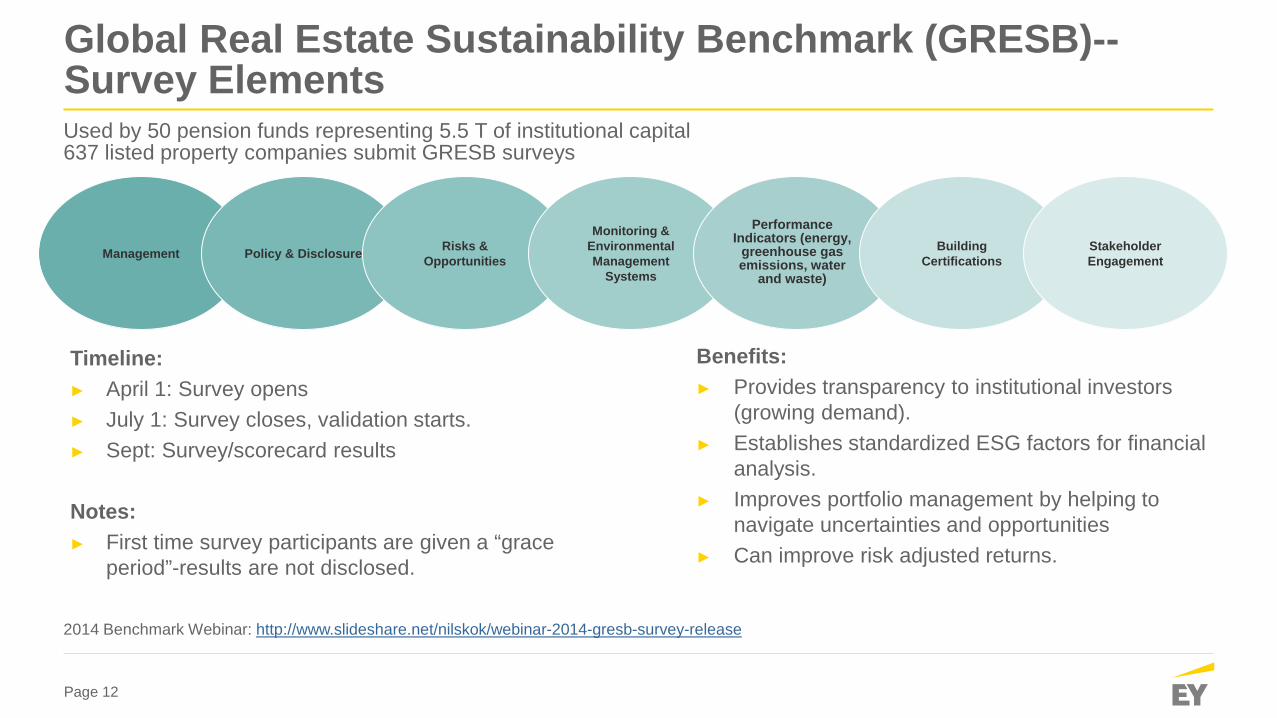
Global Real Estate Sustainability Benchmark (GRESB)-- Survey Elements
Benefits: ► Provides transparency to institutional investors
(growing demand). ► Establishes standardized ESG factors for financial
analysis. ► Improves portfolio management by helping to
navigate uncertainties and opportunities ► Can improve risk adjusted returns.
Used by 50 pension funds representing 5.5 T of institutional capital 637 listed property companies submit GRESB surveys
Timeline: ► April 1: Survey opens ► July 1: Survey closes, validation starts. ► Sept: Survey/scorecard results
Notes: ► First time survey participants are given a “grace
period”-results are not disclosed.
2014 Benchmark Webinar: http://www.slideshare.net/nilskok/webinar-2014-gresb-survey-release
Policy & Disclosure Risks & Opportunities
Monitoring & Environmental Management
Systems
Building Certifications
Stakeholder Engagement
Performance Indicators (energy,
greenhouse gas emissions, water
and waste)
Page 13
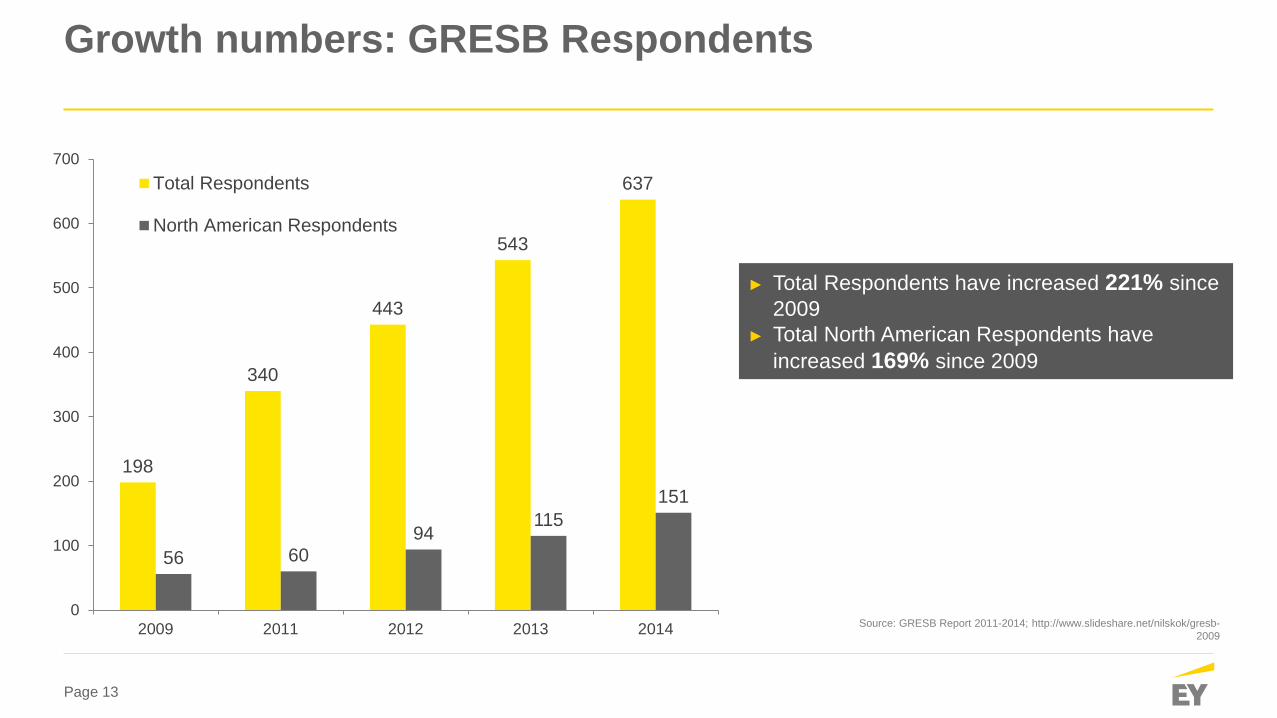
Growth numbers: GRESB Respondents
Source: GRESB Report 2011-2014; http://www.slideshare.net/nilskok/gresb-2009
198
340
443
543
637
56 60 94
115 151
0
100
200
300
400
500
600
700
2009 2011 2012 2013 2014
Total Respondents
North American Respondents
► Total Respondents have increased 221% since 2009
► Total North American Respondents have increased 169% since 2009
Page 14
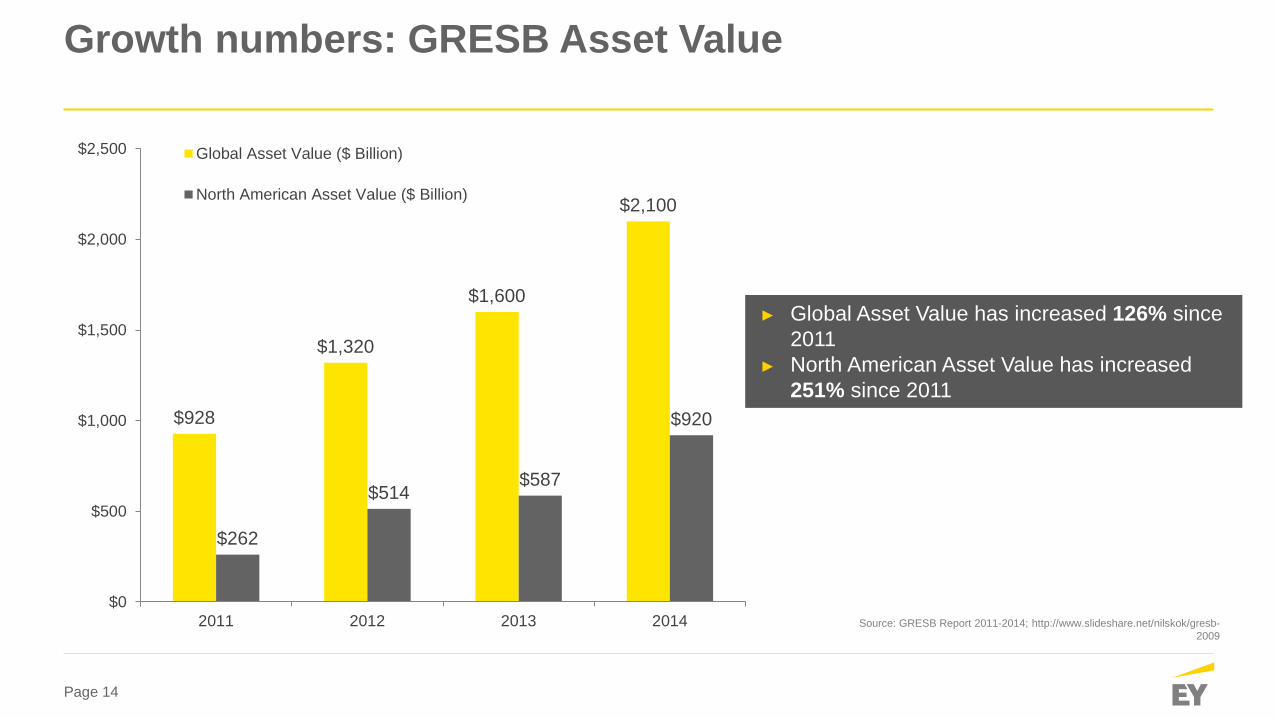
Growth numbers: GRESB Asset Value
$928
$1,320
$1,600
$2,100
$262
$514 $587
$920
$0
$500
$1,000
$1,500
$2,000
$2,500
2011 2012 2013 2014
Global Asset Value ($ Billion)
North American Asset Value ($ Billion)
► Global Asset Value has increased 126% since 2011
► North American Asset Value has increased 251% since 2011
Source: GRESB Report 2011-2014; http://www.slideshare.net/nilskok/gresb-2009
Page 15
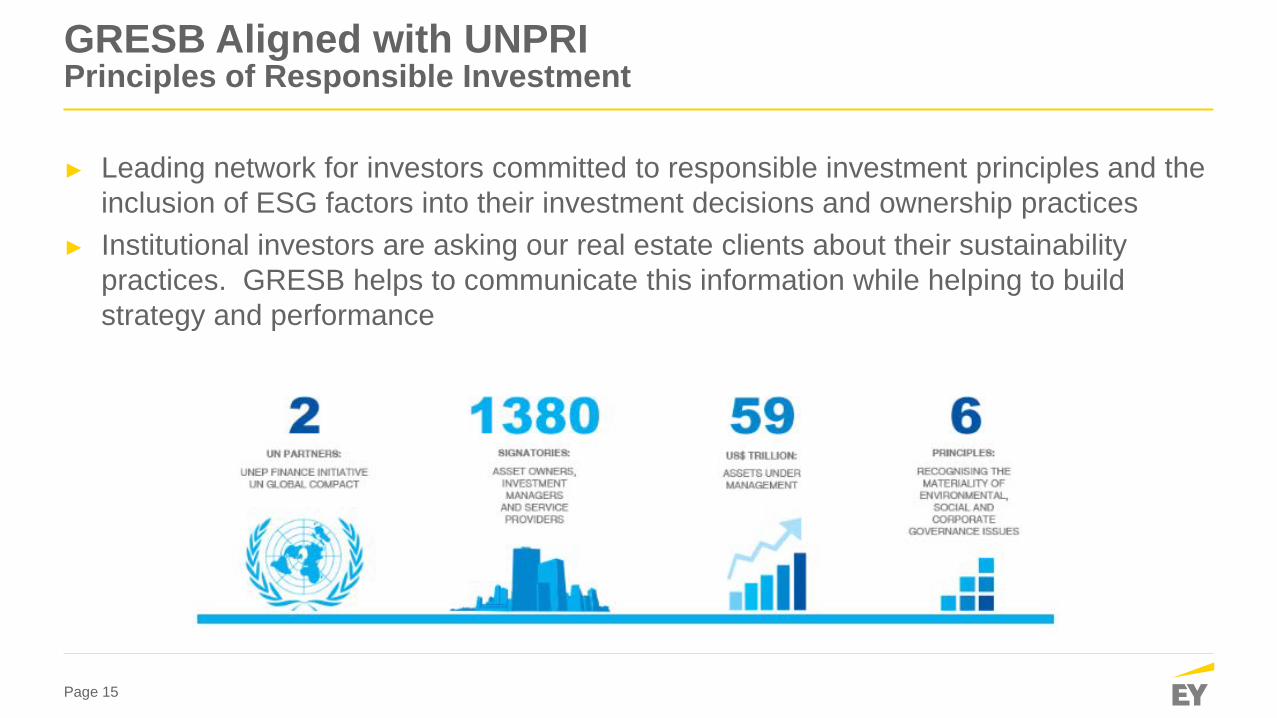
GRESB Aligned with UNPRI Principles of Responsible Investment
► Leading network for investors committed to responsible investment principles and the inclusion of ESG factors into their investment decisions and ownership practices
► Institutional investors are asking our real estate clients about their sustainability practices. GRESB helps to communicate this information while helping to build strategy and performance
Page 16
UN PRI Real Estate Trend Overview
Key Statistics
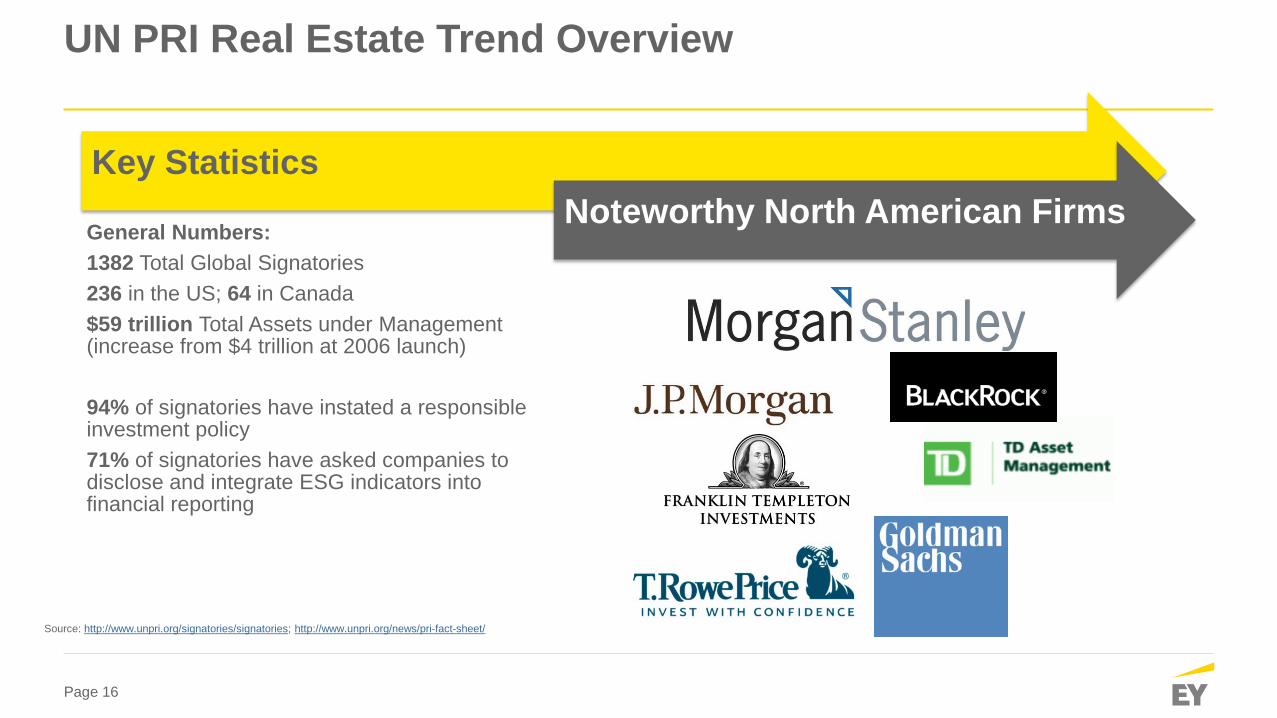
General Numbers: 1382 Total Global Signatories 236 in the US; 64 in Canada $59 trillion Total Assets under Management (increase from $4 trillion at 2006 launch) 94% of signatories have instated a responsible investment policy 71% of signatories have asked companies to disclose and integrate ESG indicators into financial reporting
Noteworthy North American Firms
Source: http://www.unpri.org/signatories/signatories; http://www.unpri.org/news/pri-fact-sheet/

Page 17
Beyond reporting – realizing value
Page 18
REITs continue to invest in sustainability and realize returns
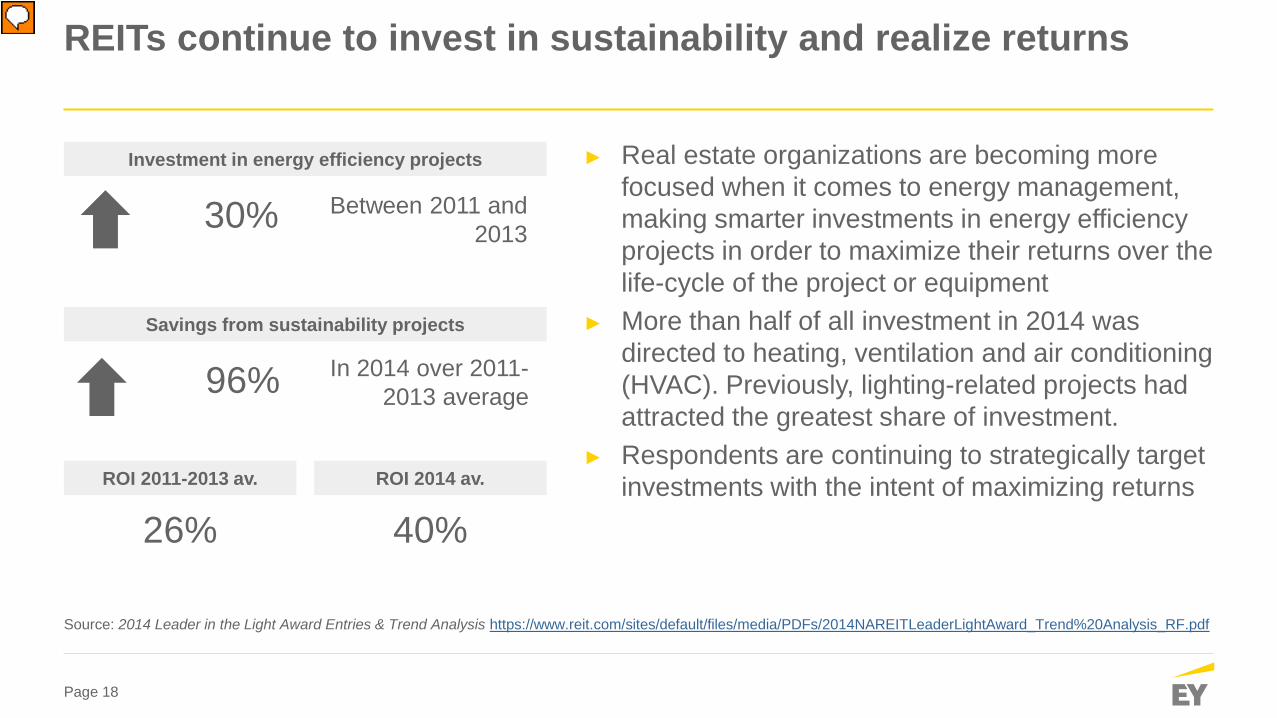
► Real estate organizations are becoming more focused when it comes to energy management, making smarter investments in energy efficiency projects in order to maximize their returns over the life-cycle of the project or equipment
► More than half of all investment in 2014 was directed to heating, ventilation and air conditioning (HVAC). Previously, lighting-related projects had attracted the greatest share of investment.
► Respondents are continuing to strategically target investments with the intent of maximizing returns
Source: 2014 Leader in the Light Award Entries & Trend Analysis https://www.reit.com/sites/default/files/media/PDFs/2014NAREITLeaderLightAward_Trend%20Analysis_RF.pdf
Investment in energy efficiency projects
30%
Between 2011 and 2013
Savings from sustainability projects
ROI 2011-2013 av. ROI 2014 av.
96% In 2014 over 2011-2013 average
26%
40%
Page 19
REITs with higher GRESB scores outperform peers
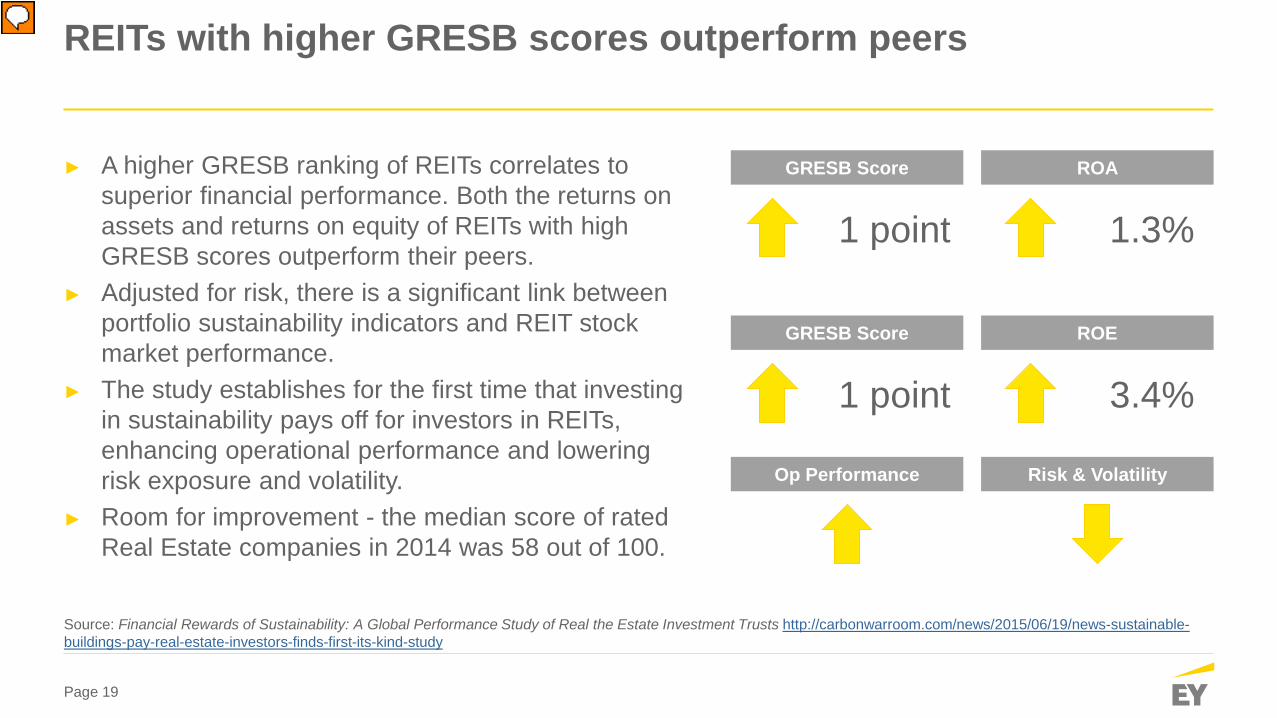
► A higher GRESB ranking of REITs correlates to superior financial performance. Both the returns on assets and returns on equity of REITs with high GRESB scores outperform their peers.
► Adjusted for risk, there is a significant link between portfolio sustainability indicators and REIT stock market performance.
► The study establishes for the first time that investing in sustainability pays off for investors in REITs, enhancing operational performance and lowering risk exposure and volatility.
► Room for improvement - the median score of rated Real Estate companies in 2014 was 58 out of 100.
Source: Financial Rewards of Sustainability: A Global Performance Study of Real the Estate Investment Trusts http://carbonwarroom.com/news/2015/06/19/news-sustainable-buildings-pay-real-estate-investors-finds-first-its-kind-study
GRESB Score ROA
1 point
1.3%
GRESB Score ROE
1 point
3.4%
Op Performance Risk & Volatility
Page 20
Real-world example: TIAA-CREFF Social Choice Equity Fund
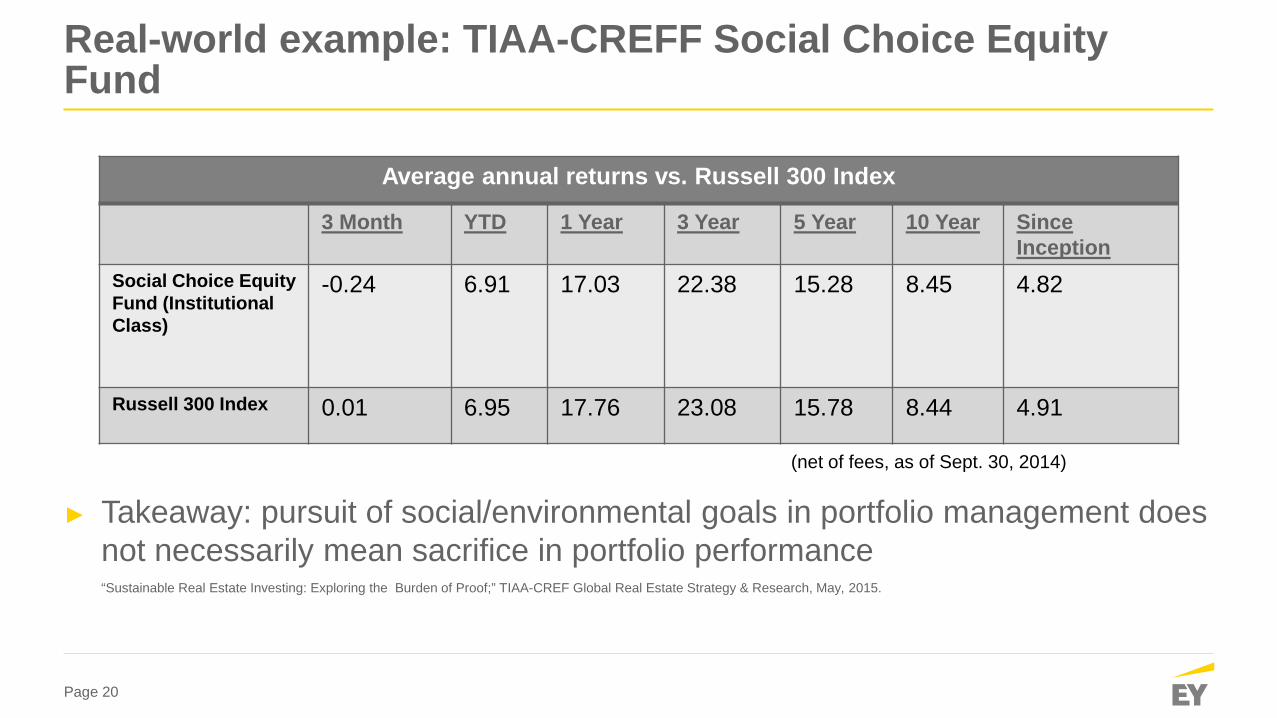
Average annual returns vs. Russell 300 Index
3 Month YTD 1 Year 3 Year 5 Year 10 Year Since Inception
Social Choice Equity Fund (Institutional Class)
-0.24 6.91 17.03 22.38 15.28 8.45 4.82
Russell 300 Index 0.01 6.95 17.76 23.08 15.78 8.44 4.91
► Takeaway: pursuit of social/environmental goals in portfolio management does not necessarily mean sacrifice in portfolio performance “Sustainable Real Estate Investing: Exploring the Burden of Proof;” TIAA-CREF Global Real Estate Strategy & Research, May, 2015.
(net of fees, as of Sept. 30, 2014)
Page 21
Quantitative evidence:
► TIAA-CREF: “The high winning percentage of the LEED portfolio and the non-LEED portfolio’s low winning percentage are interesting; both are statistically significant. These results validated the LEED portfolio’s tendency to outperform over NCREIF office performance and the non-LEED portfolio’s propensity to underperform.”
“Sustainable Real Estate Investing: Exploring the Burden of Proof”; TIAA-CREF Global Real Estate Strategy & Research, May, 2015
Page 22
Case Study: TIAA-CREF’s Global Real Estate Sustainability Initiative (GRESI)
► TIAA’s GRESI incorporates the pursuit of economic returns, environmental returns, risk mitigation and meeting market expectations
► During 2014, TIAA-CREF’s GRESI benefitted their portfolios: ► Over $14 million in energy costs saved ► Over 118 million kilowatt-hours of energy consumption avoided ► Greenhouse gas emissions reduced by over 47,700 metric tons of carbon dioxide
equivalent
► Potentially improving Net Operating Income and Asset Valuation, while meeting shareholder value and stakeholder transparency
“Sustainable Real Estate Investing: Exploring the Burden of Proof”; TIAA-CREF Global Real Estate Strategy & Research, May, 2015
Page 23
EY – Integration of GRESB, Green Buildings and Incentives
Page 24
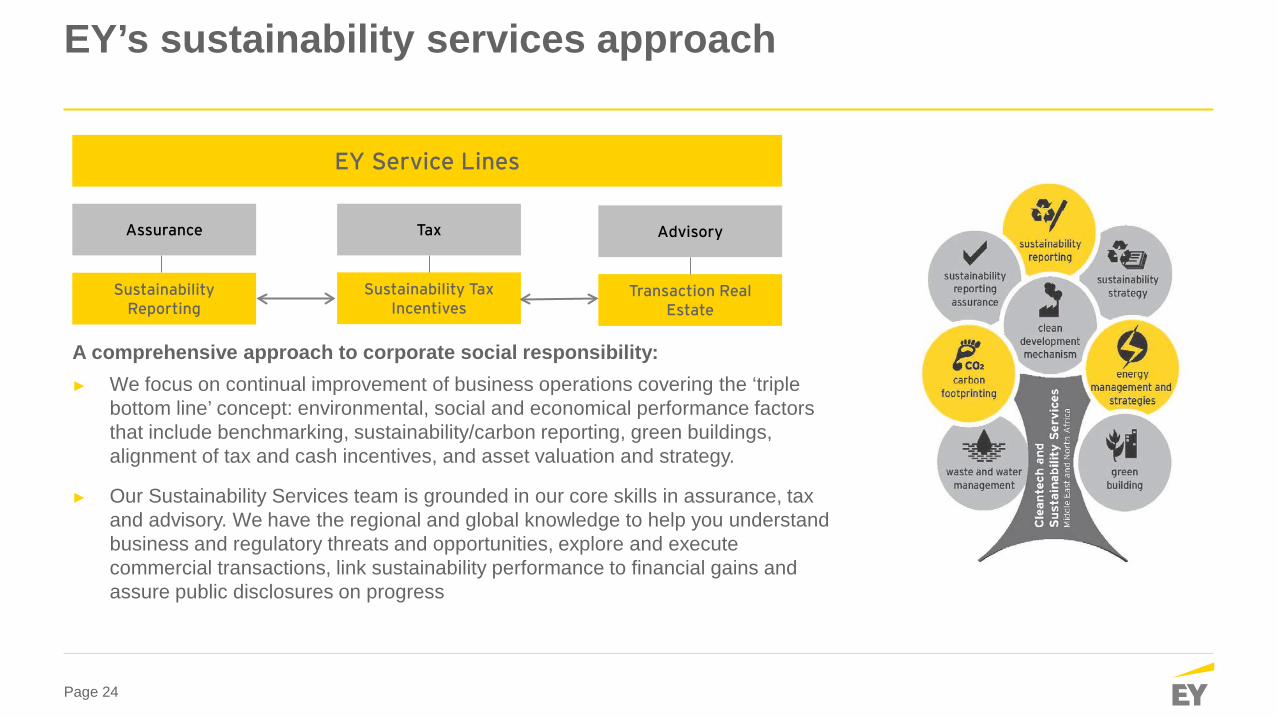
A comprehensive approach to corporate social responsibility: ► We focus on continual improvement of business operations covering the ‘triple
bottom line’ concept: environmental, social and economical performance factors that include benchmarking, sustainability/carbon reporting, green buildings, alignment of tax and cash incentives, and asset valuation and strategy.
► Our Sustainability Services team is grounded in our core skills in assurance, tax and advisory. We have the regional and global knowledge to help you understand business and regulatory threats and opportunities, explore and execute commercial transactions, link sustainability performance to financial gains and assure public disclosures on progress
EY’s sustainability services approach
EY Service Lines
Assurance Advisory Tax
Sustainability Tax Incentives
Transaction Real Estate
Sustainability Reporting
Page 25
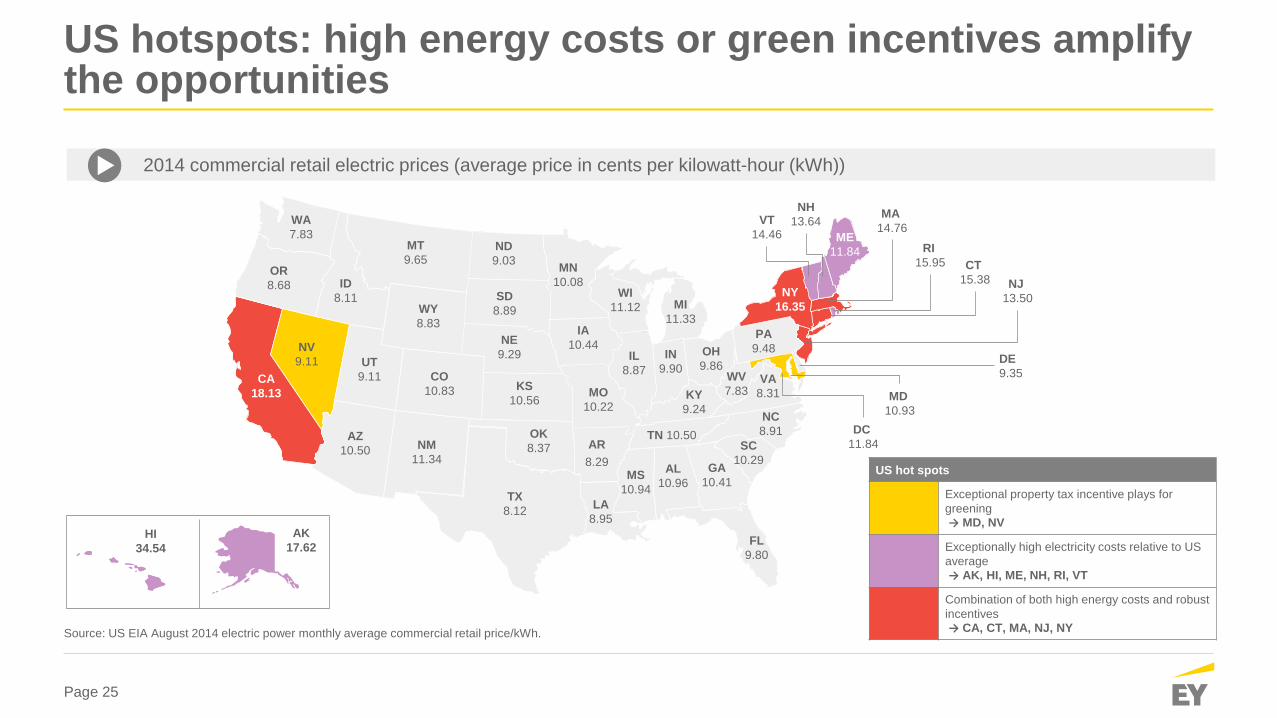
US hotspots: high energy costs or green incentives amplify the opportunities
2014 commercial retail electric prices (average price in cents per kilowatt-hour (kWh))
Source: US EIA August 2014 electric power monthly average commercial retail price/kWh.
US hot spots
Exceptional property tax incentive plays for greening → MD, NV
Exceptionally high electricity costs relative to US average → AK, HI, ME, NH, RI, VT
Combination of both high energy costs and robust incentives → CA, CT, MA, NJ, NY
AK 17.62
HI 34.54
WA 7.83
OR 8.68
CA 18.13
NV 9.11
ID 8.11
MT 9.65
WY 8.83
UT 9.11
AZ 10.50
CO 10.83
NM 11.34
TX 8.12
ND 9.03
SD 8.89
NE 9.29
KS 10.56
OK 8.37 AR
8.29
LA 8.95
MS 10.94
AL 10.96
GA 10.41
FL 9.80
SC 10.29
NC 8.91 TN 10.50
VA 8.31
WV 7.83 KY
9.24 MO
10.22
PA 9.48 OH
9.86 IN
9.90 IL
8.87
IA 10.44
MN 10.08
WI 11.12 MI
11.33
NY 16.35
ME 11.84
VT 14.46
NH 13.64 MA
14.76
RI 15.95 CT
15.38 NJ 13.50
DE 9.35
MD 10.93
DC 11.84
Page 26
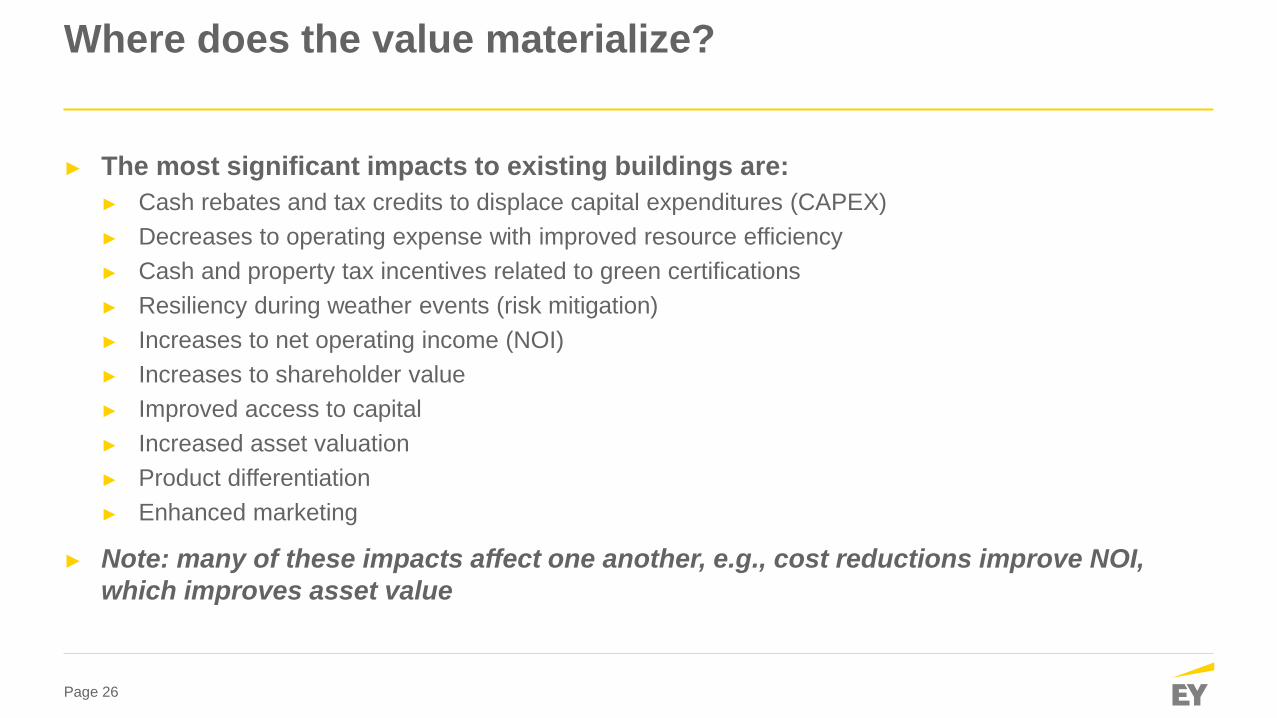
► The most significant impacts to existing buildings are: ► Cash rebates and tax credits to displace capital expenditures (CAPEX) ► Decreases to operating expense with improved resource efficiency ► Cash and property tax incentives related to green certifications ► Resiliency during weather events (risk mitigation) ► Increases to net operating income (NOI) ► Increases to shareholder value ► Improved access to capital ► Increased asset valuation ► Product differentiation ► Enhanced marketing
► Note: many of these impacts affect one another, e.g., cost reductions improve NOI, which improves asset value
Where does the value materialize?
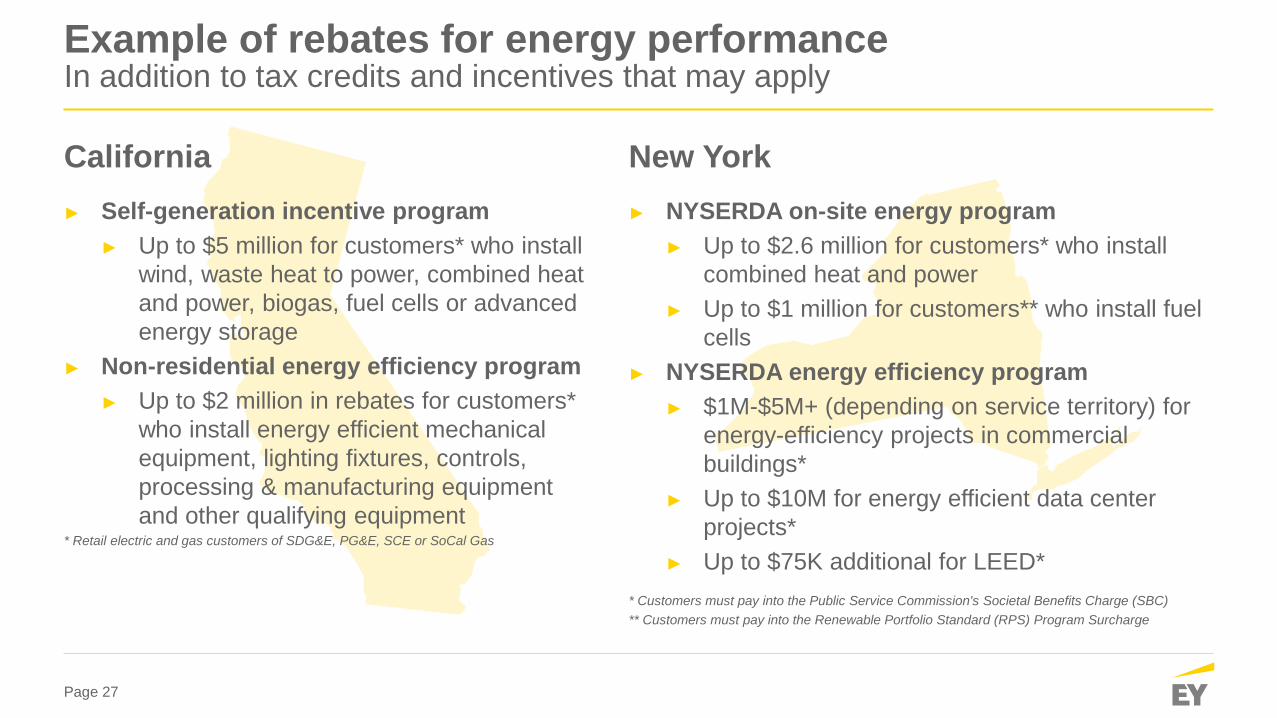
Page 27
► Self-generation incentive program ► Up to $5 million for customers* who install
wind, waste heat to power, combined heat and power, biogas, fuel cells or advanced energy storage
► Non-residential energy efficiency program ► Up to $2 million in rebates for customers*
who install energy efficient mechanical equipment, lighting fixtures, controls, processing & manufacturing equipment and other qualifying equipment
* Retail electric and gas customers of SDG&E, PG&E, SCE or SoCal Gas
► NYSERDA on-site energy program ► Up to $2.6 million for customers* who install
combined heat and power ► Up to $1 million for customers** who install fuel
cells ► NYSERDA energy efficiency program
► $1M-$5M+ (depending on service territory) for energy-efficiency projects in commercial buildings*
► Up to $10M for energy efficient data center projects*
► Up to $75K additional for LEED* * Customers must pay into the Public Service Commission's Societal Benefits Charge (SBC) ** Customers must pay into the Renewable Portfolio Standard (RPS) Program Surcharge
California New York
Example of rebates for energy performance In addition to tax credits and incentives that may apply
Page 28
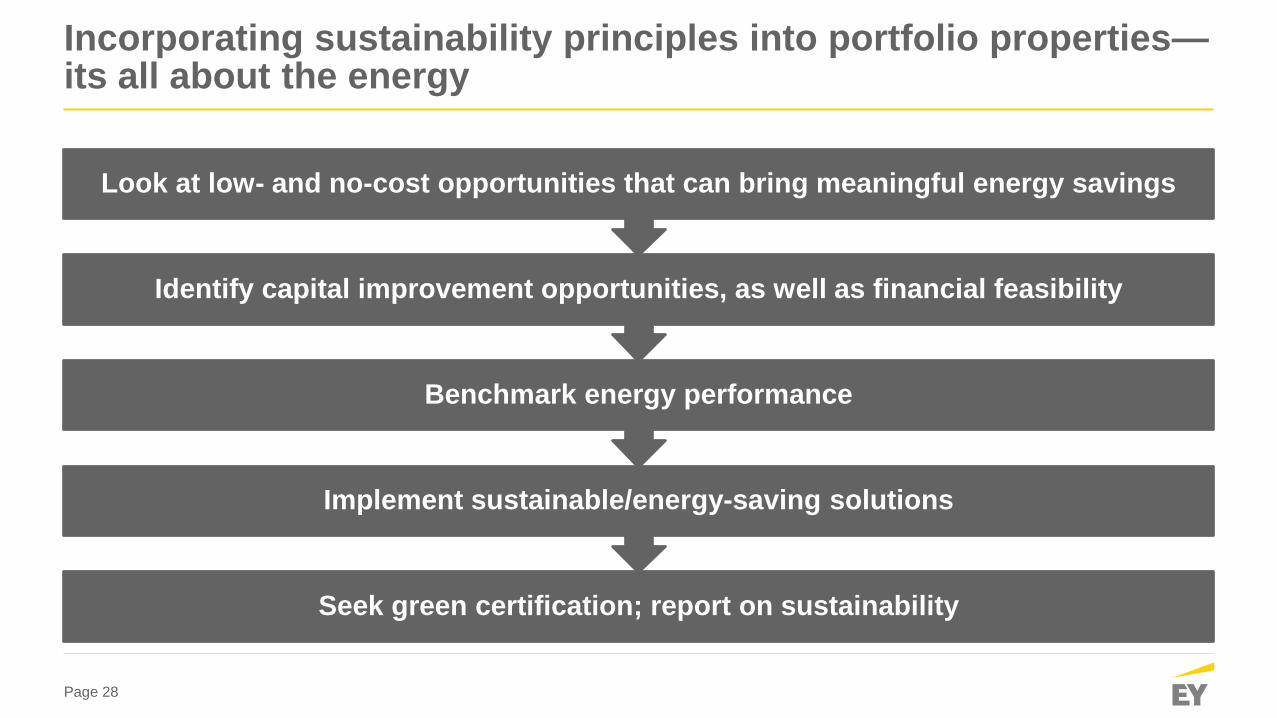
Incorporating sustainability principles into portfolio properties—its all about the energy
Seek green certification; report on sustainability
Implement sustainable/energy-saving solutions
Benchmark energy performance
Identify capital improvement opportunities, as well as financial feasibility
Look at low- and no-cost opportunities that can bring meaningful energy savings
Page 29
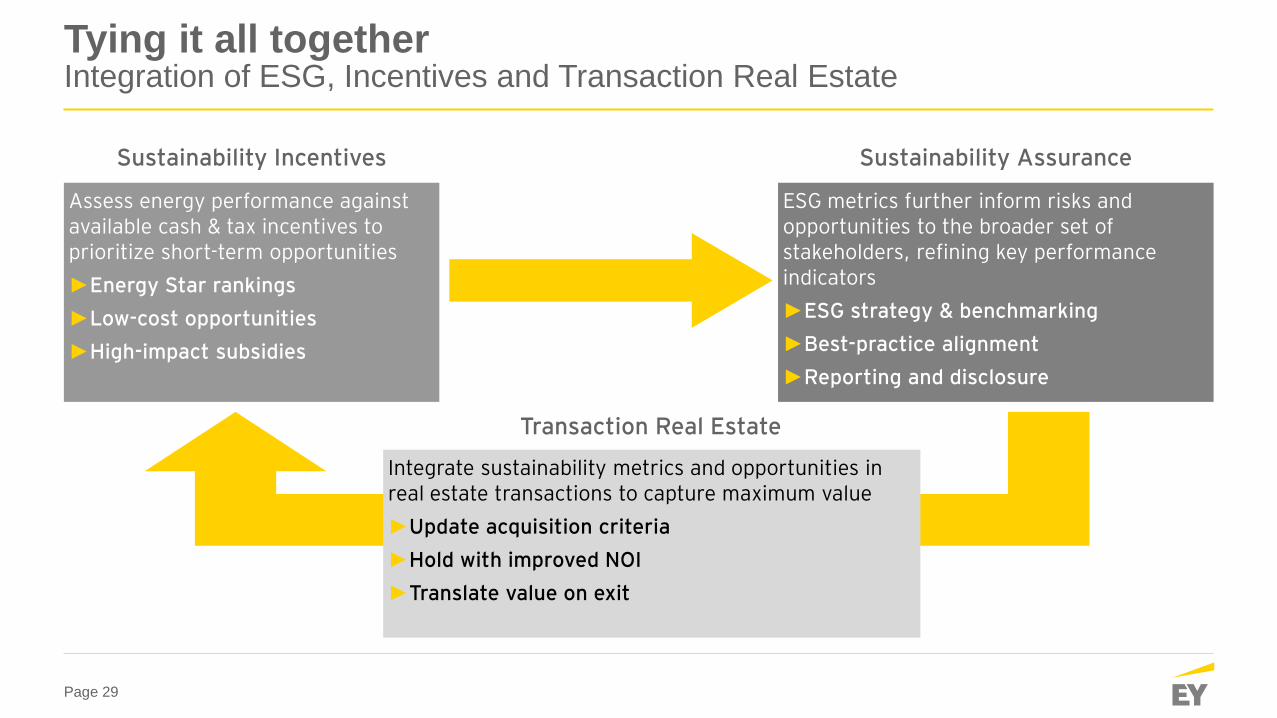
Tying it all together Integration of ESG, Incentives and Transaction Real Estate
Assess energy performance against available cash & tax incentives to prioritize short-term opportunities ►Energy Star rankings ►Low-cost opportunities ►High-impact subsidies
ESG metrics further inform risks and opportunities to the broader set of stakeholders, refining key performance indicators ►ESG strategy & benchmarking ►Best-practice alignment ►Reporting and disclosure
Integrate sustainability metrics and opportunities in real estate transactions to capture maximum value ►Update acquisition criteria ►Hold with improved NOI ►Translate value on exit
Sustainability Incentives Sustainability Assurance
Transaction Real Estate
Page 30
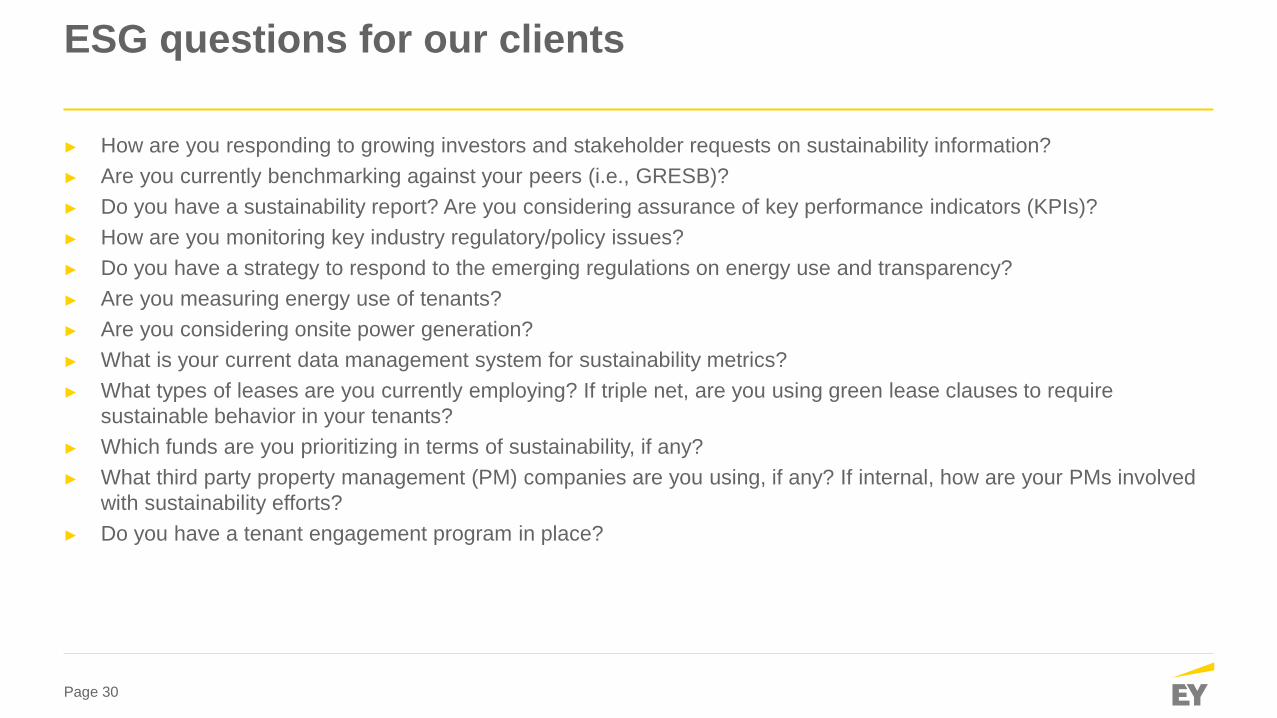
ESG questions for our clients
► How are you responding to growing investors and stakeholder requests on sustainability information? ► Are you currently benchmarking against your peers (i.e., GRESB)? ► Do you have a sustainability report? Are you considering assurance of key performance indicators (KPIs)? ► How are you monitoring key industry regulatory/policy issues? ► Do you have a strategy to respond to the emerging regulations on energy use and transparency? ► Are you measuring energy use of tenants? ► Are you considering onsite power generation? ► What is your current data management system for sustainability metrics? ► What types of leases are you currently employing? If triple net, are you using green lease clauses to require
sustainable behavior in your tenants? ► Which funds are you prioritizing in terms of sustainability, if any? ► What third party property management (PM) companies are you using, if any? If internal, how are your PMs involved
with sustainability efforts? ► Do you have a tenant engagement program in place?

Page 31 Page 31
For additional information please contact:
Terry Hudgins Senior Manager, LEED-AP®
Green Building & Incentives Ernst & Young LLP ► +1 (480) 620-4795 ► [email protected]
Chris Doherty Senior Manager Sustainability Services Ernst & Young LLP ► +1 (415) 769-7918 ► [email protected]