Embed Size (px)
Citation preview
Sustainable and Energy Efficient Urban and Built Infrastructure Development: Opportunities
and Challenges in Systems Engineering Satish Narayanan
United Technologies Research Center
2010 MIT SDM Conference on Systems Thinking for Contemporary Challenges
October 21-22, 2010 Cambridge, MA

1
� Energy use in buildings matter • Efficiency offers the best means to substantial reduction in energy use • External drivers defining the market – building energy performance labeling,
auditing and reporting
� Highly energy efficient buildings exist • 50-70% energy use reduction in buildings is feasible with existing technologies • Systems approach to design and operations is key • Barriers to market adoption are speed and quality of design and associated costs • Systems engineering challenges exist in all phases of building delivery
� System design and delivery methodologies can drive and persist aggressive energy use reduction
• Integrated design methods and engineering tools • Methodologies for extensive validation and verification of system implementations
KEY POINTS
Otis
Pratt & Whitney
Carrier
Sikorsky
UTC Fire & Security
Hamilton Sundstrand
aerospace systems
power solutions building systems UTC Power UTC Poweer
Otis OO UTC Fire & Security & Securit& S ittyt
Hamilton Sundstrand SundstranS d t ndddSikorsky Sikorskky
Carrier
Pratt & Whitney Pratt & Whitne
yeeyeey
UNITED TECHNOLOGIES
Otis
&ey
C
yiltonstranddddd
$52.9B
2
The Energy Demand Problem in the Built Infrastructure…
3
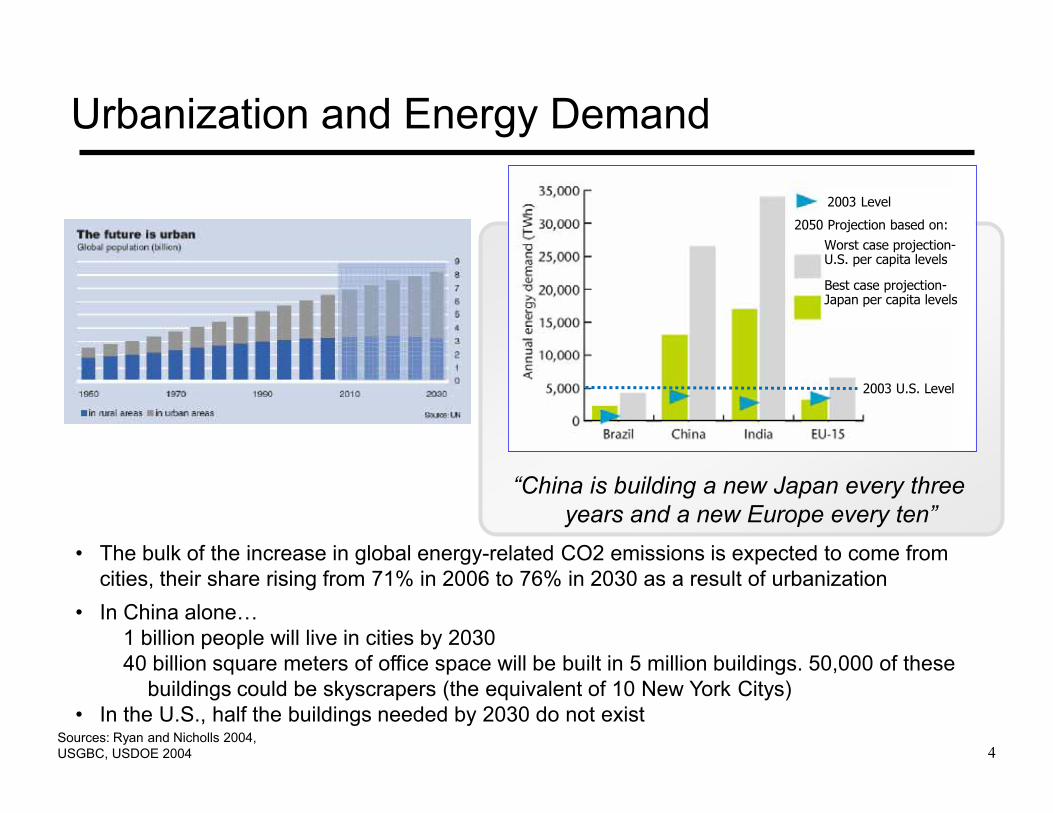
Urbanization and Energy Demand
“China is building a new Japan every three years and a new Europe every ten”
2003 U.S. Level
2003 Level
2050 Projection based on:
Worst case projection- U.S. per capita levels Best case projection- Japan per capita levels
Sources: Ryan and Nicholls 2004, USGBC, USDOE 2004
• The bulk of the increase in global energy-related CO2 emissions is expected to come from cities, their share rising from 71% in 2006 to 76% in 2030 as a result of urbanization
• In China alone… 1 billion people will live in cities by 2030 40 billion square meters of office space will be built in 5 million buildings. 50,000 of these
buildings could be skyscrapers (the equivalent of 10 New York Citys) • In the U.S., half the buildings needed by 2030 do not exist
4
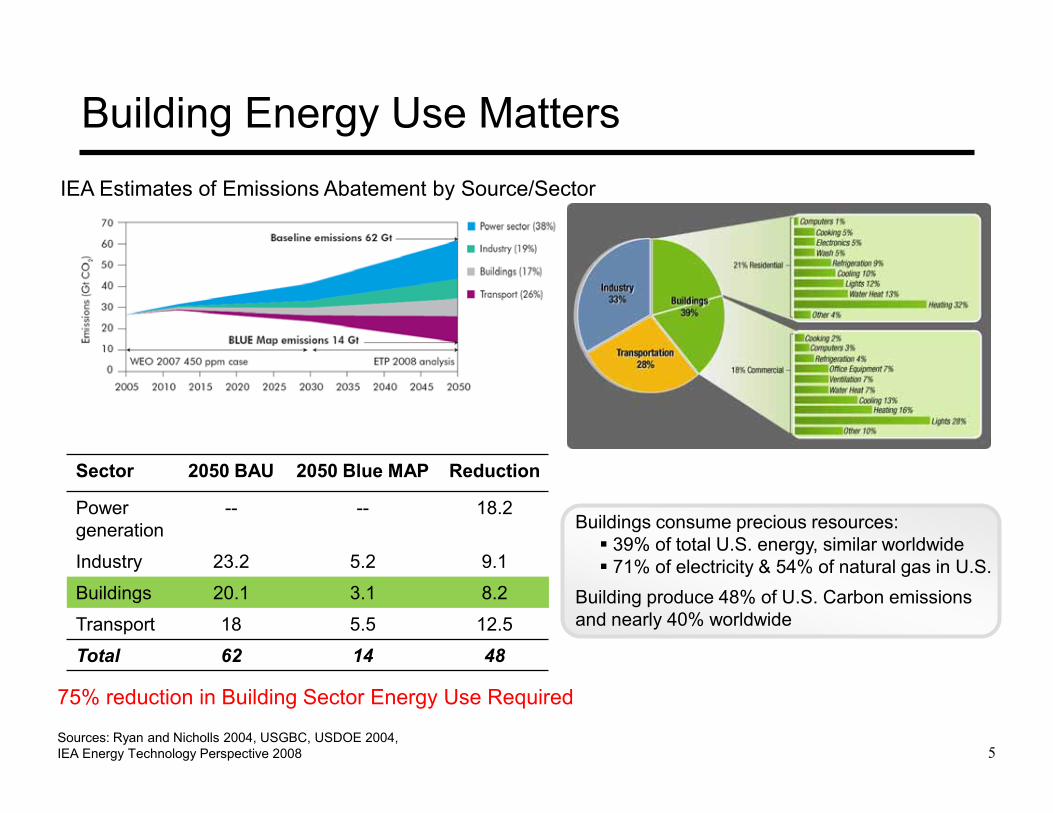
Sector 2050 BAU 2050 Blue MAP Reduction
Power generation
-- -- 18.2
Industry 23.2 5.2 9.1
Buildings 20.1 3.1 8.2
Transport 18 5.5 12.5
Total 62 14 48
IEA Estimates of Emissions Abatement by Source/Sector
Building Energy Use Matters
75% reduction in Building Sector Energy Use Required
Sources: Ryan and Nicholls 2004, USGBC, USDOE 2004, IEA Energy Technology Perspective 2008
Buildings consume precious resources: � 39% of total U.S. energy, similar worldwide � 71% of electricity & 54% of natural gas in U.S.
Building produce 48% of U.S. Carbon emissions and nearly 40% worldwide
5

What Will It Take and
Is It Feasible?
6
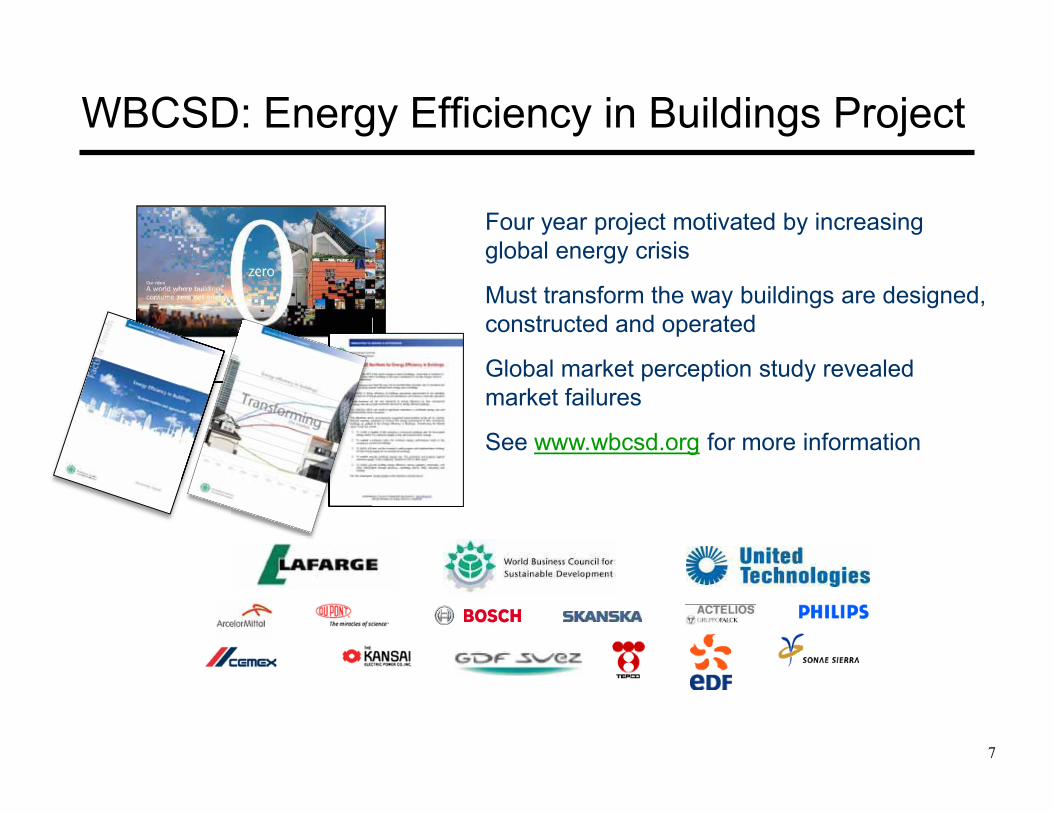
WBCSD: Energy Efficiency in Buildings Project
Four year project motivated by increasing global energy crisis
Must transform the way buildings are designed, constructed and operated
Global market perception study revealed market failures
See www.wbcsd.org for more information
7
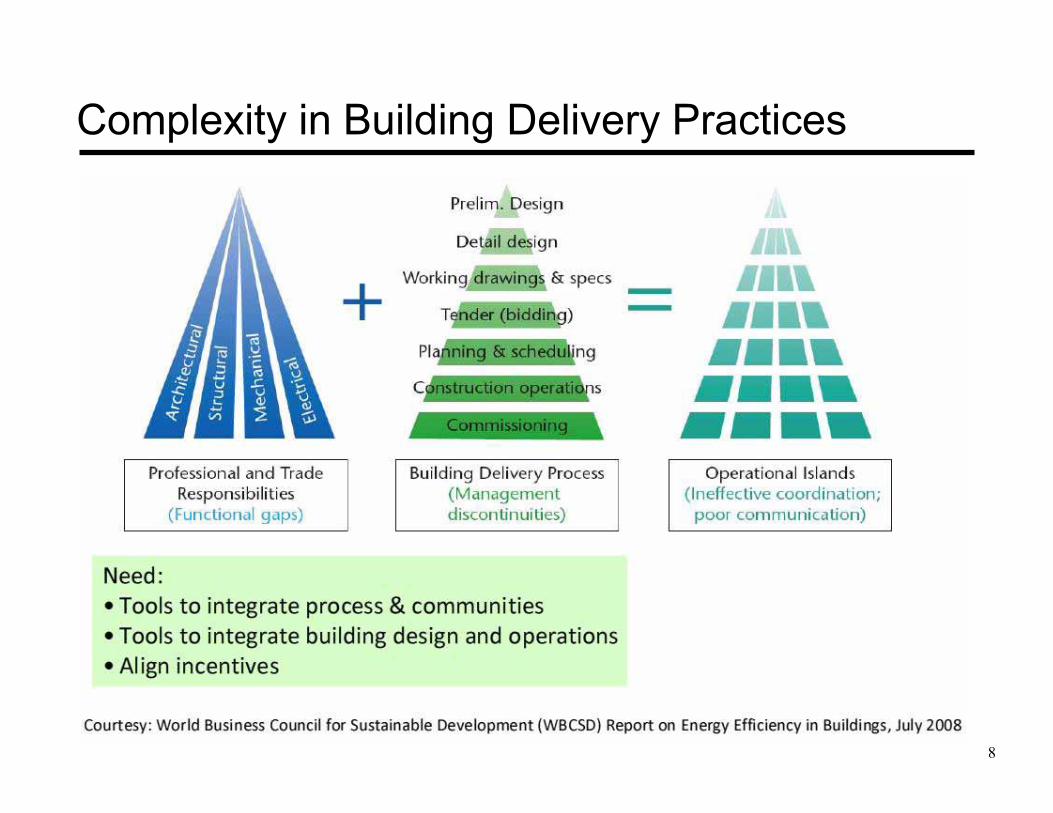
Complexity in Building Delivery Practices
8
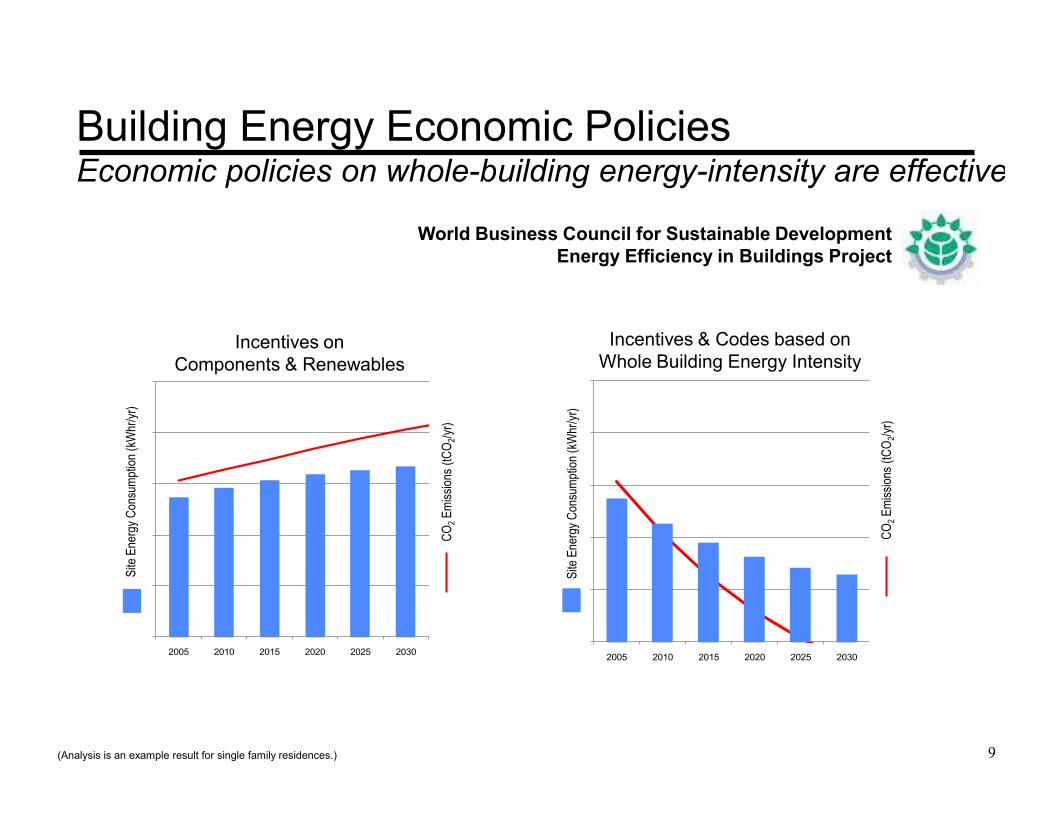
Building Energy Economic Policies Economic policies on whole-building energy-intensity are effective
World Business Council for Sustainable Development Energy Efficiency in Buildings Project
(Analysis is an example result for single family residences.)
CO2 E
miss
ions (
tCO 2
/yr)
Incentives & Codes based on Whole Building Energy Intensity
2005 2010 2015 2020 2025 2030
Site
Ener
gy C
onsu
mptio
n (kW
hr/yr
)
Incentives on Components & Renewables
2005 2010 2015 2020 2025 2030
Site
Ener
gy C
onsu
mptio
n (kW
hr/yr
)
CO2 E
miss
ions (
tCO 2
/yr)
9
0%
10%
20%
30%
40%
50%
60%
70%
80%
90%
100%
< 5 year payback <10 year payback > 10 year payback$0
$25
$50
$75
$100
$125
$150
$175
$200
CO
2 E
mis
sion
Red
uctio
n*
Incremental Investm
ent, $B
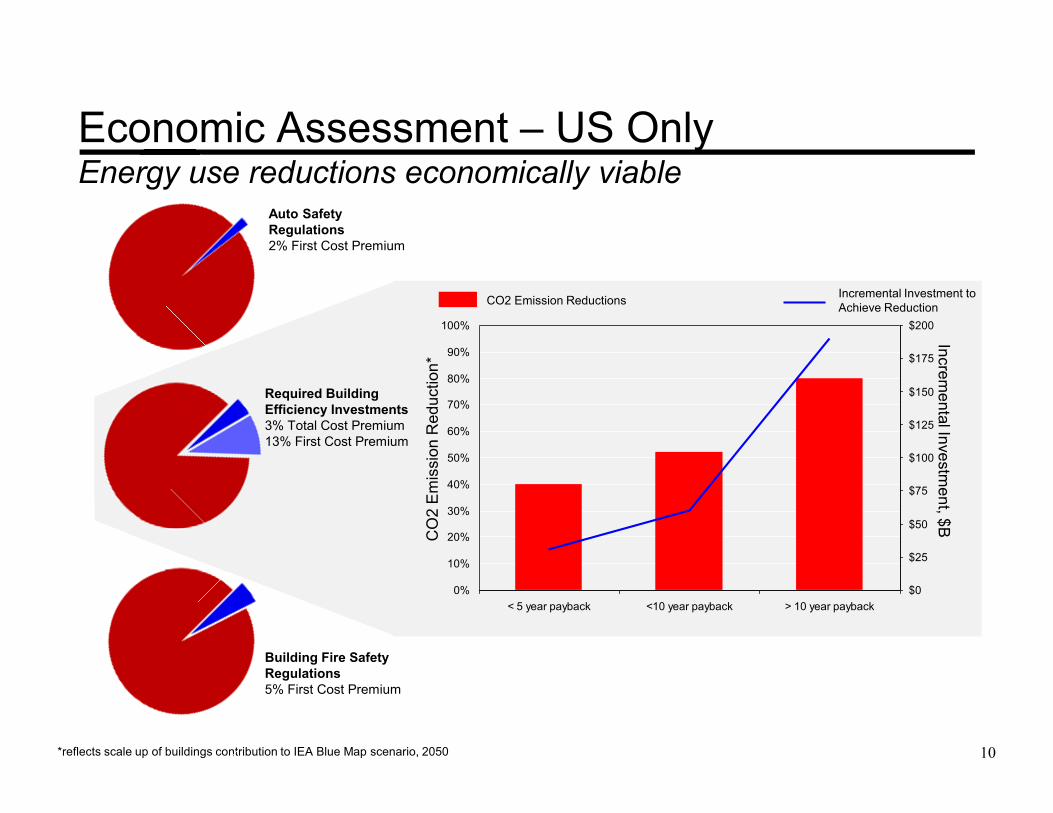
CO2 Emission Reductions Incremental Investment to Achieve Reduction
*reflects scale up of buildings contribution to IEA Blue Map scenario, 2050 buildings contr
Auto Safety Regulations 2% First Cost Premium
Building Fire Safety Regulations 5% First Cost Premium
Required Building Efficiency Investments 3% Total Cost Premium 13% First Cost Premium
Economic Assessment – US Only Energy use reductions economically viable
10

Market and Regulatory Landscape Changing… Necessitating A
Systems Approach
11
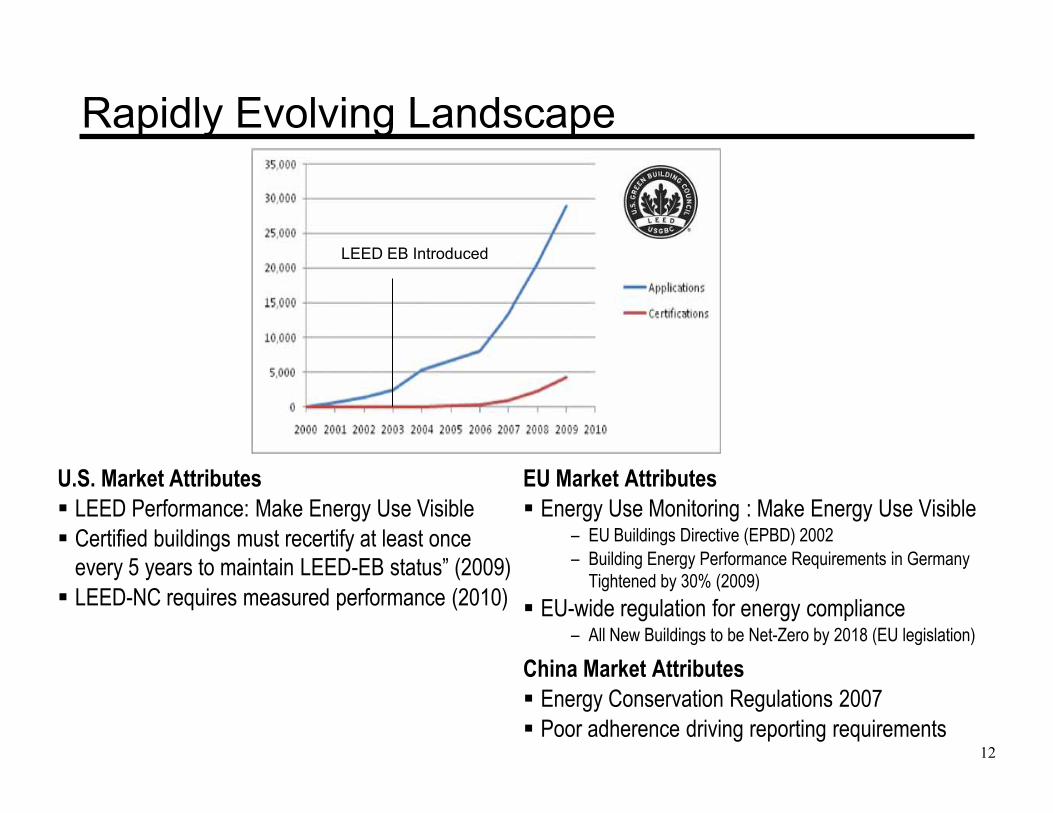
Rapidly Evolving Landscape
12
EU Market Attributes � Energy Use Monitoring : Make Energy Use Visible
– EU Buildings Directive (EPBD) 2002 – Building Energy Performance Requirements in Germany
Tightened by 30% (2009) � EU-wide regulation for energy compliance
– All New Buildings to be Net-Zero by 2018 (EU legislation)
China Market Attributes � Energy Conservation Regulations 2007 � Poor adherence driving reporting requirements
U.S. Market Attributes � LEED Performance: Make Energy Use Visible � Certified buildings must recertify at least once
every 5 years to maintain LEED-EB status” (2009) � LEED-NC requires measured performance (2010)
LEED EB Introduced
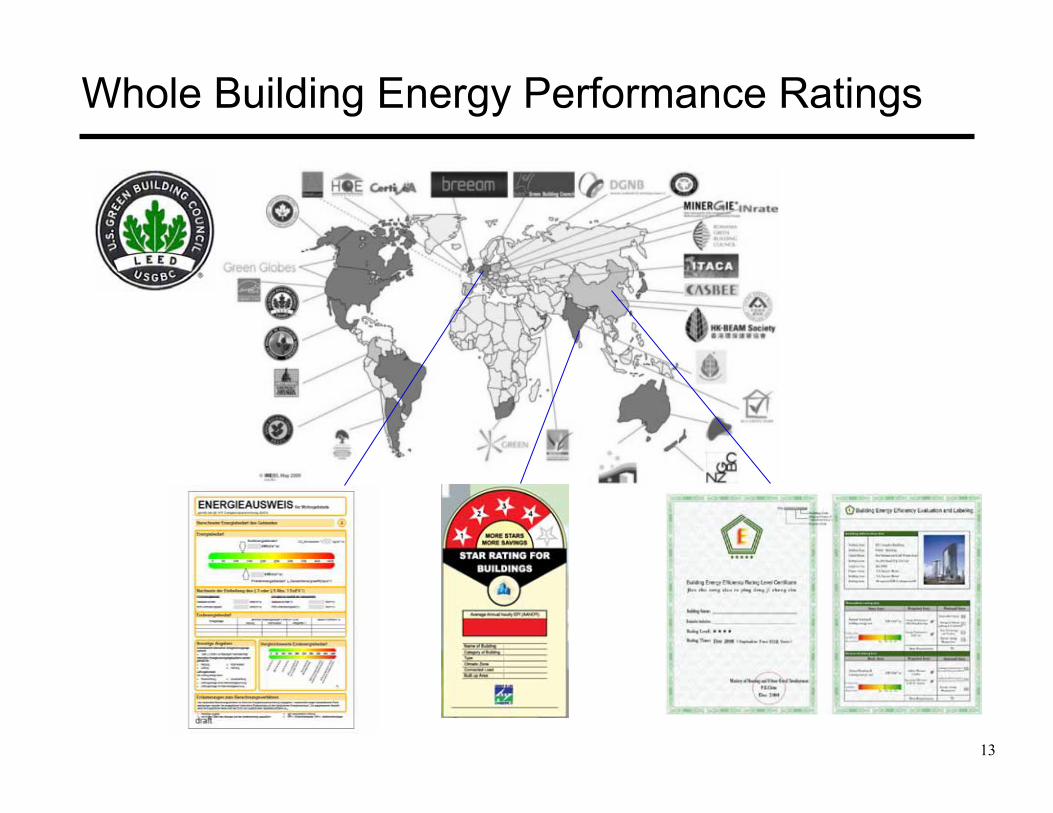
Whole Building Energy Performance Ratings
13
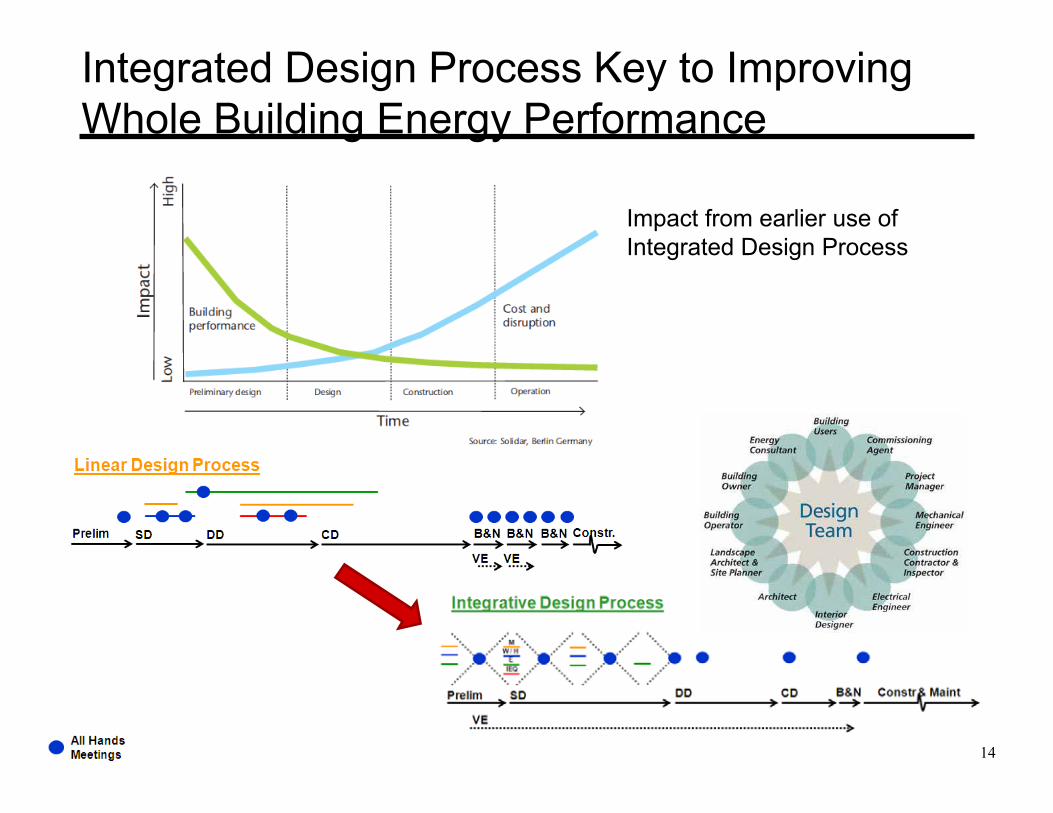
Integrated Design Process Key to Improving Whole Building Energy Performance
Impact from earlier use of Integrated Design Process
14
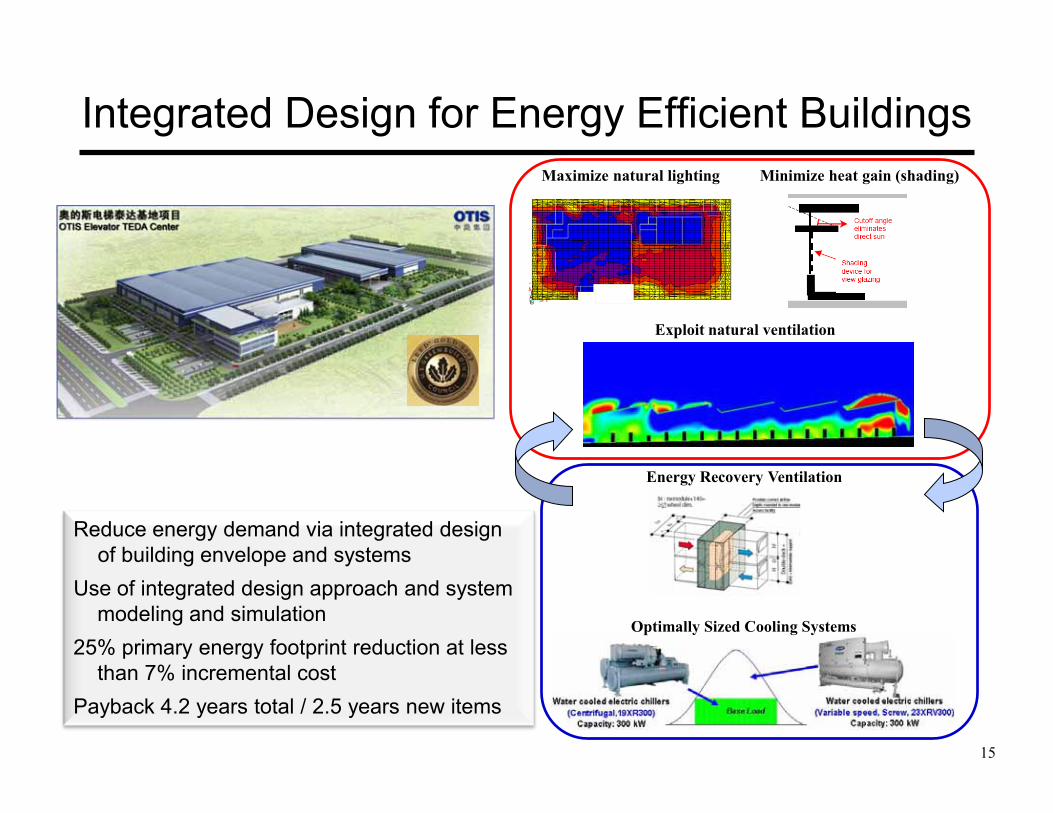
Integrated Design for Energy Efficient Buildings Maximize natural lighting Minimize heat gain (shading)
Exploit natural ventilation
Energy Recovery Ventilation
Optimally Sized Cooling Systems
Reduce energy demand via integrated design of building envelope and systems
Use of integrated design approach and system modeling and simulation
25% primary energy footprint reduction at less than 7% incremental cost
Payback 4.2 years total / 2.5 years new items
15

Sustainable and Energy Efficient Facilities in UTC
LEED Platinum 44% energy savings
LEED Gold 25% energy savings
UTC LEED-EB factories (11 factories worldwide achieving this milestone)
16
Carrier’s Charlotte (-17%), Carrier’s Huntington (-31%),
… and 24 additional are registered (2009)
P&W Shanghai Engine Center
Otis TEDA facility
P&W G Bldg. Renovation
LEED-CI Silver
But Integrated Design is Insufficient and the Entire Delivery Process
Must Undergo a Transformation…
17

Energy Efficient Buildings: Reality Designs over-predict gains by ~20-30%
Large Variability in Performance Predictions
Performance simulations conducted for peak conditions
As-built specifications differ from design intent, resulting in compromise of energy performance due to detrimental sub-system interactions
Uncertainty in operating environment and loads
M. Frankel (ACEEE, 2008)
18
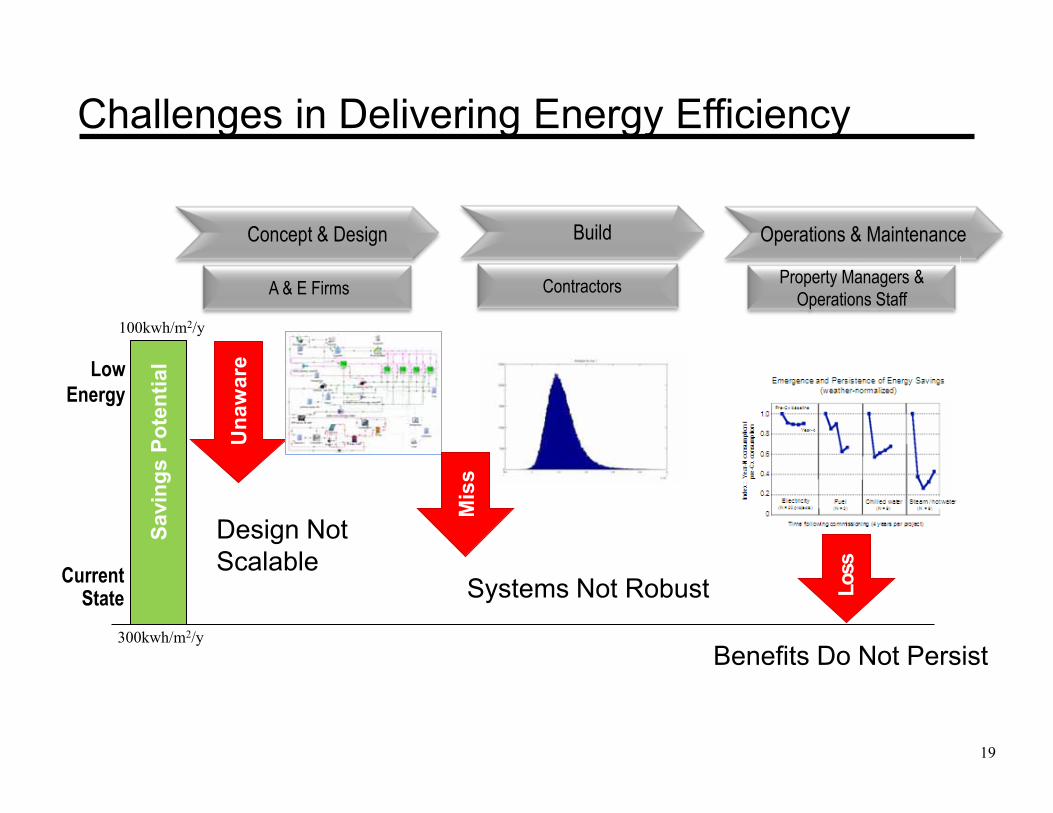
19
Low Energy
Loss
Una
war
e
Current State
Savi
ngs
Pote
ntia
l
Property Managers & Operations Staff
Operations & Maintenance Concept & Design
Contractors
Build
A & E Firms
Systems Not Robust
Benefits Do Not Persist
Design Not Scalable
Mis
s
Challenges in Delivering Energy Efficiency
300kwh/m2/y
100kwh/m2/y
So, are there proof points for very low energy consumption buildings?
What do we know about them?
20
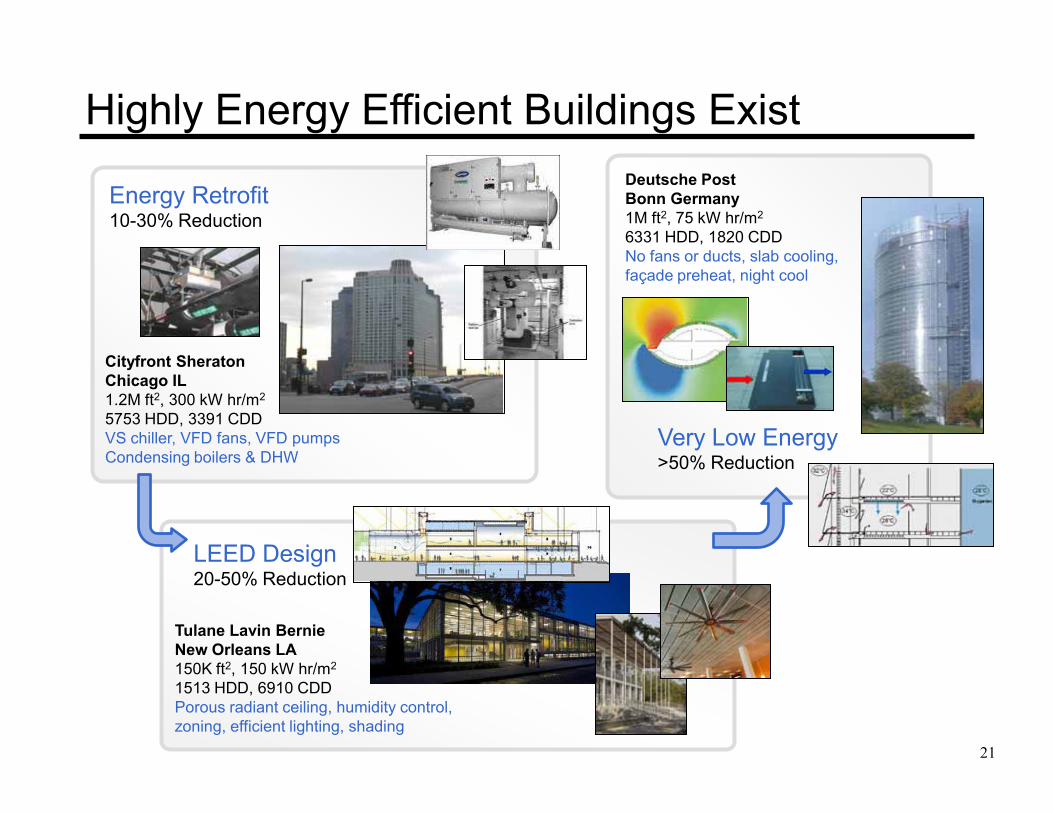
Highly Energy Efficient Buildings Exist
Very Low Energy >50% Reduction
LEED Design 20-50% Reduction
Tulane Lavin Bernie New Orleans LA 150K ft2, 150 kW hr/m2
1513 HDD, 6910 CDD Porous radiant ceiling, humidity control, zoning, efficient lighting, shading
Deutsche Post Bonn Germany 1M ft2, 75 kW hr/m2 6331 HDD, 1820 CDD No fans or ducts, slab cooling, façade preheat, night cool
Energy Retrofit 10-30% Reduction
Cityfront Sheraton Chicago IL 1.2M ft2, 300 kW hr/m2
5753 HDD, 3391 CDD VS chiller, VFD fans, VFD pumps Condensing boilers & DHW
21
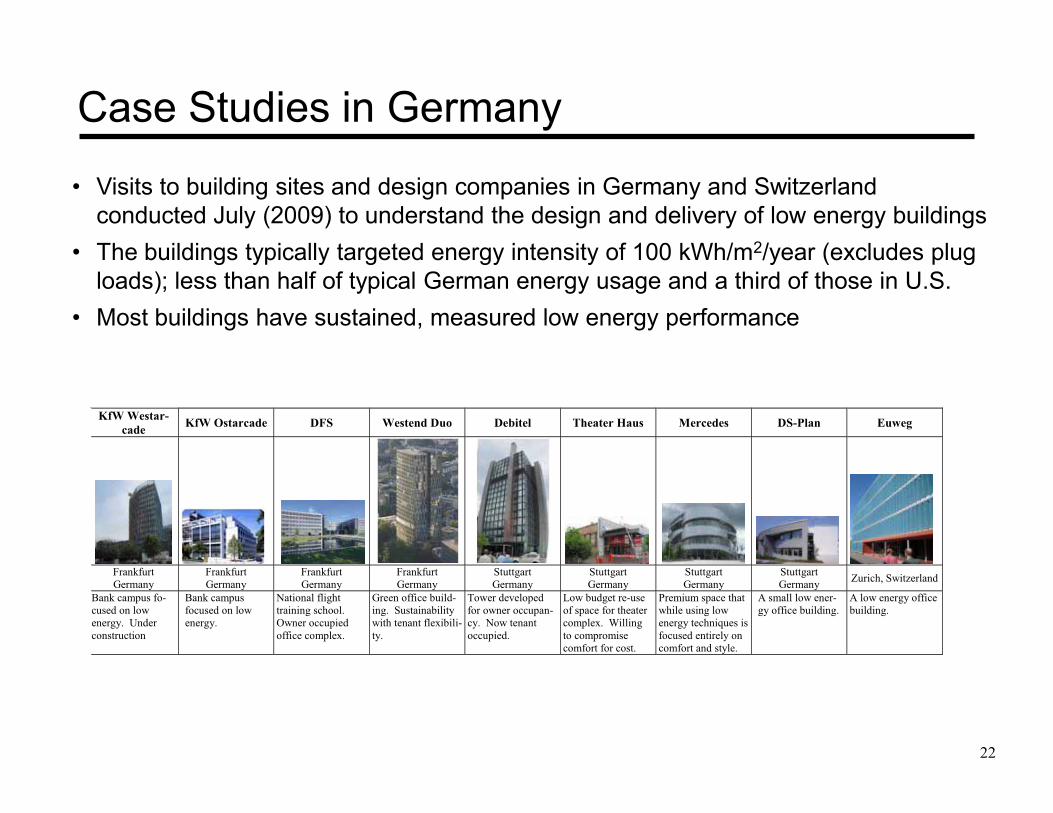
Case Studies in Germany
• Visits to building sites and design companies in Germany and Switzerland conducted July (2009) to understand the design and delivery of low energy buildings
• The buildings typically targeted energy intensity of 100 kWh/m2/year (excludes plug loads); less than half of typical German energy usage and a third of those in U.S.
• Most buildings have sustained, measured low energy performance
KfW Westar-cade KfW Ostarcade DFS Westend Duo Debitel Theater Haus Mercedes DS-Plan Euweg
Frankfurt Germany
Frankfurt Germany
Frankfurt Germany
Frankfurt Germany
Stuttgart Germany
Stuttgart Germany
Stuttgart Germany
Stuttgart Germany Zurich, Switzerland
Bank campus fo-cused on low energy. Under construction
Bank campus focused on low energy.
National flight training school. Owner occupied office complex.
Green office build-ing. Sustainability with tenant flexibili-ty.
Tower developed for owner occupan-cy. Now tenant occupied.
Low budget re-use of space for theater complex. Willing to compromise comfort for cost.
Premium space that while using low energy techniques is focused entirely on comfort and style.
A small low ener-gy office building.
A low energy office building.
22

0
100
200
300
400
500
600
700
US Average Japan Average
Germany Average
WestEnd Duo Debitel Deutsche Post
DS-Plan
Prim
ary
Ener
gy In
tens
ity (k
Whr
/m2 )
Internal Loads
Internal Loads (est)
HVAC + Lighting (breakout not available) Lighting
Ventilation
Space Cooling
Space Heating
Commercial Office Building Energy Use
Est
.
Est
.
23
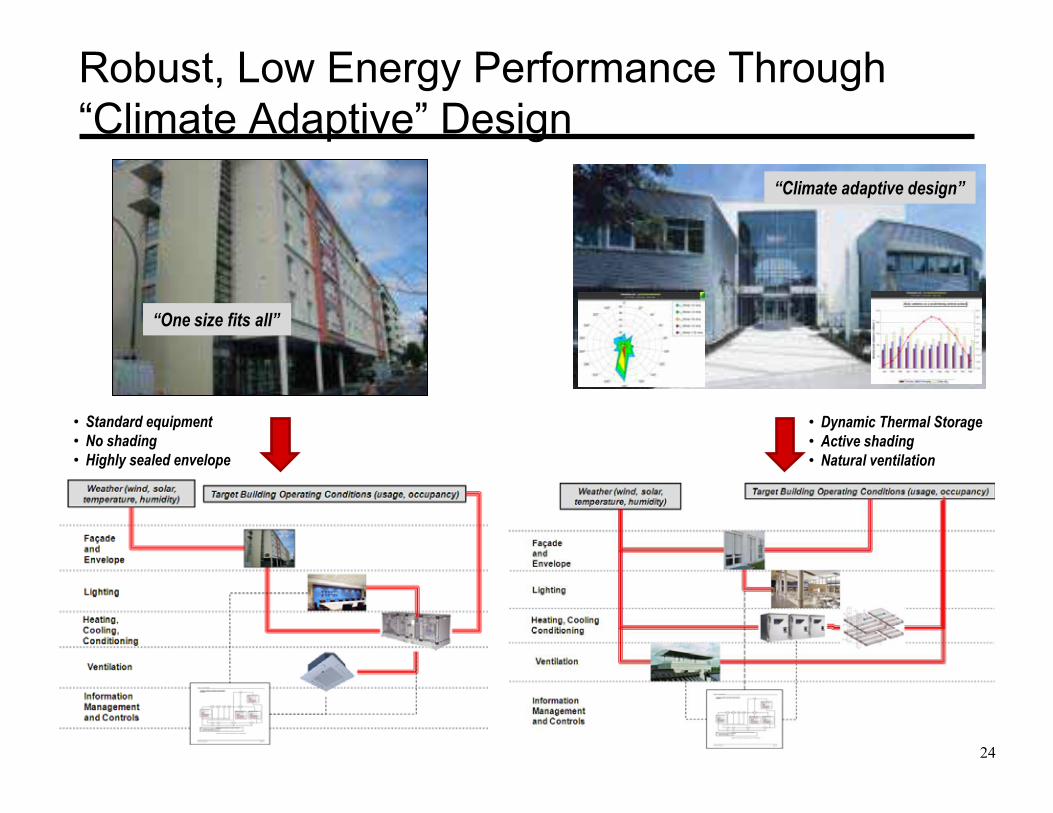
Robust, Low Energy Performance Through “Climate Adaptive” Design
“One size fits all”
“Climate adaptive design”
• Standard equipment • No shading • Highly sealed envelope
• Dynamic Thermal Storage • Active shading • Natural ventilation
24

Monitoring and Tuning Necessary to Achieve Energy Performance Targets
Year 1 Year 2 Year 3
KfW East Arcade Building Case Study
Primary Site Energy
Various Loads
Tuning the controls for night purge (pre-cooling thermal mass)
25
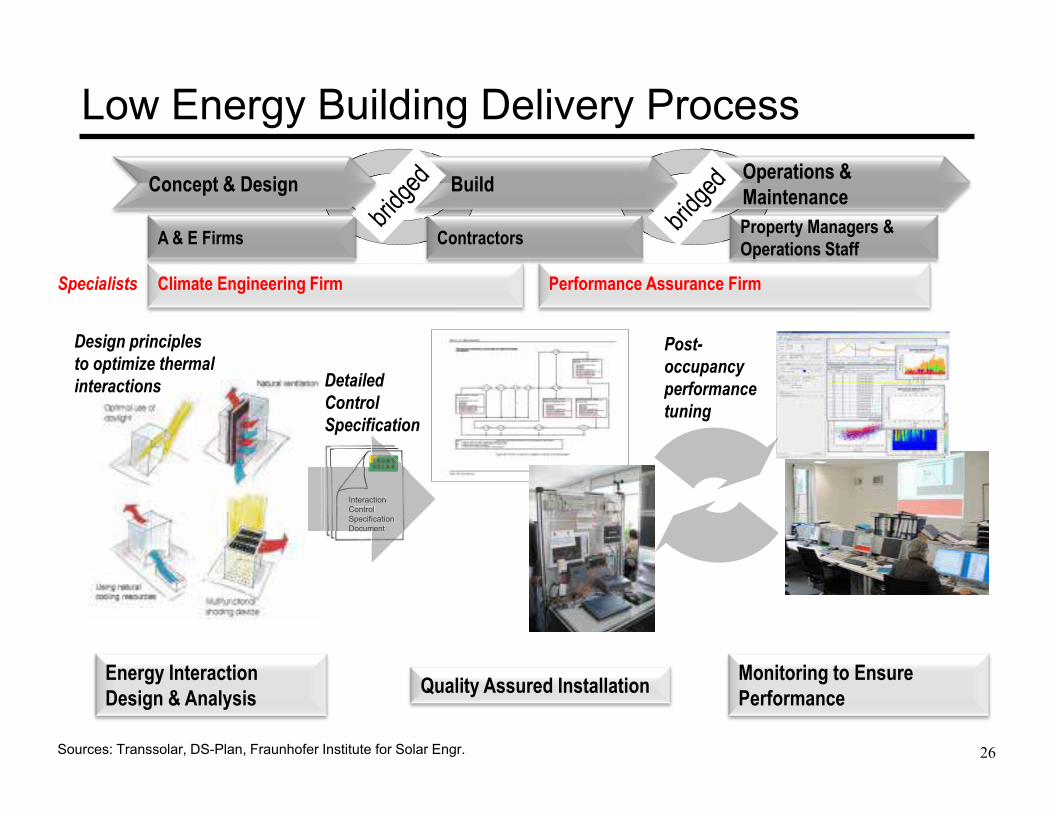
Low Energy Building Delivery Process
Contractors
Climate Engineering Firm
Property Managers & Operations Staff
Operations & Maintenance Concept & Design Build
A & E Firms
Performance Assurance Firm
Monitoring to Ensure Performance
Energy Interaction Design & Analysis Quality Assured Installation
Design principles to optimize thermal interactions
Interaction Control Specification Document
InteractionControlSpecification Document
Post-occupancy performance tuning
Detailed Control Specification
26 Sources: Transsolar, DS-Plan, Fraunhofer Institute for Solar Engr.
Specialists
Challenges in Delivering Energy Efficiency In The Built Infrastructure
• Integrated design methods, engineering software and tools Tools for architectural tradeoffs and selection with modeling and simulation tools that can handle heterogeneity, uncertainty and multi-scale dynamics Tools for rigorous requirements capture and tracking Uncertainty quantification and risk assessment tools Methodologies and tools for automated system failure analysis to establish tolerances critical to achieving and sustaining target energy performance Capability to update design models with commissioning and operational data (dynamic Building Information Models)
• Methodologies for validation and verification of system implementations
Model-based validation and verification of building systems and controls Tools to assist in auditing and regulation of building energy performance
27

What’s Next? Efficient Buildings To Eco Cities
New Songdo City South Korea
Dongtan China
28
Sustainable Development at District – City Scale Potential for larger impact and benefit More complex decision making Larger scope of infrastructure and system alternatives

Thank You…
29