Embed Size (px)
Citation preview
SUSTAINABLE BIOGAS – CLIMATE AND ENVIRONMENTAL EFFECTS OF BIOGAS PRODUCTION
JØRGEN E. OLESEN, HENRIK B. MØLLER, SØREN O. PETERSEN, PETER SØRENSEN, TAVS NYORD & SVEN G. SOMMER
DCA REPORT NO. 181 · JANUARY 2021 · POLICY ADVICE

AARHUS UNIVERSITET
Jørgen E. Olesen1, Henrik B. Møller2, Søren O. Petersen1, Peter Sørensen1, Tavs Nyord2 & Sven G. Sommer2
Aarhus Universitet1Department of Agroecology Blichers Allé 20DK-8830 Tjele
2Department of Biological and Chemical EngineeringInge Lehmanns Gade 10DK-8000 Aarhus C
SUSTAINABLE BIOGAS – CLIMATE AND ENVIRONMENTAL EFFECTS OF BIOGAS PRODUCTION
DCA REPORT NO. 181 · JANUARY 2021 · POLICY ADVICE

Series and number: DCA Report no. 181. The report has previously been publish in Danish (DCA Report no. 175)
Type of report: Policy advice
Author(s): Jørgen E. Olesen, Henrik B. Møller, Søren O. Petersen, Peter Sørensen, Tavs Nyord, Sven G. Sommer
Referees: Anders Peter Adamsen, Department of Biological and Chemical Engineering and Lars Elsgaard, Department of Agroecology
Commissioned by: The Danish Energy Agency.
Funding: This report has been prepared as part of an agreement between The Danish Energy Agency and Aarhus University.
Eksternal comments: The Danish Energy Agency. Please see https://bit.ly/3db2AOT
Eksternal contributions: Yes, at two stakeholder workshops. See explanation in preface
To be cited as: Olesen, J. E., Møller, H. B., Petersen, Sa. O., Sørensen, P., Nyord, T. and Sommer, S. G. Aarhus Universitet, DCA – Danish Centre for Food and Agriculture. 85 p. - DCA report nr. 181 https://dcapub.au.dk/djfpdf/DCArapport181.pdf
ISBN: Printed version 978-87-93998-34-6, elektronic version 978-87-93998-35-3
ISSN: 2245-1684
Pages: 85
Electronic version: https://dcapub.au.dk/djfpdf/DCArapport181.pdf
Photo front page: Jesper Rais, AU Foto
Print: Digisource.dk
Policy support from DCA: Read more at https://dca.au.dk/en/policy-support/
SUSTAINABLE BIOGAS – CLIMATE AND ENVIRONMENTAL EFFECTS OF BIOGAS PRODUCTION
AARHUS UNIVERSITET

4
Preface
This report was prepared under a contract between the Danish Energy Agency and Aarhus University
concerning the project 'Sustainable biogas – climate and environmental effects of biogas production'.
The project was initiated by the Danish Energy Agency's bioenergy task force.
Scenarios and preliminary results have been discussed at two meetings with a stakeholder group
organised at the Danish Environmental Protection Agency on 24 September 2019 and 6 March 2020.
The first workshop gave input to the selection of the biomasses and biogas plants used in the scenar-
ios in the report. The comments to preliminary results at the second meeting did not affect the assess-
ments as such, but qualified the discussions in the report.
The stakeholder group consisted of representatives from Department of the Ministry of Environment
and Food of Denmark, The Danish Environmental Protection Agency, The Danish Agricultural Agency,
The Danish Biogas Industry Association, The Danish Gas Technology Centre, The Danish Society for
Nature Conservation and The Ecological Council.
The report was peer-reviewed by Anders Peter Adamsen (Department of Biological and Chemical
Engineering, Aarhus University) and Lars Elsgaard (Department of Agroecology, Aarhus University).
The Danish Energy Agency was given the opportunity to comment on two draft reports.
Niels Halberg,
Director, DCA – Danish Centre for Food and Agriculture

5
Table of Contents
Preface ............................................................................................................................................... 4
Table of Contents ............................................................................................................................... 5
Summary ............................................................................................................................................ 8
1. Introduction ............................................................................................................................... 12
2. Biogas scenarios ....................................................................................................................... 16
2.1 Biomasses ......................................................................................................................... 16
2.2 Model plant ....................................................................................................................... 17
3. Climate effects of biogas .......................................................................................................... 22
3.1 Methane from biomass storage ........................................................................................ 22
3.1.1 Slurry and digestate ...................................................................................................... 22
3.1.2 Deep litter and biowaste .............................................................................................. 24
3.1.3 Principles for calculating methane emissions in scenarios ........................................... 27
3.1.4 Calculations of methane from stored biomasses .......................................................... 29
3.2 Nitrous oxide from storage and after application ............................................................. 32
3.2.1 Storage of slurry and digestate ..................................................................................... 33
3.2.2 Deep litter storage ........................................................................................................ 34
3.2.3 Field application of slurry .............................................................................................. 34
3.2.4 Field application of deep litter ...................................................................................... 35
3.2.5 Overall greenhouse gas balance for storage and field application ............................. 36
3.2.6 Sensitivity to the hydraulic retention time ..................................................................... 38
3.3 Biogas production and substitution of fossil energy .......................................................... 38
3.3.1 Biogas production ......................................................................................................... 39
3.3.2 Energy balances ........................................................................................................... 40
3.4 Methane from biogas plants and upgrading plants ......................................................... 41
3.5 Energy demand for biomass transport .............................................................................. 43
3.6 Soil carbon storage ........................................................................................................... 44
3.7 Climate effects of using energy crops and waste for biogas ............................................ 45

6
4. Nitrate leaching ........................................................................................................................ 47
4.1 Effect of anaerobic digestion on nitrate leaching ............................................................. 47
4.2 Organic farming scenario ................................................................................................. 49
4.3 Reduction of nitrate leaching in model plants .................................................................. 50
5. Ammonia volatilization, air pollution and odour ....................................................................... 52
5.1 Ammonia volatilization ..................................................................................................... 52
5.1.1 Stored digested slurry ................................................................................................... 52
5.1.2 Stored deep litter .......................................................................................................... 54
5.1.3 Stored slaughterhouse waste and biowaste ................................................................. 55
5.1.4 Applied digested slurry ................................................................................................. 55
5.1.5 Applied deep litter ........................................................................................................ 58
5.2 Odour from application of slurry ....................................................................................... 59
5.3 Air pollution from transport of biomasses .......................................................................... 60
5.4 Air pollution from upgrading ............................................................................................. 61
6. Recycling and utilisation of nutrients ........................................................................................ 63
6.1 Organic arable cropping including digestion of grass-clover ........................................... 63
6.2 Recirculation of nutrients from waste ................................................................................ 63
6.3 Utilisation and availability of sulphur in digested fertiliser ................................................. 64
6.4 Substitution of mineral nitrogen fertiliser ........................................................................... 64
7. Model-calculated effects of biogas scenarios .......................................................................... 65
7.1 Climate effects ................................................................................................................. 65
7.1.1 Retention time .............................................................................................................. 69
7.1.2 Methane leakage ......................................................................................................... 70
7.1.3 Methane emissions from storage of livestock manure and biogas slurry ...................... 71
7.1.4 Nitrous oxide from field application of biogas slurry ..................................................... 72
7.2 Nitrate leaching ................................................................................................................ 72
7.3 Ammonia volatilization ..................................................................................................... 72
7.4 Air pollution and odour ..................................................................................................... 73
7.5 Crops for biomass ............................................................................................................. 73
7.6 Uncertainties ..................................................................................................................... 74

7
7.6.1 Uncertainties with respect to energy production .......................................................... 74
7.6.2 Uncertainty in methane emissions from stored slurry .................................................... 75
7.6.3 Carbon storage uncertainty .......................................................................................... 76
7.6.4 Ammonia volatilization uncertainty .............................................................................. 76
7.6.5 Uncertainties in recycling of nutrients ........................................................................... 76
References ........................................................................................................................................ 78

8
Summary
Biogas is a renewable energy source (or form), which can substitute fossil fuel such as natural gas.
Biogas is produced by digesting biomass, e.g., manures and organic wastes, under anaerobic condi-
tions. Manure, sewage sludge and wet organic waste from industry and households can be used for
bioenergy production through anaerobic digestion, which also functions as waste treatment. Other
types of biomass are typically added to enhance the biogas yield, including maize silage and straw.
The quantification of the greenhouse gas (GHG) and environmental effects of biogas production con-
stitutes an important basis for the design of future subsidies for biogas production when optimizing the
effects on GHG emissions and environmental impacts. This report presents an analysis of the effects of
biogas production from manure co-digested with biomasses from waste and agriculture. It describes
and quantifies impacts of relevant effects of biogas, including energy production, GHG emissions, ni-
trate leaching, ammonia volatilization, nutrient use, and odour from field application of the digested
slurry. The effects are described for five selected model biogas plants with different composition of the
biomass substrates (Table 0.3). These scenarios and associated assumptions represent the best-applied
technologies in the Danish biogas sector as well as expected development pathways. In addition, ef-
fects of different digestion times in the biogas reactors, and methane losses from the biogas plants, were
analysed. It is presupposed that biogas is produced in large, centralised biogas facilities, and that the
gas is upgraded to natural gas quality for distribution via the natural gas grid. It is also presupposed that
the digested material is stored for 20 days with collection of the gas before the digestate is transported
to farms, where 50% of the digestate is assumed to be stored in tanks with a solid cover.
Table 0.1 Effects on GHG emissions for five selected model biogas plants at 45 day retention time in
the biogas reactor. The GHG emissions include substitution of energy, emissions of methane and ni-
trous oxide, and changes in soil carbon storage for biogas digested slurry compared to a reference
situation. The GHG effects are calculated based on the biomasses used and based on the produced
gross energy. Positive effects represent reductions in emissions.
Model biogas plant
GHG per ton
biomass
kg CO2-eq ton-1 bio-
mass
GHG per unit of gross
gas energy produced
kg CO2-eq. GJ-1
gross energy
M1a. Slurry + deep litter 66.8 77.5
M1b. Slurry + straw 105.5 52.9
M2. Slurry + deep litter + energy crop 67.7* 68.4*
M3. Slurry + deep litter + organic waste 65.3 52.7
M4. Grass-clover + slurry + deep litter + biowaste 99.5 54.7 *: The GHG effects of energy crops does not include the effects of changes in land use (iLUC).
9
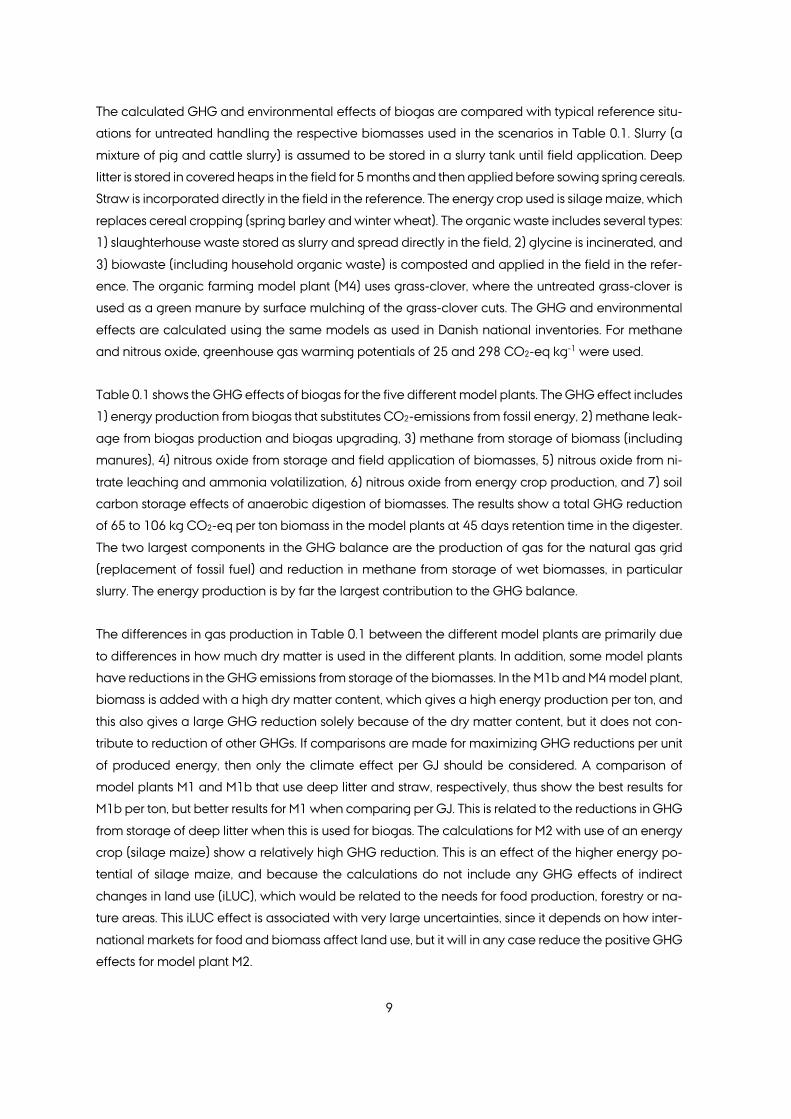
The calculated GHG and environmental effects of biogas are compared with typical reference situ-
ations for untreated handling the respective biomasses used in the scenarios in Table 0.1. Slurry (a
mixture of pig and cattle slurry) is assumed to be stored in a slurry tank until field application. Deep
litter is stored in covered heaps in the field for 5 months and then applied before sowing spring cereals.
Straw is incorporated directly in the field in the reference. The energy crop used is silage maize, which
replaces cereal cropping (spring barley and winter wheat). The organic waste includes several types:
1) slaughterhouse waste stored as slurry and spread directly in the field, 2) glycine is incinerated, and
3) biowaste (including household organic waste) is composted and applied in the field in the refer-
ence. The organic farming model plant (M4) uses grass-clover, where the untreated grass-clover is
used as a green manure by surface mulching of the grass-clover cuts. The GHG and environmental
effects are calculated using the same models as used in Danish national inventories. For methane
and nitrous oxide, greenhouse gas warming potentials of 25 and 298 CO2-eq kg-1 were used.
Table 0.1 shows the GHG effects of biogas for the five different model plants. The GHG effect includes
1) energy production from biogas that substitutes CO2-emissions from fossil energy, 2) methane leak-
age from biogas production and biogas upgrading, 3) methane from storage of biomass (including
manures), 4) nitrous oxide from storage and field application of biomasses, 5) nitrous oxide from ni-
trate leaching and ammonia volatilization, 6) nitrous oxide from energy crop production, and 7) soil
carbon storage effects of anaerobic digestion of biomasses. The results show a total GHG reduction
of 65 to 106 kg CO2-eq per ton biomass in the model plants at 45 days retention time in the digester.
The two largest components in the GHG balance are the production of gas for the natural gas grid
(replacement of fossil fuel) and reduction in methane from storage of wet biomasses, in particular
slurry. The energy production is by far the largest contribution to the GHG balance.
The differences in gas production in Table 0.1 between the different model plants are primarily due
to differences in how much dry matter is used in the different plants. In addition, some model plants
have reductions in the GHG emissions from storage of the biomasses. In the M1b and M4 model plant,
biomass is added with a high dry matter content, which gives a high energy production per ton, and
this also gives a large GHG reduction solely because of the dry matter content, but it does not con-
tribute to reduction of other GHGs. If comparisons are made for maximizing GHG reductions per unit
of produced energy, then only the climate effect per GJ should be considered. A comparison of
model plants M1 and M1b that use deep litter and straw, respectively, thus show the best results for
M1b per ton, but better results for M1 when comparing per GJ. This is related to the reductions in GHG
from storage of deep litter when this is used for biogas. The calculations for M2 with use of an energy
crop (silage maize) show a relatively high GHG reduction. This is an effect of the higher energy po-
tential of silage maize, and because the calculations do not include any GHG effects of indirect
changes in land use (iLUC), which would be related to the needs for food production, forestry or na-
ture areas. This iLUC effect is associated with very large uncertainties, since it depends on how inter-
national markets for food and biomass affect land use, but it will in any case reduce the positive GHG
effects for model plant M2.

10
The model biogas plant with the greatest GHG reduction per ton biomass is M1b, where 20% straw is
added, although with current biogas technology this option is not realistic. This model plant should,
therefore, primarily be considered to represent a future scenario following further technological de-
velopment. This is also the model plant with the lowest GHG reduction per unit produced energy. The
GHG reduction among the other biogas plants is lowest on the plant with addition of industrial waste
(M3), which primarily derives from the use of glycerol, which is alternatively used for energy produc-
tion through incineration. The biogas plant with substitution of deep litter with maize silage (M2) is
only marginally worse than the plant with slurry and deep litter (M1a), which is partly due to the high
degradability of dry matter in the silage maize and thus high biogas yields. The organic farming plant
(M4) has, except for M1b, the best climate effect (99 kg CO2-eq ton-1), where the high gas production
originates from grass, deep litter and biowaste.
The GHG emissions in this report are calculated from a Danish territorial perspective, where only ef-
fects represented in the Danish national inventory are included. One exception is that the effect of
reduced emissions from production of nitrogen in fertilizers is included, even though there is currently
no fertilizer production in Denmark. The effect of reduced fertilizer production contributes about 1.5
kg CO2-eq per ton biomass. There are no effects included of changes in land use as a consequence
of increased area of energy crops in model plant M2, which will replace food production (the iLUC
effect).
The retention time in the biogas plant affects the total GHG reduction by use of biogas. A longer
retention time will increase the production of gas and reduce the amount of degradable dry matter
during the subsequent storage of the digestate, whereby the methane emissions are reduced. The
effect of longer retention time depends on degradability of the biomass used, so that the largest fur-
ther reductions in GHG emissions are achieved with use of slowly degradable biomass such as ma-
nure and straw. There is for all plants a reduction in GHG emissions by extending the retention time
from 45 to 60 days, whereas the effect of further increasing retention time to 90 days results only in
reduction in GHG emissions for M1a, M1b and M3. For the other model plants, the positive effect on
greater biogas production is outweighed by greater use of process energy.
Methane leakage from the biogas plant, and from biogas upgrading, has great impact on the GHG
reductions due to the large global warming potential of methane. It is assumed in the scenarios that
1% of the produced methane is lost. Greater methane leakages will reduce the positive GHG reduc-
ing effects of biogas by 7% for each percentage-point increase in leakage.
11
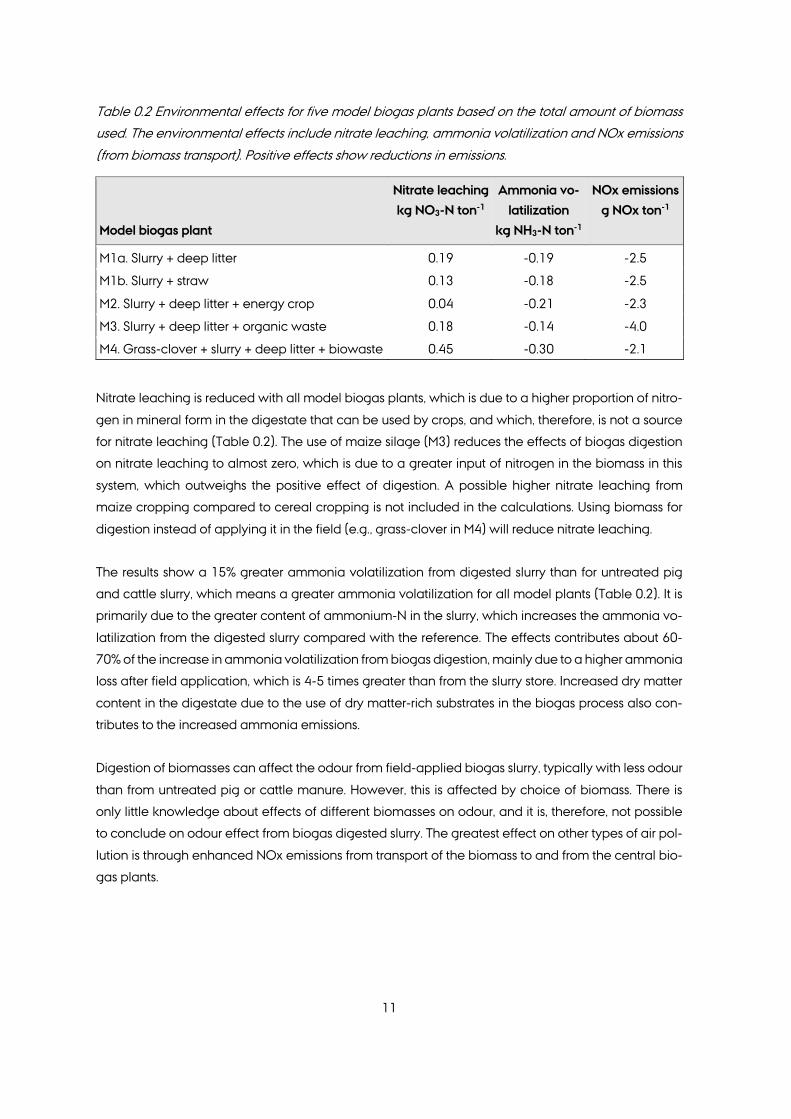
Table 0.2 Environmental effects for five model biogas plants based on the total amount of biomass
used. The environmental effects include nitrate leaching, ammonia volatilization and NOx emissions
(from biomass transport). Positive effects show reductions in emissions.
Model biogas plant
Nitrate leaching
kg NO3-N ton-1
Ammonia vo-
latilization
kg NH3-N ton-1
NOx emissions
g NOx ton-1
M1a. Slurry + deep litter 0.19 -0.19 -2.5
M1b. Slurry + straw 0.13 -0.18 -2.5
M2. Slurry + deep litter + energy crop 0.04 -0.21 -2.3
M3. Slurry + deep litter + organic waste 0.18 -0.14 -4.0
M4. Grass-clover + slurry + deep litter + biowaste 0.45 -0.30 -2.1
Nitrate leaching is reduced with all model biogas plants, which is due to a higher proportion of nitro-
gen in mineral form in the digestate that can be used by crops, and which, therefore, is not a source
for nitrate leaching (Table 0.2). The use of maize silage (M3) reduces the effects of biogas digestion
on nitrate leaching to almost zero, which is due to a greater input of nitrogen in the biomass in this
system, which outweighs the positive effect of digestion. A possible higher nitrate leaching from
maize cropping compared to cereal cropping is not included in the calculations. Using biomass for
digestion instead of applying it in the field (e.g., grass-clover in M4) will reduce nitrate leaching.
The results show a 15% greater ammonia volatilization from digested slurry than for untreated pig
and cattle slurry, which means a greater ammonia volatilization for all model plants (Table 0.2). It is
primarily due to the greater content of ammonium-N in the slurry, which increases the ammonia vo-
latilization from the digested slurry compared with the reference. The effects contributes about 60-
70% of the increase in ammonia volatilization from biogas digestion, mainly due to a higher ammonia
loss after field application, which is 4-5 times greater than from the slurry store. Increased dry matter
content in the digestate due to the use of dry matter-rich substrates in the biogas process also con-
tributes to the increased ammonia emissions.
Digestion of biomasses can affect the odour from field-applied biogas slurry, typically with less odour
than from untreated pig or cattle manure. However, this is affected by choice of biomass. There is
only little knowledge about effects of different biomasses on odour, and it is, therefore, not possible
to conclude on odour effect from biogas digested slurry. The greatest effect on other types of air pol-
lution is through enhanced NOx emissions from transport of the biomass to and from the central bio-
gas plants.

12
1. Introduction
Biogas is a renewable energy source (or form) that can substitute fossil natural gas. Biogas is pro-
duced by digesting biomass, such as slurry and other organic waste under anaerobic conditions. Live-
stock manure, sewage sludge and wet organic waste from industry and households can be used in
the production, which then also serves as waste treatment. Other biomasses, such as maize, which
are easily degraded into biogas in a biogas reactor can also be added to increase the gas yield.
The production of biogas in Denmark has increased from about 3 PJ (petajoule, 1015 J) in 2000 to 13
PJ in 2018 (Danish Energy Agency, 2019). This increase was particularly seen after the Energy Agree-
ment in 2012, which offered much higher subsidies for establishing and operating biogas plants. For
a long time, biogas has been produced from sludge from wastewater treatment facilities, but this
potential has almost been fully utilised. The focus has, therefore, been on utilising other waste bio-
masses, particularly slurry from livestock farming, source-separated organic household waste and
other residual biomasses, such as deep litter and straw. This is illustrated in Figure 1, which shows the
distribution of biogas from different types of biomass in 2018/2019. The development of biogas
plants in Denmark has also been supported by technological improvements, which have allowed for
utilisation of such biomasses for biogas production.

13
Figure 1.1 Biomasses used for biogas in 2018/2019 and related energy production (Danish Energy Agency, 2020).
Biogas consists of a mixture of gases, particularly methane (CH4) and carbon dioxide (CO2), but also
sulphur gases, hydrogen, and ammonia (NH3) at low concentrations. The most recent development
of biogas after the Energy Agreement in 2012 has, in particular, focused on the production of biogas
for the natural gas grid. In this process, the biogas is cleaned of CO2 and other gases, so that only
methane is fed into the grid. Recent years have seen a major focus on reducing the loss of methane
from biogas production, from upgrading plants and post-digesters.
Biogas production can have both positive and negative impacts on GHG emissions and environmen-
tal loadings. The production may also have agricultural benefits. When livestock manure is supplied
for biogas production, the emissions of GHGs from the livestock are reduced. The process also makes
the nitrogen (N) in the manure more accessible for plants. The extent of the effects depends on the
production characteristics, including, in particular, the biomasses used and the reference situation
used for the comparison. Moreover, factors such as transport, process energy consumption and the
size of any methane loss from the plant are included.
Biom
ass
(milli
on to
nnes
) En
ergy
pro
duct
ion
(PJ)
Slurry
and m
anure
Indus
trial w
aste
Straw
Crop re
sidue
s
Energy
crop
s
Source
-sepa
rated
orga
nic ho
useh
old
waste,
kitch
en w
aste,
etc.
Glyceri
ne

14
Nielsen et al. (2002) conducted an overall analysis of socio-economic effects of biogas, which also
included the effects of GHG emissions, N utilisation, nitrate leaching and odour nuisances from field
application. Those analyses were based on biogas plants, which used slurry and organic waste from
slaughterhouses and the food industry. At that time, the alternative use of such waste types involved
considerable climate and environmental impacts, and most of the calculated benefits of biogas were
linked to this reference situation. However, the potential for those waste types is already fully utilised
in the biogas plants today, and with the recent years' massive development, the share of those waste
resources compared to other biomasses is very limited and only constitutes a small proportion of the
total biomass supplied to the plants. This makes the current biogas production somewhat different
than calculated in Nielsen et al. (2002), and the biomass composition supplied to the plants now and
in future will also be different.
Calculations of socio-economic impacts of different types of biomass for biogas were made by Ja-
cobsen et al. (2013) and Møller and Martinsen (2013). Jacobsen et al. (2013) studied the following
alternative biomasses in biogas plants with slurry: separated fibre fraction from the slurry, maize silage,
grass, and beet. The calculations included effects on greenhouse gases and nitrate leaching based
on Olesen et al. (2013). Møller and Martinsen (2013) studied different sizes of biogas plants based on
cattle slurry, pig slurry and grass-clover, where plants that used grass-clover were based on organic
farming. Effects on GHGs and nitrate leaching were calculated, but the basis of those calculations is
poorly described.
Based on Petersen et al. (2016), Mikkelsen et al. (2016) developed a new model for calculating me-
thane emissions from livestock manure management, which also included effects of biogas and fre-
quent removal of slurry from the livestock housing to an outside storage tank. However, no biomasses
other than slurry were included, nor were any other effects such as energy and environmental factors.
Olesen et al. (2018) used the results from Mikkelsen et al. (2016) to calculate effects of methane and
nitrous oxide emissions from the use of different types of biomass, such as slurry, fibre fraction from
the slurry, deep litter, straw, grass, grass-clover and beet.
Since the most comprehensive socio-economic calculations by Nielsen et al. (2002) and Jacobsen
et al. (2013) were made, considerable technological developments have been seen in biogas plants
and their use of waste biomasses. Moreover, new models have been developed for calculation of
GHG emissions from biological waste management (Mikkelsen et al., 2016) and the calculation of
nitrate leaching from digested slurry (Sørensen and Børgesen, 2015).
The quantification of the climate and environmental effects of biogas production constitutes an im-
portant basis for designing and targeting future biogas subsidies to optimise the climate and environ-
mental benefits of the production. Efforts have previously been made to quantify the effects in various
contexts, but the results were ambiguous, and the analyses did not include all relevant effects. This
report presents an analysis of the effects of biogas production based on livestock manure and various

15
relevant types of biomasses from waste management and agriculture. It describes and quantifies all
relevant effects within energy production, GHG emissions, nitrate leaching, ammonia volatilization, N
utilisation, and odour nuisances from field application. The effects are described for a number of
model biogas production plants with different retention times and different biomass compositions.
The selected scenarios and assumptions represent the best technologies currently applied in the Dan-
ish biogas sector and the anticipated future development.
This report uses a method where the calculated climate and environmental effects are compared
with a typical reference situation for management of the different types of biomasses. This method
differs from other methods, such as life-cycle analyses (LCA), where only the effects of biomass man-
agement in the relevant management chain are considered (e.g., biogas). The report mostly uses the
same models and values for GHG emissions and environmental effects as are used in Denmark's
national inventories of emissions and environmental impact.

16
2. Biogas scenarios
Biogas is a multi-functional process where anaerobic bacteria and archaea break down organic
materials into biogas. A number of fundamental conditions must be in place for the microorganisms
to convert organic materials into biogas, including anaerobic conditions and optimum pH. Moreover,
a high and stable biogas yield relies on a temperature within the mesophilic or thermophilic temper-
ature range. Biogas technology is being developed continuously, and this report reflects current best
practice.
2.1 Biomasses
Many types of biomasses can be used for biogas (Table 2.1). The existing central biogas plants in
Denmark often use up to 25% organic residues in terms of dry matter content, mainly in the form of
industrial residues, such as stomach and intestinal content from slaughterhouses, whey from dairies,
etc. However, keep the volume of these residues below 25% is not as important as previously, where
the aim was for the digestate to be used according to the Danish Executive Order on Livestock Ma-
nure rather than the Danish Executive Order on the Use of Waste for Agricultural Purposes, but since
the content of the two executive orders no longer differs significantly, the percentage volume is no
longer as important. The residues must be recyclable as fertilizer and must, therefore, meet the re-
quirements for heavy metals and environmentally harmful substances (the Danish Executive Order
on the Use of Waste for Agricultural Purposes, BEK no, 1001 of 27 June 2018). The existing biogas
plants use almost all industrial residues available in Denmark today.
Table 2.1. Examples of types of biomass for biogas.
Origin Types
Agricultural residues and energy crops
Livestock manure
Energy crops
Straw
Organic grass-clover
Private households and re-tail sector (biowaste)
Household waste, commercial kitchens, retail sector, etc.
Industrial by-products Glycerine
By-products, residues from food production, including slaughterhouse waste
Waste from grease separators
Wastewater treatment plants
Wastewater sludge
17
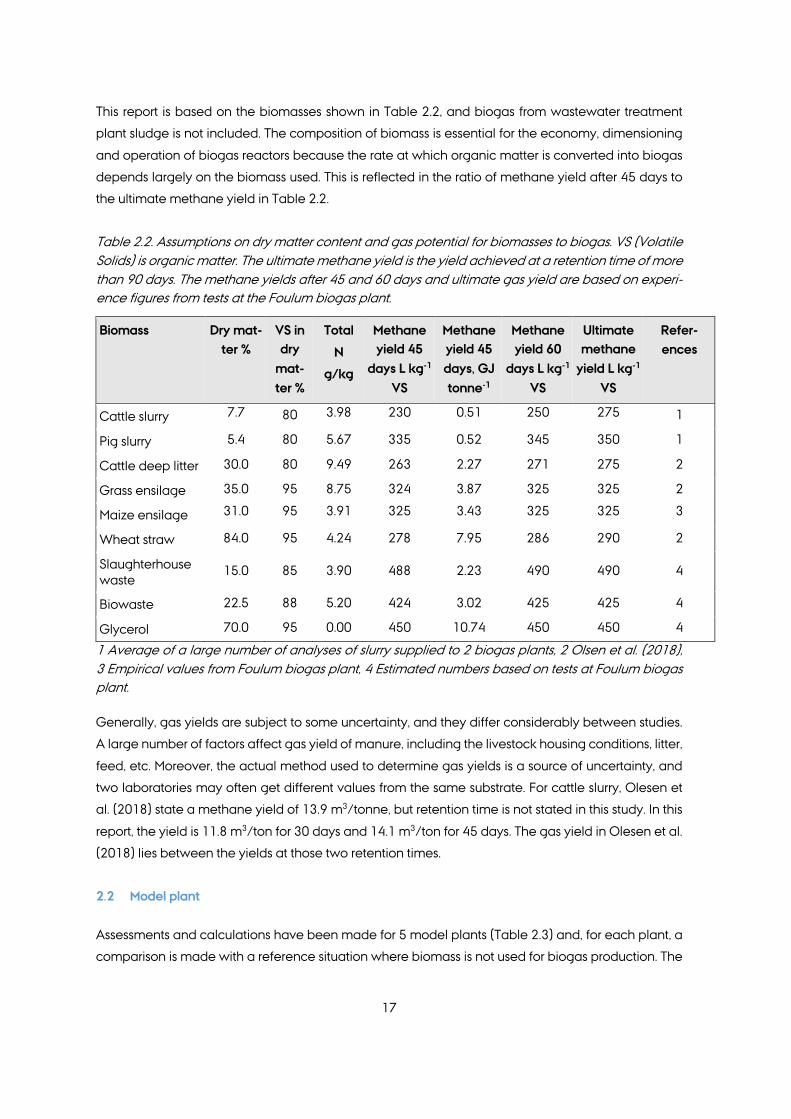
This report is based on the biomasses shown in Table 2.2, and biogas from wastewater treatment
plant sludge is not included. The composition of biomass is essential for the economy, dimensioning
and operation of biogas reactors because the rate at which organic matter is converted into biogas
depends largely on the biomass used. This is reflected in the ratio of methane yield after 45 days to
the ultimate methane yield in Table 2.2.
Table 2.2. Assumptions on dry matter content and gas potential for biomasses to biogas. VS (Volatile Solids) is organic matter. The ultimate methane yield is the yield achieved at a retention time of more than 90 days. The methane yields after 45 and 60 days and ultimate gas yield are based on experi-ence figures from tests at the Foulum biogas plant.
Biomass Dry mat-ter %
VS in dry
mat-ter %
Total
N
g/kg
Methane yield 45
days L kg-1 VS
Methane yield 45 days, GJ tonne-1
Methane yield 60
days L kg-1 VS
Ultimate methane
yield L kg-1 VS
Refer-ences
Cattle slurry 7.7 80 3.98 230 0.51 250 275 1
Pig slurry 5.4 80 5.67 335 0.52 345 350 1
Cattle deep litter 30.0 80 9.49 263 2.27 271 275 2
Grass ensilage 35.0 95 8.75 324 3.87 325 325 2
Maize ensilage 31.0 95 3.91 325 3.43 325 325 3
Wheat straw 84.0 95 4.24 278 7.95 286 290 2
Slaughterhouse waste
15.0 85 3.90 488 2.23 490 490 4
Biowaste 22.5 88 5.20 424 3.02 425 425 4
Glycerol 70.0 95 0.00 450 10.74 450 450 4
1 Average of a large number of analyses of slurry supplied to 2 biogas plants, 2 Olsen et al. (2018), 3 Empirical values from Foulum biogas plant, 4 Estimated numbers based on tests at Foulum biogas plant.
Generally, gas yields are subject to some uncertainty, and they differ considerably between studies.
A large number of factors affect gas yield of manure, including the livestock housing conditions, litter,
feed, etc. Moreover, the actual method used to determine gas yields is a source of uncertainty, and
two laboratories may often get different values from the same substrate. For cattle slurry, Olesen et
al. (2018) state a methane yield of 13.9 m3/tonne, but retention time is not stated in this study. In this
report, the yield is 11.8 m3/ton for 30 days and 14.1 m3/ton for 45 days. The gas yield in Olesen et al.
(2018) lies between the yields at those two retention times.
2.2 Model plant
Assessments and calculations have been made for 5 model plants (Table 2.3) and, for each plant, a
comparison is made with a reference situation where biomass is not used for biogas production. The

18
composition of nutrients in the biomasses in the model plants is shown in Table 2.4. The N content in
the manures and digestates is used to calculate ammonia loss, leaching loss and GHG emissions. The
content of N is based on standard figures for content in the components included in the digestates.
Table 2.3. Model plants in the study. Distribution of biomass input is stated in weight percentage.
Type of plant
Input Reactor DM (%)
Reference
1 Central plant
1a. Slurry + deep litter
1b. Slurry + straw
6.2
9.5
Slurry is stored in a slurry tank and is then spread di-rectly on the field. Deep litter is alternatively stored in covered stacks/manure piles for five months and is applied before sowing spring cereal. Alternatively, straw is incorporated.
2 Central plant
Slurry + deep litter + 12% energy crops
5.1 The area with energy crops is used for cereal crop-ping.
3 Central plant
Slurry + deep litter + 20% organic waste
5.3 The organic waste is stored as slurry and is then spread directly on the field (slaughterhouse waste) Incinerated (glycerine) Composted and then applied (biowaste)
4 Organic central plant
Organic grass-clover 25% + slurry 50% + deep litter 20% + biowaste 5%
8.7 Organic farm without a biogas plant, the clover grass is used as green manure.
Table 2.4. The content of nutrients (g kg-1) in the digestate from the model plants subject to the con-dition that no mass is lost in the process.
Nutrient Model plant 1a Model plant 1b Model plant 2 Model plant 3 Model plant 4
Total N 5.76 4.71 5.09 5.09 6.34
NH4-N 2.89 2.52 2.78 2.55 2.18
P 1.02 0.87 0.93 1.11 3.04
K 4.44 5.15 3.64 3.32 6.36
Model plants M1a and M1b1
Plant 1a is supplied only with slurry and deep litter. The volume of deep litter that can be added is
limited by the fact that there is a maximum to how much dry matter can be managed in the reactor.
The slurry is an equal mixture of cattle and pig slurry. The deep litter used is assumed to be from cattle
farming. Moreover, a calculation is made where deep litter is substituted by straw (model plant 1b).
The biomass composition in model plants 1a and 1b1 is shown in Table 2.5.

19
Table 2.5. Biomass composition in model plants M1a and M1b. Model plant M1a uses deep litter and model plant M1b uses straw.
Biomass Share (% of weight)
Share (% of dry matter)
1a
Share (% of dry matter)
1b
Cattle slurry 40 27 14
Pig slurry 40 19 10
Deep litter (1a) / straw (1b) 20 53 76
It is assumed that slurry is collected and delivered 10 km from the biogas plant, i.e., a total of
20 km transport. In the reference situation, the slurry is alternatively stored in a slurry tank and then
spread directly on the field. The deep litter is alternatively stored in a stack/manure pile for about 5
months.
Model plant M2
The plant is supplied with slurry, deep litter, and energy crops (Table 2.6). The share of energy crops
is 12% based on weight, and the dry matter content is kept at the same level as in model plant M1.
The energy crop used is maize, which is assumed to substitute cereal crops.
Table 2.6. Biomass composition in model plant M2.
Biomass Share (% of weight)
Share (% of dry matter)
Cattle slurry 40 27
Pig slurry 40 19
Cattle deep litter 8 21
Energy crops 12 33
In the reference situation, the slurry is alternatively stored in a slurry tank and then spread directly in
the field. The deep litter is alternatively stored in a stack/manure pile for 5 months. The use of maize
as an energy crop for biogas means a smaller cereal cropping area (Section 3.7).
Model plant M3
The plant is supplied with slurry, deep litter, and waste (Table 2.7). The share of waste is 20% based
on weight. Three types of waste are used:
• Biowaste (source-separated organic household waste and commercial waste)
• Slaughterhouse waste (stomach and intestinal content)
• Glycerol

20
Table 2.7. Biomass composition in model plant M3.
Biomass Share (% of weight)
Share (% of dry matter)
Cattle slurry 35 22
Pig slurry 35 16
Cattle deep litter 10 25
Biowaste 5 9
Slaughterhouse waste 13 16
Glycerol 2 12
In the reference situation, the slurry is alternatively stored in a slurry tank and then spread directly on
the field. The deep litter is alternatively stored in a stack/manure pile for 5 months. For waste, the use
in the reference situation depends on the waste type (Table 2.8).
Table 2.8. Reference for biomass in model plant M3.
Waste type Reference
Source-separated organic household waste Slaughterhouse waste Glycerol
Composting Storage and application on agricultural land after hygienisation at 70°C Incineration with heat recovery and utilisation
Model plant M4
This plant is assumed to be relevant for organic farming. The plant is supplied with slurry, deep litter,
and clover grass (Table 2.9). It is assumed that all slurry comes from cattle and that the energy crop
consists of clover grass. As it is expected to be difficult to obtain large volumes of slurry for organic
plants, only 50% slurry is added. 5% biowaste is added. The composition of the biomasses means that
the dry matter content will be significantly greater than in model plants M1 to M3.
Table 2.9. Biomass composition in model plant M4.
Biomass Share (% of weight) Share (% of dry matter)
Cattle slurry 50 20
Cattle deep litter 20 30
Grass-clover 25 44
Source-separated organic household waste
5 6
In the reference situation, the slurry is alternatively stored in a slurry tank and then spread directly on
the field. The deep litter is alternatively stored in a stack/manure pile for 5 months. Grass-clover
comes from areas already planted with clover grass for green manure, including catch crops, and it

21
is assumed that it will not replace the cultivation of cash crops. Part of the grass-clover is ensilaged to
ensure an even supply to the biogas plant all year.
Assumptions
For all model plants, the following is assumed:
• The plants are central biogas plants.
• The biomass retention in primary reactors is 45 days with thermophilic operation (49-55°C). The
45 days have been selected based on a study conducted by the Danish Energy Agency (Tafdrup,
2019), which shows that the average retention time is 47 days in existing plants. In new biogas
plants, retention times tend to be longer, and calculations have, therefore, been made with in-
creased retention times of 60 and 90 days.
• Heat exchange is assumed to lower the temperature in the digestate to 25°C before it is supplied
to a post-digester with gas collection in the plant.
• For all model plants, it is assumed that methane is collected from post-digester with a retention
time of 20 days and that the temperature of the digestate is 20°C when it leaves the biogas
plant and is supplied to the final storage tank.
• There is no difference between storing livestock manure before biogas treatment in a biogas
plant and untreated slurry transported directly from the housing to slurry tank storage. Solid ma-
nure and deep litter are transported from the livestock housing to biogas plant and are covered
according to the provisions of the Executive Order on Livestock Manure. It is assumed that 50%
of the digested slurry has tent cover. Transport distances for the biomass are specified in Table
3.6.
• Dry matter content in the reactor is a maximum of 10%.
• In all model plants, digestion takes place by serial operation in 2 reactors with the same retention
time at each step.

22
3. Climate effects of biogas
This section describes climate effects of the different biogas scenarios in the form of GHG emissions,
energy production and transport. A 100-year time horizon is used for calculating the global warming
potential, and the conversion factors from methane and nitrous oxide (N2O) to CO2 equivalents are,
in accordance with Denmark's national inventory (Nielsen et al., 2019), 25 and 298 kg CO2-eq kg-1,
respectively.
3.1 Methane from biomass storage
3.1.1 Slurry and digestate
Biogas production from slurry, deep litter, grass-clover and energy crops can be calculated based on
test results. Methane emissions from slurry and digestate during storage, in contrast, are estimated
based on the chemical composition before and after biogas treatment.
In principle, this report uses the same basis for the calculations of methane emissions as Denmark's
national inventories (Mikkelsen et al., 2016), where the amounts of highly degradable (VSd, kg kg-1)
and slowly degradable organic matter (VSnd, kg kg-1) in slurry and digestate are used for calculation
of methane emissions as a function of storage temperature. The key equation is:
!" = (%&! + 0.01%&"!),($"%&!"#$) (1)
where Ft is the methane production rate (g CH4 kg-1 VS h-1), Ea is the process activation energy
(J mol-1), lnA (g CH4 kg-1 VS h-1) is a constant related to the methane production potential of the slurry,
R is the universal gas constant (J K-1 mol-1), and T is the temperature (K). This equation can be used to
calculate the daily methane emission under the specified assumptions. The amount and degradabil-
ity of biomass organic matter, and storage temperature are controlling variables, whereas other pa-
rameters are constant.
The current knowledge about the parameters for the temperature dependency has been described
in two articles (Elsgaard et al., 2016; Petersen et al., 2016), whereas the estimates of amounts and
degradability of organic matter (VS) are based on biogas tests with slurry and other inputs for biogas
plants (Møller, personal communication). The Ea value used is currently the best estimate available,
and the value, 81 kJ mol-1, was adopted in the most recent update of the IPCC Guidelines for National
Greenhouse Gas Inventories (IPCC, 2019).
The other parameter for temperature dependency is lnA. Sensitivity analyses have shown that the
empirical model is highly sensitive to lnA (Chianese et al., 2009; Petersen et al., 2016). This is also true
for Ea, which is, however, in this report kept at a constant value found to be the best available estimate
(Baral et al., 2018; IPCC, 2019). Petersen et al. (2016) used a laboratory test (described by Elsgaard
et al., 2016) to estimate lnA in slurry based on measurements of methane production rate at a known
temperature close to the storage temperature:

23
-./ = -. 0 (%()*&+,.,.)*'&)
1 + /"01 (2)
Equation (2) is a rearrangement of equation (1). By collecting slurry samples from housing and stor-
age tanks on different farms and at different times, it will in principle be possible to determine lnA
experimentally. So far, this has only been done in a pilot study (Petersen et al., 2016), where slurry
samples were collected in cattle sheds and pig houses. It is uncertain how well those lnA values rep-
resent the subsequent long-term storage in slurry tanks, and we therefore reviewed literature to find
relevant studies of methane emissions from slurry storage tanks.
Table 3.1. The methane production potential values, lnA’, in biogas slurry, cattle slurry and pig slurry were calculated based on information about methane production rate, total VS and temperature. In the table 2̅ ± 6. ,. represent means and standard errors.
Slurry type Month lnA’ Source
Digestate March 28.3 Maldaner et al. (2018)
April 27.4 Elsgaard et al. (2016)
September 28.2 Maldaner et al. (2018)
2̅ ± 6. ,. 27.9 ± 0.4
Cattle slurry March 28.6 Maldaner et al. (2018)
April 28.2 Husted (1994)
April 30.1 Elsgaard et al. (2016)
July 29.3 Husted (1994)
September 29.6 Maldaner et al. (2018)
2̅ ± 6. ,. 29.2 ± 0.1
Pig slurry January 30.4 Sharpe et al. (2002)
April 31.1 Husted (1994)
May 29.2 Sharpe et al. (2002)
July 30.8 Husted (1994)
August 30.0 Sharpe et al. (2002)
2̅ ± 6. ,. 30.3 ± 0.4
In equation (2), lnA is related to degradable VS. Only few studies report the amount of VS (organic dry
matter) in the stored slurry, and, unfortunately, no studies have determined the fraction of degradable
VS, VSd. As an alternative, it is possible to calculate an lnA value based on total VS, in the following
referred to as lnA’. The parameter lnA’ is more dynamic than lnA, since lnA’ changes with the residual
pool of degradable VS. This calculation practice made it possible to analyse data from the few studies
which had information about storage temperature and volume of VS in the slurry. From those studies,
we calculated lnA’ values with reference to total VS (Table 3.1). The values represent untreated cattle
slurry and pig slurry, and digestate (livestock slurry co-digested with other biomasses). Two of the studies

24
were annual studies, and here two months with relatively low and high methane emissions, respectively,
were randomly selected for this compilation.
Figure 3.1 Average lnA’ values for biogas slurry, cattle slurry and pig slurry calculated from observa-tions in selected studies (Table 3.1).
Figure 3.1 shows a clear difference in lnA’ for biogas slurry, cattle slurry and pig slurry. The associated
theoretical methane production potentials may be compared after back-transformation, i.e. exp(lnA’).
Thus, the values in Table 3.1 correspond to methane production potentials of digestate being about
70% lower compared with untreated cattle slurry, and about 90% lower compared with untreated pig
slurry. Measured against a mixture of cattle and pig slurry, the potential for methane production in
digestate is 85% lower. This agrees with the assumption that 90% of degradable VS is degraded dur-
ing the biogas treatment (Section 3.3).
With access to lnA’ estimates for outdoor storage, it was decided to base the methane emission cal-
culations for scenarios with and without biogas treatment on total VS. In the analysis, also the lnA
values for slurry collected in housing (Petersen et al., 2016) were converted to lnA’. For pig slurry, lnA’
is 30.6 g CH4 kg-1 VS h-1, whereas lnA’ for cattle slurry is 30.1 g CH4 kg-1 VS h-1. Calculations were
made to confirm that methane emissions based on lnA’ with reference to total VS were identical to
the calculation based on lnA with reference to VSd + 0.01VSnd (equation 1).
3.1.2 Deep litter and biowaste
During storage of solid manure, there will be a degradation of organic matter in the heap that is often
associated with increasing temperatures and emissions of ammonia (NH3), nitrous oxide and me-
thane. The air exchange through the heap is essential for the extent and composition of gaseous
emissions, and high air exchange rates contribute to intense biological degradation and resulting
heat production. In the warm core of manure heaps, oxygen is often depleted, and the transformation
Cattle slurry Pig slurry Biogas slurry
lnA’ (calculated from total VS) G
CH4 k
g-1 V
S ho
ur-1

25
of organic matter under anaerobic conditions may result in production of methane, which is trans-
ported to the surface and surroundings. The following describes the processes occurring in heaps of
solid manure, and based on this emissions of the three gases mentioned are estimated.
Figure 3.2 Temperature in manure heaps with A) Temperature measured at the centre of heaps con-taining different types of solid manure; solid pig manure containing straw, and semi-solid cattle ma-nure (Petersen et al., 1998); solid cattle manure, untreated, compacted and covered with plastic cov-ering (Chadwick, 2005); fibre fraction from digestate, untreated and covered with plastic (Hansen et al., 2006). B) The temperature in the middle of the stack as a function of the density of solid manure and biomasses (Bernal et al., 2017).
According to legislation, heaps of solid manure or deep litter must be covered until application, but if
the heap is not covered and porous enough to ensure a high air exchange, the temperature in the
core increases to 60-70°C in the centre (Figure 3.2A), while large amounts of CO2 produced by aer-
obic microorganisms are emitted. The temperature is not evenly distributed in the heap, and, typically,
the temperature is low at the bottom and then increases to a maximum in the centre followed by a
decrease towards the surface, which is cooled by the surrounding air.
In a Danish study (Figure 3.2), the temperature was high in heaps with straw-rich pig manure and low
in heaps with cattle manure (Petersen et al., 1998). The cattle manure contained lower amounts of
bedding material than the pig manure and was not porous, and the air exchange was probably
modest. Heaps of cattle deep litter, on the other hand, are porous and the temperature can quickly
rise over time during storage. Reducing the air exchange by compaction or coverage can counteract
the temperature increase by limiting the supply of air containing oxygen (Chadwick, 2005).
A) B)
0.2 0.6 0.5 0.3 0.4 0.7 0.8
Pigs (Petersen et al. 1998) Cattle (Petersen et al. 1998) Cattle (Chadwick 2005) Cattle compacted (Chadwick 2005) Fibre fraction (Hansen et al. 2006) Fibre fraction covered (Hansen et al. 2006)
Untreated heaps Reduced air supply
Tem
pe
ratu
re, °
C
Tem
pe
ratu
re, °
C
Days from heap establishment Density, Tonne m-3
26
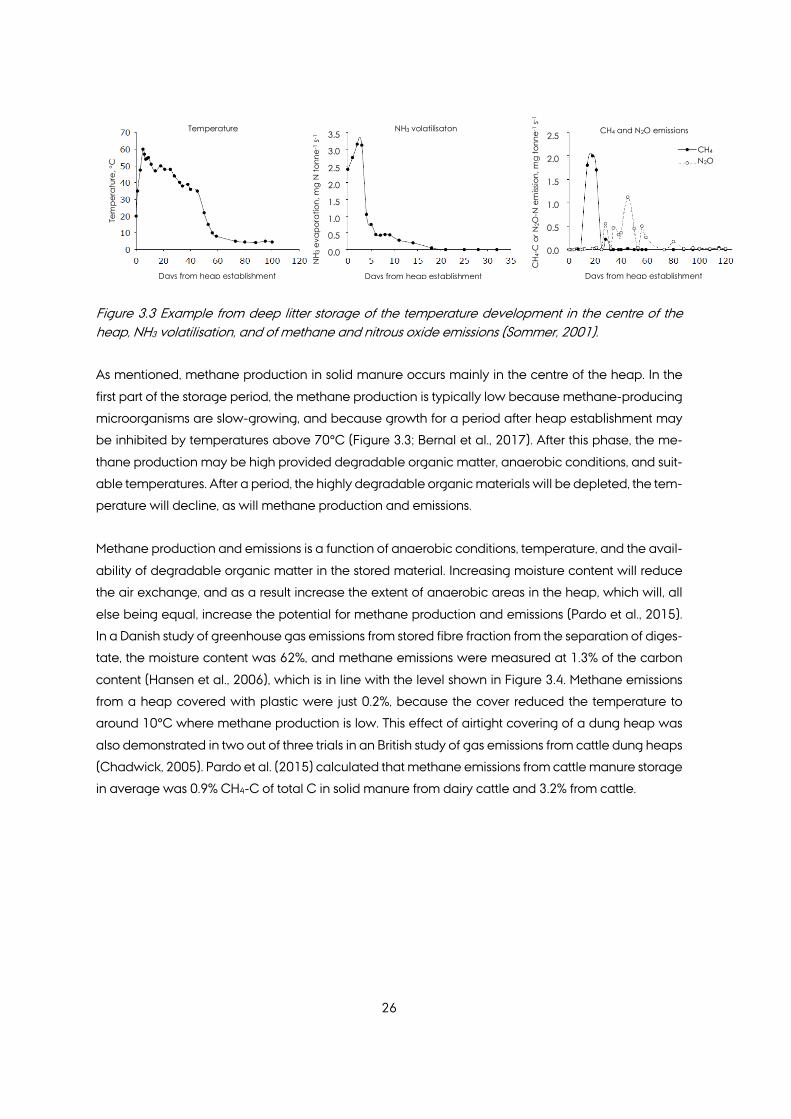
Figure 3.3 Example from deep litter storage of the temperature development in the centre of the heap, NH3 volatilisation, and of methane and nitrous oxide emissions (Sommer, 2001).
As mentioned, methane production in solid manure occurs mainly in the centre of the heap. In the
first part of the storage period, the methane production is typically low because methane-producing
microorganisms are slow-growing, and because growth for a period after heap establishment may
be inhibited by temperatures above 70°C (Figure 3.3; Bernal et al., 2017). After this phase, the me-
thane production may be high provided degradable organic matter, anaerobic conditions, and suit-
able temperatures. After a period, the highly degradable organic materials will be depleted, the tem-
perature will decline, as will methane production and emissions.
Methane production and emissions is a function of anaerobic conditions, temperature, and the avail-
ability of degradable organic matter in the stored material. Increasing moisture content will reduce
the air exchange, and as a result increase the extent of anaerobic areas in the heap, which will, all
else being equal, increase the potential for methane production and emissions (Pardo et al., 2015).
In a Danish study of greenhouse gas emissions from stored fibre fraction from the separation of diges-
tate, the moisture content was 62%, and methane emissions were measured at 1.3% of the carbon
content (Hansen et al., 2006), which is in line with the level shown in Figure 3.4. Methane emissions
from a heap covered with plastic were just 0.2%, because the cover reduced the temperature to
around 10°C where methane production is low. This effect of airtight covering of a dung heap was
also demonstrated in two out of three trials in an British study of gas emissions from cattle dung heaps
(Chadwick, 2005). Pardo et al. (2015) calculated that methane emissions from cattle manure storage
in average was 0.9% CH4-C of total C in solid manure from dairy cattle and 3.2% from cattle.
Temperature NH3 volatilisaton CH4 and N2O emissions
CH4
N2O
Tem
pera
ture
, °C
NH 3
eva
pora
tion,
mg
N to
nne-
1 s-1
CH 4
-C o
r N2O
-N e
miss
ion,
mg
tonn
e-1 s
-1
Days from heap establishment Days from heap establishment Days from heap establishment
3.5
3.0
2.5
2.0
1.5
1.0
0.5
0.0
2.5
2.0
1.5
1.0
0.5
0.0

27
Figure 3.4. (A) Nitrous oxide emissions from heaps of livestock manure as a function of density, and (B) methane emissions from heaps of organic waste as a function of moisture content (Bernal et al. 2017).
3.1.3 Principles for calculating methane emissions in scenarios
A separate calculation of methane emissions from housing and storage has been made for with the
purpose to estimate annual methane emissions. It is difficult to estimate the amount of slurry in the
storage tank because of the addition and removal of slurry in different periods, and it was not possible
to use information from Denmark's national inventory report, which is based on statistical information.
Instead, a simplified approach was used, which assumes that untreated slurry and slurry supplied to
biogas plants are collected in animal houses during 30-40 days. Transfer to the storage tank takes
place 10 times distributed over the year, starting on 1 June (up to 325 days with emptying in April).
The amount of VS exported (corresponding to the average amount and composition of VS during the
collection period) has been calculated by Møller (personal communication). Based on Mikkelsen et
al. (2016), the average retention time in the housing was set at 20 days for cattle and 19 days for pigs.
The temperature of slurry in the housing was set at 13.8�C for cattle and 18.6�C for pigs (Gyldenkærne,
personal communication).
In the outdoor storage tank, the temperature of untreated slurry and digestate was calculated based
on monthly mean temperatures as in Mikkelsen et al. (2016). Using total VS exported from the house,
or total VS in digestate, as starting value, the amount of VS remaining in the storage tank was then
calculated with daily time steps. As mentioned, separate values of the parameter lnA’ for cattle slurry,
pig slurry and digestate were used.
Estimation of VS degradation assumes that the ratio of methane to the total carbon loss, mainly in the
form of methane and CO2, is known. During anaerobic digestion, methanogenesis is the main deg-
radation pathway, and the methane share is 55-65% (Triolo et al., 2011). During outside storage the
A) B)
Untreated heap Reduced air change
Moisture content, % Density, ton m-3
Met
hane
em
issio
n C
H4-
C %
of t
ota
l C
Nitr
ous o
xide
emiss
ion,
N
2O -
N %
of T
ota
l N
3.0
2.5
2.0
1.5
1.0
0.5
0.0 0.0 0.2 0.6 0.4 0.8 1.0

28
temperature is lower, and the share of methane is often considerably lower than 60%; Petersen et al.
(2016) quoted studies with values of 10%-30%. However, one study found that the share of methane
gradually increased from 8% to 43% during the period from May to November (Leytem et al., 2011).
The present analysis assumes that loss of carbon in the form of methane accounts for a constant share
of 25% of the total carbon loss from the degradation of VS in untreated slurry, and 10% in digestate
(Mikkelsen et al., 2016), whereas the carbon content in VS is set at 45% (Petersen et al., 2016). The
potential error resulting from the uncertainty regarding the CH4:CO2 ratio is assessed in the next sec-
tion.
For deep litter, Nielsen et al. (2019), with reference to IPCC (2006), recommend an MCF (methane
conversion factor) for housing and storage of 3% if manure is collected in housing for up to a month
between removals, and 17% for deep litter collected in housing over a longer period of time (Table
3.2). This translates to 0.005 and 0.027 kg CH4 kg-1(VS), respectively (equation 3), and corresponds to
0.01 and 0.054 kg CH4 kg-1(C). If it is further assumed that half of the emissions come from the storage
tank, this corresponds to between 0.005 and 0.027 kg CH4 kg-1(C) (Table 3.2) which is in line with the
results from a Danish study of methane emissions from deep litter (Sommer, 2001).
Methane emission factors (EF, kg CH4 kg-1(VS)) are calculated using the IPCC tier 2 model:
EF = BMP × MCF × 0.67 (3)
where BMP is the biochemical methane production potential (m3 CH4 kg-1(VS)), and MCF (%) is a
methane conversion factor.
We expect that the upper IPCC level is representative for the use of deep litter under Danish condi-
tions, i.e., with a relatively long retention time in the house. Emissions from the subsequent outside
storage of deep litter in heaps without cover can, therefore, be estimated at 0.027 kg CH4 kg-1(C).
This is in line with emissions corresponding to 0.01-0.03 kg CH4 kg-1(C), which were calculated by
Pardo et al. (2015) as an average for dairy cattle manure and all categories of solid cattle manure,
respectively.
In Denmark, however, deep litter heaps must be covered, and as mentioned, this reduces the tem-
perature increase and risk of methane production. Considering the numerous uncertainties, we esti-
mate that covering will cut the methane emissions from deep litter heaps by half, and this loss is
therefore estimated at 0.015 kg CH4 kg-1(C), or 0.0075 kg CH4 kg-1(VS) (Table 3.2).
In connection with composting, the heap is actively aerated or turned, which reduces the extent of
anaerobic areas and increases the temperature. In connection with the composting of organic waste,
Pardo et al. (2015) found methane emissions corresponding to 2.7% of the carbon content. If the same

29
C:VS ratio is assumed in organic waste as in deep litter, these emissions correspond to 1.4% of the VS
(Table 3.2).
Table 3.2. Emission factors for methane (CH4) and nitrous oxide (N2O) from deep litter in housing and storage facilities (IPCC 2006), as well as emission factors used for outside storage in this report.
Categories Methane Nitrous oxide
IPCC (housing and storage)
MCF (% of BMP) kg CH kg-1 (VS) % of total N
<1 month collection in housing, fol-lowed by outside storage in heaps
3 0.005 1
>1 month collection in housing, fol-lowed by outside storage in heaps
17 0.027 1
This analysis (stor-age)
kg CH kg-1 (VS) % of total-N
Storage in heaps, covered 0.0075 0.5
Composting 0.014 2.2
3.1.4 Calculations of methane from stored biomasses
Using the methodology described above, methane emissions have been calculated for the reference
and biogas scenarios (Figure 3.5). Regardless of the scenario, a significant reduction in the emission
of methane was calculated, which varied between 41% and 56%, Please note that the reductions in
total greenhouse gas emissions, which include contributions from nitrous oxide, are significantly lower
(see Section 3.2.5).

30
Figure 3.5 Methane emissions from housing and storage for reference and biogas scenarios. The model plants are 1a: slurry and deep litter, 1b: slurry and straw, 2: slurry, deep litter, and maize silage, 3: slurry, deep litter, and organic waste, 4: slurry, deep litter, organic waste, and organic grass-clover.
3.1.5 Sensitivity assessment of assumptions regarding VS degradation
In the model calculations, the VS degradation was estimated based on an anticipated proportion of
carbon lost in the form of CH4 to CO2, a ratio which is subject to large uncertainty. In the scenario
calculations, the share of methane for untreated slurry and biomass is set at 25%, corresponding to
75% of the carbon in VS being decomposed to CO2, while the share of methane for digestate is set
at 10%.
The importance of the ratio of CH4 to CO2 on methane emissions was studied in a sensitivity analysis,
which looked into the effects of reducing by half, or doubling, the expected share of methane. The
deviations are shown in Table 3.3. Untreated pig slurry was most sensitive to the assumption regarding
methane share, with 19% lower methane emissions if the assumed methane share was reduced by
half, and a 13% increase if the assumed methane share was doubled. All other relative errors were
less than 10%. Based on this, we conclude that the potential error resulting from an incorrect estimate
with regard to the ratio of CH4 to CO2 is minor.
Table 3.3. Sensitivity analysis of the CH4 share of the carbon loss (halving or doubling) for the total methane emissions from in-house and outside storage (relative differences where the model results are set at 1.0).
Untreated Digested
CH4 share Cattle Pig CH4 share Cattle Pig
12.5% 0.92 0.81 5% 0.92 0.92
25% 1.00 1.00 10% 1.00 1.00
50% 1.03 1.13 20% 1.04 1.05
2.5
2.0
1.5
1.0
0.5
0.0
Scenario
Reference
Biogas
kg C
H4 p
er to
nne
of b
iom
ass
31
One reason why an increasing share of methane does not lead to a corresponding increase in me-
thane production is that methane production in the livestock house was constant (since it was based
on experimental data). With a 50% share of CH4 instead of 25%, the calculated VS degradation in the
house will, therefore, be halved compared to a 25% CH4 share. This in turn moves more of the VS
degradation to the storage tank where the storage tank is lower temperatures than inside the house,
and this counteracts the effect of an increased share of methane.
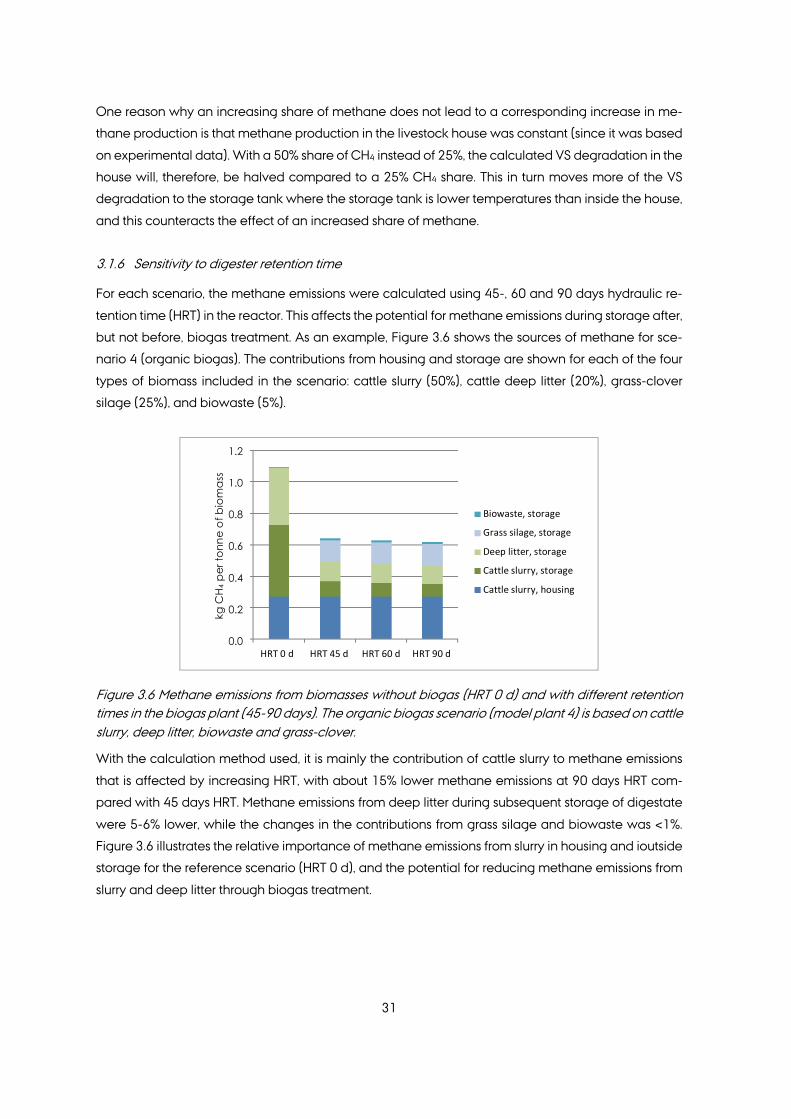
3.1.6 Sensitivity to digester retention time
For each scenario, the methane emissions were calculated using 45-, 60 and 90 days hydraulic re-
tention time (HRT) in the reactor. This affects the potential for methane emissions during storage after,
but not before, biogas treatment. As an example, Figure 3.6 shows the sources of methane for sce-
nario 4 (organic biogas). The contributions from housing and storage are shown for each of the four
types of biomass included in the scenario: cattle slurry (50%), cattle deep litter (20%), grass-clover
silage (25%), and biowaste (5%).
Figure 3.6 Methane emissions from biomasses without biogas (HRT 0 d) and with different retention times in the biogas plant (45-90 days). The organic biogas scenario (model plant 4) is based on cattle slurry, deep litter, biowaste and grass-clover.
With the calculation method used, it is mainly the contribution of cattle slurry to methane emissions
that is affected by increasing HRT, with about 15% lower methane emissions at 90 days HRT com-
pared with 45 days HRT. Methane emissions from deep litter during subsequent storage of digestate
were 5-6% lower, while the changes in the contributions from grass silage and biowaste was <1%.
Figure 3.6 illustrates the relative importance of methane emissions from slurry in housing and ioutside
storage for the reference scenario (HRT 0 d), and the potential for reducing methane emissions from
slurry and deep litter through biogas treatment.
kg C
H4 p
er to
nne
of b
iom
ass
1.2
1.0
0.8
0.6
0.4
0.2
0.0
Biowaste, storage
Grass silage, storage
Deep litter, storage
Cattle slurry, storage
Cattle slurry, housing
HRT 0 d HRT 45 d HRT 60 d HRT 90 d

32
The overall effect of increasing HRT from 45 days to 60 or 90 days on methane emissions during
storage (housing and storage facility) is shown in Figure 3.7. The effects of HRT on methane emissions
are very limited, with 2-3% lower greenhouse gas emissions at 90 days compared with 45 d.
Figure 3.7 Total emissions of methane during storage before and after biogas treatment at hydraulic retention times (HRT) of 45, 60 and 90 days. The model plants are 1a: slurry and deep litter, 1b: slurry and straw, 2: slurry, deep litter, and maize silage, 3: slurry, deep litter, and organic waste, 4: slurry, deep litter, organic waste, and organic grass-clover.
3.2 Nitrous oxide from storage and after application
Gaseous nitrogen losses during the biogas treatment process can largely be avoided, but the net
mineralisation of organically bound nitrogen will typically results in a higher ammonium content than
the substrates fed to the reactor. This ammonification process increases the risk of subsequent am-
monia loss (see Section 5.1), but ammonium (ammonia) can also be transformed via nitrification and
subsequent denitrification. Denitrification is the most important source of nitrous oxide, but this process
also depends on degradable VS as energy and carbon source, a substrate which is reduced following
biogas treatment. Nitrous oxide may be emitted from slurry and digested slurry during storage and
after application to cropland.
During storage of solid manure, organic matter will be degraded in the heap and may result in in-
creasing temperatures and associated emissions of ammonia, free nitrogen (N2), nitrous oxide and
methane. Production of nitrous oxide is linked to the oxidation of ammonia to nitrate (nitrification) and
subsequent reduction of nitrate to free nitrogen (denitrification) under aerobic and anaerobic condi-
tions, respectively (Box 3.1).
Solid manure heaps have a high availability of oxygen in the outer layers, whereas the gas phase in
the centre can be oxygen-free, or almost oxygen-free, because the oxygen supply is consumed more
kg C
O2-
eq p
er to
nne
of b
iom
ass
HRT 45 d
HRT 60 d
HRT 90 d

33
quickly by aerobic microorganisms than the oxygen can enter the inner parts of the heap. The con-
ditions for transport of nitrate in solid manure are poor, and, therefore, nitrous oxide is likely to form
near the surface of the deep litter, in oxygen-deficient niches where there is close physical contact
between nitrification and denitrification zones. From there, the nitrous oxide formed can be trans-
ported via air-filled pores to the surface and into the atmosphere (Bernal et al., 2017).
Box 3.1.Processes in the bioconversion of mineral nitrogen relevant for nitrous oxide emissions.
Nitrification: A two-step aerobic process where ammonia (NH3) via nitrite (NO2) is converted into
nitrate (NO3). Nitrous oxide (N2O) can be formed during nitrification under special circumstances,
such as oxygen limitation.
Denitrification: A step-wise reduction of NO3 via NO2, NO and N2O to free nitrogen (N2). In this pro-
cess, N2O is a free intermediate product that may accumulate under oxygen-limited (but not oxy-
gen-free) conditions, because oxygen inhibits the last step in the reduction process.
3.2.1 Storage of slurry and digestate
Nitrous oxide emissions during slurry storage depend on the formation of a surface crust where pop-
ulations of nitrifying and denitrifying bacteria can grow. Surface crusts are not formed in slurry pits,
and nitrous acid emissions from animal houses are instead expected to come from soiled surfaces. In
small-scale experiments, Misselbrook et al. (2005) found that dry matter content is important for how
fast a surface crust develops. However, a more recent study of practical storage tanks (Smith et al.,
2007) showed less clear results. All else being equal, degradation of organic dry matter in slurry
should reduce the potential for supernatant development during subsequent storage, because gas
production in the liquid phase is usually important for the buoyancy of the surface crust (Ottosen et
al., 2009). On the other hand, biogas plants increasingly use high-fibre biomasses, such as deep litter
and maize silage that can contribute to formation a crust on the stored digestate. In the following it is
assumed that there is no difference in the potential for crust formation during storage of untreated
slurry compared to digestate.
The IPCC guidelines suggest an emission factor for storage tanks with a surface crust of 0.5%, i.e., 0.5%
of total N entering the storage tank is converted to N2O (IPCC, 2006). Danish pilot-scale measure-
ments indicated lower emissions, 0.2-0.4% (Petersen et al., 2013), but the level of emissions will be
influenced by climatic conditions, especially the water balance (Sommer et al., 2000). Regardless of
biogas treatment, however, methane dominates the greenhouse gas balance of slurry storage tanks
(Baral et al., 2018). Without a surface crust, IPCC sets the emission factor for N2O at 0 for both un-
treated slurry and digestate, and the emissions of N2O during storage are, therefore, expected to vary
between 0 and 0.5% of total N.

34
3.2.2 Deep litter storage
Production and emissions of nitrous oxide from porous heaps are limited (Figure 3.4). This can be
interpreted as a result of high oxygen availability, but high temperatures can also inhibit nitrification
and denitrification. For compacted heaps, nitrous oxide emissions vary (Figure 3.4), which shows that
factors other than oxygen and temperature may be involved (Pardo et al., 2015). In a study of gase-
ous emissions from the fibre fraction after slurry separation, nitrous oxide emissions from an uncovered
heap were 5% of total N, but only 0.04% from a similar heap covered with plastic (Hansen et al., 2006).
For cattle deep litter, the IPCC N2O emission factor for housing and storage is 1% of total N, regardless
how long the deep litter remains in the house (Table 3.2). If it is assumed that half of emissions origi-
nate from outdoor storage, this is 0.5% of total N. In Danish studies of nitrous oxide emissions from
relatively small heaps, N2O-N emissions were 0.1-0.3% of total N (Sommer, 2001), whereas Pardo et
al. (2015) calculated emissions of 1.7%. The present analysis uses a value of 0.5% (Table 3.2), but we
agree with Pardo et al. (2015) that the IPCC emission factor should be further evaluated. Pardo et al.
(2015) calculated that N2O emissions from compost heaps with organic waste corresponded to 2.2%
of total N. The likely reason for the higher emissions with composting is that compost heaps are ac-
tively aerated or turned, which may ensure contact between aerobic and anaerobic zones support-
ing nitrification and denitrification, and N2O formation, in a larger proportion of the total volume.
3.2.3 Field application of slurry
Slurry is a liquid and contains carbon and nitrogen in dissolved and particulate form. In digestates a
larger proportion of nitrogen is in mineral and dissolved forms, which can potentially infiltrate the soil.
In slurry-saturated soil, the degradation of organic matter can lead to anaerobic conditions which are
favourable for denitrification (Petersen and Sommer, 2011). In practice, the distribution of slurry liquid
will depend on organic dry matter content (VS, mainly fibres), which has a high water retention ca-
pacity (Petersen et al., 2003). The distribution of liquid in the soil can, therefore, be estimated based
on the VS content of the slurry and the soil water potential (Sommer et al. 2004). If there is less VS in
digestate than in untreated slurry, it will reduce the share of nitrogen which is retained and trans-
formed in slurry-saturated soil.
Slurry environments are oxygen-deficient because of the high oxygen demand associated with the
conversion of degradable carbon in the slurry. If digestate contains less degradable carbon, then the
oxygen-deficient environment will have a shorter lifespan. This in turn may reduce the risk of nitrous
oxide emissions. Some studies have in fact found significantly lower nitrous oxide emissions from di-
gestate compared with untreated slurry (Petersen, 1999; Möller, 2015), whereas other studies did not
show such an effect (Thomsen et al., 2010). A laboratory test of two soil types found reduced nitrous
oxide emissions with biogas treatment in sandy soil, but not in clayey soil (Oenema et al., 2005). As
described above for the model plants, livestock slurry is co-digested with other biomasses, and the
resulting digestates will not necessarily contain less VS than untreated slurry.
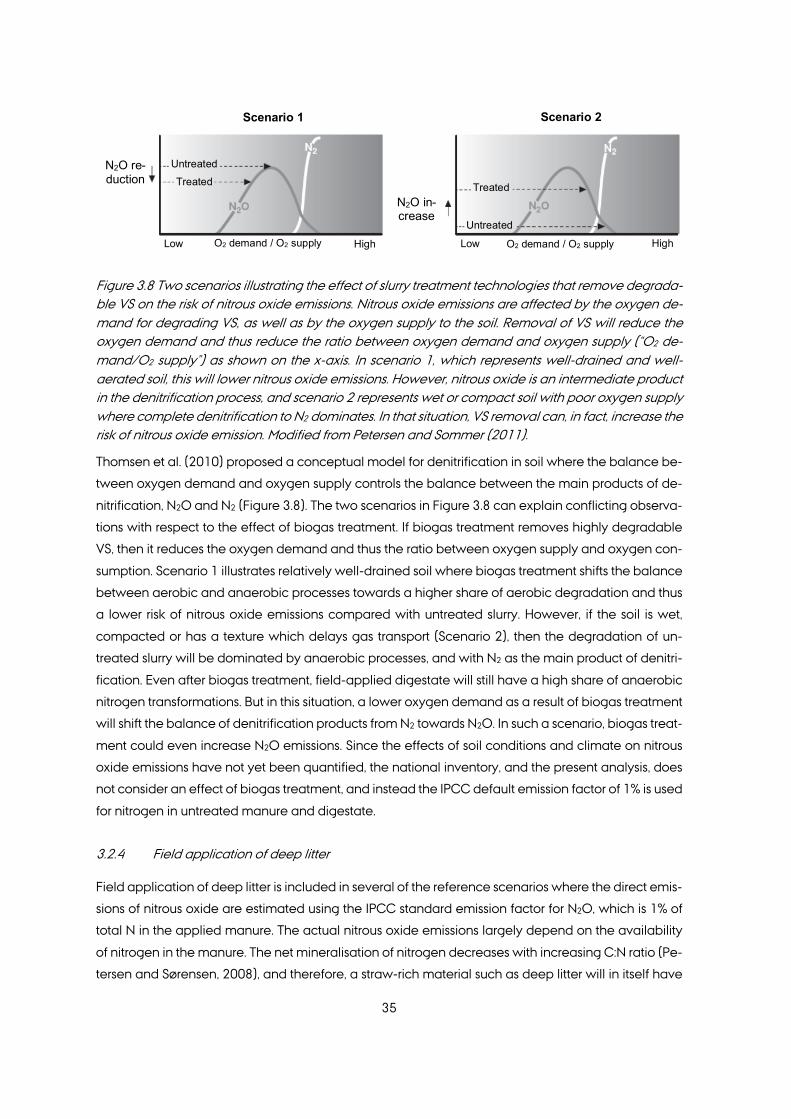
35
Figure 3.8 Two scenarios illustrating the effect of slurry treatment technologies that remove degrada-ble VS on the risk of nitrous oxide emissions. Nitrous oxide emissions are affected by the oxygen de-mand for degrading VS, as well as by the oxygen supply to the soil. Removal of VS will reduce the oxygen demand and thus reduce the ratio between oxygen demand and oxygen supply (“O2 de-mand/O2 supply”) as shown on the x-axis. In scenario 1, which represents well-drained and well-aerated soil, this will lower nitrous oxide emissions. However, nitrous oxide is an intermediate product in the denitrification process, and scenario 2 represents wet or compact soil with poor oxygen supply where complete denitrification to N2 dominates. In that situation, VS removal can, in fact, increase the risk of nitrous oxide emission. Modified from Petersen and Sommer (2011).
Thomsen et al. (2010) proposed a conceptual model for denitrification in soil where the balance be-
tween oxygen demand and oxygen supply controls the balance between the main products of de-
nitrification, N2O and N2 (Figure 3.8). The two scenarios in Figure 3.8 can explain conflicting observa-
tions with respect to the effect of biogas treatment. If biogas treatment removes highly degradable
VS, then it reduces the oxygen demand and thus the ratio between oxygen supply and oxygen con-
sumption. Scenario 1 illustrates relatively well-drained soil where biogas treatment shifts the balance
between aerobic and anaerobic processes towards a higher share of aerobic degradation and thus
a lower risk of nitrous oxide emissions compared with untreated slurry. However, if the soil is wet,
compacted or has a texture which delays gas transport (Scenario 2), then the degradation of un-
treated slurry will be dominated by anaerobic processes, and with N2 as the main product of denitri-
fication. Even after biogas treatment, field-applied digestate will still have a high share of anaerobic
nitrogen transformations. But in this situation, a lower oxygen demand as a result of biogas treatment
will shift the balance of denitrification products from N2 towards N2O. In such a scenario, biogas treat-
ment could even increase N2O emissions. Since the effects of soil conditions and climate on nitrous
oxide emissions have not yet been quantified, the national inventory, and the present analysis, does
not consider an effect of biogas treatment, and instead the IPCC default emission factor of 1% is used
for nitrogen in untreated manure and digestate.
3.2.4 Field application of deep litter
Field application of deep litter is included in several of the reference scenarios where the direct emis-
sions of nitrous oxide are estimated using the IPCC standard emission factor for N2O, which is 1% of
total N in the applied manure. The actual nitrous oxide emissions largely depend on the availability
of nitrogen in the manure. The net mineralisation of nitrogen decreases with increasing C:N ratio (Pe-
tersen and Sørensen, 2008), and therefore, a straw-rich material such as deep litter will in itself have
Scenario 1 Scenario 2
N2O re-duction
N2O in-crease
Untreated
Untreated
Treated Treated
Low Low High High O2 demand / O2 supply O2 demand / O2 supply

36
a lower risk of nitrous oxide emissions than slurry and digestate. However, if mineral fertilizers are
applied before or at the same time as the application of deep litter, this may eliminate the nitrogen
limitation and stimulate nitrous oxide emissions (Charles et al., 2017).
3.2.5 Overall greenhouse gas balance for storage and field application
Figure 3.9 shows the overall balances for methane and nitrous oxide emissions from housing, storage,
and after field application. As already described, a significant reduction in methane emissions after
biogas treatment was calculated, ranging from 41% to 56%. However, nitrous oxide is included in the
greenhouse gas balances for both reference and biogas scenarios, and no effect is assumed for bi-
ogas treatment on nitrous oxide emissions during storage or after field application; nitrous oxide emis-
sions are therefore directly related to total N in the biomasses used. In the overall greenhouse gas
balances for methane and nitrous oxide, the reductions due to biogas treatment vary between 21%
and 40% for the five scenarios.
The emission factors used for nitrous oxide are 0.5% during storage (slurry, deep litter in a covered
heap), 2.2% (biowaste, which is assumed to be composted) and 1% of total N after field application.
Only a few Danish studies have investigated these emissions. One pilot study of slurry storage (Pe-
tersen et al., 2013) found nitrous oxide emissions of 0.2-0.4% of total N for pig slurry forming a surface
crust, whereas a small number of field studies (summarised by Petersen et al., 2018) indicate an av-
erage nitrous oxide emission factor for applied fertilizer of 0.7% (95% confidence interval 0.5-0.8%).
These numbers indicate that the relative significance of nitrous oxide under Danish conditions may
be less than shown in Figure 3.9.
Figure 3.9 Total methane and nitrous oxide emissions from stored slurry and other biomasses in the reference scenarios (“Ref.”) and biogas scenarios (“Biogas”). The model plants are 1a: slurry and deep
kg C
O2-
eq p
er to
nne
of b
iom
ass
Ref. Biogas Ref. Biogas Ref. Biogas Ref. Biogas Ref. Biogas
Methane, storage Nitrous oxide, storage Nitrous oxide, field

37
litter, 1b: slurry and straw, 2: slurry, deep litter, and maize ensilage, 3: slurry, deep litter, and organic waste, 4: slurry, deep litter, organic waste, and organic grass-clover.
Denmark and large parts of Northern Europe are dominated by sandy soil types (Ballabio et al., 2016).
Based on the above considerations, the most likely outcome of biogas treatment is that nitrous oxide
emissions will tend to be lower after field application. Based on two years of field studies with sandy,
clayey soil (JB4), Petersen (1999) estimated that the effect could be in the range 20-40%, whereas a
later study with sandy, clayey soil (JB6) did not show any effect (Thomsen et al., 2010).
The IPCC calculation method is based on nitrogen, but meta-studies indicate a difference in the risk
of nitrous oxide emissions depending on the type of fertilizer (commercial fertilizer, livestock manure)
and the simultaneous application of commercial fertilizer and livestock manure (Charles et al., 2017).
Recent studies of nitrous oxide emissions under Danish conditions have concluded that the presence
of degradable organic materials, and not just N, may be an important driver of nitrous oxide emissions.
Pugesgaard et al. (2017) found that the amount of N in plant residues, and not the amount of N in
applied fertilizer, gave the best prediction of nitrous oxide emissions during the spring period. Other
studies have observed nitrous oxide emissions even in well-drained sandy soil (Nair et al., 2020), and
those studies also provide strong evidence that the degradation of organic matter creates the re-
quired anaerobic conditions which form the basis of nitrous oxide production.
Based on several studies, we find that organic materials such as crop residues and organic fertilizers,
can maintain a potential for nitrous oxide emissions under a wide range of soil conditions, which can
be ascribed to a high local oxygen demand during the degradation of newly applied organic mate-
rials (e.g., Li et al., 2016; Pugesgaard et al., 2017).
A simplified description of how dissolved organic carbon (assumed to represent degradable VS) and
N in slurry and digested biomass is distributed in soil was proposed by Petersen et al. (2003). Based
on this, Sommer et al. (2004) proposed an empirical model for estimating nitrous oxide emissions with
and without biogas treatment. In the model, the fibre fraction also plays an important role, since or-
ganic fibres have a high water retention capacity (Petersen et al., 2003) and thus retains water as
well as dissolved nitrogen and carbon compounds in slurry-saturated volumes of soil.
Biogas treatment will reduce the content of dissolved C, and that will often reduce the potential for
denitrification after field application (cf. Figure 3.8 and the related text). Depending on the biomasses
supplied to the biogas plant, the fibre content in digestate may, however, be higher than in untreated
slurry. This will, in turn, retain dissolved C and N in and around anaerobic volumes in the soil and
thereby also increase the risk of nitrous oxide emission. There is a need to characterise digestates with
regard to composition, water retention and nitrous oxide emissions under varying soil conditions. The
mentioned empirical model for nitrous oxide emissions has been improved (Baral et al., 2016), but
still has certain limitations and, for example, does not account for soil nitrate availability. For this rea-
son, an adequate basis for estimating the effect of biogas treatment on nitrous oxide emissions from
38
arable soil does not currently exist. Moreover, consideration should be given to the effect of the vari-
ous types of biomasses on the composition of the biogas slurry, and thus of the nitrous oxide emission
potential.
3.2.6 Sensitivity to the hydraulic retention time
The overall effect of increasing HRT from 45 days to 60 or 90 days on methane emissions during
storage (housing and storage facility) is shown in Figure 3.7. Contributions from nitrous oxide are de-
fined by fixed emission factors and are, therefore, not affected by HRT.
3.3 Biogas production and substitution of fossil energy
The effect of displacing fossil energy has been calculated for the different model plants at retention
times (HRT) of 45, 60 and 90 days. Furthermore, the energy balance has been calculated with and
without heat exchange. This has been done for a number of assumptions (Table 3.4).
The calculations are based on the displacement of natural gas. It is assumed that the methane sub-
stituted is of fossil origin with emissions of 0.057 kg MJ-1 (Møller et al., 2008). The plant electricity de-
mand for agitators, pumps, etc. is assumed to be covered by a mix of the Danish electricity production,
which is estimated at 0.150 g CO2 kWh-1 in 2019 based on calculations from Energinet.dk (2019).
The heat to be used for heating biomass and temperature control of reactors is produced with natural
gas since it is common practice for all biogas to be upgraded and repurchased by the plant for tax
reasons. If heat is produced with biogas, then a smaller share is left for upgrading, but the total bal-
ance will only be marginally affected if more biogas has to be upgraded and requires energy. The
electricity consumption for the biogas process is calculated as the average consumption per tonne
of biomass from 16 plants (Møller and Nielsen, 2016) and is estimated at 6.5 kWh tonne-1.

39
Table 3.4. Assumptions for biogas energy calculations.
Assumptions
Tank type Steel tank
Liquid volume 8000 m3
Approx. dimension ø16*H=20 m (H=1.25xD)
Insulation 200 mm mineral wool + trapezoidal sheet
Agitation Suspended vertical agitator(s)
Average outdoor temperature 8°C
Average biomass temperature (Møller et al., 2019) 15°C
Average temperature of biomass leaving reactor 25°C
Average temperature of biomass leaving biogas plant 20°C
Specific heat capacity for biomass (Møller et al., 2008)1 4.2 kJ K-1 kg-1 1 Cp for dry organic matter (straw, wood, etc.) is approx. 1.3 - 2 kJ K-1 kg-1. For water, it is 4.2 kJ K-1 kg-
1. As digestate contains about 90-95% water, Cp as in water is assumed for all model plants.
3.3.1 Biogas production
The methane produced is determined for each biomass, and, through modelling using the Gompertz
equation, the gas potential at a given time is calculated as follows:
7(") = 8, ∙ (1 − ,&2∙4) (4)
where M is the cumulative CH4 yield (ml g-1 VS), B0 is the theoretical CH4 yield (ml g-1 VS), k is a first-
order kinetic rate constant, and t is time. The theoretical gas potential states the theoretical CH4 yield
upon complete conversion of all organic matter and is used to determine the share of the organic
matter, which is degraded in the biogas process. The theoretical gas yield can be calculated if the
ratio C:H:N:O:S in the biomass is known, or by determining the content of the main organic compo-
nents, such as carbohydrate, protein, lipid, VFA, lignin, and glycerol. It will also be possible to estimate
the gas yield based on literature data.
The share of organic matter left after the biogas process is determined as the ratio of M at the selected
retention time to the theoretical gas yield. Calculations of CH4 emissions at storage after the biogas
process must use VSd and VSnd, which are the easily degradable and the slowly degradable fibre part
of VS. Those fractions are not known, but are estimated in Mikkelsen et al. (2016) for untreated slurry.
For other biomasses, VSd in the unconverted biomass is estimated at the amount of VS that will be
converted over 20 days in a biogas process using the Gompertz model. However, this report does not
use the division into VSd and VSnd to calculate CH4 emissions from stored slurry and digestate, as the
data basis is not adequate (see Section 3.1).

40
Figure 3.10 Methane yield of the individual biomasses as a function of time calculated using the Gompertz equation and estimated B0 and k values (Møller, 2020).
Figure 3.10 shows the methane yield as a function of retention time in the reactor. The figure shows
significant differences between biomasses with regard to how fast they are degraded and the size
of the final methane yield. The determination of how fast gas is produced is based on an estimate,
and this is a source of considerable uncertainty as it is based on laboratory studies that do not fully
reflect the process conditions in real biogas reactors, just as each biomass varies in terms of compo-
sition and quality. Furthermore, laboratory tests are often carried out separately for each biomass, but
in practice, the mixing ratios between the individual biomasses are expected to give rise to synergies
or antagonism. The degradation profiles used are essential for the determination of gas yields at dif-
ferent retention times and for how much VS are subsequently stored. This means that the degradation
profiles used influence how much gas is produced and the amount of the methane emissions during
the subsequent storage.
3.3.2 Energy balances
Figure 3.11 illustrates the energy balance for the individual model plants. Calculations are made with
and without heat exchange. The final calculations assume heat exchange at a temperature of 25°C.
In Figure 3.12, the energy balance is converted into reduced CO2 emissions provided that the CH4
Ga
s (L
CH
4/kg
VS)
Cattle slurry
Pig slurry
Cattle deep litter
Poultry manure Chickens
Grass ensilage
Maize ensilage
Straw - Wheat straw
Slaughterhouse waste
Biowaste
Glycerol
Days
600.0
500.0
400.0
300.0
200.0
100.0
0.0

41
produced substitutes natural gas. The largest reduction is seen when biomasses with straw or grass in
the mixture are used.
Figure 3.11 Energy balances for each model plant. The energy balance has been calculated with (+) and without (-) heat exchanger. The model plants are 1a: slurry and deep litter, 1b: slurry and straw, 2: slurry, deep litter, and maize ensilage, 3: slurry, deep litter, and organic waste, 4: slurry, deep litter, organic waste, and organic grass-clover.
3.4 Methane from biogas plants and upgrading plants
Methane can be emitted from different sources at the biogas plant. Sources of methane emissions
could be storage tanks for untreated biomass and digestate as well as leakages in biogas and up-
grading plants.
Ener
gy b
alan
ce (k
Wh/
tonn
es b
iom
ass)
Model plant 1 Model plant 1b Model plant 2 Model plant 3 Model plant 4 Transport
Net
Methane production for the grid
Heat for biogas plant
Electricity at biogas plant, includ-ing upgrading
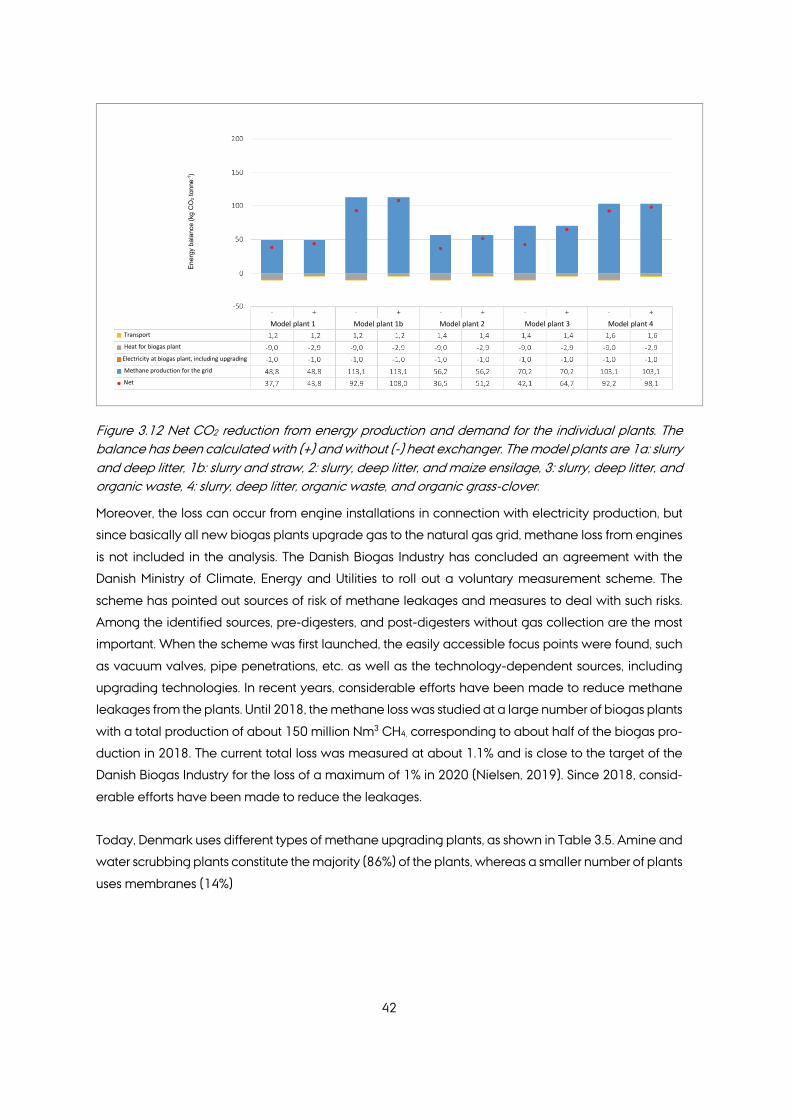
42
Figure 3.12 Net CO2 reduction from energy production and demand for the individual plants. The balance has been calculated with (+) and without (-) heat exchanger. The model plants are 1a: slurry and deep litter, 1b: slurry and straw, 2: slurry, deep litter, and maize ensilage, 3: slurry, deep litter, and organic waste, 4: slurry, deep litter, organic waste, and organic grass-clover.
Moreover, the loss can occur from engine installations in connection with electricity production, but
since basically all new biogas plants upgrade gas to the natural gas grid, methane loss from engines
is not included in the analysis. The Danish Biogas Industry has concluded an agreement with the
Danish Ministry of Climate, Energy and Utilities to roll out a voluntary measurement scheme. The
scheme has pointed out sources of risk of methane leakages and measures to deal with such risks.
Among the identified sources, pre-digesters, and post-digesters without gas collection are the most
important. When the scheme was first launched, the easily accessible focus points were found, such
as vacuum valves, pipe penetrations, etc. as well as the technology-dependent sources, including
upgrading technologies. In recent years, considerable efforts have been made to reduce methane
leakages from the plants. Until 2018, the methane loss was studied at a large number of biogas plants
with a total production of about 150 million Nm3 CH4, corresponding to about half of the biogas pro-
duction in 2018. The current total loss was measured at about 1.1% and is close to the target of the
Danish Biogas Industry for the loss of a maximum of 1% in 2020 (Nielsen, 2019). Since 2018, consid-
erable efforts have been made to reduce the leakages.
Today, Denmark uses different types of methane upgrading plants, as shown in Table 3.5. Amine and
water scrubbing plants constitute the majority (86%) of the plants, whereas a smaller number of plants
uses membranes (14%)
Ener
gy b
alan
ce (k
g C
O2 t
onne
-1)
Model plant 1 Model plant 1b Model plant 2 Model plant 3 Model plant 4 Transport
Net
Methane production for the grid
Heat for biogas plant
Electricity at biogas plant, including upgrading

43
Table 3.5. Methane upgrading plants in Denmark (Kvist, 2020).
Technology Share of capacity (%) Loss (%)
Amine 56 0.05
Water scrubber 30 1.0
Membrane 14 0.5
The methane loss varies between the different technologies, and water scrubbers have the highest
loss of about 1%. However, technologies, such as regenerative thermal oxidation (RTO), exist that can
oxidise methane, and 5 plants use this technology today. RTO plants can reduce CH4 emissions by
99.5%. The total loss from upgrading plants in Denmark is estimated by DGC (Kvist, 2020) to be about
0.3%. The Danish Energy Agency has entered into an agreement to reduce methane emissions from
Danish biogas plants via a dedicated effort headed by Ramboll in partnership with Force, Technical
University of Denmark, and the Danish Technological Institute (Nielsen, 2019). Based on current
knowledge, a total loss of 1% is estimated for the biogas plant and the upgrading plant. However,
plants that are not part of the voluntary scheme might have a higher loss. Also, water scrubber plants
would not be able to comply with an emission limit of max. 1%, unless an RTO plant is installed, as a
loss is always anticipated from the biogas plant itself in addition to the loss from the upgrading.
Table 3.6. Assumptions for biomass transport. CO2 emissions of 2.7 kg per litre of diesel are assumed.
Biomass type Category Distance km
Transport volume
tonne load-1
Diesel consump-tion
CO2 emission kg CO2
km L-1 L tonne-1 tonne-1
Cattle slurry Slurry 20 38,000 1.2 0.4 1.2
Pig slurry Slurry 20 38,000 1.2 0.4 1.2
Deep litter cattle Solid biomass 30 25,000 2.5 0.5 1.3
Poultry manure Solid biomass 30 25,000 2.5 0.5 1.3
Grass ensilage Other biomass 15 20,000 2.5 0.3 0.8
Maize ensilage Other biomass 15 20,000 2.5 0.3 0.8
Wheat straw Other biomass 20 15,000 2.8 0.5 1.3
Slaughterhouse waste Industry 50 25,000 2.5 0.8 2.2
Biowaste Industry 55 20,000 2.5 1.1 3.0
Glycerol Industry 300 35,000 2.0 4.3 11.6
3.5 Energy demand for biomass transport
The biomass added to central biogas plants is transported either in liquid or solid form. The transport
volume of the different biomasses varies, and different diesel consumption is assumed per kilometre
driven. Table 3.6 shows the assumptions for energy demand and CO2 emissions during transport. The
distances are calculated as the average additional transport compared to the situation where the

44
biomass is not supplied to biogas plants. Figure 3.13 shows the calculated CO2 emissions from
transport for the individual model plants.
Figure 3.13 CO2 emissions from biomass transport. The model plants are 1a: slurry and deep litter, 1b: slurry and straw, 2: slurry, deep litter, and maize ensilage, 3: slurry, deep litter, and organic waste, 4: slurry, deep litter, organic waste, and organic grass-clover.
3.6 Soil carbon storage
The effect of biogas treatment of slurry and other livestock manure on soil carbon storage is still rela-
tively poorly clarified, but a study based on laboratory incubation measured slightly smaller soil car-
bon storage in connection with biogas digestion (Thomsen et al., 2013). Based on Thomsen et al.
(2013), the amount of carbon digested in the biogas plant is assumed to have contributed to carbon
storage by 25% of the effect achieved from adding carbon to fresh plant material and straw, i.e., 0.25
× 15% = 3.75% of the degraded carbon in the biogas would have been stored after a 20-year period,
assuming soil storage of 15% of the carbon added from plant material over 20 years (Christensen,
2004). This shows what the carbon storage would have been had the organic material not been
degraded in the biogas plant. This results in net CO2 emissions from less soil carbon storage of 37.5
kg C, corresponding to 138 kg CO2 per tonne of C in the produced biogas (methane and CO2), or,
with a carbon content of 45% in VS, minor carbon storage of 62 kg CO2 per tonne of VS degraded in
the biogas plant. The estimates of the effect of biogas digestion on carbon storage are subject to
some uncertainty, but other studies confirm that a reduction in the amount of degradable carbon, incl.
carbohydrate added to the soil, will reduce carbon storage (Liang et al., 2018).
CO2 e
mis
sion
s (k
g to
nne-1 )
Model plant 1 Model plant 2 Model plant 1b Model plant 3 Model plant 4
1.80
1.60
1.40
1.20
1.00
0.80
0.60
0.40
0.20
0.00
1.21 1.15 1.20
1.62
1.20

45
3.7 Climate effects of using energy crops and waste for biogas
In addition to livestock manure and biowaste, the biomasses used include the following types: grass-
clover silage, maize silage, straw from winter wheat and glycerol.
For maize silage production, the alternative is assumed to be cereal production (spring barley and
winter wheat). There is no difference between cereal and maize in the effect on soil carbon storage
(Hamelin et al., 2012). Compared to spring barley and winter wheat, maize has greater average ni-
trous oxide emissions of about 0.2 kg N2O-N ha-1, and with a GWP for nitrous oxide of 298, this gives
0.19 Mg CO2-eq ha-1. A dry matter yield of 9.4 Mg ha-1 for maize is assumed (Hamelin et al., 2012).
With a dry matter content in maize ensilage of 31%, this gives an increased climate impact from
maize ensilage of 6.2 kg CO2-eq tonne-1 biomass. In principle, maize cropping for biogas will, no
matter what, reduce the extent of the cereal cropping area, and that might result in leakage effects
where cereal will have to be produced elsewhere in the world. Since the calculations in this report
only deal with emissions within the Danish territory, this effect has not been included. This is in accord-
ance with the rules in the EU's Renewable Energy Directive, where such leakage effects are not in-
cluded for any other types of biofuels, such as biodiesel from rape (Elsgaard et al., 2013). Moreover,
these leakage effects are subject to considerable uncertainty as they depend on the need for culti-
vating a new area elsewhere on the planet to compensate for the smaller area for food production
in Denmark, known as the iLUC (indirect Land Use Change) effect. This iLUC effect of maize is as-
sessed to potentially account for 2.6 tonnes CO2-eq per tonne of kernels, and translated into maize
silage, this gives about 0.9 tonnes CO2-eq per tonne of biomass (Searchinger et al., 2018). In practice,
such an iLUC effect will depend on many unknown factors, including the extent to which reduced
production resulting from a less cultivated area is replaced by greater productivity on existing agri-
cultural land and the types of land use used for cultivation. Those effects are hard to determine with
a high degree of certainty, and iLUC effects are, therefore, not included in more detail in this report.
Here, grass-clover is assumed to be produced in organic cropping systems where the alternative to
using clover grass for biogas is to use it for green manure (Brozyna et al., 2013). Grass-clover will not
be produced in greater quantities when used for biogas, and as a result, grass-clover production has
no effect on GHG emissions.
For straw, the alternative is assumed to be soil incorporation. The long-term effect of treatment of
straw in biogas plants on soil carbon storage is not experimentally known, but slightly smaller soil
carbon storage is measured in connection with anaerobic digestion in the medium term (Thomsen
et al., 2013). Based on Thomsen et al. (2013), it is assumed that in the medium term, 15% of the carbon
will be retained if straw is applied directly to the soil, whereas for digested straw, the share will be 13%
(Christensen et al., 2004; Olesen et al., 2013). For one tonne of straw with a dry matter content of 85%
and a carbon content in the dry matter of 45%, this will correspond to reduced soil carbon storage of
7.7 kg C, equal to 28.1 kg CO2.

46
Glycerol is a combustible liquid and is a by-product from the processing of animal and vegetable fats
and can be used directly for energy production (Bohon et al., 2010), but it is also a suitable product
for biogas production. The energy content is about 16 MJ kg-1 in pure form, but it is often methylated
and demethylated with an energy content of 20 and 21 MJ kg-1. In the calculations, we assume 19
MJ kg-1 (Bohon et al., 2010). The glycerol supplied to Danish biogas plants is expected to have a
content of 70% of the pure product, corresponding to an energy content of 13.3 MJ kg-1. When glyc-
erol is used directly for energy production, this corresponds to a GHG effect of 690 kg CO2 per tonne
when it substitutes natural gas for heat production. By comparison, it is expected to be able to pro-
duce 299 Nm3 methane per tonne, equal to 558 kg CO2 per tonne when natural gas is substituted by
biogas. The GHG effect of using glycerol for biogas production rather than directly for energy is, there-
fore, lower. However, it may still make sense to use glycerol for biogas production as the result is a
higher value energy form, which can be stored and converted into electricity. There are no plants
today that use large volumes of glycerol to produce energy for heat and CHP production, and in the
short term, biogas will, therefore, often be the only option. As a result, it can be difficult to use glycerol
with other energy technologies, and as long as the biogas sector has the willingness to pay, glycerol
will be used. If the biogas sector did not demand it, glycerol would be expected to be used by other
technologies for energy production.

47
4. Nitrate leaching
4.1 Effect of anaerobic digestion on nitrate leaching
During anaerobic digestion, organically bound nitrogen (N), which is, e.g., found in proteins, is miner-
alised, meaning that a larger share of N will be in mineral form and thus be available to the crop after
field application of the digested slurry. This also means that less organically bound N is left in the soil,
which could give rise to nitrate leaching in the following years as the organically bound N is mineral-
ised.
Nitrate leaching from the applied slurry during the year of application is expected to be determined
by the amount of total N applied (Sørensen and Børgesen, 2015). As a result, leaching is expected to
remain unchanged before and after digestion during the year of application, as with the current leg-
islation, the same amount of N can be applied before and after digestion of livestock manure.
However, the current regulations mean that, on average, more mineral fertiliser N can be used in in
the fertilisation plan of the farm, when the manure has been through a biogas plant (Sørensen and
Pedersen, 2020). The reason is that the N content in untreated manure is based on norm figures,
whereas the N content in the digestate, which a farm receives from a biogas plant is mostly based
on direct chemical analysis of the digestate. A more detailed analysis of fertiliser accounts prepared
at Danish biogas plants with stable production showed that, on paper, more N was supplied to the
plants than was supplied to farms as digestate. Sørensen and Pedersen (2020) calculated this reduc-
tion in N content to an average of 4.3%, but with significant variation between the biogas plants. This
has been calculated to result in increased leaching, corresponding to 0.54% of total N in the treated
fertiliser (Sørensen and Pedersen, 2020). A new statement from June 2020 shows that in 2018, the
difference between N supplied to and N leaving the biogas plant is about 10% (unpublished data).
This increases the possibilities of using mineral N fertiliser after anaerobic digestion, which largely
neutralises the calculated reduction in nitrate leaching in connection with biogas. However, this effect
is not included in the following calculations as it is relates the current rules for fertiliser accounting in
connection with biogas plants. The effect of digestion on nitrate leaching over a 10-year period has
been calculated using a simple model based on the principles applied by Sørensen and Børgesen
(2015). The calculation uses a number of assumptions:
• Leaching from applied mineral N and organic N released during the year of application is the
same as for N added with mineral fertiliser and is based on the marginal leaching calculated
using the NLES4 leaching model for a standard crop rotation (crop rotation for cattle farming as
specified by Sørensen and Børgesen (2015)). According to NLES4, this loss occurs within the first
5 years after application. On average, the recently updated NLES5 model (Børgesen et al., 2020)
calculates the same marginal leaching as the NLES4 model.

48
• The leaching from mineralised N released from year 2 and subsequent years is assumed to be
twice as large as from mineral N applied in the spring as the release takes place throughout the
year (Sørensen and Børgesen, 2015; Sørensen et al., 2019).
• Average mineralisation has been calculated and has been used for organic N in all types of
fertilisers (Figure 4.1).
Cumulative mineralisation of organic N added in slurry (average cattle and pig)
Figure 4.1 Average cumulative N mineralisation from organic N applied in livestock slurry over a 10-year period (Sørensen and Børgesen, 2015).
• The calculations of marginal leaching were made for loamy soil (JB6) with low average precip-
itation and sandy soil (JB3) with high average precipitation. An average effect has been calcu-
lated after weighting with 80% of the fertiliser applied to sandy soil with high precipitation and
20% to loamy soil with low precipitation, as about 80% of livestock manure in Denmark is applied
to sandy soils (Sørensen and Pedersen, 2020).
• Moreover, assumptions were made for the utilisation requirements for the input of organic ferti-
liser and the share of ammonium N (or immediately plant-available N) in organic fertiliser with
and without digestion (Table 4.1).
• The effect of changed ammonia loss occurring in connection with anaerobic digestion and the
following storage and application of digestate were calculated separately.
Year
Min
eral
isatio
n of
or
gani
c N (%
)

49
Table 4.1. Assumptions about ammonium-N content in biomasses before and after biogas treatment, utilisation requirements for different types of organic fertilisers and the calculated effect of digestion on the reduction of nitrate leaching from different types of fertilisers before inclusion of the effect of ammonia loss. The share of ammonium-N in organic fertilisers is based on Sørensen and Børgesen (2015) and own estimates.
Fertiliser type
Ammonium N/total N* Utilisation re-quirement, %
Reduced NO3 leaching at diges-tion
Untreated Digested % of total N kg N tonne-1
Cattle slurry 0.58 0.68 70 1.7 0.067
Pig slurry 0.79 0.90 75 1.8 0.105
Cattle deep litter 0.20 0.50 45 5.0 0.477
Poultry manure 0.50 0.80 45 5.0 0.957
Grass-clover ensilage 0.35 0.60 40 5.0 0.440
Maize ensilage 0.25 0.60 40 -19.3 -0.757
Straw 0.00 0.30 40 5.0 0.213
Stomach and intestinal content, slaughterhouse
0.25 0.60 40 5.9 0.229
Biowaste (source-sepa-rated organic household waste)
0.25 0.80 40 9.2 0.479
*For most untreated types of manures and wastes, ammonium N/total N does not state the ammo-
nium N content, but the share of total N expected to be plant-available for the first crop when used
directly as fertiliser. The reason is that the amount of organic N from manure left in the soil after the
first crop forms the basis of nitrate leaching calculations. In liquid manures (slurry), the amount of or-
ganic N left in the soil is assumed to be identical with the organic N added.
Table 4.1 shows the model-calculated effect of digestion for different types of organic fertilisers and
manures. If an energy crop such as maize silage is used, a higher amount of N will be added to the
system, which results in increased nitrate leaching (stated as a negative value in Table 4.1) The cal-
culations do not include any effect on nitrate leaching from the actual cultivation of the energy crop.
Such calculations are difficult to perform as they will depend on the substituted crop and the related
crop rotation.
4.2 Organic farming scenario
If grass-clover is used in an organic biogas plant, it is assumed that the alternative to the digestion of
harvested grass-clover is to leave the grass-clover as cut green manure directly in the field. It is as-
sumed that 35% of N in untreated grass-clover is available in the short term (Sørensen et al., 2013).
De Notaris et al. (2018) compared the leaching measured in two organic systems where cutting of
grass-clover/lucerne with re-application as green manure was compared to the harvesting of crops
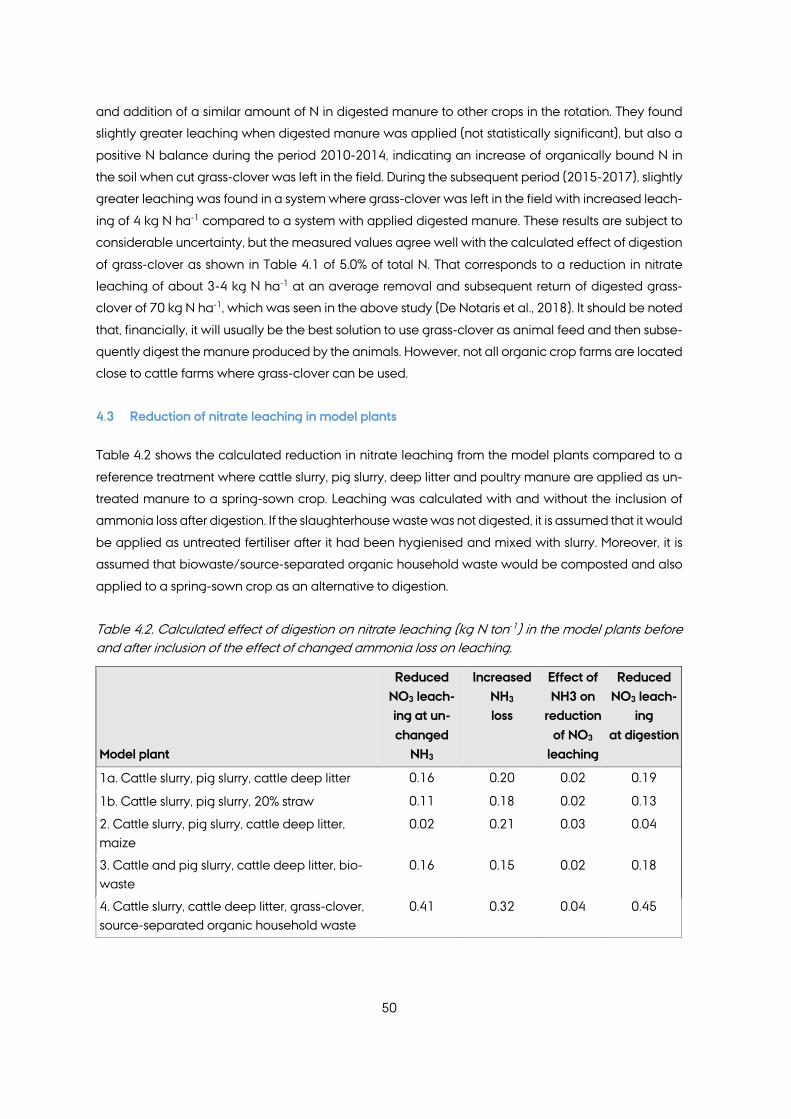
50
and addition of a similar amount of N in digested manure to other crops in the rotation. They found
slightly greater leaching when digested manure was applied (not statistically significant), but also a
positive N balance during the period 2010-2014, indicating an increase of organically bound N in
the soil when cut grass-clover was left in the field. During the subsequent period (2015-2017), slightly
greater leaching was found in a system where grass-clover was left in the field with increased leach-
ing of 4 kg N ha-1 compared to a system with applied digested manure. These results are subject to
considerable uncertainty, but the measured values agree well with the calculated effect of digestion
of grass-clover as shown in Table 4.1 of 5.0% of total N. That corresponds to a reduction in nitrate
leaching of about 3-4 kg N ha-1 at an average removal and subsequent return of digested grass-
clover of 70 kg N ha-1, which was seen in the above study (De Notaris et al., 2018). It should be noted
that, financially, it will usually be the best solution to use grass-clover as animal feed and then subse-
quently digest the manure produced by the animals. However, not all organic crop farms are located
close to cattle farms where grass-clover can be used.
4.3 Reduction of nitrate leaching in model plants
Table 4.2 shows the calculated reduction in nitrate leaching from the model plants compared to a
reference treatment where cattle slurry, pig slurry, deep litter and poultry manure are applied as un-
treated manure to a spring-sown crop. Leaching was calculated with and without the inclusion of
ammonia loss after digestion. If the slaughterhouse waste was not digested, it is assumed that it would
be applied as untreated fertiliser after it had been hygienised and mixed with slurry. Moreover, it is
assumed that biowaste/source-separated organic household waste would be composted and also
applied to a spring-sown crop as an alternative to digestion.
Table 4.2. Calculated effect of digestion on nitrate leaching (kg N ton-1) in the model plants before and after inclusion of the effect of changed ammonia loss on leaching.
Model plant
Reduced NO3 leach-ing at un-changed
NH3
Increased NH3 loss
Effect of NH3 on
reduction of NO3
leaching
Reduced NO3 leach-
ing at digestion
1a. Cattle slurry, pig slurry, cattle deep litter 0.16 0.20 0.02 0.19
1b. Cattle slurry, pig slurry, 20% straw 0.11 0.18 0.02 0.13
2. Cattle slurry, pig slurry, cattle deep litter, maize
0.02 0.21 0.03 0.04
3. Cattle and pig slurry, cattle deep litter, bio-waste
0.16 0.15 0.02 0.18
4. Cattle slurry, cattle deep litter, grass-clover, source-separated organic household waste
0.41 0.32 0.04 0.45

51
Some types of waste and biomasses would not be used on agricultural land without anaerobic di-
gestion, and this results in increased N inputs to agricultural land causing also a greater nitrate leach-
ing potential. An utilisation requirement of 40% for N in waste is included in the calculations (legislated
substitution rate related to mineral fertilisers). Other types of biomasses, such as biowaste and slaugh-
terhouse waste, can be used as fertiliser or soil improvement even without digestion (e.g., as compost
or directly after hygienisation), and this is expected to result in a reduction in long-term nitrate leach-
ing after digestion as a greater share of N is in inorganic form after digestion.
Chapter 5 calculates an increased average ammonia loss after digestion, which will have both a
direct and an indirect effect on nitrate leaching (Petersen and Sørensen, 2008). If the ammonia loss
increases, less N will be available for the crop and thereby also for leaching, and it is to be expected
that the marginal leaching from such N is the same as for other mineral N (Børgesen et al., 2020).
With the NLES5 model, average marginal leaching of 17% has been found for mineral N applied in
the spring (Børgesen et al., 2020). If it is taken into consideration that 80% of the livestock manure is
applied to sandy soil (Blicher-Mathiesen et al., 2020), the marginal leaching will, however, be slightly
greater, and can be approximated to be about 20% from ammonium N in applied livestock manure.
Such marginal leaching based on NLES5 applies for a 3-year time period. Part of the applied N is still
retained in the soil after 3 years and can be leached later. Over a 10-year period, the leaching is
expected to increase further by an average of about 2% (Sørensen et al. 2019), corresponding to a
total of 22% of the applied N. Increased NH3 loss, therefore, results in an N leaching reduction corre-
sponding to 22% of the ammonia loss (direct effect). Indirectly, a reduction in ammonia emissions will
result in smaller deposition of N in agricultural soil, forests, and nature areas. It is estimated that about
30% of the volatalized NH3 from agriculture is re-deposited in Danish soil (Hansen et al., 2008; Pe-
tersen and Sørensen, 2008). Olsen (2020) has estimated that an average of about 33% of the depos-
ited N is leached. As a result, the indirect effect of increased N loss with NH3 is increased nitrate leach-
ing of 30% x 33% = 10% of the increased N loss. The total 10-year effect of an increased NH3 loss is
reduced leaching of 22% (direct effect) less an increase of 10% (indirect effect), which results in a
total reduction in nitrate leaching of 12% of the increased N loss with NH3. This factor has been used
to calculate the total leaching reduction in Table 4.2.

52
5. Ammonia volatilization, air pollution and odour
5.1 Ammonia volatilization
Slurry from biogas plants has a higher pH value and a greater ammonium concentration (TAN) than
untreated livestock manure. In the anaerobic digestion process, the physical and chemical properties
of the slurry are changed, such as dry matter content, viscosity and certain substances, which are
converted e.g. bicarbonate, ammonium, sulphide etc. This conversion affect the ammonia volatiliza-
tion and odour emissions after application of the slurry.
5.1.1 Stored digested slurry
Today, the the national inventories of agricultural ammonia volatilization are calculated using emis-
sion factors from Hansen et al. (2008). For stored digested slurry, the calculations are based on a study
of ammonia volatilization from three storage tanks containing digested slurry from Ribe Biogas (Som-
mer, 1997). The report mentions that ammonia volatilization from stored digested slurry is affected by
the area, TAN concentration, slurry pH, temperature, and wind speed (Hansen et al., 2008). Emission
factors are stated as a percentage of the total TAN content in the slurry, which is stored in the slurry
tank for more than a year. The calculation of volatilization factor assumes that the measurements are
representative of the current composition of Danish digested slurry, storage, and climate. It is known
that the temperature of digested slurry is higher than untreated slurry (Hansen et al., 2006), which also
contributes to a higher emission factor for digested slurry than for untreated slurry (Table 5.1). In 2008,
it was assessed that 27.3% of TAN in digested slurry volatilization from uncovered storage tanks (Table
5.1), which is less than the 32% calculated in a review including studies from the US and Canada in
addition to the Danish data (Sommer et al. 2019). The difference can partly be ascribed to the fact
that Sommer et al. (2019) assume that the slurry storage tanks in Europe have an average depth of 3
m, whereas Hansen et al. (2008) assume that the depth of the storage tanks is 4 m (Poulsen et al.,
2001). If the depth of a slurry tank increases, the relative loss of ammonia from the stored slurry is
reduced, and that is reflected in a lower emission factor at increasing depth. As the ammonia volati-
lization will be the same per surface unit, regardless of the depth of a slurry storage tank, the ammonia
emission factor from a 4-metre-deep storage tank will be 0.75% of that of a 3-metre-deep storage
tank. For Danish conditions with 4-metre-deep storage tanks, the 32% should instead be 24% men-
tioned in the review of Sommer et al. (2019). This is less than assumed by Hansen et al. (2008), but
within the uncertainty range calculated for the emission factor by Sommer et al. (2019).
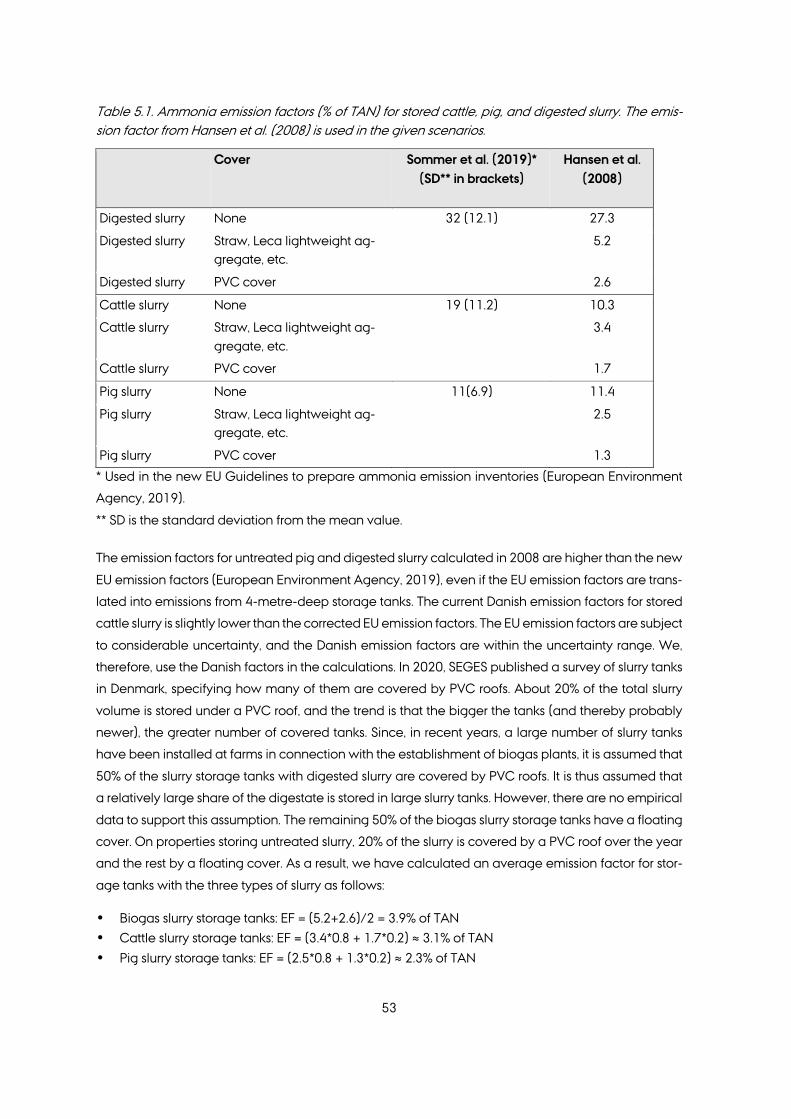
53
Table 5.1. Ammonia emission factors (% of TAN) for stored cattle, pig, and digested slurry. The emis-sion factor from Hansen et al. (2008) is used in the given scenarios.
Cover Sommer et al. (2019)* (SD** in brackets)
Hansen et al. (2008)
Digested slurry None 32 (12.1) 27.3
Digested slurry Straw, Leca lightweight ag-gregate, etc.
5.2
Digested slurry PVC cover 2.6
Cattle slurry None 19 (11.2) 10.3
Cattle slurry Straw, Leca lightweight ag-gregate, etc.
3.4
Cattle slurry PVC cover 1.7
Pig slurry None 11(6.9) 11.4
Pig slurry Straw, Leca lightweight ag-gregate, etc.
2.5
Pig slurry PVC cover 1.3
* Used in the new EU Guidelines to prepare ammonia emission inventories (European Environment
Agency, 2019).
** SD is the standard deviation from the mean value.
The emission factors for untreated pig and digested slurry calculated in 2008 are higher than the new
EU emission factors (European Environment Agency, 2019), even if the EU emission factors are trans-
lated into emissions from 4-metre-deep storage tanks. The current Danish emission factors for stored
cattle slurry is slightly lower than the corrected EU emission factors. The EU emission factors are subject
to considerable uncertainty, and the Danish emission factors are within the uncertainty range. We,
therefore, use the Danish factors in the calculations. In 2020, SEGES published a survey of slurry tanks
in Denmark, specifying how many of them are covered by PVC roofs. About 20% of the total slurry
volume is stored under a PVC roof, and the trend is that the bigger the tanks (and thereby probably
newer), the greater number of covered tanks. Since, in recent years, a large number of slurry tanks
have been installed at farms in connection with the establishment of biogas plants, it is assumed that
50% of the slurry storage tanks with digested slurry are covered by PVC roofs. It is thus assumed that
a relatively large share of the digestate is stored in large slurry tanks. However, there are no empirical
data to support this assumption. The remaining 50% of the biogas slurry storage tanks have a floating
cover. On properties storing untreated slurry, 20% of the slurry is covered by a PVC roof over the year
and the rest by a floating cover. As a result, we have calculated an average emission factor for stor-
age tanks with the three types of slurry as follows:
• Biogas slurry storage tanks: EF = (5.2+2.6)/2 = 3.9% of TAN
• Cattle slurry storage tanks: EF = (3.4*0.8 + 1.7*0.2) ≈ 3.1% of TAN
• Pig slurry storage tanks: EF = (2.5*0.8 + 1.3*0.2) ≈ 2.3% of TAN

54
5.1.2 Stored deep litter
Deep litter from cattle is used in several of the model plants. The reference situation for such deep
litter is storage in a plastic-covered heap. Ammonia volatilization from a dung heap is controlled by
the ammonium (TAN) content, pH, temperature, and airflow. The total ammonia volatilization will
depend on the ratio of carbon to nitrogen (C:N ratio) and the degradability of the organic material
and, to a considerable extent, on whether the heap is covered or not, i.e., whether the air change is
reduced to almost zero as would be the case with a tight cover. On the one hand, a high supply of
straw in the housing will increase the porosity and temperature of the heap facilitating ammonia
volatilization and, on the other hand, contribute to a high C:N ratio and conversion of TAN into organic
matter (Webb et al., 2012). Ammonia volatilization is variable, but an average of known measure-
ments can be found in Sommer et al. (2019) and Pardo et al. (2015), who show that the calculated
emission factors are higher than the Danish emission factors for cattle deep litter (Table 5.2). The dif-
ference can, among other things, be ascribed to the fact that Hansen et al. (2008) used emission data
from solid dung (solid manure), and solid dung has a modest content of litter, and ammonia volati-
lization from solid dung heaps is, therefore, low. Low ammonia emissions from cattle dung heaps
have also been measured (Petersen et al., 1998). Based on measurements of ammonia volatilization
from deep litter heaps (Table 5.2), it is recommended to use an emission factor of 18% of the total N
if the heap is not covered. If the heap is covered, volatilization is considerably reduced (Hansen et al.,
2008; Pardo et al., 2015).
A study of ammonia loss from deep litter heaps has recently been initiated, and until data are avail-
able, the emission factors calculated by Hansen et al. (2008) will be used. According to legislation,
the heaps must be covered, and the calculations assume that ammonia emissions are 3% of the am-
monium (TAN) in the stored deep litter (Hansen et al., 2008), although this value is lower than stated
in other references (Table 5.2). The difference is assumed to be the effect of covering the heaps.
Table 5.2. Ammonia volatilization from solid manure storage tanks.
Fertiliser type Reference NH3 volatiliza-tion % of TAN
NH3 volatiliza-tion %
of total N
Cattle dung (manure and deep litter)
Sommer et al. (2019)* 32
Cattle deep litter Sommer et al. (2019) 85 (SD=57, n=17) 18 (SD=12, n=17)
Cattle deep litter Sommer (2001) 53 17
Cattle dung (solid manure) Chadwick (2005) 15 (SD 7, n=3) 2 (SD=2, n=3)
Cattle deep litter (Covered) Hansen et al. (2008) 3
*Partly used in the EMEP/EEA (2019) guidebook to calculate ammonia evaporation in the EU.

55
As with deep litter, considerable variation is also seen in ammonia volatilization in connection with
composting of organic waste, depending on the material, composting method, etc. (Pardo et al.,
2015). Increased supply of air by turning the compost heap or by forced aeration increases volatiliza-
tion and covering reduces it. High moisture content or high density reduces ammonia volatilization
from compost heaps (Pardo et al., 2015). The addition of straw or other organic materials with the
intention to increase the C:N ratio and porosity proved to have no effect. An explanation could be
that the effect of increased C:N ratio (potential reduction of ammonia volatilization) is compensated
by increased porosity (potential increase in volatilization). Pardo et al. (2015) calculated that ammo-
nia volatilization from organic food waste is about 21% of total N, and this emission factor is used here.
5.1.3 Stored slaughterhouse waste and biowaste
Since slaughterhouse waste mainly consists of the stomach and intestinal content from pigs, it is as-
sumed that the storage loss in the reference situation is in line with the loss from pig slurry with a cover
(floating cover), i.e., 2.3% of TAN. In order to determine the storage loss from biowaste, it is assumed
that biowaste is composted. We know that this is a “hypothetical” reference situation. The choice was
made following discussions with the expert monitoring group and supported by the fact that waste
burning is prohibited, which makes composting, however rarely used in practice, the most likely al-
ternative treatment. The volatilization of ammonia from organic waste composting varies in the same
way as the volatilization from deep litter (Pardo et al., 2015). Increased supply of air by turning the
compost heap or forced aeration increases volatilization and covering reduces it. High moisture con-
tent or high density reduces ammonia volatilization from compost heaps (Pardo et al., 2015). Their
study did not demonstrate any effect of adding straw or other organic materials with the intention to
increase the C:N ratio. One explanation could be that the effect of an increased C:N ratio (potential
reduction of ammonia volatilization) is compensated by increased porosity (potential increase in vo-
latilization). Pardo et al. (2015) calculated that the ammonia volatilization from composting organic
food waste is about 21% of total N, and we use this emission factor here.
5.1.4 Applied digested slurry
So far, it has been assumed (Hansen et al. 2008) that digested slurry has a lower dry matter content
and lower viscosity than untreated slurry and that it, therefore, infiltrates the soil faster and more effi-
ciently. This is expected to reduce the amount and period of TAN on the soil surface and thus the
potential for ammonia volatilization. Such a reduction was assumed to counterbalance the effect of
higher pH and TAN content on ammonia volatilization (Pain et al., 1990; Rubæk et al., 1996). It has,
therefore, so far been assumed that ammonia volatilization from applied digested slurry could be
calculated using the same models as for untreated slurry (Hansen et al., 2008). However, since the
1990s, there has been a change in the use of biomasses in biogas production, which has resulted in
a change in the dry matter content of the digested slurry and possibly the viscosity and "adhesiveness",
which has affected the ammonia volatilization potential from digested slurry probably being higher

56
than from untreated slurry with the same dry matter and TAN content (Dinuccio et al., 2011; Möller
and Stinner, 2009; Perschke et al., in prep).
A number of studies show that digested slurry applied to the field has a higher ammonia volatilization
potential than untreated slurry (Amon et al., 2006; Clemens et al., 2006; Dinuccio et al., 2011; Möller
and Stinner, 2009; Percshke et al., in prep; Sommer et al., 2006). The presumption is that the effect of
higher pH in biogas slurry is of greater importance for the total ammonia evaporation than the soil
infiltration rate. In a recent unpublished study, the ammonia volatilization from applied digested cat-
tle slurry was significantly higher than from untreated cattle slurry. No other substrates than cattle slurry
were added to the biogas process. The dry matter content in digested cattle slurry was 1.5% lower
than in the untreated cattle slurry, and the pH value was 0.6 units higher in the digested slurry
(Perschke et al., in prep). One explanation of the increased ammonia volatilization from digested
slurry could be the adhesive characteristics of the digested slurry, which are supposed to contribute
to slower infiltration in the soil and which are not outweighed by the effect of reduced dry matter
content. This supposedly higher "adhesiveness" must be attributable to physical/chemical changes
in the slurry properties as a result of the digestion. In connection with anaerobic fermentation of slurry
in biogas reactors, the highly degradable particles are broken down, and larger microbial flocs (fila-
ments) are formed, which contribute to a shift towards a higher share of large particles in digested
slurry compared to untreated slurry (Marcato et al., 2008). Such filaments can be assumed to contrib-
ute to the adhesiveness, and this characteristic, along with larger particles, reduces the infiltration into
the soil by blocking the soil pores. It is well known that dry matter content and viscosity greatly affect
ammonia volatilization from slurry, but it is new to include adhesiveness and change in particle size
in the assessment of the ammonia volatilization potential from applied biogas slurry.
An Austrian study looked at the application of cattle slurry and digested cattle slurry to which no bio-
masses had been added prior to digestion (Amon et al., 2006), and this study resulted in higher emis-
sions from digested cattle slurry than from untreated slurry. A study carried out in Sweden in 2019
demonstrated a higher loss of ammonia from biogas slurry (of other origins) than from untreated cat-
tle slurry despite a considerably lower dry matter content in the biogas slurry compared to the un-
treated slurry. One reason could be higher pH of the biogas slurry and also greater distribution on the
soil surface when the slurry is applied using trailing hoses (Pedersen et al., in prep). The increased
covering of the soil surface with digested slurry is a factor that has not been studied much. However,
it does undoubtedly have a major impact on the ammonia loss potential (Pedersen et al., in prep). If
pores in the soil surface are blocked as a result of, e.g., changed particle size distribution in connection
with digestion, this might result in greater cover of soil surface with slurry and thus increased ammonia
loss. The reason for the greater covering of the soil could be higher viscosity of the digested slurry
(Sommer et al., 2006).
New emission factors for ammonia from applied slurry are being prepared at Aarhus University. The
emission factors will be calculated using the statistical and mechanistic model ALFAM2 (Hafner et al.,

57
2019). The model includes the effect of slurry composition, climate, and crop height. The work is yet
to be completed, but it is assessed that the effect of digestion can be estimated based on this work.
The ALFAM2 model does not use the slurry category "digested slurry", but the effect of digestion is
estimated based on "average values" for change of pH and dry matter. The dry matter content has
generally proven not to be reduced as a result of anaerobic digestion due to the addition of dry mat-
ter-rich substrates. Based on existing studies and the ALFAM2 work, we estimate that the ammonia
volatilization from biogas slurry applied using trailing hoses and biogas injected in the grass will be
15% higher than the volatilization from untreated slurry applied in a similar manner (Tables 5.3 and
5.4). New studies will increase our knowledge of the effect of adding different substrates, but we do
not currently know how different types of substrates and the combination of slurry and other bio-
masses will affect the infiltration of slurry, which relies on viscosity, dry matter content and adhesive-
ness.
Table 5.3. Ammonia emission factors from applied cattle slurry on livestock and plant farms (Hansen et al., 2008), and estimates of the effect of anaerobic digestion on the emission factors.
Crop
Applied in month Application method
Volatilization, cattle slurry,
% of TAN
Volatilization, biogas slurry,
% of TAN
Whole-crop barley w/second-layer crop
April Injected into bare soil 2 2
Clover grass March Injected into grass 24
June Trailing hose + acid* 32 -
July Trailing hose + acid* 32 -
August Trailing hose + acid* 32 -
June Injected into grass - 37
July Injected into grass - 37
August Injected into grass - 37
Whole-crop barley w/second-layer crop
April Injected into bare soil 2 2
Maize April Injected into bare soil 2 2
* Field acidification to pH 6.4
** Biogas slurry is injected into grass as acidification is not practically possible due to extensive foam-
ing and acid consumption.
In order to deduce a weighted emission factor for ammonia evaporation following the application of
cattle slurry, it is assumed that 50% of the slurry is injected into bare soil before maize and barley
whole-crop, and that the remaining 50% is applied to grass with about half being applied in March
before the first cutting. This makes the weighted emission factor for ammonia loss from the field about
15% of TAN and 17% of TAN for digested slurry.

58
Table 5.4. Ammonia emission factors from applied pig slurry on pig and plant farms (Hansen et al., 2008), and estimates of the effect of anaerobic digestion on the emission factors.
Crop
Applied
month Application method
Crop height,
cm
Emission factor pig slurry*
% of TAN
Emission factor bio-gas slurry **
% of TAN
Winter rape August Injected into black soil 0 1 1
Winter wheat April Trailing hose 20 15 17
Winter wheat with catch crop
April Trailing hose 20 15 17
Spring barley May Trailing hose 25 13 15
Spring barley April Injected into black soil 0 1 1
*Pig slurry: TS = 38 g L-1, TAN= 3.2g N kg-1, pH= 7.3 (SEGES 2018).
**Biogas slurry: TS =45.3 g L-1, TAN=2.85 g N kg-1, pH= 7.73.
In order to calculate a weighted emission factor for pig slurry, it is assumed that 15% of the pig slurry
is applied to winter oilseed rape, while 60% is applied to winter wheat, and 25% to spring barley, half
of which is injected into bare soil. This makes the weighted emission factor for ammonia volatilization
from pig slurry applied to fields approximately 11% of TAN and for biogas slurry approximately 13%
of TAN.
Due to lack of data, the ammonia volatilization from biowaste is assumed to be in line with that from
pig slurry as much of the biowaste is stomach and intestinal content from pigs and, thus, is largely
similar to pig slurry.
5.1.5 Applied deep litter
From applied deep litter, a large share of the ammonia content in the deep litter volatilizes (Hansen
et al., 2008; Webb et al., 2012; Sommer et al., 2019). Unless rain washes ammonium into the ground
(Misselbrook et al., 2005), there is considerable volatilization of the ammonia from applied deep litter
as the liquid fraction containing ammonium does not automatically seep into the ground. Only limited
data was available when Hansen et al. (2008) estimated the emission factors from solid manure ap-
plied in the field. Martin Hansen (personal comment, 2020) stated over the phone that there in 2008
was a considerable desire for emission factors that reflected the climatic conditions of the four sea-
sons. A much larger number of studies are available today than was the case in 2008, but there is
considerable variation in the measured ammonia volatilization (Webb et al., 2012; Sommer et al.,
2019), and it is not considered appropriate to calculate emission factors that vary with the season.
Based on extracts of data from MarkOnline (SEGES' fertiliser planning tool, which is used for planning
of about 85% of all Danish fields), it is assessed that more than 90% of the deep litter produced is
applied either in the spring or autumn where the temperature does not differ too much (Petersen,
2018). It makes sense, therefore, to use the same emission factor for applied deep litter regardless of
whether the application takes place in the spring or autumn.

59
Deep litter must be incorporated into the soil immediately after application. It is not technically possi-
ble to incorporate the deep litter by ploughing at the same time as the application, and studies have
shown that, during the approximately 20 minutes where the deep litter lies exposed, before the fastest
possible ploughing, about 10% of the applied ammonium will volatalize (Hansen and Birkmose,
2005). The effect of the high loss rates immediately after application is also seen in the review article
by Webb et al. (2012). The same article also states that ammonia volatilization in the period after
ploughing was insignificant when ploughing occurred less than 4 hours after application of solid pig
manure, In consequence a maximum of 10% of the ammonia content in the applied deep litter will
volatalize if ploughing is performed quickly, i.e., within 30 minutes of application. In the reference
situation for cattle deep litter, we assume that ploughing is used for incorporation. As a result of the
variation in results from different studies, we suggest these emission factors:
• Ploughing in connection with application: 10% of TAN
• Ploughed in 1.5 hours after application: 20% of TAN
• Ploughed in 4 hours after application: 25% of TAN
• Ploughed in 6 hours after application: 30% of TAN
It is assumed that in practise an average of 4 hours will pass from application to incorporation. As a
result, the ammonia emission factor for deep litter is 25%.
The ammonia loss from applied compost is assumed to be in line with cattle deep litter.
5.2 Odour from application of slurry
It is a well-known that anaerobic digestion changes the concentration of some of the chemical com-
ponents of slurry. As a result, the concentration of most organic acids is reduced, resulting in lower
odour emissions after application of slurry (Perschke et al., in prep). As pig slurry has higher concen-
trations of organic acids than cattle slurry, it must be assumed that the effect of anaerobic digestion
is greater for pig slurry than for cattle slurry. This applies not least two to three days after application
since these are relatively less volatile gases, which volatalizes later than many of the more volatile
sulphurous compounds. Moreover, it seems that a large proportion of the very odorous compound 4-
methylphenol is transformed to methane and phenol during anaerobic digestion. The methane is
"harvested" in the biogas plant, and phenol is significantly less odorous than 4-methylphenol, which
explains why less odour was recorded in recent Danish studies (Perschke et al., in prep). It should be
emphasised that considerations are hypotheses since the odour from applied slurry has not yet been
studied in detail.
Research indicates that anaerobic digestion overall reduces odour emissions from the application of
slurry. However, it should be taken into account that, for some biogas plants, very odorous substrates
are added to the biogas process, which in some cases may result in increased odour emissions after

60
application of the biogas slurry, but no empirical studies have documented the effects of such prac-
tices.
5.3 Air pollution from transport of biomasses
In connection with biogas plants, there will be an increased transport of biomass. In that connection,
there will be air pollution in the form of NOx. The emission of NOx will depend on which European
standard the individual vehicle complies to. It is assumed that transport takes place using vehicles
that complies with the Euro 6 standard, and it is assumed that transport is a weighted average of
rural/urban driving. The calculations of NOx emissions assume that trucks are, on average, loaded
75%, and for slurry that is at the low end, whereas for other biomasses it is at the high end.
Table 5.5. Overview of nitrogen oxide emissions (NOx) from trucks calculated for Euro standard 6 (Winther, 2020).
Load (%)
Trucks - weighted average. Emission factor in NOx g per litre diesel
34-40 tonnes 40-50 tonnes
50% 1.02 0.93
75% 0.52 0.86
100% 0.82 0.79
Figure 5.1 shows NOx emissions as a result of additional transport shown for the different model plants.
NOx emissions are within the range 2.1-4.0 g tonne-1 biomass. NOx emissions per energy unit pro-
duced can be reduced by increasing the dry matter content in the slurry.

61
Figure 5.1 NOx (NO2) emissions from the transport of biomasses to different biogas model plants. The model plants are 1a: slurry and deep litter, 1b: slurry and straw, 2: slurry, deep litter, and maize ensilage, 3: slurry, deep litter, and organic waste, 4: slurry, deep litter, organic waste, and organic grass-clover.
5.4 Air pollution from upgrading
In connection with biogas upgrading, CO2 and sulphur are removed from the gas produced during
anaerobic digestion. CO2 from biogas is not considered as air pollution, whereas sulphur is a source
of air pollution as well as odour from the biogas plant. This report only focuses on the air pollution
aspect. Sulphur will mostly occur as hydrogen sulphide (H2S), and the contribution from organic sul-
phur compounds is low, but they are probably more difficult to remove than hydrogen sulphide; how-
ever, no data are currently available from biogas plants (Feilberg, 2020). Biogas plants remove sul-
phur using different technologies, most commonly before the gas is fed into the upgrading plant.
When amine plants are used for upgrading, the gas will often have a high sulphur content when it is
fed into the upgrading plant. When amine regenerates, both CO2 and hydrogen sulphide will be
present in the discharge, after which the discharge gas is purified in a biological purification unit that
removes much of the sulphur, but sulphur discharge might be seen during peak periods. This is only
supported by very limited data, but is studied in the new PEAK project (EUDP). Compared to sulphur
emissions from livestock farming in general (Feilberg, 2020), it is assessed that the share from the
actual biogas plant will be relatively limited, but this is not yet supported by data. The loss of sulphur
from the biological purification is expected to be low as the biogas plant has to meet requirements
for low odour emissions in accordance with their environmental permits, but there are examples of
problems with inadequate purification. Since no knowledge is available about the loss of sulphur in
connection with upgrading, it is not possible to determine whether biogas has a positive or negative
NOx e
mis
sion
s (g
tonn
e-1 )
Model plant 1a Model plant 2 Model plant 1b Model plant 3 Model plant 4
4.50
4.00
3.50
3.00
2.50
2.00
1.50
1.00
0.50
0.00
2.49 2.30
2.13
3.97
2.48

62
impact on sulphur loss. Further studies of the sulphur loss from the upgrading process are required to
quantify such losses. CO2 from the upgrading process is discharged to the surroundings, but it will, in
future, be possible to use it more widely for "Power to X" or to substitute CO2 in industrial applications.

63
6. Recycling and utilisation of nutrients
In connection with digestion, it is possible to achieve greater plant availability of N in slurry, provided
there is focus on avoiding increased ammonia losses. The greater fertilising effect has previously been
assessed by Sørensen and Børgesen (2015) to correspond to 0.10-0.15 kg N kg-1 total-N during the
year of application. The residual effect in the following years will, however, be lower, so the long-term
increase in fertiliser value only corresponds to 0.05 – 0.08 kg N kg-1 treated N. With the current fertiliser
regulations in Denmark, where economically optimal fertiliser standards can be used, the increased
fertilising effect is not expected to be utilised for increased yields, but may potentially be utilised by
the farmer to reduce the use of commercial fertilisers. With the current rules, such voluntary standard
reduction can be substituted by reduced use of cover crops. Basically, this means that the reduced
use of fertiliser is not translated into reduced nitrate leaching. The farmer can, however, reduce the
costs of both establishing cover crops and purchase of N fertilisers.
6.1 Organic arable cropping including digestion of grass-clover
In organic crop rotation studies, direct comparisons have been made of yields measured in a system
where grass-clover was left as green manure in the field and a cropping system with the same crops
where grass-clover was harvested and replaced with a similar addition of N in manure for cereal
crops in the crop rotation (average 70 kg N ha-1 year-1 throughout the crop rotation, Brozyna et al.
(2013)). The studies were carried out on a loamy soil at Flakkebjerg (Zealand) and sandy soil at Fou-
lum (Jutland). On average, grass-clover harvesting and re-application as fertiliser resulted in an in-
creased cereal yield of 0.6 Mg dry matter ha-1 at both locations (Shah et al., 2017), corresponding to
an increased cereal yield of 0.7 Mg ha-1 (cereal containing 15% water). This is expected to be achiev-
able for most organic arable farms. At an organic cereal price of 2 DKK kg-1, this corresponds to a
gain of 1400 DKK ha-1 distributed over the entire cultivated area.
6.2 Recirculation of nutrients from waste
The value of other nutrients, such as phosphorus and potassium, is believed to remain unchanged
after anaerobic digestion in the given scenarios as it is assumed that the alternative to the digestion
of waste is composting or similar use as fertiliser. The digestion is assessed not to impact on the long-
term availability of phosphorus and potassium. In cases where the alternative to the digestion of
waste is incineration and deposition of ash, improved utilisation of the recirculated nutrients could be
achieved by digestion.
Increased use of waste for co-substrates to biogas may also result in increased nitrate leaching, as it
results in an overall increase of N supply to the agricultural sector (Blicher-Mathiesen et al., 2020). This
report only calculates the effect of anaerobic digestion (digestion versus waste composting).

64
6.3 Utilisation and availability of sulphur in digested fertiliser
When manures and organic waste is digested, a loss of sulphur occurs, mainly in the form of hydrogen
sulphide in the biogas, and sulphur is also an important plant nutrient. Sulphur in biogas is unwanted,
and sulphur is therefore removed in gas filters. In many cases, bio-filters are used, and the output is a
liquid containing the removed sulphur in a plant-available form. Fontaine et al. (2020) found a sulphur
loss in connection with the digestion of 0-30% and a loss of around 20-30% is expected. The availa-
bility of the sulphur remaining in the fertiliser is very low, and the digestate may even cause immobi-
lisation of sulphur from the soil (Fontaine et al., 2020). Biogas plants will typically return liquid from
sulphur filters to the digested fertiliser. Such sulphur is in a plant-available form, but there is a risk that
it can be lost as hydrogen sulphide in case of long-term storage in the digestate. However, recently
completed studies indicate that the removed sulphur can be stored for at least a couple of months
without being lost and that it has the same effect as sulphur in commercial fertilisers (Fontaine et al.,
2021). It is, however, uncertain what happens to sulphur from gas filters if it is stored for many months
in the digestate.
Biogas plants should therefore show attention to how they handle material from sulphur filters. Ac-
cordingly, farmers receiving digested fertiliser should be aware of whether sulphur from the gas puri-
fication has been added to their fertiliser. There is a risk of receiving fertiliser with the very limited
fertilising effect of sulphur, which may require further addition of sulphur fertiliser.
6.4 Substitution of mineral nitrogen fertiliser
As described above, the increased fertilising effect after digestion is expected to be equivalent to
0.05-0.08 kg N kg-1 treated N in the long term (Sørensen and Børgesen, 2015). If this is translated into
a reduction in added N with mineral fertilisers of 0.05 kg N kg-1 treated N, this results in CO2 reductions
from the reduced use of fertilisers of 5.6 kg CO2 kg-1 N (Chojnacka et al., 2019), equal to 0.28 kg CO2
kg-1 treated N in the biogas plant.

65
7. Model-calculated effects of biogas scenarios
7.1 Climate effects
Table 7.1 shows a total climate effect of 65-106 kg CO2-eq per tonne of biomass input in the baseline
scenarios for model biogas plants having a retention time of 45 days. Most of the effect can be as-
cribed to the substitution of fossil energy in energy production. The differences in gas production be-
tween the biogas model plants is mainly ascribed to the volume of dry matter supplied. There are
also minor climate effects from the reduction of methane emissions during storage of slurry, deep
litter, and slaughterhouse waste. The differences between model plants are smaller when consider-
ing the climate effect per produced energy unit; here, the effects vary between 53 and 77 kg CO2-
eq per GJ gross energy. The differences in the results calculated per tonne and per GJ can mainly be
ascribed to variation in the amounts of dry matter per tonne of biomass supplied. The M1b and M4
plants are supplied with biomasses having a high dry matter content. This makes it possible to pro-
duce a high amount of energy per tonne, which, for this reason alone, contributes to a considerable
reduction in GHG emissions. In order to make the comparison independent of these differences in
dry matter content, it should be based on the GHG effect per GJ. For example, plant M1b with straw
has a significantly higher GHG effect per tonne than plant M1 with deep litter. The reason is that
considerably more dry matter is supplied to the M1b plant. If the same amount of dry matter were
supplied to M1b as with deep litter, the "straw" plant (M1b) would have a lower climate effect. This is
reflected in a lower GHG effect per GJ of straw compared to deep litter.
The model plant with the greatest effect per ton biomass (M1b) is the plant where 20% straw is added,
although with current biogas technology this option is not found to be technically feasible due to
difficulties with pumping and agitating biomass with such high dry matter content, and this plant
should, therefore, primarily be considered to represent a future scenario, which is expected to be
realised following further technological development. However, this is also the model plant with the
lowest GHG effect per unit produced energy. Among the other plants, the GHG effect is lowest for
the plant where industrial waste is added (M3), which is mainly because the glycerol would otherwise
have been used for energy. This assumption has not previously been used and is one of the reasons
why the outcome of the calculations for the "industrial waste plant" is not as good as in previous stud-
ies. The study by Nielsen et al. (2002) calculated a total GHG effect of 90 kg CO2-eq tonne-1 biomass,
which is significantly higher than calculated in this study for a plant based on livestock manure and
industrial waste.

66
Table 7.1. Calculated effects per tonne of biomass for five model plants at 45 days retention time and 1% methane leakage from the biogas plant. The model plants are 1a: slurry and deep litter, 1b: slurry and straw, 2: slurry, deep litter, and maize ensilage, 3: slurry, deep litter, and organic waste, 4: slurry, deep litter, organic waste, and organic grass-clover. Positive values indicate lower emissions and negative values indicate increased emissions from biogas.
Source M1a M1b M2 M3 M4
Energy (kg C02-eq tonne-1 biomass)
Gas for the natural gas grid 48.35 111.94 55.61 69.48 102.09
Glycerol for heating -13.80
Process energy -3.84 -3.85 -3.84 -3.84 -3.85
Transport -1.21 -1.20 -1.15 -1.62 -1.20
Fertiliser production, N 1.61 1.32 1.43 1.43 1.77
Methane leakage (kg CO2-eq tonne-1 biomass) -4.31 -9.98 -5.01 -6.19 -9.10
Methane from storage (kg CO2-eq tonne-1 biomass)* 29.58 15.09 24.24 20.78 11.19
Nitrous oxide from storage (kg CO2-eq tonne-1 biomass)* 0.00 -1.26 0.00 1.32 1.32
Nitrous oxide after field application (kg CO2-eq tonne-1 biomass) 0.00 0.00 0.00 0.00 0.00
Nitrous oxide from nitrogen leaching (kg CO2-eq tonne-1 biomass) 0.40 0.29 0.09 0.39 0.97
Nitrous oxide from ammonia vol. (kg CO2-eq tonne-1 biomass) -0.69 -0.66 -0.76 -0.51 -1.11
Nitrous oxide from maize cropping (kg CO2-eq tonne-1 biomass) 0.00 0.00 -0.74 0.00 0.00
Carbon storage (biomass for biogas) (kg CO2-eq tonne-1 biomass) -3.14 -6.16 -2.12 -2.11 -2.64
Total impact (kg CO2-eq tonne-1 biomass) 66.76 105.53 67.74 65.32 99.46
Energy production (GJ gross energy tonne-1 biomass) 0.86 2.00 0.99 1.24 1.82
Total impact (kg CO2-eq GJ-1 gross energy) 77.46 52.89 68.35 52.74 54.65
Nitrate leaching (kg NO3-N tonne-1 biomass) 0.19 0.13 0.04 0.18 0.45
Ammonia volatilization (kg NH3-N tonne-1 biomass) -0.19 -0.18 -0.21 -0.14 -0.30
NOx (g NOx tonne-1 biomass) -2.49 -2.48 -2.30 -3.97 -2.13
* Methane and nitrous oxide from storage relate to emissions from storage of biomasses, especially slurry, deep litter, and slaughterhouse waste.

67
Table 7.2. Calculated effects per tonne of biomass for five model plants at 60 days retention time and 1% methane leakage from the biogas plant. The model plants are 1a: slurry and deep litter, 1b: slurry and straw, 2: slurry, deep litter, and maize ensilage, 3: slurry, deep litter, and organic waste, 4: slurry, deep litter, organic waste, and organic grass-clover. Positive values indicate lower emissions and negative values indicate increased emissions from biogas.
Source M1a M1b M2 M3 M4
Energy (kg CO2-eq tonne-1 biomass)
Gas for the natural gas grid 50.44 117.05 57.84 71.83 105.30
Glycerol for heating -13.80
Process energy -4.08 -4.08 -4.08 -4.08 -4.08
Transport -1.21 -1.20 -1.15 -1.62 -1.20
Fertiliser production, N 1.61 1.32 1.43 1.43 1.77
Methane leakage (kg CO2-eq tonne-1 biomass) -4.50 -10.33 -5.42 -6.34 -9.29
Methane from storage (kg CO2-eq tonne-1 biomass)* 29.91 15.75 24.50 21.04 11.54
Nitrous oxide from storage (kg CO2-eq tonne-1 biomass)* 0.00 -1.26 0.00 1.32 1.32
Nitrous oxide after field application (kg CO2-eq tonne-1 biomass) 0.00 0.00 0.00 0.00 0.00
Nitrous oxide from nitrogen leaching (kg CO2-eq tonne-1 biomass) 0.40 0.27 0.04 0.40 1.01
Nitrous oxide from ammonia vol. (kg CO2-eq tonne-1 biomass) -0.69 -0.66 -0.76 -0.51 -1.11
Nitrous oxide from maize cropping (kg CO2-eq tonne-1 biomass) 0.00 0.00 -0.74 0.00 0.00
Carbon storage (biomass for biogas) (kg CO2-eq tonne-1 biomass) -3.14 -6.16 -2.12 -2.11 -2.64
Total impact (kg CO2-eq tonne-1 biomass) 68.76 110.72 69.60 67.55 102.59
Energy production (GJ gross energy tonne-1 biomass) 0.90 2.07 1.02 1.27 1.86
Total impact (kg CO2-eq GJ-1 gross energy) 76.47 53.61 68.19 53.29 55.21
Nitrate leaching (kg NO3-N -1 biomass) 0.19 0.13 0.04 0.18 0.45
Ammonia volatilization (kg NH3-N tonne-1 biomass) -0.19 -0.18 -0.21 -0.14 -0.30
NOx (g N0x tonne-1 biomass) -2.49 -2.48 -2.30 -3.97 -2.13
* Methane and nitrous oxide from storage relate to emissions from storage of biomasses, especially slurry, deep litter, and slaughterhouse waste.

68
Table 7.3. Calculated impacts per tonne of biomass for five model plants at 90 days retention time and 1% methane leakage from the biogas plant. The model plants are 1a: slurry and deep litter, 1b: slurry and straw, 2: slurry, deep litter, and maize ensilage, 3: slurry, deep litter, and organic waste, 4: slurry, deep litter, organic waste, and organic grass-clover. Positive values indicate lower emissions and negative values indicate increased emissions from biogas.
Source M1a M1b M2 M3 M4
Energy (kg CO2-eq tonne-1 biomass)
Gas for the natural gas grid 52.34 119.32 59.00 72.92 105.50
Glycerol for heating -13.80
Process energy -4.54 -4.54 -4.54 -4.54 -4.54
Transport -1.21 -1.20 -1.15 -1.62 -1.20
Fertiliser production, N 1.61 1.32 1.43 1.43 1.77
Methane leakage (kg CO2-eq tonne-1 biomass) -4.62 -10.53 -5.26 -6.43 -9.31
Methane from storage (kg CO2-eq tonne-1 biomass)* 30.13 16.13 24.69 21.21 11.77
Nitrous oxide from storage (kg CO2-eq tonne-1 biomass)* 0.00 -1.26 0.00 1.32 1.32
Nitrous oxide after field application (kg CO2-eq tonne-1 biomass) 0.00 0.00 0.00 0.00 0.00
Nitrous oxide from nitrogen leaching (kg CO2-eq tonne-1 biomass) 0.40 0.27 0.04 0.40 1.01
Nitrous oxide from ammonia vol. (kg CO2-eq tonne-1 biomass) -0.69 -0.66 -0.76 -0.51 -1.11
Nitrous oxide from maize cropping (kg CO2-eq tonne-1 biomass) 0.00 0.00 -0.74 0.00 0.00
Carbon storage (biomass for biogas) (kg CO2-eq tonne-1 biomass) -3.14 -6.16 -2.12 -2.11 -2.64
Total impact (kg CO2-eq tonne-1 biomass) 70.29 112.70 70.64 68.25 102.53
Energy production (GJ gross energy tonne-1 biomass) 0.92 2.11 1.04 1.29 1.86
Total impact (kg CO2-eq GJ-1 gross energy) 76.10 53.53 67.85 53.04 55.08
Nitrate leaching (kg NO3-N -1 biomass) 0.19 0.13 0.04 0.18 0.45
Ammonia volatilization (kg NH3-N tonne-1 biomass) -0.19 -0.18 -0.21 -0.14 -0.30
NOx (g NOx tonne-1 biomass) -2.49 -2.48 -2.30 -3.97 -2.13
* Methane and nitrous oxide from storage relate to emissions from storage of biomasses, especially slurry, deep litter, and slaughterhouse waste.

The biogas model plant where part of the deep litter has been substituted by maize (M2) is only
marginally worse than the plant with deep litter, and slurry alone (M1a). This is because a high
conversion of the organic matter in maize to biogas is assumed. Moreover, the methane emission
from storage of deep litter assumed in the reference is expected to be lower than for liquid live-
stock manure; thus, the GHG impact of anaerobic digestion of deep litter is limited. In a study by
Jacobsen et al. (2013), the total GHG impact of a biogas plant based on 10% maize was calcu-
lated at 72 kg CO2-eq tonne-1 biomass, which is about 10 kg CO2-eq tonne-1 higher than in this
study. In Jacobsen et al. (2013), fibre fraction was supplied instead of deep litter, and this had a
considerable climate impact when digested, which is one reason for the greater impact.
With the exception of the "straw plant", the organic model plant has the best climate impact (99
kg CO2-eq tonne-1), where most of the impact is attributable to a high gas yield as a result of a
large volume of grass-clover, deep litter, and biowaste. For an organic biogas plant, Møller and
Martinsen (2013) calculated a lower impact of about 83 kg CO2-eq tonne-1 for energy production
and reduced methane emissions. Generally, the energy effect in this study was more important
for the overall GHG impact than in previous studies, where the contribution from reduced me-
thane and nitrous oxide emissions was greater (Nielsen et al., 2002).
The GHG impacts in this report are calculated based on a Danish territorial perspective, where
only impacts on the Danish national GHG emissions are included. However, the energy impacts
also include a minor climate impact from the production of N in commercial fertiliser, correspond-
ing to about 1.5 kg CO2-eq per tonne of biomass. Since there is no fertiliser production in Denmark,
such emissions are not included in Denmark's national GHG emissions. Neither are the possible
effects of changes in land use elsewhere on the planet (iLUC) included. This is only relevant for
model plant M2 where the cultivation of maize as an energy crop will replace the production of
cereals and could, thus, potentially have iLUC impacts. The iLUC impacts are uncertain, but may
very well exceed the calculated positive climate impacts of biogas production. iLUC impacts are
included in the inventory of climate impact in connection with the inventory of biofuels under the
EU's Renewable Energy Directive (RED), but are not included in the EU requirements for compli-
ance with RED II (European Commission, 2015). Compared to maize for biogas production, the
iLUC impact in a RED context was recently calculated at 21 kg CO2-eq MJ-1 (Valin et al., 2015).
7.1.1 Retention time
The retention time in the biogas plant affects the total GHG impact of biogas production. A longer
retention time will increase the production of gas and reduce the amount of degradable dry mat-
ter during the subsequent storage, thus reducing methane emissions from the digestate. On the
other hand, larger reactors with a larger surface area will have to be established, thus increasing
the loss of heat to the surroundings. Generally, the volume will increase more than the surface,
and consequently, the heat loss will still be relatively smaller.
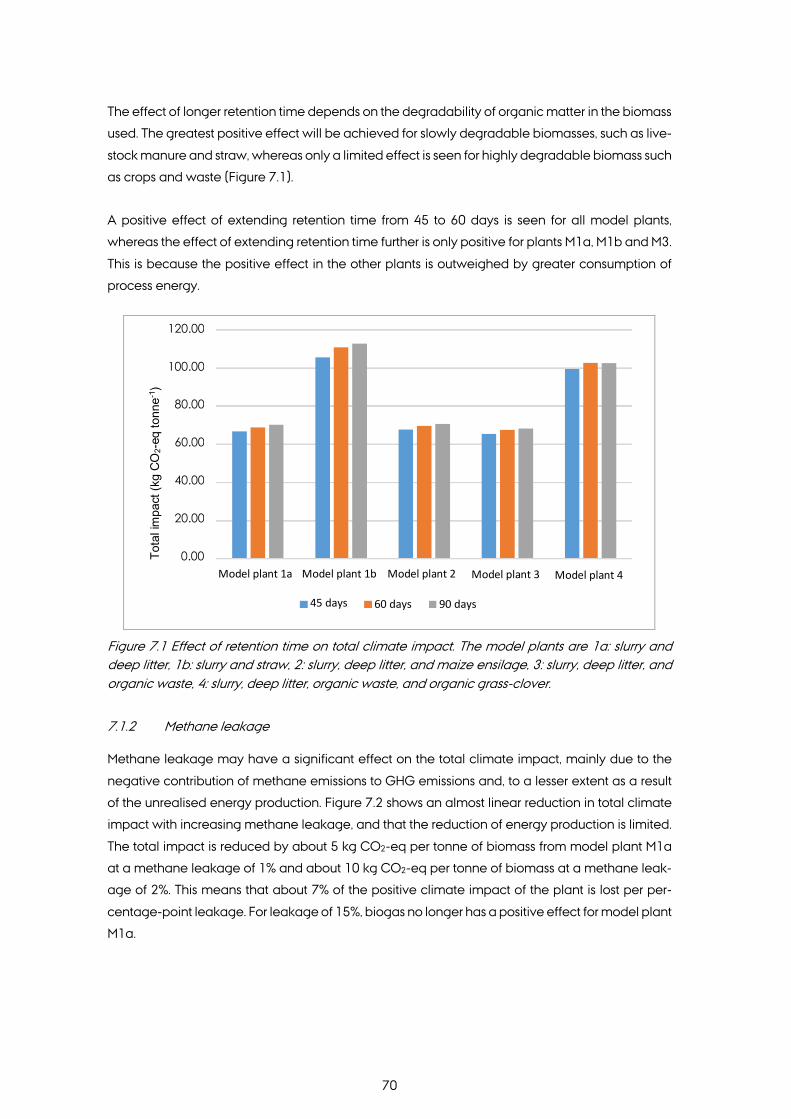
70
The effect of longer retention time depends on the degradability of organic matter in the biomass
used. The greatest positive effect will be achieved for slowly degradable biomasses, such as live-
stock manure and straw, whereas only a limited effect is seen for highly degradable biomass such
as crops and waste (Figure 7.1).
A positive effect of extending retention time from 45 to 60 days is seen for all model plants,
whereas the effect of extending retention time further is only positive for plants M1a, M1b and M3.
This is because the positive effect in the other plants is outweighed by greater consumption of
process energy.
Figure 7.1 Effect of retention time on total climate impact. The model plants are 1a: slurry and deep litter, 1b: slurry and straw, 2: slurry, deep litter, and maize ensilage, 3: slurry, deep litter, and organic waste, 4: slurry, deep litter, organic waste, and organic grass-clover.
7.1.2 Methane leakage
Methane leakage may have a significant effect on the total climate impact, mainly due to the
negative contribution of methane emissions to GHG emissions and, to a lesser extent as a result
of the unrealised energy production. Figure 7.2 shows an almost linear reduction in total climate
impact with increasing methane leakage, and that the reduction of energy production is limited.
The total impact is reduced by about 5 kg CO2-eq per tonne of biomass from model plant M1a
at a methane leakage of 1% and about 10 kg CO2-eq per tonne of biomass at a methane leak-
age of 2%. This means that about 7% of the positive climate impact of the plant is lost per per-
centage-point leakage. For leakage of 15%, biogas no longer has a positive effect for model plant
M1a.
Tota
l im
pact
(kg
CO2-
eq to
nne-1 )
Model plant 1a Model plant 2 Model plant 1b Model plant 3 Model plant 4
120.00
100.00
80.00
60.00
40.00
20.00
0.00
45 days 60 days 90 days

Figure 7.2 Calculated effects of methane leakage on the climate impact for model plant M1a.
7.1.3 Methane emissions from storage of livestock manure and biogas slurry
Compared to previous reports, a number of changes in assumptions and the basis of calculations
have been introduced for this analysis. Nielsen et al. (2002) assumed that in the reference, organic
waste was stored under anaerobic conditions and was, therefore, an important source of me-
thane emissions. The present analysis includes a number of biomasses from agriculture for the
biogas production, and here the alternative use is incorporation (straw), ensiling (maize), storage
in a heap (deep litter) or composting (biowaste), while only slaughterhouse waste supplied to
one model plant is expected to be stored under anaerobic conditions. In all cases, except for
slaughterhouse waste, this makes the potential for methane mitigation lower than with the bio-
mass used in the previous analyses.
An empirical model was previouosly developed to estimate methane emissions in scenario anal-
yses (Sommer et al., 2004). The temperature dependence of methane production was described
using an Arrhenius equation, but parameters were derived from a combination of storage exper-
iments and not measured directly. The present analysis is based on a new version of the model
where the parameters (Ea, lnA’) are based on direct analyses of slurry samples. Although the
number of observations behind the parameter estimates is still limited, the updated model allows
for an independent calculation of methane emissions before and after biogas treatment.
Methane leakage (% of total methane production)
CO2 impact energy production
CO2 methane leakage
CO2 other
CO2 total
100.00
80.00
60.00
40.00
20.00
0.00
-20.00
-40.00
-60.00
-80.00
Kg C
O 2-e
q to
nne-
1

72
There are still uncertainties and knowledge gaps concerning the determination of methane emis-
sions from slurry and digestate as summarised by Petersen and Gyldenkærne (2020). In this anal-
ysis, it should be emphasised that the degradation of organic matter had to be based on simpli-
fied assumptions, where methane emissions were based on total VS, and not degradable VS, as
discussed in section 3.1. Moreover, a fixed InA value (expresses the methane production potential)
was used for slurry and other biomasses following biogas treatment, although the composition of
digestates should be expected to vary considerably. It is, therefore, a possibility that the calcu-
lated differences between 45, 60 and 90 days retention time for methane emissions (Figures 3.6
and 3.9) are, in fact, greater than reported here.
7.1.4 Nitrous oxide from field application of biogas slurry
Another significant difference in this analysis compared to the analysis in Nielsen et al. (2002) is
the calculation of nitrous oxide emissions. Removal of degradable organic matter in the biogas
process will, all else being equal, reduce the potential for microbial processes in the soil which
are responsible for nitrous oxide formation. However, nitrous oxide emissions are controlled by a
complex interaction between the properties of the biomass and the soil, and scientific literature
provides examples of reduction, no impact, and even greater emission with biogas treatment. In
Nielsen et al. (2002), an impact was calculated as described by Sommer et al. (2004), but, in the
light of insufficient clarification of this impact under Danish conditions, any anticipated effect of
anaerobic digestion on nitrous oxide emissions are omitted from the present analysis. Total emis-
sions from untreated biomass and digestate, as well as the effect of biogas treatment, are subject
to uncertainty. A new study monitoring nitrous oxide emissions from four soil types is expected to
contribute new data for the quantification of this impact.
7.2 Nitrate leaching
Here, the effect of digestion on nitrate leaching from the root zone was calculated using the same
method as in Sørensen and Børgesen (2015). For model plant M1a, based on livestock manure
alone, a reduction in leaching of 0.19 kg N tonne-1 was calculated. This is somewhat higher than
estimates of 0.11 kg N tonne-1 used in previous assessments by Nielsen et al. (2002) and Jacobsen
et al. (2013). This higher impact in plant M1a is, however, mainly attributable to the deep litter
content, as the impact for pure cattle slurry is only calculated at 0.07 kg N tonne-1, and for pig
slurry 0.11 kg N tonne-1 (Table 4.1). If 12% maize silage is used (M3), the effect of digestion on
leaching is close to zero, which was also estimated by Sørensen and Børgesen (2015). The reason
is that this scenario adds more N to the soil, and this effect outweighs the positive effect of diges-
tion on the leaching. However, the use of plant biomass, which is also applied to the field without
digestion, as in model plant M4 with organic grass-clover, will reduce leaching – here estimated
at 0.45 kg N tonne-1 with the given biomass composition.
7.3 Ammonia volatilization
The calculations shows 15% higher ammonia volatilization from digested slurry than from cattle
slurry and pig slurry, neither of which are digested. This is obviously one of the reasons why the

results for all biogas model plants are negative (Table 7.1). However, it should be noted that the
higher content of TAN in the slurry causes a significant increase in ammonia volatilization for the
biogas plants compared to the reference. This effect contributes about 60-70% of the increase in
ammonia volatilization from biogas digestion, which is mainly due to greater ammonia loss after
field application of the digestate, which is 4-5 times greater than the loss from the storage tank.
In connection with the application, it is possible to reduce the ammonia loss, especially by in-
creased use of injection. This could be injection into grass fields, but also increased use of injection
into bare soil if allowed by crop rotation and soil type. Reduction of ammonia volatilization
through acidification in the storage tank or in connection with application is not a technology that
can realistically be used as the pH buffer capacity in biogas slurry is so large that the acid demand
will be disproportionately high, thus resulting in both financial and practical problems. However,
new studies indicate that a small pH reduction combined with the application of slurry to ensure
a minimum slurry surface area after application has the potential to lower the ammonia loss sig-
nificantly. A smaller amount of acid will still cause the biogas slurry to foam, but not nearly as
much as if the pH value had to be reduced to the level required for "normal" field/storage acidi-
fication.
The relatively high ammonia volatilization from model plant M4 is particularly caused by the use
of grass silage as a substrate in the plant as this increases the TAN content in the digested slurry.
At the same time, there is relatively little ammonia volatilization from the reference situation,
which is assumed to be trimming and incorporation. On the other hand, the reason for the rela-
tively small increase in loss from model plant M3 is that the losses from the reference situation are
relatively large in connection with storage and application of cattle deep litter and biowaste.
The organic biogas model plant results in a relatively high ammonia loss from the application of
slurry in the field. Here, it is worth mentioning that organic farms may use the injection of slurry to
a large extent. The greater share of spring crops in organic crop rotations and later sowing time
generally make it attractive to use bare soil or grass injection and, in practice, this means that the
ammonia loss will be considerably lower than assumed in this report.
7.4 Air pollution and odour
Only very limited knowledge is available on odour from biogas slurry and on how, e.g., the choice
of substrate affects the odour after application of biogas slurry. Therefore, it is not possible to draw
any conclusions about how biogas affects the odour from applied slurry. With regard to air pollu-
tion, the main effect is NOx emissions from transport of the biomasses to and from a central biogas
plant.
7.5 Crops for biomass
Continued development of biogas production in Denmark will require a supply of sufficiently en-
ergy-rich biomasses. In addition to livestock manure, the model plants use different types of bio-
masses from the agricultural sector. Model plant M1b uses straw and, in practice, this resource is

74
very large, especially if the use of straw for incineration in combined heat and power plants is
reduced. However, the calculations in this report assume that the alternative to using straw is in-
corporation in the field. Had the alternative been incineration for combined heat and power, the
climate impact would have been considerably lower as the energy gain would have been elim-
inated. On the other hand, biogas from straw has the advantage that nutrients and parts of the
slowly degradable carbon in the straw is returned to the field.
Energy crops, such as maize, are still a significant feedstock for Danish biogas plants (Figure 1.1).
Compared to cereal cropping, there are only limited negative environmental effects of cropping
of maize and other energy crops. However, there are energy crops with a better environmental
and GHG profile for biogas production than maize. That is the case for, e.g., grass and sugar beets
(Olesen et al., 2018). However, other opportunities exist for using other types of biomasses, such
as cover crops, for biogas production. This way, nitrous oxide from the incorporation of cover crops
can be reduced (Li et al., 2015) while at the same time maintaining the carbon storage potential
from cover crops and possibly improving the carbon utilisation from cover crops. Cover crops and
straw together provide a good source of biogas while at the same time increasing the use of
nutrients in the plant production (Fontaine et al. 2020). Utilisation of the increasing area with cover
crops for biogas production will not have the potential iLUC impacts associated with the cultiva-
tion of dedicated energy crops for biogas.
7.6 Uncertainties
The calculations presented in this report are based on the current knowledge about energy pro-
duction in the form of biogas from different types of biomasses and the related environmental
and climate impacts. Biogas technology is constantly developing, and so is the alternative use of
biomasses. This in itself is a source of uncertainty about the representativeness of relevant biogas
plants and their composition of biomasses used to feed the biogas reactors. However, the varia-
tion among model plants in this study represents the types of biomasses currently used for biogas
production in Denmark (Figure 1.1).
Other uncertainties are associated with the way in which impacts are quantified. The report is
based on the models and data used elsewhere for Denmark's national inventory of environmen-
tal and climate impacts. These models are constantly being improved, particularly to take better
account of variation in environmental factors relevant for the biological processes behind the
impacts, and of variation in the characteristics of biomasses and how they are managed in prac-
tice. It is not possible with the current knowledge to quantify these uncertainties, but below they
are discussed qualitatively.
7.6.1 Uncertainties with respect to energy production
The gas potential of the different biomasses and the rate at which the gas is produced, are a
significant source of uncertainty, especially in the assessment of the effect of retention time in the
biogas reactor. The degradation profiles used are, therefore, essential for the determination of
gas yield at different retention times, and how much VS remains in the digestate after the biogas

treatment. Thus, the degradation profiles used influence the amount of gas produced and me-
thane emissions during subsequent storage. There is a considerable need for knowledge to doc-
ument the rate at which the gas is produced, and it is necessary to identify any interactions be-
tween biomasses that may give rise to synergies, as well as antagonistic effects. Moreover, it is
necessary to investigate in greater detail the correlation between tests in batches and in contin-
uous systems. Such matters lead to uncertainty in the determination of differences between 45,
60 and 90 days retention time.
This study assumes that electricity used as process energy for biogas production is covered by a
mix of Danish electricity production, which is equivalent to 0.150 g CO2 kWh-1 in 2019. It may be
argued that such emissions could be 0 g kWh-1 if only renewable energy were used. If it is as-
sumed that no CO2 is emitted from the production of process energy, the total positive climate
impact would increase by about 0.97 kg CO2 per tonne of biomass at 45 days retention time. That
would mean an increase in the total climate effect by a maximum of 1.7%, and the emission
factor used for electricity for process energy is, therefore, less important.
7.6.2 Uncertainty in methane emissions from stored slurry
There are still uncertainties and knowledge gaps concerning the estimation of methane emis-
sions from slurry and digestate (Petersen and Gyldenkærne, 2020). In this report, methane emis-
sions and the related degradation of organic matter are based on simplified assumptions. Firstly,
methane emissions are calculated based on total VS and not degradable VS, as discussed in
section 3.1. The reason is a lack of relevant experimental data regarding VS and VS degradability,
storage temperature, and methane production. With total VS as reference it was, however, pos-
sible to estimate a methane production potential for cattle and pig slurry and digestate based on
published experimental results. Another uncertainty is that the same lnA’ value is used for digested
livestock slurry as well as other digested biomasses, although the parameter value is based on
observations made with mixtures of digested slurry and other biomass. The chemical composition
of digestate can be expected to vary, and therefore the calculated differences between 45, 60
and 90 days retention time with respect to methane emission (Figures 3.6 and 3.7) may be greater
than calculated here. Improving the quantification of these differences requires further research.
Among the specific needs are the development of a standardised method for determining VS
degradability, and monitoring of methane emissions, VS content and degradability at representa-
tive farms.
Increasing the retention time in biogas reactors from 45 to 90 days showed only a limited effect
on CH4 emissions during the subsequent storage of digestate (Figure 3.6), with a 15% reduction
in emissions from cattle slurry as the most significant effect. A possible reason for the limited sen-
sitivity to retention time could be that methane emissions are estimated on the basis of total VS
and using the same lnA’ value for digestate regardless of retention time. The slowly degradable
part of VS will dominate the dry matter in digestate regardless of retention time, and, therefore,
the differences between 45, 60 and 90 days retention time are small. An improvement of the
methodology would require storage experiments with individual biomasses at relevant storage
76
temperatures for the purpose of determining methane production and VS composition at different
times in order to calculate specific lnA’ values for each digestate.
7.6.3 Carbon storage uncertainty
The calculations include an assumption that digestion of slurry and biomasses reduces soil carbon
storage compared with direct field application of those biomasses. Only very limited documen-
tation exists for this effect (Thomsen et al., 2013), which is very difficult to determine experimen-
tally. The effect is, therefore, also uncertain, and further studies are needed to quantify this effect
better.
7.6.4 Ammonia volatilization uncertainty
Our estimate of ammonia losses from biogas slurry is uncertain because we do not know how
different types of substrates, and the combination of substrates and slurry categories used in con-
nection with anaerobic digestion, will affect the infiltration of the digestate into the soil. The infil-
tration is a function of viscosity, dry matter content and adhesiveness. Ammonia volatilization de-
pends on how fast the slurry infiltrates the soil, and it is still poorly understood how this infiltration
is affected by biogas treatment and digestate properties. Again, it must be emphasized that it is
the higher content of TAN in the slurry that causes the significant increase in ammonia volatiliza-
tion for the digested slurry compared to reference scenarios. This effect contributes 60-70% of the
increase in ammonia loss resulting from biogas treatment. The uncertainty in this effect is smaller
than the effect of 15% increase in ammonia volatilization that can be attributed to higher pH and
rate of infiltration in the soil. Thus, it is relatively certain that ammonia volatilization increases as a
result of digestion, even though the estimated impact is subject to considerable uncertainty.
It is assumed that 50% of the biogas slurry is stored with a solid tent cover on the storage tank, and
the rest by a natural surface crust or straw cover. According to legislation, slurry must be covered,
and even if a larger share of the stored slurry is covered by a crust or straw cover rather than tent
cover, this will not result in significantly higher ammonia emissions from storage of digested slurry
than from untreated slurry.
7.6.5 Uncertainties in recycling of nutrients
The calculations assume that anaerobic digestion of the biomasses results in better N utilisation
of the manure, and that this results in reduced use of mineral fertilisers. However, as specified in
section 6, this assumption cannot necessarily be expected to be realised in practice where the
effects on N utilisation can also be counterated with decreased use of cover crops. This also leads
to uncertainties in estimates of the effects on nitrate leaching. Here, it is assumed that the reduced
need for nitrogen fertiliser reduces the energy demand for fertiliser production and, thus, also the
associated CO2 emissions. Since there is no fertiliser production in Denmark, such emissions are
not included in Denmark's national emission inventories. If effects on Denmark's national emis-
sions inventory alone is considered, the climate impacts in Tables 7.1 to 7.3 should be reduced by
about 1.5 kg CO2-eq per tonne of biomass.


78
References
Amon B, Kryvoruchko V, Amon T, Zechmeister-Boltenstern S, 2006. Methane, nitrous oxide and
ammonia emissions during storage and after application of dairy cattle slurry and influence of
slurry treatment. Agriculture, Ecosystems & Environment. 112, 153–162.
https://doi.org/10.1016/j.agee.2005.08.030
Ballabio C, Panagos P, Monatanarella L, 2016. Mapping topsoil physical properties at European
scale using the LUCAS database. Geoderma 261, 110–123.
Baral KR, Arthur E, Olesen JE, Petersen SO, 2016. Predicting N2O emissions from manure proper-
ties and soil moisture: An incubation experiment. Soil Biol. Biochem. 97, 112-120.
Baral KR, Jégo G, Amon B, Bol R, Chantigny MH, Olesen JE, Petersen SO, 2018. Greenhouse gas
emissions during storage of manure and digestates: Key role of methane for prediction and mit-
igation. Agricultural Systems 166, 26-35.
Bernal MP, Sommer SG, Chadwick D, Qing C, Guoxue L, Michel Jr. FC, 2017. Current Approaches
and Future Trends in Compost Quality Criteria for Agronomic, Environmental, and Human
Health Benefits. In: Donald L.Sparks, editor, Advances in Agronomy, Vol. 144, Burlington: Aca-
demic Press, 2017, pp. 143-233. ISBN: 978-0-12-812419-2.
Blicher-Mathiesen G, Olesen JE, Jung-Madsen S, 2020. Update of Baseline 2021 (Opdatering af
Baseline 2021). Technical report from DCE no. 162, 135 pp.
Bohon MD, Metzger BA, Linak, WP, King, KJ, Roberts, WL, 2010. Proceedings of the Combustion
Institute (2010), doi:10.1016/j.proci.2010.06.154
Brozyna MA, Petersen SO, Chirinda N, Olesen JE, 2013. Effects of grass-clover management and
cover crops on nitrogen cycling and nitrous oxide emissions in a stockless organic crop rotation.
Journal of Agriculture, Ecosystems & Environment 181, 115-126.
Børgesen CD, Sørensen P, Blicher-Mathiesen G, Kristensen KM, Pullens JWM, Zhao J, Olesen JE,
2020. NLES5 - An empirical model for predicting nitrate leaching from the root zone of agricul-
tural land in Denmark. DCA report 163. Aarhus University.
Chadwick DR, 2005. Emissions of ammonia, nitrous oxide and methane from cattle manure heaps:
effect of compaction and covering. Atmospheric Environment 39, 787–799.
Charles A, Rochette P, Whalen JK, Angers DA, Chantigny MH, Bertrand N, 2017. Global nitrous
oxide emission factors from agricultural soils after addition of organic amendments: A meta-
analysis. Agriculture Ecosystems Environment, 236, 88– 98.Chianese, D., Rotz, C., Richard, T.,
2009. Simulation of methane emissions from dairy farms to assess greenhouse gas reduction
strategies. Trans. ASABE 52, 1313-1323.
Chianese, D., Rotz, C., Richard, T., 2009. Simulation of methane emissions from dairy farms to as-
sess greenhouse gas reduction strategies. Trans. ASABE 52, 1313-1323.
Chojnacka K, Kowalski Z, Kulczycka J, Dmytryk A, Górecki H, Ligas B, Gramza M, 2019. Carbon
footprint of fertiliser technologies. Environmental Management 231, 962-967.
Christensen BT, 2004. Carbon storage in connection with incorporation of straw and catch crops
(Kulstoflagring ved nedmuldning af halm og efterafgrøder). I: Olesen JE, Petersen SO, Gylden-
kærne S, Mikkelsen MH, Jacobsen BH, Vesterdal L, Jørgensen AMK, Christensen BT, Abildtrup J,

Heidmann T, Rubæk G (ed.). Agriculture and climate change - correlation to aquatic environment
plans (Jordbrug og klimaændringer - samspil til vandmiljøplaner). DJF Report, Markbrug no 109
pp. 157-166.
Clemens J, Trimborn M, Weiland P, Amon B, 2006. Mitigation of greenhouse gas emissions by
anaerobic digestion of cattle slurry. Agriculture, Ecosystems & Environment 112, 171–177.
De Notaris C, Rasmussen J, Sørensen P, Olesen JE, 2018. Nitrogen leaching: A crop rotation per-
spective on the effect of N surplus, field management and use of catch crops. Agriculture, Eco-
systems and Environment 255, 1-18.
Dinuccio E, Berg W, Balsari P, 2011. Effects of mechanical separation on GHG and ammonia
emissions from cattle slurry under winter conditions. Animal Feed Science and Technology 166–
167, 532–538.
Elsgaard L, Olesen JE, Hermansen JE, Kristensen IT, Børgesen CD, 2013. Regional greenhouse
emissions from cultivation of winter wheat and winter rapeseed for biofuels in Denmark. Acta
Agriculturae Scandinavica, Section B Plant and Soil 63, 219-230.
Elsgaard L, Olsen AB, Petersen SO, 2016. Temperature response of methane production in liquid
manure and co-digestates. The Sci. Total Environ. 539, 78-84.
EMEP/EEA, 2019. EMEP/EEA air pollutant emission inventory guidebook -Technical guidance to
prepare national emission inventories, European Environment Agency (http://www.eea.eu-
ropa.eu/emep-eea-guidebook), accessed 5 April 2020.
Energinet.dk, 2019. https://energinet.dk/Om-nyheder/Nyheder/2020/01/16/Rekord-lav-
CO2udledning-fradanskernes-elforbrug-i-2019.
The Danish Energy Agency, 2019. Energy statistics 2018. Data, tables, statistics and maps.
The Danish Energy Agency, 2020. Personal communication.
European Commission, 2015. Directive (EU) 2015/1513 of the European Parliament and of the
Council of 9 September 2015 amending Directive 98/70/EC relating to the quality of petrol and
diesel fuels and amending Directive 2009/28/EC on the promotion of the use of energy from
renewable sources.
European Environment Agency, 2016. EMEP/EEA Air Pollutant Emission Inventory Guidebook
2016 – Technical Guidance to Prepare National Emission Inventories. EEA Report No 21/2016.
Fontaine D, Feng L, Labouriau R, Møller HB, Eriksen J, Sørensen P, 2020. Nitrogen and sulphur avail-
ability in digestates from anaerobic co-digestion of cover crops, straw and cattle manure. Jour-
nal of Soil Science and Plant Nutrition 20, 621-636.
Fontaine D, Eriksen J, Sørensen P, 2021. Sulfur from biogas desulfurization: Fate of S during storage
in manure and after application to plants. Sci. Total Environ. 754, 142180.
Gyldenkærne S, personal communication. Aarhus University. Department of Environmental Sci-
ence.
Hafner SD, Pacholski A, Bittman S, Carozzi M, Chantigny M, Génermont S, Häni C, Hansen MN,
Huijsmans J, Kupper T, Misselbrook T, Neftel A, Nyord T, Sommer SG, 2019. A flexible semi-em-
pirical model for estimating ammonia volatilisation from field-applied slurry. Atmospheric Envi-
ronment. 199, 474- 484.

80
Hamelin L, Jørgensen U, Petersen BM, Olesen JE, Wenzel H, 2012. Modelling the carbon and ni-
trogen balances of direct land use changes from energy crops in Denmark: a consequential life
cycle inventory. Global Change Biology Bioenergy 4, 889-907.
Hansen MN, 2020. Personal communication.
Hansen MN, Birkmose TS, 2005. Fast incorporation of solid livestock manure – effect on ammonia
evaporation and economy (Hurtig nedmuldning af fast husdyrgødning – betydning for ammo-
niakfordampning og økonomi). Grøn Viden Markbrug, no. 311. Danish Institute of Agricultural
Sciences.
Hansen MN, Henriksen K, Sommer SG, 2006. Observations of production and emission of green-
house gases and ammonia during storage of solids separated from pig slurry: effects of covering.
Atmospheric Environment. 40, 4172-4181
Hansen, T.L., Sommer, S.G., Gabriel, S. and Christensen, T. H. 2006. Methane production during
storage of anaerobically digested municipal organic waste. J. Environ. Qual., 35, 830-836.
Hansen MN, Sommer SG, Hutchings NJ, Sørensen P, 2008. Emission factors for calculating ammo-
nia evaporation from storage and application of livestock manure (Emissionsfaktorer til bereg-
ning af ammoniakfordampning ved lagring og udbringning af husdyrgødning). DJF Husdyrbrug
no. 84. 43 pp.
Husted S, 1994. Seasonal variation in methane emission from stored slurry and solid manures. J.
Environ. Qual. 23, 585–592.
IPCC, 2006. N2O emissions from managed soils, and CO2 emission from lime and urea applica-
tion. Chapter 11. In: Eggleston, H., Buendia, S.L., Miwa, K., Ngara, T., Tanabe, K. (Eds.), 2006 IPCC
Guidelines for National Greenhouse Gas Inventories. Vol. 4: Agriculture, forestry and other land
use. Institute for Global Environment Strategies, Hayama, Japan.
Jacobsen BH, Laugesen FM, Dubgaard A, Bojesen M, 2013. Biogas production in Denmark – As-
sessments of operation and socioeconomics (Biogasproduktion i Danmark – Vurderinger af
driftsog samfundsøkonomi). IFRO Report 220, University of Copenhagen.
Kvist T, 2020. Gasteknisk Center. Personal communication.
Leytem AB, Dungan RS, Bjorneberg DL, Koehn AC, 2011. Emissions of ammonia, methane, carbon
dioxide and nitrous oxide from dairy cattle housing and manure management systems. J. Envi-
ron. Qual. 40:1383–1394.
Li X, Petersen SO, Sørensen P, Olesen JE, 2015. Effects of contrasting catch crops on nitrogen
availability and nitrous oxide emissions in an organic cropping system. Agriculture, Ecosystems
and Environment 199, 382-393.
Li X, Sørensen P, Olesen JE, Petersen, SO, 2016. Evidence for denitrification as main source of N2O
emission from residue-amended soil. Soil Biol. Biochem. 92, 153-160.
Maldaner L, Wagner-Riddle C, VanderZaag AC, Gordon R, Duke C, 2018. Methane emissions from
storage of digestate at a dairy manure biogas facility. Agricultural and Forest Meteorology 258,
96–107.
Liang Z, Elsgaard L, Nicolaisen M, Lyhne-Kjærbye A, Olesen JE, 2018. Carbon mineralisation and
microbial activity in agricultural topsoil and subsoil as regulated by root nitrogen and recalcitrant
carbon concentrations. Plant and Soil 433, 65-82.

Marcato CE, Pinelli E, Pouech P, Winterton P, Guiresse M, 2008. Particle size and metal distributions
in anaerobically digested pig slurry. Bioresource Technology 99, 2340–2348.
Mikkelsen MH, Albrektsen R, Gyldenkærne S, 2016. Consequences of biogas production for
greenhouse gas emissions in the agricultural sector (Biogasproduktions konsekvenser for
drivhusgasudledning i landbruget). Aarhus University, DCE – Danish Centre for Environment and
Energy, 41 pp. - Scientific Report from DCE - Danish Centre for Environment and Energy no. 197
Misselbrook TH, Scholefield D, Parkinson R, 2005. Using time domain reflectometry to characterize
cattle and pig slurry infiltration into soil. Soil Use Management 21, 167–172.
Moeller K, Stinner W, 2009. Effects of different manuring systems with and without biogas diges-
tion on soil mineral nitrogen content and on gaseous nitrogen losses (ammonia, nitrous oxides).
European Journal of Agronomy. 30, 1-16
Møller F, Martinsen L, 2013. Socioeconomic evaluation of selected biogas technologies. Scientific
Report from DCE no. 62.
Møller HB, personal communication. Aarhus University, Department of Engineering, Aarhus Uni-
versity.
Møller HB, Nielsen KJ, 2016. Biogas Taskforce – developing and streamlining biogas production
in Denmark (Biogas Taskforce – udvikling og effektivisering af biogasproduktionen i Danmark).
Aarhus University, DCA Report No. 077.
Møller HB, Nielsen A, Murto M, Christensson K, 2008. Manure and energy crops for biogas produc-
tion Nordic council of Ministers TemaNord, ISSN 0908-6692; 2008:544.
Möller K, 2015. Effects of anaerobic digestion on soil carbon and nitrogen turnover, N emissions,
and soil biological activity. A review. Agronomy for Sustainable Development 35, 1021-1041.
Nair D, Baral KR, Abalos D, Strobel BW, Petersen SO, 2020. Nitrate leaching and nitrous oxide
emissions from maize after grass-clover on a coarse sandy soil: Mitigation potentials of 3,4-de-
methylpyrazole phosphate (DMPP). J. Environ. Manage. 260, 110165.
Nielsen BS, 2019. Voluntary methane loss measurement scheme. GASenergi, no. 3.
Nielsen LH, Hjort-Gregersen K, Thygesen P, Christensen J, 2002. Socioeconomic analyses of cen-
tral biogas plants – with technical and financial background analyses (Samfundsøkonomiske
analyser af biogasfællesanlæg – med tekniske og selskabsøkonomiske baggrundsanalyser).
Report no. 136, Institute of Food and Resource Economics.
Nielsen O-K, Plejdrup MS, Winther M, Nielsen M, Gyldenkærne S, Mikkelsen MH, Albrektsen R,
Thomsen M, Hjelgaard K, Fauser P, Bruun HG, Johannsen VK, Nord-Larsen T, Vesterdal L, Calle-
sen I, Caspersen OH, Scott-Bentsen N, Rasmussen E, Petersen SB, Olsen TM, Hansen MG, 2019.
Denmark's National Inventory Report 2019. Emission Inventories 1990-2017 - Submitted under
the United Nations Framework Convention on Climate Change and the Kyoto Protocol. Aarhus
University, DCE – Danish Centre for Environment and Energy, 886 pp. Scientific Report No. 318.
Oenema O, Wrage N, Velthof GL, van Groeningen JW, Dolfing J, Kuikman PJ, 2005. Trends in
global nitrous oxide emissions from animal production systems. Nutrient Cycling in Agroecosys-
tems 72, 51–65.
Olesen JE, 2020. Estimation of reduced deposition on leaching (Estimering af reduceret deposi-
tion på udvaskningen). I Blicher-Mathiesen G, Olesen JE, Jung-Madsen S (eds.) 2020. Update of
Baseline 2021 (Opdatering af Baseline 2021). Technical report from DCE no. 162, 135 pp.

82
Olesen JE, Jørgensen U, Hermansen JE, Petersen SO, Eriksen J, Søgaard K, Vinther FP, Elsgaard, L.,
Lund, P, Nørgaard JV, Møller HB, 2013. Effects of measures to reduce agricultural greenhouse
gas emissions (Effekter af tiltag til reduktion af landbrugets udledninger af drivhusgasser). Aar-
hus University.
Olesen JE, Petersen SO, Lund P, Jørgensen U, Kristensen T, Elsgaard L, Sørensen P, Lassen, J, 2018.
Measures to reduce greenhouse gasses in the agricultural sector (Virkemidler til reduktion af
klimagasser i landbruget). DCA - Danish Centre for Food and Agriculture, 2018. 119 pp. (DCA
report no. 130).
Ottosen LDM, Poulsen HV, Nielsen D Aa, Finster K, Nielsen LP, Revsbech NP, 2009. Observations
on microbial activity in acidified pig slurry. Biosystems Eng. 102:291–297.
Pain BF, Misselbrook TH, Clarkson CR, Rees YJ, 1990. Odour and ammonia emissions following
the spreading of anaerobically digested pig slurry on grassland. Biological Wastes 34, 259–267
Pardo G, Moral R, Aguilera E, del Prado A, 2015. Gaseous emissions from management of solid
waste: a systematic review. Global Change Biology 21, 1313–1327.
Pedersen MJ, Andersson K, Feilberg A, Delin S, Nyord T, 2020. The effect of manure surface ex-
posed area on ammonia emission from separated, unseparated, and digested cattle manure.
In preparation.
Petersen J, Sørensen P, 2008. Fertilising effect of nitrogen in livestock manure - Basis for deter-
mining substitution requirements (Gødningsvirkning af kvælstof i husdyrgødning – Grundlag for
fastlæggelse af substitutionskrav). DJF Report, Markbrug no 138. 111 pp.
Petersen J, Sørensen P, 2008. Loss of nitrogen and carbon during storage of the fibrous fraction of
separated pig slurry and influence on nitrogen availability. J. Agric. Sci. Camb. 146, 403– 413.
Petersen SO, 1999. Nitrous oxide emissions from manure and inorganic fertilisers applied to spring
barley. J. Environ. Qual. 28: 1610-1618.
Petersen SO, Sommer SG, 2011. Ammonia and nitrous oxide interactions - the role of manure
organic matter management. Animal Feed Sci. Technol. 166-167: 503-513.
Petersen SO, Gyldenkærne S, 2020. Report on anticipated adjustments in the calculation of me-
thane emissions from livestock manure (Redegørelse omkring forventede justeringer i
beregning af metan-emission fra husdyrgødning), No. 2020-0066332, 10 pp., Apr. 18, 2020.
Petersen SO, Elsgaard L, Gyldenkærne S, Hutchings NJ, Kristensen IS, Lærke PE, Olesen, JE, 2018,
'Level of emissions from Danish soil types depending on the use of different fertiliser types com-
pared to IPCC standards' ('Niveau af emissioner på danske jordtyper afhængig af anvendelse
af forskellige gødningstyper sammenlignet med IPCC standarder'), No. 2017-760-000338, 10
p., Feb. 23, 2018.
Petersen J, Sorensen P, 2008. Loss of nitrogen and carbon during storage of the fibrous fraction of
separated pig slurry and influence on nitrogen availability. Journal of Agricultural Science 146,
403-413.
Petersen SO, Lind A-M, Sommer SG, 1998. Nitrogen and organic matter losses during storage of
cattle and pig manure. Journal of Agricultural Science 130, 69-79.
Petersen SO, Nissen HH, Lund I, Ambus P, 2003. Redistribution of slurry in soil as influenced by
organic matter content and injection method. J. Environ. Qual. 32: 2399-2409.

Petersen SO, Dorno N, Lindholst S, Feilberg A, Eriksen J, 2013. Emissions of CH4, N2O, NH3 and
odorants from pig slurry during winter and summer storage. Nutr. Cycl. Agroecosys. 95: 103-113.
Petersen SO, Olsen AB, Elsgaard L, Triolo JM, Sommer SG, 2016. Estimation of methane emissions
from slurry pits under pig and cattle confinements. PLOS ONE 11(8): e0160968.
Poulsen HD, Børsting CF, Rom HB, Sommer SG, 2001. Nitrogen, phosphorus and potassium in live-
stock manure – norm figures 2000 (Kvælstof, fosfor og kalium i husdyrgødning – normtal 2000).
DJF Report Husdyrbrug no. 36 • November 2001. Published by the Danish Institute of Agricultural
Sciences, Tjele. Pp 154.
Pugesgaard S, Petersen SO, Chirinda N, Olesen JE, 2017. Crop residues as driver for N2O emis-
sions from a sandy loam soil. Agric. Forest Meteorol. 233, 45-54.
Rubæk GH, Henriksen K, Petersen J, Rasmussen B, Sommer SG, 1996. Effects of application tech-
nique and anaerobic digestion on gaseous nitrogen loss from animal slurry applied to ryegrass
(Lolium perenne). Journal of Agricultural Science 126, 481-492.
Searchinger, TD, Wirsenius S, Beringer T, Dumas P, 2018. Assessing the efficiency of changes in
land use for mitigating climate change. Nature 564, 249-256.
Shah A, Askegaard M, Rasmussen IA, Jimenez EMC, Olesen JE, 2017. Productivity of organic and
conventional arable cropping systems in long-term experiments in Denmark. European Journal
of Agronomy 90, 12-22.
Sharpe RR, Harper LA, Byers FM, 2002. Methane emissions from swine lagoons in Southeastern US.
Agric. Ecosyst. Environ. 90, 17–24.
Smith K, Cumby T, Lapworth J, Misselbrook T, Williams A, 2007. Natural crusting of slurry storage
as an abatement measure for ammonia emissions on dairy farms. Biosystems Engineering, 97,
464– 471.
Sommer SG, 1997. Ammonia volatilisation from farm tanks containing anaerobically digested
animal slurry. Atmospheric Environment 31, 863-868.
Sommer SG, 2001. Effect of composting on nutrient loss and nitrogen availability of cattle deep
litter. European Journal of Agronomy. 14, 123–133.
Sommer SG, Petersen SO, Søegaard HT, 2000. Greenhouse gas emission from stored livestock
slurry. J. Environ. Qual. 29: 744-750.
Sommer SG, Petersen SO, Møller HB, 2004. Algorithms for calculating methane and nitrous oxide
emissions from manure management. Nutr. Cycl. Agroecosys. 69:143-154.
Sommer SG, Jensen LS, Clausen SB, Søgaard HT, 2006. Ammonia volatilisation from surface-ap-
plied livestock slurry as affected by slurry composition and slurry infiltration depth. Journal of
Agricultural Science 229–235. https://doi.org/10.1017/S0021859606006022
Sommer SG, Webb J, Hutchings NJ, 2019. New Emission Factors for Calculation of Ammonia Vo-
latilisation from European Livestock Manure Management Systems. Frontiers in Sustainable
Food Systems 3:101. 1-9. doi: 10.3389/fsufs.2019.00101
Sørensen P, Børgesen CD, 2015. Nitrogen leaching and fertilising effect from digestate (Kvælstof-
udvaskning og gødningsvirkning ved anvendelse af afgasset biomasse). DCA report no. 65. 46
pp.

84
Sørensen P, Christensen BT, Børgesen CD, 2019. Long-term effects on nitrate leaching of mineral
nitrogen in applied fertiliser (10-year perspective) (Langtidseffekter på nitratudvaskning af mi-
neralsk kvælstof i tilført gødning (10-års perspektiv)). Technical report to MFVM. Nr. 2019-
0015938, 2019. 9 s., Dec. 02, 2019. Aarhus Universitet. https://pure.au.dk/portal/fi-
les/172983126/Langtidseffekter _af_N_i_g_dning_og_udvaskning_Nov19.pdf
Sørensen P, Kristensen E, Odokonyero K, Petersen SO, 2013. Utilisation of nitrogen in legume-
based mobile green manures stored as compost or ensilage. In: Løes, A.-K., Askegaard, M., Lan-
ger, V., Partanen, K., Pehme, S., Rasmussen, I.A., Salomon, E., Sørensen, P., Ullvén, K., Wivstad, M.
(eds.). NJF seminar 461 Proceedings, Organic farming systems as a driver for change. NJF Re-
port vol 9(3), 157-158.
Sørensen P, Pedersen BF, 2020. Effects of bio-gasification and recycled organic waste (Effekter
af bioforgasning og genanvendt organisk affald). In Update of Baseline 2021 (Opdatering af
Baseline 2021). Technical report from DCE no. 162, pp. 51-58
Tafdrup S, 2019. Internal memo in the Danish Energy Agency.
Thomsen IK, Pedersen AR, Nyord T, Petersen SO, 2010. Effects of slurry pre-treatment and appli-
cation technique on short-term N2O emissions as determined by a new non-linear approach.
Agric. Ecosys. Environ. 136:227-235.
Thomsen IK, Olesen JE, Møller HB, Sørensen P, Christensen BT, 2013. Carbon dynamics and stabi-
lisation in soil after anaerobic digestion of dairy cattle feed and faeces. Soil Biology and Bio-
chemistry 58, 82-87.
Triolo JM, Sommer SG, Møller HB, Weisbjerg MR, Jiang X, 2011. A new algorithm to characterize
biodegradability of biomass during anaerobic digestion: influence of lignin concentration on
methane production potential. Bioresour. Technol. 102, 9395–9402.
Valin H, Peters D, van den Berg M, Frank S, Havlik P, Forsell N, Hamelinck C, Pirker J, Mosnier A,
Balkovic J, Schmid E, Dürauer M, di Fulvio F, 2015. The land use changes the impact of biofuels
consumed in the EU. Quantification of area and greenhouse gas impacts. European Commis-
sion Project: BIENL13120.
Webb J, Sommer SG, Kupper T, Groenestein K, Hutchings NJ, Eurich-Menden B, Rodhe L, Mis-
selbrook TH, Amon B, 2012. Emissions of Ammonia, Nitrous Oxide and Methane during the Man-
agement of Solid Manures. Sust. Agric. Rev. 8, 67 – 107, ISSN 2210-4410
Winther M, 2020. Personal communication.

AARHUS UNIVERSITET
Om DCADCA - Nationalt Center for Fødevarer og Jordbrug er den faglige indgang til jordbrugs- og fødevareforskningen ved Aarhus Universitet.
Centret omfatter institutter og forskningsmiljøer, der har aktiviteter på jordbrugs- og fødevareområdet. Det er primært Institut for Agroøkologi, Institut for Husdyrvidenskab, Institut for Fødevarer, Center for Kvantitativ Genetik og Genomforskning samt dele af Institut for Ingeniørvidenskab.
Aktiviteterne i DCA understøttes af en centerenhed, der varetager og koordinerer op-gaver omkring myndighedsbetjening, erhvervs- og sektorsamarbejde, internationalt samarbejde og kommunikation.
Forskningsresultater fra DCAResultater fra forskningen publiceres i internationale, videnskabelige tidsskrifter. Publi-kationerne kan findes via universitets publikationsdatabase (pure.au.dk).
DCA rapporter DCAs rapportserie formidler hovedsageligt myndighedsrådgivning fra DCA til Miljø- og Fødevareministeriet. Der kan også udgives rapporter, som formidler viden fra forsknings-aktiviteter. Rapporterne kan frit hentes på centrets hjemmeside: dca.au.dk.
NyhedsbreveDCA udsender et nyhedsbrev, der løbende orienterer om jordbrugs- og fødevareforsknin-gen og herunder om nye forskningsresultater, rådgivning, uddannelse, arrangementer og andre aktiviteter. Det er gratis at tilmelde sig nyhedsbrevet, og det kan ske på dca.au.dk.
Biogas is renewable energy produced by digesting biomass under anaerobic conditions. Livestock manure, wastewater, and wet organic waste from industry and households can be used in the production which then also serves as waste treatment. When livestock manure is supplied for biogas production, the emissions of greenhouse gases from livestock are reduced. The process also makes the nutrients in the manure more accessible for plants.
The extent of the greenhouse gas and environmental impacts of biogas depends on the production characteristics, inclu-ding, in particular, the biomasses used. Moreover, factors such as transport, process energy consumption, and any methane loss from the plant are included.
The quantification of the greenhouse gas and environmental impacts of biogas production constitutes an important basis for designing and targeting future biogas funding in order to optimise the climate and environmental benefits of the production.The report presents an analysis of the effects of biogas production based on livestock manure and various relevant types of biomasses from waste management and agriculture. The effects are described for five model biogas production plants with different biomass compositions.
RESUME