Embed Size (px)
Citation preview
Sustainable Buildings and Campus Development School of Engineering Practice Course 704 Inquiry Paper Final Submission
Submitted by: Mark Gallant B.Eng, M.Eng Candidate [email protected] Submitted to: Dr. Gail Krantzberg
McMaster University Dofasco Center For Engineering and Public Policy School of Engineering Practice 1280 Main Street West, ITB-102 Hamilton, ON L8S 4K1 http://msep.mcmaster.ca
Submitted on: November 24th 2006
2
i. Abstract
This inquiry examined the current policies that govern new building development
at several of Ontario’s Universities. It was the intent of this investigation to determine
how future sustainability of these buildings was considered during their planning and
development, and to suggest what additional policies need to be in place for new campus
facilities to be sustainable in the future. The approach that was taken was to break-up the
inquiry into several key sections to look at various influencing factors for the policy
recommendations.
Within the first section, this inquiry investigates the relationship between
population demographics and a universities’ predicted growth trend, to determine how
one of the current justifications for future campus expansion could impact sustainable
building development. The next major section looked at the existing policies for building
development throughout the various campuses studied to examine the existing governing
forces behind the design, location, and functionality of new facilities and their subsequent
integration onto the existing campus. The last major section presented, determined the
role that stakeholder relationships (both on-campus and off-campus), have had on current
building development policies.
The result was the creation of five policies that are intended to be a step towards
creating university campus facilities that will strive to be sustainable or at least attempt to
improve upon their current development policies. These policies were developed in such
a way that they could be adopted (or integrated into existing policies) by any of the
schools that were studied within this report.

3
ii. Table of Contents
i. Abstract P 2 ii. Table of contents P 3 iii. List of figures P 4 1.0 Introduction P 5 2.0 Driving the need for new buildings: Population growth versus predicted P 7
university trends 2.0.1 Current and estimated population demographics P 7 2.0.2 Current and estimated university demographics P 11 2.0.3 Relating these estimations to the schools being studied P 15 3.0 Existing policies for building development P 20 3.1 What governs new building development? P 20 3.2 Input into design and location P 22 3.3 What is the intended functionality of new buildings P 23 3.3.1 A buildings designed purpose P 24 3.3.2 Building integration and campus growth P 25 3.4 Land-use policies P 27 3.5 Energy P 28 3.5.1 Current and predicted electrical capacity P 29 3.5.2 Energy’s effect on university building development policies P 31 4.0 Stakeholders P 34 4.1 Understanding the university-community relationship P 35 4.2 Understanding the administration-faculty/staff-student relationship P 37 5.0 Policy recommendations and closing remarks P 39 Acknowledgements P 44 References P 45

4
ii. List of Figures and Tables
Figures
1. Figure 2.0.1.1 Projected Ontario population from 2006 to 2031 p 9 2. Figure 2.0.1.2 Projected Ontario population for age demographics p 9
17 to 24 3. Figure 2.0.1.3 Population trends over the entire age demographic p 10
(scenario #2) 4. Figure 2.0.1.4 Ages of new immigrant populations for a 25 year period p 11
between July 1st 1980 and July 1st 2005 5. Figure 2.0.2.1 Current participation rate of Ontario’s population p 12
(Aged 17-25) attending university 6. Figure 2.0.2.2 Estimated students available for enrolment at Ontario’s p 13
Universities to the year 2031, based on a population participation rate of 30% and a medium growth rate
7. Figure 2.0.2.3 Percentage of new registered students attending Ontario’s p 14 universities who originate from out of province
8. Figure 2.0.3.1 Distribution of enrolment attending the eight universities p 16 being studied within this inquiry
9. Figure 2.0.3.2 Student enrolment by Ontario university p 17 10. Figure 2.0.3.3 Growth of graduate and undergraduate full-time p 18
enrolment for 1995 to 2004 11. Figure 3.1.1 General approval structure for new building development at p 21
the various universities studied for this inquiry 12. Figure 3.5.1.1 Available sources of electrical power generation and their p 29
Output over a year period between July 2005 and July 2006 13. Figure 3.5.1.2.Current and predicted electricity production for Ontario p 30
from 2006 to 2025 assuming that no new capacity is built 14. Figure 3.5.2.1 Design and placement of the geothermal wells on the p 33
OUIT campus 15. Figure 4.2.1 Proposed ideal interaction between on-campus university p 38
stakeholders 16. Figure 4.2.2 Generalized perceived state of current university group p 38
stakeholder communication
17. Figure 4.2.3 Proposed communication method for university group p 39
stakeholders
Tables
1. Table 2.0.2.1 Excerpt from numerical data used to create Figure 4.1.2.3 p 15 2. Table 2.0.3.1 Space short-fall estimated for Ontario universities for p 19
2004-2005 3. Table 3.5.2.1 Key highlights of campus renewal partnership at McMaster p 34
5
1.0 Introduction:
Canada exists in a world that is constantly changing, physically and socially.
Whether it is the concerns over global climate change; political instabilities; declining
energy supplies; or global economies (just to name a few), we as a society and as part of
a larger global community need to develop methods to ensure that there exists academic
institutions to properly prepare current and future generations to adapt to the upcoming
and ongoing changes ahead.
The focus of this inquiry will be centered on several university institutions within
a geographical region of southwestern Ontario, defined by a 150km radius from the city
of Hamilton1. The institutions that will be studied within this inquiry (as defined by the
region above) are Brock University; McMaster University; the University of Guelph; the
University of Toronto St. George Campus; the University of Toronto at Mississauga;
York University; University of Ontario Institute of Technology (UOIT); Wilfred Laurier
University.
The scope of this focus leads to the central defining question of this inquiry. Since
these schools are highly regarded by society as facilities that train and mold the future
leaders and global citizens of tomorrow it is important that they remain viable and
sustainable entities of the public infrastructure. This however presents a problem in that
for each of these institutions to continue to be successful in attracting students they may
overzealously push for expansions in order to offer new facilities to entice larger
enrolments from generally the same pool of applying students (especially within
southwestern Ontario). It is this situation where institutions continually seek to expand
that is the primary cause for this inquiry paper. It is the intention of this paper to
investigate the following central question: What policies need to be in place for new
campus facilities to be sustainable in the future? Before this question can be looked at
with any sort of depth it is important to clearly define the terms ‘new campus facilities’,
‘future’ and ‘sustainable’, and how they are to be interpreted within this inquiry paper.
The use of the term ‘new campus facility’ refers to any campus-building project
that is defined by one of the following:
1 This region was chosen because of its significant amount of post secondary institutions, and because it is
one of the most populated regions within Canada.

6
• The building is completely new in construction from the foundation up
• The building is built on an existing foundation after the previous building has
been demolished
• The building is a retrofit of a pre-existing non-campus building for future campus
use
It should be noted that although temporary campus buildings may not fall within the
definitions defined above, it is still important that their effects on campus sustainability
be taken into consideration if their use is evident within individual campus policies.
For the purposes of this inquiry the future refers to a time period of 25 to 30 years
from 2006. This time scale was chosen for two reasons: the first is based on the
projection planning horizons stated within the Master Campus Plans of a majority of the
eight schools being studied2; the second is based on the data provided by Statistics
Canada whose provincial statistical projection only extend to 2031(Statistics Canada:
Current Population, 2006).
The final aspect of the central question that needs to be defined and clarified is
what the term sustainable means within the scope of this inquiry paper. A preliminary
source for the definition of sustainability has historically been linked to the Brundtland
Commission and their subsequent report in that they defined sustainable practices as
those that do not diminish the availability of resources to future generations (Brundtland
Commission, 1987). This definition is thought to be too vague to be effectively used
within the scope of this inquiry paper. Therefore, sustainability will not only be defined
in terms of the Brundtland Report, but will also use three key metrics:
Economic; Environmental; and Social.
The economic metric will look at whether the new developments consider the
required investments and future operating costs? The environmental metric will look at
current and future environmental footprint as it relates to energy conservation, land-use,
and campus integration. Whereas, the social metric will look at the various stakeholders
groups and their effect on new building development, and the intended functionality as
viewed by users of new buildings.
2 Of the schools being studied the only school without a current Master Campus Plan was York University
7
The methodology that will be used to investigate the central question, will be to
divide this inquiry into four major components: Driving the need for new building:
population growth versus predicted university trends; Existing policies for building
development; Stakeholders; Policy recommendations and concluding remarks. 3
2.0 Driving the need for new buildings: Population growth versus predicted
university trends
One of the key factors that will affect the future role and operation of Canadian
universities is the current and estimated population demographics. These demographics
can be direct indicators for a university’s need (or perceived need) for new buildings and
the subsequent acquisition for new land. These may not be the only indicators (for
instance, perceived competition from other schools) but historically provincial funding is
often linked to student enrolments. The purpose of this analysis was to determine whether
the Canadian population demographics are in line with anticipated student enrolments
within these universities, to see if there is any evidence that the current level of campus
growth is representative of the capacity and level of services that will be required in the
future.
This analysis was conducted by using data freely available through Statistics
Canada4 and the Council of Ontario Universities, student enrolment and projected
enrolment data provided by the schools being studied.
2.0.1 Current and estimated population demographics
As of 2005, Statistics Canada reported a current total population estimate of
32,270,500 people and showed the most populous regions to be Ontario (12,541,400),
Quebec (7,589,100), British Columbia (4,254,500), and Alberta (3,256,800), while all
other provinces and territories had population less than 1 million people (Statistics
3 While this paper does acknowledge that there is a difference in the ways that private, public and
institutional buildings are financed, designed and constructed, the focus will primarily be on institutional
(university) building development and the unique challenges that these developers and planners must work
within. 4 Statistics Canada Website can be found at http://www.statcan.ca/
8
Canada: Current Population, 2006). For the purposes of this inquiry the focus will
mainly be within Ontario.
In addition to the current population estimates, Statistics Canada provides
estimated national and provincial populations based on several possible growth scenarios.
The following three growth scenarios were chosen:
Scenario #1 Low Growth: assumes a relatively low fertility rate of 1.3 births per
woman, combined with relatively low levels of immigration (approximately 0.55%),
and an overall life expectancy of 81.1 years for men and 85.3 years for women
(Statistics Canada: Table 052-0004, 2005)
Scenario #2 Medium Growth: assumes a moderate fertility rate of 1.5 births per
woman, combined with moderate levels of immigration (approximately 0.7%), and an
overall life expectancy of 81.9 years for men and 86.0 years for women (Statistics
Canada: Table 052-0004, 2005)
Scenario #3 High Growth: assumes a relatively high fertility rate of 1.7 births per
woman, combined with higher levels of immigration (approximately 0.85%), and an
overall life expectancy of 82.6 years for men and 86.6 years for women (Statistics
Canada: Table 052-0004, 2005)
The focus for these projections will be on the age groups most likely to be pursuing post-
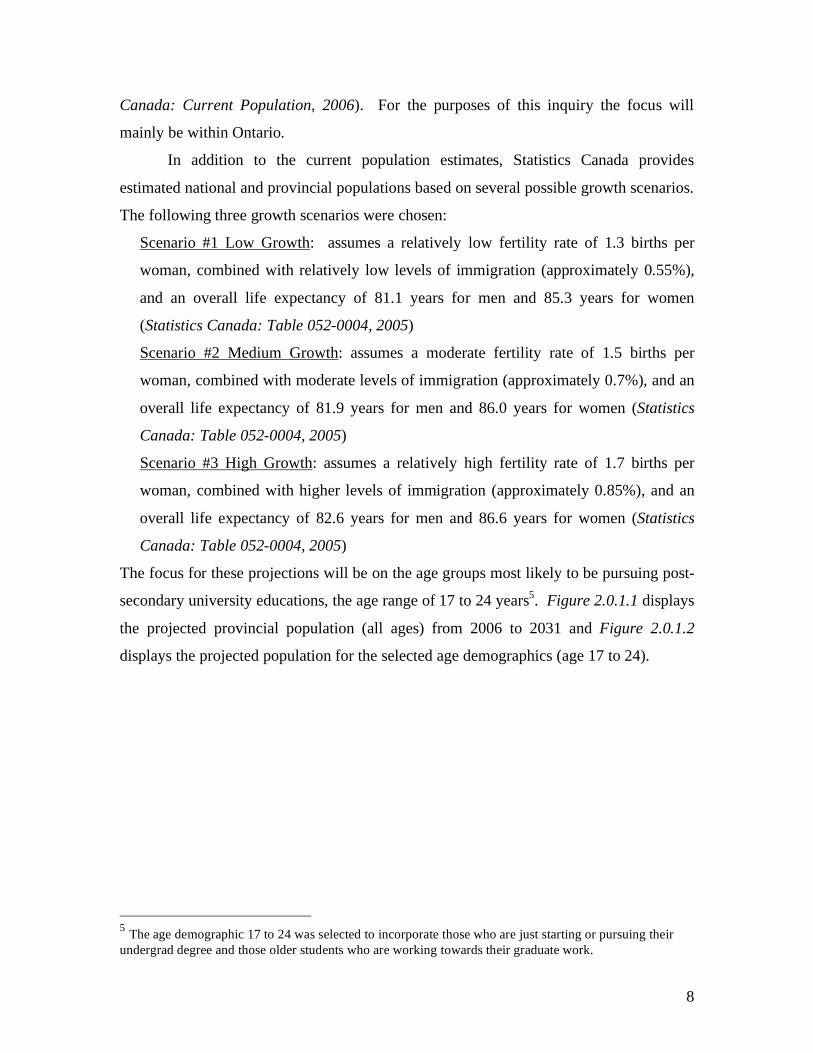
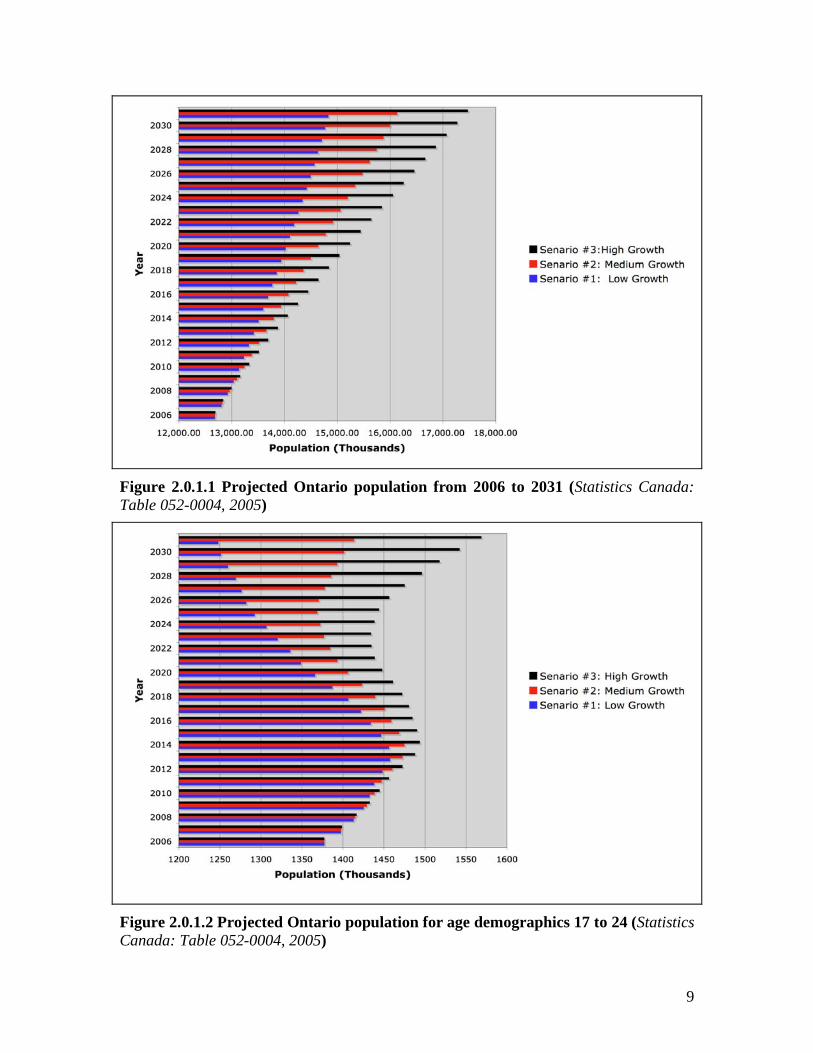
secondary university educations, the age range of 17 to 24 years5. Figure 2.0.1.1 displays
the projected provincial population (all ages) from 2006 to 2031 and Figure 2.0.1.2
displays the projected population for the selected age demographics (age 17 to 24).
5 The age demographic 17 to 24 was selected to incorporate those who are just starting or pursuing their
undergrad degree and those older students who are working towards their graduate work.
9
Figure 2.0.1.1 Projected Ontario population from 2006 to 2031 (Statistics Canada:
Table 052-0004, 2005)
Figure 2.0.1.2 Projected Ontario population for age demographics 17 to 24 (Statistics
Canada: Table 052-0004, 2005)
10
Figure 2.0.1.2 demonstrates that while the provincial population trends (shown in figure
2.0.1.1) show a tendency to consistently rise, the same cannot be said about the
demographics of ages between 17 and 24, which show levels of rising and falling.
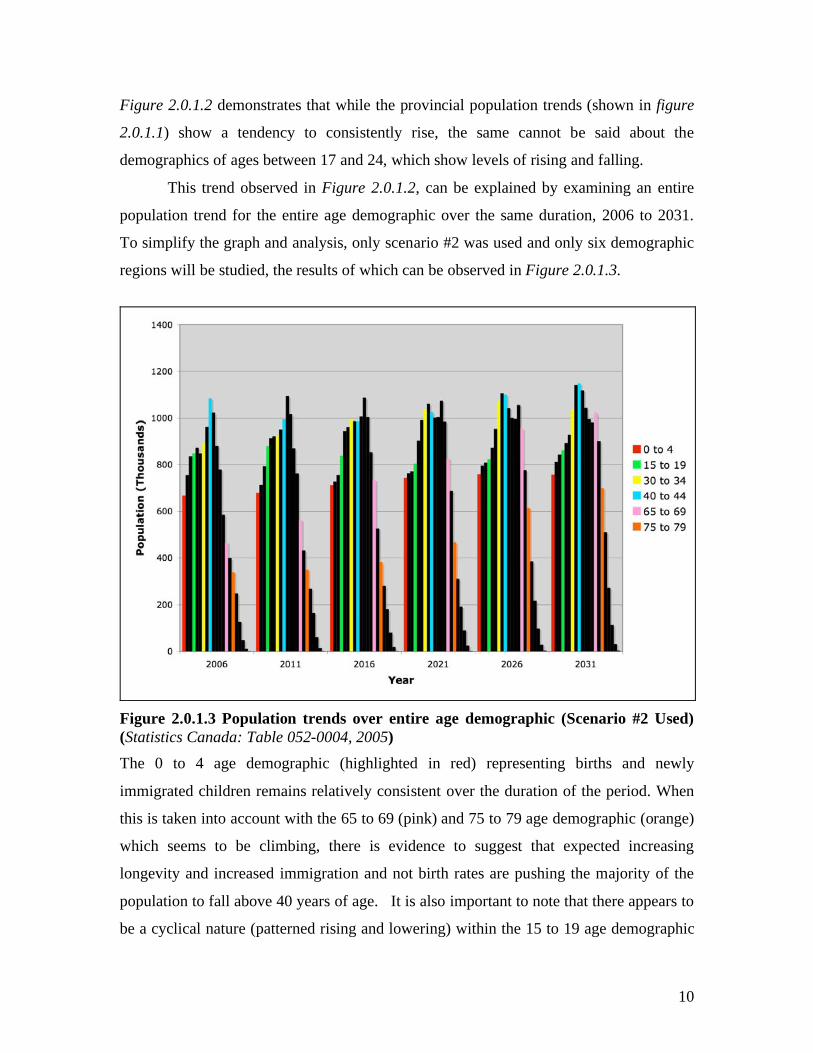
This trend observed in Figure 2.0.1.2, can be explained by examining an entire
population trend for the entire age demographic over the same duration, 2006 to 2031.
To simplify the graph and analysis, only scenario #2 was used and only six demographic
regions will be studied, the results of which can be observed in Figure 2.0.1.3.
Figure 2.0.1.3 Population trends over entire age demographic (Scenario #2 Used)
(Statistics Canada: Table 052-0004, 2005)
The 0 to 4 age demographic (highlighted in red) representing births and newly
immigrated children remains relatively consistent over the duration of the period. When
this is taken into account with the 65 to 69 (pink) and 75 to 79 age demographic (orange)
which seems to be climbing, there is evidence to suggest that expected increasing
longevity and increased immigration and not birth rates are pushing the majority of the
population to fall above 40 years of age. It is also important to note that there appears to
be a cyclical nature (patterned rising and lowering) within the 15 to 19 age demographic
11
indicating that immigration levels for this age group may not be enough to offset the
relatively consistent birthrates, this observation is important because it is within this age
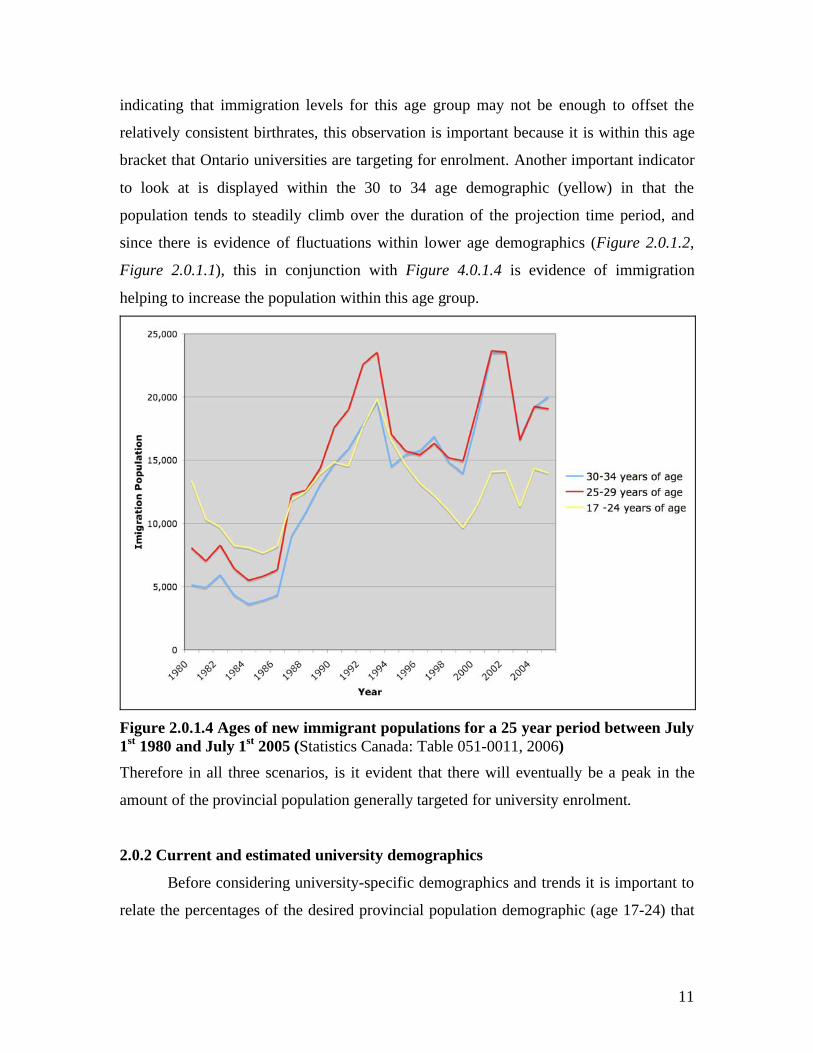
bracket that Ontario universities are targeting for enrolment. Another important indicator
to look at is displayed within the 30 to 34 age demographic (yellow) in that the
population tends to steadily climb over the duration of the projection time period, and
since there is evidence of fluctuations within lower age demographics (Figure 2.0.1.2,
Figure 2.0.1.1), this in conjunction with Figure 4.0.1.4 is evidence of immigration
helping to increase the population within this age group.
Figure 2.0.1.4 Ages of new immigrant populations for a 25 year period between July
1st 1980 and July 1
st 2005 (Statistics Canada: Table 051-0011, 2006)
Therefore in all three scenarios, is it evident that there will eventually be a peak in the
amount of the provincial population generally targeted for university enrolment.
2.0.2 Current and estimated university demographics
Before considering university-specific demographics and trends it is important to
relate the percentages of the desired provincial population demographic (age 17-24) that
12
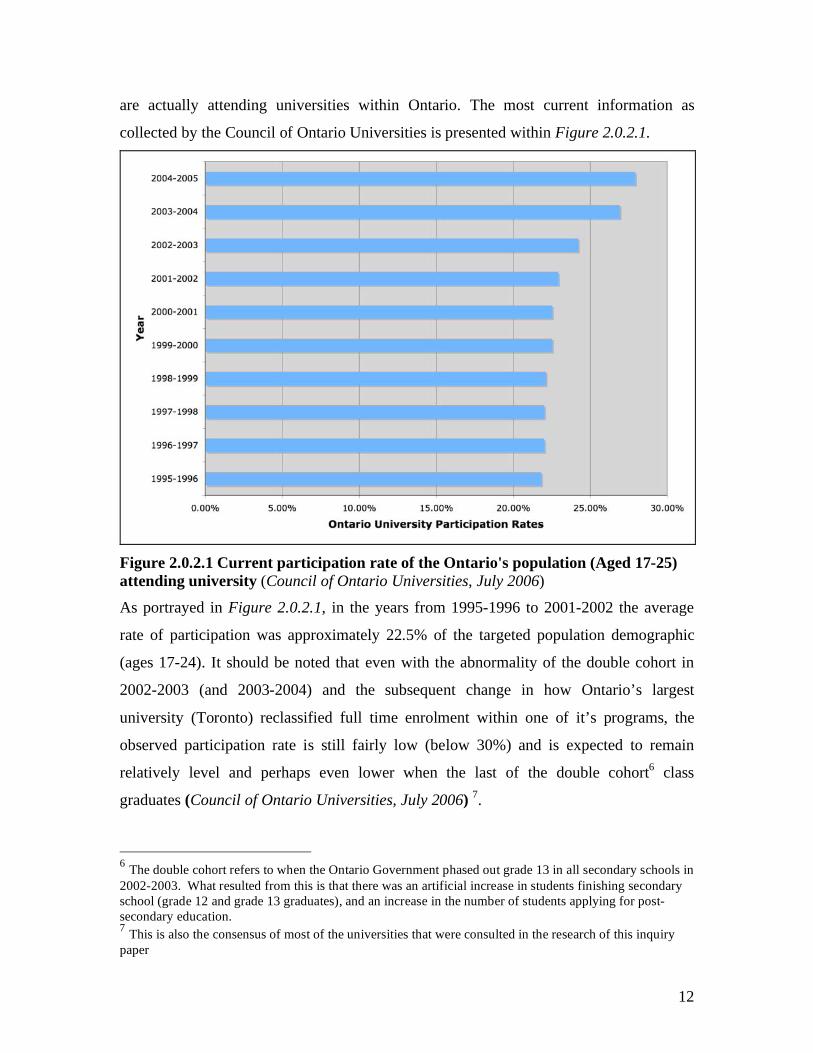
are actually attending universities within Ontario. The most current information as
collected by the Council of Ontario Universities is presented within Figure 2.0.2.1.
Figure 2.0.2.1 Current participation rate of the Ontario's population (Aged 17-25)
attending university (Council of Ontario Universities, July 2006)
As portrayed in Figure 2.0.2.1, in the years from 1995-1996 to 2001-2002 the average
rate of participation was approximately 22.5% of the targeted population demographic
(ages 17-24). It should be noted that even with the abnormality of the double cohort in
2002-2003 (and 2003-2004) and the subsequent change in how Ontario’s largest
university (Toronto) reclassified full time enrolment within one of it’s programs, the
observed participation rate is still fairly low (below 30%) and is expected to remain
relatively level and perhaps even lower when the last of the double cohort6 class
graduates (Council of Ontario Universities, July 2006) 7.
6 The double cohort refers to when the Ontario Government phased out grade 13 in all secondary schools in
2002-2003. What resulted from this is that there was an artificial increase in students finishing secondary
school (grade 12 and grade 13 graduates), and an increase in the number of students applying for post-
secondary education. 7 This is also the consensus of most of the universities that were consulted in the research of this inquiry
paper
13
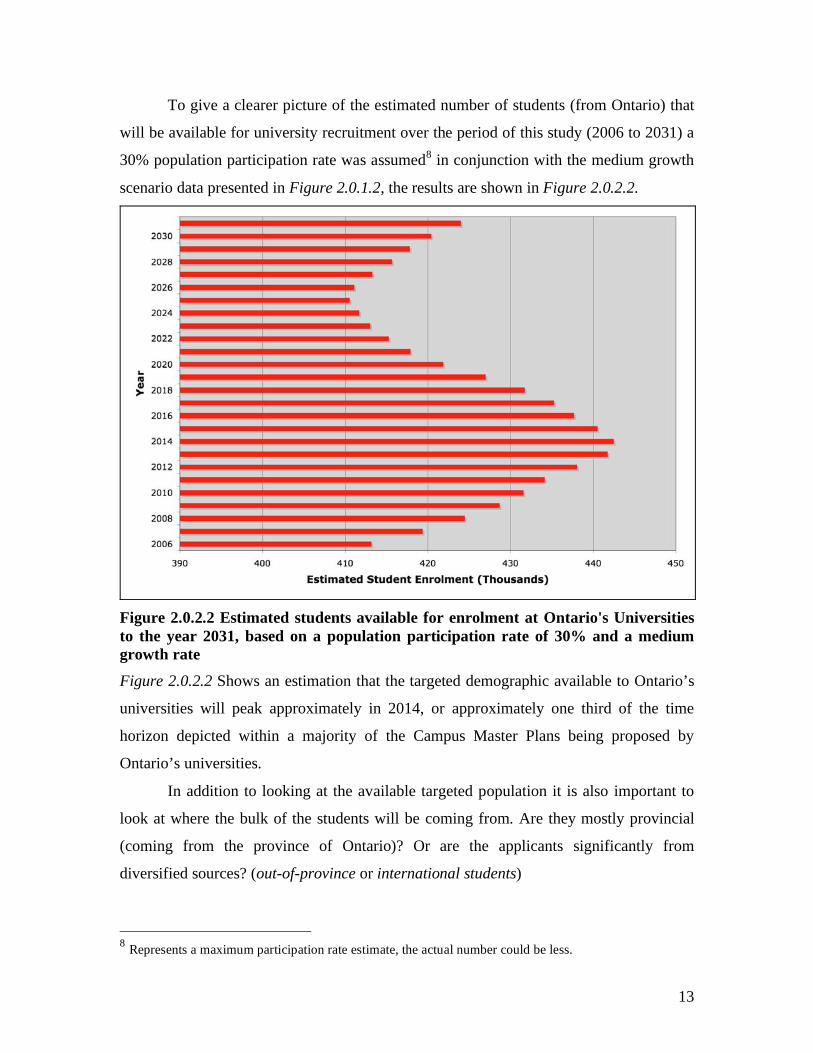
To give a clearer picture of the estimated number of students (from Ontario) that
will be available for university recruitment over the period of this study (2006 to 2031) a
30% population participation rate was assumed8 in conjunction with the medium growth
scenario data presented in Figure 2.0.1.2, the results are shown in Figure 2.0.2.2.
Figure 2.0.2.2 Estimated students available for enrolment at Ontario's Universities
to the year 2031, based on a population participation rate of 30% and a medium
growth rate
Figure 2.0.2.2 Shows an estimation that the targeted demographic available to Ontario’s
universities will peak approximately in 2014, or approximately one third of the time
horizon depicted within a majority of the Campus Master Plans being proposed by
Ontario’s universities.
In addition to looking at the available targeted population it is also important to
look at where the bulk of the students will be coming from. Are they mostly provincial
(coming from the province of Ontario)? Or are the applicants significantly from
diversified sources? (out-of-province or international students)
8 Represents a maximum participation rate estimate, the actual number could be less.
14
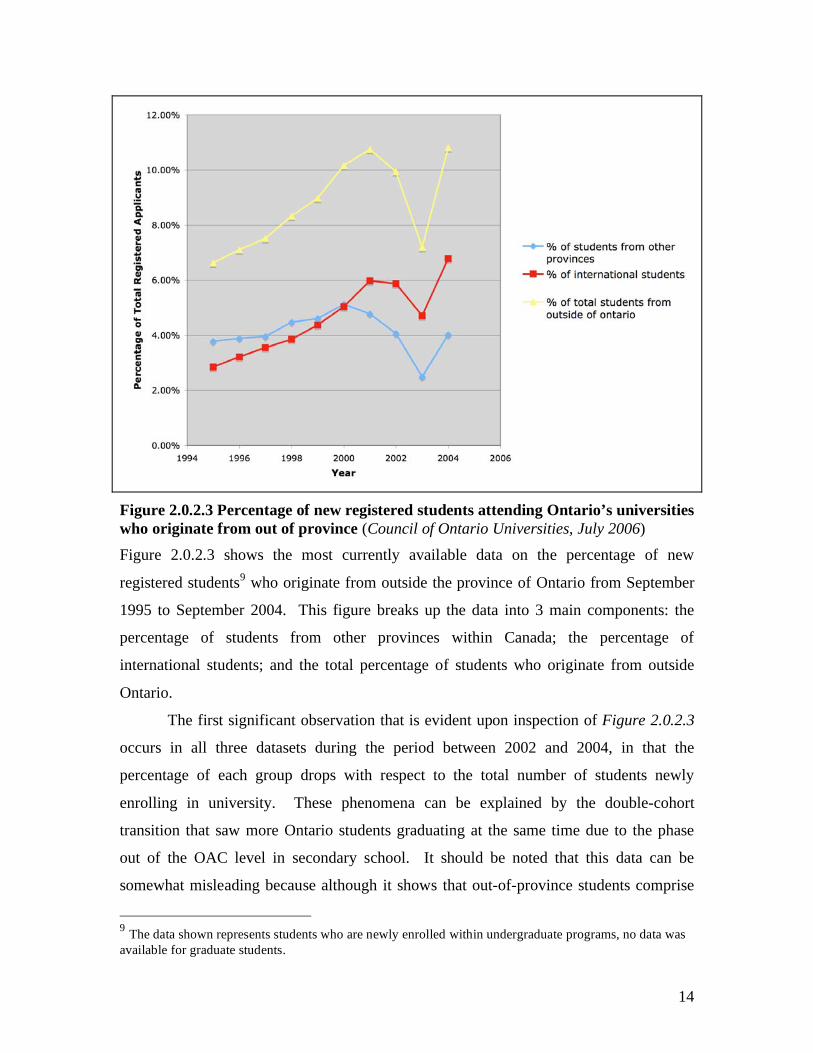
Figure 2.0.2.3 Percentage of new registered students attending Ontario’s universities
who originate from out of province (Council of Ontario Universities, July 2006)
Figure 2.0.2.3 shows the most currently available data on the percentage of new
registered students9 who originate from outside the province of Ontario from September
1995 to September 2004. This figure breaks up the data into 3 main components: the
percentage of students from other provinces within Canada; the percentage of
international students; and the total percentage of students who originate from outside
Ontario.
The first significant observation that is evident upon inspection of Figure 2.0.2.3
occurs in all three datasets during the period between 2002 and 2004, in that the
percentage of each group drops with respect to the total number of students newly
enrolling in university. These phenomena can be explained by the double-cohort
transition that saw more Ontario students graduating at the same time due to the phase
out of the OAC level in secondary school. It should be noted that this data can be
somewhat misleading because although it shows that out-of-province students comprise
9 The data shown represents students who are newly enrolled within undergraduate programs, no data was
available for graduate students.
15
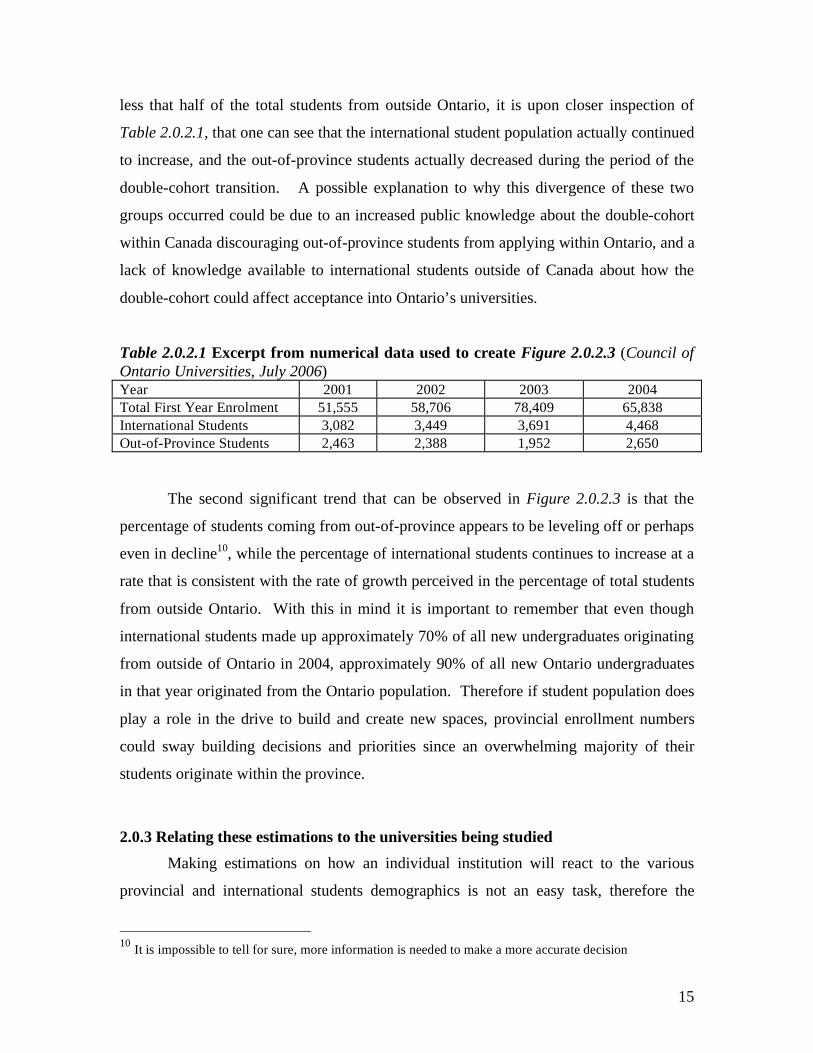
less that half of the total students from outside Ontario, it is upon closer inspection of
Table 2.0.2.1, that one can see that the international student population actually continued
to increase, and the out-of-province students actually decreased during the period of the
double-cohort transition. A possible explanation to why this divergence of these two
groups occurred could be due to an increased public knowledge about the double-cohort
within Canada discouraging out-of-province students from applying within Ontario, and a
lack of knowledge available to international students outside of Canada about how the
double-cohort could affect acceptance into Ontario’s universities.
Table 2.0.2.1 Excerpt from numerical data used to create Figure 2.0.2.3 (Council of
Ontario Universities, July 2006)
Year 2001 2002 2003 2004
Total First Year Enrolment 51,555 58,706 78,409 65,838
International Students 3,082 3,449 3,691 4,468
Out-of-Province Students 2,463 2,388 1,952 2,650
The second significant trend that can be observed in Figure 2.0.2.3 is that the
percentage of students coming from out-of-province appears to be leveling off or perhaps
even in decline10, while the percentage of international students continues to increase at a
rate that is consistent with the rate of growth perceived in the percentage of total students
from outside Ontario. With this in mind it is important to remember that even though
international students made up approximately 70% of all new undergraduates originating
from outside of Ontario in 2004, approximately 90% of all new Ontario undergraduates
in that year originated from the Ontario population. Therefore if student population does
play a role in the drive to build and create new spaces, provincial enrollment numbers
could sway building decisions and priorities since an overwhelming majority of their
students originate within the province.
2.0.3 Relating these estimations to the universities being studied
Making estimations on how an individual institution will react to the various
provincial and international students demographics is not an easy task, therefore the
10 It is impossible to tell for sure, more information is needed to make a more accurate decision

16
proposed analysis on the subject will be limited to what has been observed historically
and the material that was disclosed in the various interviews conducted for this inquiry.
Figure 2.0.3.1 Distribution of enrolment attending the eight universities being
studied within this inquiry (Council of Ontario Universities, July 2006, January 2005,
March 2001)
One of the initial areas that was looked at was how the total provincial enrolments
were distributed among the universities being studied. The analysis looked at the most
current data provided by the Council of Ontario Universities (for 2004) and compared
these against the total enrolment from the four previous years. Figure 2.0.3.1 shows the
results of this analysis. One dominant trend that can be seen in Figure 2.0.3.1 is that the
enrolment levels when compared to each other as a function of percentage of total
provincial enrolment remain fairly consistent to ±0.75%. The only one that does not
conform to this trend is the University of Ontario Institute of Technology (UOIT), which
was not formed until the 2004 academic year. If this trend were to remain consistent it
could be a useful tool to estimate the projected enrolment numbers. However, this is a
tool that should be used with great caution, because it is only an approximation, and does
17
not reflect the impact of individual institutions introducing new programs into their
curriculum.
In looking at how the projected demographics demonstrated within the earlier
sections (2.0.1 and 2.0.2) relate to the future enrolment levels, and their significance to
the need for building development, again caution will be taken as to try to avoid any
poorly based assumptions (for instance assuming that student distribution remain
consistent to the number shown in Figure 2.0.3.1 over the 30-year planning horizon).
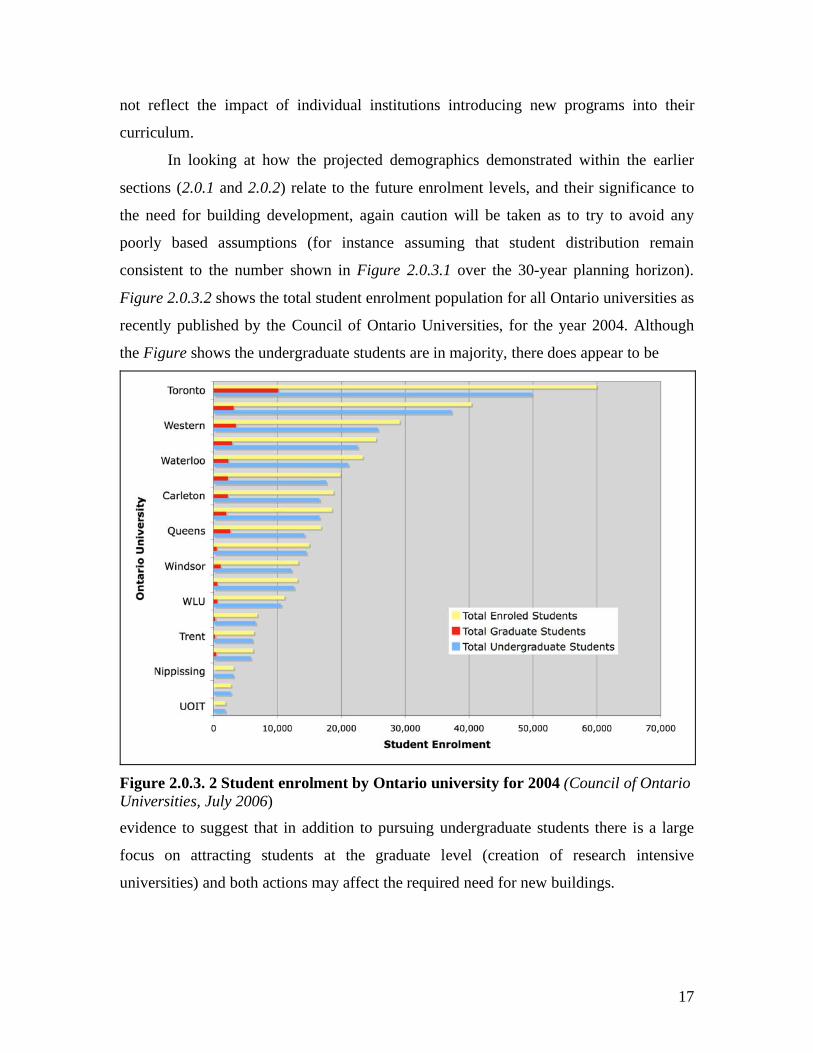
Figure 2.0.3.2 shows the total student enrolment population for all Ontario universities as
recently published by the Council of Ontario Universities, for the year 2004. Although
the Figure shows the undergraduate students are in majority, there does appear to be
Figure 2.0.3. 2 Student enrolment by Ontario university for 2004 (Council of Ontario
Universities, July 2006)
evidence to suggest that in addition to pursuing undergraduate students there is a large
focus on attracting students at the graduate level (creation of research intensive
universities) and both actions may affect the required need for new buildings.

18
To demonstrate the rate of increased growth that has been experienced within
enrolment in both undergraduate and graduate level programs in Ontario, the data used
(shown in Figure 2.0.3.3) covered a 10-year period between 1995 and 2004.
Figure 2.0.3.3 Growth of graduate and undergraduate full-time enrolments from
1995 to 2004 (Council of Ontario Universities, July 2006)
Figure 2.0.3.3 shows that both graduate and undergraduate attendance has steadily been
increasing over a ten-year period from 1995 to 2004, however how this becomes
significant to the need for new buildings and campus space is not evident until the
amount of required space for each additional student is taken into account. The space
requirements that are used within this inquiry were developed by the Council of Ontario
Universities, and are complied within their Inventory of Physical Facilities of Ontario
Universities report issued in December 2005. The report states that while there are
increases in building spaces they are predominately specific use facilities such as
classrooms, research labs and faculty offices and that there currently is insufficient new
buildings and spaces to accommodate the new enrolments. (Council of Ontario
Universities, December 2005) Therefore the argument that the Council of Ontario
Universities is putting forward is that further expansion is required. To give an idea of the
19
general short-fall estimated by the Council of Ontario Universities, they provide the
following figures (shown in Table 2.0.3.1):
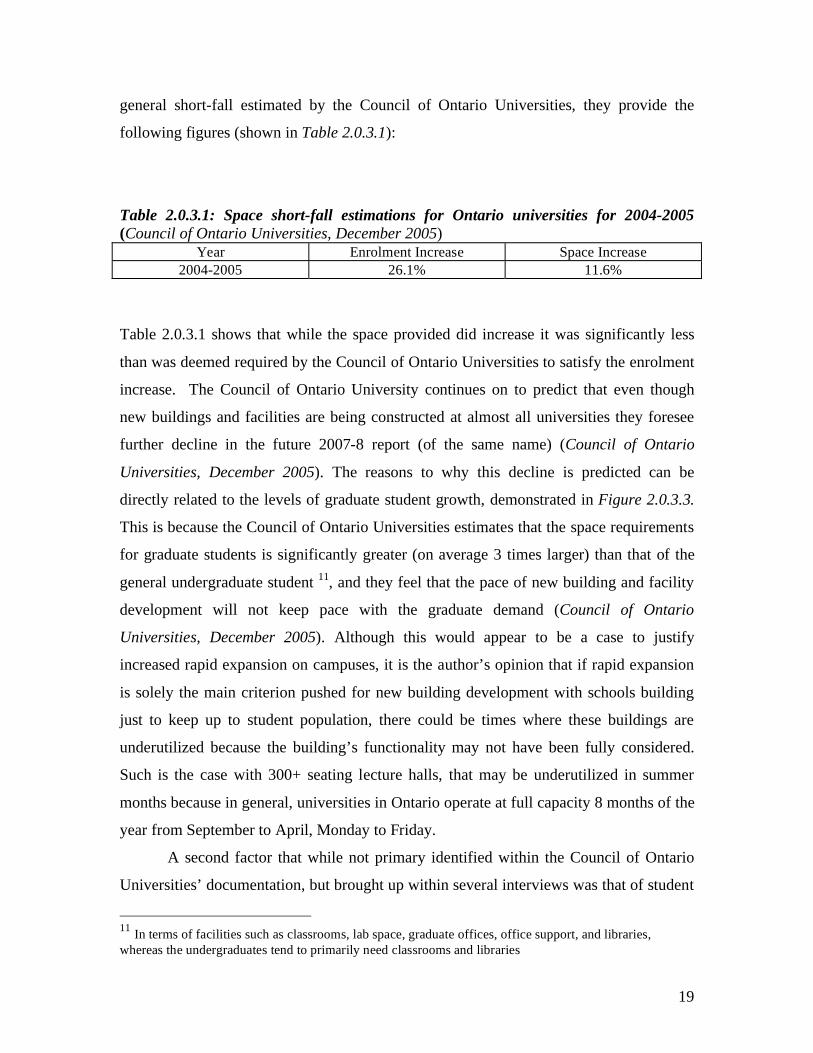
Table 2.0.3.1: Space short-fall estimations for Ontario universities for 2004-2005
(Council of Ontario Universities, December 2005) Year Enrolment Increase Space Increase
2004-2005 26.1% 11.6%
Table 2.0.3.1 shows that while the space provided did increase it was significantly less
than was deemed required by the Council of Ontario Universities to satisfy the enrolment
increase. The Council of Ontario University continues on to predict that even though
new buildings and facilities are being constructed at almost all universities they foresee
further decline in the future 2007-8 report (of the same name) (Council of Ontario
Universities, December 2005). The reasons to why this decline is predicted can be
directly related to the levels of graduate student growth, demonstrated in Figure 2.0.3.3.
This is because the Council of Ontario Universities estimates that the space requirements
for graduate students is significantly greater (on average 3 times larger) than that of the
general undergraduate student 11, and they feel that the pace of new building and facility
development will not keep pace with the graduate demand (Council of Ontario
Universities, December 2005). Although this would appear to be a case to justify
increased rapid expansion on campuses, it is the author’s opinion that if rapid expansion
is solely the main criterion pushed for new building development with schools building
just to keep up to student population, there could be times where these buildings are
underutilized because the building’s functionality may not have been fully considered.
Such is the case with 300+ seating lecture halls, that may be underutilized in summer
months because in general, universities in Ontario operate at full capacity 8 months of the
year from September to April, Monday to Friday.
A second factor that while not primary identified within the Council of Ontario
Universities’ documentation, but brought up within several interviews was that of student
11 In terms of facilities such as classrooms, lab space, graduate offices, office support, and libraries,
whereas the undergraduates tend to primarily need classrooms and libraries

20
accommodations (residences) development (Interviews 1,2,3,5,6,10,11,13). This
becomes a significant factor when one observes the rapid rate of undergraduate growth
shown in Figure 2.0.3.3, and the estimated provincial enrolment numbers for this
upcoming year (approximately 480,000 enrolled students (Government of Ontario,
2006)) in conjunction with the policies that some schools within Ontario have guaranteed
housing for qualifying first year students (for instance: University of Toronto and
McMaster University have such policies) (University of Toronto, September 2006)
(McMaster University, September 2006). In touring, interviewing, and reviewing the
websites of the various schools the impact of how significant new residence buildings are
to the overall campus development became evident, in that most schools were doing or
had done at least one of following:
• Built at least one residence in the last 4 years
• Have purchased existing off-campus buildings for student residence use
• Have plans to build new residence buildings in future capital projects
3.0 Existing policies for building development:
3.1 What governs new building development?
This section looks at the existing governing forces behind new building
development and will look at the following questions:
1. Which groups approve and oversee new building development?
2. Are there policies in place to influence new building development?
3. Are there any policies that dictate or influence how new buildings and
development are financed?
While specific universities will not be disclosed, a general picture can be presented to
demonstrate similarities and differences that became evident during the course of
conducting interviews at the various universities.
In looking at the first question, the overwhelming response by all those who were
interviewed replied that all new building developments needed to be approved by an
institutional governing board (Interviews 1,2,3,4,5,6,7,8,9,10,11,12,13). For the most
part, the structure and nature of the process that the various institutional governing
board’s use to approve new building development is similar. To illustrate the general

21
requirements to satisfy the decision process, a general case will be used. In a majority of
the institutions studied each new building project involves the use of a fixed Standing
Committee (or Capital Projects Group), comprised of at least three main groups (see
Figure 3.1.1), each having specific roles in the development of the new buildings.
(Interviews 3,5,10,11,12,13)
Figure 3.1.1 General approval structure for new building development at the
various university institutions studied for this inquiry
The first group looks at an overall university plan and takes into account things such as a
building’s location and general functionality. The second group would be more
concerned with planning and would look at the general design and the functionality of the
building with respect to the clients or intended end users of the development. It is also
this group that is generally concerned with the general costing and estimation of
expenses. The third major group that comprises the general standing committee is the
financial group who looks at a new building in terms of how will it be paid, and where
will the money come from in terms of grants, donations, mortgages, etcetera. In a
majority of the institutions studied all three of the above groups (or a variation thereof),
needs to be satisfied before the approval for a new building is granted (Interviews
3,5,10,11,12,13).
The overall responses to questions concerning the presence of policies that
influenced new building development were varied. Some individuals stated that to the
best of their knowledge their institution did not have any specific formal university
policies dealing with sustainable buildings (Interviews 6,8,11,12). Others said that while
some environment policies were in place they tended to be optional in nature and lacked

22
significant bite to affect the current set of buildings being planned, but that they were
optimistic that this may change in the future (Interviews 2,7). There was however one
institution that had implemented one fairly ambitions policy as it pertained to new
building development, in that the policy called for all new buildings to be a minimum of
L.E.E.D.12 13 silver certified (the impact of such a policy will be discussed within section
3.3) (Interviews 9,10).
In examining if any policies influenced how new building development was
funded at the various institutions, the overall responses was consistent across all
interviews conducted. There are no formal policies on how their new buildings were
financed and that the funding could come from varied sources such as grants, donations,
and mortgages (Interviews 3,5,8,9,10,11,12,13). The one aspect of financing that was
consistent regardless of institution was residence buildings (student living
accommodations), are not applicable for government funding, they are largely paid for by
the institutions taking out mortgages, financed by student rental fees (Interviews
10,12,13).
3.2 Input into design and location
During the course of conducting interviews almost all schools studied had similar
techniques when deciding who has input into the design and location of new buildings.
This analysis will look at the general groups who are involved within this process, and
what their roles have historically been.
All universities studies within this inquiry have a school council or committee that
is used to determine where a building should be located or how it should be designed, and
although the names may be different (such as Planning and Building Committee or
Project Planning Committee) the roles were the same (Interviews 3,5,9,10). Even though
12 LEED stands for Leadership in Energy and Environmental Design and is designed to be a method to rate
how green a building is by looking at five key areas of human and environmental health: sustainable site
development; water savings; energy efficiency; materials selection; and indoor environmental quality 13 Please note that the arguments for the adoption or rejection of the L.E.E.D. standards will not be covered
in this inquiry paper. It is the author’s opinion that even though the L.E.E.D. standards may have their
flaws, by following them matters of sustainability and environmental issues are brought to the forefront and
are evaluated during the design of the building, which may not have been looked at otherwise.
23
the process used to determine the location and the process used to determine design were
both extremely important each looked at very different aspects of building development.
The methods of deciding the location of new facilities have common elements
among schools studied. The two largest groups within these committees that hold the
most power over the decision of where buildings could be located, (or should be located
on campus) were the university planners and the faculty members (this was often seen at
the larger institutions) but both groups have very different roles (Interviews
3,5,6,7,8,9,10,11,12,13). The university planners need to look at new developments in
terms of direction of the campus master plan and the current level and availability of
building services (for instance the ease of integration into campus physical plant for
water, stream, electricity, sewers, heat, air conditioning) (Interview 10). The faculties are
largely concerned with how their new buildings integrate or interact with their existing
ones (for instance new engineering buildings should be near other engineering facilities
when possible, for ease of faculty services) (Interviews 10, 12, 13).
The decisions involved in the design of a new facility can also be varied based on
the specific institutions involved, one of the similarities evident when conducting the
various interviews was described by one school as a functional plan (Interview 10). This
functional plan stage of design would examine what the required new building or facility
needs in terms of demands from its intended user group. After the university committee
(or council) approves the functional plan the next steps in the design process in
simplified terms would be: Funding Approval Architectural Design Building
Construction (Interviews 5,7,10,13).
3.3 What is the intended functionality of new buildings?
In order to understand whether a new building’s functionality is reflective of its
sustainability, this analysis will look into why a building’s functional design is
increasingly becoming important as it relates to its sustainable use on campus. This
analysis considers such factors as: a buildings designed purpose; the integration of new
buildings with older ones or the surrounding environment and its effect on campus
growth.
24
3.3.1 A building’s designed purpose
To examine how a building’s designed purpose is important to the sustainability
of the building and to the perception of the building for the intended users, one of the
questions that was asked during the course of the interviews was: Are there any
buildings on campus that in retrospect, you would have preferred were designed and/or
located differently? Not surprisingly the general answer was yes from all those who were
interviewed, however to be fair some did point out their campuses were older with
several historic buildings and that when these buildings were constructed, sustainability
and adaptability were probably not developed into their designs (Interviews 2,5,7,8,9,10)
In hearing these responses the same question was asked regarding buildings that were
constructed within the last 10-years, the result interestingly yielded the same result. What
was interesting was that the problems or limitations that were brought up about these
buildings were not complaints about the aesthetics but rather the functionality of the
building in that it was not designed to the full potential required by its targeted user group
(Interviews 1,2,6,7,8,10). Although this answer can at first be a bit discouraging, it is
important to note that at most schools there is evidence that user functionality and
building sustainability is slowly being implemented in new building design. The
evidence of this was the answers provided for the following interview question: To your
knowledge, is future functionality being considered for new building design and
construction? While all schools did mention that they actively wanted to pursue a
building development policy focusing on sustainable or even in some cases14 adaptable
buildings, this report will highlight a few of the fairly large ongoing initiatives.
1. Several schools are looking at creating student-focused buildings to be adaptable
overtime to reflect current technologies (Interview 3,4,5,9,13). One example of
this type of adaptable building is a library that uses compression shelving to store
books to allow more space for students study area while still maintaining its
collections. One school that was interviewed was planning on taking the idea of
compression shelving to a more complete level, in that they are replacing printed
texts and journals as they become available with electronic versions, while
14 This sometimes is not possible because some of the new constructions are purpose built such as
residences, hazardous lab spaces, etcetera.

25
placing an emphasis on people and the space they require, therefore as more
electronic media replaces printed material the area available for student work will
be gradually increased (Interview 3,5).
2. Several schools have started to adopt L.E.E.D. standards into some of their new
developments (Interview 2,3,5,9,10,13), however as was mentioned in section 3.1
only one school has created a policy that all new buildings being constructed are
required to be L.E.E.D silver minimum certification (Interview 10). This policy is
a very ambitious one because the additional planning and documentation will be
required to be completed before a building can receive its certification (given after
the building is completed). The reason why this policy is significant is not only
because the school has said that it will enforce L.E.E.D. certifications but the fact
that it was spearheaded primarily by one individual who wanted to see a change in
the way buildings were looked at and developed.
3. The University of Toronto St. George Campus, has developed an innovative
building for the biological sciences, which uses several functional technologies to
allow it self to be more adaptable to needed change in the future. This building is
the Centre for Cellular and Bio-molecular Research (CCBR). Functionalities
such as utilities (lights, electrical) are located in exposed ceiling tracks for
maximum flexibility of equipment location and labs are space adaptable because
of moving partitions; and 40% of the building was left unfinished as shell space
that can be use to accommodate future expansions within the faculty using this
building (Lum, 2006).
3.3.2 Building integration and campus growth
A second key aspect of a building functionality as it relates to existing building
policies is how new buildings are being integrated within the existing campuses, and their
effects on overall campus growth.
Two questions were asked of all the individuals who were interviewed: What
considerations are given to the integration of new building development within the
existing/surrounding environment on campus? and Do you feel that the direction and rate
of new construction and growth reflects the aspirations set forth within your institution’s
campus master plan? One of the most straightforward answers received that summed-up

26
the difficulties in balancing building integration and campus growth in that the challenge
from a future use or sustainability point of view is to be able to marry older technologies
into newer more efficient systems (Interview 13). This became evident when touring
around some of the older universities, such as the St. George Campus of the University of
Toronto, Guelph and McMaster, and seeing how these schools need to be conscious of
how retrofits and new building are planned and located so as not to detract from some of
the more historic buildings and open space areas.
There is a basic level of integration that all of the institutions adhere to, in that
the new building designs try to incorporate the different
aesthetics/architectural/environmental features from the new building’s planned
surroundings (Interviews 7,8,10,12,13). This is the same sort of policy that is seen within
various different campus master plans studied for this inquiry. These are a few examples
from some of the master plans from the schools being studied:
Guelph University: Campus Master Plan
“Project sites will be selected to preserve campus assets, favor the repair of
problem sites, and avoid compromising good quality buildings and landscapes”
(University of Guelph, 2002)
“Building design must be of its time but take inspiration from the original older
buildings.” (University of Guelph, 2002)
McMaster University: Campus Master Plan
“New buildings, additions to historic structures, … will be sensitively designed
and carefully reviewed to ensure an appropriate fit with the architectural character
of the building, the historic image they create, and their relationship with the
Cootes Paradise Ravine and other important open spaces.” (McMaster University,
March 2002)
Brock University: Campus Master Plan
“A bold and modern architectural expression in keeping with the existing
academic buildings will be encouraged for all new buildings, both academic and
residential” (Brock University, 2003)
However, what is not clear is whether these policies within the various plans have any
bite or enforcement to them. In addition to this what is not stated or implied within the
27
studied Campus Master Plans (as it relates to new building integration) is that one of the
largest constraints that can affect the level of integration is economics (Interview 7). This
is because some of the various historic buildings used materials that can be quite cost
prohibitive (for instance marble) for new buildings.
In response to the second question, the general findings are:
1. For some of the schools it has been a learning process. Their campus master plans
were so rigorous in when growth would be anticipated or required, that they have
had to remove or plan expansions because more information became known after
the document was written (Interview 3,4,5,13).
2. One aspect of the various campus master plans is that most were written several
years ago, and some of those interviewed were very surprised at how fast their
school had grown population wise yet the Campus Master Plans remained
adaptable and robust enough to maintain on course (Interviews 3,10,11,12,13).
3. Most of those who interviewed agreed that for the various Campus Master Plans
to be successful they needed to be living documents not static ones, in order to be
able to adapt to unforeseen changes in university policies, or to add beneficial
changes to university policies (include sustainability criteria into building designs:
L.E.E.D. / CBIP programs) (Interviews 3,4,5,9,10,11,12,13).
3.4 Land-use policies
In examining the current land use restrictions in the several campuses being
studied, there are mainly three categories that these restrictions are placed into.
1- The campus development area is predefined by man-made barriers such as
existing structures (as is the case in the University of Toronto at St George,
McMaster, Wilfrid Laurier) or by natural boundaries such as rivers, ravines,
escarpment (as is the case of McMaster, Brock, University of Ontario Institute of
Technology, University of Toronto at Mississauga)
2 – City and Municipal zoning and regulations.
3 – The development area is specifically defined by university policy: Campus
Master Plan; Green Plan.

28
The first and second categories will not be discussed within this report due to the
following issues: each school is located within a different geographical area that may
require policy decisions that are unique to those schools; the various city and municipal
regulations is beyond the scope of the central inquiry topic. The main focus of this
section will examine the various existing university policies that govern land-use at their
individual institutions.
In reading the various Campus Master Plans and interviewing individuals of those
campuses there are some similarities on how land-use is governed. The first similarity
that was mentioned in both interviews and Campus Plans, is the current and future
preservation of a centralized green space or gardens, which have taken on significant
historical and aesthetic significance at those schools (Interviews 1,2,3,4,5,7,8,9,10).
Examples of these spaces are Johnston Green at Guelph, and the Front and Back Campus
Greens at the University of Toronto at St George. The second similarity is that some
schools state within their Campus Master Plans the need for pedestrian friendly building
development, by encouraging dense growth for new buildings (Brock University, 2003)
(University of Toronto, 1999) (McMaster University, March 2002) (Guelph University,
2002). The last similarity that will be discussed is how several of the universities have
specific policies, on the land-use for development facing outside the campus into the
surrounding community (University of Ontario Institute of Technology, 2001) (McMaster
University, 2002) (University of Toronto at Mississauga, 2000) (University of Guelph,
2002). These are specific policies outlined within the various Campus Master Plan to
“provide gateways with distinctive landscape and architectural features that announce
“arrival” to campus” (McMaster University, March 2002). The impression on the author
is that these types of policies are in place to present attractive outward images of the
university to it’s surrounding community.
3.5 Energy
The most significant factor when looking at existing building policies with respect
to the investigation of the central question was Energy15
, this was reflected in all
15 It is important to note that Energy will largely be defined as Electrical (from a variety of sources)

29
interviews that were conducted in the research of this inquiry (Interviews
1,2,3,4,5,6,7,8,9,10,11,12,13).
3.5.1 Current and predicted electrical capacity
Ontario’s current state of electricity production is at one of the most strained
points in its existence, in that there is less capacity in its current state than there was 12
years ago and yet demand tends to remain on the increase (Ontario Power Authority,
2005). This is a problem that not only threatens the sustainability of Ontario’s University
institutions but also is cause for concern within other residential and commercial uses, as
(Ontario) society progresses into the near future.
The most currently available data (provided by IESO) for provincial power supply
within Ontario (Figure 3.5.1.1), results in two initial observations:
1) The three most significant generation sources over the past year were Nuclear,
Hydro and Coal-fired plants. It is also evident that nuclear energy is responsible for
close to half of the required electricity for the Province of Ontario, with Hydro and
Coal-fired taking up a significant chunk of the remaining second half.
2) In each of the 12 months listed within this observed period, imports were
necessary to help the required provincial demand, indicating that the current capacity
delivered may not be enough.
Figure 3.5.1.1 Available sources of electrical power generation and their output over
a year period between July 2005 and July 2006 (IESO, 2006)
30
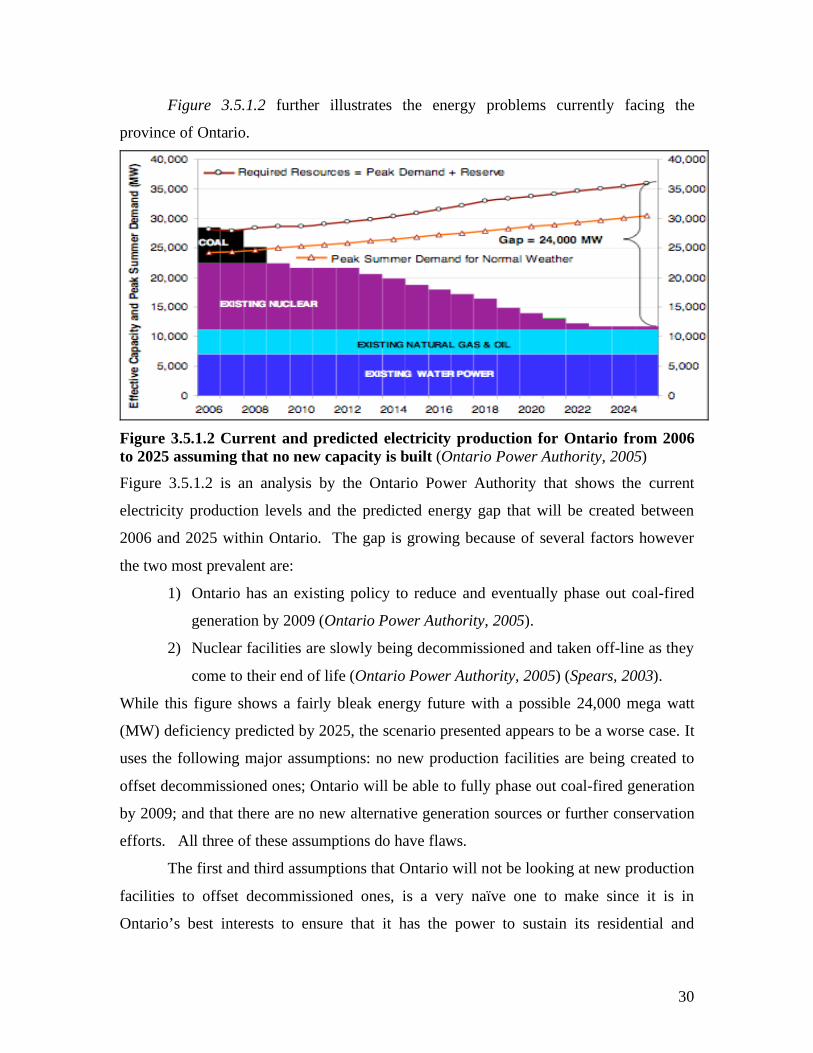
Figure 3.5.1.2 further illustrates the energy problems currently facing the
province of Ontario.
Figure 3.5.1.2 Current and predicted electricity production for Ontario from 2006
to 2025 assuming that no new capacity is built (Ontario Power Authority, 2005)
Figure 3.5.1.2 is an analysis by the Ontario Power Authority that shows the current
electricity production levels and the predicted energy gap that will be created between
2006 and 2025 within Ontario. The gap is growing because of several factors however
the two most prevalent are:
1) Ontario has an existing policy to reduce and eventually phase out coal-fired
generation by 2009 (Ontario Power Authority, 2005).
2) Nuclear facilities are slowly being decommissioned and taken off-line as they
come to their end of life (Ontario Power Authority, 2005) (Spears, 2003).
While this figure shows a fairly bleak energy future with a possible 24,000 mega watt
(MW) deficiency predicted by 2025, the scenario presented appears to be a worse case. It
uses the following major assumptions: no new production facilities are being created to
offset decommissioned ones; Ontario will be able to fully phase out coal-fired generation
by 2009; and that there are no new alternative generation sources or further conservation
efforts. All three of these assumptions do have flaws.
The first and third assumptions that Ontario will not be looking at new production
facilities to offset decommissioned ones, is a very naïve one to make since it is in
Ontario’s best interests to ensure that it has the power to sustain its residential and
31
commercial sectors. To support this view one needs only to view the press releases
produced by the current Ontario Government and its Ministry of Energy; which report
initiatives to increase hydroelectric capacity (Office of the Premier, 2006), adding
additional nuclear capacity (to remain at the current 2006 levels of 14,000 MW) (Ministry
of Energy, 2006), and alternative energies (Office of the Premier, 2006). Considering the
second assumption that Ontario will be able to fully phase out coal-fired generation by
2009, there appears to be much debate within the current Ontario government on whether
or not it is feasible to accomplish that within this time frame (Energy Probe, 2006),
indicating that coal-fired generation may possibly supply more than Figure 3.5.1.2
predicted. However these assumptions aside, there is potential trouble ahead if energy
conservation is not viewed as a high priority.
3.5.2 Energy’s effect on university building development policies
To study the effect that energy use and consumption is beginning to have at the
various universities, this analysis examined types of energy initiatives these institutions
are currently researching or have implemented and what factors have attributed to the
need for these changes.
In conducting the interviews there is a general sense of concern for energy
use and the how the costs of energy have continued to increase disproportionately to what
would be expected, even after accounting for new building development (Interviews
2,3,4,5,7,8,10,11,12). This increase is especially apparent when discussing utility bills
that saw the costs increase several million dollars per year in the case of some campuses.
(Interviews 10, 12) In examining how these increased energy costs have affected existing
and new building usage and development, this inquiry will present some solutions that
seem fairly consistent at all the schools studied, then discuss some approaches that were
unique to individual schools (or groups of schools).
How are these emerging energy costs affecting the current constructed campus
building energy policies? One common theme in all interviews, was the concept of
utilities retrofits, where aging existing infrastructure and technology is decommissioned
and replaced with modernized more energy efficient ones (Interviews
1,2,3,4,7,10,11,12,13). The easiest and most cost effective solution that has been
32
implemented (or is in the process of being implemented) in many of the schools, is the
conversion of buildings from using 60-watt incandescent lighting to using 13-watt
compact fluorescent lighting. To give an idea of one schools level of success, after
retrofitting their residence buildings they predicted an annual savings of approximately
$60,000 at a cost of $15- $20,000 for 6600 conversions, indicating an initial return on
investment to be less than half a year. (Interview 8) A second popular retrofit that has
also been widely implemented is in replacing a building’s standard glass windows to a
reflective better insulating glass (Interviews 2,8,10,12,13).
In addition to the retrofitting of existing buildings on campus there is evidence to
suggest that in several schools, energy use and conservation is starting to affect the ways
in which new buildings are built and designed. One change that was noticed in some
institutions was the use of L.E.E.D. standards (not necessarily following through with the
complete certification) and/or designing buildings under the guidelines of the
Commercial Building Incentive Program (CBIP) (Interviews 3,4,5,7,10,11,12,13). This
section will largely focus on CBIP because it is an initiative that is specifically designed
to encourage investment into creating energy-efficient building design (Office of Energy
Efficiency, August 2006), and while L.E.E.D. standards do look at energy use within their
mandate (Canada Green Building Council, 2003) do not solely focus on them.
CBIP funding is based on two documents developed by the Canadian
Government: Model National Energy Code for Buildings (MNECB) (Office of Energy
Efficiency, April 2006); the CBIP Technical Guide (Office of Energy Efficiency, May
2005). The main requirement that a new building must comply with to be eligible for the
CBIP funding, is that it must demonstrate a minimum energy efficiency increase of 25%
compared to the minimal standards set forth in MNECB and applications must be
submitted before March 31 2007 (Office of Energy Efficiency, August 2006). Eligibility is
determined using energy performance simulation software (EE4 (CAMNET, 2006))
developed by the CANMET Energy Technology Centre (CETC), a subsidiary of Natural
Resources Canada: Sustainable Building and Communities, to look at how a building’s
energy efficiency compares to the minimum energy requirements set in MNECB (Office
of Energy Efficiency, August 2006). The funding or incentive that CBIP provides is equal
to twice the difference of the estimated annual energy cost savings between the CBIP
33
approved design and one built to MNECB requirements, and is a one-time financial
incentive (Office of Energy Efficiency, August 2006). An example calculation is shown in
Table 3.5.2.1.
Table 3.5.2.1 Example of CBIP incentive amount
Estimated annual energy costs
(MNECB requirements)
$200,000
Estimated annual energy costs
(CBIP approved design)
$170,000
Estimated annual energy cost savings $30,000
CBIP incentive $30,000 x 2 = $60,000
Table 3.5.2.1 show the maximum amount of funding available through CBIP per building
project, with up to a maximum of six projects or $250,000 in financial incentives per
institution (Office of Energy Efficiency, August 2006). The significance of the CBIP
incentive program in comparison to the L.E.E.D. certification is that it offers an
institution financial compensation to help with the costs of integrating more energy
efficient technologies into new building design.
Examples of energy innovation and design
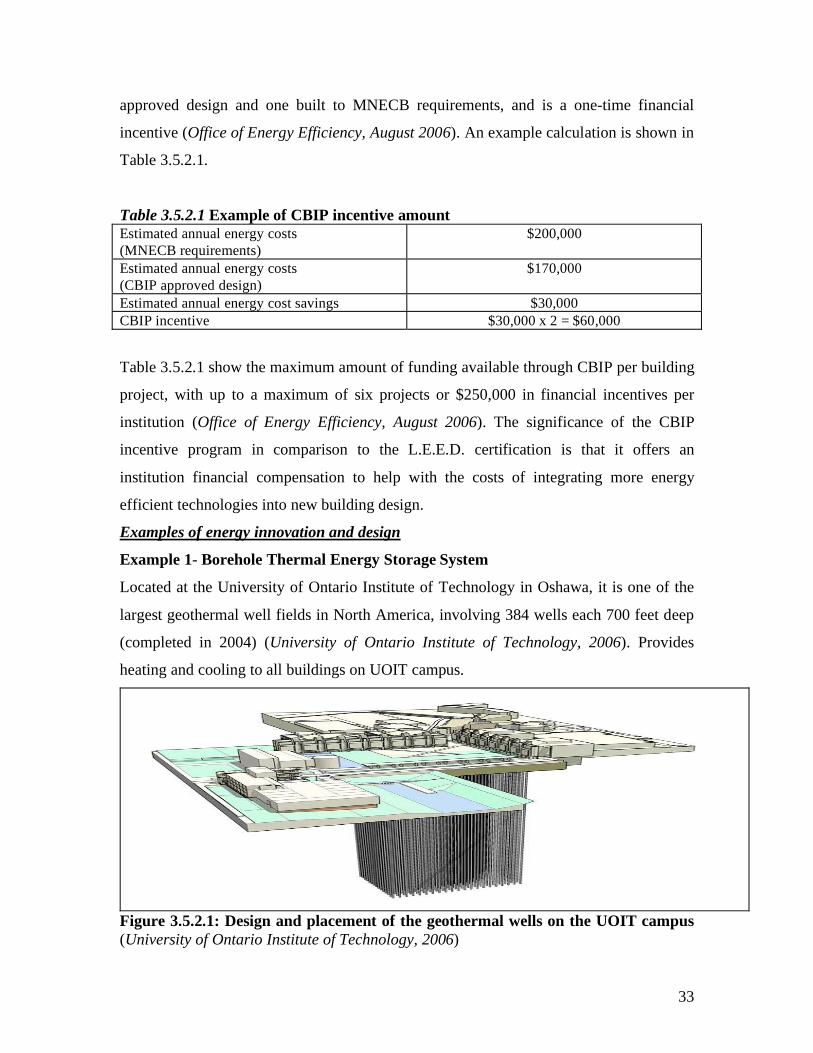
Example 1- Borehole Thermal Energy Storage System
Located at the University of Ontario Institute of Technology in Oshawa, it is one of the
largest geothermal well fields in North America, involving 384 wells each 700 feet deep
(completed in 2004) (University of Ontario Institute of Technology, 2006). Provides
heating and cooling to all buildings on UOIT campus.
Figure 3.5.2.1: Design and placement of the geothermal wells on the UOIT campus
(University of Ontario Institute of Technology, 2006)

34
Example 2- Campus Renewal Partnership (McMaster University, 2006)
This initiative is currently occurring at McMaster University, in Hamilton. This is a
partnership started in the fall of 2003 between Ameresco (an energy consulting firm) and
McMaster for the energy reduction and the renewal of McMaster facilities, with respect
to structures retrofits and functionality (McMaster University, 2006). Key highlights of
the program are shown in Table 3.5.2.2.
Table 3.5.2.2: Key highlights of campus renewal partnership at McMaster
(McMaster University, 2006) McMaster is currently saving $1.5 million annually in utility costs
Even with steady campus growth McMaster is still exceeding saving targets by 7%
In 2005 McMaster reduced GHG emissions by 11,252 tonnes
Example #3 - The Centre for Emerging Energy Technologies
This is an initiative that started in 2003/04 at the University of Toronto at Mississauga
(UTM) that looks at incorporating alternative or energy efficient technologies into its
campus. UTM is able to do this cost effectively because they see themselves as early
adopters of technologies and are therefore able to receive corporate and government
grants/donations. Some of the initiatives they are currently investigating are:
Microturbines, Photovoltaic arrays, Hydrogen Technologies (University of Toronto at
Mississauga, 2006).
Example #4 - One school is planning on implementing a system where the utilities cost
will no longer be paid for by the institution’s physical plant, but rather the costs will be
passed directly to the various faculties within the university (Interviews 3,4,5,7). This
policy is significant because the intention of its implementation is to force the various
faculties that make up this particular campus to evaluate their energy use, and actively
seek ways to conserve in existing and future buildings.
4.0 Stakeholders
While it is important to look at what drives the need for new buildings or what the
existing policies for building development are, to properly address the central question
the focus should also include how a stakeholders’ participation (or in some case lack
thereof) can influence the direction and sustainability of a campus. The term stakeholder,

35
refers to individuals (or groups) that are affected (directly or indirectly) by the increased
development on campus. There are 4 main stakeholders groups that this inquiry will
focus on: Administration; Faculty and Staff; Students; and Community. The methodology
that will be used for this analysis is journal research on stakeholder relations within
universities and personal interviews at each of the schools being studied.
4.1 Understanding the University-Community Relationship
Universities are a part of a greater community or city and are therefore subjected
to constraints by way of regional and zoning laws in addition to their own policies and
guidelines.16 In acknowledgment of this, the first stakeholder relationship that will be
addressed is the University-Community partnership, where the University group is
comprised of all on-campus stakeholders (administration/ faculty and staff/students) as
one group representing one focused voice and the Community groups will comprise of the
permanent residents, and Non-Governmental-Organizations (NGO) within the direct
geographic area.
The reason why these partnerships are often formed between the university and its
surrounding community is usually one of mutual benefit for both groups. They are built
with overlapping interests that for the most part are focused on improving/maintaining
community conditions (Baum, 2000). For instance the University group relies on services
such as entertainment, accommodation (availability of rental properties), and other
essential services such as financial and medical, while the Community group benefits
from the availability of university resources17 and a fairly stable and reliable employer
(Lederer & Seasons, 2000). With these mutual benefits in mind, it is also important to
remember that these types of partnerships are not without their inherent problems.
Universities in the past have often faced harsh criticism because of the differences in
lifestyles between the student communities and permanent residents (of that area),
because they can be responsible for student slums 18 and subsequent transportation
congestion issues (Lederer & Seasons, 2000). It is because of these inherent problems
16 Due to the complexity involved in analyzing the municipal regulations for all eight schools (all located
in different municipalities) the city/or regional constraints will not be analyzed within this inquiry. 17
Resources such as libraries, athletic centers, restaurants, etc 18 Low rent, population dense area primary comprised of student tennants

36
that there could be a cause for concern for outside communities looking at forming local
university-community partnerships but there is evidence to show that the university
groups are understanding and taking their role within this partnership more seriously.
One key indicator that seems to point to this envisioned new commitment from the
various urban located universities (towards their surrounding communities) can be
observed within the future direction set forth within their campus master plans.19 This is
especially true with some universities defining explicit policies regarding their proposed
continuing community partnerships, such as McMaster (McMaster University, March
2002) and the University of Toronto (at St. George) (University of Toronto, 1999).
Simply stated many schools are beginning to comprehend that in order to protect their
immediate and future interests they need to protect their surrounding environment, create
innovative developments and be willing to learn from as well as teach the stakeholders
within their partnered communities (Lederer & Seasons, 2000) (Keating & Sjoquist,
2000).
Whether community stakeholders have any significant influence behind the need
for new buildings or creating building development policies, has been more elusive in
resolution, because each school and community presents it own set of problems. The
simple answer is that historically the surrounding community has had little20 to no impact
on campus-based policies as it pertains to the sustainability of campus facilities, this is
the consensus of several of the interviews (Interviews 2,3,4,5,6,9,10,11,12). However
this does not mean that the surrounding community does not have a vested interest in
seeing their local campuses continue to sustainably grow and thrive (due to the benefits
previously described). To reinforce this there are some 21 who believe there are methods
to ensure that universities can significantly benefit from increased collaboration efforts
with their surrounding communities. Baum, recommends that there are four steps to
creating a successful university-community partnership, and while they do not directly
pertain to new building future sustainability, in the opinion of the author they are actions
19 Please note that at the time of this inquiry neither York University nor Ryerson University had released a
current campus master plan. 20 One example where community involvement did help play a significant role was with the Bahen Centre
at University of Toronto (St. George Campus), in that the community and various campus groups wanted
an existing historic building (Victorian house) incorporated into the new design (Interviews 2,7) 21
Howell S. Baum; David N. Cox; Larry Keating and David L. Sjoquist to name a few
37
that a university can take to ensure they maintain healthy partnerships with their
surrounding communities.
1. Match Resources to Purposes: In that all affected groups need to be able to
manage and allocate their key resources. With the three most important being
knowledge, time, and money (Baum, 2000)
2. Make Funders Partners: If all affected groups have a vested interest in a projects’
development, it will reinforce a strong sense of responsibility for them and this
will in turn provide for more constructive influence in products planning and
development (Baum, 2000)
3. Make Partners Accountable to One Another: All groups must be willing to
commit themselves and follow through on projects. In that they must be willing to
give their time, knowledge, authority and resources, and be accountable for what
they have agreed to commit (Baum, 2000). The purpose of this is to discourage
groups from benefiting without contribution.
4. Organize, Continually: This is important because for the partnership to be
successful it must be worked at: work groups need to be developed; constructive
meetings need to be held; framework needs to be developed to create and
implement plans; and plans need to be in place to find successors as individuals
leave the partnership (Baum, 2000)
4.2 Understanding the Administration-Faculty/Staff-Student Relationship
The next relationship that will be examined is the interaction between the
stakeholders that comprise the university group discussed within the previous section.
To give an indication of how these three stakeholder groups are inter-dependant,
Figure 4.2.1 represents how an ideal interaction between the three would conceptually
look like.

38
Figure 4.2.1 Proposed ideal interaction between on-campus university stakeholders
It shows that all three stakeholders should have an equal voice and vested interest within
the university group. However after visiting the many campuses and conducting
interviews, the reality is that the student voice has historically had little impact on the
need for new buildings, building policies or building sustainability assessments
(Interviews 1,2,6,7,8,10,11).
There appears to be a communication breakdown not only between the
stakeholder groups but also within each of the stakeholder groups themselves (Interviews
1,2,6,8,9,10,11,12). To give an idea of the impression that was given, please refer to the
following flow diagram:
Figure 4.2.2 Generalized perceived state of current university group stakeholder
communication
While on the surface it would seem that there was an established flow of information
between all involved stakeholders, it was evident within certain interviews that not all
stakeholders (particularly the students) knew the extent of the projects or initiatives that
were being developed within their own universities (Interviews 1,6,8). The tools22 for
communication are available, however there is a problem within the implementation, in
that there isn’t a central medium where all the information can be accessed within one
place.
22
Sources available to all stakeholders within the university group include: administrative websites;
university planning websites; student initiative websites; physical plant websites; and capital project
websites

39
While there may be several solutions to this disjointed-communication problem,
this inquiry will focus on just one potential strategy. The proposed solution was inspired
by a case study developed by Robert L. Shelton (2000), in which he looked at the
significance of the institutional ombudsman in resolving many of the academic disputes
between many of the various stakeholder groups that one would encounter in a university.
The proposed idea is to create a developmental ombudsman, who would look specifically
at the interactions between the various university stakeholder groups in relation to
ongoing facilities growth and development at the institution. The proposed interaction
would resemble the following flow diagram:
Figure 4.2.3 Proposed communication method for university group stakeholders
By using a system such as this the developmental ombudsman acts as a central hub for
communication between all three-stakeholder groups, and facilitate in an easier
transference of information. The primary medium recommended for relating the current
development issues could be the use of newsletters, however an easier method would be
to use the existing user base and distributions networks of the university or community
papers. Taking out one to two pages to list and answer the following: What projects are
currently in development?; Who will these projects affect?; Why are they being done?
Etc.
5.0 Policy recommendations and closing remarks:
The final component that will be looked at is the future policy recommendations,
as they relate to the central question of this inquiry. These will be based upon the
information discussed previously within sections four, five, and six of this report, and
from the interviewed responses for the following question: Is there anything within the
40
current new development process or existing development policies that you would like to
see changed?
1: Developmental Ombudsman Staffing Policy
This policy stems from the recommendation on how to remediate the
communication problem discussed within section 6.2. The developmental ombudsman
role is to act as a central point of contact for communication between the three university
based stakeholder groups (Administration, Students, Faculty/Staff) as it relates to the
various initiatives and development projects that are ongoing at that particular school.
This policy can help new campus facilities to be more sustainable in the future for 2
reasons: as communication is increased between all involved stakeholders, buildings can
be better designed and located to ensure that they will be used to the full extent needed by
the users of these facilities; and the use of a developmental ombudsman will provide an
unbiased channel to voice concerns and suggestions for future development.
The implementation of the developmental ombudsman would include the hiring
of one person who is external from the school, in that they cannot be a current member of
the administration, faculty/staff personnel or student (this is done to help ensure
impartiality). The hiring process would involve a panel interview with representatives
from all three stakeholder groups. He/she would be responsible for setting up an office
accessible to all three stakeholder groups, and would be responsible to attend the various
general meetings held by each of the stakeholder groups to speak and answer questions.
He/she is also responsible for delivering a written summary of the current and proposed
on campus development within the school paper/website once per month during the
school year. While not initially proposed this position may also work with the university-
community liaison(s) to development plans to the surrounding communities.
2: Utility Accountability Policy
This policy is based upon one of the energy initiatives currently being
implemented by one of the universities being studied (as mentioned in section 5.6.2), and
the desires expressed by one of those being interviewed (Interview 10). This policy can
help new campus facilities to be more sustainable in the future because it requires the
users (Faculties, Departments, and Ancillary Operations) to evaluate their current use of
university utilities, and look for ways to conserve and save on costs. This can especially

41
be true when faculties want to build new buildings, because now there is incentive for
them to be involved at looking at more efficient energy saving technologies and using the
recovered savings towards upgrading older facilities.
The implementation of this policy would require extensive effort but the energy
savings could be substantial. The following are the general steps that would have to be
initiated to start such a policy:
i. An energy audit would need to be performed for all existing facilities to
determine how much power each room used while in use. Energy meters would
need to be installed on labs, and experimental facilities.
ii. The school administration would have to reevaluate how tuition and other sources
of income are split between department/faculties and required school costs
(maintenance, employee salaries etc.) in order to be able to cover current levels of
utility use.
iii. Teaching schedules need to be evaluated to see the required number of lecture
hours required by the teachers of various faculties, this is cross referenced with
the size and energy requirements of the required classroom, and a cost is
calculated
iv. For labs, the costs need to be calculated monthly by the installed metered readings
v. In cases of external research an additional energy cost may have to be included
into fees currently charged by the schools
3: Combined Operational and Construction Cost Policy
This policy is based on several of the interviews conducted (Interviews
2,3,5,8,10,11,12), and seeks to address their growing concern that there is a divorce
between the construction and operation costs for new or proposed buildings because
traditional building design has not considered the potential utility and maintenance costs
that will be associated after its construction. This policy can help new campus facilities
to be more sustainable in the future because more informed decisions can be made by the
school’s building development committees or various board groups as to what a more
complete cost for a building will be and not just the sticker price for construction.
The implementation of this policy would also require extensive effort as was the
case with Policy 2, but in this case both the operational and maintenance savings could be

42
substantial. The following are the general steps that would have to be initiated to start
such a policy:
i. Once there is a desire for a new building on campus, the normal groups of
committees are formed (described in sections 5.1 and 5.2)
ii. After the proposed use and functional plan of the new facility is established,
architects, design consultants, and utility/energy consultants are brought in and
work together to create the building design. It is at this point that the concept of
building sustainability must be introduced to the project, so that it can be
incorporated into the design from the start of planning and design. Sustainability
must not be an afterthought, in the design process.
iii. The development plan would then follow the regular channels described in
sections 5.1 and 5.2
4: Building Utilization Policy
The issues discussed in sections 4 and 5.3 influenced this policy. This policy
looks to create a 6 day (or 7 day) academic week as opposed to the 5 day week discussed
in section 5.3. This policy can help new campus facilities to be more sustainable in the
future because it will allow a better utilization of current buildings (by accommodating
more students) and reduce the perceived pressure to develop new buildings that will
require more of the universities financial resources. An example of a better utilization
would be seen in requiring the building of less 300+ seating lecture halls. The required
space could be made up by shifting some first year (or large) classes to Saturday or
Sunday, therefore the majority of new buildings can be designed to accommodate other
needs or university groups.
The implementation of this policy might initially face student and/or faculty resistance,
however it is a solution that may prove more cost effective than the rapid construction of
a new building. The following are the general recommended steps for implementing this
policy:
i. Need to approach the teaching unions to discuss why this policy is being
implemented, and to suggest the addition of teacher’s scheduled days off to
ensure that if they need to have classes on weekends that this time will be
available to them during the course of the week. Another alternative would be to
43
also offer rotating days, where they would only be required to have one or two
weekend lecture sessions per month. Once the teaching unions have agreed, the
same may need to be done for the Teaching Assistants (T.A.), Janitorial staff,
Physical Plant etc.
ii. Approach the registrars office to create new class schedules and room locations
before the start of fall classes, preferably before the start of student registration.
One important aspect of this policy is that the effects can be studied one year and if the
results are not as was anticipated, the policy can be modified before the next academic
school year.
5: CBIP Program Extension Policy
This policy is also based upon one of the energy initiatives currently available to
all the universities being studied, and it involves the reevaluation by the Canadian
Government to extend the CBIP program beyond its current termination date of March
31st 2007 or to develop a similar program to take its place after this date. This policy can
help new campus facilities to be more sustainable in the future because it provides
government financial incentive to look at developing and constructing energy efficient
buildings.
The implementation of this policy would require the various universities within
South-Western Ontario request that the Canadian Government extend the program, or
develop another similar one to replace it. One way to influence the Government’s
decision would be to have key school figures (i.e. presidents, physical plant director,
university planners) lobby the Office of Energy Efficiency to voice their appreciation for
the program. Possible suggestions for the program could be the following:
i. Remove the maximum cap limit from six buildings
ii. Extend the program to 2010, to allow the next wave of university
buildings to be built
iii. To create a competition and award an addition CBIP incentive for the
building that was able to create and sustain the largest annual energy cost
savings (at the end of the extended program)

44
The proposed five policies are intended to be a step towards creating university
campus facilities that will strive to be sustainable or at least attempt to improve upon
their current development policies. These policies were developed in such a way that
they could be adopted by any of the schools that were studied within this report, however
it is important to remember that these policies provide generalized steps and that the
various schools may have to modify/adapt some of the implementation aspects to better
suit their organizational structure.
Acknowledgements:
I would like to thank the following people who have helped me greatly in the direction and development of this research project, by providing me guidance and feed-back throughout the several working drafts.
Mr. Cam Churchill Dr. Gail Krantzberg Mr. Anthony Cupido
I would also like to thank the following people for allowing me the privilege of interviewing them as I was conducting research for this project.
Mr. Scott Walker Ms. Gillian Maurice Mr. Matt Leiss Mr. Anthony Cupido Ms. Linda Axford Dr. Beth Savan Ms. Holly A. Jordan Mr. Ray deSouza Dr. Christopher H. Chen Mr. Ben Louie
Mr. Ralph Aprile Mr. Ron Dupuis Ms. Elizabeth Liu
References:
Journals:
Baum, Howell S.. Fantasies and Realities in University- Community Partnerships. Journal of Planning Education Research Vol. 20 Y2000
Keating, Larry. and Sjoquist, David L.. The Use of an External Organization to Facilitate University-Community Partnerships. Cityscape: A Journal of Development and Research Vol. 5 No.1 Y2000
Lederer, Jeff. And Seasons, Mark.. Understanding the University-Community Alliance: The Waterloo Experience. Canadian Journal of Urban Research. Winter Y2000

45
Shelton, Robert L.. The Institutional Ombudsman: A University Case Study. Negotiation Journal January Y2000
Electronic Media:
Brock University. Campus Master Plan. February 2003
http://www.brocku.ca/campusplan/ Brundtland Commission: Brundtland Report. 1987
http://www.are.admin.ch/imperia/md/content/are/nachhaltigeentwicklung/brundtland_bericht.pdf?PHPSESSID=63c83f8729050a84e4c6786f6fa70810
Canada Green Building Council. Building Rating Systems: LEED Ratings System. Posted 2003 http://www.cagbc.org/building_ratings_system.php
CAMNET. Energy Technology Center. Natural Resources Canada: Sustainable Buildings and Communities. EE4 Software. Posted: August 9th 2006 http://www.sbc.nrcan.gc.ca/software_and_tools/ee4_soft_e.asp
Council of Ontario Universities Inventory of Physical Facilities of Ontario Universities 2004-2005. PDF document released December 2005 http://www.cou.ca
Council of Ontario Universities Facts and Figures: A Compendium of Statistics on Ontario Universities 2000 PDF document released March 2002 http://www.cou.ca
Council of Ontario Universities Facts and Figures: A Compendium of Statistics on Ontario Universities 2005 PDF document released January 2005 http://www.cou.ca
Council of Ontario Universities Facts and Figures: A Compendium of Statistics on Ontario Universities 2006 PDF document released July 2006 http://www.cou.ca
Energy Probe. Electricity Supply for Ontario: Excerpt House Hansard Session 38.2. June 13th 2006 http://energyprobe.org/energyprobe/index.cfm?DSP=Content&ContentID=15898
IESO (Independent Electrical System Operator). Released August 10th 2006 http://www.ieso.ca/imoweb/siteShared/monthly_update.asp?sid=bi
Government of Ontario. CNW GROUP-Ontario News Room. Ministry of Training, Colleges and Universities Record-Breaking Enrolments Expected at Ontario Colleges and Universities September 6th 2006 http://ogov.newswire.ca/ontario/GPOE/2006/09/06/c3301.html
Lum, Ken. M.Arch Candidate University of Waterloo. The CCBR Building: University
of Toronto, Ontario. Accessed September 18th 2006 http://www.architecture.uwaterloo.ca/faculty_projects/terri/684_educational.html
McMaster University. Undergraduate Calendar. Accessed: September 13th 2006 http://registrar.mcmaster.ca/CALENDAR/year2006/pdf/index.htm
McMaster University. Campus Master Plan. Released March 2002 http://www.mcmaster.ca/ua/opr/campusplan/master.html
McMaster University. Campus Renewal Partnership. Accessed September 15th 2006 http://ppims.mcmaster.ca/crp

46
Ministry of Energy. (Ontario Government): McGuinty Government Delivers a Balanced
Plan for Ontario’s Electricity Future: Securing Reliability for Ontario’s Long-
Term Electricity Supply. Posted June 13th 2006 http://www.energy.gov.on.ca/index.cfm?fuseaction=english.news&body=yes&news_id=134
Office of Energy Efficiency. (Government of Canada) CBIP Technical Guide. Posted
May 18th
2006 http://http://oee.nrcan.gc.ca/commercial/financial-assistance/new-buildings/apply/technical-guide.cfm?attr=20
Office of Energy Efficiency. (Government of Canada) Commercial Building Incentive
Program (CBIP) for New Buildings. Posted August 4th
2006 http://http://oee.nrcan.gc.ca/commercial/financial-assistance/new-buildings/index.cfm
Office of Energy Efficiency. (Government of Canada) Model National Energy Code for
Buildings. Posted April 13th
2006 http://http://oee.nrcan.gc.ca/commercial/financial-assistance/new-buildings/mnecb.cfm?attr=20
Office of the Premier. (Ontario Government): Ontario’s “big becky” drills to properity. Posted: August 8th 2006 http://www.premier.gov.on.ca/news/Product.asp?ProductID=712
Ontario Power Authority: Supply Mix Advice Report. Posted December 9th 2005 http://www.powerauthority.on.ca/Report_Static/157.htm
Spears, John.. Energy policy needed before lights go out: Nuclear power will be worn out by 2018, Bruce Power calls for an energy overhaul. Toronto Star. November 27th 2003 http://www.energyshop.com/es/contactus/energy_policy.cfm
Statistics Canada: Current Population. May 2006
http://www40.statcan.ca/101/sct01/demo02.htm Statistics Canada Table 051-0011: International migrants by age group and sex, Canada
provinces and territories, annual (persons). May 2006 http://estat.statcan.ca Statistics Canada Table 052-004: Projected population, by projection scenario, sex, and
age group as of July 1. December 2005 http://estat.statcan.ca University of Guelph. Campus Master Plan. October 2002.
http://www.pr.uoguelph.ca/pr/campusmasterplan1.htm University of Ontario Institute of Technology. Campus Master Plan. 2001
http://www.bradjohnson.ca/pages/durham%20/durham4.html University of Ontario Institute of Technology. Faculty of Engineering and Applied
Science. Posted 2006 http://engineering.uoit.ca/facilities/borehole.php University of Toronto. University College Residences Website. Accessed: September
13th 2006 http://www.utoronto.ca/ucres/fallwinter/admis06.html University of Toronto at Mississauga. Campus Master Plan. 2000.
http://utm.utoronto.ca/utmasterplan/3_0.html University of Toronto at Mississauga. The Centre for Emerging Energy Technologies.
Posted: May 10th 2006 http://www.utm.utoronto.ca/1558.0.html University of Toronto at St. George. Open Space Master Plan. Released 1999
http://www.utoronto.ca/openspace/intro.htm

47
Interviews: