Embed Size (px)
Citation preview
SuStainable City Government: operationS Summary 2009–2011
This document was produced as a joint venture among all City bureaus. Sustainability liaisons coordinated writing bureau highlights and data gathering while the Bureau of Planning and Sustainability facilitated compilation, data analysis and editing.
bureau Sustainability liaisonsAbby Coppock, Office of Management and FinanceGenny Dupre, Bureau of Emergency CommunicationsJohn Dutt, Office of Neighborhood InvolvementStacey Foreman, Office of Management and Finance, ProcurementWendy Gibson, Office of Management and FinanceRich Grant, Portland Bureau of TransportationEmily Hauth, Bureau of Environmental ServicesMatt Jaffe, Government RelationsCarol Justice, Office for Community TechnologyKaren Lavoie, Portland Police BureauKim McCarty, Portland Housing BureauCaitlin McCollum, Portland Bureau of TransportationJulie Morrow, Fire and Police Disability and RetirementPam Neild, Bureau of Planning and SustainabilitySally Noble, Portland Parks and RecreationSid Palmer, Portland Fire and RescuePatty Rueter, Portland Bureau of Emergency ManagementHeather Saby, Printing and DistributionJanet Senior, Portland Water BureauJason Smith, Portland Parks and RecreationGreg Supriano, Bureau of Development ServicesMichele Whaley , Portland Development CommissionBen Walters, City Attorney
additional ContributorsMany of these staff members work on sustainability-related initiatives and policy development in their job, and they have offered their knowledge and insights to further the findings in this summary. Special thanks are due to:Nick Atanasov and David Olsav, Bureau of Environmental ServicesLisa Leddy, Office of Neighborhood InvolvementBob Downing, Parks and RecreationDon DePiero and Hanh Ta, CityFleetKirsten Klym, Bureau of RevenueTodd Kelley, ProcurementJan Clow, Office of Management and FinanceMichael Armstrong, JoEllen Carothers, Pete Chism, Michele Crim, Kyle Diesner, Julie Hernandez, Alisa Kane, Jill Kolek, Julie Ocken, Brett Ratchford, Ralph Sanders, Dave Tooze, Bureau of Planning and Sustainability
The Bureau of Planning and Sustainability is committed to providing equal access to information and hearings. If you need special accommodation, please call 503-823-7700, the City’s TTY at 503-823-6868, or the Oregon Relay Service at 1-800-735-2900.
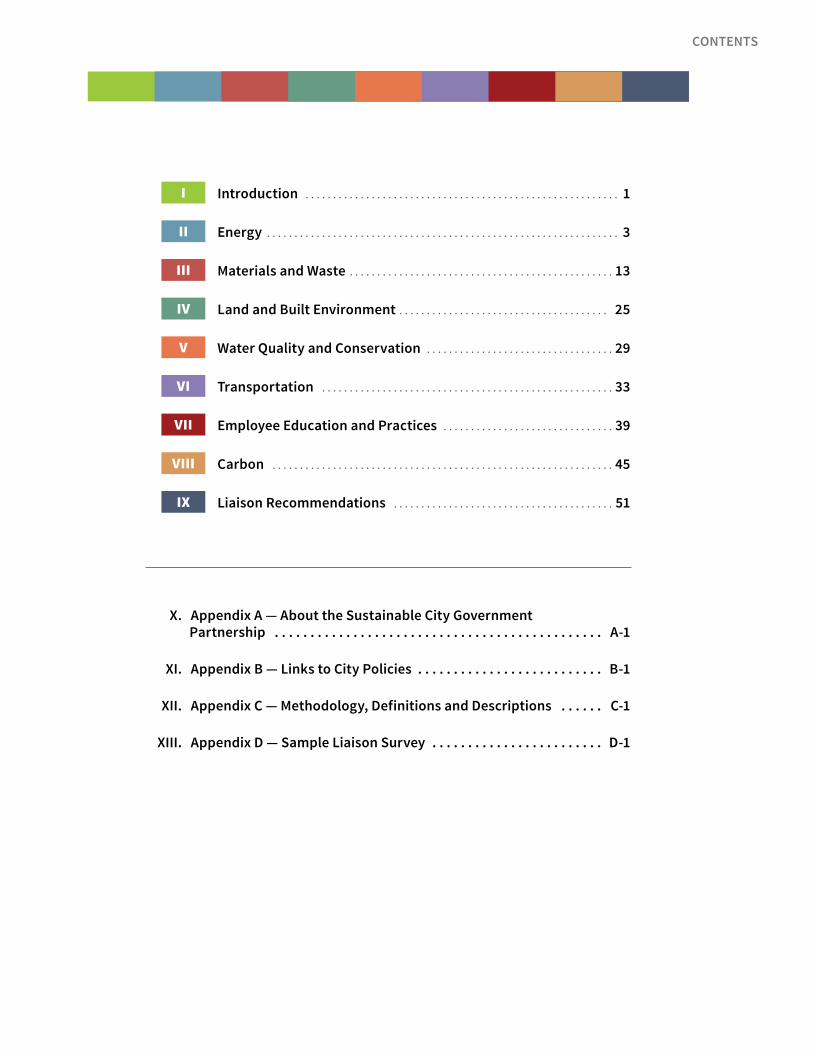
I Introduction . . . . . . . . . . . . . . . . . . . . . . . . . . . . . . . . . . . . . . . . . . . . . . . . . . . . . . . . . 1
II Energy . . . . . . . . . . . . . . . . . . . . . . . . . . . . . . . . . . . . . . . . . . . . . . . . . . . . . . . . . . . . . . . . 3
III Materials and Waste . . . . . . . . . . . . . . . . . . . . . . . . . . . . . . . . . . . . . . . . . . . . . . . . 13
IV Land and Built Environment . . . . . . . . . . . . . . . . . . . . . . . . . . . . . . . . . . . . . . 25
V Water Quality and Conservation . . . . . . . . . . . . . . . . . . . . . . . . . . . . . . . . . . 29
VI Transportation . . . . . . . . . . . . . . . . . . . . . . . . . . . . . . . . . . . . . . . . . . . . . . . . . . . . . 33
VII Employee Education and Practices . . . . . . . . . . . . . . . . . . . . . . . . . . . . . . . 39
VIII Carbon . . . . . . . . . . . . . . . . . . . . . . . . . . . . . . . . . . . . . . . . . . . . . . . . . . . . . . . . . . . . . . 45
IX Liaison Recommendations . . . . . . . . . . . . . . . . . . . . . . . . . . . . . . . . . . . . . . . . 51
X. Appendix A — About the Sustainable City Government Partnership . . . . . . . . . . . . . . . . . . . . . . . . . . . . . . . . . . . . . . . . . . . . . . A-1
XI. Appendix B — Links to City Policies . . . . . . . . . . . . . . . . . . . . . . . . . . B-1
XII. Appendix C — Methodology, Definitions and Descriptions . . . . . . C-1
XIII. Appendix D — Sample Liaison Survey . . . . . . . . . . . . . . . . . . . . . . . . D-1
COnTEnTS

SuStainable City Government: operationS Summary
1November 2012
I. Introduction
The City has achieved impressive results in many sustainable operations areas including $5.4 million in annual energy savings. We’ve also decreased carbon emissions by 23 percent per employee from 2000 levels, received LEED for Existing Buildings certifications, and were named the #1 Fleet in America from Government Fleet magazine. At the same time, major challenges lie ahead to address increasing resource costs and to meet carbon reduction goals.
For more than three decades, since the 1979 Energy Policy, the City of Portland has prioritized resource efficiency through the community and in its own operations. This summary focuses on work that followed Resolution No. 36468, which formalized the Sustainable City Government (SCG) partnership in 2006 “to set goals, objectives and performance measurements for sustainable practices to be considered by all bureaus and City Council in decision making.”
Acting as the City’s Green Team, the SCG partnership promotes resource efficiency in all City operations. This is accomplished by educating or assisting staff who implement sustainability policies, obtain funds for capital improvements, win awards or take voluntary actions to improve efficiencies. The results are helping to achieve long-term cost savings, resource conservation and efficiency, decreased carbon emissions and improved employee morale.
In FY10–11, the City spent nearly $25 million on utility and solid waste bills and nearly $500 million on personnel. With an adopted budget of $3.4 billion, $30 billion in assets and 5,700 employees, the City of Portland has a major impact on the region’s economic, environmental and human health. With such substantial sums involved, small changes in resource efficiency or productivity can have big impacts.
City operations span a wide variety of activities, including:
� Operating and maintaining facilities as diverse as fire and police stations, offices, parks, laboratories, community centers, and an emergency communications center.
� Using energy in street lights, wastewater treatment facilities and pump stations. � Providing on-the-job transportation options for employees, including fuel type and vehicle type as well
as supporting all types of transportation modes. � Managing stormwater at City-owned properties. � Using potable water at City-owned facilities. � Purchasing goods and services and related contract management. � Pursuing waste reduction, reuse, recycling and composting. � Educating employees about resource-efficient practices.
In FY10–11, the City saved $5.4 million from energy efficiency projects.
2 November 2012
SCG members, who act as liaisons for their bureaus, compiled the data and highlights in this summary. Liaisons conducted surveys among their bureau staff to collect data and to uncover challenges and opportunities for bureaus. The Liaison Survey gathered information about five areas: 1) green teams, 2) sustainability education, 3) the City’s Toxics Reduction Strategy, 4) indoor water conservation tools and 5) challenges bureaus and liaisons face in working toward more sustainable practices. The survey allowed liaisons to share recent activities and accomplishments, as well as the ongoing work they have done over past years.
The SCG will use results from this summary to guide the group’s own project work, provide updates to bureau directors and managers on specific goals and metrics, and make recommendations where broader project or policy support is needed.
the accomplishments described in this report are selected highlights of work by City bureaus. bureau highlights referenced in each chapter are not comprehensive of all ongoing work.
City of portland bureauS and aCronymS
bureau aCronym
Bureau of Development Services BDS
Bureau of Emergency Communications BOEC
Bureau of Environmental Services BES
Water Pollution Control Lab BES WPCL
Materials Testing Lab BES MTL
Bureau of Planning and Sustainability BPS
City Attorney City Attorney
Portland Fire and Rescue PF&R
Fire and Police Disability and Retirement FPDR
Government Relations Government Relations
Office of Healthy Working Rivers OHWR
Office for Community Technology OCT
Office of Management and Finance OMF
Bureau of Internal Business Services OMF BIBS — Facilities Services
Printing and Distribution P&D
Procurement Purchasing
Office of Neighborhood Involvement ONI
North Portland Neighborhood Services ONI NPNS Office
East Portland Neighborhood Office ONI EPNO
Portland Parks and Recreation PP&R
Portland Bureau of Emergency Management PBEM
Portland Bureau of Transportation PBOT
Portland Development Commission PDC
Portland Housing Bureau PHB
Portland Police Bureau Police
Portland Water Bureau PWB
SuStainable City Government: operationS Summary
3November 2012
OVERVIEW
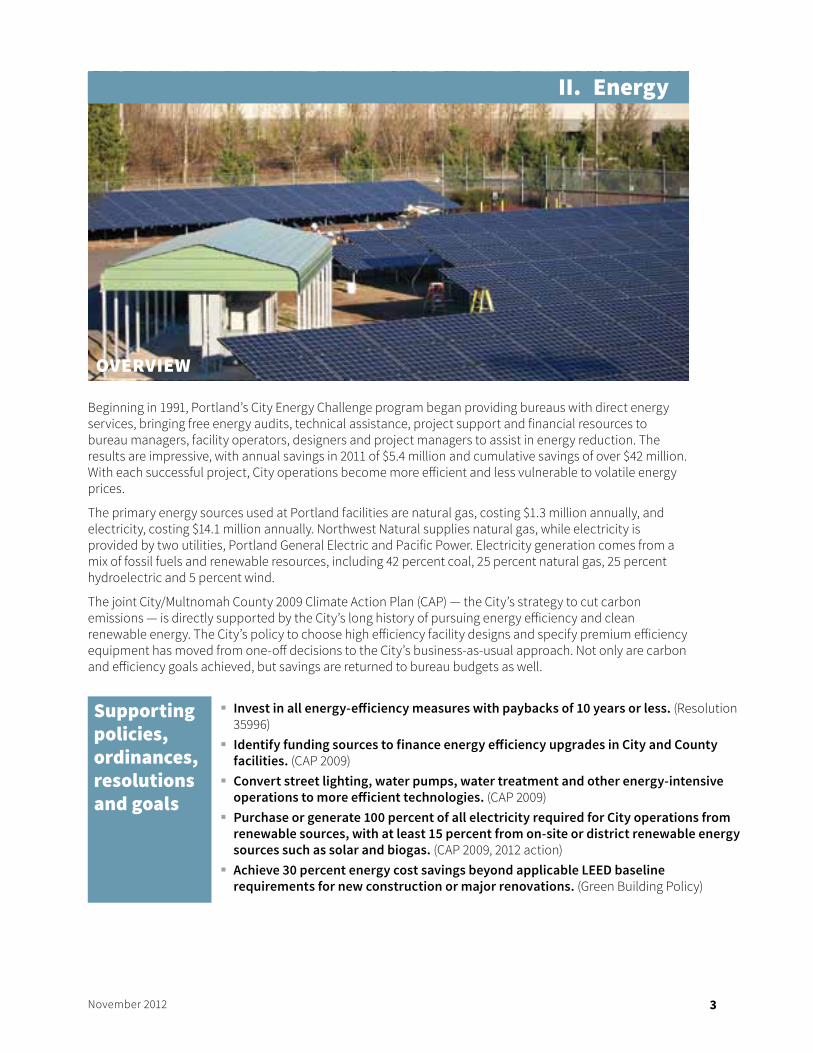
Beginning in 1991, Portland’s City Energy Challenge program began providing bureaus with direct energy services, bringing free energy audits, technical assistance, project support and financial resources to bureau managers, facility operators, designers and project managers to assist in energy reduction. The results are impressive, with annual savings in 2011 of $5.4 million and cumulative savings of over $42 million. With each successful project, City operations become more efficient and less vulnerable to volatile energy prices.
The primary energy sources used at Portland facilities are natural gas, costing $1.3 million annually, and electricity, costing $14.1 million annually. Northwest Natural supplies natural gas, while electricity is provided by two utilities, Portland General Electric and Pacific Power. Electricity generation comes from a mix of fossil fuels and renewable resources, including 42 percent coal, 25 percent natural gas, 25 percent hydroelectric and 5 percent wind.
The joint City/Multnomah County 2009 Climate Action Plan (CAP) — the City’s strategy to cut carbon emissions — is directly supported by the City’s long history of pursuing energy efficiency and clean renewable energy. The City’s policy to choose high efficiency facility designs and specify premium efficiency equipment has moved from one-off decisions to the City’s business-as-usual approach. Not only are carbon and efficiency goals achieved, but savings are returned to bureau budgets as well.
Supporting policies, ordinances, resolutions and goals
� Invest in all energy-efficiency measures with paybacks of 10 years or less. (Resolution 35996)
� Identify funding sources to finance energy efficiency upgrades in City and County facilities. (CAP 2009)
� Convert street lighting, water pumps, water treatment and other energy-intensive operations to more efficient technologies. (CAP 2009)
� Purchase or generate 100 percent of all electricity required for City operations from renewable sources, with at least 15 percent from on-site or district renewable energy sources such as solar and biogas. (CAP 2009, 2012 action)
� Achieve 30 percent energy cost savings beyond applicable LEED baseline requirements for new construction or major renovations. (Green Building Policy)
II. Energy
4 November 2012
Energy: Data
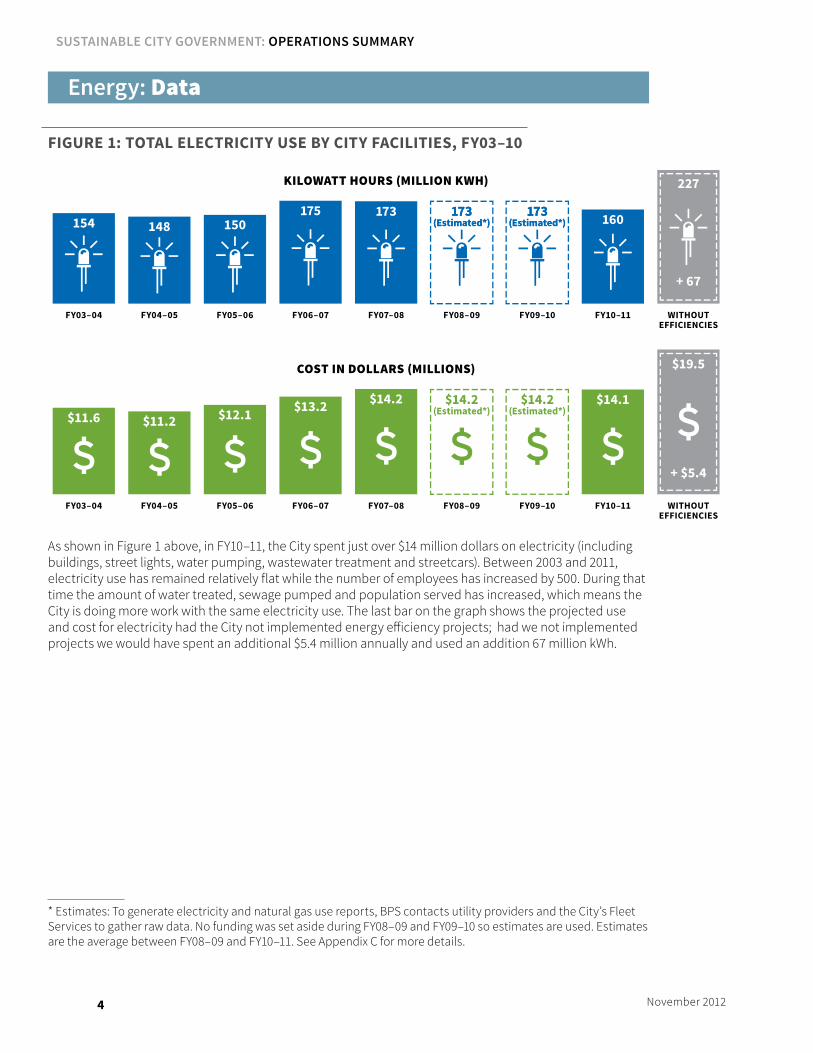
fiGure 1: total eleCtriCity uSe by City faCilitieS, fy03–10
KILOWATT HOURS (MILLION KWH)
FY03–04 FY04–05 FY05–06 FY06–07 FY07–08 FY08–09 FY09–10 FY10–11
154 148 150175 173 173
(Estimated*)173
(Estimated*)173
(Estimated*)173
(Estimated*) 160
COST IN DOLLARS (MILLIONS)
FY03–04 FY04–05 FY05–06 FY06–07 FY07–08 FY08–09 FY09–10 FY10–11
$11.6 $11.2 $12.1 $13.2 $14.2 $14.2(Estimated*)
$14.2(Estimated*)
$14.1
WITHOUTEFFICIENCIES
$19.5
+ $5.4
WITHOUTEFFICIENCIES
227
+ 67
As shown in Figure 1 above, in FY10–11, the City spent just over $14 million dollars on electricity (including buildings, street lights, water pumping, wastewater treatment and streetcars). Between 2003 and 2011, electricity use has remained relatively flat while the number of employees has increased by 500. During that time the amount of water treated, sewage pumped and population served has increased, which means the City is doing more work with the same electricity use. The last bar on the graph shows the projected use and cost for electricity had the City not implemented energy efficiency projects; had we not implemented projects we would have spent an additional $5.4 million annually and used an addition 67 million kWh.
* Estimates: To generate electricity and natural gas use reports, BPS contacts utility providers and the City’s Fleet Services to gather raw data. No funding was set aside during FY08–09 and FY09–10 so estimates are used. Estimates are the average between FY08–09 and FY10–11. See Appendix C for more details.
SuStainable City Government: operationS Summary
5November 2012
Energy: Data
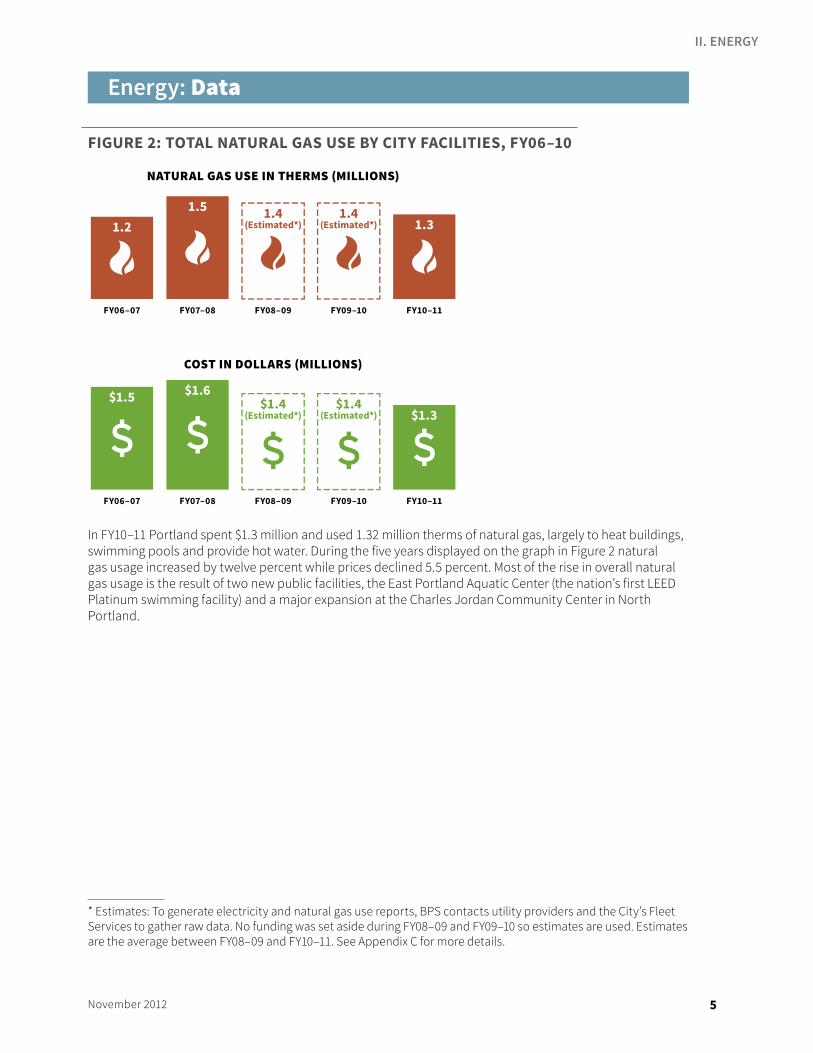
fiGure 2: total natural GaS uSe by City faCilitieS, fy06–10
COST IN DOLLARS (MILLIONS)
FY06–07 FY07–08 FY08–09 FY09–10 FY10–11
$1.5 $1.6$1.4
(Estimated*)$1.4
(Estimated*) $1.3
NATURAL GAS USE IN THERMS (MILLIONS)
FY06–07 FY07–08 FY08–09 FY09–10 FY10–11
1.4(Estimated*)
1.4(Estimated*)1.2
1.51.3
In FY10–11 Portland spent $1.3 million and used 1.32 million therms of natural gas, largely to heat buildings, swimming pools and provide hot water. During the five years displayed on the graph in Figure 2 natural gas usage increased by twelve percent while prices declined 5.5 percent. Most of the rise in overall natural gas usage is the result of two new public facilities, the East Portland Aquatic Center (the nation’s first LEED Platinum swimming facility) and a major expansion at the Charles Jordan Community Center in North Portland.
* Estimates: To generate electricity and natural gas use reports, BPS contacts utility providers and the City’s Fleet Services to gather raw data. No funding was set aside during FY08–09 and FY09–10 so estimates are used. Estimates are the average between FY08–09 and FY10–11. See Appendix C for more details.
II. EnERGY
6 November 2012
Energy: Data
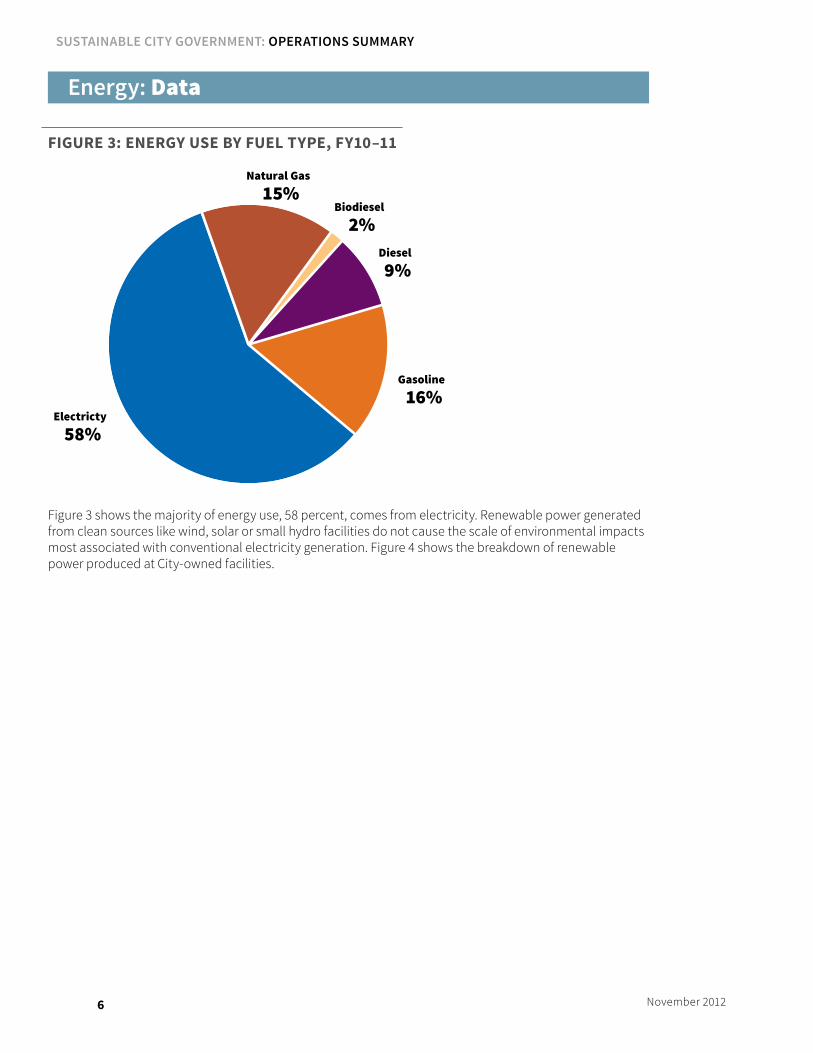
fiGure 3: enerGy uSe by fuel type, fy10–11
Electricty58%
Natural Gas15%
Biodiesel2%
Diesel9%
Gasoline16%
Figure 3 shows the majority of energy use, 58 percent, comes from electricity. Renewable power generated from clean sources like wind, solar or small hydro facilities do not cause the scale of environmental impacts most associated with conventional electricity generation. Figure 4 shows the breakdown of renewable power produced at City-owned facilities.
SuStainable City Government: operationS Summary
7November 2012
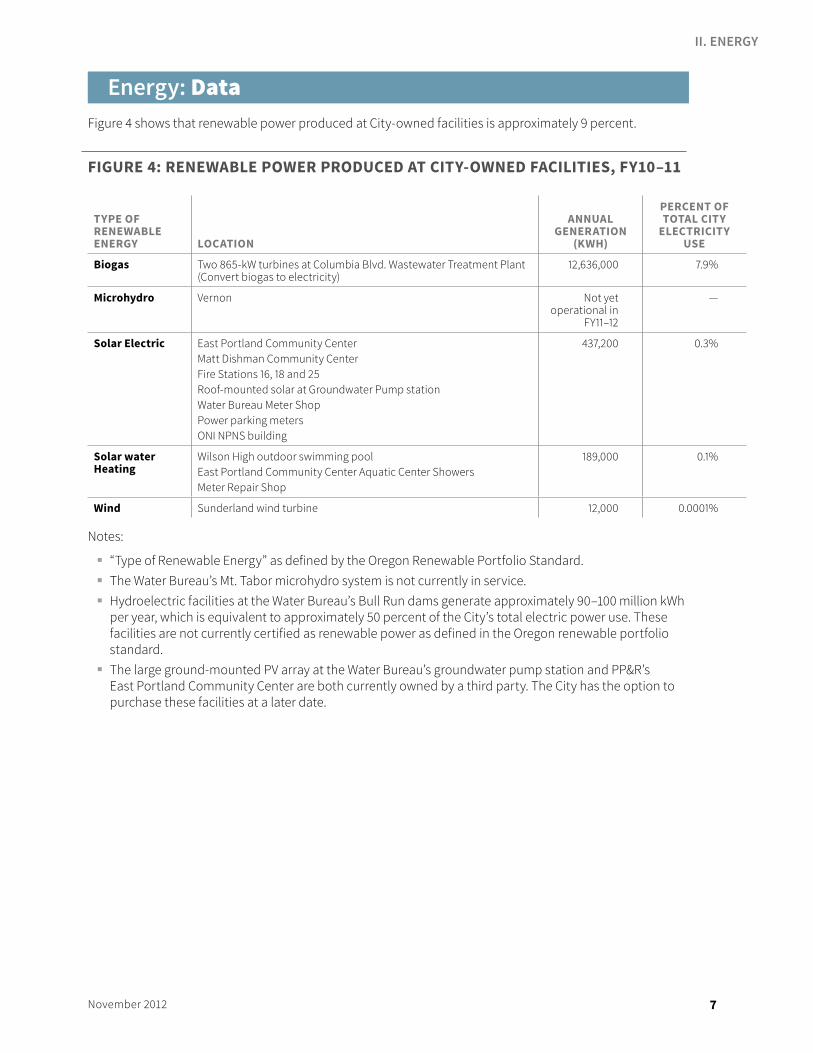
Energy: DataFigure 4 shows that renewable power produced at City-owned facilities is approximately 9 percent.
fiGure 4: renewable power produCed at City-owned faCilitieS, fy10–11
type of renewable enerGy loCation
annual Generation
(kwh)
perCent of total City
eleCtriCity uSe
biogas Two 865-kW turbines at Columbia Blvd. Wastewater Treatment Plant (Convert biogas to electricity)
12,636,000 7.9%
microhydro Vernon Not yet operational in
FY11–12
—
Solar electric East Portland Community CenterMatt Dishman Community CenterFire Stations 16, 18 and 25Roof-mounted solar at Groundwater Pump stationWater Bureau Meter ShopPower parking metersONI NPNS building
437,200 0.3%
Solar water heating
Wilson High outdoor swimming poolEast Portland Community Center Aquatic Center ShowersMeter Repair Shop
189,000 0.1%
wind Sunderland wind turbine 12,000 0.0001%
Notes:
� “Type of Renewable Energy” as defined by the Oregon Renewable Portfolio Standard. � The Water Bureau’s Mt. Tabor microhydro system is not currently in service. � Hydroelectric facilities at the Water Bureau’s Bull Run dams generate approximately 90–100 million kWh
per year, which is equivalent to approximately 50 percent of the City’s total electric power use. These facilities are not currently certified as renewable power as defined in the Oregon renewable portfolio standard.
� The large ground-mounted PV array at the Water Bureau’s groundwater pump station and PP&R’s East Portland Community Center are both currently owned by a third party. The City has the option to purchase these facilities at a later date.
II. EnERGY
8 November 2012
Energy: Data
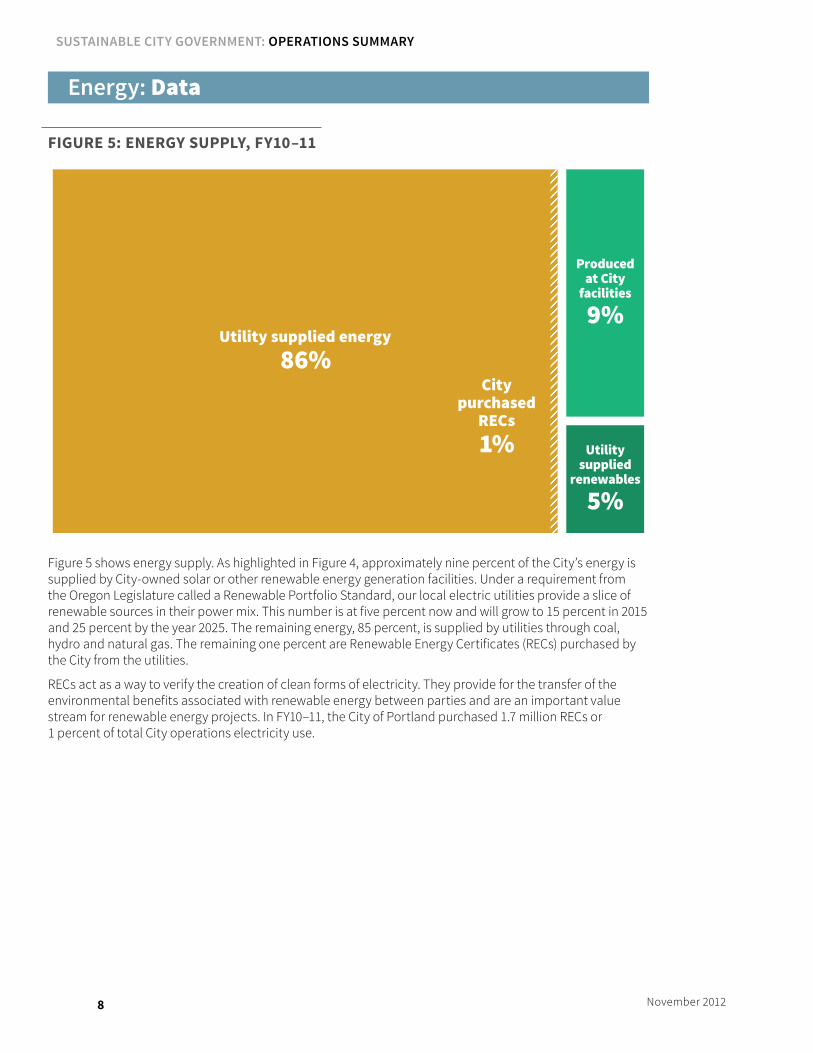
fiGure 5: enerGy Supply, fy10–11
Producedat City
facilities
9%
Utilitysupplied
renewables
5%
Utility supplied energy86%
Citypurchased
RECs1%
Figure 5 shows energy supply. As highlighted in Figure 4, approximately nine percent of the City’s energy is supplied by City-owned solar or other renewable energy generation facilities. Under a requirement from the Oregon Legislature called a Renewable Portfolio Standard, our local electric utilities provide a slice of renewable sources in their power mix. This number is at five percent now and will grow to 15 percent in 2015 and 25 percent by the year 2025. The remaining energy, 85 percent, is supplied by utilities through coal, hydro and natural gas. The remaining one percent are Renewable Energy Certificates (RECs) purchased by the City from the utilities.
RECs act as a way to verify the creation of clean forms of electricity. They provide for the transfer of the environmental benefits associated with renewable energy between parties and are an important value stream for renewable energy projects. In FY10–11, the City of Portland purchased 1.7 million RECs or 1 percent of total City operations electricity use.
SuStainable City Government: operationS Summary
9November 2012
Energy: Bureau Highlights
EnERgy USETo save energy in off-hours, many bureaus have worked with the City’s janitorial services to switch to a day-time cleaning schedule. In addition, solar arrays have become more prominent on City-owned facilities and bureaus’ Green Teams are doing internal energy walk-throughs to ensure staff turn off equipment before leaving the office each evening.
Since 1991, Portland city government has saved $42 million on its energy bills.
PBOT has switched to using Warm Mix Asphalt (WMA) instead of Hot Mix Asphalt (HMA) in its paving projects. The environmental benefits of using WMA instead of HMA are due to the reduction in the temperature that is required to produce the WMA at the asphalt plants and at the job site. There is a 30 to 45 percent reduction in the amount of fuel used to heat the asphalt at the plant, depending on the type of WMA used. This leads to reductions in nitrous oxides, carbon monoxide and Volatile Organic Compounds during the production process of WMA. WMA also produces fewer fumes and significantly improves the work environment. A long-term benefit of WMA versus HMA is that the lower heating temperatures will not prematurely age the asphalt, thus potentially giving a longer service life to the pavement surface.
REnEWaBlESBES (Wastewater Group) reduces the flaring of biogas by using it to power, heat and supply resources to the treatment plant as well as to nearby businesses. The engine-generators supply about 40 percent of the wastewater plant’s electrical needs, and the plant recovers heat from water and engine exhaust to use in its anaerobic digesters. The treatment plant also compresses some of its biogas and delivers it via pipeline to a nearby industrial facility to use for process heating.
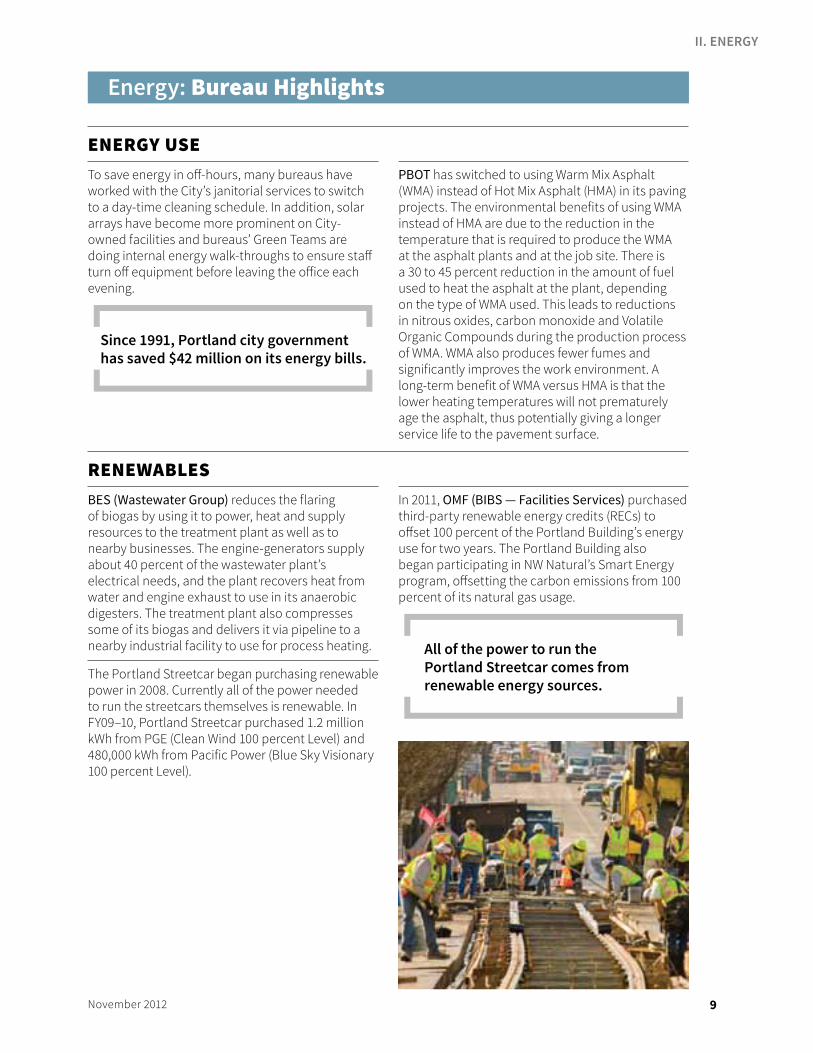
The Portland Streetcar began purchasing renewable power in 2008. Currently all of the power needed to run the streetcars themselves is renewable. In FY09–10, Portland Streetcar purchased 1.2 million kWh from PGE (Clean Wind 100 percent Level) and 480,000 kWh from Pacific Power (Blue Sky Visionary 100 percent Level).
In 2011, OMF (BIBS — Facilities Services) purchased third-party renewable energy credits (RECs) to offset 100 percent of the Portland Building’s energy use for two years. The Portland Building also began participating in NW Natural’s Smart Energy program, offsetting the carbon emissions from 100 percent of its natural gas usage.
All of the power to run the Portland Streetcar comes from renewable energy sources.
II. EnERGY
10 November 2012
BUIlDIng SyStEmS anD EqUIpmEntEven though the flow of water through Portland’s system is mostly driven by gravity, the Water Bureau (PWB) does use electricity to pump water to higher elevations. Over 80 percent of PWB’s annual electricity budget is spent on pumping water. This amount can be in excess of $2 million per year when groundwater is used to supplement the Bull Run supply. The PWB Operations Group and their Energy Team worked to implement opportunities for electricity savings at the Bureau’s pump stations, saving the bureau $113,000 in 2011 alone.
In 2011, PWB saved over $113,000 by operating pump stations more efficiently and pumping at off-peak hours when electricity is cheaper.
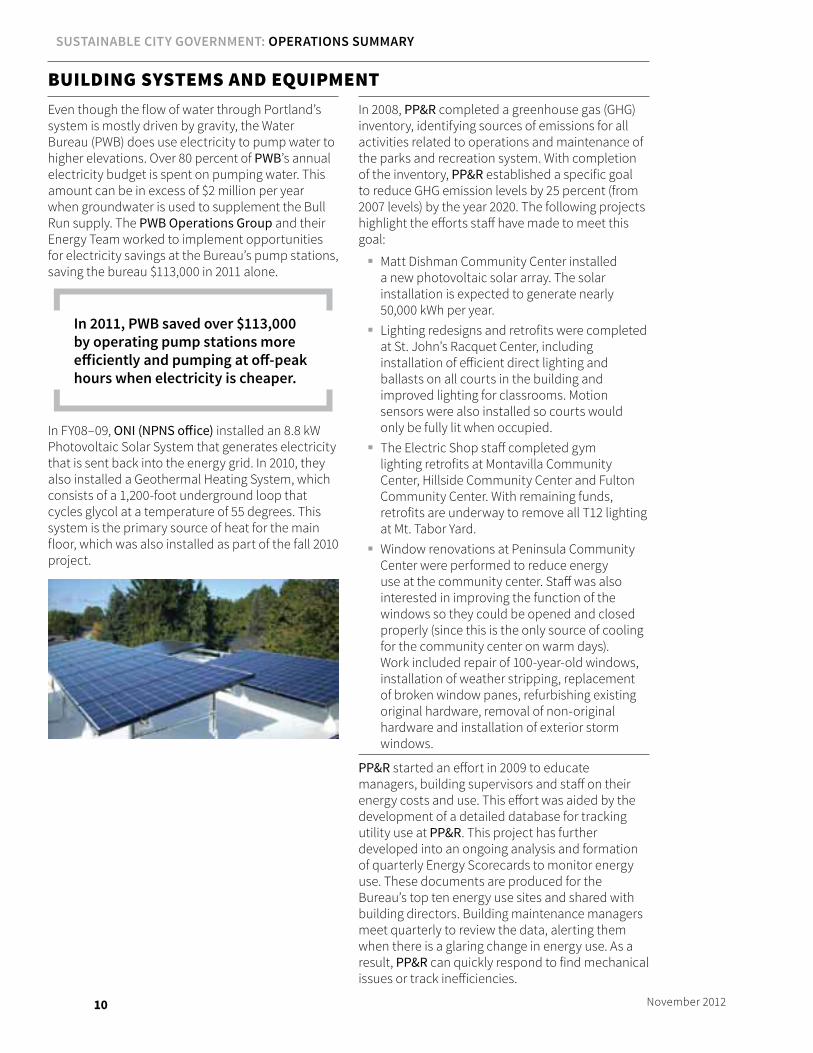
In FY08–09, ONI (NPNS office) installed an 8.8 kW Photovoltaic Solar System that generates electricity that is sent back into the energy grid. In 2010, they also installed a Geothermal Heating System, which consists of a 1,200-foot underground loop that cycles glycol at a temperature of 55 degrees. This system is the primary source of heat for the main floor, which was also installed as part of the fall 2010 project.
In 2008, PP&R completed a greenhouse gas (GHG) inventory, identifying sources of emissions for all activities related to operations and maintenance of the parks and recreation system. With completion of the inventory, PP&R established a specific goal to reduce GHG emission levels by 25 percent (from 2007 levels) by the year 2020. The following projects highlight the efforts staff have made to meet this goal:
� Matt Dishman Community Center installed a new photovoltaic solar array. The solar installation is expected to generate nearly 50,000 kWh per year.
� Lighting redesigns and retrofits were completed at St. John’s Racquet Center, including installation of efficient direct lighting and ballasts on all courts in the building and improved lighting for classrooms. Motion sensors were also installed so courts would only be fully lit when occupied.
� The Electric Shop staff completed gym lighting retrofits at Montavilla Community Center, Hillside Community Center and Fulton Community Center. With remaining funds, retrofits are underway to remove all T12 lighting at Mt. Tabor Yard.
� Window renovations at Peninsula Community Center were performed to reduce energy use at the community center. Staff was also interested in improving the function of the windows so they could be opened and closed properly (since this is the only source of cooling for the community center on warm days). Work included repair of 100-year-old windows, installation of weather stripping, replacement of broken window panes, refurbishing existing original hardware, removal of non-original hardware and installation of exterior storm windows.
PP&R started an effort in 2009 to educate managers, building supervisors and staff on their energy costs and use. This effort was aided by the development of a detailed database for tracking utility use at PP&R. This project has further developed into an ongoing analysis and formation of quarterly Energy Scorecards to monitor energy use. These documents are produced for the Bureau’s top ten energy use sites and shared with building directors. Building maintenance managers meet quarterly to review the data, alerting them when there is a glaring change in energy use. As a result, PP&R can quickly respond to find mechanical issues or track inefficiencies.
SuStainable City Government: operationS Summary
11November 2012
BES (Wastewater Group) has a Sustainability and Energy Management Program that focuses on waste and energy reduction, reuse and renewable resources. Accomplishments include:
� Participation in the Association of California Water Agencies Sustainable Energy Management Training Program, which helped staff develop a systems approach to managing energy at WG facilities. Staff can now better assess energy conservation and renewable energy opportunities at our treatment plants.
� Creation of a SERTT (Sustainable Energy and Resource Tracking and Training team) in the spring of 2010. This team pursues knowledge about conservation, reclamation and reuse applications. At the end of each fiscal year, the team will report on of energy metrics and actions.
BES (WPCL Facilities) increased energy efficiency by fine-tuning the HVAC system including upgrades to the control system.
In 2011, OMF (BIBS — Facilities Services) upgraded the Portland Building’s variable air volume boxes from pneumatic to digital controls, which is estimated to save 466,886 kWh annually.
In 2010 and 2011, OMF (BIBS — Facilities Services) upgraded the SW 3rd Ave and Alder St. parking garage retail spaces installing five heat pumps, a 90 percent efficient gas boiler and variable frequency drives on the cooling tower fan water pumps.
OMF (Financial Services) is researching options to replace the microfiche viewer to allow it to connect directly to computers and print to PDF rather than to a microfiche printer.
During 2011, OMF (BIBS — Facilities Services) worked with custodial vendors to reduce their use of a gas-powered leaf vacuum. The use of this vacuum is now limited to spring and fall.
OMF (BIBS — Facilities Services), OMF (Revenue Bureau), OMF (BIBS — Risk), FDPR and BPS have all purchased new refrigerators, dishwashers and/or copy machines in the past two years. In replacing the old equipment, these bureaus replaced the outdated machines with ENERGY STAR rated ones.
lIgHtIngTo reduce building lighting energy use, ONI (NPNS office) uses interior energy-efficient fluorescent lighting. For outdoor lighting, they use a combination of diurnal and timed outdoor security lighting. They also keep the community room refrigerator unplugged when not in use.
PBOT and OMF (BIBS — Facilities Services) completed lighting retrofits in the City’s parking garages in 2011. It is estimated this will reduce lighting energy use by 30 percent.
OMF (BIBS — Facilities Services) upgraded the lighting in the SW 3rd and Alder St. parking garage, saving an estimated 48,000 kWh annually.
BES (Wastewater Group) electricity-saving initiatives include:
� Installed room occupancy light sensors that turn off room lights automatically when not occupied.
� Installed LED lighting in numerous locations. � Purchased premium efficiency motors. � Used Programmable Logic Controlling (PLC) to
optimize equipment energy use.
In several areas around the city, PBOT crews have installed LED street lighting that uses half the energy of traditional bulbs and needs replacing less often, reducing maintenance costs. LED lighting is long lasting, durable, more efficient, cost-effective and mercury free. In addition, all traffic signals in the city have been replaced with energy efficient LED lighting, reducing maintenance needs. Signals and Street Lighting staff have been implementing LED pedestrian countdown timers that use less energy and improve the information provided to pedestrians on how much time they have to cross the street. These devices result in improved compliance and encourage walking. These changes save more than $61,000 per year in energy costs, plus reduced maintenance needs.
II. EnERGY
12 November 2012
Lighting was modified by ONI (City Hall office) to use full spectrum lighting to reduce eye strain and improve energy efficiency. Similarly, the PHB Green Team completed a review of the office’s lighting systems to make changes to light sensors based on use and need. Additionally, to better assess the needs and comfort of staff, BPS’ Sustainable Operations Committee (SOC) asked staff to take a lighting assessment survey to help reduce overhead lighting in areas on the floor where staff noted they wanted a dimmer setting. The SOC then worked with facilities to turn off lights where staff noted they didn’t need or want them.
The City’s largest fuel station at OMF (BIBS — CityFleet) was recently renovated and the new fuel canopy uses LED lights for more efficient use of electricity, better lighting, and simplified
maintenance. LED lights were also installed outdoors around the Body Shop on North Graham St.
ONI (EPNO office) has reduced lighting levels by installing only two fluorescent bulbs in each four-bulb fixture. When bulbs burn out, they are replaced with energy-efficient bulbs. Also, staff uses task lighting to reduce energy consumption. When working alone in the office, they turn off overhead lights and use only desk lights at their workstations.
OMF (Revenue Bureau) uses energy efficient light bulbs in track and spot lighting. The Bureau also uses occupancy sensors in communal areas to reduce need for constant lighting.
EnERgy aWaREnESSIn 2011, PP&R received a grant from Energy Trust of Oregon (ETO) to fund building audits from a leading mechanical engineering consultant. The sites chosen for the study were the top five energy use sites owned by PP&R: Southwest Community Center, Mt. Scott Community Center, Matt Dishman Community Center, Children’s Museum and Columbia Pool. A consulting firm is in the final stages of creating reports per site (due in 2012). ETO also has offered free lighting upgrade training for electricians and facility maintenance staff.
The ONI (EPNO office) did a tenant improvement office remodel and followed the specs for a High Performance Workspace.
With assistance from OMF (BIBS — Facilities Services), The Portland Building, City Hall and the 1900 Building’s janitorial services switched to daytime cleaning in 2010. Daytime janitorial service eliminates the need for building lights to be on after hours and increases transportation options for janitorial staff. PP&R is also working with the janitorial services contractor at other locations to continue education and communication with staff about the benefits of this change. FPDR has also requested that the janitorial staff of their building clean the FPDR offices before other offices in the building so cleaning could be accomplished during normal business hours.
A number of bureaus have undertaken energy walk-throughs (audits) are efforts to motivate employees to reduce nighttime energy consumption. PBOT, OMF (BIBS — Procurement) and BPS green team employees have conducted these checks to identify electronic equipment that is left on after employees leave for the day. Employees who turn off all of their equipment (computer, lights, radio, scanners, etc.) receive a thank you note and a piece of candy. OMF (Revenue Bureau) sends reminders to staff to turn off computers, fans and lights at the end of the day or when not in use.
PBOT’s Portland Building offices reduced nighttime energy consumption 33 percent between the first walk-through in February 2010 and May 2011.
BES (Wastewater Group) monitors utilities (water, electric, natural gas) across 99 different wastewater locations (CBWTP, TCWTP and pump-stations) and reports on usage trending, which is used by the group to make cost saving repair and replacement decisions for equipment and process areas.
OMF (Financial Services) has made requests to install automatic light switches for offices.
SuStainable City Government: operationS Summary
13November 2012
OVERVIEW
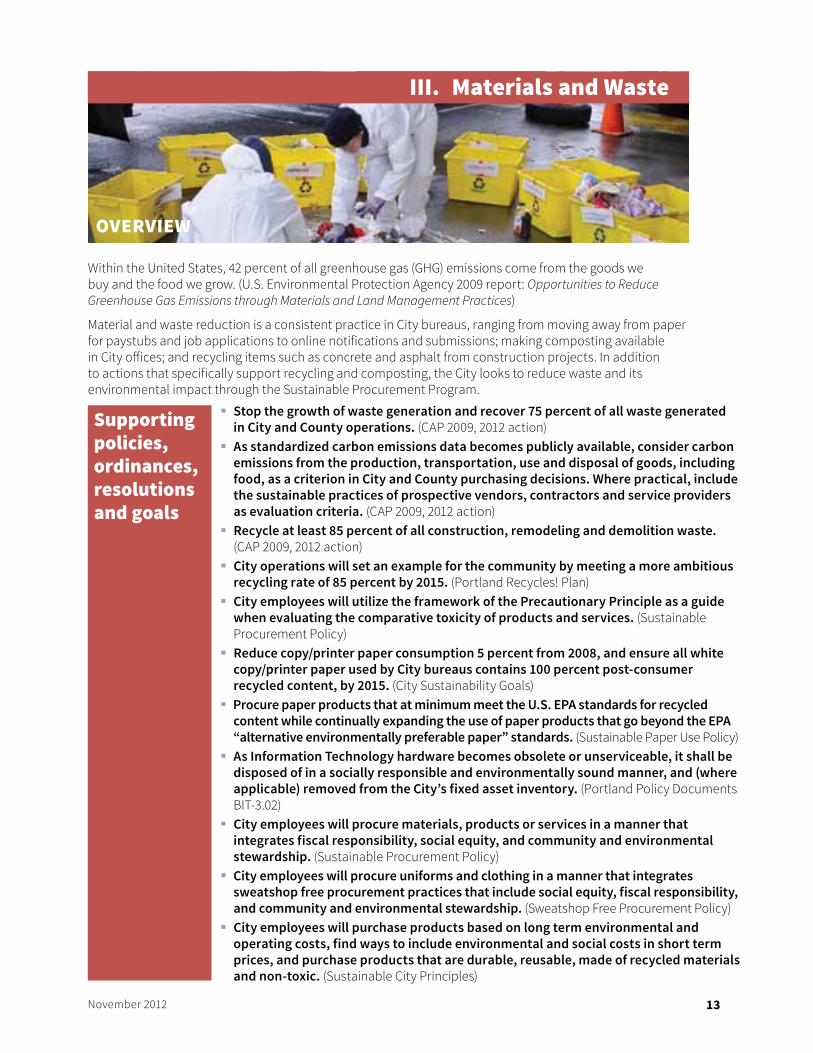
Within the United States, 42 percent of all greenhouse gas (GHG) emissions come from the goods we buy and the food we grow. (U.S. Environmental Protection Agency 2009 report: Opportunities to Reduce Greenhouse Gas Emissions through Materials and Land Management Practices)
Material and waste reduction is a consistent practice in City bureaus, ranging from moving away from paper for paystubs and job applications to online notifications and submissions; making composting available in City offices; and recycling items such as concrete and asphalt from construction projects. In addition to actions that specifically support recycling and composting, the City looks to reduce waste and its environmental impact through the Sustainable Procurement Program.
Supporting policies, ordinances, resolutions and goals
� Stop the growth of waste generation and recover 75 percent of all waste generated in City and County operations. (CAP 2009, 2012 action)
� As standardized carbon emissions data becomes publicly available, consider carbon emissions from the production, transportation, use and disposal of goods, including food, as a criterion in City and County purchasing decisions. Where practical, include the sustainable practices of prospective vendors, contractors and service providers as evaluation criteria. (CAP 2009, 2012 action)
� Recycle at least 85 percent of all construction, remodeling and demolition waste. (CAP 2009, 2012 action)
� City operations will set an example for the community by meeting a more ambitious recycling rate of 85 percent by 2015. (Portland Recycles! Plan)
� City employees will utilize the framework of the Precautionary Principle as a guide when evaluating the comparative toxicity of products and services. (Sustainable Procurement Policy)
� Reduce copy/printer paper consumption 5 percent from 2008, and ensure all white copy/printer paper used by City bureaus contains 100 percent post-consumer recycled content, by 2015. (City Sustainability Goals)
� Procure paper products that at minimum meet the U.S. EPA standards for recycled content while continually expanding the use of paper products that go beyond the EPA “alternative environmentally preferable paper” standards. (Sustainable Paper Use Policy)
� As Information Technology hardware becomes obsolete or unserviceable, it shall be disposed of in a socially responsible and environmentally sound manner, and (where applicable) removed from the City’s fixed asset inventory. (Portland Policy Documents BIT-3.02)
� City employees will procure materials, products or services in a manner that integrates fiscal responsibility, social equity, and community and environmental stewardship. (Sustainable Procurement Policy)
� City employees will procure uniforms and clothing in a manner that integrates sweatshop free procurement practices that include social equity, fiscal responsibility, and community and environmental stewardship. (Sweatshop Free Procurement Policy)
� City employees will purchase products based on long term environmental and operating costs, find ways to include environmental and social costs in short term prices, and purchase products that are durable, reusable, made of recycled materials and non-toxic. (Sustainable City Principles)
III. materials and Waste
14 November 2012
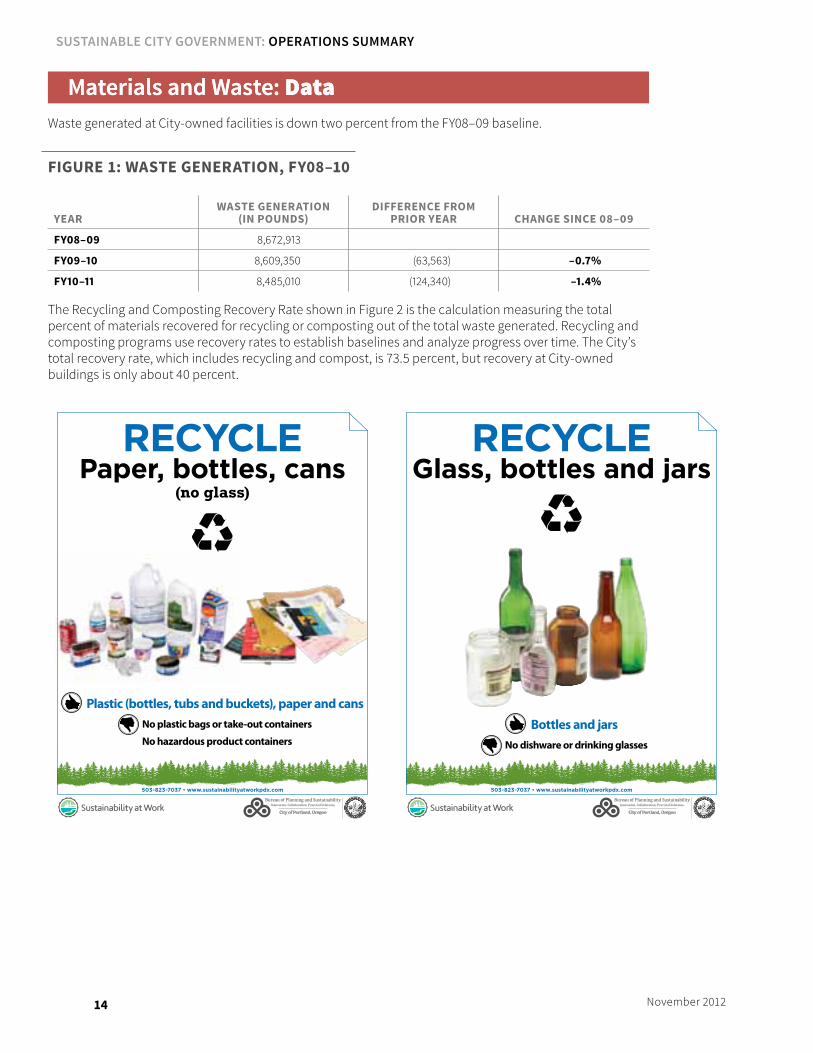
Materials and Waste: DataWaste generated at City-owned facilities is down two percent from the FY08–09 baseline.
fiGure 1: waSte Generation, fy08–10
yearwaSte Generation
(in poundS)differenCe from
prior year ChanGe SinCe 08–09
fy08–09 8,672,913
fy09–10 8,609,350 (63,563) –0.7%
fy10–11 8,485,010 (124,340) –1.4%
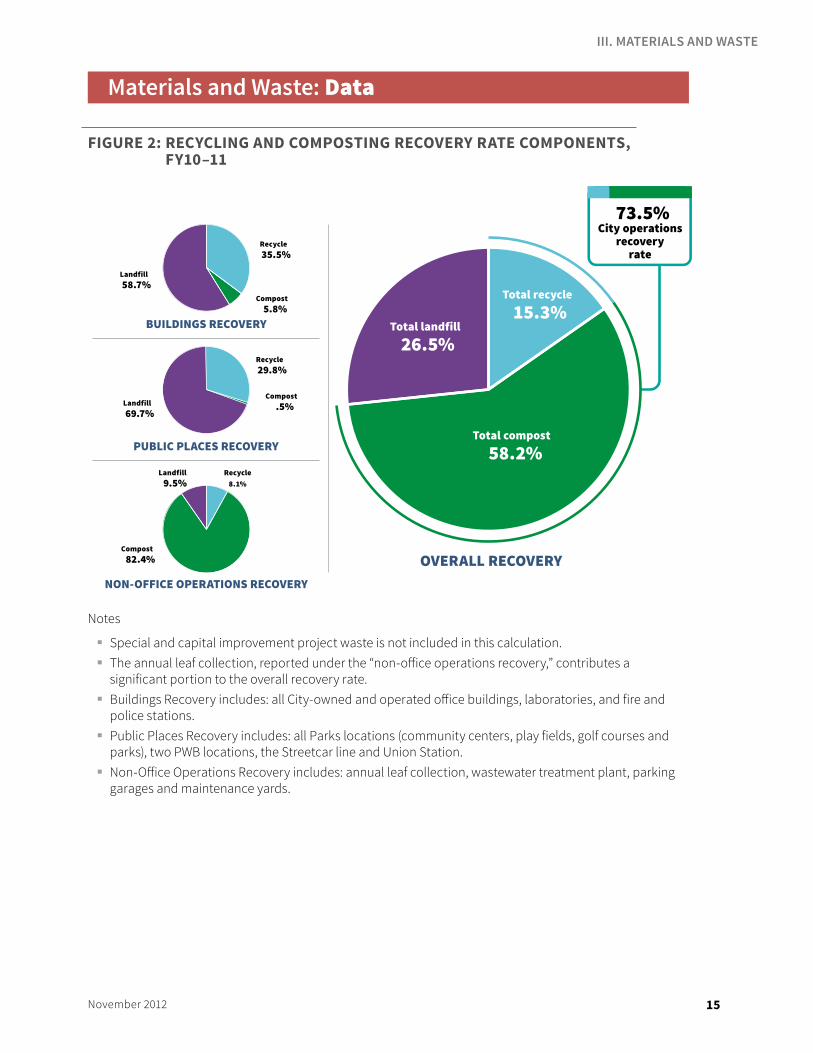
The Recycling and Composting Recovery Rate shown in Figure 2 is the calculation measuring the total percent of materials recovered for recycling or composting out of the total waste generated. Recycling and composting programs use recovery rates to establish baselines and analyze progress over time. The City’s total recovery rate, which includes recycling and compost, is 73.5 percent, but recovery at City-owned buildings is only about 40 percent.
Plastic (bottles, tubs and buckets), paper and cans
No plastic bags or take-out containers
No hazardous product containers
ReCYCLepaper, bottles, cans
(no glass)
503-823-7037 • www.sustainabilityatworkpdx.com
Bottles and jars
No dishware or drinking glasses
ReCYCLeGlass, bottles and jars
503-823-7037 • www.sustainabilityatworkpdx.com
SuStainable City Government: operationS Summary
15November 2012
Materials and Waste: Data
fiGure 2: reCyClinG and CompoStinG reCovery rate ComponentS, fy10–11
Recycle35.5%
Compost 5.8%
Landfill58.7%
BUILDINGS RECOVERY
Recycle29.8%
Compost .5%Landfill
69.7%
PUBLIC PLACES RECOVERY
Recycle8.1%
Compost 82.4%
Landfill9.5%
NON-OFFICE OPERATIONS RECOVERY
Total recycle15.3%
Total compost 58.2%
Total landfill26.5%
OVERALL RECOVERY
73.5%City operations
recoveryrate
Notes
� Special and capital improvement project waste is not included in this calculation. � The annual leaf collection, reported under the “non-office operations recovery,” contributes a
significant portion to the overall recovery rate. � Buildings Recovery includes: all City-owned and operated office buildings, laboratories, and fire and
police stations. � Public Places Recovery includes: all Parks locations (community centers, play fields, golf courses and
parks), two PWB locations, the Streetcar line and Union Station. � Non-Office Operations Recovery includes: annual leaf collection, wastewater treatment plant, parking
garages and maintenance yards.
III. MATERIALS AnD WASTE
16 November 2012
Materials and Waste: Bureau Highlights
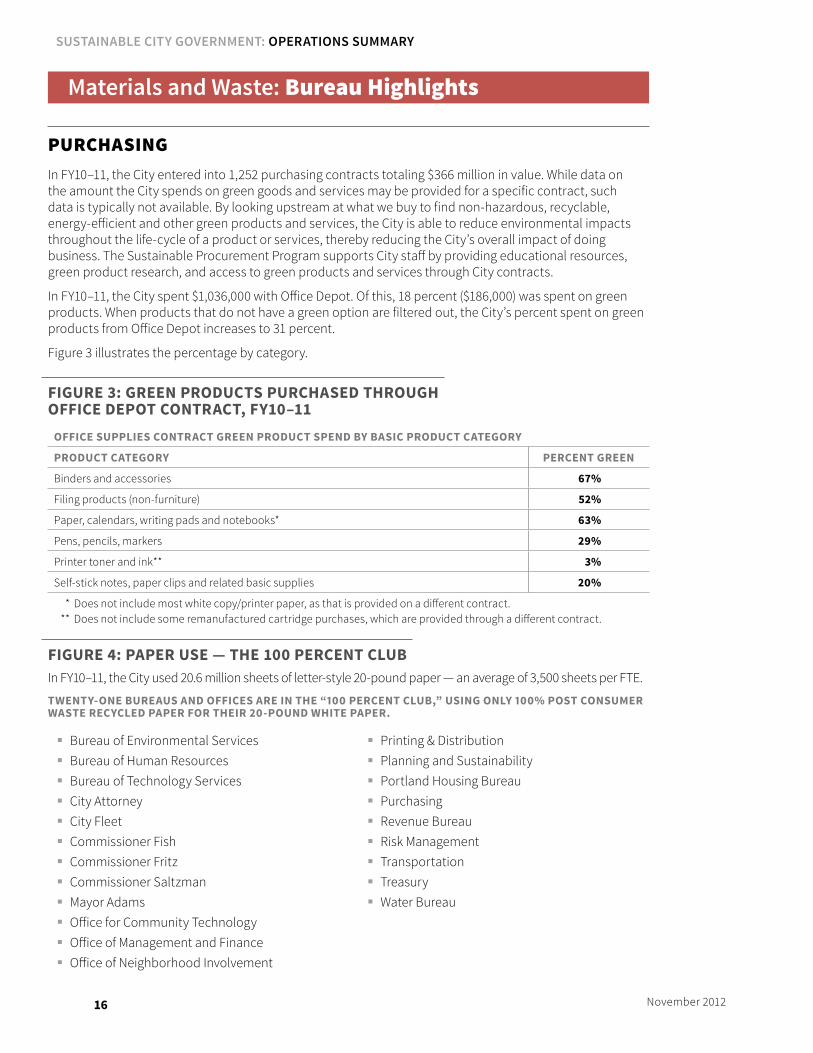
pURcHaSIngIn FY10–11, the City entered into 1,252 purchasing contracts totaling $366 million in value. While data on the amount the City spends on green goods and services may be provided for a specific contract, such data is typically not available. By looking upstream at what we buy to find non-hazardous, recyclable, energy-efficient and other green products and services, the City is able to reduce environmental impacts throughout the life-cycle of a product or services, thereby reducing the City’s overall impact of doing business. The Sustainable Procurement Program supports City staff by providing educational resources, green product research, and access to green products and services through City contracts.
In FY10–11, the City spent $1,036,000 with Office Depot. Of this, 18 percent ($186,000) was spent on green products. When products that do not have a green option are filtered out, the City’s percent spent on green products from Office Depot increases to 31 percent.
Figure 3 illustrates the percentage by category.
fiGure 3: Green produCtS purChaSed throuGh offiCe depot ContraCt, fy10–11
offiCe SupplieS ContraCt Green produCt Spend by baSiC produCt CateGory
produCt CateGory perCent Green
Binders and accessories 67%
Filing products (non-furniture) 52%
Paper, calendars, writing pads and notebooks* 63%
Pens, pencils, markers 29%
Printer toner and ink** 3%
Self-stick notes, paper clips and related basic supplies 20%
* Does not include most white copy/printer paper, as that is provided on a different contract. ** Does not include some remanufactured cartridge purchases, which are provided through a different contract.
fiGure 4: paper uSe — the 100 perCent ClubIn FY10–11, the City used 20.6 million sheets of letter-style 20-pound paper — an average of 3,500 sheets per FTE.
twenty-one bureauS and offiCeS are in the “100 perCent Club,” uSinG only 100% poSt ConSumer waSte reCyCled paper for their 20-pound white paper.
� Bureau of Environmental Services � Bureau of Human Resources � Bureau of Technology Services � City Attorney � City Fleet � Commissioner Fish � Commissioner Fritz � Commissioner Saltzman � Mayor Adams � Office for Community Technology � Office of Management and Finance � Office of Neighborhood Involvement
� Printing & Distribution � Planning and Sustainability � Portland Housing Bureau � Purchasing � Revenue Bureau � Risk Management � Transportation � Treasury � Water Bureau
SuStainable City Government: operationS Summary
17November 2012
As of 2011, the City Wellness Program [OMF (Human Resources)] no longer purchases bottled water for employee wellness events. Reusable water bottles were given as prizes in a City-wide employee recognition program.
OMF (BIBS — CityFleet) works with other bureaus to identify areas where electric vehicle and hybrid vehicle applications can be used when discussing vehicle replacement schedules.
OMF (BIBS — Procurement) developed the City’s Sustainable Procurement Policy, which is a model policy for other government agencies throughout the country. Procurement staff continues to answer inquiries from other government agencies around the nation regarding how to implement sustainable procurement practices.
In 2010, OMF’s offices in The Portland Building on the 7th and 12th floors replaced their jug bottled water with leased ENERGY STAR filter systems. The filter systems each cost $720 a year, saving approximately $6,000 annually. This change impacts seven OMF bureaus/divisions.
The City’s Sustainable Procurement Policy is a model policy for other government agencies throughout the country.
Where possible, PBOT purchases items that have a high recycled content, are refillable, recyclable, or compostable and are less toxic. In FY10–11, 43 percent of the items purchased had one or more of these green attributes.
In 2010, OMF (BIBS — Procurement) started posting example “green” specifications on their website for the public (namely other public agencies) to view. The webpage receives consistent traffic and is referenced on many other public agency websites.
In 2011, OMF (BIBS — Procurement) posted seven new “Buying Green Case Studies” and updated the existing 12 case studies. The use of the case studies has been tracked, and they are some of the most popular pieces of content on the OMF website.
OMF (Technology Services) works to make sure City desktop workstations, laptops, monitors and printers are all required to be compliant with the Electronic Product Environmental Assessment Tool (EPEAT) criteria for green technology. BTS strives to purchase equipment rated as EPEAT Gold wherever possible.
In FY10–11, all City standard desktops and notebooks purchased [OMF (Technology Services)] were EPEAT Gold, and 88 percent of monitors purchased were EPEAT Silver or greater. According to the Electronics Environmental Benefits Calculator, purchasing these EPEAT products instead of non-EPEAT products saves the following over the lifetime of the product:
� 381,777 kWh of energy � 579,691 kg in primary materials � 1.3 million kg in air emissions � 2,830 kg in water emissions � 38 kg in toxic material usage � 1,400 kg in hazardous waste
These savings are derived from all EPEAT qualified products purchased in FY10–11. Total cost savings of these reduced impacts is about $36,000.
In 2009, OMF (BIBS — Procurement) developed and adopted an ongoing Sweatshop Free Procurement Policy in the Administrative Rules and began implementation.*
In 2010, Procurement Services became a founding member of the national Sweatfree Purchasing Consortium, which is dedicated to coordinating public agencies’ efforts to implement effective “sweatfree” procurement policies.*
OMF (BIBS — Procurement) ensures that City solicitation documents continue to include requirements for green products and services. Over the past two years, Procurement Services has implemented additional internal processes to institutionalize and prioritize sustainability reviews of incoming requisitions, both for Goods and Services and Professional Services.
* The policy requires that apparel purchases comply with labor, health and safety standards that ensure workers are not subjected to sweatshop conditions.
III. MATERIALS AnD WASTE

18 November 2012
tOXIcS REDUctIOnThe PP&R Integrated Pest Management Program (IPM) for Portland parks has been in place since the late 1980s. The policies in this program direct all aspects of pest management in Portland’s parks and serve as rules for all pest management personnel. Documentation for the Salmon-Safe certification included the following comment about PP&R IPM: “Pesticide use within Portland’s well-established IPM program is minimal and well justified. Pest management decisions and methodology are based on sound scientific information. The program has served as a model for others that IPM is practical and effective as well as ecologically responsible.”
Portland’s PP&R Integrated Pest Management has been hailed as a model of responsible methods and practices by other municipalities and agencies throughout the region.
In 2011, OMF (BIBS — Facilities Services) began an integrated pest management contract at 23 of its locations. This type of pest control puts strict limitations on the use of pesticides and focuses instead on structural changes.
In the Portland Building, PBOT purchased a product called the Giotto “Air Rocket.” This device is used in lieu of compressed air to clean hard-to-reach places such as keyboard trays. Compressed air contains tetrafluoroethane and difluoroethane which are potent greenhouse gases. Since purchasing the air rockets in 2010, PBOT has reduced its consumption of the canned air by 62 percent.
In the Portland Building, PBOT’s Green Team members work with OMF (Printing & Distribution) to create notebooks made of scrap paper.
OMF (BIBS — CityFleet) is certified as an Eco-Logical Business by the Pollution Prevention Excellence program, and uses:
� Mirka Environmentally Green Compliant abrasives.
� Re-refined oil in gas-powered City vehicles. � Bio-lubricants in environmentally sensitive
areas that provide drinking water to citizens. � Beet juice, in lieu of calcium, as environmentally
friendly counterweights in tires.
BPS and OMF (BIBS — CityFleet) worked to retrofit the CityFleet with diesel particulate filters and in-cab heaters that significantly reduce exhaust emissions, funded with a $2.4 million EPA grant. To date, the City has installed:
� 29 diesel particulate filters that lower particulate matter by 85 percent.
� 68 diesel oxidation catalysts that lower particulate matter 25–40 percent.
� 149 in-cab heaters that reduce idle time and exhaust emissions and improve operator comfort.
In 2011 OMF (BIBS — Facilities Services and Procurement) began integrating high performance green cleaning specifications into janitorial service contracts for City-owned facilities as they came up for renewal.
REUSE anD WaStE pREVEntIOnIn FY06–07, FPDR used the highest amount of paper since monitoring paper usage within the bureau began in FY04–05. Paper usage increased approximately 20 percent between FY04–05 and FY06–07. Since FY06–07, FPDR has used less paper and more environmentally friendly paper whenever possible, resulting in 21 percent reduction in paper use in FY09–10, and an additional 10 percent reduction in FY10–11. Businesses that FPDR routinely interacts with used to request single-sided copies but are slowly beginning to accept double-sided copies. Lower paper usage may be
attributable to increased double-sided printing and copying, an increase in scanned documents, and more staff awareness of City policies.
The Portland Commission on Disability, for which ONI provides staff support, has a sustainability policy to reduce over-printing of documents. Each year, members are asked to indicate if they’d like hard copies of documents. If they don’t request hard copies, commissioners share documents at the meeting, and documents are posted online.
SuStainable City Government: operationS Summary
19November 2012
Since 2003, the City Attorney’s office has reduced paper use by 27 percent.
The ONI Graffiti Abatement program recently switched the products it uses for graffiti abatement and cleanup work. The program now uses Metro Recycled Paint and Soyclean (a soy-based solvent) on all volunteer projects, and the professional contractors they work with are all required to use environmentally-safe products in their work.
OMF (Financial Services): Financial Planning prints half as many City budget documents as they used to (75 instead of 150) and all 18 FPD staff members have switched to double-sided printing as their default.
When the City was targeting its paper policy, the City Attorney’s office discovered that they had the highest paper use, per capita, of all the bureaus. This wasn’t surprising, since every legal document produced was copied to at least four people, which adds up quickly when the legal briefs are sometimes over 800 pages in length. Through the efforts of staff, and changes in federal court filing requirements, the office was able to decrease overall paper consumption by about 27 percent in a four-year period. Today they continue this downward trend and also use 100 percent recycled and acid-free paper for all print jobs.
OMF (Human Resources) implemented electronic screening of recruitment applications for hiring managers in 2009. Hiring managers can choose to receive candidate applications and relevant hiring material via thumb drive, eliminating the need for any hard copy applications.
OMF recently streamlined several processes by creating electronic systems, which were previously reliant on paper:
� Treasury OMF (Financial Services) began offering online disclosure statements in 2010 for all debt transactions, which reduced the number of disclosures printed from over 1,000 annually to less than 200.
� Required use of eFiles — which has been used by the Auditor’s Office for years — was implemented in 2009 by OMF (Human Resources), which eliminates archiving hard copies of recruitment documents and creates an electronic archiving process.
� The OMF (BIBS — Facilities Services) Maintenance Technician work order process was upgraded to electronic mobile capabilities in 2010. This resulted in reduced average daily paper use of 48 percent, saving approximately 11,000 pieces of paper annually.
� OMF (Revenue Bureau) implemented online business license resources and online tax filing, including credit card payments, in 2009. Over 9,800 online filings and payments related to Business License Tax were made in FY09–10, and over 11,700 were made in FY10–11 (a 19 percent increase).
� OMF (EBS) introduced paperless paystubs in 2010. Currently, 57 percent of City employees participate in the paperless paystub option, decreasing paper use by 69,750 pieces of paper and saving approximately $6,500 in administration costs. Paperless W-2s are also available through the Employee Portal.
In July 2011, OMF (Human Resources) launched the City’s new online application system, nEOGOV. As of the end of 2011, electronic submission of all applications is required, resulting in projected annual reduction of 80,000 sheets of paper and related copier toner.
In 2009, BPS consolidated office locations, which resulted in a significant reconfiguration of furniture and equipment. BPS ensured the reuse of unneeded office equipment, including desks, chairs, filing cabinets and office supplies, by sending them to the State’s surplus program, and in some instances donating items. The bureau also went from approximately 12 printers down to four large
III. MATERIALS AnD WASTE
20 November 2012
ones. Staff has also been asked to use a delayed printing option, so that instead of documents printing instantaneously, a user has to click print from their computer and then select their print job at the printer to actually print. This has accounted for a large decrease in extraneous printing and papers and misprints that used to go directly into the recycling bin.
Approximately 60 percent of all new business license registrations coming through OMF (Revenue Bureau) are now completed online, and the Business Welcome Kit is also online, saving the City approximately $20,000 annually.
With implementation of handheld units for Parking Enforcement Officers, PBOT has reduced or eliminated its use of various paper forms and logbooks. Prior to using the handheld units, officers used legal-sized, colored paper for tow and complaint logs; spiral notebooks for record keeping; citation booklets; and waterproof beat cards. Officers now perform these functions electronically using the handheld units.
BDS and BPS promote the use of durable dishware at bureau events, via a durable dishware library with items for check-out for meetings and other events. Both bureaus have also discontinued use of bottled water at bureau events.
PHB has an initiative to ensure all major documents will be saved in eFiles, the City’s online archiving system, by 2013.
PBOT (Transportation Options) prints more than 35,000 walking and bicycling maps each year. The maps measure 26 by 26 inches, whereas the paper that they are printed on is 28 inches by 40 inches, leaving a large portion of paper unused. Historically, this extra paper was simply recycled. In 2008, PBOT discovered that they could print additional items on the leftover paper. This method of combining print jobs diverts over 1,500 pounds of paper from being recycled annually. In addition to the environmental savings, PBOT has been able to save more than $6,400 in set-up fees and $8,000 in other printing costs.
By combining print jobs of walking and biking maps with other print needs, PBOT has saved more than $6,400 in set-up fees and $8,000 in other printing costs.
The City continues to incorporate sustainability requirements and evaluation criteria such as diesel emission reduction, biodiesel and idle reduction into solicitation documents when feasible.
BES (Water Pollution Control Lab [WPCL] Field Operations), is transitioning from disposable 6V alkaline “lantern” batteries to 6V rechargeable batteries for flow monitoring equipment. The Field Operations staff expects to purchase more flow meters within the next two years, increasing the use of batteries to about 550 per year.
BES (WPCL — Field Operations) is transitioning to rechargeable batteries, which will reduce waste and save approximately $4,000 annually.
BES (WPCL — Organics) staff developed a technique that speeds up analyses of Phtahalate/PAH in grab samples from Underground Injection Controls from hours to minutes and reduces the use of toxic solvents by 98 percent. The new technique extracts only a small amount of sample product for analysis thus reducing the use of toxic solvents. Previously, BES lab technicians sent the samples to an outside lab for analyses. This new technique also allows BES staff to do the work in-house. The estimated savings to the City is an average of $70,000 annually in lab fees and reduced toxic solvents. BES Lab staff anticipates this new analysis technique can transfer to other sampling work for soil hydrocarbon, resulting in more budget savings.
SuStainable City Government: operationS Summary

21November 2012
OMF (BIBS — CityFleet) proactively takes measures to reduce environmental waste by:
� Retreading approximately 400 heavy duty truck and equipment tires annually to reduce landfill impacts.
� Changing to non-lead wheel weights reduced their annual lead purchases by 252 pounds.
� Recycling vehicle wash water.
In 2011, OMF (BIBS — Facilities Services) put together a temporary furniture surplus program due to the high volume of tenant improvements and department moves that were taking place. Approximately 150 Herman Miller AO3 (the City standard) workstations were inventoried, resulting in an estimated cost savings of $570,000.
In 2011, OMF (BIBS — Facilities Services) began removing paper towels from restrooms in the Portland Building and installing high-efficiency hand dryers. It is estimated that the Portland Building spends over $14,000 on restroom paper towels annually and that paper towels account for at least 15 percent of the building’s waste stream.
OMF (BIBS — P&D) switched its plate making process to a chemical-free system. By processing printing plates with water instead of traditional developing chemicals, the amount of chemicals introduced into the print shop was reduced and the resulting chemical waste was eliminated. Waste water from the system no longer has a hazardous component and the plates themselves are now completely recyclable.
In 2010, working through OMF (BIBS — Procurement), the City’s office supplies provider (Office Depot) piloted delivering City orders in reusable tote containers and recyclable paper bags. While the reusable totes do not fully eliminate the use of cardboard boxes and plastic air pillow packaging, it is the primary shipment packaging for small and medium-size orders/products. The tote delivery pilot soon expanded to all metro-area Office Depot accounts, and is now being rolled out nationwide. This program reduced the amount of packaging waste from City orders and will result in further waste reductions throughout the metro area.
OMF (BIBS — Procurement) works with vendors to reduce packaging waste in routine delivery services to the City. They are also working on including language regarding minimal waste in solicitation evaluation criteria.
In 2009 and 2010, OMF (Procurement and Technology Services) participated in a pilot of GreenPrint, software that is designed to reduce unnecessary printing. The pilot was successfully completed and GreenPrint is currently being rolled out on all new and replacement computers. By the end of 2011, GreenPrint had been installed on more than 1,200 City computers. By the end of 2012, this software will be on nearly 5,000 City computers. In addition, most City printers are set up with a default of double-sided printing to reduce paper usage.
OMF (Revenue Bureau and Procurement Services), ONI (EPNO), BPS, PBOT and BDS provide reusable silverware and dishware in their employee kitchens. This discourages waste generated by disposable cups, plates and plastic ware.
OMF (Revenue Bureau) is currently researching how to automatically capture email addresses in a database so that all correspondence with businesses, including notification postcards, can be done by email.
OMF (BIBS — P&D) has eliminated hazardous waste water from printing plates.
The ONI (City Hall) office replaced bottled water service with a water filtering system. This achieved long-term cost savings, created greater storage space while reducing petrochemical leeching into the water supply, reduced risk of worker injury due to the maneuvering of the old jugs and saved energy consumption that was used by the delivery system of the water service. OCT has also eliminated use of bottled water in the office.
III. MATERIALS AnD WASTE
22 November 2012
The Tool Room at PBOT (Maintenance Operations) has introduced fuel, noise, emissions, weight and over-all costs reductions with handheld power equipment for its employees. Within the City’s competitive equipment purchasing guidelines, the Tool Room was able to specify and secure backpack blowers, brush cutters and hedge trimmers. A sample of what these reductions mean to the City includes:
� Fuel: With a 20 percent reduced fuel consumption verses like equipment without this new technology (4-Mix), the entire cost of this new equipment will be paid for in two years.
� Noise: The new 4-Mix engine technology reduces the tone and amount of decibels (dBA) to fully comply with the city’s noise ordinances.
� Emissions: Over a 20 percent reduction in emissions from the reduced fuel consumption and the ash and smokeless 2-cycle oil mix.
� Weight: The reduced requirement for fuel has allowed the fuel tank capacity to be reduced, which translates to less weight the operator must pack around while working. This also reduces operator fatigue and potential injuries while increasing productivity.
� Overall Costs: From the operator health, user friendly features, reduced fuel requirements, and factory training for our mechanics for in-house maintenance all factors into additional savings for the public and its workers.
FPDR donated an envelope stuffer machine to a non-profit organization rather than disposing of it.
OMF (Financial Services) selected several pieces of furniture from surplus storage in 2011 instead of buying new equipment.
cOmpOStIng anD REcyclIngCity Attorney, BPS and ONI staff recycle additional plastics that are not recycled by the City facilities’ regular recycling program. A staff member at each bureau sets up a separate bin in the break room for plastics that can’t be included in regular pick-up; when this bin gets full, the employee takes these to Far West Fibers for recycling.
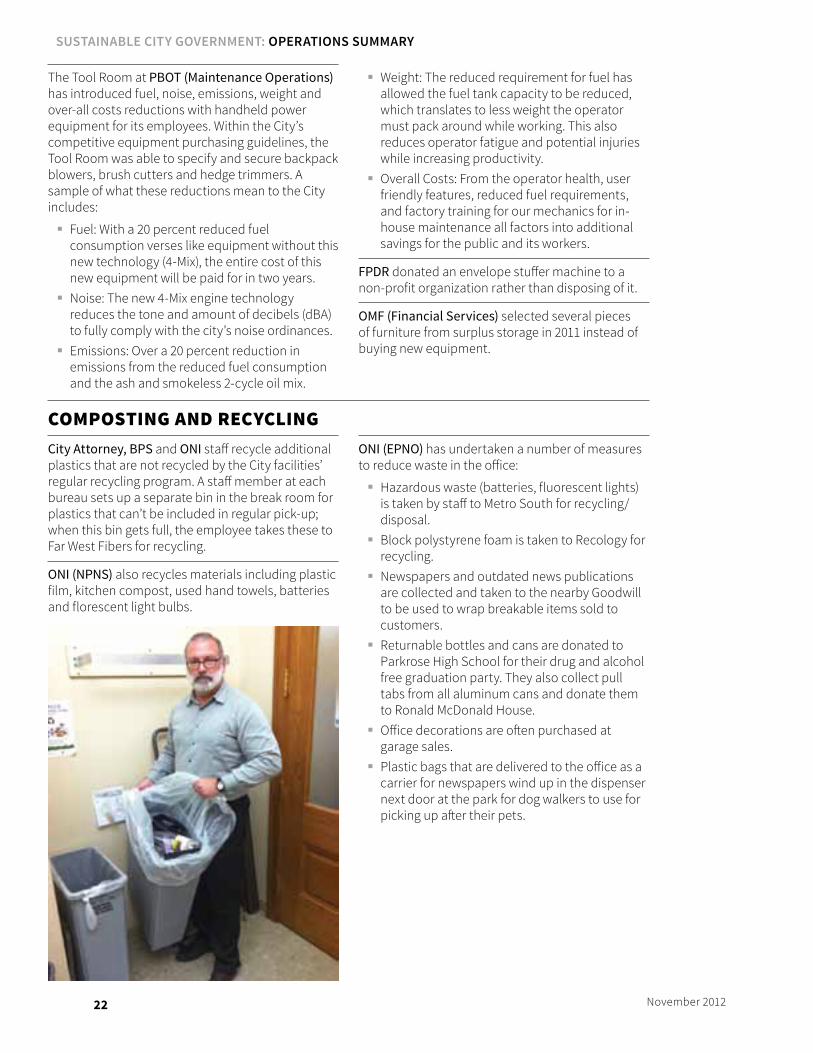
ONI (NPNS) also recycles materials including plastic film, kitchen compost, used hand towels, batteries and florescent light bulbs.
ONI (EPNO) has undertaken a number of measures to reduce waste in the office:
� Hazardous waste (batteries, fluorescent lights) is taken by staff to Metro South for recycling/disposal.
� Block polystyrene foam is taken to Recology for recycling.
� Newspapers and outdated news publications are collected and taken to the nearby Goodwill to be used to wrap breakable items sold to customers.
� Returnable bottles and cans are donated to Parkrose High School for their drug and alcohol free graduation party. They also collect pull tabs from all aluminum cans and donate them to Ronald McDonald House.
� Office decorations are often purchased at garage sales.
� Plastic bags that are delivered to the office as a carrier for newspapers wind up in the dispenser next door at the park for dog walkers to use for picking up after their pets.
SuStainable City Government: operationS Summary
23November 2012
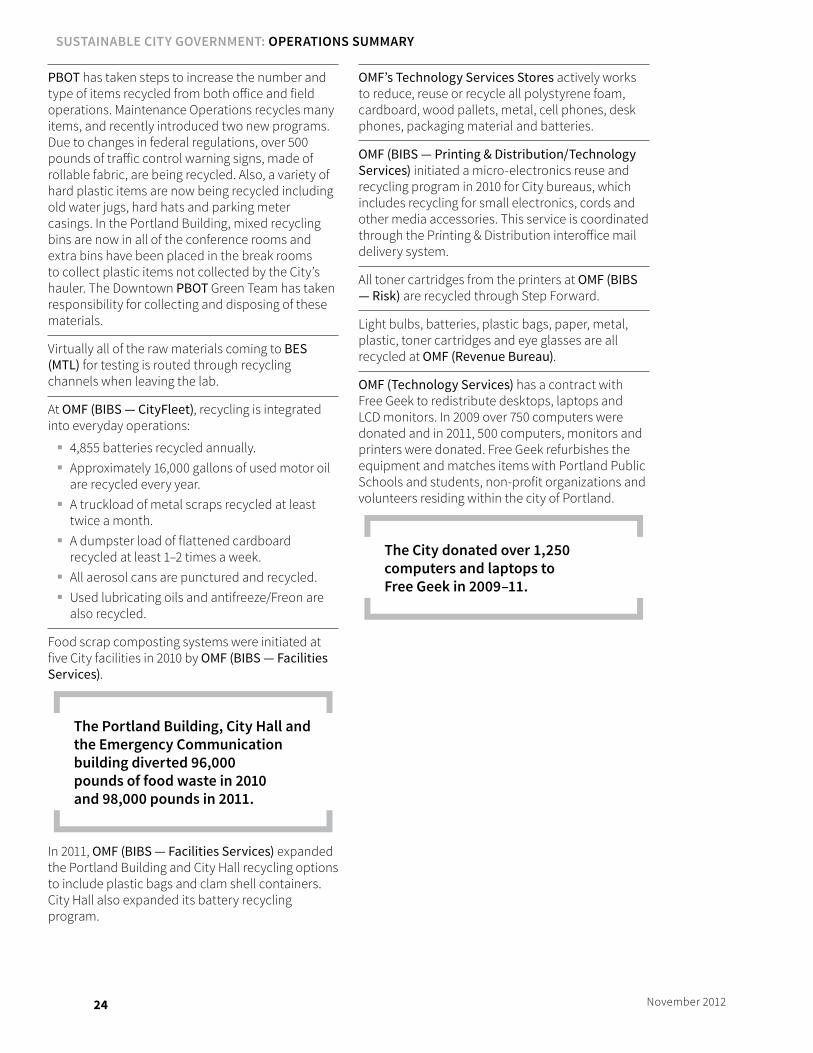
PP&R performed pilot studies and waste sorts in FY08–09 to find best waste management methods in athletic field locations. Findings were expanded to highest use fields, outdoor pools and all stadiums. PP&R conducted pilot studies and waste sorts in traditional park settings in FY09–10. The South Service Zone staff experimented to determine best collection methods, containers and signage. The program expanded in FY11–12 to all zones of the city, with the help of elected Recycling Captains in each work unit. All larger permitted events have recycling requirements. Composting is set up at Multnomah Art Center Loaves & Fishes kitchen as well as Portland International Raceway for public waste collection. Internally, PP&R recycles industrial items such as metal, wood, small batteries, lighting, used motor oil, car batteries, propane containers, tires, paint cans, pallets and many other items. PP&R continues to make efforts to improve, with the following Trashco information showing an increase in recovery:
� FY09–10: 15 percent recovery rate in public waste collections.14 percent internally collected waste recovery.
� FY10–11: 17 percent recovery in public waste collections.14 percent internally collected waste recovery.
For decades, PP&R has recycled shrub clippings and tree trimmings, grinding them into mulch for use in parks. They also utilize mulching lawn mowers to grind trimmings so they degrade on site and release nitrogen back into the soil. These two practices create healthier soils and turf, with much less need for chemical weed controls.
PP&R’s highest use athletic fields, skate parks and picnic areas now have recycling options as well as all stadiums, community centers, outdoor pool locations, Concerts in the Park, Movies in the Park and Summer Lunch Programs.
BOEC recycles all batteries, computer equipment, radios, phones, pagers and electric appliances through BTS Comnet. BOEC also recycles packaging, bubble wrap and polystyrene foam.
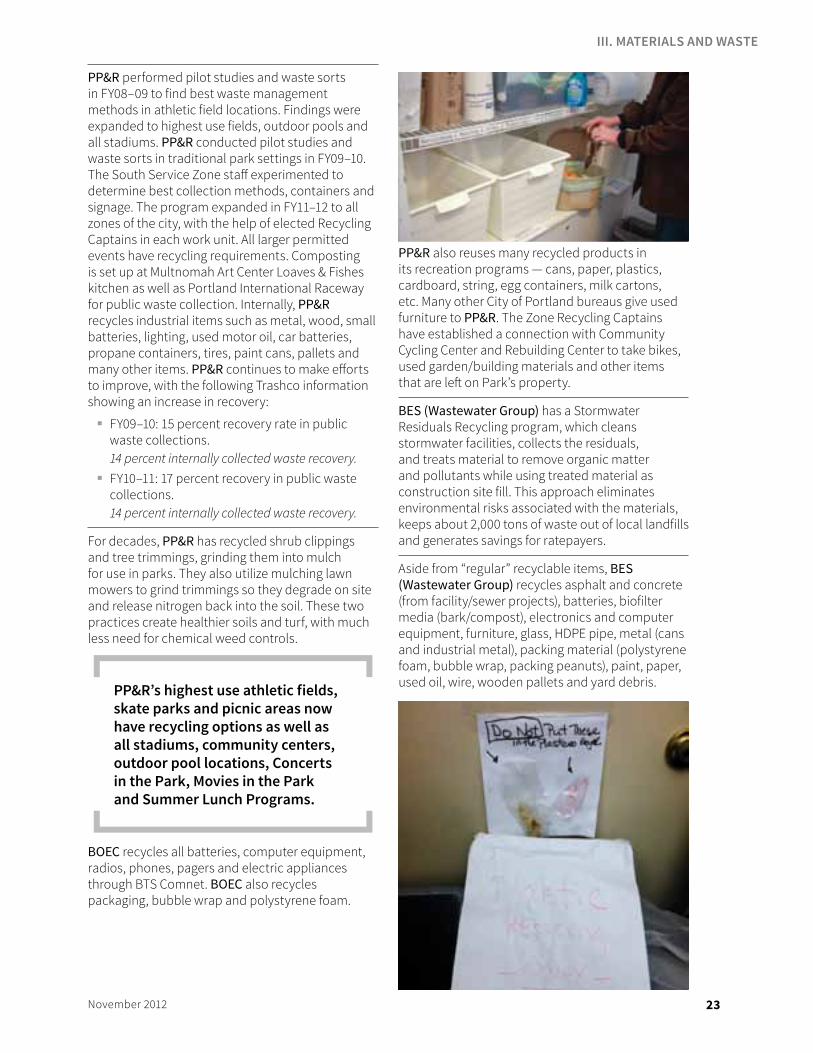
PP&R also reuses many recycled products in its recreation programs — cans, paper, plastics, cardboard, string, egg containers, milk cartons, etc. Many other City of Portland bureaus give used furniture to PP&R. The Zone Recycling Captains have established a connection with Community Cycling Center and Rebuilding Center to take bikes, used garden/building materials and other items that are left on Park’s property.
BES (Wastewater Group) has a Stormwater Residuals Recycling program, which cleans stormwater facilities, collects the residuals, and treats material to remove organic matter and pollutants while using treated material as construction site fill. This approach eliminates environmental risks associated with the materials, keeps about 2,000 tons of waste out of local landfills and generates savings for ratepayers.
Aside from “regular” recyclable items, BES (Wastewater Group) recycles asphalt and concrete (from facility/sewer projects), batteries, biofilter media (bark/compost), electronics and computer equipment, furniture, glass, HDPE pipe, metal (cans and industrial metal), packing material (polystyrene foam, bubble wrap, packing peanuts), paint, paper, used oil, wire, wooden pallets and yard debris.
III. MATERIALS AnD WASTE
24 November 2012
PBOT has taken steps to increase the number and type of items recycled from both office and field operations. Maintenance Operations recycles many items, and recently introduced two new programs. Due to changes in federal regulations, over 500 pounds of traffic control warning signs, made of rollable fabric, are being recycled. Also, a variety of hard plastic items are now being recycled including old water jugs, hard hats and parking meter casings. In the Portland Building, mixed recycling bins are now in all of the conference rooms and extra bins have been placed in the break rooms to collect plastic items not collected by the City’s hauler. The Downtown PBOT Green Team has taken responsibility for collecting and disposing of these materials.
Virtually all of the raw materials coming to BES (MTL) for testing is routed through recycling channels when leaving the lab.
At OMF (BIBS — CityFleet), recycling is integrated into everyday operations:
� 4,855 batteries recycled annually. � Approximately 16,000 gallons of used motor oil
are recycled every year. � A truckload of metal scraps recycled at least
twice a month. � A dumpster load of flattened cardboard
recycled at least 1–2 times a week. � All aerosol cans are punctured and recycled. � Used lubricating oils and antifreeze/Freon are
also recycled.
Food scrap composting systems were initiated at five City facilities in 2010 by OMF (BIBS — Facilities Services).
The Portland Building, City Hall and the Emergency Communication building diverted 96,000 pounds of food waste in 2010 and 98,000 pounds in 2011.
In 2011, OMF (BIBS — Facilities Services) expanded the Portland Building and City Hall recycling options to include plastic bags and clam shell containers. City Hall also expanded its battery recycling program.
OMF’s Technology Services Stores actively works to reduce, reuse or recycle all polystyrene foam, cardboard, wood pallets, metal, cell phones, desk phones, packaging material and batteries.
OMF (BIBS — Printing & Distribution/Technology Services) initiated a micro-electronics reuse and recycling program in 2010 for City bureaus, which includes recycling for small electronics, cords and other media accessories. This service is coordinated through the Printing & Distribution interoffice mail delivery system.
All toner cartridges from the printers at OMF (BIBS — Risk) are recycled through Step Forward.
Light bulbs, batteries, plastic bags, paper, metal, plastic, toner cartridges and eye glasses are all recycled at OMF (Revenue Bureau).
OMF (Technology Services) has a contract with Free Geek to redistribute desktops, laptops and LCD monitors. In 2009 over 750 computers were donated and in 2011, 500 computers, monitors and printers were donated. Free Geek refurbishes the equipment and matches items with Portland Public Schools and students, non-profit organizations and volunteers residing within the city of Portland.
The City donated over 1,250 computers and laptops to Free Geek in 2009–11.
SuStainable City Government: operationS Summary
25November 2012
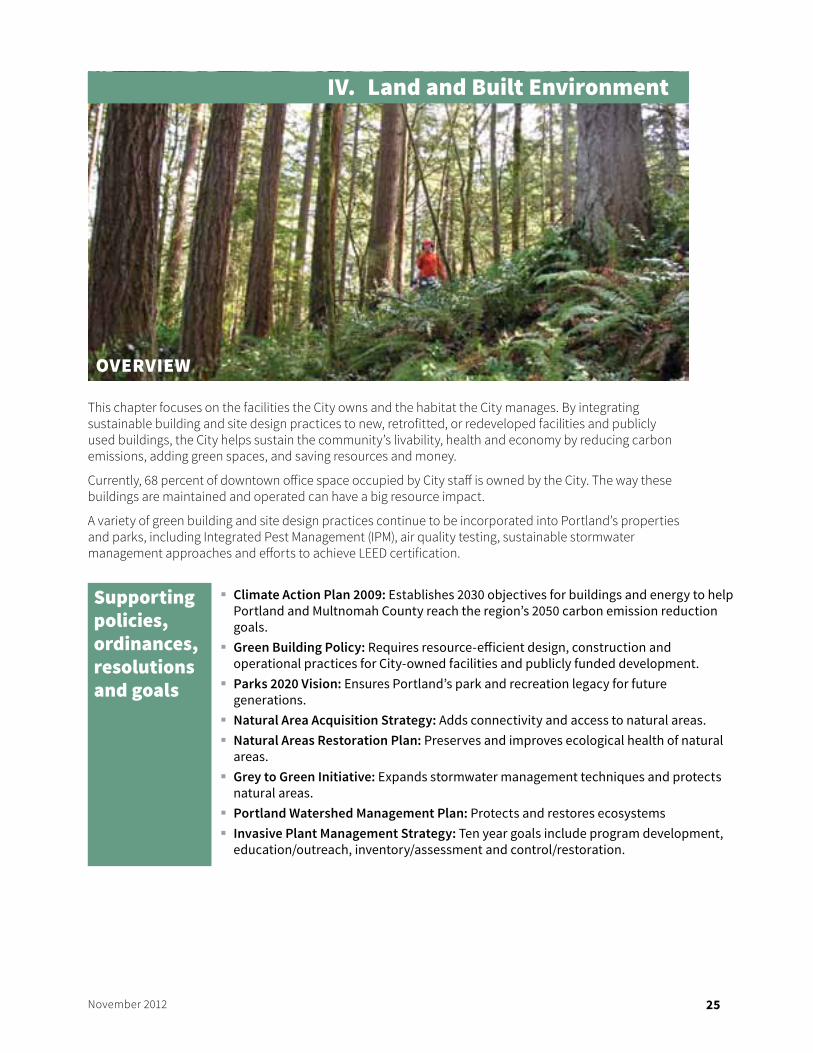
OVERVIEW
This chapter focuses on the facilities the City owns and the habitat the City manages. By integrating sustainable building and site design practices to new, retrofitted, or redeveloped facilities and publicly used buildings, the City helps sustain the community’s livability, health and economy by reducing carbon emissions, adding green spaces, and saving resources and money.
Currently, 68 percent of downtown office space occupied by City staff is owned by the City. The way these buildings are maintained and operated can have a big resource impact.
A variety of green building and site design practices continue to be incorporated into Portland’s properties and parks, including Integrated Pest Management (IPM), air quality testing, sustainable stormwater management approaches and efforts to achieve LEED certification.
Supporting policies, ordinances, resolutions and goals
� Climate Action Plan 2009: Establishes 2030 objectives for buildings and energy to help Portland and Multnomah County reach the region’s 2050 carbon emission reduction goals .
� Green Building Policy: Requires resource-efficient design, construction and operational practices for City-owned facilities and publicly funded development .
� Parks 2020 Vision: Ensures Portland’s park and recreation legacy for future generations .
� natural Area Acquisition Strategy: Adds connectivity and access to natural areas . � natural Areas Restoration Plan: Preserves and improves ecological health of natural
areas . � Grey to Green Initiative: Expands stormwater management techniques and protects
natural areas . � Portland Watershed Management Plan: Protects and restores ecosystems � Invasive Plant Management Strategy: Ten year goals include program development,
education/outreach, inventory/assessment and control/restoration .
IV. land and Built Environment
26 November 2012
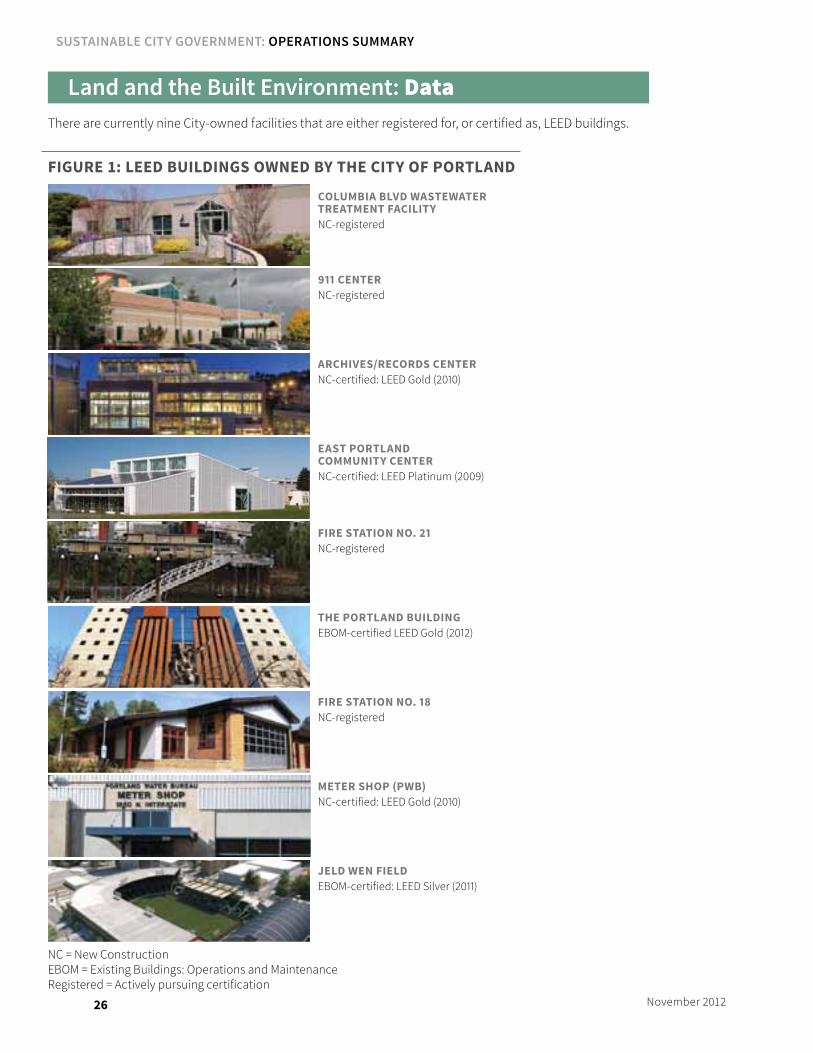
Land and the Built Environment: DataThere are currently nine City-owned facilities that are either registered for, or certified as, LEED buildings.
fiGure 1: leed buildinGS owned by the City of portland
Columbia blvd waStewater treatment faCilityNC-registered
911 CenterNC-registered
arChiveS/reCordS CenterNC-certified: LEED Gold (2010)
eaSt portland Community CenterNC-certified: LEED Platinum (2009)
fire Station no. 21NC-registered
the portland buildinGEBOM-certified LEED Gold (2012)
fire Station no. 18NC-registered
meter Shop (pwb)NC-certified: LEED Gold (2010)
Jeld wen fieldEBOM-certified: LEED Silver (2011)
NC = New Construction EBOM = Existing Buildings: Operations and Maintenance Registered = Actively pursuing certification
SuStainable City Government: operationS Summary
27November 2012
Land and the Built Environment: Bureau Highlights
FacIlItIESIn 2010, OMF (BIBS — Facilities Services) hired a full-time Sustainable Building Coordinator to enhance sustainability efforts for buildings within its portfolio, including a goal of achieving LEED for Existing Buildings.
BPS Green Building staff has provided training to dozens of project managers on LEED and green building.
PDC’s headquarters is a LEED-certified building (Existing Building, Gold). PDC collaborated with the building owner to achieve this certification.
PDC’s Green Team coordinated the activities to certify PDC headquarters as a LEED-certified building (Existing Building, Gold). The activities included coordination of surveys, performance monitoring, installation of motion sensor light fixtures (estimated savings of $2,000 annually; 75,000 gallons); low-flow toilets and showerheads (estimated savings of $1,000 annually); and other related projects.
Regular air quality testing by OMF (Facilities) was implemented in 2003 to ensure good air quality in City offices.
Eighteen buildings and five kiosks in the City’s property inventory have ecoroofs covering almost one acre of rooftop area. City-owned ecoroofs contribute 8 percent of the total 356 ecoroofs covering nearly 18 acres in the city as a whole. The City’s goal is to have 43 acres of ecoroofs city-wide by 2013.
OMF (BIBS — Facilities Services) participated in the Carbon4Square Challenge, which challenges buildings to reduce their greenhouse gas emissions through energy reduction, water efficiency, increasing alternative transportation commuting and waste reduction. City Hall placed 2nd in the Carbon Leaders category for small buildings. The Challenge also recognized the City of Portland for its carbon reduction efforts and engagement of tenants.
In 2011, both City Hall and The Portland Building became EnERGY STAR Certified buildings, both achieving a score over 80 out of 100, meaning their performance compares favorably to 80 percent of office buildings nationally.
ONI (NPNS office) has added numerous environmental features to the building such as a photovoltaic solar system, a geothermal heating system, radiant floor heating in the main community room and an “at sink” water heating system.
PP&R’s new Flavel Maintenance Facility incorporates many sustainable features including a solar thermal wall to meet the State’s 1.5 percent solar requirement, an eco-roof, extensive day lighting, high efficiency lighting, occupancy sensors and controls and high efficiency air handling units. Extensive landscaping was added to the site to meet stormwater run-off requirements.
HaBItatONI (NPNS office) has an Audubon Certified Backyard Habitat Courtyard that staff and volunteers maintain. Staff has modified the landscape and outdoor features to include native and salvaged plants, a rain garden, porous paving, and limited turf and impervious surfaces. No chemicals are used in any of the landscaping.
PP&R was evaluated by Salmon-Safe, an independent certification organization that assesses land management practices and their possible effects on aquatic ecosystems. A park system is considered salmon-safe when both its impact upon the aquatic ecosystem is assessed and any harmful impacts on water quality and fish habitat are minimized. PP&R was recertified Salmon-Safe in 2012.
IV. LAnD AnD THE BUILT EnVIROnMEnT
28 November 2012
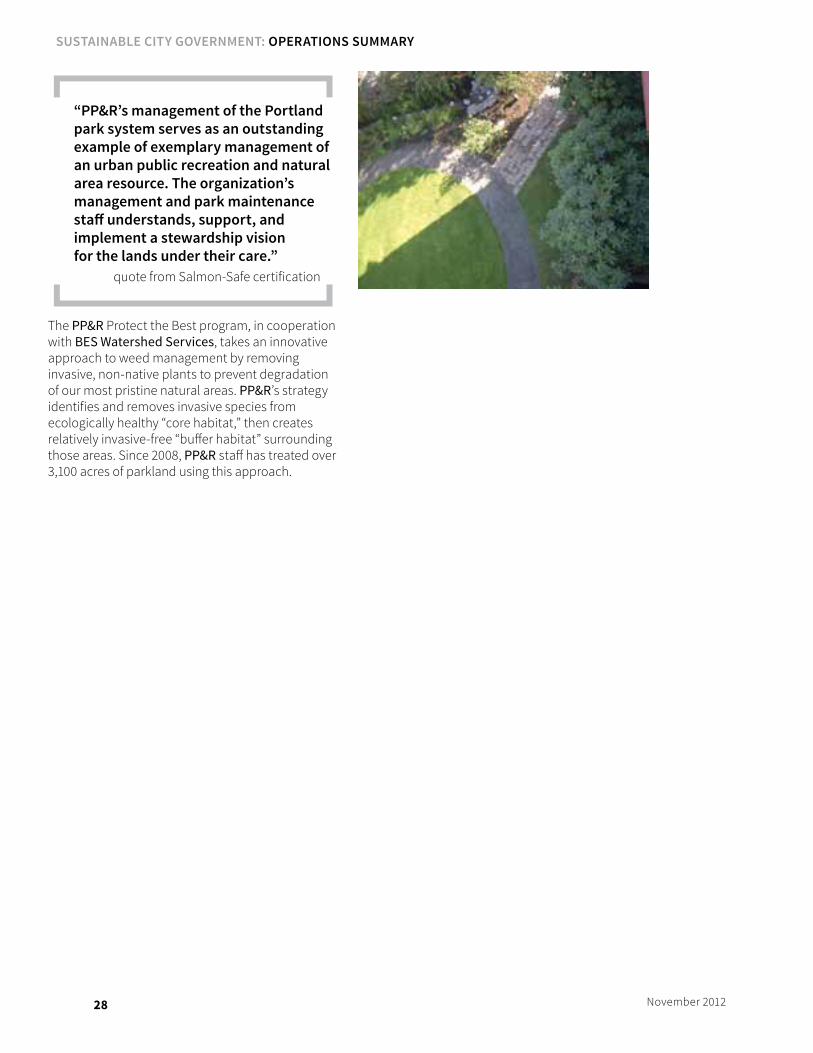
“PP&R’s management of the Portland park system serves as an outstanding example of exemplary management of an urban public recreation and natural area resource. The organization’s management and park maintenance staff understands, support, and implement a stewardship vision for the lands under their care.”
quote from Salmon-Safe certification
The PP&R Protect the Best program, in cooperation with BES Watershed Services, takes an innovative approach to weed management by removing invasive, non-native plants to prevent degradation of our most pristine natural areas. PP&R’s strategy identifies and removes invasive species from ecologically healthy “core habitat,” then creates relatively invasive-free “buffer habitat” surrounding those areas. Since 2008, PP&R staff has treated over 3,100 acres of parkland using this approach.
SuStainable City Government: operationS Summary
29November 2012
OVERVIEW
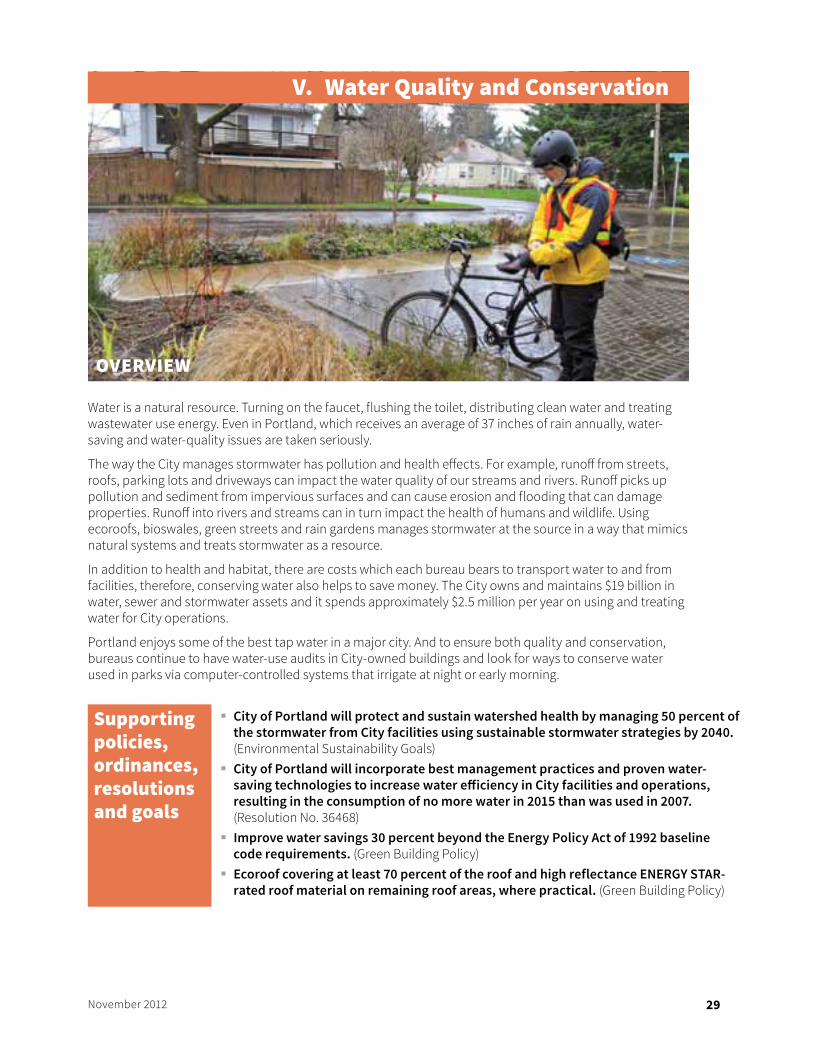
Water is a natural resource. Turning on the faucet, flushing the toilet, distributing clean water and treating wastewater use energy. Even in Portland, which receives an average of 37 inches of rain annually, water-saving and water-quality issues are taken seriously.
The way the City manages stormwater has pollution and health effects. For example, runoff from streets, roofs, parking lots and driveways can impact the water quality of our streams and rivers. Runoff picks up pollution and sediment from impervious surfaces and can cause erosion and flooding that can damage properties. Runoff into rivers and streams can in turn impact the health of humans and wildlife. Using ecoroofs, bioswales, green streets and rain gardens manages stormwater at the source in a way that mimics natural systems and treats stormwater as a resource.
In addition to health and habitat, there are costs which each bureau bears to transport water to and from facilities, therefore, conserving water also helps to save money. The City owns and maintains $19 billion in water, sewer and stormwater assets and it spends approximately $2.5 million per year on using and treating water for City operations.
Portland enjoys some of the best tap water in a major city. And to ensure both quality and conservation, bureaus continue to have water-use audits in City-owned buildings and look for ways to conserve water used in parks via computer-controlled systems that irrigate at night or early morning.
Supporting policies, ordinances, resolutions and goals
� City of Portland will protect and sustain watershed health by managing 50 percent of the stormwater from City facilities using sustainable stormwater strategies by 2040. (Environmental Sustainability Goals)
� City of Portland will incorporate best management practices and proven water-saving technologies to increase water efficiency in City facilities and operations, resulting in the consumption of no more water in 2015 than was used in 2007. (Resolution No. 36468)
� Improve water savings 30 percent beyond the Energy Policy Act of 1992 baseline code requirements. (Green Building Policy)
� Ecoroof covering at least 70 percent of the roof and high reflectance EnERGY STAR-rated roof material on remaining roof areas, where practical. (Green Building Policy)
V. Water quality and conservation
30 November 2012
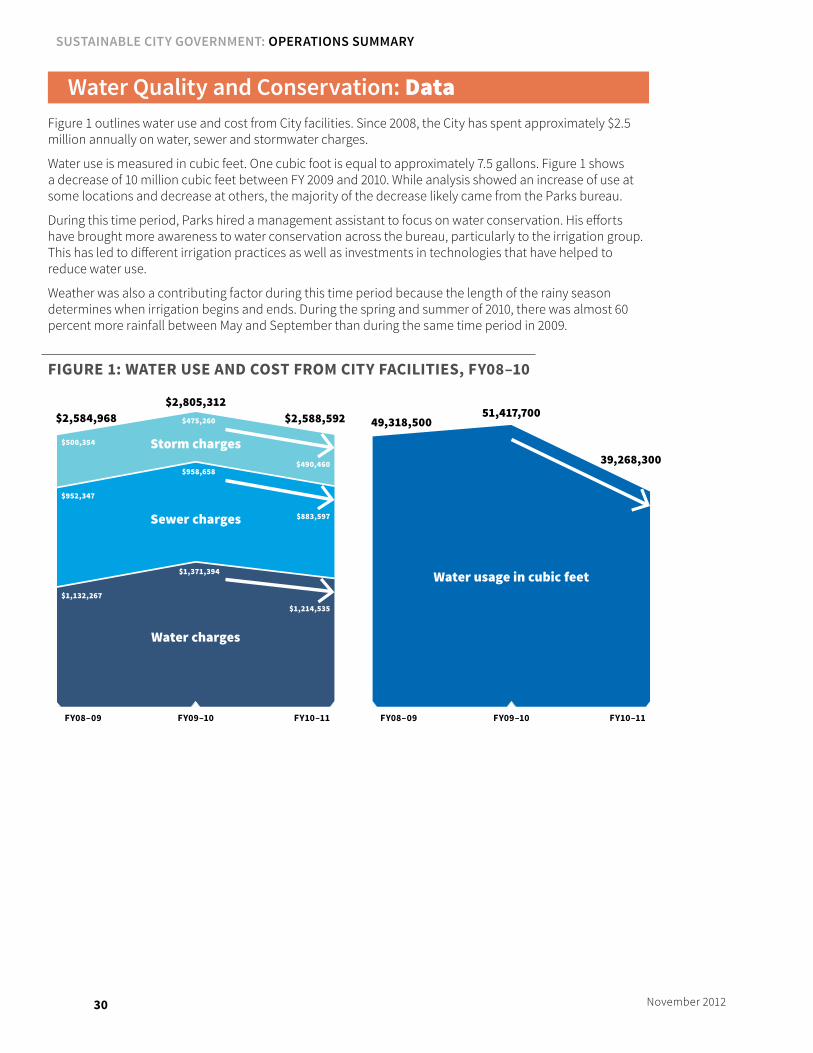
Water Quality and Conservation: DataFigure 1 outlines water use and cost from City facilities. Since 2008, the City has spent approximately $2.5 million annually on water, sewer and stormwater charges.
Water use is measured in cubic feet. One cubic foot is equal to approximately 7.5 gallons. Figure 1 shows a decrease of 10 million cubic feet between FY 2009 and 2010. While analysis showed an increase of use at some locations and decrease at others, the majority of the decrease likely came from the Parks bureau.
During this time period, Parks hired a management assistant to focus on water conservation. His efforts have brought more awareness to water conservation across the bureau, particularly to the irrigation group. This has led to different irrigation practices as well as investments in technologies that have helped to reduce water use.
Weather was also a contributing factor during this time period because the length of the rainy season determines when irrigation begins and ends. During the spring and summer of 2010, there was almost 60 percent more rainfall between May and September than during the same time period in 2009.
fiGure 1: water uSe and CoSt from City faCilitieS, fy08–10
49,318,500
$1,132,267
$500,354
$952,347
$2,584,968 51,417,700
$1,371,394
$475,260
$958,658
$2,805,312
39,268,300
$1,214,535
$490,460
$883,597
$2,588,592
Storm charges
Sewer charges
Water charges
Water usage in cubic feet
FY08–09 FY09–10 FY10–11 FY08–09 FY09–10 FY10–11
SuStainable City Government: operationS Summary
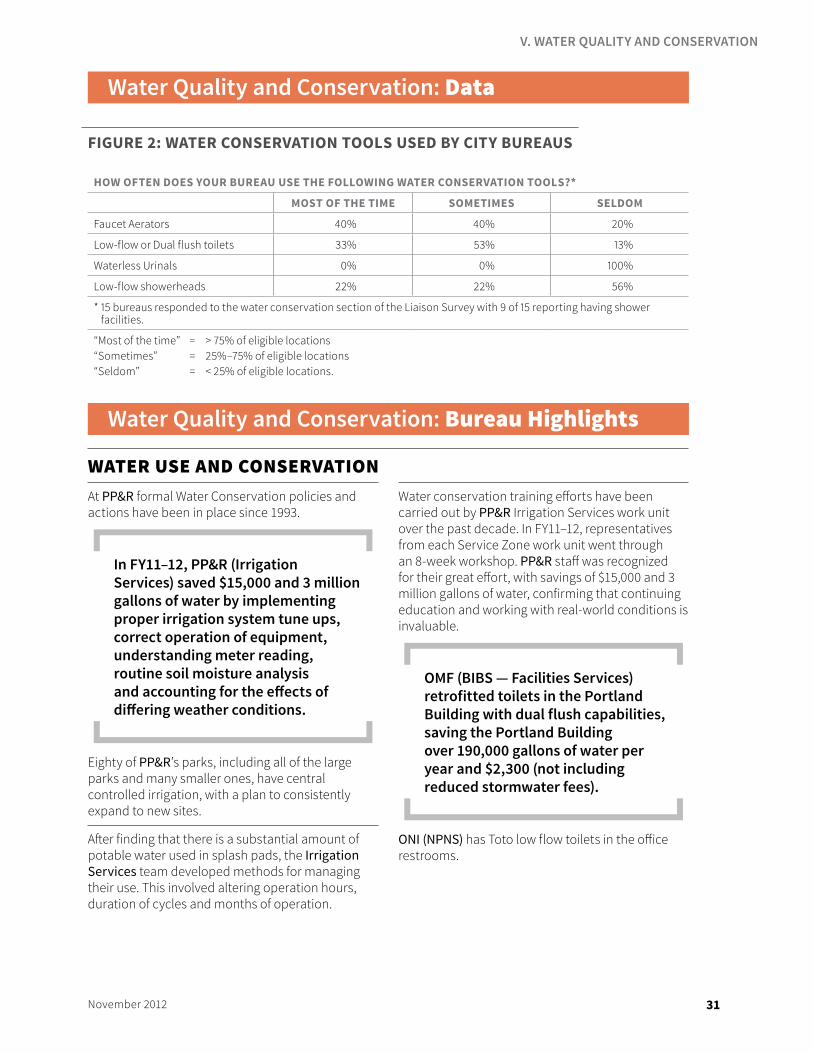
31November 2012
Water Quality and Conservation: Data
fiGure 2: water ConServation toolS uSed by City bureauS
how often doeS your bureau uSe the followinG water ConServation toolS?*
moSt of the time SometimeS Seldom
Faucet Aerators 40% 40% 20%
Low-flow or Dual flush toilets 33% 53% 13%
Waterless Urinals 0% 0% 100%
Low-flow showerheads 22% 22% 56%
* 15 bureaus responded to the water conservation section of the Liaison Survey with 9 of 15 reporting having shower facilities.
“Most of the time” = > 75% of eligible locations“Sometimes” = 25%–75% of eligible locations“Seldom” = < 25% of eligible locations.
Water Quality and Conservation: Bureau Highlights
WatER USE anD cOnSERVatIOnAt PP&R formal Water Conservation policies and actions have been in place since 1993.
In FY11–12, PP&R (Irrigation Services) saved $15,000 and 3 million gallons of water by implementing proper irrigation system tune ups, correct operation of equipment, understanding meter reading, routine soil moisture analysis and accounting for the effects of differing weather conditions.
Eighty of PP&R’s parks, including all of the large parks and many smaller ones, have central controlled irrigation, with a plan to consistently expand to new sites.
After finding that there is a substantial amount of potable water used in splash pads, the Irrigation Services team developed methods for managing their use. This involved altering operation hours, duration of cycles and months of operation.
Water conservation training efforts have been carried out by PP&R Irrigation Services work unit over the past decade. In FY11–12, representatives from each Service Zone work unit went through an 8-week workshop. PP&R staff was recognized for their great effort, with savings of $15,000 and 3 million gallons of water, confirming that continuing education and working with real-world conditions is invaluable.
OMF (BIBS — Facilities Services) retrofitted toilets in the Portland Building with dual flush capabilities, saving the Portland Building over 190,000 gallons of water per year and $2,300 (not including reduced stormwater fees).
ONI (NPNS) has Toto low flow toilets in the office restrooms.
V. WATER QUALITY AnD COnSERVATIOn
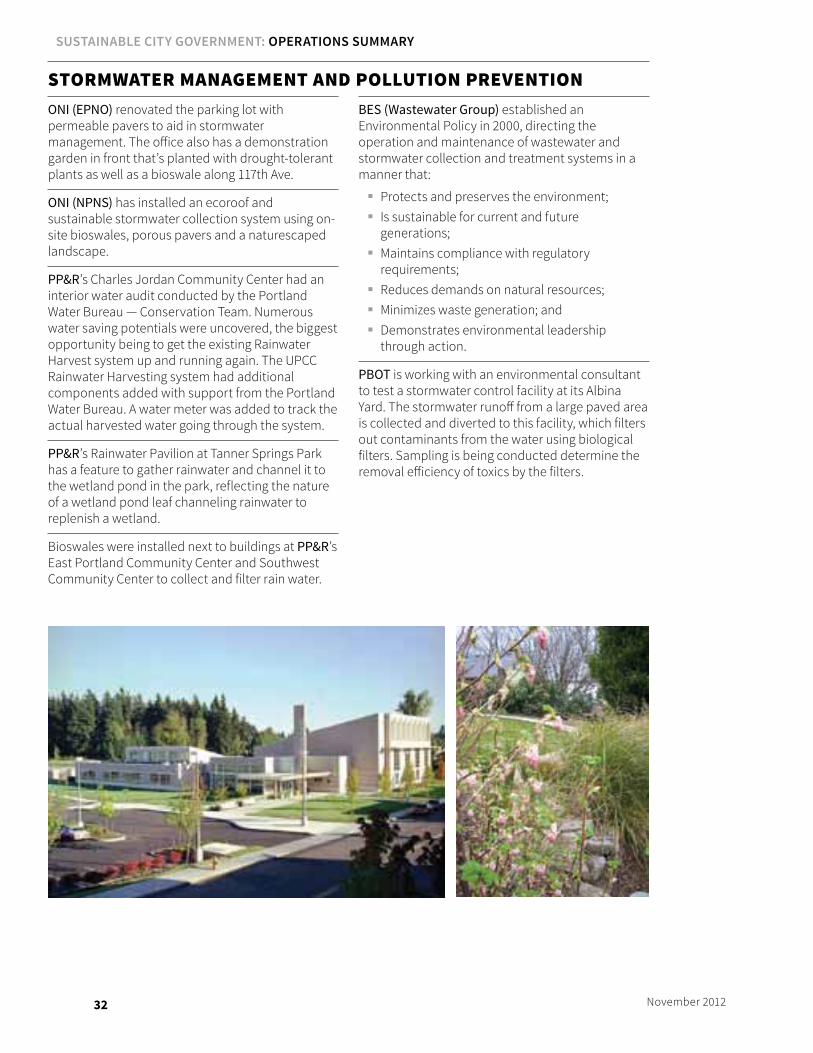
32 November 2012
StORmWatER managEmEnt anD pOllUtIOn pREVEntIOnONI (EPNO) renovated the parking lot with permeable pavers to aid in stormwater management. The office also has a demonstration garden in front that’s planted with drought-tolerant plants as well as a bioswale along 117th Ave.
ONI (NPNS) has installed an ecoroof and sustainable stormwater collection system using on-site bioswales, porous pavers and a naturescaped landscape.
PP&R’s Charles Jordan Community Center had an interior water audit conducted by the Portland Water Bureau — Conservation Team. Numerous water saving potentials were uncovered, the biggest opportunity being to get the existing Rainwater Harvest system up and running again. The UPCC Rainwater Harvesting system had additional components added with support from the Portland Water Bureau. A water meter was added to track the actual harvested water going through the system.
PP&R’s Rainwater Pavilion at Tanner Springs Park has a feature to gather rainwater and channel it to the wetland pond in the park, reflecting the nature of a wetland pond leaf channeling rainwater to replenish a wetland.
Bioswales were installed next to buildings at PP&R’s East Portland Community Center and Southwest Community Center to collect and filter rain water.
BES (Wastewater Group) established an Environmental Policy in 2000, directing the operation and maintenance of wastewater and stormwater collection and treatment systems in a manner that:
� Protects and preserves the environment; � Is sustainable for current and future
generations; � Maintains compliance with regulatory
requirements; � Reduces demands on natural resources; � Minimizes waste generation; and � Demonstrates environmental leadership
through action.
PBOT is working with an environmental consultant to test a stormwater control facility at its Albina Yard. The stormwater runoff from a large paved area is collected and diverted to this facility, which filters out contaminants from the water using biological filters. Sampling is being conducted determine the removal efficiency of toxics by the filters.
SuStainable City Government: operationS Summary

33November 2012
OVERVIEW
More than 40 percent of Oregon’s carbon emissions are transportation-related (PBOT Employer Transportation Tool Kit 2010), and the City has the opportunity to address transportation costs, energy use and carbon emissions both on the job and in supporting commute options for city employees.
While at work, employees are increasingly using more efficient technologies and cleaner fuel. According to the Oregon Department of Environmental Quality, “a dollar spent on cleaner fuel will bring $10 worth of benefits to public health and the environment.” By adding highly efficient electric vehicles to the City’s fleet, as well as using technology and transportation options to decrease time and carbon emissions from work-related travel, Portland is reducing money spent on fuel and pollutants entering the atmosphere.
Employees have many choices in how they get to work. By offering and promoting transportation options such as walking, taking public transit, carpooling and bicycling, City employees help offset many tons of would-be emitted carbon.
Supporting policies, ordinances, resolutions and goals
� City-owned vehicles that operate on diesel shall use fuel with a biodiesel content of not less than 20 percent to maximize the City’s use of renewable fuels. (Biofuels Requirement for Petroleum-based Fuels Sold in Portland and City-owned Vehicles)
� Do not unnecessarily idle diesel vehicles more than 5 minutes or gasoline vehicles more than 1 minute when vehicle is stopped for a foreseeable period of time. (Idle Reduction Policy)
� Allow appropriate time for cool-down of diesel vehicles prior to shutting them off, not to exceed 5 minutes. Limit idle time of diesel-powered vehicles to no more than 5 minutes during warm-up, gasoline-powered vehicles to no more than 5 minutes during warm-up, and at times when the vehicle is being restarted after a prolonged period of shut down because that result is a similar condition to initial shift warm-up. (Idle Reduction Policy)
� Restrict idle time to less than 3 minutes for gasoline vehicles making frequent and multiple stops. (Idle Reduction Policy)
� Ensure environmental quality and understand environmental linkages when decisions are made regarding growth management, land use, transportation, energy, water, affordable housing, indoor and outdoor air quality and economic development. (ENN-3.01 — Sustainable City Principles)
� CityFleet shall pursue alternative programs to reduce dependency on fossil fuels, reduce fuel consumption, and promote clean air. (Idle Reduction Policy)
� Require that local government fleets, regulated fleets (e.g., taxis and waste/recycling haulers), and the fleets of local government contractors meet minimum fleet fuel efficiency standards and use low-carbon fuels. (CAP 2009)
� Buy electric and plug-in hybrid vehicles for City and County fleets as they become commercially available. (CAP 2009)
� Establish video and/or web conferencing capability in all major City and County facilities. (CAP 2009)
VI. transportation
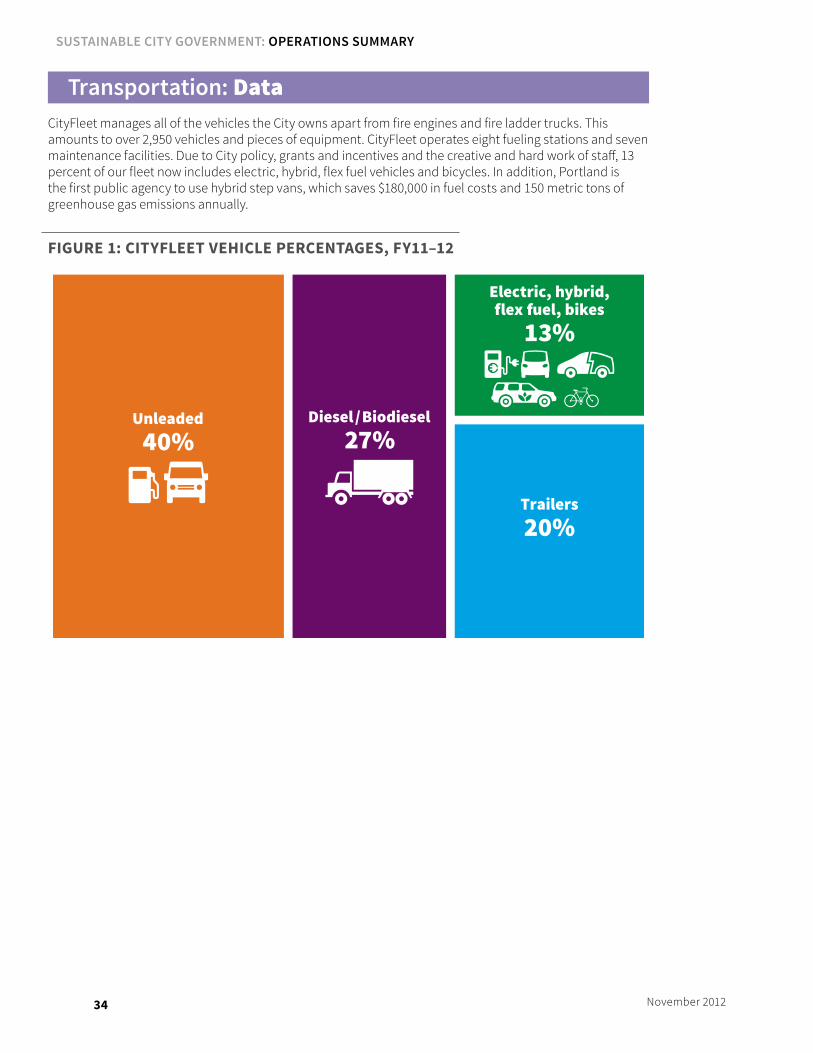
34 November 2012
Transportation: DataCityFleet manages all of the vehicles the City owns apart from fire engines and fire ladder trucks. This amounts to over 2,950 vehicles and pieces of equipment. CityFleet operates eight fueling stations and seven maintenance facilities. Due to City policy, grants and incentives and the creative and hard work of staff, 13 percent of our fleet now includes electric, hybrid, flex fuel vehicles and bicycles. In addition, Portland is the first public agency to use hybrid step vans, which saves $180,000 in fuel costs and 150 metric tons of greenhouse gas emissions annually.
fiGure 1: Cityfleet vehiCle perCentaGeS, fy11–12
Electric, hybrid,flex fuel, bikes
13%
Trailers20%
Diesel/Biodiesel27%
Unleaded40%
SuStainable City Government: operationS Summary
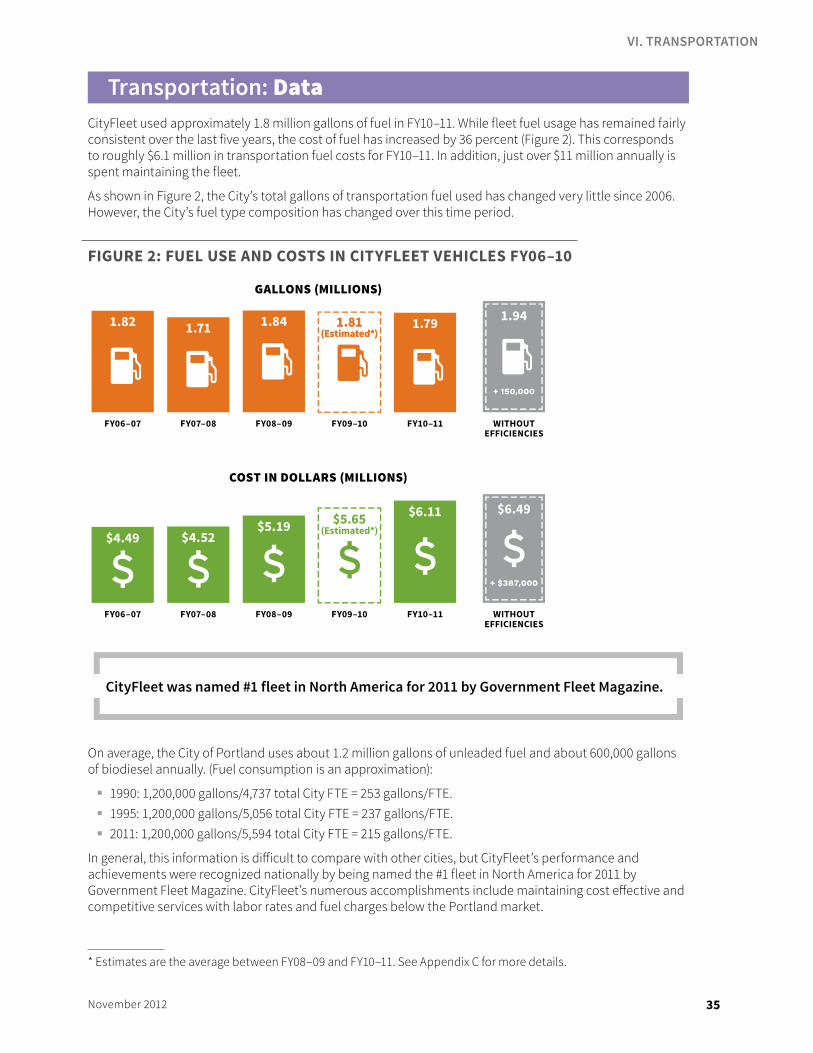
35November 2012
Transportation: DataCityFleet used approximately 1.8 million gallons of fuel in FY10–11. While fleet fuel usage has remained fairly consistent over the last five years, the cost of fuel has increased by 36 percent (Figure 2). This corresponds to roughly $6.1 million in transportation fuel costs for FY10–11. In addition, just over $11 million annually is spent maintaining the fleet.
As shown in Figure 2, the City’s total gallons of transportation fuel used has changed very little since 2006. However, the City’s fuel type composition has changed over this time period.
fiGure 2: fuel uSe and CoStS in Cityfleet vehiCleS fy06–10
1.84
COST IN DOLLARS (MILLIONS)
GALLONS (MILLIONS)
FY06–07 FY07–08 FY08–09 FY09–10 FY10–11 WITHOUTEFFICIENCIES
1.82 1.71 1.81(Estimated*)
1.81(Estimated*)
1.79 1.94
+ 150,000
FY06–07 FY07–08 FY08–09 FY09–10 FY10–11 WITHOUTEFFICIENCIES
$4.49 $4.52$5.19 $5.65
(Estimated*)
$6.11 $6.49
+ $387,000
CityFleet was named #1 fleet in north America for 2011 by Government Fleet Magazine.
On average, the City of Portland uses about 1.2 million gallons of unleaded fuel and about 600,000 gallons of biodiesel annually. (Fuel consumption is an approximation):
� 1990: 1,200,000 gallons/4,737 total City FTE = 253 gallons/FTE. � 1995: 1,200,000 gallons/5,056 total City FTE = 237 gallons/FTE. � 2011: 1,200,000 gallons/5,594 total City FTE = 215 gallons/FTE.
In general, this information is difficult to compare with other cities, but CityFleet’s performance and achievements were recognized nationally by being named the #1 fleet in North America for 2011 by Government Fleet Magazine. CityFleet’s numerous accomplishments include maintaining cost effective and competitive services with labor rates and fuel charges below the Portland market.
* Estimates are the average between FY08–09 and FY10–11. See Appendix C for more details.
VI. TRAnSPORTATIOn
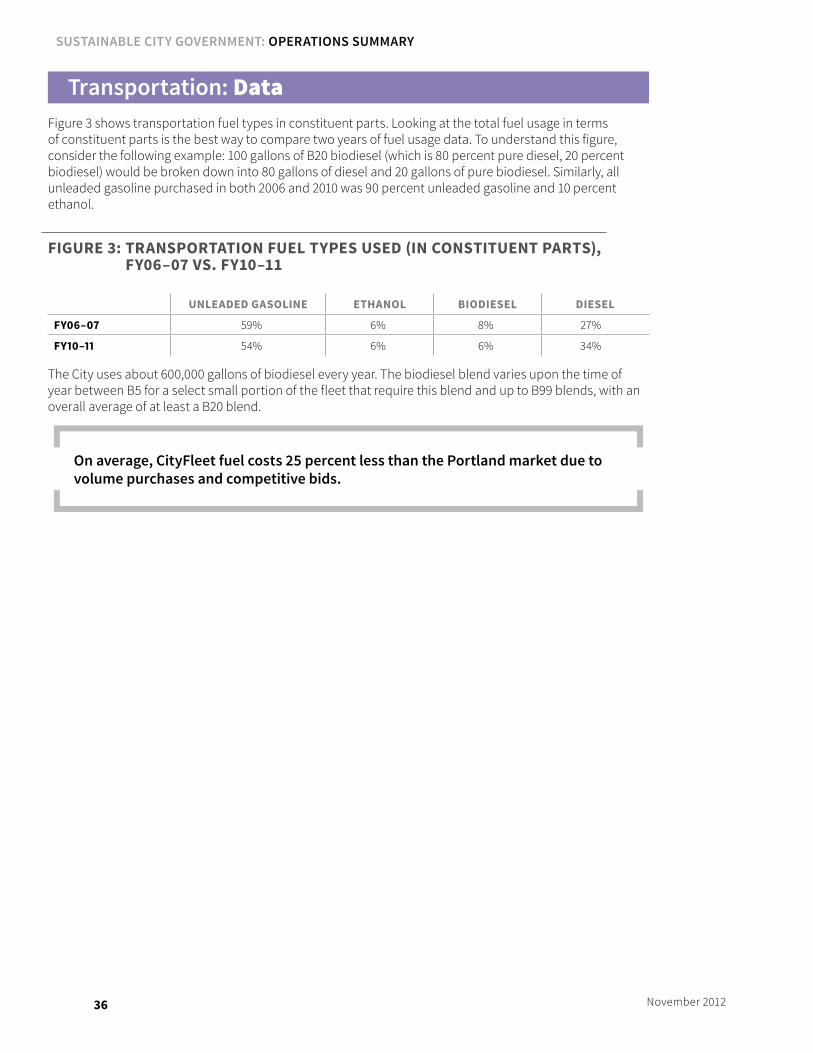
36 November 2012
Transportation: DataFigure 3 shows transportation fuel types in constituent parts. Looking at the total fuel usage in terms of constituent parts is the best way to compare two years of fuel usage data. To understand this figure, consider the following example: 100 gallons of B20 biodiesel (which is 80 percent pure diesel, 20 percent biodiesel) would be broken down into 80 gallons of diesel and 20 gallons of pure biodiesel. Similarly, all unleaded gasoline purchased in both 2006 and 2010 was 90 percent unleaded gasoline and 10 percent ethanol.
fiGure 3: tranSportation fuel typeS uSed (in ConStituent partS), fy06–07 vS. fy10–11
unleaded GaSoline ethanol biodieSel dieSel
fy06–07 59% 6% 8% 27%
fy10–11 54% 6% 6% 34%
The City uses about 600,000 gallons of biodiesel every year. The biodiesel blend varies upon the time of year between B5 for a select small portion of the fleet that require this blend and up to B99 blends, with an overall average of at least a B20 blend.
On average, CityFleet fuel costs 25 percent less than the Portland market due to volume purchases and competitive bids.
SuStainable City Government: operationS Summary
37November 2012
Transportation: Bureau Highlights
FUElIn 2011, PWB staff drove approximately 1,625,000 miles and used 227,000 gallons of fuel. In an effort to reduce fuel use, the PWB created an eco-driver training program. Class participants learn about how the six principles of eco-driving (driving style, starting and idling, vehicle speed, vehicle load, driving conditions and maintenance) impact fuel use, personal safety, and the environment.
In 2010 and 2011, OMF (BIBS — CityFleet) renovated/replaced aging infrastructure with a state-of-the-art fueling station at Sandy River, added a biodiesel fuel tank to the fueling station at the SW 1st Ave. and Jefferson St. facility, and upgraded its Stanton Yard fueling station to meet DEQ requirements. The Stanton Yard fueling station has a tank for dispensing E85 and also has the first Diesel Exhaust Fluid (DEF) dispenser in the State of Oregon to meet new EPA emission reduction requirements.
OMF (BIBS — P&D) improved the fleet efficiency by adding more fuel-efficient vehicles.
PP&R staff has been using WebEx, an online video conferencing technology that allows staff to participate in meetings from their desks or from specified conference rooms in the system, reducing fuel use and staff travel time. Documents can be edited and shared easily by meeting participants.
FlEEtAs of the end of 2011, the City now owns 11 Nissan LEAFs and one GEM Electric Car as part of its fleet. The City continually examines opportunities to green the fleet by looking for areas of compatibility for more all-electric, plug-in hybrid and hybrid vehicles.
OMF (BIBS — CityFleet) has incorporated a number of smaller electric vehicles, including electric bicycles, into the City’s fleet for use by City staff. CityFleet is evaluating the feasibility of replacing vehicles (including step vans) that have reached the end of their economic lifecycle with an electric vehicle. CityFleet also purchased four fuel-efficient hybrid step vans in 2011.
OMF (BIBS — CityFleet) is aggressively pursuing a goal of having 20 percent of the City’s fleet be electric vehicles by the year 2030.
PP&R has replaced a variety of their fleet vehicles with more efficient vehicles including four Ford Fusion Hybrids, downsized an extended cab pickup to a Ford Fusion Hybrid, and replaced an aerial truck with a hybrid aerial truck. PP&R also uses a few smaller, fuel efficient vehicles such as the Toro Workman.
PBOT (Transportation Maintenance) has six diesel electric hybrid trucks. Four of these are step vans to be used by the Traffic Signs Maintenance division; the other two are used as fueling trucks. The batteries on board also power the equipment used by the maintenance crews and reduce idling time of the engine. The regenerative braking system charges the battery and reduces brake wear.
Approximately half of all City bureaus offer TriMet passes for staff who are going to work-related meetings, which helps eliminate single-occupancy travel while providing an incentive for staff to use public transportation when possible.
Since 2000, OMF (BIBS — CityFleet) has used 100 percent re-refined motor oil certified by the American Petroleum Institute (API) for medium and heavy duty vehicles, including diesel vehicles, pickups, and light trucks. Additionally, used motor oil is sent to a local company to be re-refined again or used as fuel oil. In a typical year, the City recycles 16,000 gallons of used motor oil.
VI. TRAnSPORTATIOn
38 November 2012
IDlIngThrough the work of BPS, PBOT and OMF (BIBS — CityFleet), Council approved an idle reduction policy for all City vehicles in 2010.
OMF (BIBS — Facilities Services) placed signs in the garage of the Portland Building asking drivers to turn off their vehicle to reduce idling.
OMF (BIBS — Procurement) completed a successful pilot with its office supplies vendor, Office Depot, to deliver orders by cargo trike. The pilot worked so well that Office Depot has since expanded the program to other customer accounts and additional City locations.
BUSInESS tRaVEl; nOn-cOmmUtE-RElatED pRactIcESBES (Wastewater Group) purchases and uses all-electric carts for plant use. Bicycles are used at the Columbia Blvd Wastewater Treatment plant for travel within the site. Other transportation-related items from this group include:
� Use of webinars to reduce travel and fuel expenses.
� The Pump Station Maintenance department has supplied six maintenance vehicles with laptops for bureau staff to conduct City business remotely. The help reduce travel time, carbon dioxide emissions and fuel usage.
To save money, OMF (BIBS — Risk) changed the work procedure of using personal vehicles for field work to requiring use of CityFleet Motor Pool cars for business purposes.
The ONI Crime Prevention program is moving its entire staff to a central hub location, reducing the need to travel to meetings. Previous to the creation of this hub office, the Crime Prevention Coordinators were located in seven to eight different offices across the city, requiring staff to travel to participate in group and staff meetings.
cOmmUtIngCity employees from the City Attorney’s Office worked with the Mayor’s Office, both housed in City Hall, and with OMF to have bike racks installed on the fourth floor of the building. These racks are now used by employees from throughout the building and are generally full year-round. The bike racks relieve some of the congestion at the Portland Building bike parking, and they serve as a convenient amenity for City Hall employees.
A PBOT/OMF (BIBS — Facilities Services) survey showed single-occupancy commuting accounts for only 40 percent of the commuting in the Portland Building and 20 percent of the commuting in City Hall.
At OnI (nPnS and EPnO), about half of all staff commutes are by bike.
In spring 2011, BPS and BDS, in conjunction with Portland State University, worked to have a second secure bike parking area installed in the 1900 Building. This project had been discussed for many years, and this was a great accomplishment, pushed by BPS consolidating offices (and adding 30+ employees) at the building. This additional in-building, key fob-secured area accommodates up to 57 bicycles and includes a self-service repair stand and 36 lockers.
ONI (NPNS) has installed bike racks to encourage visitors to bike by providing a convenient resource for keeping their bikes secure during their visit.
SuStainable City Government: operationS Summary
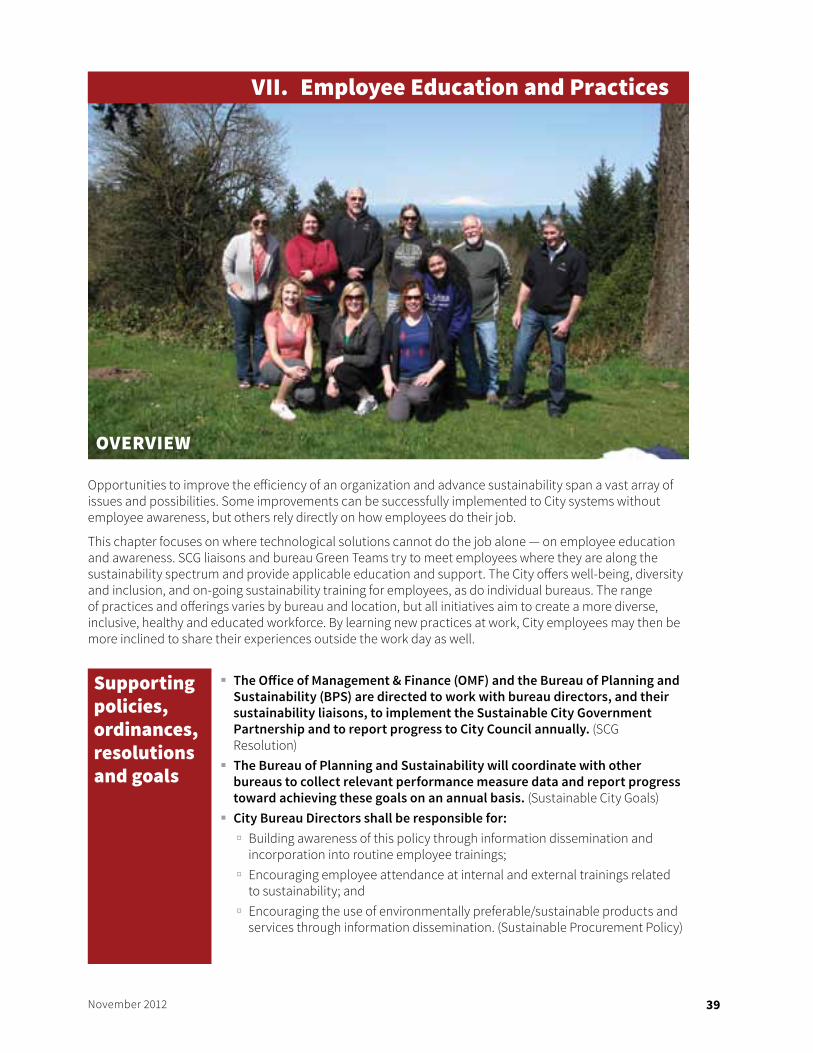
39November 2012
OVERVIEW
Opportunities to improve the efficiency of an organization and advance sustainability span a vast array of issues and possibilities. Some improvements can be successfully implemented to City systems without employee awareness, but others rely directly on how employees do their job.
This chapter focuses on where technological solutions cannot do the job alone — on employee education and awareness. SCG liaisons and bureau Green Teams try to meet employees where they are along the sustainability spectrum and provide applicable education and support. The City offers well-being, diversity and inclusion, and on-going sustainability training for employees, as do individual bureaus. The range of practices and offerings varies by bureau and location, but all initiatives aim to create a more diverse, inclusive, healthy and educated workforce. By learning new practices at work, City employees may then be more inclined to share their experiences outside the work day as well.
Supporting policies, ordinances, resolutions and goals
� The Office of Management & Finance (OMF) and the Bureau of Planning and Sustainability (BPS) are directed to work with bureau directors, and their sustainability liaisons, to implement the Sustainable City Government Partnership and to report progress to City Council annually. (SCG Resolution)
� The Bureau of Planning and Sustainability will coordinate with other bureaus to collect relevant performance measure data and report progress toward achieving these goals on an annual basis. (Sustainable City Goals)
� City Bureau Directors shall be responsible for: à Building awareness of this policy through information dissemination and
incorporation into routine employee trainings; à Encouraging employee attendance at internal and external trainings related
to sustainability; and à Encouraging the use of environmentally preferable/sustainable products and
services through information dissemination. (Sustainable Procurement Policy)
VII. Employee Education and practices
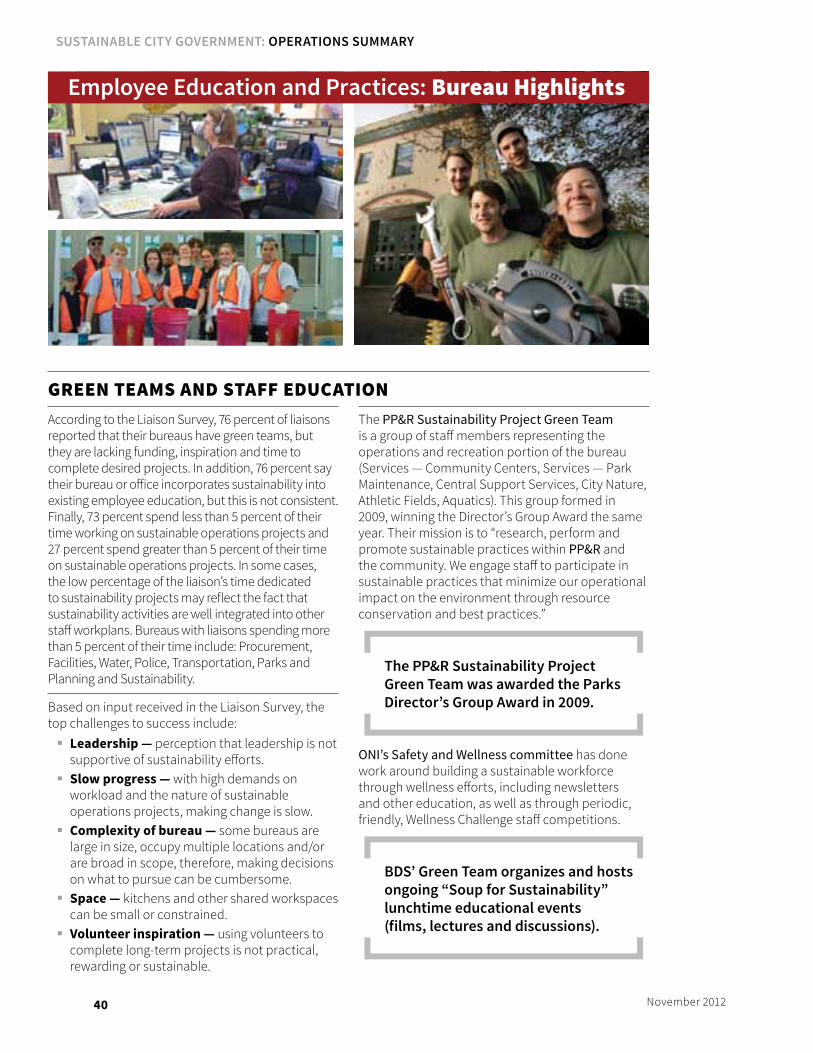
40 November 2012
gREEn tEamS anD StaFF EDUcatIOnAccording to the Liaison Survey, 76 percent of liaisons reported that their bureaus have green teams, but they are lacking funding, inspiration and time to complete desired projects. In addition, 76 percent say their bureau or office incorporates sustainability into existing employee education, but this is not consistent. Finally, 73 percent spend less than 5 percent of their time working on sustainable operations projects and 27 percent spend greater than 5 percent of their time on sustainable operations projects. In some cases, the low percentage of the liaison’s time dedicated to sustainability projects may reflect the fact that sustainability activities are well integrated into other staff workplans. Bureaus with liaisons spending more than 5 percent of their time include: Procurement, Facilities, Water, Police, Transportation, Parks and Planning and Sustainability.
Based on input received in the Liaison Survey, the top challenges to success include:
� leadership — perception that leadership is not supportive of sustainability efforts.
� Slow progress — with high demands on workload and the nature of sustainable operations projects, making change is slow.
� Complexity of bureau — some bureaus are large in size, occupy multiple locations and/or are broad in scope, therefore, making decisions on what to pursue can be cumbersome.
� Space — kitchens and other shared workspaces can be small or constrained.
� volunteer inspiration — using volunteers to complete long-term projects is not practical, rewarding or sustainable.
The PP&R Sustainability Project Green Team is a group of staff members representing the operations and recreation portion of the bureau (Services — Community Centers, Services — Park Maintenance, Central Support Services, City Nature, Athletic Fields, Aquatics). This group formed in 2009, winning the Director’s Group Award the same year. Their mission is to “research, perform and promote sustainable practices within PP&R and the community. We engage staff to participate in sustainable practices that minimize our operational impact on the environment through resource conservation and best practices.”
The PP&R Sustainability Project Green Team was awarded the Parks Director’s Group Award in 2009.
ONI’s Safety and Wellness committee has done work around building a sustainable workforce through wellness efforts, including newsletters and other education, as well as through periodic, friendly, Wellness Challenge staff competitions.
BDS’ Green Team organizes and hosts ongoing “Soup for Sustainability” lunchtime educational events (films, lectures and discussions).
Employee Education and Practices: Bureau Highlights
SuStainable City Government: operationS Summary
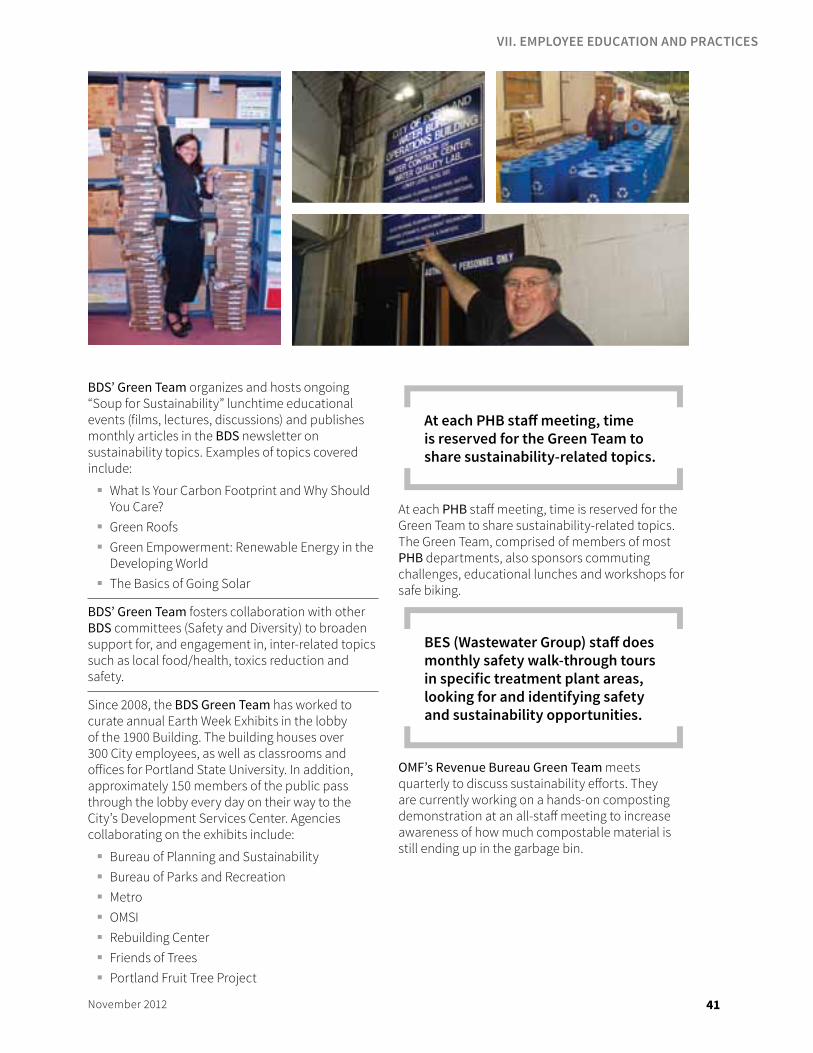
41November 2012
BDS’ Green Team organizes and hosts ongoing “Soup for Sustainability” lunchtime educational events (films, lectures, discussions) and publishes monthly articles in the BDS newsletter on sustainability topics. Examples of topics covered include:
� What Is Your Carbon Footprint and Why Should You Care?
� Green Roofs � Green Empowerment: Renewable Energy in the
Developing World � The Basics of Going Solar
BDS’ Green Team fosters collaboration with other BDS committees (Safety and Diversity) to broaden support for, and engagement in, inter-related topics such as local food/health, toxics reduction and safety.
Since 2008, the BDS Green Team has worked to curate annual Earth Week Exhibits in the lobby of the 1900 Building. The building houses over 300 City employees, as well as classrooms and offices for Portland State University. In addition, approximately 150 members of the public pass through the lobby every day on their way to the City’s Development Services Center. Agencies collaborating on the exhibits include:
� Bureau of Planning and Sustainability � Bureau of Parks and Recreation � Metro � OMSI � Rebuilding Center � Friends of Trees � Portland Fruit Tree Project
At each PHB staff meeting, time is reserved for the Green Team to share sustainability-related topics.
At each PHB staff meeting, time is reserved for the Green Team to share sustainability-related topics. The Green Team, comprised of members of most PHB departments, also sponsors commuting challenges, educational lunches and workshops for safe biking.
BES (Wastewater Group) staff does monthly safety walk-through tours in specific treatment plant areas, looking for and identifying safety and sustainability opportunities.
OMF’s Revenue Bureau Green Team meets quarterly to discuss sustainability efforts. They are currently working on a hands-on composting demonstration at an all-staff meeting to increase awareness of how much compostable material is still ending up in the garbage bin.
VII. EMPLOYEE EDUCATIOn AnD PRACTICES
42 November 2012
For the past four years, OMF’s Revenue Bureau Green Team has sponsored a clothing donation drive for Dress for Success. Clothing items get re-used through this program and avoid ending up in the land fill.
OMF (BIBS — P&D) has highlighted and encouraged the use of environmentally preferable papers to City bureaus and other customers on its website and through hosted open houses.
In 2011, OMF (BIBS — Procurement) staff received over 8 hours in training from sustainable procurement expert, Scott Case. This training not only emphasized how to incorporate sustainability into procurement decisions and processes, but also built awareness of sustainability best practices in general. In addition to this special training, Procurement Services routinely incorporates sustainability updates and education into staff meetings, brown bags, and related employee education opportunities.
PP&R’s Sustainability Team, in conjunction with Mapache Films, created a short video that was shown at the Movies in the Park series in the summer of 2012. The film highlights kids talking about what they think it means to “be green” relative to recycling, energy conservation and taking care of the planet. The kids helped staff to understand what they know about sustainability and how to care for parks and natural areas. The video sharing incorporates sustainability messaging into entertainment venues with a captive audience as an innovative way to share information.
PP&R’s Sustainability Team, in conjunction with Mapache Films, is creating a short video to be shown at the Movies in the Park series in the summer of 2012. The film highlights kids talking about what they think it means to “be green” relative to recycling, energy conservation, and taking care of the planet.
In addition to staff education, PWB’s Green Teams have used recycling rebate money to host breakfast presentations for Maintenance and Construction crews. Presentations focus primarily on waste reduction and recycling.
At the beginning of 2012, the OMF Green Team partnered with the City’s Wellness program to collect and recycle over 320 pairs of shoes for Nike’s Regrind program. Included in this effort was a brown bag on how to pick new athletic shoes, attended by over 40 City employees.
BPS’ Sustainable Operations Committee (SOC) hosts monthly Green Bag lunches on a variety of sustainability-oriented topics. Speakers and walking tours of features nearby the office, such as the 4-T, are also popular events hosted by the SOC.
In July 2009, OMF (Revenue Bureau) held an employee brown bag to watch Garbage! The Revolution Starts at Home, a documentary that tracked the garbage generated by one family for three months.
OMF (Business Operations and BIBS — Facilities) hosted a lunchtime brown bag to watch and discuss The Greening of Southie, a documentary on green building challenges.
SuStainable City Government: operationS Summary
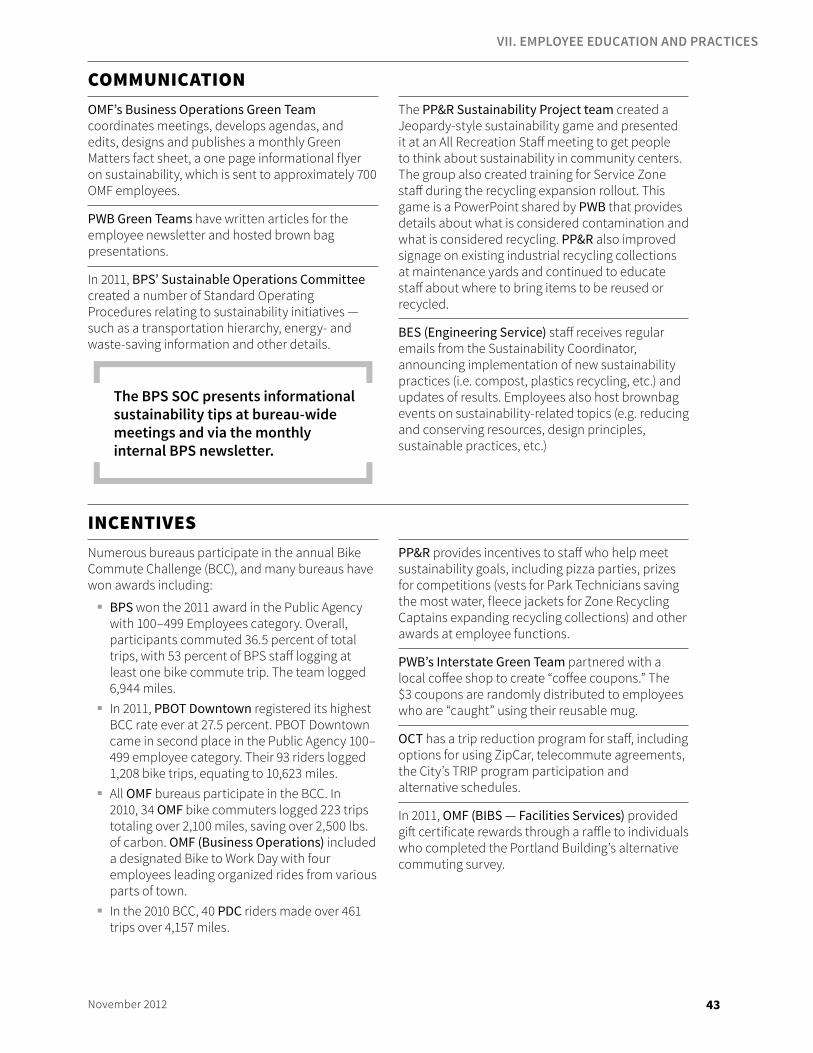
43November 2012
cOmmUnIcatIOnOMF’s Business Operations Green Team coordinates meetings, develops agendas, and edits, designs and publishes a monthly Green Matters fact sheet, a one page informational flyer on sustainability, which is sent to approximately 700 OMF employees.
PWB Green Teams have written articles for the employee newsletter and hosted brown bag presentations.
In 2011, BPS’ Sustainable Operations Committee created a number of Standard Operating Procedures relating to sustainability initiatives — such as a transportation hierarchy, energy- and waste-saving information and other details.
The BPS SOC presents informational sustainability tips at bureau-wide meetings and via the monthly internal BPS newsletter.
The PP&R Sustainability Project team created a Jeopardy-style sustainability game and presented it at an All Recreation Staff meeting to get people to think about sustainability in community centers. The group also created training for Service Zone staff during the recycling expansion rollout. This game is a PowerPoint shared by PWB that provides details about what is considered contamination and what is considered recycling. PP&R also improved signage on existing industrial recycling collections at maintenance yards and continued to educate staff about where to bring items to be reused or recycled.
BES (Engineering Service) staff receives regular emails from the Sustainability Coordinator, announcing implementation of new sustainability practices (i.e. compost, plastics recycling, etc.) and updates of results. Employees also host brownbag events on sustainability-related topics (e.g. reducing and conserving resources, design principles, sustainable practices, etc.)
IncEntIVESNumerous bureaus participate in the annual Bike Commute Challenge (BCC), and many bureaus have won awards including:
� BPS won the 2011 award in the Public Agency with 100–499 Employees category. Overall, participants commuted 36.5 percent of total trips, with 53 percent of BPS staff logging at least one bike commute trip. The team logged 6,944 miles.
� In 2011, PBOT Downtown registered its highest BCC rate ever at 27.5 percent. PBOT Downtown came in second place in the Public Agency 100–499 employee category. Their 93 riders logged 1,208 bike trips, equating to 10,623 miles.
� All OMF bureaus participate in the BCC. In 2010, 34 OMF bike commuters logged 223 trips totaling over 2,100 miles, saving over 2,500 lbs. of carbon. OMF (Business Operations) included a designated Bike to Work Day with four employees leading organized rides from various parts of town.
� In the 2010 BCC, 40 PDC riders made over 461 trips over 4,157 miles.
PP&R provides incentives to staff who help meet sustainability goals, including pizza parties, prizes for competitions (vests for Park Technicians saving the most water, fleece jackets for Zone Recycling Captains expanding recycling collections) and other awards at employee functions.
PWB’s Interstate Green Team partnered with a local coffee shop to create “coffee coupons.” The $3 coupons are randomly distributed to employees who are “caught” using their reusable mug.
OCT has a trip reduction program for staff, including options for using ZipCar, telecommute agreements, the City’s TRIP program participation and alternative schedules.
In 2011, OMF (BIBS — Facilities Services) provided gift certificate rewards through a raffle to individuals who completed the Portland Building’s alternative commuting survey.
VII. EMPLOYEE EDUCATIOn AnD PRACTICES
44 November 2012
nEW EmplOyEE ORIEntatIOn (OnBOaRDIng)Results from the Liaison Survey show that 53 percent of liaisons said their bureau or office incorporates sustainability in new employee education.
OMF (Human Resources, BIBS — Risk and Revenue Bureau) include information about recycling and composting processes in new employee orientations.
The Police Bureau will be starting a Green Team in FY12–13. Initial goals for the Police SCG liaison are to share the importance of various sustainability efforts as well as to get staff on board with recycling in all Police offices and other locations.
BES’ new Wastewater Group employees receive an orientation packet on CD, which saves hundreds of pages of paper per person. New employees also go through an orientation process with their immediate supervisor where they are educated on the bureau, division and work group mission and values and where sustainability practices are incorporated. Continuing sustainability education is incorporated into employees’ performance evaluations, personnel training (conferences, webinars), presentations at staff meetings and outside training opportunities.
SuStainable City Government: operationS Summary
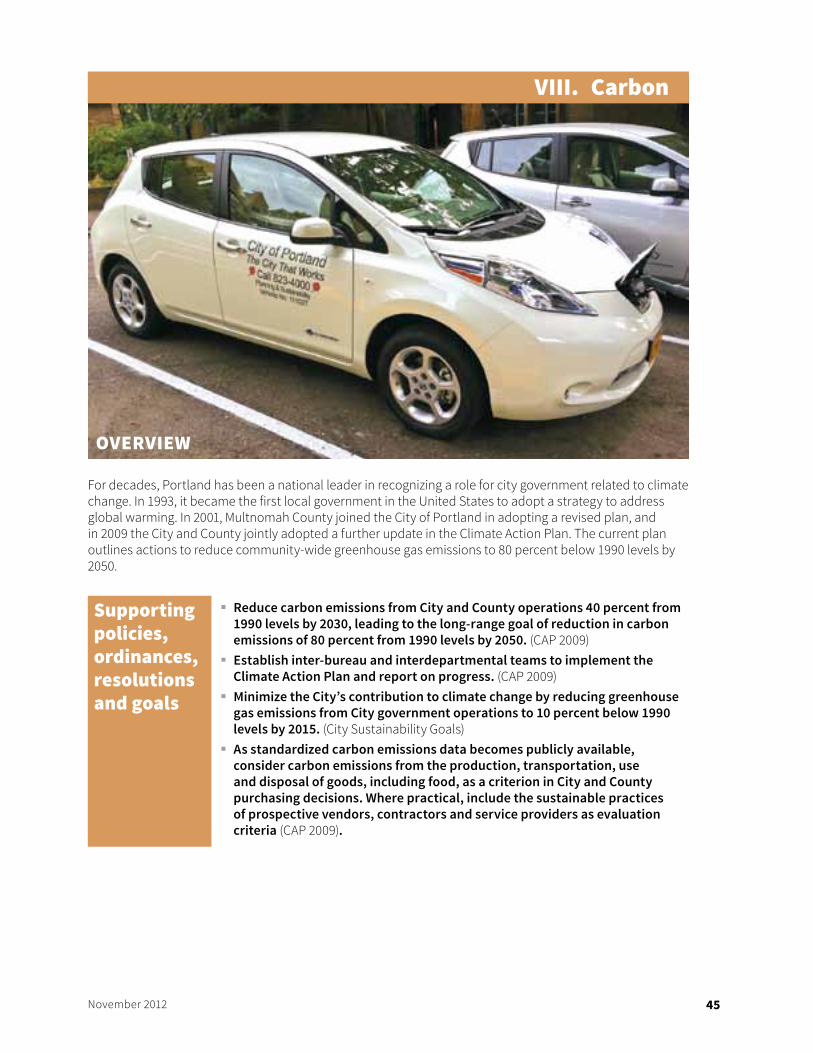
45November 2012
OVERVIEW
For decades, Portland has been a national leader in recognizing a role for city government related to climate change. In 1993, it became the first local government in the United States to adopt a strategy to address global warming. In 2001, Multnomah County joined the City of Portland in adopting a revised plan, and in 2009 the City and County jointly adopted a further update in the Climate Action Plan. The current plan outlines actions to reduce community-wide greenhouse gas emissions to 80 percent below 1990 levels by 2050.
Supporting policies, ordinances, resolutions and goals
� Reduce carbon emissions from City and County operations 40 percent from 1990 levels by 2030, leading to the long-range goal of reduction in carbon emissions of 80 percent from 1990 levels by 2050. (CAP 2009)
� Establish inter-bureau and interdepartmental teams to implement the Climate Action Plan and report on progress. (CAP 2009)
� Minimize the City’s contribution to climate change by reducing greenhouse gas emissions from City government operations to 10 percent below 1990 levels by 2015. (City Sustainability Goals)
� As standardized carbon emissions data becomes publicly available, consider carbon emissions from the production, transportation, use and disposal of goods, including food, as a criterion in City and County purchasing decisions. Where practical, include the sustainable practices of prospective vendors, contractors and service providers as evaluation criteria (CAP 2009).
VIII. carbon
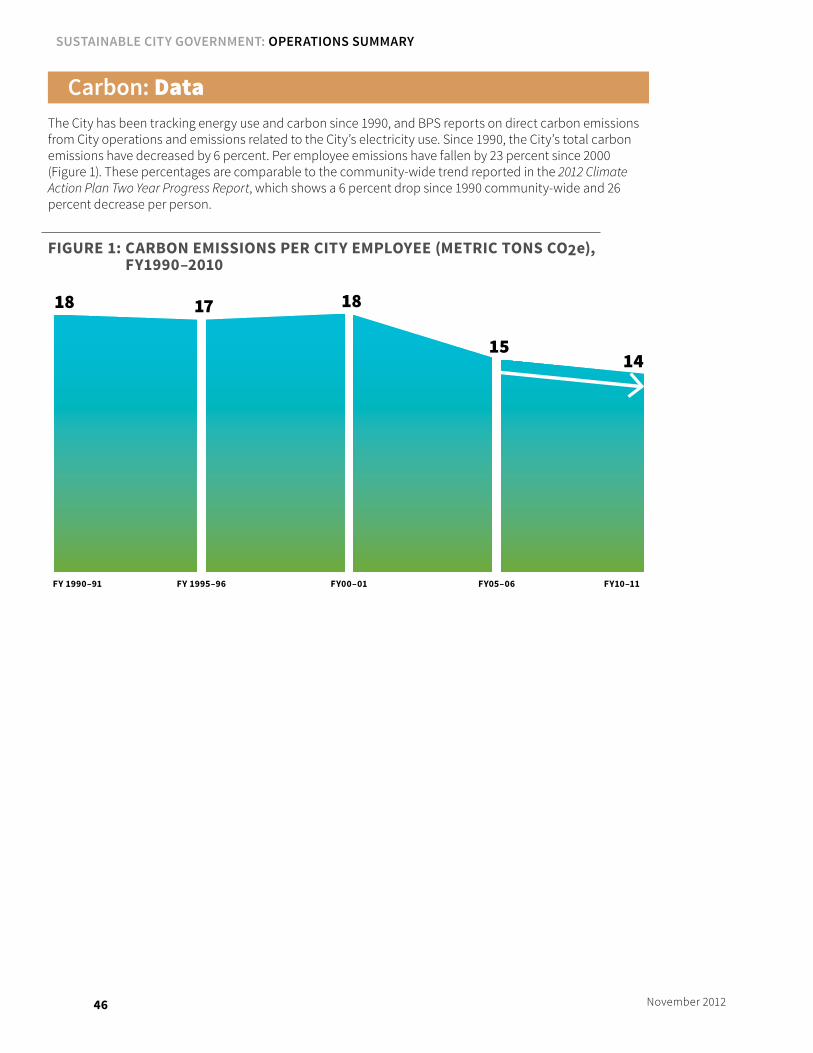
46 November 2012
Carbon: DataThe City has been tracking energy use and carbon since 1990, and BPS reports on direct carbon emissions from City operations and emissions related to the City’s electricity use. Since 1990, the City’s total carbon emissions have decreased by 6 percent. Per employee emissions have fallen by 23 percent since 2000 (Figure 1). These percentages are comparable to the community-wide trend reported in the 2012 Climate Action Plan Two Year Progress Report, which shows a 6 percent drop since 1990 community-wide and 26 percent decrease per person.
fiGure 1: Carbon emiSSionS per City employee (metriC tonS Co2e), fy1990–2010
FY 1990–91 FY 1995–96 FY00–01 FY05–06 FY10–11
18 17 18
1514
SuStainable City Government: operationS Summary
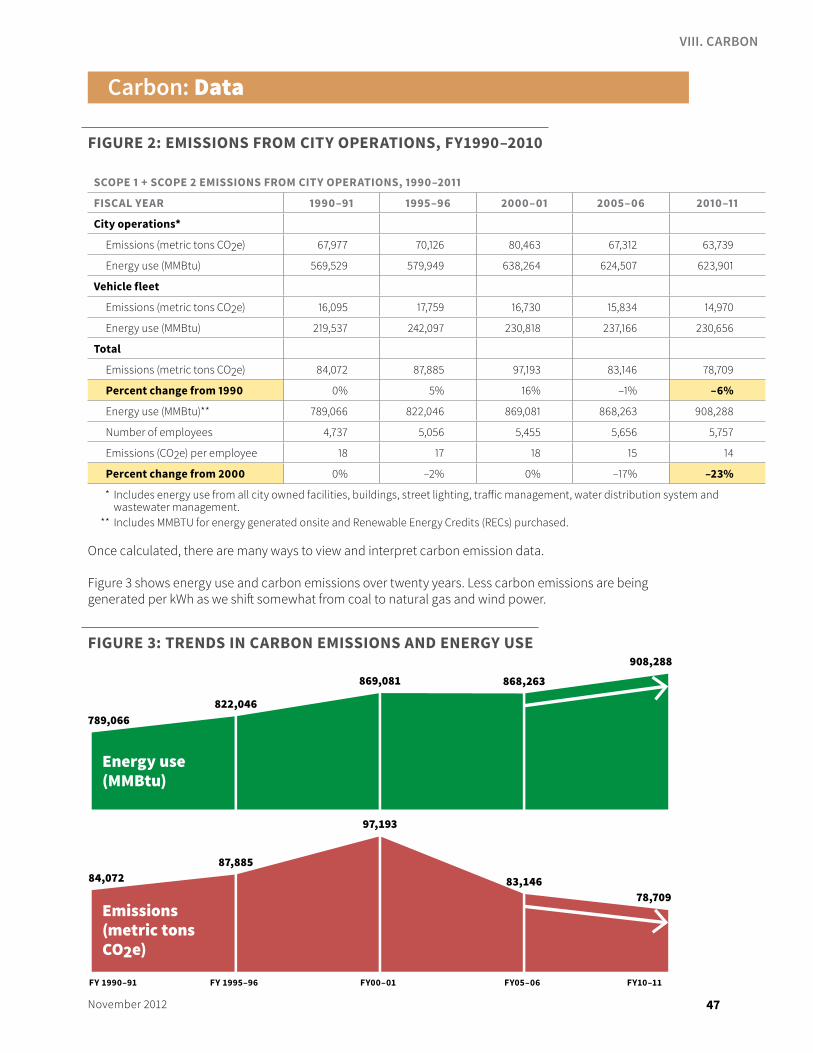
47November 2012
Carbon: Data
fiGure 2: emiSSionS from City operationS, fy1990–2010
SCope 1 + SCope 2 emiSSionS from City operationS, 1990–2011
fiSCal year 1990–91 1995–96 2000–01 2005–06 2010–11
City operations*
Emissions (metric tons CO2e) 67,977 70,126 80,463 67,312 63,739
Energy use (MMBtu) 569,529 579,949 638,264 624,507 623,901
vehicle fleet
Emissions (metric tons CO2e) 16,095 17,759 16,730 15,834 14,970
Energy use (MMBtu) 219,537 242,097 230,818 237,166 230,656
total
Emissions (metric tons CO2e) 84,072 87,885 97,193 83,146 78,709
percent change from 1990 0% 5% 16% –1% –6%
Energy use (MMBtu)** 789,066 822,046 869,081 868,263 908,288
Number of employees 4,737 5,056 5,455 5,656 5,757
Emissions (CO2e) per employee 18 17 18 15 14
percent change from 2000 0% –2% 0% –17% –23%
* Includes energy use from all city owned facilities, buildings, street lighting, traffic management, water distribution system and wastewater management.
** Includes MMBTU for energy generated onsite and Renewable Energy Credits (RECs) purchased.
Once calculated, there are many ways to view and interpret carbon emission data.
Figure 3 shows energy use and carbon emissions over twenty years. Less carbon emissions are being generated per kWh as we shift somewhat from coal to natural gas and wind power.
fiGure 3: trendS in Carbon emiSSionS and enerGy uSe
789,066822,046
869,081 868,263
908,288
84,07287,885
97,193
83,14678,709
FY 1990–91 FY 1995–96 FY00–01 FY05–06 FY10–11
Energy use (MMBtu)
Emissions (metric tons CO2e)
VIII. CARBOn
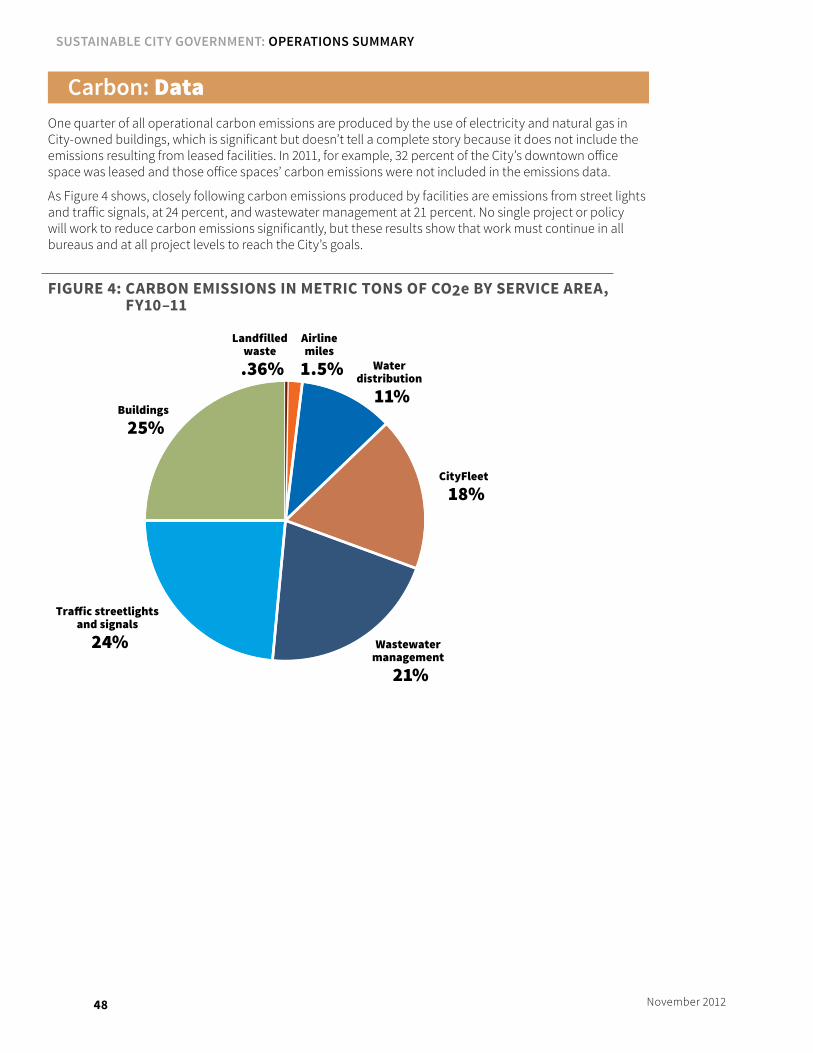
48 November 2012
Carbon: DataOne quarter of all operational carbon emissions are produced by the use of electricity and natural gas in City-owned buildings, which is significant but doesn’t tell a complete story because it does not include the emissions resulting from leased facilities. In 2011, for example, 32 percent of the City’s downtown office space was leased and those office spaces’ carbon emissions were not included in the emissions data.
As Figure 4 shows, closely following carbon emissions produced by facilities are emissions from street lights and traffic signals, at 24 percent, and wastewater management at 21 percent. No single project or policy will work to reduce carbon emissions significantly, but these results show that work must continue in all bureaus and at all project levels to reach the City’s goals.
fiGure 4: Carbon emiSSionS in metriC tonS of Co2e by ServiCe area, fy10–11
Landfilledwaste.36%
Tra�ic streetlightsand signals
24%
Waterdistribution
11%
Wastewatermanagement
21%
CityFleet18%
Airlinemiles
1.5%
Buildings25%
SuStainable City Government: operationS Summary
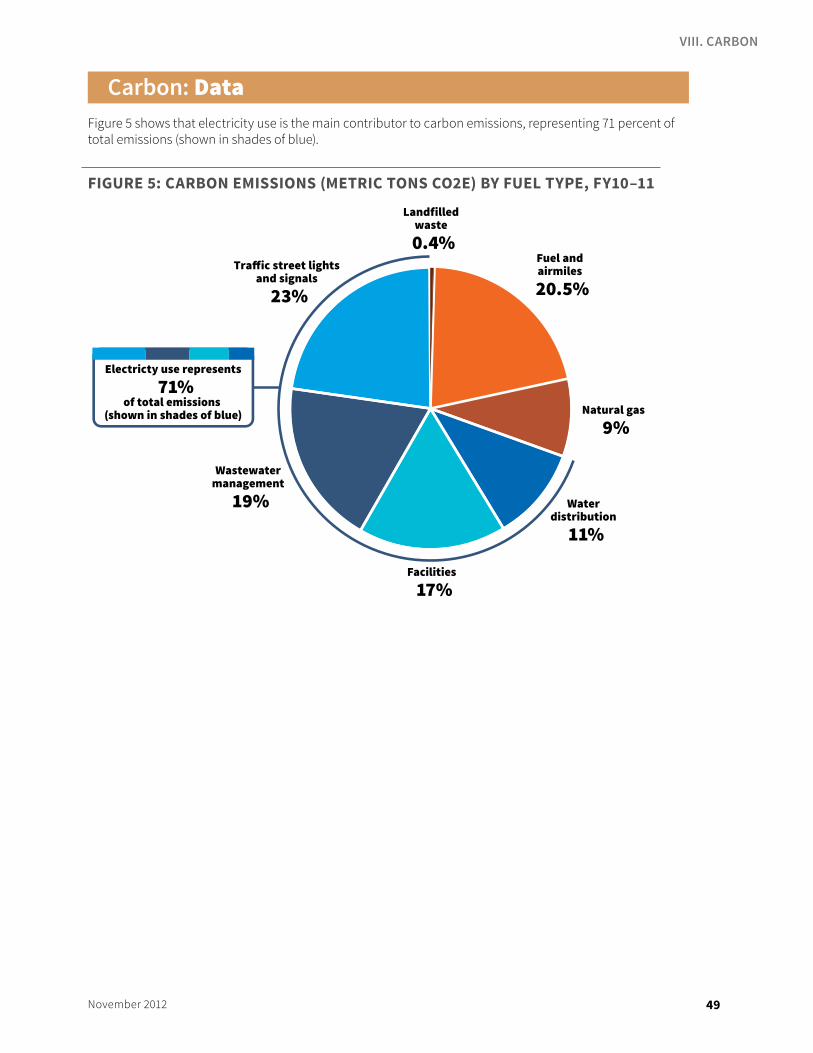
49November 2012
Carbon: DataFigure 5 shows that electricity use is the main contributor to carbon emissions, representing 71 percent of total emissions (shown in shades of blue).
fiGure 5: Carbon emiSSionS (metriC tonS Co2e) by fuel type, fy10–11
Waterdistribution
11%
Facilities17%
Wastewatermanagement
19%
Fuel andairmiles20.5%
Natural gas9%
Landfilledwaste0.4%
Tra�ic street lightsand signals
23%
Electricty use represents71%
of total emissions (shown in shades of blue)
VIII. CARBOn
50 November 2012
Carbon: Bureau Highlights
PBOT’s Maintenance Operations Cured-in-Place Pipe (CIPP) repair technology, used to fix broken or leaking underground pipes, includes slipping a polyurethane-impregnated felt liner into a length of broken pipe. Once cured, the liner becomes a permanent part of the pipe. This technology eliminates the need to excavate pipe and reduces the amount of disturbed dirt generated from cutting pavement and digging trenches. During FY09–10 and FY10–11, PBOT used this technology in 672 sewer repair jobs to line over 24,000 linear feet of piping, the equivalent of over 4.5 miles. By using CIPP, the bureau estimates saving $3 million over traditional sewer repair methods. This method eliminates the need to haul materials removed during the trenching process, which results in a 90 percent reduction in the amount of greenhouse gases emitted (compared to standard practices).
PBOT (Maintenance Operations) received the 2010 Julian Award for Sustainability from the Oregon Chapter of the American Public Works Association for its use of a cured-in-place sewer pipe (CIPP) repair technology to fix broken or leaking underground pipes. By using CIPP, the bureau estimates saving $3 million over traditional sewer repair methods.
In 2011, PBOT (Transportation Maintenance) recycled over 16,000 tons of rock, concrete and asphalt at their Sunderland Yard Facility. The material comes from sewer and road maintenance projects and is then crushed and reused in road building and sewer repair projects. Over 6,000 tons of concrete and 8,000 tons of asphalt were crushed, avoiding the equivalent of 1,300 metric tons of carbon during FY10–11. In addition, 1,557 tons of dirt was recovered for reuse. In 2011, the recycled material generated over 16,000 tons of 3/4" rock. Sunderland Yard also composted 7,526 tons of leaves from street cleaning in 2011.
SuStainable City Government: operationS Summary
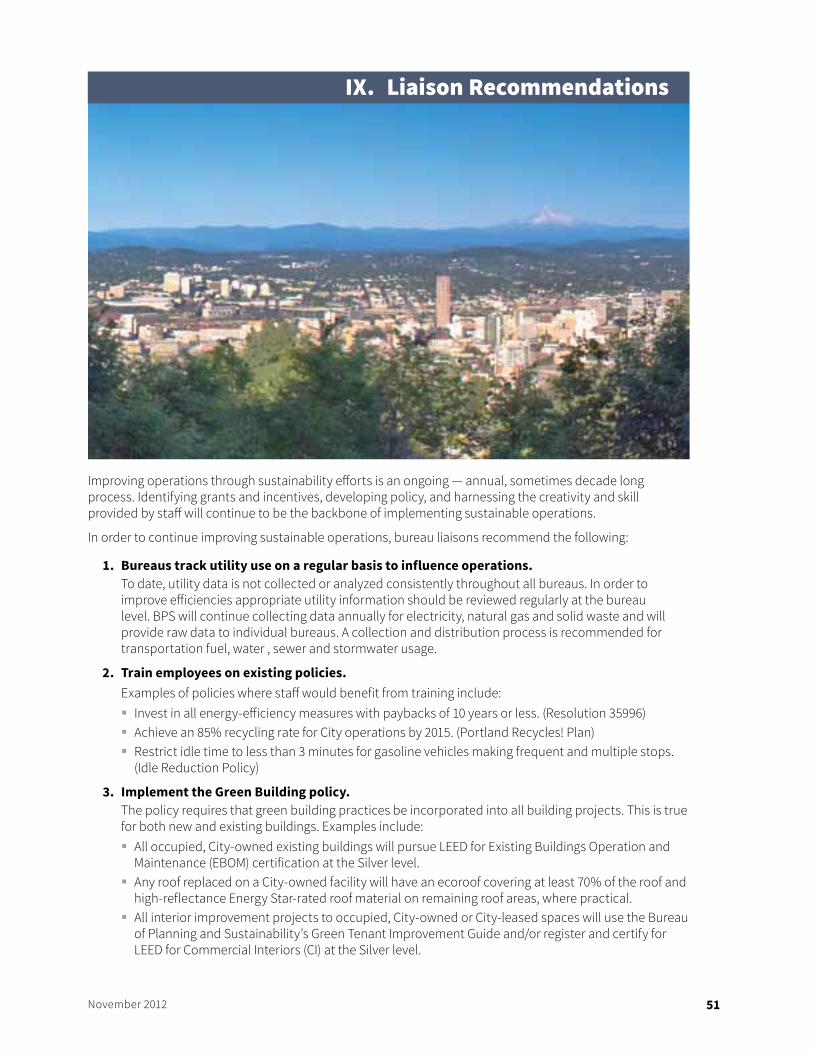
51November 2012
Improving operations through sustainability efforts is an ongoing — annual, sometimes decade long process. Identifying grants and incentives, developing policy, and harnessing the creativity and skill provided by staff will continue to be the backbone of implementing sustainable operations.
In order to continue improving sustainable operations, bureau liaisons recommend the following:
1. bureaus track utility use on a regular basis to influence operations.To date, utility data is not collected or analyzed consistently throughout all bureaus. In order to improve efficiencies appropriate utility information should be reviewed regularly at the bureau level. BPS will continue collecting data annually for electricity, natural gas and solid waste and will provide raw data to individual bureaus. A collection and distribution process is recommended for transportation fuel, water , sewer and stormwater usage.
2. train employees on existing policies.Examples of policies where staff would benefit from training include:
� Invest in all energy-efficiency measures with paybacks of 10 years or less. (Resolution 35996) � Achieve an 85% recycling rate for City operations by 2015. (Portland Recycles! Plan) � Restrict idle time to less than 3 minutes for gasoline vehicles making frequent and multiple stops.
(Idle Reduction Policy)
3. implement the Green building policy.The policy requires that green building practices be incorporated into all building projects. This is true for both new and existing buildings. Examples include:
� All occupied, City-owned existing buildings will pursue LEED for Existing Buildings Operation and Maintenance (EBOM) certification at the Silver level.
� Any roof replaced on a City-owned facility will have an ecoroof covering at least 70% of the roof and high-reflectance Energy Star-rated roof material on remaining roof areas, where practical.
� All interior improvement projects to occupied, City-owned or City-leased spaces will use the Bureau of Planning and Sustainability’s Green Tenant Improvement Guide and/or register and certify for LEED for Commercial Interiors (CI) at the Silver level.
IX. liaison Recommendations

52 November 2012
4. Support bureau green teams, liaisons and technical staff.While three fourths of City bureaus self-identify as having a green team, these groups are not well supported and have limited decision making authority. In addition, due to the long-term nature of many projects, the staying power to complete projects is sometimes lacking. By supporting existing staff and partnerships sustainability goals can be reached.
The process of developing this summary has provided a common language for staff to use when discussing future projects. The process also helped to identify gaps. The SCG Partnership will work together to address gaps and bring additional reports to City leadership on a regular basis.
SuStainable City Government: operationS Summary
a-1November 2012
I. X. appendix a — about the Sustainable city government partnership
The City of Portland’s Sustainable City Government (SCG) partnership was formalized by Resolution No. 36468 in 2006 “to set goals, objectives and performance measurements for sustainable practices to be considered by all bureaus and City Council in decision making.”
Also included in the original resolution was the requirement that all bureaus “adopt, implement and update a bureau specific sustainability plan and progress report, and contribute to an annual City-wide sustainability report on progress.”
In November 2010, Bureau of Planning and Sustainability (BPS) staff convened SCG liaisons to share highlights of their work on improving the sustainability of City operations. A number of liaisons raised concern about the requirement to submit individual bureau sustainability plans; many bureaus had either stopped this work completely or saw more value in creating a different process to share accomplishments and goals.
In order to communicate results efficiently, the liaisons recommended creating this 2009–2011 Sustainable Operations Summary to highlight the City’s collective current efforts. A goal is to complete a summary biennially with input from all bureaus.
In addition to a biennial summary, SCG liaisons meet quarterly. Each meeting provides an opportunity for liaisons to share ideas from their bureaus, discuss and think about solutions to particular challenges and share resources for topic-specific training either by liaisons or by outside experts.

a-2 November 2012
SuStainable City Government: operationS Summary
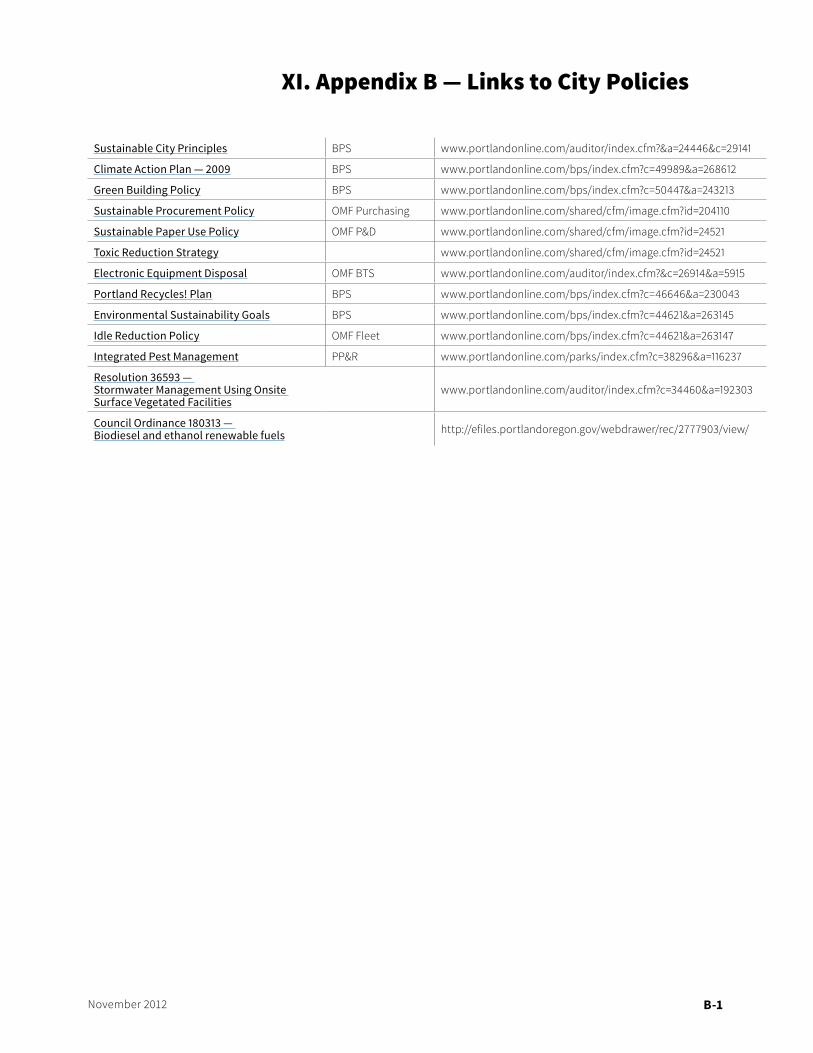
b-1November 2012
II. XI. appendix B — links to city policies
Sustainable City Principles BPS www.portlandonline.com/auditor/index.cfm?&a=24446&c=29141
Climate Action Plan — 2009 BPS www.portlandonline.com/bps/index.cfm?c=49989&a=268612
Green Building Policy BPS www.portlandonline.com/bps/index.cfm?c=50447&a=243213
Sustainable Procurement Policy OMF Purchasing www.portlandonline.com/shared/cfm/image.cfm?id=204110
Sustainable Paper Use Policy OMF P&D www.portlandonline.com/shared/cfm/image.cfm?id=24521
Toxic Reduction Strategy www.portlandonline.com/shared/cfm/image.cfm?id=24521
Electronic Equipment Disposal OMF BTS www.portlandonline.com/auditor/index.cfm?&c=26914&a=5915
Portland Recycles! Plan BPS www.portlandonline.com/bps/index.cfm?c=46646&a=230043
Environmental Sustainability Goals BPS www.portlandonline.com/bps/index.cfm?c=44621&a=263145
Idle Reduction Policy OMF Fleet www.portlandonline.com/bps/index.cfm?c=44621&a=263147
Integrated Pest Management PP&R www.portlandonline.com/parks/index.cfm?c=38296&a=116237
Resolution 36593 — Stormwater Management Using Onsite Surface Vegetated Facilities
www.portlandonline.com/auditor/index.cfm?c=34460&a=192303
Council Ordinance 180313 — Biodiesel and ethanol renewable fuels http://efiles.portlandoregon.gov/webdrawer/rec/2777903/view/

b-2 November 2012
SuStainable City Government: operationS Summary
C-1November 2012
III. XII. appendix c — methodology, Definitions and Descriptions
mEtHODOlOgy
enerGyoverviewPortland’s electricity generation mix is calculated using the Oregon Department of Energy’s webpage “Where does Oregon’s electricity come from?” http://www.oregon.gov/energy/pages/oregons_electric_power_mix.aspx. Portland is served by two electric utilities, so our calculations weighted the generation sources by the percentage of electricity contributed by each utility, using 72 percent for Portland General Electric and 28 percent for Pacific Power.
figure 1: total electricity use by City facilitiesRenewable energy only shows as electricity used and not as a cost. Adding in the market rate for energy costs, this renewable energy use would add an additional $1 million to City operations total energy spend. This estimate is based on what the City would have paid for renewable energy (excluding the 8m kWh for the RPS).
From FY07–08 to FY10–11, Portland’s population increased from 562,690 to 583,776 (+3.7 percent) while the number of authorized full-time positions within City government decreased from 5,970 to 5,757 (–3.6 percent).
The decision to use FY06–07 data as an estimate was based on NOAA data that tracks Heating Degree Days (HDD). FY06–07, FY08–09, and FY09–10 were similarly “warm” years in terms of HDD values where more natural gas would be used while FY07–08 and FY10–11 were “cool” years, in terms of HDD values where less natural gas would be used.
City energy use reportingBPS has generated an annual energy use report since 1989, documenting electricity, natural gas and transportation fuel use for each City account and bureau. The process is quite labor some as collectively City bureaus have roughly 1,200 electricity, 140 natural gas and dozens of transportation fuel accounts. To generate the report, BPS contacts Portland General Electric, Pacific Power, Northwest Natural Gas and the City’s Fleet Services to gather the raw data. Then City staff sorts through the data identifying dropped/closed accounts and new accounts and sorts the data by bureau. Monthly data is condensed to annual and results are analyzed.
materialS and waSterecovery rateThe material recovery rates for both the City-wide and individual bureau analysis use the same sets of data. The difference between the analyses is how that data is sorted:
1. City-wide Material Recovery Rates: Trashco data plus additional recycling data sorted by location type (building/public place).
2. Bureau Material Recovery Rates: Trashco data plus additional recycling data sorted by individual bureaus.
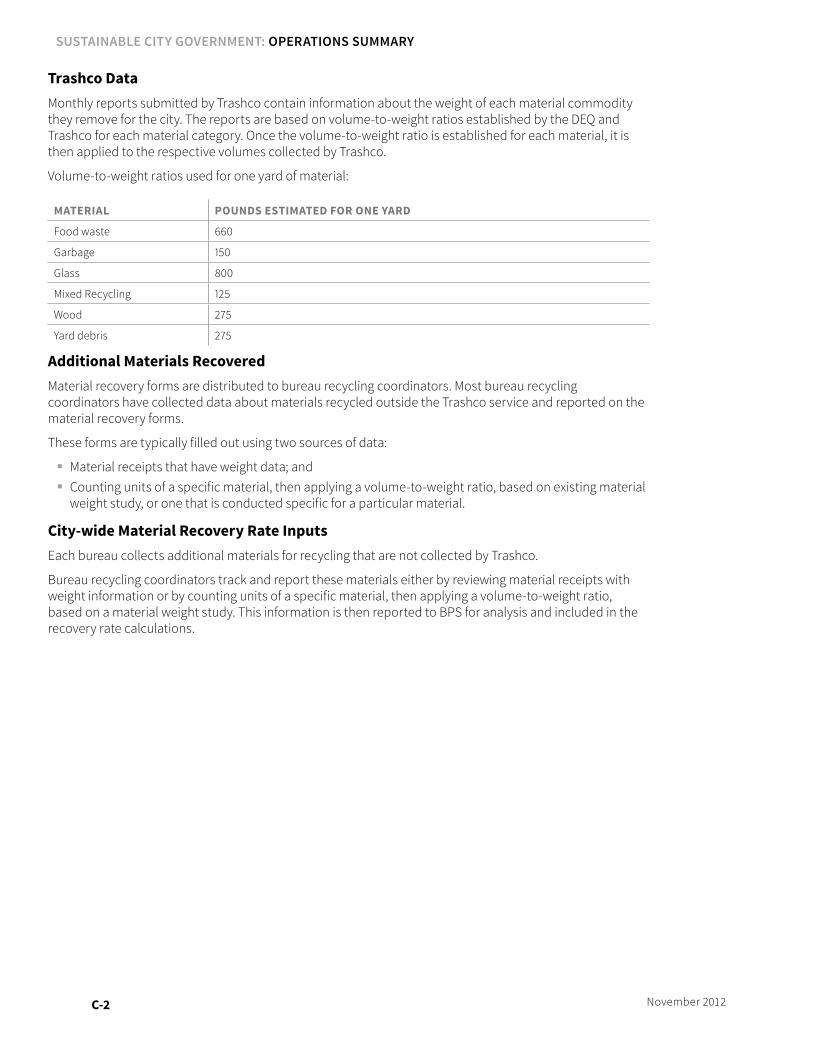
C-2 November 2012
trashco dataMonthly reports submitted by Trashco contain information about the weight of each material commodity they remove for the city. The reports are based on volume-to-weight ratios established by the DEQ and Trashco for each material category. Once the volume-to-weight ratio is established for each material, it is then applied to the respective volumes collected by Trashco.
Volume-to-weight ratios used for one yard of material:
material poundS eStimated for one yard
Food waste 660
Garbage 150
Glass 800
Mixed Recycling 125
Wood 275
Yard debris 275
additional materials recoveredMaterial recovery forms are distributed to bureau recycling coordinators. Most bureau recycling coordinators have collected data about materials recycled outside the Trashco service and reported on the material recovery forms.
These forms are typically filled out using two sources of data:
� Material receipts that have weight data; and � Counting units of a specific material, then applying a volume-to-weight ratio, based on existing material
weight study, or one that is conducted specific for a particular material.
City-wide material recovery rate inputsEach bureau collects additional materials for recycling that are not collected by Trashco.
Bureau recycling coordinators track and report these materials either by reviewing material receipts with weight information or by counting units of a specific material, then applying a volume-to-weight ratio, based on a material weight study. This information is then reported to BPS for analysis and included in the recovery rate calculations.
SuStainable City Government: operationS Summary
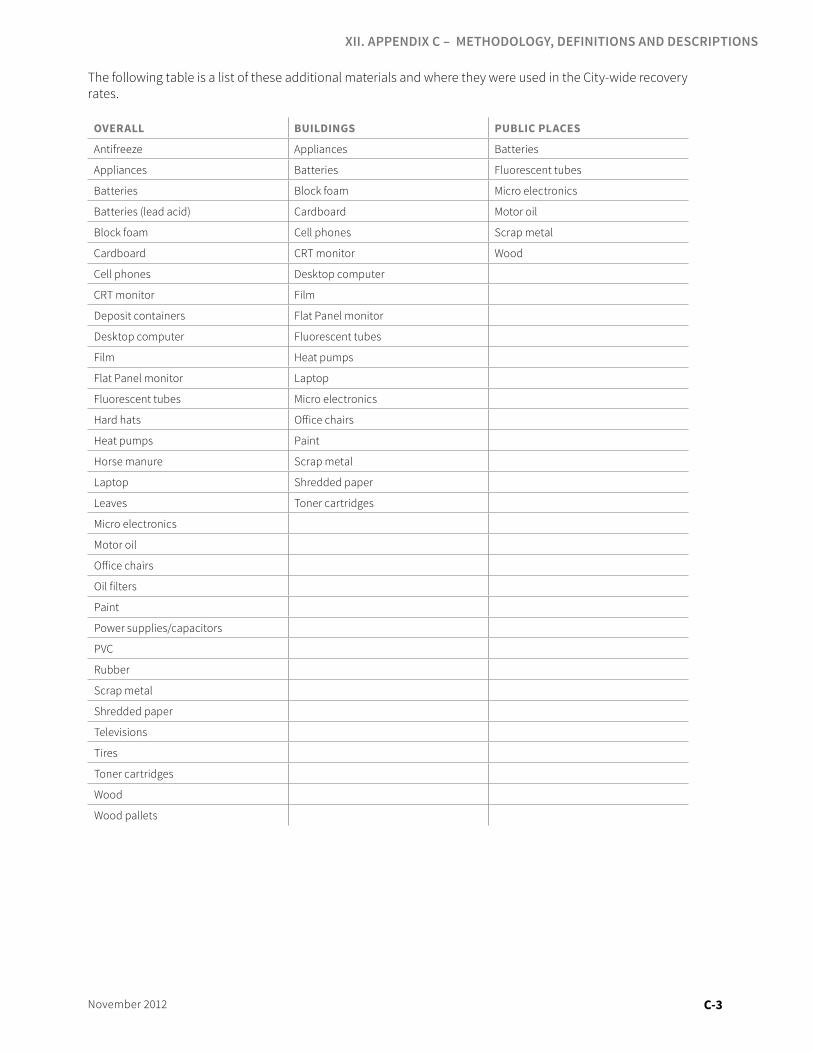
C-3November 2012
The following table is a list of these additional materials and where they were used in the City-wide recovery rates.
overall buildinGS publiC plaCeS
Antifreeze Appliances Batteries
Appliances Batteries Fluorescent tubes
Batteries Block foam Micro electronics
Batteries (lead acid) Cardboard Motor oil
Block foam Cell phones Scrap metal
Cardboard CRT monitor Wood
Cell phones Desktop computer
CRT monitor Film
Deposit containers Flat Panel monitor
Desktop computer Fluorescent tubes
Film Heat pumps
Flat Panel monitor Laptop
Fluorescent tubes Micro electronics
Hard hats Office chairs
Heat pumps Paint
Horse manure Scrap metal
Laptop Shredded paper
Leaves Toner cartridges
Micro electronics
Motor oil
Office chairs
Oil filters
Paint
Power supplies/capacitors
PVC
Rubber
Scrap metal
Shredded paper
Televisions
Tires
Toner cartridges
Wood
Wood pallets
XII. APPEnDIX C – METHODOLOGY, DEFInITIOnS AnD DESCRIPTIOnS
C-4 November 2012
water Quality and ConServationFigure 1 shows total water use and cost in nominal dollars from City Facilities. Data includes both use in cubic feet and cost displayed for water, sewer, and storm charges.
Data was provided by the Revenue Bureau and includes costs paid for water use, sewer and storm charges. Generally, the Bureau of Environmental Services does not pay for storm or sewer and the Water Bureau does not pay for water, thus those costs are not reflected in the graph.
tranSportationCityFleet manages over 2,950 vehicles and pieces of equipment, operates eight fueling stations and seven maintenance facilities, and provides new vehicle outfitting, repair, maintenance, auto body work, welding, machining, project design, and metal fabrication. CityFleet is also responsible for maintaining emergency generators, renting construction equipment and disposing of vehicles at the end of the economic lifecycles.
Information shared about fuel consumption and the make up of vehicles for this report is from CityFleet only.
Estimates on what would have been used and spent without efficiencies were based on the following information provided by CityFleet:
� The average price of fuel over the five years would be $2.58 per gallon. � We have saved about 150,048 gallons of fuel by increasing our efficiency over the past five years. If we
stayed steady with what we had five years ago our total usage would be somewhere around 1,935,120 gallons of fuel.
� The estimated dollar savings was calculated by multiplying the average price per gallon by the number of gallons saved.
Carbonfigure 2: Scope 1 and 2 emissions from City operationsIn general, the methodology follows guidelines developed by ICLEI — Local Governments for Sustainability and uses the Clean Air and Climate Protection software developed jointly by ICLEI and STAPPA/ALAPCO by Torrie Smith Associates Inc. The inventory of emission trends presented here includes Scope 1 and Scope 2 emissions from all of the City’s electricity and natural gas accounts, vehicle fleet fuel usage (gasoline, diesel, biodiesel and ethanol). Electricity emissions include the benefits of voluntary green power purchases made by the City. Significant categories of emissions not included in the inventory are emissions from air travel, landfilled solid waste, wastewater treatment other than energy use, sequestration by the urban forest and other biological processes, emissions arising from the production of goods consumed by the City in the course of City business, and commute trips taken by City employees. The inventory also does not include any fugitive process or refrigerant emissions.
figure: trends in Carbon emissions and energy useIn general, the methodology follows guidelines developed by ICLEI — Local Governments for Sustainability and uses the Clean Air and Climate Protection software developed jointly by ICLEI and STAPPA/ALAPCO by Torrie Smith Associates Inc. The inventory for FY10–11 presented here includes Scope 1, Scope 2, and Scope 3 emissions from all of the City’s electricity and natural gas accounts, vehicle fleet fuel usage (gasoline, diesel, biodiesel and ethanol), emissions calculated from miles of air travel and emissions from landfilled solid waste. Electricity emissions include the benefits of voluntary green power purchases made by the City. Emissions from Air Travel have been calculated using 0.0005558MT CO2e/Mile using the methodology developed by Good Company in June 2008 for PP&R, Carbon Calculator, Version 1. [Significant categories of emissions not included in the inventory are wastewater treatment other than energy use, sequestration by the urban forest and other biological processes, emissions arising from the production of goods consumed by the City in the course of City business, and commute trips taken by City employees. The inventory also does not include any fugitive process or refrigerant emissions.]
SuStainable City Government: operationS Summary
C-5November 2012
DEFInItIOnSbiogas: A combustible gas derived from decomposing biological waste. Biogas normally consists of 50 to 60 percent methane.Source: Oregon.gov glossary of Energy terms.
Carbon emissions: All greenhouse gas emissions. Key emissions include Carbon dioxide (CO2), Methane (CH4), Nitrous oxide (N2O), Hydrofluorocarbons (HFCs), Perfluorocarbons (PFCs) and Sulfur hexafluoride (SF6).
ecoroof: An ecoroof, also known as an extensive green roof, is a living, breathing, sustainable alternative to conventional roofing. These lightweight vegetated roof systems are part of a growing worldwide effort to promote sustainable development and reduce negative impacts on water, air and the earth.Source: http://www.portlandonline.com/bes/index.cfm?a=312082&c=50816
leed: LEED certification provides independent, third-party verification that a building, home or community was designed and built using strategies aimed at achieving high performance in key areas of human and environmental health: sustainable site development, water savings, energy efficiency, materials selection and indoor environmental quality.Source: http://www.usgbc.org/DisplayPage.aspx?CMSPageID=1988
micro-hydro: Micro-hydro systems are small (100 kW or smaller) water powered sources that are used for individual users or small groups of users such as small communities or developments.Source: http://www.pnwwaterweb.com/initiatives/pnw_146.htm
micro-wind: Small wind turbines often mounted on a roof top.
mmbtu: One million British thermal units.Source: Oregon.gov glossary of Energy terms.
natural gas: A mixture of gaseous hydrocarbons, primarily methane, occurring naturally in the earth. Used as fuel.Source: Oregon.gov glossary of Energy terms.
renewable portfolio Standard (rpS): The Renewable Portfolio Standard requires Oregon utilities to meet a percentage of their retail electricity needs with qualified renewable resources. For Oregon’s three largest utilities (Portland General Electric (PGE), PacifiCorp and the Eugene Water and Electric Board), the standard starts at 5% in 2011, increases to 15% in 2015, 20% in 2020, and 25% in 2025. Other electric utilities in the state, depending on size, have standards of 5% or 10% in 2025.Source: http://www.oregon.gov/ENERGY/RENEW/RPS_home.shtml
renewable energy Certificates (reC): A REC (pronounced: rěk) represents the property rights to the environmental, social, and other nonpower qualities of renewable electricity generation. A REC, and its associated attributes and benefits, can be sold separately from the underlying physical electricity associated with a renewable-based generation source.Source: http://www.epa.gov/greenpower/gpmarket/rec.htm
Scope 1 and 2 Carbon emissions: The GHG emissions generated directly and indirectly by an entity can be classified into “scopes,” based on the source of the emissions:
� Scope 1 emissions are direct GHG emissions from sources that are owned or controlled by the entity. Scope 1 can include emissions from fossil fuels burned on site, emissions from entity-owned or entity-leased vehicles, and other direct sources.
� Scope 2 emissions are indirect GHG emissions resulting from the generation of electricity, heating and cooling, or steam generated off site but purchased by the entity, and the transmission and distribution (T&D) losses associated with some purchased utilities (e.g., chilled water, steam, and high temperature hot water).
XII. APPEnDIX C – METHODOLOGY, DEFInITIOnS AnD DESCRIPTIOnS

C-6 November 2012
SuStainable City Government: operationS Summary
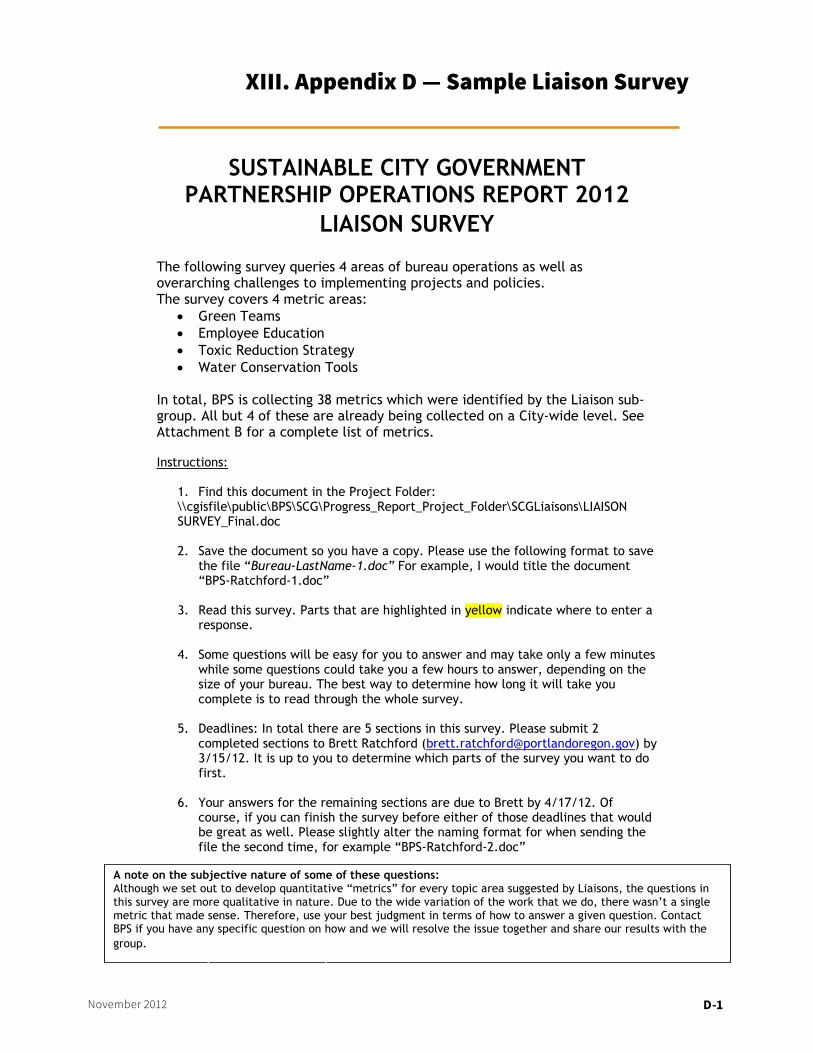
1
SUSTAINABLE CITY GOVERNMENT PARTNERSHIP OPERATIONS REPORT 2012
LIAISON SURVEY The following survey queries 4 areas of bureau operations as well as overarching challenges to implementing projects and policies. The survey covers 4 metric areas:
• Green Teams • Employee Education • Toxic Reduction Strategy • Water Conservation Tools
In total, BPS is collecting 38 metrics which were identified by the Liaison sub-group. All but 4 of these are already being collected on a City-wide level. See Attachment B for a complete list of metrics. Instructions:
1. Find this document in the Project Folder: \\cgisfile\public\BPS\SCG\Progress_Report_Project_Folder\SCGLiaisons\LIAISON SURVEY_Final.doc 2. Save the document so you have a copy. Please use the following format to save
the file “Bureau-LastName-1.doc” For example, I would title the document “BPS-Ratchford-1.doc”
3. Read this survey. Parts that are highlighted in yellow indicate where to enter a
response.
4. Some questions will be easy for you to answer and may take only a few minutes while some questions could take you a few hours to answer, depending on the size of your bureau. The best way to determine how long it will take you complete is to read through the whole survey.
5. Deadlines: In total there are 5 sections in this survey. Please submit 2
completed sections to Brett Ratchford ([email protected]) by 3/15/12. It is up to you to determine which parts of the survey you want to do first.
6. Your answers for the remaining sections are due to Brett by 4/17/12. Of
course, if you can finish the survey before either of those deadlines that would be great as well. Please slightly alter the naming format for when sending the file the second time, for example “BPS-Ratchford-2.doc”
A note on the subjective nature of some of these questions: Although we set out to develop quantitative “metrics” for every topic area suggested by Liaisons, the questions in this survey are more qualitative in nature. Due to the wide variation of the work that we do, there wasn’t a single metric that made sense. Therefore, use your best judgment in terms of how to answer a given question. Contact BPS if you have any specific question on how and we will resolve the issue together and share our results with the group. PUBLIC REVIEW DRAFT – July 2011
www.portlandonline.com/bps
d-1November 2012
IV. XIII. appendix D — Sample liaison Survey
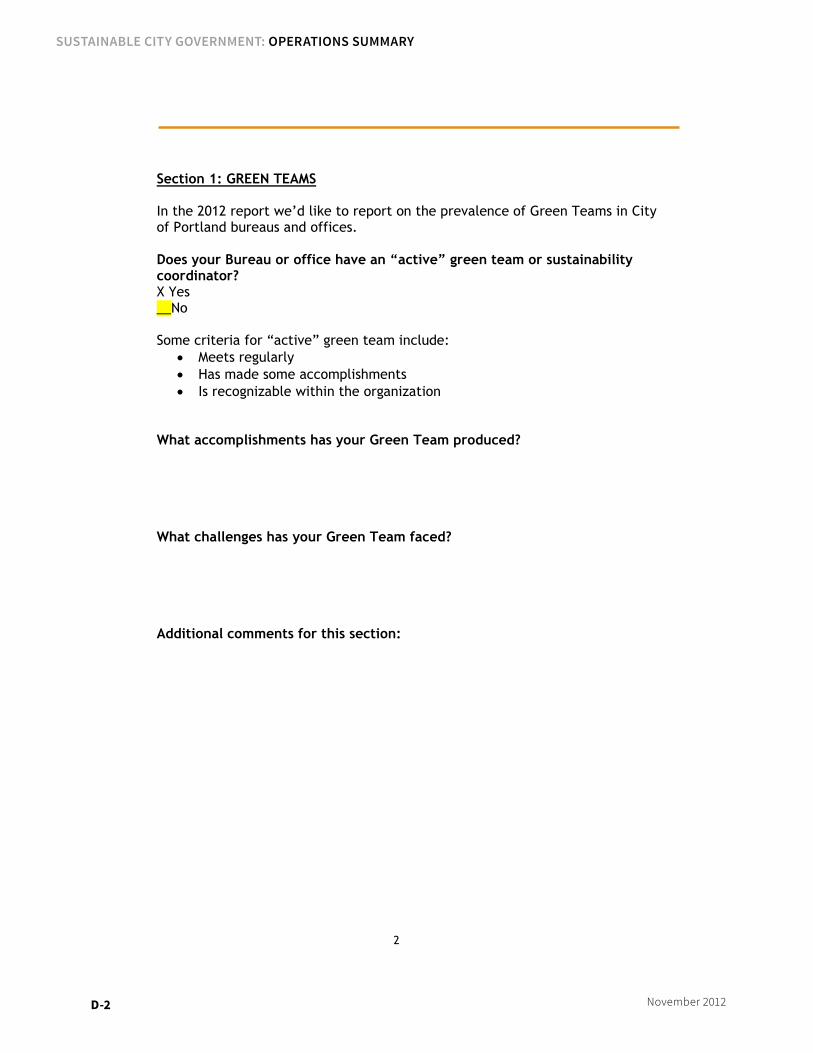
2
Section 1: GREEN TEAMS In the 2012 report we’d like to report on the prevalence of Green Teams in City of Portland bureaus and offices. Does your Bureau or office have an “active” green team or sustainability coordinator? X Yes __No Some criteria for “active” green team include:
• Meets regularly • Has made some accomplishments • Is recognizable within the organization
What accomplishments has your Green Team produced? What challenges has your Green Team faced? Additional comments for this section:
d-2 November 2012
SuStainable City Government: operationS Summary
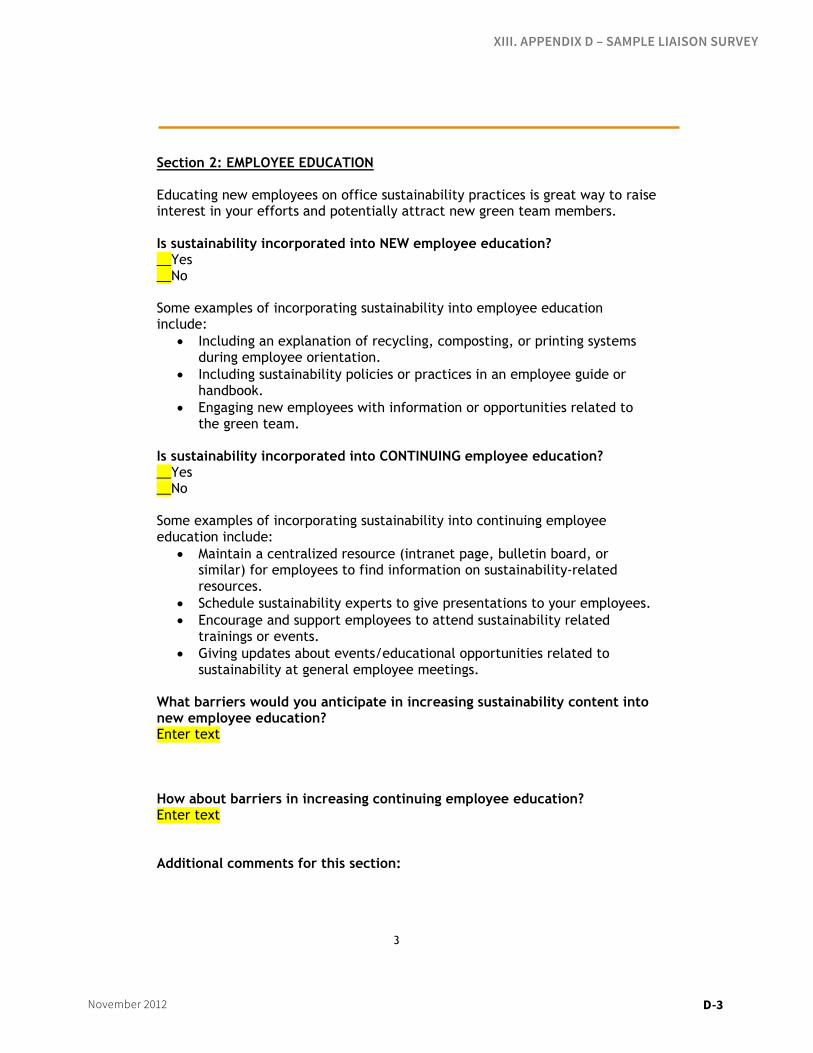
3
Section 2: EMPLOYEE EDUCATION Educating new employees on office sustainability practices is great way to raise interest in your efforts and potentially attract new green team members. Is sustainability incorporated into NEW employee education? __Yes __No Some examples of incorporating sustainability into employee education include:
• Including an explanation of recycling, composting, or printing systems during employee orientation.
• Including sustainability policies or practices in an employee guide or handbook.
• Engaging new employees with information or opportunities related to the green team.
Is sustainability incorporated into CONTINUING employee education? __Yes __No Some examples of incorporating sustainability into continuing employee education include:
• Maintain a centralized resource (intranet page, bulletin board, or similar) for employees to find information on sustainability-related resources.
• Schedule sustainability experts to give presentations to your employees. • Encourage and support employees to attend sustainability related
trainings or events. • Giving updates about events/educational opportunities related to
sustainability at general employee meetings. What barriers would you anticipate in increasing sustainability content into new employee education? Enter text How about barriers in increasing continuing employee education? Enter text Additional comments for this section:
d-3November 2012
XIII. APPEnDIX D – SAMPLE LIAISOn SURVEY
4
Section 3: TOXICS REDUCTION STRATEGY In 2006, the Toxic Reductions Strategy outlined proposed actions to support broad Toxic Reduction actions for the City and County. Although Bureaus were not directly assigned toxic reductions goals, Bureaus names were listed next to certain toxic reduction actions that may have an impact on that Bureaus’ work. The summary chart on the follow page links Bureaus to specific actions. Instructions for this section: 1. Open Toxic Reduction Strategy:
http://www.portlandonline.com/bps/index.cfm?a=252139&c=44621 2. Use the summary table (pg 5) to match the action numbers for your Bureau
with the actions listed in the Toxics Reductions Strategy. 3. Record your bureau’s progress on its Toxics Reduction’s Actions in response
to the questions on pg 6.
d-4 November 2012
SuStainable City Government: operationS Summary
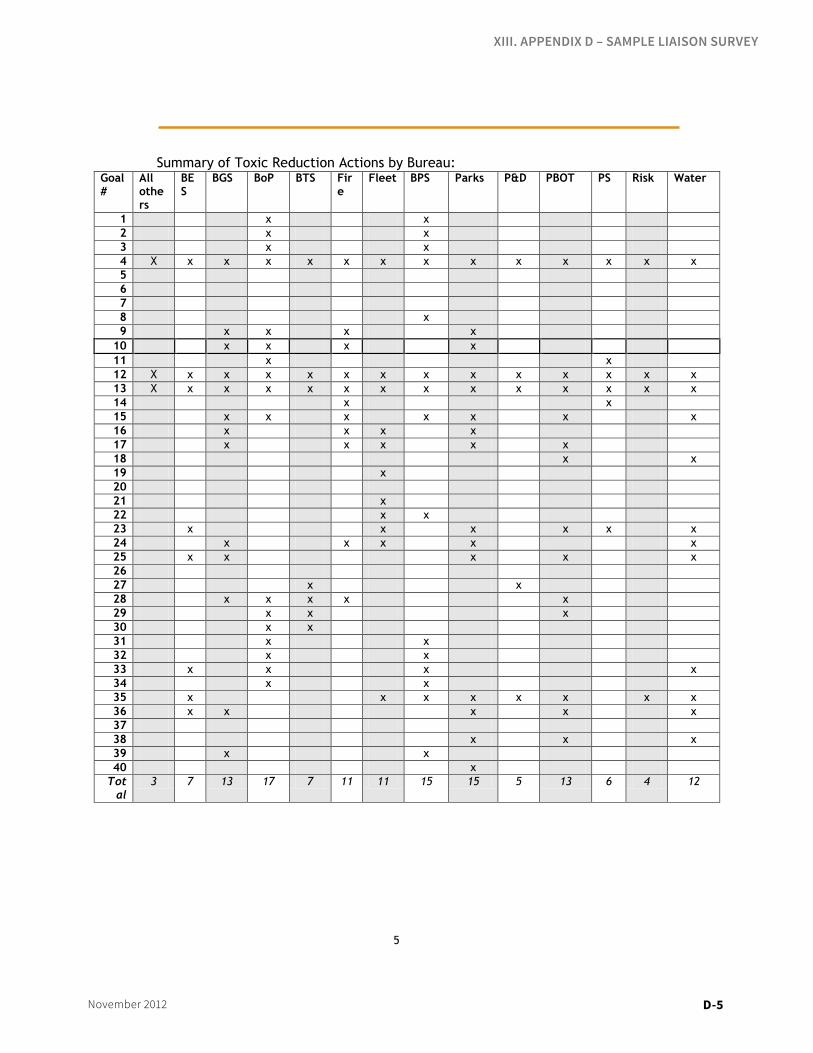
5
Summary of Toxic Reduction Actions by Bureau: Goal#
All others
BES
BGS BoP BTS Fire
Fleet BPS Parks P&D PBOT PS Risk Water
1 x x 2 x x 3 x x 4 X x x x x x x x x x x x x x 5 6 7 8 x 9 x x x x
10 x x x x 11 x x 12 X x x x x x x x x x x x x x 13 X x x x x x x x x x x x x x 14 x x 15 x x x x x x x 16 x x x x 17 x x x x x 18 x x 19 x 20 21 x 22 x x 23 x x x x x x 24 x x x x x 25 x x x x x 26 27 x x 28 x x x x x 29 x x x 30 x x 31 x x 32 x x 33 x x x x 34 x x 35 x x x x x x x x 36 x x x x x 37 38 x x x 39 x x 40 x
Total
3 7 13 17 7 11 11 15 15 5 13 6 4 12
d-5November 2012
XIII. APPEnDIX D – SAMPLE LIAISOn SURVEY
6
Did your Bureau or office make progress toward any of the Toxics Reductions actions listed in the summary table? Possible Answers:
• Action Complete • Action In-Progress • No progress made with this action
d-6 November 2012
SuStainable City Government: operationS Summary
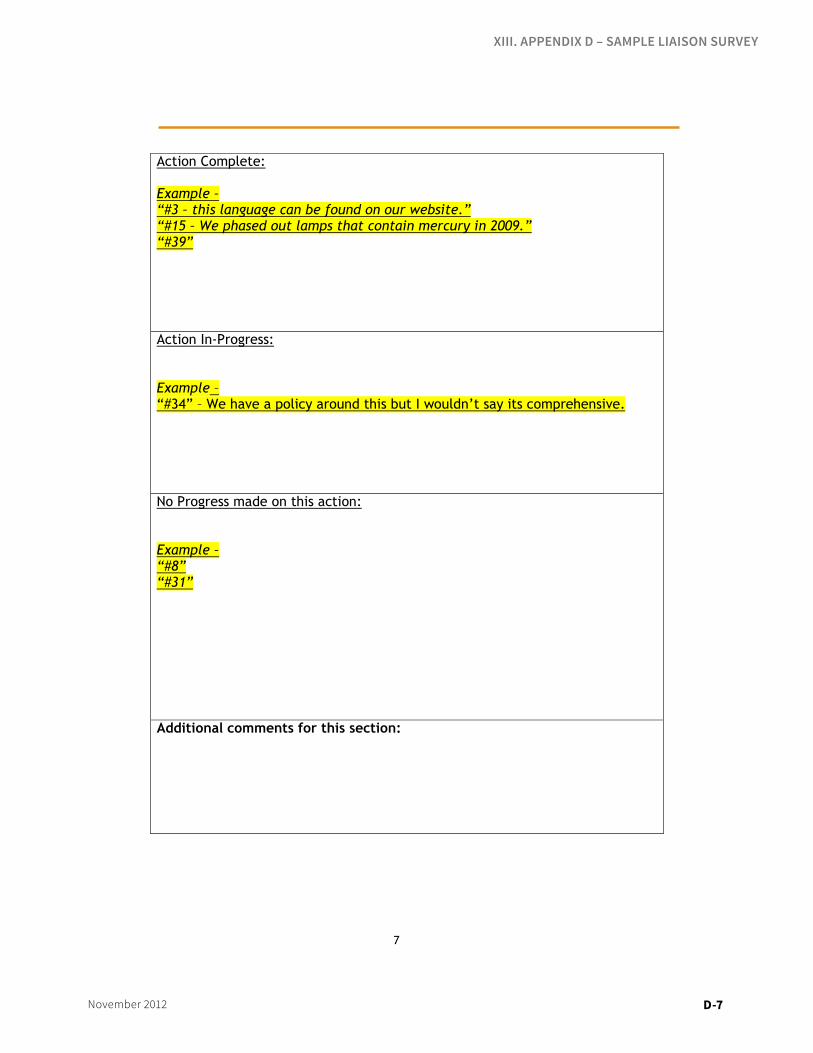
7
Action Complete: Example – “#3 – this language can be found on our website.” “#15 – We phased out lamps that contain mercury in 2009.” “#39” Action In-Progress: Example – “#34” – We have a policy around this but I wouldn’t say its comprehensive. No Progress made on this action: Example – “#8” “#31” Additional comments for this section:
d-7November 2012
XIII. APPEnDIX D – SAMPLE LIAISOn SURVEY
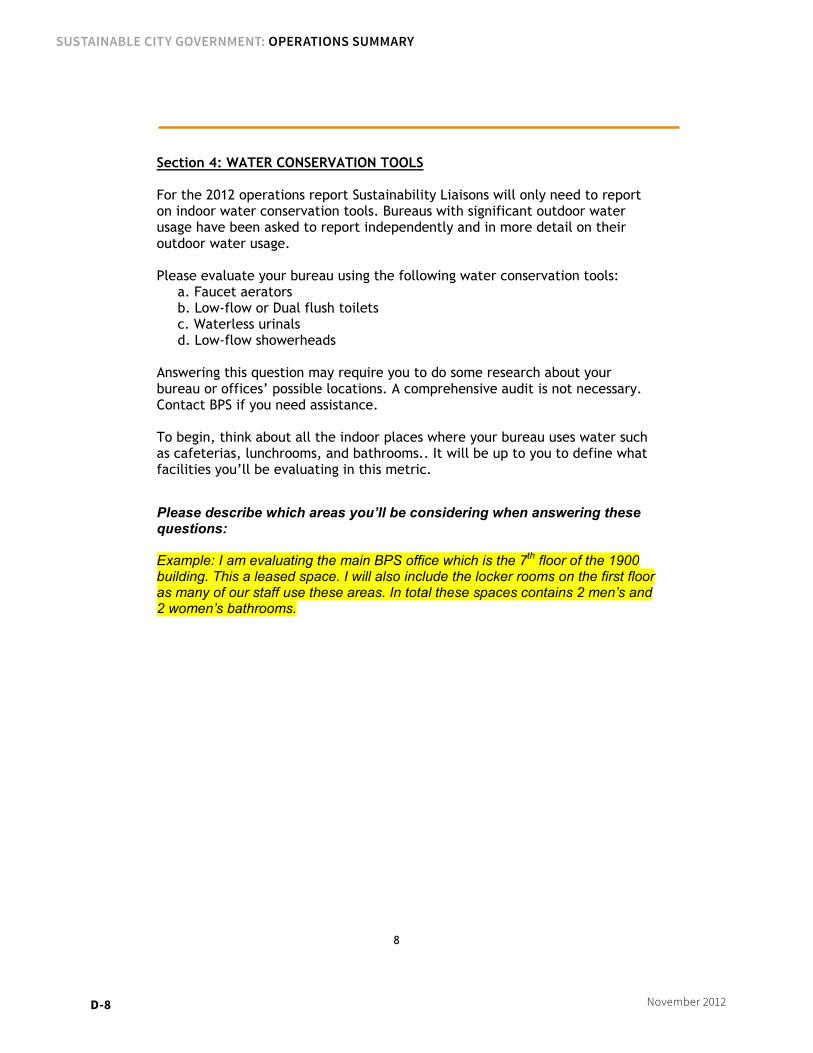
8
Section 4: WATER CONSERVATION TOOLS For the 2012 operations report Sustainability Liaisons will only need to report on indoor water conservation tools. Bureaus with significant outdoor water usage have been asked to report independently and in more detail on their outdoor water usage. Please evaluate your bureau using the following water conservation tools:
a. Faucet aerators b. Low-flow or Dual flush toilets c. Waterless urinals d. Low-flow showerheads
Answering this question may require you to do some research about your bureau or offices’ possible locations. A comprehensive audit is not necessary. Contact BPS if you need assistance. To begin, think about all the indoor places where your bureau uses water such as cafeterias, lunchrooms, and bathrooms.. It will be up to you to define what facilities you’ll be evaluating in this metric. Please describe which areas you’ll be considering when answering these questions: Example: I am evaluating the main BPS office which is the 7th floor of the 1900 building. This a leased space. I will also include the locker rooms on the first floor as many of our staff use these areas. In total these spaces contains 2 men’s and 2 women’s bathrooms.
d-8 November 2012
SuStainable City Government: operationS Summary
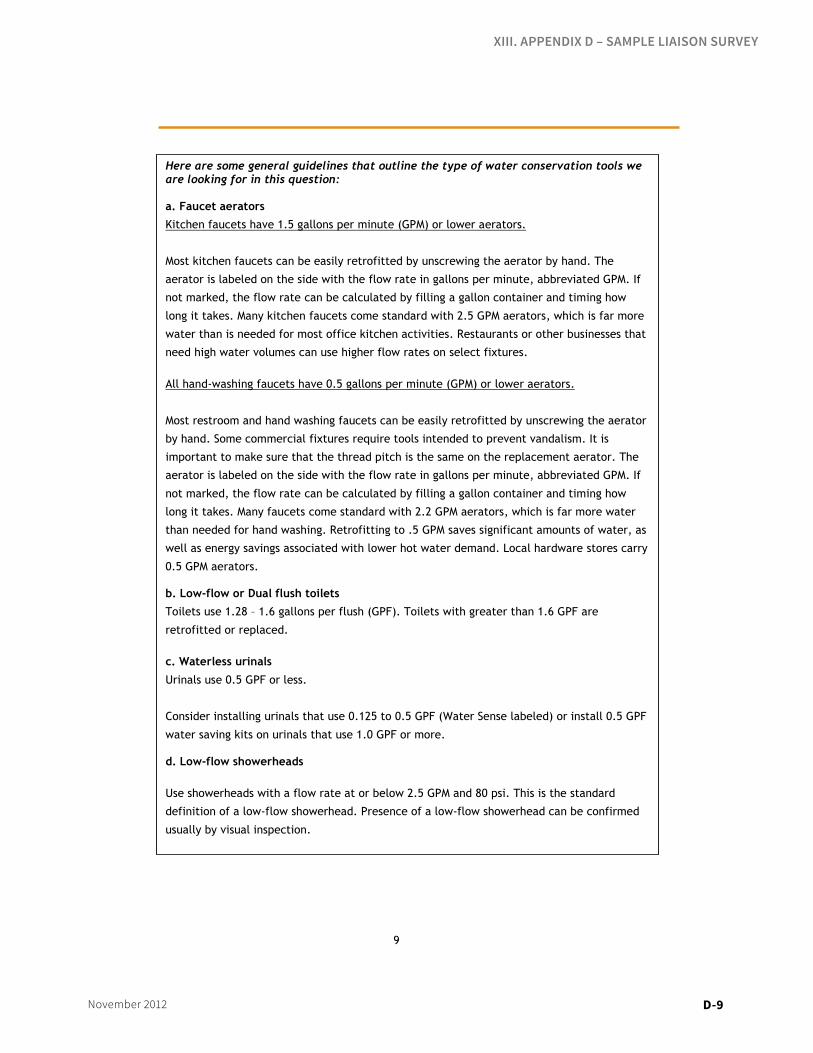
9
Here are some general guidelines that outline the type of water conservation tools we are looking for in this question: a. Faucet aerators
Kitchen faucets have 1.5 gallons per minute (GPM) or lower aerators.
Most kitchen faucets can be easily retrofitted by unscrewing the aerator by hand. The
aerator is labeled on the side with the flow rate in gallons per minute, abbreviated GPM. If
not marked, the flow rate can be calculated by filling a gallon container and timing how
long it takes. Many kitchen faucets come standard with 2.5 GPM aerators, which is far more
water than is needed for most office kitchen activities. Restaurants or other businesses that
need high water volumes can use higher flow rates on select fixtures.
All hand-washing faucets have 0.5 gallons per minute (GPM) or lower aerators.
Most restroom and hand washing faucets can be easily retrofitted by unscrewing the aerator
by hand. Some commercial fixtures require tools intended to prevent vandalism. It is
important to make sure that the thread pitch is the same on the replacement aerator. The
aerator is labeled on the side with the flow rate in gallons per minute, abbreviated GPM. If
not marked, the flow rate can be calculated by filling a gallon container and timing how
long it takes. Many faucets come standard with 2.2 GPM aerators, which is far more water
than needed for hand washing. Retrofitting to .5 GPM saves significant amounts of water, as
well as energy savings associated with lower hot water demand. Local hardware stores carry
0.5 GPM aerators. b. Low-flow or Dual flush toilets
Toilets use 1.28 – 1.6 gallons per flush (GPF). Toilets with greater than 1.6 GPF are
retrofitted or replaced.
c. Waterless urinals
Urinals use 0.5 GPF or less.
Consider installing urinals that use 0.125 to 0.5 GPF (Water Sense labeled) or install 0.5 GPF
water saving kits on urinals that use 1.0 GPF or more. d. Low-flow showerheads
Use showerheads with a flow rate at or below 2.5 GPM and 80 psi. This is the standard
definition of a low-flow showerhead. Presence of a low-flow showerhead can be confirmed
usually by visual inspection.
d-9November 2012
XIII. APPEnDIX D – SAMPLE LIAISOn SURVEY
10
Section 4: Questions a. How often does your Bureau or office use faucet aerators?
__Always (in >75% of possible locations)
__Sometimes (in 25-75% of possible locations)
__Rarely (in <25% of possible locations)
__Not applicable
Comments: If applicable b. How often does your Bureau or office use low-flow or dual flush toilets?
__Always (in >75% of possible locations)
__Sometimes (in 25-75% of possible locations)
__Rarely (in <25% of possible locations)
__Not applicable
Comments: If applicable
d-10 November 2012
SuStainable City Government: operationS Summary
11
c. How often does your Bureau or office use waterless urinals?
__Always (in >75% of possible locations)
__Sometimes (in 25-75% of possible locations)
__Rarely (in <25% of possible locations)
__Not applicable
Comments: If applicable d. How often does your Bureau or office use low-flow showerheads?
__Always (in >75% of possible locations)
__Sometimes (in 25-75% of possible locations)
__Rarely (in <25% of possible locations)
__Not applicable
Comments: If applicable Additional comments for this section:
d-11November 2012
XIII. APPEnDIX D – SAMPLE LIAISOn SURVEY
12
Section 5: OVERARCHING CHALLENGES Instructions for this section: 1. Review Attachment A: SCG Partnership Operations Report Contents paying special attention to “related policy goals”. Find this here: \\cgisfile\public\BPS\SCG\Progress_Report_Project_Folder\SCGLiaisons\projectguide_finaldraft.doc
Answer the following questions: I spend __less than five percent of my time implementing sustainable operations. __greater than five percent of my time implementing sustainable operations. Below are six topic areas where challenges may exist within your bureau or office. Complete with “yes” or “no” for each topic area. __Yes or No – Paying for projects __Yes of No – Implementing existing policies __Yes of No – Developing new policies __Yes of No – Receiving support from staff __Yes of No – Receiving support from management __Yes of No – No one in my bureau or office has been responsible for implementing sustainable operations policy. __Yes of No – Additional topic area(s):______________________________ Please describe specific challenges here being as specific as possible. (These are the examples the Liaison sub-group will draw from in our presentation to Bureau Directors.) If applicable Using the following list of topics, please rank the top three challenges for your bureau or office. Mark 1, 2 or 3 here* where 1 is the highest priority: __Paying for projects __Implementing existing policies __Developing new policies __Receiving support from staff __Receiving support from management __No one in my bureau or office has been responsible for implementing sustainable operations policy. __Additional topic area(s):______________________________ *We will dedicate a large portion of our meeting in June to this topic. Additional comments for this section. If applicable
d-12 November 2012
SuStainable City Government: operationS Summary