Embed Size (px)
Citation preview

PHD THESIS
Sustainable Consumer Behaviour
Supervisor: PhD candidate: Prof. Marco Frey Ajla Cosic Tutor: Prof.Francesco Testa
Pisa, September 2015.
2
©2015, Ajla Cosic. All rights reserved. Printed in Pisa, Italy. Sant’Anna School of Advanced Studies, Institute of Management. Piazza Martiri della Liberta 24, 56127 Pisa, Italy.

3
“Read! In the Name of your Lord, Who created”
The Qu’ran 96:1

4
Acknowledgements
In September 2013 I started my PhD journey at Scuola Superiore Sant Anna in Pisa. Last two
years of my PhD journey I have spent at London School of Economics, Em Strasbourg
Business School and Bilgi University learning about science.
I would like to thank all people that I have met for encouraging my research and for allowing
me to grow as a research scientist. Your advice on both research as well as on my career have
been priceless.
I wish to express my sincere thanks to Institute of Management for providing me with all the
necessary facilities for the research. I would like to express my special appreciation and
thanks to my advisor Marco Frey and my tutor Francesco Testa.
I had the pleasure to work on different chapters of my thesis with Fabio Iraldo, Francesco
Testa, Sebastian Ille, Hana Cosic and Sihem Dekhili.
A special thanks to my family. I owe my deepest gratitude to my parents and sister. Words
cannot express how grateful I am to my mother, father and my sister for all of the sacrifices
that you have made on my behalf. When it was hardest you have been there, making this
journey easier. I would also like to thank all of my friends and colleagues who supported me
in writing, and incented me to strive towards my goal.

5
Table of Contents
1 Introduction ........................................................................................................................... 9
1.1 “Attitude Behaviour Context” (ABC) theory ................................................................. 10
1.2 ‘Nudges’ and consumer behaviour ................................................................................. 11
1.2.1 ‘Nudges’ and recycling - Can Nudges Affect Students’ Green Behaviour? ....... 11
1.2.2 ‘Nudges’ and healthy food - Nudging Students toward Healthier Choices in a University Cafeteria ............................................................................................................ 12
References ............................................................................................................................. 13
2 Determining factors of curtailment and purchasing energy related behaviours .......... 15
2.1 Introduction .................................................................................................................... 16
2.2 Theoretical framework and research hypotheses ........................................................... 18
2.2.1 Attitudinal factors as determinant of energy-saving behaviour ........................... 18
2.2.2 Contextual factors: the role of trust concept in energy-saving ........................... 19
2.2.2.1 Government .......................................................................................... 21
2.2.2.2 Environmental NGOs ........................................................................... 21
2.2.2.3 Private companies .................................................................................. 22
2.2.2.4 Friends and family ................................................................................ 23
2.2.3 Personal capabilities ............................................................................................ 23
2.3 Methods .......................................................................................................................... 24
2.3.1 Measurements ....................................................................................................... 25
2.3.1.1 Independent variables .............................................................................. 25
2.3.1.1.1 Level of trust in the information provided by different entities.25
2.3.1.1.2 Personal norms .......................................................................... 26
2.3.1.1.3 Personal Capabilities ................................................................. 27
2.4 Empirical Models ............................................................................................................... 29
2.5 Results ................................................................................................................................ 30

6
2.6 Discussion .......................................................................................................................... 33
2.7 Conclusion .......................................................................................................................... 35
References ................................................................................................................................ 38
Appendix .................................................................................................................................. 45
3 Nudges Can Affect Students’ Green Behaviour? –A Field Experiment ......................... 48
3.1 Introduction ..................................................................................................................... 49
3.2 Literature review ............................................................................................................ 50
3.3 Model ............................................................................................................................. 52
3.4 Methods .......................................................................................................................... 56
3.5 Results ............................................................................................................................ 59
3.6 Discussion and conclusion ............................................................................................. 63
References ............................................................................................................................ 65
Appendix .............................................................................................................................. 67
4 Nudging Students toward Healthier Choices in a University Cafeteria ........................ 68
4.1 Introduction .................................................................................................................... 69
4.2 Literature review ............................................................................................................ 70
4.2.1 Social norms ......................................................................................................... 71
4.2.2 Convenience and other ‘nudges’ .......................................................................... 72
4.3 Methods .......................................................................................................................... 73
4.3.1 Experimental design ........................................................................................... 73
4.3.2 Treatment: The role of social norm and ‘easy to choose’ nudge on healthy food purchase .................................................................................................................................. 74
4.4 Results and discussion .................................................................................................... 76
4.4.1 Why nudge do not always work out as planned? .................................................. 79
4.6 Conclusion ...................................................................................................................... 81
References ............................................................................................................................ 84
5 Conclusions .......................................................................................................................... 88

7
List of Tables and Figures
Tables 2.1 Correlation matrix and descriptive statistics ..................................................................... 28
2.2 Results of regression analysis ........................................................................................... 31
4.1 Prices and total quantity of drinks and food sold during control and treatment period .... 78
4.2 T test statistics-drinks ........................................................................................................ 79
4.3 T test statistics-food ........................................................................................................... 79
Figures 2.1 Conceptual model and Hypotheses ................................................................................... 29
3.1 Dynamics of the control group ........................................................................................ 55
3.2 Dynamics of treatment 1 ................................................................................................... 55
3.3 Dynamics of treatment 2 ................................................................................................... 56
3.4 Treatment 1 ........................................................................................................................ 58
3.5 Treatment 2 ........................................................................................................................ 59
3.6 Survey results .................................................................................................................... 60
3.7 Percentage of recycled cups over the experimental period ............................................... 61
3.8 Average of percentage of recycled cups ........................................................................... 62
3.9 Treatment 2 – Share of correctly disposed recyclable and non-recyclable garbage ......... 62
3.10 Effects of parameter changes. .......................................................................................... 67
4.1 Social norm message ......................................................................................................... 75
4.2 Social norm message and label ‘healthy eating’ in cafeteria ............................................. 75
4.3 ‘Easy to choose’ nudge - green footprints in cafeteria ...................................................... 76
4.4 Sales of healthy and less healthy food in cafetaria ............................................................ 77
4.5 Sales of healthy and less healthy drinks in cafetaria ......................................................... 77

8
“Bismilahir-rahmanir-rahim!
I call to witness the ink, the quill, and the script, which flows from the quill;
I call to witness the faltering shadows of the sinking evening, the night and all she enlivens;
I call to witness the moon when she waxes, and the sunrise when it dawns. I call to witness the Resurrection Day and the soul that accuses itself;
I call to witness time, the beginning and end of all things - to witness that every man always suffers loss.”
Mesa Selimovic, Death and the Dervish

9
1
Introduction One of the important long term social and policy challenges facing the planet is how to
promote sustainable resource use and change people’s behaviour. Sustainable development
requires not only technological innovations but also changes in individual and collective
behaviours. In our opinion policies that ignore results of human psychology and assume that
we are Homo economicus will hardly reach their aimed level of impact.
Why do not we save more energy? Why do not we recycle more? Why do not we eat more
healthy food? For possible explanations and answers to these questions principles of
consumer behaviour can be used.
Consumer behaviour is a field that combines on different disciplines such as psychology,
sociology, and economics to explain the choices that consumer make. This thesis explores
different approaches of consumer behaviour to management, in order to understand consumer
behaviour in relation to sustainable development. Moreover we tried to use different
approaches in order to see are they effective in helping people to live more sustainably (to
recycle more, to save more energy and to eat healthier food).
The most commonly used definition of sustainability and sustainable development comes
from the 1987 Brundtland Commission report. Sustainable development is defined as
“development that meets the needs of the current generation without compromising the ability
of future generations to meet their needs.” (United Nations, 1987)
According to Belz and Peattie (2009) sustainable consumer behaviour is consumers’
behaviours that improve social and environmental performance as well as meet their needs.
Moreover it studies why and how consumers do or do not incorporate sustainability issues
into their consumption behaviour and everyday life.
Even though all of the progress and efforts that has been made globally toward addressing
issues of sustainability, the problem of unsustainable consumption is growing. Many
obstacles stand in the way of adopting sustainable behaviour whether material, financial or
psychological. However small, everyday changes in people’s behaviour can have significant
positive environmental impacts.

10
In literature, several models have been developed to investigate consumer behaviour. For
instance, Ajzen developed the Theory of Planned Behaviour focusing on self-interest based
and rational choice-based (1988; 1991). On the other hand Stern et al. (1999) has proposed the
Value-Belief-Norm Theory (VBN) focusing on values and moral norms (Lopez et al., 2012).
However, today it is widely accepted that consumer behaviour is the result of many factors
and can be complex to understand. In fact, no single model or theory is able to provide a
framework that can analyse more than a small portion of behaviour (Keirstead, 2006;
Stephenson et al., 2010; Wilson and Dowlatabadi, 2007).
This thesis explores two different approaches of consumer behaviour: ‘nudge’ as a
behavioural economics approach and “Attitude Behaviour Context” (ABC) theory.
1.1 “Attitude Behaviour Context” (ABC) theory
An effort to integrate different theories to predict environmental-friendly behaviour had been
made by Stern (2000) and Guagnano et al. (1995) through the development of the “Attitude
Behaviour Context” (ABC) theory which affirms that behaviour (B) is an interactive product
of personal-sphere attitudinal variables (A) and contextual factors (C)
In Chapter 2 we used “Attitude Behaviour Context” (ABC) in order to analyze the
determinants behind individuals' decisions to adopt curtailment behaviour or to purchase
energy saving products. Energy is a fundamental input for everyday consumer activities.
Changing people’s behaviour in relation to energy consumption will be one of the most
important challenges in the near future. Consumer behaviour is both complicated and difficult
to change as they are influenced by a range of internal and external factors such as personal
values, beliefs, norms, attitudes, and other people’s behaviour. Curtailment behaviour focuses
on reduction in everyday energy use, such as lowering temperature in unused rooms or
switching off the lights when leaving a room, and require either no or minimal structural
adjustment (Barr et al., 2005). While behaviour based on adoption of energy efficient
technologies is also called investment behaviour and is related to a purchasing decision (e.g.,
purchases of energy efficient light bulbs or change of insulation) (Gynther et al., 2012). Using
data from 213 university students, we explored the influence of personal capabilities and
moral norms, along with trust in information on energy saving actions provided by different
entities on two energy saving behaviours. The results of the statistical model emphasise how

11
personal norms and trust in information provided by private companies, on the one hand, and
family and friends, on the other, strongly influence the adoption of energy saving actions and
curtailment behaviours.
1.2 ‘Nudges’ and consumer behaviour
A growing literature on behavioural economics and psychology suggests use of non price
interventions- nudges. A nudge is a ‘helping hand’ that will lead someone to make better
decisions for itself and for the public interest as well. Nudges are suggested as a policy of
libertarian paternalism and favoured for its simplicity, relatively low cost of implementation
and its effectiveness. As suggested by (Thaler and Sunstein, 2008), 'libertarian' aspect refers
to the necessity of respecting everyone's freedom to act, decide or even change their minds as
it suits them.
Nudges used in the field of ecology and environment saving, are called ‘green nudges’ or
‘ecological nudges’ (e.g., reducing the number of plastic bags, energy-saving).
One example of ‘green nudge’ is reducing the number of plastic bags in China. Since 2008 in
China stores are not providing customers with plastic bags at checkouts obliges them to ask
for or even pay for them. According to Watts (2008) this measure has led to a reduction of
around 40 billion plastic bags used between 2008 and 2009, representing a saving of 1.6
billion tonnes of oil.
Nudges are also used to promote healthier eating habits. One example is removing the trays
for people who eat at the self-service restaurant on a university campus. According to Oullier
et al. (2010) this action has reduced the portions the students took for themselves and has
reduced food wastage by an average of 50%.
In two studies that we carried in Pisa and Strasbourg we used principles of nudges in order to
see effect of nudges on consumer behaviour (Chapter 3 and Chapter 4). In the first paper we
used ‘green nudges’ in order to test can nudges affect students’ green behaviour? In the
second paper we used nudges to promote healthier eating habits. Moreover we tested can
nudges affect healthier choices in a university cafeteria?
1.2.1 ‘Nudges’ and recycling - Can Nudges Affect Students’ Green Behaviour?
In Chapter 3 we study whether nudges are efficient in promotion of ecological behaviour-
12
recycling. Ecological behaviour is impeded both by financial and behavioural hurdles. A
growing literature in behavioural economics and psychology suggests the use of non-price
intervention nudges over other monetary incentives. We analyse whether nudges are indeed
efficient in promoting recycling of resources among young people, and whether the
combination of different types of nudges serve as better instruments. The study was
performed on primary data from both a survey and field experiment conducted among
university students in Pisa over a 60-day span (from October to December 2013). We
collected data on 1849 instances of plastic cup recycling at a coffee vending machine at the
Scuola Superiore Sant’Anna in Pisa. Recycling behaviour was measured by the number of
plastic cups disposed in the proper dustbin, observed at the end of each day. Results of the
experimental treatments showed a significant improvement in the amount of recyclable cups
when a combination of nudges was applied. In addition to the empirical analysis, the paper
further analytically replicates the results and illustrates the effect of a change in
perception(awareness raising) of individuals, a shift in the social norm, as well as an ‘easy to
do’ nudge.
1.2.2 ‘Nudges’ and healthy food- Nudging Students toward Healthier Choices in a
University Cafeteria
Small everyday changes in people’s eating behaviour can have significant positive impact on
our health. In Chapter 4 we study nudge and its effect on healthy food purchases in a
university cafeteria. The study was performed on primary data; a field experiment was
conducted among university students in Strasbourg. The field experiment was conducted over
a 20-day span (from February to March 2014). In total, we collected data on 606 bottle of
waters, 675 soft drinks, 339 fruit juice, 247 fruits, 257 salads, 227 desserts, 130 yogurts
(without sugar), 193 yogurts (with sugar) in a cafeteria of School of Economics and Business
School at the University of Strasbourg. Consumption of healthy food was measured by sale
records of healthy food observed at the end of a day. Results of the experimental treatments
showed a non significant impact on the amount of healthy food and drinks purchase.
13
References
Ajzen, I. (1988). Attitudes, personality and behavior. Milton Keynes: Open University Press.
Ajzen, I. (1991). The theory of planned behavior. Organizational behavior and human decision
processes 50, 179-211.
Barr, S., Gilg, A. W., & Ford, N. (2005). The household energy gap: examining the divide
between habitual-and purchase-related conservation behaviours. Energy Policy, 33(11), 1425-
1444.
Belz, Frank-Martin & Peattie, Ken (2009) Sustainability Marketing: A Global Perspective. John
Wiley & Sons, 73
Guagnano, G. A., Stern, P. C., & Dietz, T. (1995). Influences on attitude-behavior relationships
a natural experiment with curbside recycling. Environment and behavior, 27(5), 699-718.
Gynther, L., Mikkonen, I., & Smits, A. (2012). Evaluation of European energy behavioural
change programmes. Energy Efficiency, 5(1), 67-82.
Keirstead, J. (2006). Evaluating the applicability of integrated domestic energy consumption
frameworks in the UK. Energy Policy, 34(17), 3065-3077.
López-Mosquera, N., & Sánchez, M. (2012). Theory of Planned Behavior and the Value-Belief-
Norm Theory explaining willingness to pay for a suburban park. Journal of environmental
management, 113, 251-262.
Oullier O., Cialdini R., Thaler R. and Mullainathan S. (2010), “Improving public health
prevention with a nudge”
Stern P. C., Dietz T., Abel T., Guagnano G. A., Kalof L. (1999). A value-belief-norm theory of
support for social movements: The case of environmental concern. Human Ecology Review 6,
81–97.
Stern, P. C. (2000). New environmental theories: toward a coherent theory of environmentally
significant behavior. Journal of social issues, 56(3), 407-424.
Stephenson, J., Barton, B., Carrington, G., Gnoth, D., Lawson, R., & Thorsnes, P. (2010).
Energy cultures: A framework for understanding energy behaviours. Energy Policy, 38(10),
6120-6129.

14
Thaler, R. H., & Sunstein, C. R. (2008). Nudge: Improving decisions about health, wealth, and
happiness. Yale University Press.
United Nations. 1987. Report of the World Commission on Environment and Development,
General Assembly Resolution 42/187, 11 December 1987. Retrieved: March, 2015
Watts J. (2008), “China plastic bag ban 'has saved 1.6m tonnes of oil’”, The Guardian, 22 May.
Wilson, C., & Dowlatabadi, H. (2007). Models of decision making and residential energy use.
Annu. Rev. Environ. Resour., 32, 169-203.

15
2
Determining factors of curtailment and
purchasing energy related behaviours1
Abstract
Changing people’s behaviour in relation to energy consumption will be one of the most
important challenges in the near future. We analyzed the determinants behind individuals'
decisions to adopt curtailment behaviour or to purchase energy saving products. Using data
from 213 university students, we explored the influence of personal capabilities and moral
norms, along with trust in information on energy saving actions provided by different entities
on two energy saving behaviours. The results of the statistical model emphasise how personal
norms and trust in information provided by private companies, on the one hand, and family
and friends, on the other, strongly influence the adoption of energy saving actions and
curtailment behaviours. The paper reveals the pivotal role of private companies in developing
the market demand for energy-saving products by providing credible and scientifically-based
information on environmental performance. The paper also contributes to strengthening the
reliability of value-belief-norm theory and emphasizes the role of trust in information as a
contextual factor that influences the adoption of a pro-environmental behaviour.
Keywords: energy-saving; green consumer; curtailment behaviour; personal norm; trust.
1 This is a joint project with Fabio Iraldo and Francesco Testa.

16
2.1. Introduction
One of the main challenges of the 21st century is to reduce the depletion of natural resources
by human activities. Energy consumption produced by fossil resources is a principal cause of
this impoverishment and a major source of carbon emissions (Tukker et al. 2006; Zhang and
Cheng, 2009). The increase in income and well being in developed and emerging countries as
well as the increased use and ownership of electric appliances (Soytas and Sari, 2003), has
made energy efficiency a priority of policy makers.
Several studies have shown that electricity consumption in private households could be
substantially reduced if people paid more attention when buying more efficient electric
appliances or by avoiding the unnecessary use of electricity (e.g., Gram-Hanssen et al., 2004).
As the International Energy Agency concluded, there is a need for “a huge step-change in the
attitudes to energy efficiency and consumer purchases by hundreds of millions of people
worldwide…” (IEA, 2008). Energy consumer behaviour is, therefore, a key issue for scholars
and practitioners from a wide range of scientific disciplines (Stephenson et al., 2010).
Several models have been developed to investigate consumer behaviour. Ajzen developed the
Theory of Planned Behaviour focusing on self-interest based and rational choice-based
behaviour (1988; 1991). Stern et al. (1999) proposed the Value-Belief-Norm Theory (VBN)
focusing on values and moral norms (Lopez et al., 2012). This theory is based on the principle
that pro-social attitudes and personal moral norms are predictors of specific behaviour, such
as environmental-friendly or energy saving behaviour (Jackson, 2005 as referenced in
Martiskainen, 2007).
Stern (2000) and Guagnano et al. (1995) have integrated different theories to predict
environmental-friendly behaviour through the development of the “Attitude Behaviour
Context” (ABC) theory, which affirms that behaviour (B) is an interactive product of
personal-sphere attitudinal variables (A) and contextual factors (C).
However, today it is widely accepted that consumer behaviour is complex and is the result of
many factors. In fact, no single model or theory provides a framework capable of analysing
more than a small portion of behaviour (Keirstead, 2006; Stephenson et al., 2010; Wilson and
Dowlatabadi, 2007).
Energy saving behaviour can be considered as a sub-set of more general environmental-
friendly behaviours. There are essentially two fundamental categories of behaviour: energy-
saving actions based on curtailment, and actions based on the adoption of energy efficient
17
technologies (Barr et al., 2005; Stern 1992; Sutterlin et al., 2011). Curtailment behaviour in
the literature is also known as “habitual behaviour” (Maréchal, 2009). This type of behaviour
focuses on the reduction of energy use in everyday life, such as by lowering the temperature
in unused rooms or switching off lights when leaving a room, and requires no, or minimal,
structural adjustment (Barr et al., 2005). Behaviour based on the adoption of energy efficient
technologies on the other hand, is also called “investment behaviour” and is related to a
purchasing decision (e.g., purchases of energy efficient light bulbs or change in insulation)
(Gynther et al., 2012).
Several studies have investigated energy-saving behaviours mainly focusing on the influence
of attitudinal and personal factors on curtailment or purchasing behaviours, finding positive
causal relations (Barr et al., 2005; Ek and Soderholm 2008; Gadenne et al., 2011; Hori et al.,
2013; Oikonomou et al., 2009; Stern, 2000; Sutterlin et al., 2011). However, most of these
studies have analyzed the predictors of curtailment or purchasing behaviours separately.
Moreover, the level of trust in the source of information concerning the energy performance
of products or energy-saving behaviour has been underestimated in the analysis of the
contextual factors that can persuade individuals to adopt energy saving behaviours.
Hence, in order to provide a valuable theoretical, policy and managerial contribution, it was
investigated the role of trust, personal norms and personal capabilities (e.g. age, education,
and income) in influencing both curtailment and purchasing behaviours of a sample of
university students using data collected through a survey.
The focus on university students in these types of studies is not uncommon in the literature. A
growing literature relies on students’ responses and according to Cullis et al. (2012, p. 167)
‘there is no reason to believe that the cognitive processes of students are different from those
of ‘real’ people’. Moreover, students play an important role in their family household by
influencing their parents and other household members. Using data collected through
questionnaires to 200 undergraduate students from a major private university in Malaysia,
Chen and Chai, (2010) investigated the relationship between attitude towards the environment
and green products. Their results revealed that consumer attitudes towards the government’s
role and their personal norms regarding the environment, contributed significantly to their
attitudes towards green products. Although the present study focuses on the same target
audience (university students), similar to Stern (1999), it was extended the types of casual
factors that can drive an individual to carry out two specific environmentally significant
behaviours.
Straughan and Roberts (1999) also collected data by distributing a questionnaire to a

18
convenience sample of 235 students attending a major university, in order to examine the
dynamic nature of ecologically-conscious consumer behaviour. They focused on two elements
of the VBN theory: the “self-efficacy” of consumer actions (perceived consumer
effectiveness) and environmental awareness. They found that demographic criteria are not as
useful a profiling method as psychographic criteria. Since the validity of VBN is largely
supported in the literature (Stern, 2000), the present study focused on two important
contextual factors which, as highlighted by Stern (1999), can play a significant role in
determining environmentally significant behaviour: social norms and trust in sources that
provide information.
The paper is organized as follows. Section 2 provides an overview of the literature concerning
the hypotheses of the study. Section 3 describes the data set and the estimation methodology.
Section 4 then presents the statistical results and Section 5 makes some recommendations for
future research and policy implications.
2.2. Theoretical framework and research hypotheses
The term “curtailment” (or “habitual”) behaviour encompasses a set of energy-saving actions
that have to be performed rapidly and that are related to a change in the consumer’s everyday
life, because they involve new habits in the use of energy (Aarts and Dijksterhuis, 2000;
Marechal, 2009; Sutterlin et al., 2011). On the other hand, energy-saving behaviours based on
energy-efficient measures (e.g. purchasing of energy efficient appliances) require a single
action and occur occasionally — typically implying a change to a new technology or
”technology choice” (Stern, 1992). Purchases of energy efficient light bulbs or changes in
insulation are some examples of purchase-related energy-saving behaviour.
Stern (2000) divided the determinants of environmentally significant behaviour into four
major categories: attitudinal factors (norms, beliefs and values), contextual forces (e.g.,
community expectations, advertising and government regulations), personal capabilities
(sociodemographics: e.g., age or income) and habits or routines. The following sub-sections
provide a brief overview of the literature and introduce the hypotheses of the study.
2.2.1 Attitudinal factors as determinant of energy-saving behaviour
Many studies have been carried out to clarify the key factors that influence energy-saving

19
behaviour (e.g., Oikonomou et al., 2009; Gadenne et al., 2011; Hori et al., 2013; Stern, 2000),
highlighting that “personal moral norms are the main basis for individuals’ general
predisposition for pro-environmental action” (Stern, 2000).
Hori et al. (2013) carried out a survey in five major Asian cities, in order to identify factors
that affect household energy-saving behaviour. Their results showed that global warming
consciousness, environmental behaviour, social interaction and community-based activities
significantly affected energy-saving behaviour. The results of a study carried out by Gadenne
et al. (2011) showed that general environmental beliefs highly influenced norms on
environmental actions, and emphasised a strong association between environmental attitudes
and energy-saving behaviours.
The main influence of attitudinal variables seem to be on specific stages of energy-saving
behaviour. According to a review of US-based studies, attitudes are good predictors of general
intentions to change residential energy use, however structural characteristics (of the
residence) are better predictors of specific actions, such as weatherization (Guerin et al.,
2000). Similarly, Oikonomou et al. (2009) found that people not only consider the comfort
and costs of energy-saving, but also moral aspects such as environmental quality and impact
on future generations.
Based on the literature available, our aim was to further explore the effect of personal norms
both on purchasing decisions and curtailment behaviours:
H1-2: Consumers with strong personal norms related to energy-saving issues are more likely
to purchase energy-saving products (1) and to adopt curtailment behaviours (2).
2.2.2 Contextual factors: the role of trust in energy-saving
A second major type of causal variables is the contextual or external forces, which include
interpersonal influences, community expectations, government regulations, monetary
incentives and other legal and institutional factors (for an overview, see Stern, 2000).
Contextual factors can impede pro-environmental personal attitudes from generating concrete
actions. Although information is not directly included by Stern (2000) as a contextual factor
(he explicitly mentions only the role of advertising), it can play a considerable role in
supporting both curtailment and purchasing behaviour.
Behaviours and actions regarding environmental protection and energy-saving are shaped not
only by how individuals react to specific environmental issues, but also by information, the
openness of society, and the attitudes toward the reliability of the source of information

20
(Tjernström and Tietenberg, 2008). Trustworthy information provided by external entities can
make a social norm more pervasive (Stern, 1996) and compensate for a weak personal attitude
towards environmental issues. Additionally, the energy and environmental attributes of a
product are characterized by an asymmetrical distribution of information between the
consumer and producer (Perrini et al. 2010). Therefore, how consumers perceive the
reliability of information provided by companies on their product attributes, may have a
significant influence on purchasing behaviours (Testa et al. 2013).
The concept of trust has gradually acquired importance in both marketing and management
research (Schoorman et al., 2007) and has proven to be an effective key in analyzing
situations where the truster (i.e. the consumer in our case) is vulnerable (Castaldo et al.,
2009). Trust can be defined as the truster’s expectation that the trustee (i.e. a producer in our
case) is willing to keep promises and fulfil obligations (Hagen and Choe, 1998). The
expectation is based on such variables as the level of competence, honesty, altruism, and
goodwill of the trustee (Blomqvist, 1997). According to Castaldo et al. (2009) trust is
multidimensional and can be applied across different levels of analysis (interpersonal,
intergroup or inter-organizational).
Although relationship of trust with energy-related issues has gained the interest of
scholars, researchers and policy makers (Mitchell et al., 2010; Rayner, 2010), the focus on
behaviours has been very limited. For instance, Rayner (2010) looked at diverse concepts and
roles of trust in the fields of energy and environmental policy research: public trust in science,
institutional trust in technology choices, and the idea that high-trust societies are more
sustainable than those exhibiting low-trust. Numerous studies have also analyzed the
importance of trust in the field of service provision (Price and Arnould, 1999; Geyskens et al.,
1998) and in energy technologies (e.g., Ashworth et al., 2011). The influence of trust in the
energy provider on customer loyalty has been investigated (Ibáñez et al., 2006) but mainly
focusing on the effect of the perceived trust and switching costs on customer loyalty in
residential energy markets.
Consumers receive information regarding energy-saving from different entities: government,
local authorities, EU commissions, NGOs, scientists, private companies, the media, friends
and family. Trust in information received by an individual plays an important role in this
process and could determine consumer responses to the energy-saving information they
receive from various entities.
Some research has investigated the relation between the concept of trust in information and
green consumption (e.g., Bonini et al., 2008; Darnall et al., 2012). Studying a sample of more

21
than 1,200 UK residents, Darnall et al. (2012), found evidence that consumers who have
greater trust in information provided by governments, environmental NGOs, and
friends/family are more likely to rely on eco-labels in their product purchases. Additionally,
according to Bonini et al. (2008) businesses must act on global warming and other
environmental issues to narrow the trust gap between them and the public.
Whereas the literature tends to focus on environment-related behaviour, this study
concentrated on the trust in information on energy-saving issues provided by governments,
local authorities, the European Commission, NGOs, scientists, private companies, friends and
family. It is investigated the effect of trust not only on purchasing decisions, but also on the
adoption of curtailment behaviours.
2.2.2.1 The governments
The government is responsible for establishing energy laws, developing environment
protection policies and distributing information that directly or indirectly affects energy
saving. Literature related to energy consumption and trust in the government is still not
abundant, and only a few studies on the role of trust in the fields of energy and environmental
policy have been conducted (e.g., Mitchell et al., 2010; Rayner, 2010). However, Margaret
Walls, one of the energy experts for The Wall Street Journal, suggested that government
should focus more on behavioural approaches and provide more information to energy users
in order to make them to save more (Ball, 2013). Her idea is that governments should
concentrate on information programs that include product labels, such as the "Energy Guide"
on appliances; voluntary certification programs such as Energy Star; energy audits; and other
programs focusing on making energy uses and costs more transparent (Ball, 2013).
This leads us to formulate the following two hypotheses:
H3-H4: Consumers with greater trust in information on energy saving actions provided by
governments are more likely to purchase energy-saving products (3) and to adopt curtailment
behaviours (4)
2.2.2.2 Environmental NGOs
Environmental NGOs play an important role in energy-saving and environmental activities.
NGOs have established different working relationships in order to exchange information and
collaborate on issues related to energy-saving and environmental protection (Gan, 2000).

22
Through formal and informal networks, NGOs shape the attitudes and operations of other
social institutions (Gan, 2000). Environmental NGOs help consumers by protesting publicly
against labels that fall short of environmental expectations (Rivera and de Leon, 2004). Like
governments, environmental NGOs also help to protect customers from false market claims,
e.g. by developing eco-labels and eco-label guidelines (Rex and Baumann, 2007).
This leads us to formulate the following hypotheses:
H5-6: Consumers with greater trust in information on energy saving actions provided by
NGOs are more likely to purchase energy-saving products (5) and to adopt curtailment
behaviours (6)
2.2.2.3 Private companies
Companies can differentiate themselves from their competitors by acting on environmental
and other social issues, which can help them to build trust among their consumers. However,
issues connected with “greenwashing“ make customers confused and disoriented regarding
the environmental claims that companies provide (Mayer et al., 1993).
Although companies increasingly make use of green claims in advertising their products
(Testa et al., 2011), consumers often believe that these claims are not reliable and thus do not
orient their purchasing decisions towards greener products.
Greenwashing has increased consumer distrust and reduced consumers’ willingness to “buy
green” (Peattie and Crane, 2005), and has created barriers towards encouraging a broader
societal change (Knott et al., 2008). Based on a study by McKinsey (Bonini et al. 2008),
awareness promotion is critical for companies, insofar as consumers are increasingly willing
to “do business” with companies only if they trust them to perform well in terms of societal
and environment issues. In other words, performing concrete actions towards sustainability
increases the corporate reputation and the level of trust by consumers, as well as their
propensity to buy green products. Using an extensive dataset of consumer choices Testa et al.,
(2013) found that some ecolabels are able to provide reliable messages to consumers and
encourage them to make environmental friendly purchasing behaviours. In order to contribute
to the current debate on the role of trust in information provided by private companies on
energy- savings behaviours, the following hypotheses are formulated:
H7-8: Consumers with greater trust in private companies who provide information on the
energy efficiency of their products are more likely to purchase energy- saving products (7)
and to adopt curtailment behaviours (8)

23
2.2.2.4 Friends and family
A number of studies have investigated the role of other social actors on an individual’s
choice to adopt energy-saving behaviour. For instance, Ek and Soderholm (2008) found that
perception regarding the behaviour of others in general affects individual moral norms and
ultimately contributes to determine a specific behaviour. Friends and family are the most
trusted individuals in our social network; at the same time they are very frequently reported as
trusted sources of motivation for green purchasing (Lee 2008; Young et al., 2010). The
literature suggests that consumers are favourably influenced by the opinions and actions of
their family and friends (Pickett-Baker and Ozaki, 2008; Sidiras and Koukios, 2004). This
leads us to formulate the following hypotheses:
H9-10: Consumers with greater trust in information on energy saving actions provided by
friends and family are more likely to purchase energy-saving products (9) and to adopt
curtailment behaviours (10)
2.2.3 Personal capabilities
Personal capabilities include both the knowledge and skills required for specific actions and
the more general capabilities and resources (such as money). Personal capabilities are usually
measured by means of sociodemographic variables such as age, education, and income (Stern,
2000). Many studies have investigated the role of sociodemographic variables as predictors of
environmental behaviours, and have found contrasting results. A few studies identify the
typical “energy saver” as young, female, with high level of education, and wealthy, (Roberts,
1996; Sardianou, 2007). A number of past studies (Roberts, 1995; 1996; Zimmer et al., 1994)
have shown that younger individuals are more likely to be sensitive to environmental issues.
Conversely, results from other studies (Stern, 1999, Testa et al., 2013) show that demographic
criteria were found to be unrelated and not useful for profiling college students based upon
ecologically-conscious consumer behaviour.
Income is generally thought to be positively related to energy-saving behaviour. Numerous
studies have addressed the role of income as a predictor for ecologically conscious consumer
behaviour (Zimmer et al., 1994), whereas fewer studies have found a negative relation
between income and environmental concerns (Roberts 1995; 1996). The level of education is
another demographic variable that has been related to energy-saving behaviour (Roberts 1995;
1996).

24
Hence, in order to contribute to the current debate, our aim was to further investigate energy-
saving behaviours, and focus on the role of personal capabilities in individual choices.
H11-12: Consumers with higher personal capabilities are more likely to purchase energy-
saving products (11) and to adopt curtailment behaviours (12)
2.3. Methods
The study was performed on primary data from a survey conducted among university students
in Pisa, one of the most important university cities in Italy. The study instrument was a 3-page
questionnaire that posed questions concerning energy-saving behaviour. The questionnaire
was composed of four sections. Section I assessed the participants’ energy-saving behaviour
(curtailment). Section II measured different energy related beliefs, including personal norms,
awareness of consequences and ascription of responsibility. In Section III behaviours toward
the purchasing of energy-saving appliances were assessed. Section IV invited participants to
answer questions about socio-demographics (See Appendix for more details).
Data were collected between May and June 2013. Prior to the final submission, a pre-test was
administrated to 30 students during the month of May. This test was developed to reveal any
possible weaknesses and misunderstandings arising from the text. Consequently, the final
questionnaire was prepared adjusting the pre-test drawbacks, summarizing and changing the
statements of some of the questions, and eliminating some questions. Using the mailing list
provided by the university administrative departments, 450 emails were sent to university
students in Pisa including the survey link and a description of the aim of the study.
The response rate after two reminders was 47%. The group of participants included 120 males
and 86 females. Over 45% of participants were graduates. The highest percentage of students
(around 40%) was in the range of 26-29 years. Approximately 50% of the sample were living
in apartments, while 43% were renting a room, and the rest were in university dorms.
In order to overcome methodological biases based on survey techniques, several procedural
remedies were adopted. Because many researchers have highlighted social desirability as one
of the most common sources of bias affecting the validity of experimental and survey findings
(King and Bruner, 2000; Tourangeau and Yan, 2007) anonymity of respondents was
guaranteed. It was also investigated common method variance by performing Harman’s
single-factor test, which included all the variables in an exploratory factor analysis. A single
factor accounting for the majority of covariance among the variables indicates the common
25
method variance. The test revealed that no single factor accounted for the majority of variance
in the variables.
2.3.1 Measurements
For the purposes of our study, the energy-saving behaviour was measured from a twofold
perspective, in accordance with Barr et al. (2005). First, purchasing decisions were measured
using four different questions able to reflect the attitude or behaviour of an individual towards
energy- saving products.
The students were asked the following questions: 1) When buying electrical appliances, if I
could choose between energy-saving and conventional products, I would prefer energy-saving
products; 2) I try to buy products that save more energy; 3) I buy high efficiency light bulbs
to save energy. For each of these three behaviours, respondents reported “Always”=5,
“Almost always”=4, “Often”=3, “Rarely”=2, or “Never”=0 (See Appendix for more details).
The responses of the three purchasing behaviours were entered into a common factor analysis
and a reliable factor emerged to account for purchasing behaviour (Cronbach’s Alpha =
0.8618).
Second, energy-saving actions based on curtailment behaviour were measured as in Sutterlin
et al. (2011). Three everyday actions were listed and participants were asked how often they
carry out the following activities: 1) I turn off the light upon leaving a room; 2) I adjust room
temperature according to room usage; 3) I turn off standby appliances (e.g., TV, PC). For
each of these three actions, respondents reported “Always”=5, “Almost always”=4
“Often”=3, “Rarely”=2, or “Never”=1. The responses were summed to obtain an overall
curtailment behaviour index, which accounted for both the frequency and amplitude of an
individual’s energy-saving behaviour.
2.3.1.1 Independent variables
2.3.1.1.1 Level of trust in the information provided by different entities
Trust is a complex and multidimensional concept that can be applied across different levels of
analysis in the field of energy consumption and, as a consequence, measured in several ways
(Price and Arnould, 1999; Geyskens et al., 1998, Ashworth et al. 2011). For instance, the
importance of trust in the service provider was investigated by Price and Arnould (1999).
Hartmann and Ibanez (2007) investigated the impact of energy branding using two constructs:

26
familiarity with brand and its trustworthiness. Ashworth et al. 2011 investigated public trust in
energy technologies.
While some studies ask general ‘trust’ questions using various methods such as experiments,
interviews (Glaeser et al. 2000), some go beyond the general and focus on specific ‘trust’
behaviours. Similarly Rahbar and Abdul Wahid (2011) measured trust in eco-labels and eco-
brands by asking the following: “I am doubtful about the above logo” and “I am doubtful
about the eco-brand”. According to Rahbar and Abdul Wahid (2011) customer trust in
ecolabels and ecobrands and their perception of ecobrands show a positive and significant
impact on their actual purchase behaviour.
Similarly, the concept of trust has been analysed from a different perspective, that is the
reliability of information provided by different entities that are directly and indirectly related
to energy-saving issues. According to Sayogo et al. (2014), trust in the information regarding
product and certification is crucial for the adoption and use of smart disclosure tools that
make use of such information. They investigated the determinants of trust in sustainable
product information through a survey administered in Mexico and the United States, and
found that the reputation of brands and certificates are important in developing trust.
Following Darnall et al. (2012), the level of trust was measured by asking: “How much do
you trust the following bodies in providing you with reliable information on energy-saving
actions”. Respondents indicated the level of trust in local authorities, national governments,
the European Commission, environmental NGOs, scientists and friends/family using a 5
point Likert scale (“No trust at all”=1, “Little trust”=2, “Neither”=3, “Trust a little”=4, “Trust
wholly”=5). The responses in the three public institutions were entered into a common factor
analysis and one reliable factor emerged to account for trust in public institutions (Cronbach’s
Alpha =0.8276). This factor measures the extent to which the information provided by several
entities are perceived as credible and reliable by interviewees. Additionally, the trust in
information provided by private companies was measured by asking “How much do you trust
private companies that provide information on the energy efficiency of specific appliances”.
Respondents replied using the above mentioned Likert scale.
2.3.1.1.2 Personal norms
Subjective norms are widely considered as a relevant predictor of environmental behaviours.
Values, norms, and beliefs play a significant role in determining the actions of an individual
regarding energy-saving. Since there is a causal order between value, belief and personal

27
norms (Stern, 2000), and many studies have empirically demonstrated the reliability of VBN
theory (Stern et al. 1999), this study focused on the personal norms that influence the
adoption of an environmentally significant behaviour. Personal norms were measured by
asking respondents to express their level of agreement with the following four assertions: i) I
pay attention to energy consumption because I care about the environment; ii) I have a
responsibility to contribute to environmental preservation by using energy-saving products;
iii) I do not feel good when energy is consumed unnecessarily in the household (e.g. leaving
lights on in an unused room); iv) I feel personally obligated to avoid unnecessary energy
consumption wherever possible. For each of these four assertions, respondents reported
“Strongly agree”=5, “Agree” =4 “Neutral”=3, “Disagree”=2, or “Strongly disagree”=1. The
responses of the four assertions were entered into a common factor analysis and one reliable
factor emerged to account for purchasing behaviour (Cronbach’s Alpha =0.7953).
2.3.1.1.3 Personal Capabilities
Because of the analysis of factors influencing purchasing choices and energy-saving
behaviour also involves the consideration of various personal capabilities, a set of variables
was included that could affect the frequency and amplitude of the energy-saving actions by
individuals. Since many studies have found that the personal characteristics of an individual
can influence an individual’s environmental consciousness and, therefore turn into an energy-
saving behaviours (Karp, 1996; Mostafa, 2007; Tilikidou and Delistavrou, 2008; Chen and
Chai, 2010), variables measuring the age of the respondent, his/her level of education and
gender were included. Additionally, since the level of income may affect the decision to adopt
curtailment activities (Zimmer et al., 1994; Darnall et al., 2012), three different variables were
included in the model: level of household monthly income (0-1000€; 1000€-2000€; 2000€-
3500€; 3500€-5000€; above 5000€) the main source of income (family assistance; loan;
scholarship; salary), the role of financial resources in inducing specific behaviours (level of
agreement - from strongly disagree to strongly agree - to the following sentence: I primarily
pay attention to energy consumption in the household for financial reasons).
Finally, the political and religious orientation of the respondent (Costa and Kahn, 2010) and
his/her nationality were measured. The descriptive statistics and correlations for the study
variables are summarized in Table 2.1

28
Table 2.1: Correlation matrix and descriptive statistics (*, **, and *** indicate the significance at the 10%, 5%, and 1% levels, respective)
1) 2) 3) 4) 5) 6) 7) 8) 9) 10) 11) 12) 13) 14) 15) 16) 17)
1) Purchase 1.00
2) Curtailment 0.41*** 1.00
3) Personal norms 0.53*** 0.52*** 1.00
4) Trust institutions 0.35*** 0.15** 0.27*** 1.00
5) Trust NGOs 0.30*** 0.18** 0.29*** 0.58*** 1.00
6) Trust family and
friends
0.09 0.18** 0.03 0.06 0.19*** 1.00
7) Trust private sector 0.34*** 0.11 0.23*** 0.41*** 0.26*** 0.05 1.00
8)Financial motives 0.10 0.21*** 0.003 0.002 -0.08 -0.01 0.06 1.00
9) Age -0.21*** -0.11 -0.22*** -0.17** -0.13** -0.03 -0.07 -0.11 1.00
10) Gender -0.21*** -0.07 -0.18*** 0.06 -0.07 -0.18*** 0.05 -0.09 0.03 1.00
11) Education -0.17** -0.13* -0.14** -0.05 -0.07 0.04 -0.12* -0.01 0.29*** 0.10 1.00
12) Area of study -0.09 0.0006 -0.17** -0.11 -0.02 0.06 -0.03 0.07 0.11* -0.01 0.06 1.00
13) Nationality 0.01 -0.04 0.05 -0.15** -0.18*** -0.05 -0.03 -0.01 0.02 0.04 0.14** -0.08 1.00
14) Source of income -0.11 -0.06 -0.05 -0.07 -0.05 -0.03 -0.12* -0.07 0.44*** 0.08 0.36*** 0.02 0.018 1.00
15) Family income 0.19*** 0.24*** 0.23*** 0.05 0.08 -0.07 0.02 0.10 -0.14** -0.09 -0.22*** 0.07 -0.20*** -0.08 1.00
16) Conservative or
liberal
0.09 -0.01 0.03 0.05 0.09 -0.04 0.008 -0.09 0.15** -0.06 0.01 0.14 ** -0.008 0.07 0.10 1.00
17) Religious person 0.08 0.11* 0.05 0.01 -0.02 -0.004 0.16** 0.05 0.01 0.05 0.05 -0.06 -0.13* 0.15** 0.06 0.08 1.00
Mean 6.30 0 0 0 2.17 2.09 2.44 2.13 3.12 1.41 2.29 3.04 2.93 2.89 2.76 2.34 1.60
Standard deviation 3.13 .92 .89 .88 1.06 0.96 1.10 .91 1.04 0.49 0.68 1.90 2.48 1.02 1.14 .49
Min 0 -1.30 -1.29 -1.51 1 1 1 1 1 1 1 1 1 1 1.14 1 1
Max 14 2.64 3.46 2.14 5 5 5 5 6 2 3 7 8 4 1 4 2
N 213 213 213 199 199 200 200 213 206 206 206 206 206 206 206 206 205
29
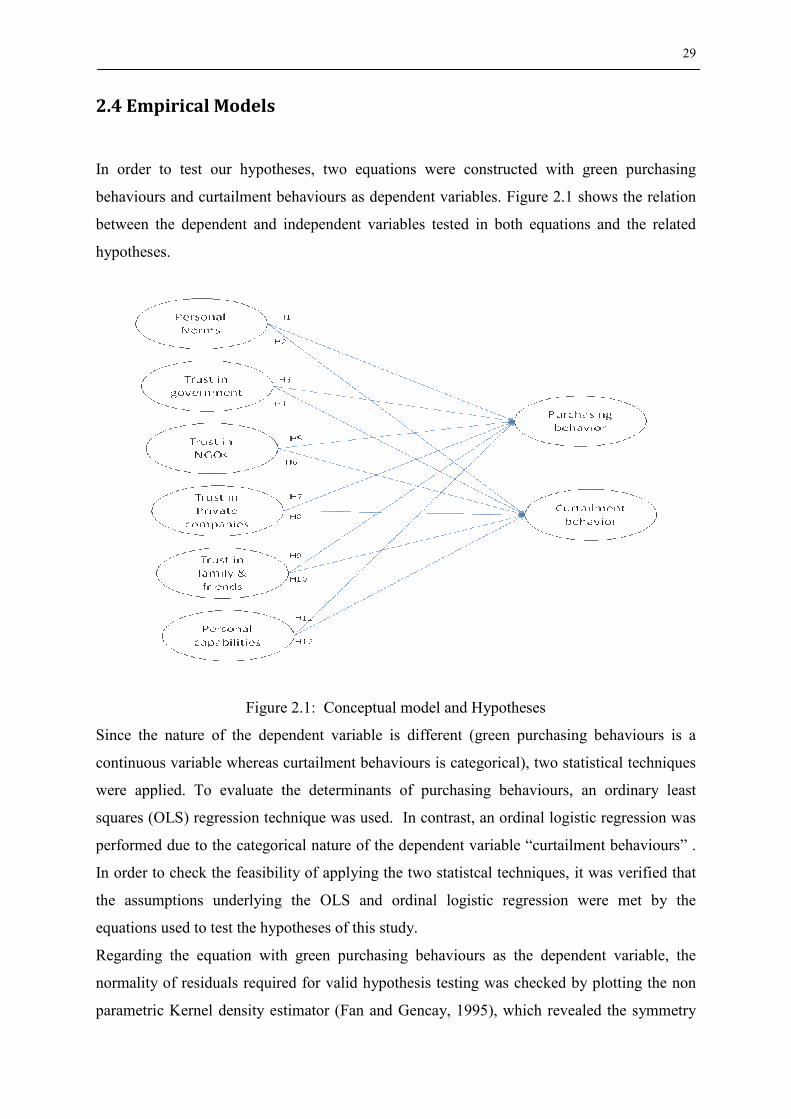
2.4 Empirical Models
In order to test our hypotheses, two equations were constructed with green purchasing
behaviours and curtailment behaviours as dependent variables. Figure 2.1 shows the relation
between the dependent and independent variables tested in both equations and the related
hypotheses.
Figure 2.1: Conceptual model and Hypotheses
Since the nature of the dependent variable is different (green purchasing behaviours is a
continuous variable whereas curtailment behaviours is categorical), two statistical techniques
were applied. To evaluate the determinants of purchasing behaviours, an ordinary least
squares (OLS) regression technique was used. In contrast, an ordinal logistic regression was
performed due to the categorical nature of the dependent variable “curtailment behaviours” .
In order to check the feasibility of applying the two statistcal techniques, it was verified that
the assumptions underlying the OLS and ordinal logistic regression were met by the
equations used to test the hypotheses of this study.
Regarding the equation with green purchasing behaviours as the dependent variable, the
normality of residuals required for valid hypothesis testing was checked by plotting the non
parametric Kernel density estimator (Fan and Gencay, 1995), which revealed the symmetry

30
of residual distribution. Secondly, the homogeneity of variance of the residuals was verified
by the Breusch-Pagan test, which is one of the main assumptions for the OLS regression
(Coin, 2006). The null hypothesis that the variance of the residuals is homogenous was not
significant, thus so it is possible to assume that there was no heteroskedasticity. Finally, a
regression specification error test was performed for omitted variables (Ramalho et al., 2011),
which revealed the absence of model specification errors.
Regarding the second equation with the dependent variable “curtailment behaviours”, the
assumptions were positively tested that the cumulative odds ratio for any two values of the
covariates was constant across response categories (Peterson and Harrel, 1990). A likelihood
ratio test was applied where the null hypothesis was that there was no difference in the
coefficients among models.
The presence of collinearity in both equations was also checked by computing the tolerance
and variance inflationary factor (VIF) for all variables. Low variance inflation factors (< 2.0)
and a VIF less than 5 revealed that that multicollinearity was not present in our empirical
model (O’Brien, 2007).
2.5 Results
In order to test our hypotheses, since energy-saving behaviour was measured from different
perspectives (Barr et al., 2005; Suterllin et al., 2011), two separate models were constructed:
a Curtailment energy- saving model (Model 1) and a Purchase-related energy-saving model
(Model 2) (Table 2.2).
31
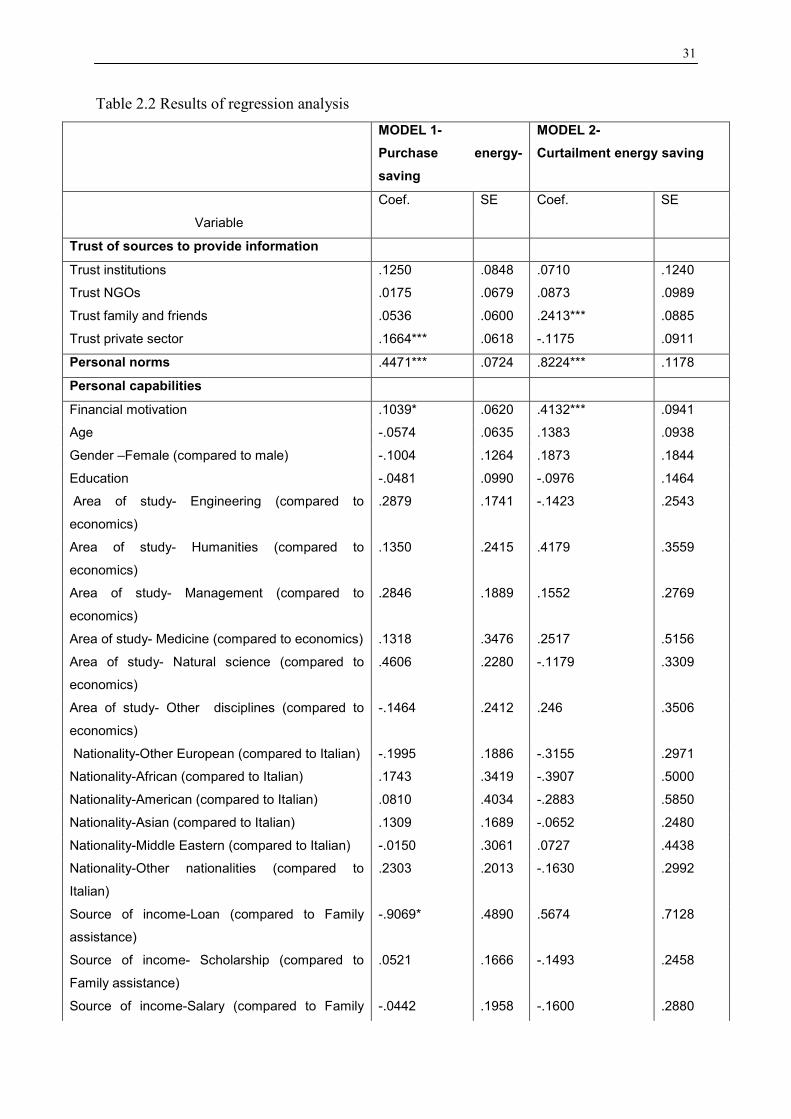
Table 2.2 Results of regression analysis
MODEL 1-
Purchase energy-
saving
MODEL 2-
Curtailment energy saving
Coef. SE Coef. SE
Variable
Trust of sources to provide information
Trust institutions .1250 .0848 .0710 .1240
Trust NGOs .0175 .0679 .0873 .0989
Trust family and friends .0536 .0600 .2413*** .0885
Trust private sector .1664*** .0618 -.1175 .0911
Personal norms .4471*** .0724 .8224*** .1178
Personal capabilities
Financial motivation .1039* .0620 .4132*** .0941
Age -.0574 .0635 .1383 .0938
Gender –Female (compared to male) -.1004 .1264 .1873 .1844
Education -.0481 .0990 -.0976 .1464
Area of study- Engineering (compared to
economics)
.2879 .1741 -.1423 .2543
Area of study- Humanities (compared to
economics)
.1350 .2415 .4179 .3559
Area of study- Management (compared to
economics)
.2846 .1889 .1552 .2769
Area of study- Medicine (compared to economics) .1318 .3476 .2517 .5156
Area of study- Natural science (compared to
economics)
.4606 .2280 -.1179 .3309
Area of study- Other disciplines (compared to
economics)
-.1464 .2412 .246 .3506
Nationality-Other European (compared to Italian) -.1995 .1886 -.3155 .2971
Nationality-African (compared to Italian) .1743 .3419 -.3907 .5000
Nationality-American (compared to Italian) .0810 .4034 -.2883 .5850
Nationality-Asian (compared to Italian) .1309 .1689 -.0652 .2480
Nationality-Middle Eastern (compared to Italian) -.0150 .3061 .0727 .4438
Nationality-Other nationalities (compared to
Italian)
.2303 .2013 -.1630 .2992
Source of income-Loan (compared to Family
assistance)
-.9069* .4890 .5674 .7128
Source of income- Scholarship (compared to
Family assistance)
.0521 .1666 -.1493 .2458
Source of income-Salary (compared to Family -.0442 .1958 -.1600 .2880

32
assistance)
Family income .0228 .0539 .1317* .0792
Political orientation-Conservative (compared to
liberal)
.0858 .2365 -.1844 .3475
Political orientation-Somewhere in the middle
(compared to liberal)
.0793 .1347 -.0922 .1975
Political orientation-None of them (compared to
liberal)
.2875* .1670 -.2687 .2476
Religious person .0518 .1217 .1908 .1801
Constant -.8865* .4831
N 198 198
LR chi2 -- ***
F Test *** --
Pseudo R2 -- 0.1837
R-squared 0.4679 --
First of all, Hypotheses 1 and 2 are supported, therefore, it is possible to state that consumers
with strong personal norms related to energy-saving issues are more likely to purchase
energy-saving products and to adopt curtailment behaviours. The results show that personal
norms are positively and statistically significant (p<.01) in explaining both purchase and
curtailment energy-saving behaviours (Model 1 & Model 2).
Secondly, the role of trust in several external institutions that provide information on energy
saving-related issues is not univocal. For instance, both our models, in contrast with the
evidence provided by Darnall et al. (2012), reveal that trust in NGOs and institutions (i.e.
government, local authorities and the EU Commission) does not seem to influence the
adoption of energy-saving behaviours. In both equations the coefficients are not significant,
therefore, Hypotheses 3, 4, 5 and 6 are not supported by the present study.
In contrast, trust in information provided by private companies is able to positively influence
consumer energy-saving behaviour. The most significant outcome of our purchase-related
model (Model 1) was that trust in private companies that provide information on energy
performance is positive and statistically significant (p<.01) in stimulating the purchase of
energy-saving products. Our model proves that consumers who show a higher level of trust in
the claims made by private companies regarding the environmental performance either of the
products they sell or of their own organization, are more likely to purchase energy-saving
products (such as light bulbs) from the same companies. However, trust in private companies

33
does not have the same influence on influencing curtailment energy saving behaviour,
therefore Hypothesis 7 is supported but not Hypothesis 8.
Trust in friends and family who provide information on energy saving actions was found to
be positive and statistically significant (p<.01) in determining a curtailment energy-saving
behaviour (Model 2), therefore Hypothesis 10 is supported. This outcome of our study
supports a recent stream in the literature suggesting that, when it comes to environment-
friendly daily behaviour, individuals are strongly influenced by the opinions and actions of
their family and friends (Sidiras and Koukios, 2004; Pickett-Baker and Ozaki, 2008) and that
habitudinal behaviours are mainly guided by good examples set by these key social actors.
The coefficient in Model 1 however is not significant, therefore, purchasing behaviour is not
driven by family and friends, and Hypothesis 9 is not supported.
Another notable finding of our study regards the Hypotheses 11 and 12, which are not
supported. Only one of the income-connected independent variables was found positively and
statistically significant in both models (Model 1 (p<.10) and Model 2 (p<.01)) when
explaining purchase and curtailment energy-saving behaviour. In terms of the relation
between energy-related issues and income, this is quite reasonable because of the direct
connection between an energy-saving behaviour (e.g., reducing energy use) and its direct and
immediate implications on economic savings. Similarly to our results, Martinsson, (2011)
found that people appear to pay attention to energy consumption because of financial reasons.
One last finding of our study rejects political orientation and religion as important personal
characteristics in explaining energy-saving behaviour. In both Models, neither political
orientation (people who do not consider themselves as either liberal or conservative), nor
religion affect purchasing and curtailment actions. Our results contrast Costa and Kahn
(2010), who found that the nudge had the intended effect of lowering energy consumption
among liberals, but the opposite effect among conservatives.
2.6 Discussion
The results of the model provide new and valuable insights in explaining the determinant
factors of energy-saving behaviours.
Our results highlight that personal norms are also key in explaining energy-saving behaviour,
both from the habitual and purchasing perspectives. This two-faceted outcome of the study,
emphasizing the role of informal relations and personal norms, totally confirms the VBN
34
theory, stating that pro-environmental personal norms are predictors of pro-environment
behaviour (Stern et al., 1999). In other words, people who feel responsible for increasing
energy demands, as well as people who feel personally obliged to avoid unnecessary
consumption, are also prone to save energy by undertaking both curtailment-and purchase-
related actions. These results confirm the findings of previous studies (Black et al., 1985;
Stern, 2000; Suterlin et al., 2011; Kanchanapibul et al., 2014) in which environmental
behaviour was demonstrated to be affected by beliefs and personal norms. A second finding
emerging from our purchase-related energy-saving model was the fact that trust in
information provided by private companies on environmental performance (e.g. through
claims regarding the energy efficiency of their products) is far more effective in determining
behavioural changes in shopping habits, e.g. compared to direct awareness-raising campaigns
carried out by trusted NGOs or public institutions. This outcome of the study presents a
dilemma both for policy makers and managers. Private companies, which are very often
perceived as being guilty of greenwashing, can rely on trust to influence consumption
attitudes and choices. NGOs and public institutions on the other hand, who have always been
considered as the most credible source of environmental information, are not able to directly
determine a change in energy-related behaviour. This result is quite interesting since it
reveals that the ability to directly induce behavioural change by the actors operating “out of
the market”, even if they are trusted, is actually quite weak. The outcome of our empirical
Models highlights that NGOs and public institutions are not deemed to play a role in guiding
consumer preferences and choices, or the habits of citizens with respect to energy-saving
behaviour. This is surprisingly inconsistent with the fact that many researchers have stressed
that “third parties” such as NGOs and public institutions are thought to be the most reliable
and trusted sources of environmental information and guarantees (Rodríguez-Barreiro et al.,
2013; Zsóka et al. 2013).
Trusting producers as a reliable source of information is also, in contrast, confirmed by our
model to be a key-driver for green consumption, more than many other related variables, e.g.,
socio-demographic aspects. This provides new insight into one of the most debated issues in
recent literature, fuelling the idea that every potential customer can become a green
consumer, regardless of his/her social and demographic background (Vicente-Molina et al.,
2013; Testa et al. 2013). This means that the so-called “green consumer” cannot be easily
classified in a well-defined sociological “profile” regarding his/her personal status and/or
demographical characteristics, as was believed in the past. In other words, socio-economic
factors such as education, age, nationality and, income, per se only explain a very small

35
portion of the energy-savings behaviour of an individual. In fact, all these variables are not
significantly correlated to any of the two energy-saving behaviours measured in our models.
A further important finding, was that curtailment behaviour in energy use is mostly driven by
good examples and by the influence exerted by informal relationships with very close social
actors, such as family and friends. Additionally, in contrast with recent studies (Yazdanpanah
and Forouzani, 2015), our study stresses that consumer choices too are favourably affected by
the opinions and actions of family and friends.
2.7. Conclusion
This work was based on primary data collected through a survey on students at the University
of Pisa, Italy, aimed at exploring factors that are able to influence energy-saving behaviours,
with a focus on both purchasing and curtailment behaviours. Overall, our study emphasizes
how personal norms and trust in information provided by private companies, on the one hand,
and family and friends, on the other, strongly influence the adoption of energy saving
purchases and curtailment behaviours.
How should policy makers and managers take all these findings into account? The results of
our study imply the need to rely on more indirect communication and engagement
approaches. The empirical results highlight that traditional communication campaigns aimed
at shifting citizen and consumer behaviours from unsustainable practices to more
environmental friendly actions, may be not so effective, at least for as long as the institutions
continue to be perceived as unreliable sources of environmental information. More innovative
means should be used to engage citizens or consumers. For instance, institutions and
environmental associations could consider partnering with energy-saving companies to
promote their innovative products on the market.
The role of friends and family in positively influencing curtailment and purchasing
behaviours emphasizes the importance of identifying target leaders in the design of
information and communication initiatives, who might be able to foster behavioural change
and “feed” personal norms. Education in schools typically responds to this need by teaching
energy-saving principles and methods that actively involve students. This would not only
help them to acquire ecological values, but also stimulates a discussion between classmates
and within their families, where informal relations and trust are at the highest levels.
The workplace is another good example of an informal context in which energy-saving
36
behaviour could be effectively enhanced by relying on both personal norms and familiar or
friendship relations. The experiences of energy management systems demonstrate that a
crucial factor in leveraging the actions that can lead to a continuous improvement in energy
performances is the involvement of employees. This is achieved essentially by behaviour-
based training initiatives, on the one hand, and norms and values, on the other.
Private companies could also play a pivotal role in developing the market demand for energy-
saving products. This means that managers should work on building the level of trust of
consumers in their communication and marketing strategies by providing credible and
scientifically-based information on environmental performance (e.g. energy saving,
efficiency, renewable energy, low carbon emissions linked to energy use). Energy, and in
general the environmental attributes of a product are usually affected by a non-symmetrical
distribution of information between producers and consumers. Therefore, in order to support
a more trustworthy relation between these two key actors, policy makers are focusing on
instruments that are able to remove misleading claims from the market. For instance, the
recent efforts by the European Commission to set a common methodology to communicate
the environmental and energy performance of any product by using a robust methodology
such as the PEF (Product Environmental Footprint) goes in the same direction and, therefore,
must be reinforced by supporting initiatives both at European and national/local levels.
Combating greenwashing is, in fact, the strongest possible action to defend the level of trust
that consumers have in producers and the information that they provide.
However, this represents an open field for future research.
Finally, some limitations of this study should be recognized. It is important to acknowledge
that the survey is based on students rather than on a representative sample of households and
their actual behaviours. This limitation, measured for example by the low variance in socio-
economic factors such as age and education, should be taken into consideration. Although
these variables explain a very small portion of the energy saving behaviour of individuals, in
future research it would be interesting to consider the relevance of socio economic factors by
analysing a broader socio-economic sample.
This study mainly focused on undergraduate students living in a university city, therefore the
interpretation of results should take this into consideration and no generalization can be
made. Third, it was used cross-sectional data which implies caution in the interpretation.
Future research using longitudinal data, although more complicated to collect and perform,
would be advisable. In order to assess the robustness of our conclusions, it would also be

37
desirable to replicate the study by enlarging the sample and involving other contexts outside
Italy. Further research should measure the concept of trust more deeply with alternative
measurement approaches. Finally, experimental studies using nudges (non price
interventions) to deepen the understanding of consumer and citizen energy-saving behaviour
are suggested.
38
References
Ajzen, I., 1988. Attitudes, personality and behavior. Milton Keynes: Open University Press.
Ajzen, I., 1991. The theory of planned behavior. Organizational behavior and human decision
processes. 50, 179-211.
Aarts, H., Dijksterhuis, A., 2000. The automatic activation of goal-directed behaviour: the case
of travel habit. Journal of Environmental Psychology. 20, 75–82.
Ashworth, P., Paxton, G., Carr-Cornish, S., 2011. Reflections on a process for developing
public trust in energy technologies: Follow-up results of the Australian large group process.
Energy Procedia. 4, 6322-6329.
Ball, J., 2013. The Experts: How Should Governments Encourage Energy Conservation?.
[online]17thApril. Available at:
http://online.wsj.com/news/articles/SB10001424127887324030704578426930656340990
[Accessed: 20 Oct 2013].
Barr, S., Gilg, A.W., Ford, N., 2005. The household energy gap: examining the divide between
habitual-and purchase-related conservation behaviours. Energy Policy. 33, 1425-1444.
Black, J.S., Stern, P.C., Elworth, J.T., 1985. Personal and contextual influences on househould
energy adaptations. Journal of Applied Psychology. 70, 3–21.
Blomqvist, K., 1997. The many faces of trust. Scandinavian Journal of Management. 13, 271-
286.
Bonini, S.M., Hintz, G., Mendonca, L.T., 2008. Addressing consumer concerns about climate
change. McKinsey Quarterly. 2, 52.
Castaldo, S., Perrini, F., Misani, N., Tencati, A., 2009. The missing link between corporate
social responsibility and consumer trust: The case of fair trade products. Journal of Business
Ethics. 84, 1-15.
Chen, T.B., Chai, L.T., 2010. Attitude towards the Environment and Green Products:
Consumers' Perspective. Management Science & Engineering. 4, 27-39.
Coin, D., 2006. Testing the normality of errors in regression models with a forward approach.
Economics Letters. 92, 323-329.
Costa, D.L., Kahn, M.E., 2013. Energy conservation “nudges” and environmentalist ideology:

39
Evidence from a randomized residential electricity field experiment. Journal of the European
Economic Association 11, 680-702.
Cullis, J., Jones, P., Savoia, A., 2012. Social norms and tax compliance: Framing the decision
to pay tax. The Journal of Socio-Economics 41, 159– 168.
Darnall, N., Ponting, C., Vazquez-Brust, D.A., 2012. Why consumers buy green. In Green
growth: Managing the transition to a sustainable economy (pp. 287-308). Springer
Netherlands.
Ek, K., Söderholm, P., 2008. Norms and economic motivation in the Swedish green electricity
market. Ecological Economics 68, 169-182.
Rahbar, E., Abdul Wahid, N., 2011. Investigation of green marketing tools' effect on
consumers' purchase behavior. Business Strategy Series. 12, 73 - 83
Fan, Y., Gencay, R., 1995. A consistent nonparametric test of symmetry in linear regression
models. Journal of the American Statistical Association. 90, 551-557.
Gadenne, D., Sharma, B., Kerr, D., Smith, T., 2011. The influence of consumers'
environmental beliefs and attitudes on energy saving behaviours. Energy Policy 39, 7684-
7694.
Gan, L., 2000. Energy development and environmental NGOs: The Asian perspective, in:
Shasek, P. C., (Eds.), The global environment in twenty first century: Prospect for
international cooperation. United Nations University Press Book, New York, 109–125.
Geyskens, I., Steenkamp, J.B.E.M., Kumar, N., 1998. Generalizations about trust in marketing
channel relationships using meta-analysis. International Journal of Research in Marketing
15, 223–248.
Glaeser, E.L., Laibson, D.I., Scheinkman, J.A., Soutter, C.L., 2000. Measuring trust. Quarterly
Journal of Economics, 811-846.
Gram-Hanssen, K., Kofod, C., Nærvig Petersen, K., 2004. Different everyday lives: Different
patterns of electricity use. 2004 ACEEE Summer study on energy efficiency in buildings, 1-
13.
Guagnano, G.A., Stern, P.C., Dietz, T., 1995. Influences on attitude-behavior relationships a
natural experiment with curbside recycling. Environment and Behavior 27, 699-718.
Guerin, D.A., Yust, B.L., Coopet, J.G., 2000. Occupant predictors of household energy

40
behavior and consumption change as found in energy studies since 1975. Family and
Consumer Sciences Research Journal 29, 48-80.
Gynther, L., Mikkonen, I., Smits, A., 2012. Evaluation of European energy behavioural change
programmes. Energy Efficiency 5, 67-82.
Hagen, J. M., Choe, S., 1998. Trust in Japanese interfirm relations: Institutional sanctions
matter. Academy of Management Review. 23, 589-600.
Hartmann P., Ibanez, V.A., 2007. Managing customer loyalty in liberalized residential energy
markets: The impact of energy branding. Energy Policy. 35, 2661–2672
Hori, S., Kondo, K., Nogata, D., Ben, H., 2013. The determinants of household energy-saving
behavior: Survey and comparison in five major Asian cities. Energy Policy. 52, 354-362.
Ibáñez, V.A., Hartmann, P., Calvo, P.Z., 2006. Antecedents of customer loyalty in residential
energy markets: Service quality, satisfaction, trust and switching costs. The Service Industries
Journal. 26, 633-650.
IEA, (2008). World Energy Outlook. International Energy Agency, Paris.
Jackson, T., 2005. Motivating sustainable consumption: a review of evidence on consumer
behaviour and behavioural change: a report to the Sustainable Development Research
Network. Centre for Environmental Strategy, University of Surrey.
Kanchanapibul, M., Lacka, E., Wang, X., Kai Chan, H., 2014. An empirical investigation of
green purchase behaviour among the young generation. Journal of Cleaner Production. 66,
528-536
Karp, D.G., 1996. Values and their effect on pro-environmental behavior. Environment and
behavior. 28, 111-133.
Keirstead, J., 2006. Evaluating the applicability of integrated domestic energy consumption
frameworks in the UK. Energy Policy. 34, 3065-3077.
King, M.F., Bruner, G.C., 2000. Social desirability bias: A neglected aspect of validity testing.
Psychology & Marketing 17, 79-103.
Knott, D., Muers, S., Aldridge, S. 2008. Achieving Culture Change: A Policy Framework: a
Discussion Paper by the Strategy Unit. Cabinet Office, Strategy Unit.
Lee, K., 2008. Opportunities for green marketing: young consumers. Marketing intelligence &
planning. 26, 573-586.

41
López-Mosquera, N., Sánchez, M., 2012. Theory of Planned Behavior and the Value-Belief-
Norm Theory explaining willingness to pay for a suburban park. Journal of Environmental
Management. 113, 251-262.
Maréchal, K., 2009. An evolutionary perspective on the economics of energy consumption: the
crucial role of habits. Journal of Economic Issues. 43, 69-88.
Martinsson, J., Lundqvist, L.J., Sundström, A., 2011. Energy saving in Swedish households.
The (relative) importance of environmental attitudes. Energy Policy, 39, 5182-5191.
Martiskainen, M., 2007. Affecting consumer behaviour on energy demand. Sussex: SPRU–
Science and Technology Policy Research, 81.
Mayer, R.N., Scammon, D.L., Zick, C.D., 1993. Poisoning the well: do environmental claims
strain consumer credulity?. Advances in Consumer Research, 20, 698-703
Mitchell, C., Woodman, B., 2010. Towards trust in regulation—moving to a public value
regulation. Energy Policy, 38, 2644-2651.
Mostafa, M.M., 2007. Gender differences in Egyptian consumers’ green purchase behaviour:
the effects of environmental knowledge, concern and attitude. International Journal of
Consumer Studies, 31, 220-229.
O’brien, R.M., 2007. A caution regarding rules of thumb for variance inflation factors. Quality
& Quantity. 41, 673-690.
Oikonomou, V., Becchis, F., Steg, L., Russolillo, D., 2009. Energy saving and energy
efficiency concepts for policy making. Energy Policy. 37, 4787-4796.
Peattie, K., Crane, A., 2005. Green marketing: legend, myth, farce or prophesy?. Qualitative
Market Research: An International Journal. 8, 357-370.
Perrini, F, Castaldo, S., Misani, N. Tencati, A., 2010. The impact of corporate social
responsibility associations on trust in organic products marketed by mainstream retailers: a
study of italian consumers. Business Strategy and the Environment, 19, 512–526
Peterson, B., Harrell Jr, F.E., 1990. Partial proportional odds models for ordinal response
variables. Applied Statistics. 39, 205-217.
Pickett-Baker, J., Ozaki, R., 2008. Pro-environmental products: marketing influence on
consumer purchase decision. Journal of consumer marketing. 25, 281-293.
42
Price, L.L., Arnould, E.J., 1999. Commercial friendships: service provider–client relationships
in context, Journal of Marketing. 63, 38–56.
Ramalho, E.A., Ramalho, J.J., Murteira, J.M., 2011. Alternative estimating and testing
empirical strategies for fractional regression models. Journal of Economic Surveys, 25, 19-68.
Rayner, S., 2010. Trust and the transformation of energy systems. Energy Policy, 38, 2617-
2623.
Rex, E., Baumann, H., 2007. Beyond ecolabels: what green marketing can learn from
conventional marketing. Journal of Cleaner Production. 15, 567-576.
Rivera, J., De Leon, P., 2004. Is greener whiter? Voluntary environmental performance of
western ski areas. Policy Studies Journal, 32, 417-437.
Roberts, J.A., 1995. Profiling levels of socially responsible consumer behavior: a cluster
analytic approach and its implications for marketing. Journal of Marketing Theory and
Practice, 97-117.
Roberts, J.A., 1996. Green consumers in the 1990s: profile and implications for advertising.
Journal of Business Research, 36, 217-231.
Rodríguez-Barreiro, L.M., Fernández-Manzanal, R., Serra, L.M., Carrasquer, J., Murillo, M.B.,
Morales, M.J., Calvo, J.M., del Valle, J., 2013. Approach to a causal model between attitudes
and environmental behaviour. A graduate case study. Journal of Cleaner Production. 48, 116-
125
Sayogo, D. S., Zhang, J., Liu, H., Picazo-Vela, S., Luna-Reyes, L., 2014. Examining trust as
key drivers in smart disclosure for sustainable consumption: the case of I-choose. In
Proceedings of the 15th Annual International Conference on Digital Government Research
(pp. 137-146). ACM.
Sardianou, E., 2007. Estimating energy conservation patterns of Greek households. Energy
Policy. 35, 3778-3791.
Schoorman, F.D., Mayer, R.C., Davis, J.H., 2007. An integrative model of organizational trust:
Past, present, and future. Academy of Management Review, 32, 344-354.
Sidiras, D.K., Koukios, E.G., 2004. Solar systems diffusion in local markets. Energy Policy.
32, 2007-2018.
Stephenson J., Barton B., Carrington G., Gnoth D., Lawson R., Thorsnes, P., 2010. Energy

43
cultures: A framework for understanding energy behaviours. Energy Policy, 38, 6120-6129.
Stern, P.C., 1992. What psychology knows about energy conservation. American Psychologist.
47, 1224.
Stern, P.C., Dietz T., Abel T., Guagnano, G.A., Kalof, L., 1999. A value-belief-norm theory of
support for social movements: The case of environmental concern. Human Ecology Review 6,
81–97.
Stern, P.C., 2000. New environmental theories: toward a coherent theory of environmentally
significant behavior. Journal of social issues, 56(3), 407-424.
Stern, P.C., Fineberg, H.V., (eds), 1996. Understanding risk: Informing decisions in a
democratic society. Washington DC: National Academy Press.
Straughan, R.D., Roberts, J.A., 1999. Environmental segmentation alternatives: a look at green
consumer behavior in the new millennium. Journal of Consumer Marketing. 16, 558-575
Sütterlin, B., Brunner, T.A., Siegrist, M., 2011. Who puts the most energy into energy
conservation? A segmentation of energy consumers based on energy-related behavioral
characteristics. Energy Policy. 39, 8137-8152.
Testa, F., Iraldo, F., Tessitore, S., Frey, M., 2011. Strategies and approaches green advertising:
an empirical analysis of the Italian context .International Journal of Environment and
Sustainable Development. 10, 375-395.
Testa, F., Iraldo, F., Vaccari, A., Ferrari, E., 2015. Why Eco‐labels can be Effective Marketing
Tools: Evidence from a Study on Italian Consumers. Business Strategy and the Environment.
24, 252–265
Tilikidou, I., 2007. The effects of knowledge and attitudes upon Greeks' pro‐environmental
purchasing behaviour. Corporate Social Responsibility and Environmental Management. 14,
121-134.
Tjernström, E., Tietenberg, T., 2008. Do differences in attitudes explain differences in national
climate change policies? Ecological Economics. 65, 315-324.
Tourangeau, R., Yan, T., 2007. Sensitive questions in surveys. Psychological bulletin, 133,
859-883.
Tukker ,A., Huppes, G., Guinée, J., Heijungs, R., de Koning, A., van Oers, L., Suh, S.
Geerken, T., Van Holderbeke, M., Jansen, B., Nielsen, P., 2006. Environmental Impact of

44
Products (EIPRO), Analysis of the life cycle environmental impacts related to the final
consumption of the EU-25, Main Report, IPTS/ESTO project Available at:
www.wwf.org.uk/filelibrary/pdf/innovationreport.pdf [Accessed: 20 April 2015].
Vicente-Molina, M.A., Fernández-Sáinz, A., Izagirre-Olaizola, J., 2013. Environmental
knowledge and other variables affecting pro-environmental behaviour: comparison of
university students from emerging and advanced countries. Journal of Cleaner Production. 61,
130-138
Wilson, C., Dowlatabadi, H., 2007. Models of decision making and residential energy use.
Annu. Rev. Environ. Resour. 32, 169-203.
Yazdanpanah, M., Forouzani, M., 2015. Application of the Theory of Planned Behaviour to
predict Iranian students' intention to purchase organic food, Journal of Cleaner Production.
dx.doi.org/10.1016/j.jclepro.2015.02.071
Young, W., Hwang, K., McDonald, S., Oates, C.J., 2010. Sustainable consumption: green
consumer behaviour when purchasing products. Sustainable Development 18, 20-31.
Zhang X.P., Cheng X.M., 2009. Energy consumption, carbon emissions, and economic growth
in China. Ecological Economics. 68, 2706–2712.
Zimmer, M.R., Stafford, T.F., Stafford, M.R., 1994. Green issues: dimensions of environmental
concern. Journal of Business Research, 30, 63-74.
Zsóka Á, Szerényi, Z.M., Széchy, A., Kocsis, T., 2013. Greening due to environmental
education? Environmental knowledge, attitudes, consumer behavior and everyday pro-
environmental activities of Hungarian high school and university students. Journal of Cleaner
Production. 48, 126-138
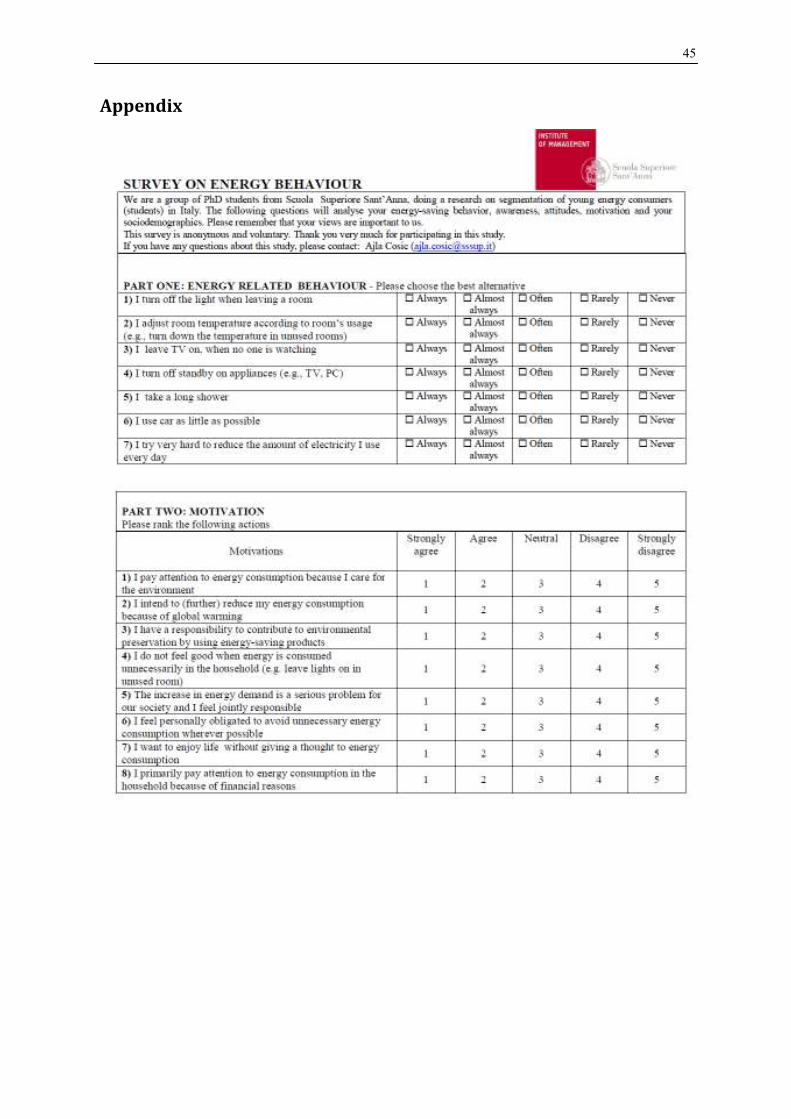
45
Appendix
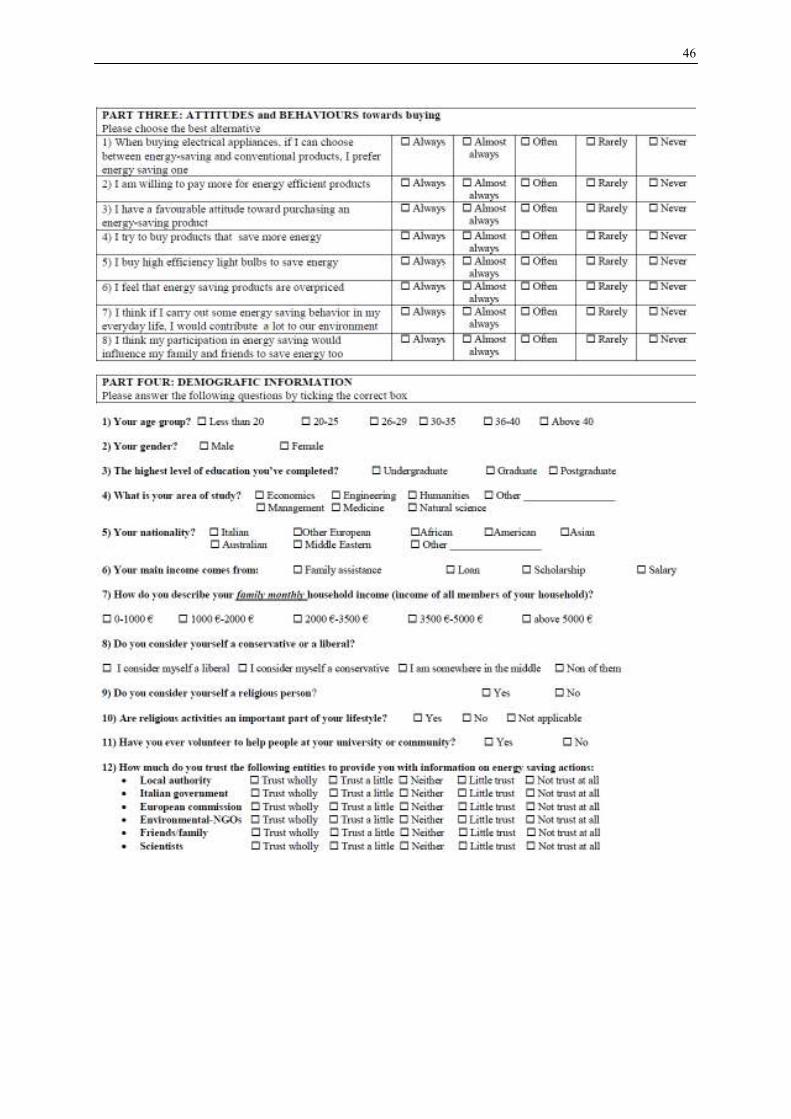
46

47
48
3
Can Nudges Affect Students’ Green
Behaviour? - A Field Experiment2
Abstract
Ecological behaviour is impeded both by financial and behavioural hurdles. A growing
literature in behavioural economics and psychology suggests the use of non-price
intervention nudges over other monetary incentives. We analyse whether nudges are indeed
efficient in promoting recycling of resources among young people, and whether the
combination of different types of nudges serve as better instruments. The study was
performed on primary data from both a survey and field experiment conducted among
university students in Pisa over a 60-day span (from October to December 2013). We
collected data on 1849 instances of plastic cup recycling at a coffee vending machine at the
Scuola Superiore Sant’Anna in Pisa. Recycling behaviour was measured by the number of
plastic cups disposed in the proper dustbin, observed at the end of each day. Results of the
experimental treatments showed a significant improvement in the amount of recyclable cups
when a combination of nudges was applied. In addition to the empirical analysis, the paper
further analytically replicates the results and illustrates the effect of a change in perception
(awareness raising) of individuals, a shift in the social norm, as well as an ‘easy to do’ nudge.
Keywords: green behaviour; nudge; experiment; behavioural change; policy.
2 This is a joint project with Sebastian Ille and Hana Cosic.

49
3.1 Introduction
As the world’s human population is constantly growing, only few places on the globe
escaped the pervasive impact of our species. Many of the world’s most difficult conservation
problems result either directly or indirectly from people’s everyday behaviour, contributing to
air and water pollution, land degradation, deforestation, loss of water resources and climate
change (Akerlof and Keneddy, 2013). The promotion of a sustainable use of natural resources
and change of people’s behaviour is one of the most important long-term social and policy
challenges which our planet is facing.
Though awareness and readiness to recycle increased in Italy over the past years, a large
number of consumers still refuses to dispose recyclable waste in stipulated containers. Even
those Italians, who are willing to alleviate the environmental costs and the challenges of
climate change, are discouraged to do so after the scandal of the Campania region hit the
news (i.e., Mayr, 2014).3 Although the Italian legislation attended the issue of waste disposal
in 2001, the industry preferred (and still prefers) paying the Italian mafia for avoiding the cost
of proper waste disposal. In addition to Italians being unaware of the necessity to recycle, this
circumstance offers an excuse for those unwilling to dispose their waste properly and, at the
same time, renders those insecure, who wish to contribute to environmental recovery.
While Italian public authorities provide proper waste collection schemes, Italy is still in need
of a mechanism that promotes their acceptance and participation of citizens. A functioning
mechanism has to go beyond legal measures or monetary incentives, and has to address three
factors influencing recycling behaviour: awareness, attitudes and structural barriers (Shaw et
al. 2007). Traditional policies of raising awareness and price-based as well as technology-
based approaches turned out to be ineffective. Pertinent literature (e.g., Allcott and
Mullainathan, 2010; Johnson and Goldstein, 2003; Thaler and Benartzi, 2004) suggests that
behavioural approaches, which appeal to social norms, commitment devices, and default
options, can be very powerful in changing behaviour.
A growing literature on behavioural economics and psychology recommends using non-price
interventions via ‘nudges’(e.g., Sunstein and Thaler, 2003; Thaler and Sunstein, 2008). A
3The Camorra (the local mafia) has discovered illegal waste disposal in the Campania region to be a lucrative
business. Factory operators in the industrial north paid the Camorra a fractional amount of what an adequate disposal would have cost. As a result, not only did cancer and death rates increase, but also high levels of toxins have been found in mozzarella cheese. See http://www.theguardian.com/world/2004/oct/14/italy.sophiearie

50
nudge is defined as a “helping hand” that will lead someone to make better decisions both for
oneself and for the public welfare. The concept of nudges (Thaler and Sunstein, 2008)
suggests a policy of libertarian paternalism, favouring simplicity, effectiveness and a
relatively low cost of implementation. As suggested by Sunstein and Thaler (2003),
'libertarian' aspect refers to the necessity of respecting everyone's freedom to act, decide or
even change their minds as it suits them.
This paper contributes to the literature on nudges as policy-making interventions, by testing
whether nudges can affect young consumers’ pro-environmental behaviour. We examine the
efficiency of specific nudges, which promote recycling. In addition, we study the effect of
combining nudges (in our case a social norm nudge with an 'easy to do' nudge), as well as the
long lasting effect of nudges on pro-environmental behaviour.
Following an overview of the current literature in the next section, the paper develops an
analytical model from which we derive hypotheses. The fourth section illustrates the
methodology used to test these hypotheses. Section 5 analyses the empirical results and
compares these to our hypotheses. Section 6 concludes.
3.2 Literature overview
Many studies show that appealing to social norms can affect individual behaviour (Cialdini,
Reno and Kallgren, 1990; Cialdini, Goldstein and Griskevicius, 2008). People may follow
others due to social penalties for non-compliance, or because they believe that others may
have better and different information about benefits. Additionally, individuals conform to a
norm of pro-social behaviour in order to signal benevolent intentions.
Cialdini and Griskevicius (2008), partnered with a hotel in Arizona to encourage guests to
reuse their towels. In this field experiment, researchers signalled to guests that a majority of
other hotel guest reuse their towels and ended with the message “Join Your Fellow Guests in
Helping to Save the Environment”. Inducing reutilization as a social norm, increased towel
recycling by 34 percent. Similarly, Allcott (2011) conducted a field experiment on energy
conservation and used social norms. Together with a company called OPOWER, home
energy use reports were mailed to consumers. Reports included information on how to
conserve energy, as well as social comparisons between a household's energy use and that of
its neighbours. This monthly program reduced energy consumption by 1.9 to 2.0 percent. In
the context of environmental protection, nudges implemented by Goldstein, Cialdini and
51
Griskevicius (2008) and Alcott (2011) have provided supportive evidence that appealing to
social norms can affect an individual behaviour.
Results of a recent body of research on default options in many different areas such as
pension savings plan, organ donations, retail electricity supplier, show that people rarely
choose to switch from a default option (e.g., Johnson and Goldstein, 2003; Alcott, 2011).
Some programs obtained strong results by using a default option. In order to tackle the
problem of inadequate pension saving in defined contribution plans, Thaler and Benartzi
(2004) developed the plan “Save More Tomorrow” (SMT). This plan had components of
default options and as a result, employees' average savings were increased by 400 percent.
Moreover, Madrian and Shea (2001) found that participation rates in a corporate pension
savings plan increased from 65 percent to 98 percent after the default option was changed
from non-enrolment to enrolment. Similar results are observed in the context of organ
donations in the European Union countries. Johnson and Goldstein (2003) examined the rate
of agreement to become a donor across European countries and illustrated that defaults
appear to make a significant difference. In countries, in which donation was a default, rates
to opt-out of the organ's donation program was much lower compared to countries where opt-
in was required.
Regarding the impact of raising awareness of end users on their willingness to recycle,
Miranda and Blanco (2010) showed that environmental awareness is still the main factor,
which influences paper recovery in European countries. According to Miranda and Blanco
(2010), a large variety of tools are available for promoting the development of awareness,
based on improving information and educational advertising. The better people are informed
about the impact of recycling, the more likely they are willing to comply and the more
satisfied they are with their choice to recycle.
The Waste and Resources Action Programme UK (WRAP UK, 2012) suggests that greater
public awareness of recycling avenues can be achieved through a number of good practice
measures, such as the provision of marketing materials or by developing public engagement.
The Department for Environment, Food and Rural Affairs UK (DEFRA, 2008) has defined
producers, consumers, retailers, local authorities and the waste management industry as key
stakeholders, but emphasised that governments should focus on communicating policy targets
to individuals and households by using awareness raising and policy interventions.

52
3.3 Model
Based on Shaw et al. (2007), three factors determine recycling behaviour: awareness,
attitudes, and structural barriers. Consequently, we address these factors via a number of
different nudges: raising consciousness, conformity, and improving accessibility.
Consciousness raising makes people aware that certain garbage is recycled and that only a
small change in one’s action can make a difference for the environment. The conformity
effect can be channelled to induce an external norm and point of reference by illustrating
behaviour of an influential reference group. Accessibility can be improved by allowing
individuals to recycle in such a way that following the habitual pattern of action is in fact
correct behaviour (e.g., by switching the default). This lowers cognitive requirements needed
to make a correct decision (i.e., which bin has to be chosen?). Similarly, reducing structural
barriers by improving accessibility reduces the cost of the act of recycling. Oftentimes the
cognitively least demanding action is also the least physically demanding (e.g., the biggest
trash bin) and we will thus not differentiate between an effect enhancing cognitive
accessibility and one which improves physical accessibility.
In order to keep the model as simple as possible, we assume that individuals have only the
choice between choosing an action or refraining from it, and neglect the intermediate case in
which individuals more or less sporadically choose this action. Our hypothetical population
can be thus grouped into recyclers and non-recyclers. Assume that each individual has the
same pay-off function (note: we can consider this as averages, it is easy to extend the model
with individually varying parameters, yet the dynamics and thus results will remain
identical). Define the pay-off of the first type by and the latter by .
If the expected pay-off from not recycling is smaller than the pay-off received from
recycling, individuals will choose to throw recyclable garbage into the recycling bin. They
will not do so if not recycling bears a higher pay-off. Thus, an equilibrium occurs when both
pay-offs are identical, i.e. at
πr= πrn (1)
We can generally assume that individuals receive a benefit from getting rid of their garbage
that is common for recyclers and non-recyclers, and we set this equal to a positive constant σ.
In addition, a non-recycler bears a social cost by throwing waste into the wrong bin, which
might be observed by others. Clearly, this cost depends on the intrinsic values of an
individual, but also on the existing social norm and should be monotonously increasing in the

53
number of recycler the individual observes. Let the frequency of recyclers be p ∈ (0, 1).
Conformism defines the predisposition of an individual to be more likely to adopt the strategy
of a member of the majority. In the presence of conformism, the literature has suggested that
the individual probability of adopting a strategy has an s-shaped relationship with the
frequency with which this strategy is adapted by others in the society (Boyd & Richerson,
1985; Bowles, 2006; Eriksson et al., 2007). This implies that for a frequency of recyclers
below the saddle point, an individual is less likely to go for recycling than the current average
of the population. Above the saddle point, the individual is more likely to recycle. This
condition can be interpreted as an individual bearing a lower social cost of not recycling, if he
does not observe a majority of others who recycle. A social or intrinsic cost of not recycling
can thus be considered to be equivalently s-shaped. The stronger the cost is s-shaped, the
larger is the critical number of players required to make an impact on the social cost of a non-
complying individual. For simplicity, we can normalise the maximum social cost to one. The
minimum social cost in the absence of any recycler lies at a ∈ (0, 1]. Let the social / intrinsic
cost be defined by
(2)
The derivation of this function is straightforward but will be illustrated in the appendix.
Parameter defines the minimum social pressure (or intrinsic motivation) that is exercised in
the absence of any recyclers (i.e., the intercept at the axis of ordinates), indicates the
reactivity to social pressure (for lower values the costs is more linear and for higher values
more s-curved). Parameter defines the sensitivity/bias to social pressure (lower
values move the saddle point to the left of 0.5 and higher values to the right).
The act of recycling is, however, also costly. Costs are partly caused by the action to separate
the waste (the cognitive cost of choosing the right bin) and in addition, by the requirement to
place the object in a small bin that is increasing difficult and repugnant the more plastic trash
is put inside that bin. We have a cost function of the simplest form.
ρ(p) = kp+ d (3)
where defines the cost of separation (i.e., the cost of making a choice and choosing the right
bin) and indicates the marginal cost increment with each piece of plastic placed into the
bin.4
4In the empirical study, we experienced that once some plastic cups were in the small yellow bin, it is dirty and
difficult to squeeze more in.
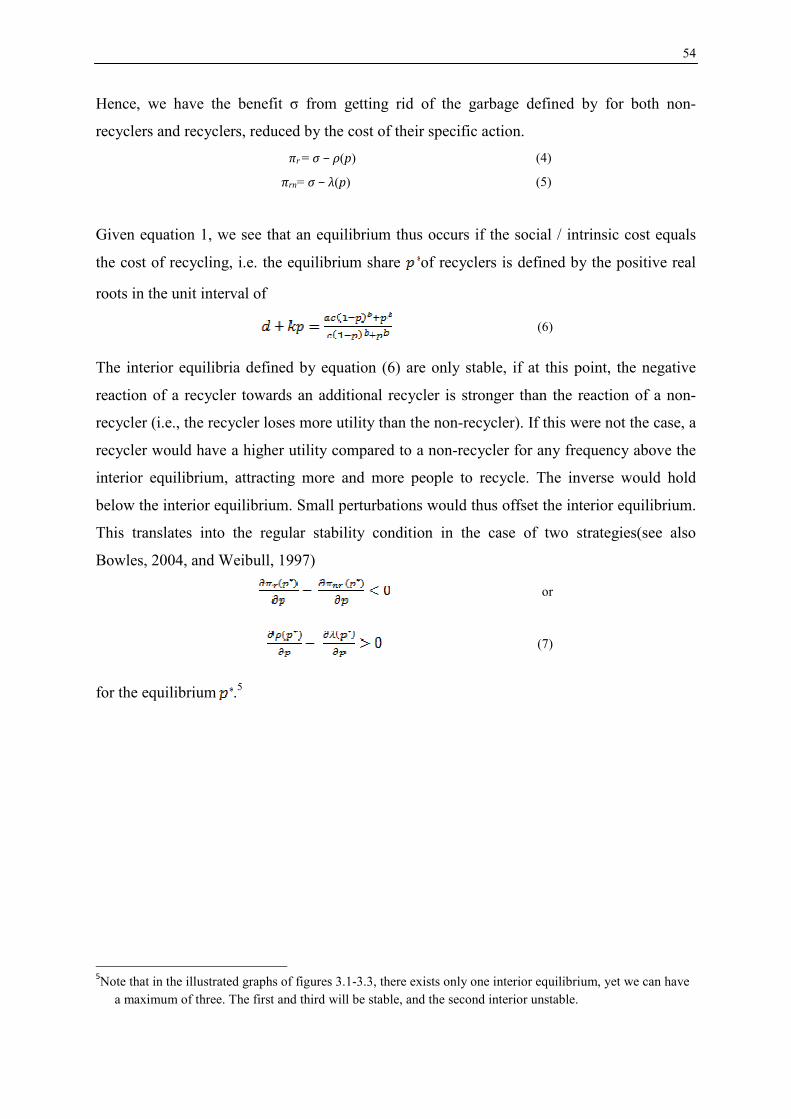
54
Hence, we have the benefit σ from getting rid of the garbage defined by for both non-
recyclers and recyclers, reduced by the cost of their specific action.
πr = σ − ρ(p) (4)
πrn= σ − λ(p) (5)
Given equation 1, we see that an equilibrium thus occurs if the social / intrinsic cost equals
the cost of recycling, i.e. the equilibrium share of recyclers is defined by the positive real
roots in the unit interval of
(6)
The interior equilibria defined by equation (6) are only stable, if at this point, the negative
reaction of a recycler towards an additional recycler is stronger than the reaction of a non-
recycler (i.e., the recycler loses more utility than the non-recycler). If this were not the case, a
recycler would have a higher utility compared to a non-recycler for any frequency above the
interior equilibrium, attracting more and more people to recycle. The inverse would hold
below the interior equilibrium. Small perturbations would thus offset the interior equilibrium.
This translates into the regular stability condition in the case of two strategies(see also
Bowles, 2004, and Weibull, 1997)
or
(7)
for the equilibrium .5
5Note that in the illustrated graphs of figures 3.1-3.3, there exists only one interior equilibrium, yet we can have
a maximum of three. The first and third will be stable, and the second interior unstable.

55
Figure 3.1: Dynamics of the control group: a = 0.2, b = 1.5, c = 2.0, k = 1.3, and d = 0.1.
As a reference, figure 3.1 illustrates a control situation, in which less than 10 percent of all
students are recycling. This equilibrium is stable since the slope of the cost of recycling is
steeper than that of the social cost function, i.e. .
As argued above, we would like to analyse an effect that operates on the level of awareness
(consciousness raising) and exercises pressure of conformity by setting a higher external
social norm of recycling. The first has an effect on the sensitivity to social pressure in the
form of decreasing . The second shifts up the minimum social pressure, thus increasing .
The result is illustrated in figure 3.2, in which we see that the interior stable equilibrium shifts
up to roughly 40 percent.
Figure 3.2: Dynamics of treatment 1: a = 0.4, b = 1.5, c = 1.0, k = 1.3, and d = 0.1.
Furthermore, we would like to analyse the effect of an easy-to-do nudge (i.e., reassigning the
larger bin as the one appropriate for recyclable material). As argued above, this reduces the
cognitive cost of making the correct choice, since this is the most intuitive bin. It also reduces

56
the physical cost of placing garbage inside and thus the barrier to recycling. Hence, we can
expect a reduction both in k and d. Figure 3.3 shows such an effect. Here, both cost functions
intersect at a frequency of recyclers close to one.
Figure 3.3: Dynamics of treatment 2: a = 0.4, b = 1.5, c = 1.0, k = 1.0, and d = 0.0, functions
intersect at a frequency of recyclers at one.
From this simple analytical model we can thus derive the following hypotheses:
H1: Using a non-price intervention nudge (social norm) combined with an awareness-raising
message positively influences recycling behaviour by affecting awareness and attitude.
H2: Using a non-price intervention - an 'easy to do' nudge - positively affects recycling
behaviour by improving cognitive and physical accessibility.
H3: Using these two nudges jointly will positively affect recycling behaviour more than if
only a single nudge is applied.
These hypotheses will be tested and analysed in the remaining parts of this article.
3.4 Methods
We studied primary data from both a survey and field study conducted among university
students in Pisa, in order to study independently both stated and revealed preferences. The
reason was to see whether or not individual's stated preferences correspond to revealed
(actual) preferences. We test this validity through a field experiment and check for possible
convergence between self-reported (from the survey) and the actual behaviour.
Data was collected during May and June 2013. By using the mailing list provided by the
university administrative departments, 450 emails were sent to university students in Pisa
including the survey link and a description of the aim of the study. The response rate after
57
two reminders was 47 percent (213 surveys). The group of participants included 120 males
and 86 females. Prior to the final submission, a pre-test was administrated to 30 students
during the month of May. This test was developed to uncover any possible weakness and
misunderstanding arising from the text. Consequently, the final questionnaire was prepared
based on pre-test results which led us to summarize and change the statements of some
questions, as well as to eliminate other questions. In order to overcome methodological biases
affecting the behavioural research based on survey techniques, we adopted several procedural
remedies. Since many researchers have pointed out social desirability as one of the most
common sources of bias affecting the validity of experimental and survey research findings
(King and Bruner, 2000; Tourangeau and Yan, 2007) we guaranteed anonymity of
respondents.
Over a span of 60-days (from October to December 2013), we collected data on 1849
instances of plastic cup disposal at a coffee vending machine at the School of Advanced
Studies Sant’Anna in Pisa. Users were unaware that they were participants in the study.
Recycling behaviour was measured by the number of plastic cups recycled in dustbins at the
end of a day. During the observation period, our team would count the number of cups
recycled every day before the dustbins were cleaned in the morning. To ensure that
participant were not aware that their recycling behaviour was being monitored, counting took
place early in the morning when nobody was present near the coffee vending machines.
We used two different treatments for the experiment. During a control period of two weeks,
we measured the number of recycled cups without any intervention. In the following, we
applied the first and second treatment, each for two weeks. Three months after the
experiment, in February 2014, we recollected data on recycled plastic cups for one week to
examine the lasting effect of the second treatment.
For treatment 1, we created a message showing signs soliciting participation in a recycling
programme. The message, which was designed to reflect the importance of recycling and the
environment protection, was not only used to raise awareness, but included an external
descriptive social norm. This external norm was induced by informing participants that the
majority of other students at one of the world’s leading universities recycle. Our message was
the following: Be different! Be better! RECYCLE! Choose the right bin, it is very
easy."Almost 70% of Harvard students RECYCLE." Do you want to lag behind?6
6In Italian the message was: Sii diverso!Fai meglio! RICICLA! Scegli il contenitore giusto: è facile. "Il 70%
degli studenti di Harvard RICICLA. " Vuoi restare indietro?

58
At the School of Advanced Studies Sant’Anna, a majority of students are Italians, but the
message was displayed both in Italian and in English to accommodate international students.
Based on the foregoing analysis, we hypothesized that the message, which induced external
social norm and raised awareness, would result in a larger share of the plastic cups being put
in the recycling bin.
Figure 3.4: Treatment 1
For treatment 2, we used the 'easy to do' nudge in combination with the social norm. In this
way, we made it is easier for subjects to recycle plastic cups by changing the recycling-bin-to
garbage ratio, as it can be seen on the picture below.

59
Figure 3.5: Treatment 2
We changed the choice architecture. The big green bin was reassigned for recycling and the
small black bin for garbage.
3.5 Results
First, we measured pro-environmental behaviour by using three different questions that are
able to reflect the willingness of individuals to participate in resources reduction,
environmental protection and more sustainable use of energy. The following three questions
tested whether participants would follow non-price intervention nudges. For each of the
following questions, respondents reported “Yes”, “No” or “I do not know”. In detail, we
asked:
1) Imagine during your next stay in a hotel you read in your bathroom “Almost 75 % of
our guests who are asked to participate in our new resource program do help by
using their towels more than once. Would you join your fellow guests in this program
to help to save the environment?”7
7See Goldstein, Cialdini and Griskevicius (2008) - a nudge using a descriptive social norm.

60
2) When it comes to energy consumption of appliances (e.g., laptop, phone) I tend to
follow the factory settings (a nudge using default options- 'preference for easy' nudge)
3) Imagine you decided to achieve a monthly goal of energy reduction by 20Euros. Are
you ready to use less of appliances (e.g., air condition, water heater, microwave,
lighting) to achieve this goal? ( a nudge using a commitment device)
A majority of participants would follow these indirect non-price intervention nudges. Over 72
percent of participants stated they would participate in the new resource program by using
their towels more than once, following the social norm nudge. For the default-effect nudge on
consumption of appliances, 40 percent of respondents said they would follow factory settings
and 20 percent said they do not know. The commitment device nudge showed that
approximately 70 percent of the participants affirmed question 3.
Results are shown in the figure 3.6 below.
Figure 3.6: Survey results
The group of participants was composed of 120 males and 86 females, thus 58 percent of the
respondents were men. Over 45 percent of participants were graduate students. The highest
percentage of students (around 40 percent) was between 26-29 years old. Approximately half
of the sample was living in detached houses, while 43 percent were renting a room, and the
rest was living at the university dorm. The main source of income of more than half of the

61
respondents was scholarships; and approximately 33 percent of the respondents had a
monthly income between 1000 and 2000 Euros. Over 70 percent of the students were
working as volunteers, and 25 percent worked for environmental organizations. More than
one third of the participants considered themselves liberal, and approximately 40 percent
stated to be neither liberal nor conservative.
The survey illustrated a positive response to the two types of nudges; the descriptive social
norm and the ‘easy to do' nudge. Figure 3.7 shows the percentage of recycled cups in the
control period, and in both treatments for the experimental period.
Figure 3.7: Percentage of recycled cups over the experimental period
In order to determine whether changes occurred in the number of recycled cups after the
implementation of the nudges treatments, we first performed an ANOVA test on our data
series.8ANOVA results illustrate a significant effect after the nudge treatments (F(2,9)=786.4
, p < .0001) and it shows that the means of the populations are not equal. Based on this result,
we tested for differences between means in the control condition and in the treatments.
Consistent with our hypothesis, a t-test revealed that an awareness raising message in
combination with the social norm (descriptive norm) nudge, yielded significantly higher
recycling rates, increasing the average of 3.91 percent in the control condition to 36 percent
in the first nudge treatment ( t (10) = 13.63 with p< .0001). See figure 3.8 below. 8Prior to performing ANOVA and t-tests we performed a Shapiro-Wilk test for normality of data. Results confirmed that our data in all the treatments were normally distributed.

62
Figure 3.8: Average of percentage of recycled cups
In order to ensure that students did not dispose all garbage in the same big bin, but continue
to recycle their waste, we counted also the properly attributed non-recyclable garbage during
the treatment. The results show that the share of correctly disposed recyclable garbage was
almost 98 percent and the share of correctly disposed non-recyclable garbage was almost 94
percent. See figure 3.9 below.
Figure 3.9: Treatment 2 – Share of correctly disposed recyclable and non-recyclable garbage
In addition, a t-test revealed that the second treatment combining the 'easy to do' nudge and
the social norm, positively affected the amount of recycled plastic cups. The second

63
intervention yielded significantly higher recycling of the plastic cups 97.35 % on average
compared to the average of 3.91 % in the control treatment (3.91; t (13) = 48.53 with p <
.0001).
The combined treatment increased recycling of plastic cups with respect to the single nudge
(social norm) treatment. A t-test at the .05 critical alpha level revealed that the two nudges
condition yielded a significantly higher recycling (97.35 %) than the one nudge (social norm)
treatment (36.0; t (15) = 22.31 with p < .0001). Our hypotheses thus proved to accord with
the data.
Three months after the experiment, participants were still recycling coffee cups at significant
levels. A t-test revealed that the second treatment yielded a significantly higher recycling than
the control treatment (68.8; t(5)=12.83 with p<.00001) three months after the experiment.
3.6 Discussion and Conclusion
In the control group, a very low percentage of subjects recycled plastic cups (on average 3.91
percent of recycled cups), illustrating a low level of pro-environmental behaviour and a
limited awareness about recycling.
In our treatments, we used awareness raising and non-price intervention nudges. Going
beyond existing literature, we studied the joint effect of a combination of nudges. Before the
treatment, students threw their cups blindly into the biggest bin, without giving much thought
as to whether these cups can be recycled. Since a large majority shared the same disregard,
we assumed that students did not pay attention to recycling because either they did not know
better or followed others for reasons of conformity, i.e. ignorance was paired with a norms of
not caring. In addition, students disposed their plastic cups in the larger bin, not only because
it was more salient than the much smaller bin, but mainly because it was also much more
accessible.
In the first treatment, we thus triggered a behavioural change via two different effects:
awareness raising and an externally imposed norm. The awareness raising effect in addition
to the external norm led to a significant improvement in the share of recycled cups by 36
percent. These results are in line with the previous research on the impact of nudges
(Goldstein, Cialdini and Griskevicius, 2008). Yet, students still bore the additional
inconvenience of opening the correct rubbish bin in order to push their cups inside.
In the second treatment, we counteracted the inconvenience and low accessibility to recycling

64
by reversing the mapping of the bin, making the large bin the one appropriate for recyclable
plastic cups. This treatment aligned external norm, awareness, and the convenience of
recycling of cups. As a result, cups were correctly attributed in almost 100 percent of the
cases.
Both nudges (social norm and 'easy to do') had a significant impact on changing behaviour.
Yet, in addition, the 'easy to do' nudge triggered the greatest behavioural change. Moreover,
we analysed the long-term effect of the nudges applied and found a long lasting effect three
months after the experiment.

65
References
Allcott, Hunt, 2011. "Social norms and energy conservation." Journal of Public Economics 95,
no. 9, 1082-1095.
Allcott, Hunt, and Sendhil Mullainathan, 2010. "Behavioral science and energy
policy." Science 327, no. 5970, 1204-1205.
Akerlof, Karen and Keneddy Chris, 2013. “Nudging toward a healthy natural environment:
How behavioural change research can inform conservation,” George Mason University.
Accessed January 18, 2014.
http://climatechangecommunication.org/sites/default/files/reports/NudgesforConservation_G
MU_061013.pdf
Bowles, Samuel, 2004. Microeconomics: behavior, institutions, and evolution. Princeton
University Press.
Boyd, Robert, and Peter J. Richerson, 1985. Culture and the Evolutionary Process. Chicago:
University of Chicago Press.
Cialdini, Robert B., Raymond R. Reno, and Carl A. Kallgren, 1990. "A focus theory of
normative conduct: recycling the concept of norms to reduce littering in public
places." Journal of personality and social psychology 58(6), 1015.
DEFRA -Department of the Environment Food and Rural Affairs, 2008. “Framework for
environmental behaviours DEFRA,” UK Government . Accessed March 20, 2014.
https://www.gov.uk/government/uploads/system/uploads/attachment_data/file/69277/pb13574-behaviours-
report-080110.pdf.
Eriksson, Kimmo, Magnus Enquist, and Stefano Ghirlanda, 2007. "Critical points in current
theory of conformist social learning." Journal of Evolutionary Psychology 5(1), 67-87.
Goldstein, Noah J., Robert B. Cialdini, and Vladas Griskevicius, 2008. "A room with a
viewpoint: Using social norms to motivate environmental conservation in hotels." Journal of
consumer Research 35(3), 472-482.
Johnson, Eric J., and Daniel G. Goldstein, 2003. "Do defaults save lives?." Science 302, 1338-
1339.
King, Maryon F., and Gordon C. Bruner, 2000. "Social desirability bias: A neglected aspect
of validity testing." Psychology and Marketing 17(2), 79-103.

66
Madrian, Brigitte C., and Dennis F. Shea, 2001. "The Power of Suggestion: Inertia in 401 (k)
Participation and Savings Behavior." The Quarterly Journal of Economics 116(4), 1149-
1187.
Mayr, Walter, 2014. “The Mafia's Deadly Garbage: Italy's Growing Toxic Waste Scandal,”
Spiegel online. Accessed January 17, 2014. http://www.spiegel.de/international/europe/anger-rises-in-
italy-over-toxic-waste-dumps-from-the-mafia-a-943630.html
Miranda, Ruben, and Angeles Blanco, 2010. "Environmental awareness and paper
recycling." Cellulose Chemistry & Technology 44 (10), 431.
Shaw, Peter J., Joanee K. Lyas, Sarah J. Maynard, and Mark Van Vugt, 2007. "On the
relationship between set-out rates and participation ratios as a tool for enhancement of
kerbside household waste recycling." Journal of environmental management 83(1), 34-43.
Sunstein, Cass R., and Richard H. Thaler, 2003. "Libertarian paternalism is not an
oxymoron." The University of Chicago Law Review, 1159-1202.
Thaler, Richard H., and Cass R. Sunstein, 2008. . Nudge. Yale University Press.
Thaler, Richard H., and Shlomo Benartzi, 2004. "Save more tomorrow™: Using behavioral
economics to increase employee saving." Journal of political Economy 112 (S1), S164-
S187.
Tourangeau, Roger, and Ting Yan, 2007. "Sensitive questions in surveys."Psychological
bulletin 133(5), 859.
Waste Prevention Loan Fund, 2012. “Raising public awareness of recycling and reuse,”UK
Government. Accessed March 25,
2014.http://www2.wrap.org.uk/downloads/2.0_Raising_public_awareness_of_recycling_and_reuse_-
_Online.ac7fcafb.9261.pdf
Weibull, Jörgen W., 1997. Evolutionary game theory. MIT press.

67
Appendix
Following our assumptions, a strictly increasing and s-shaped function in p is given by
(8)
with a minimum value of 0 at p = 0 and maximum at 1 for p = 1, and b defining the degree of
conformism. For b = 1, conformism is non-existent, for larger values of b the individual is
more biased towards the majority action. In order to shift the ”saddle point”, we extend
function by an intercept a at p = 0, in order to be able to shift the minimum
predisposition to recycle from 0 to a strictly positive value smaller than 1 without having the
maximum exceed 1 at p = 1. Variable a thus represents the intrinsic norm or motivation to
recycle in the absence of any other recycler. If sufficiently large, an individual does not
require seeing other recyclers in order to do so. In addition, we assumed that a shift from one
norm to the other is not symmetric. For example, non-recyclers need to observe a larger
number of recyclers before they switch their actions than the number of non-recycler which
recyclers need to observe before changing their actions. Introducing a bias (c) into equation
(8) allows to take account of this. The larger c, the steeper the rights side of the s-curved
function. These assumptions lead to
(9)
The following graph illustrates the effect of parameter changes
Figure 3.10: Effects of parameter changes.
b = 0.5
b = 1
b = 2
b = 3
0.2 0.4 0.6 0.8 1.0
0.2
0.4
0.6
0.8
1.0
c
a

68
4
Nudging Students toward Healthier
Choices in a University Cafeteria
- A Field Experiment9
Abstract
Small everyday changes in people’s eating behaviour can have significant positive impact on
their health. Current strategies to raise awareness of healthy eating are clearly not enough to
tackle the problems we face. A growing literature on behavioural economics and psychology
thus suggests the use of non-price intervention nudges. We study whether nudges are efficient
in promoting healthy food purchases in a university cafeteria. The study was performed on
primary data; a field experiment was conducted among university students in Strasbourg.
The field experiment was conducted over a 20-day span (from February to March 2014).
In total, we collected data on 606 bottle of waters, 675 soft drinks, 339 fruit juice, 247 fruits,
257 salads (large portion), 87 salads (small portion), 227 desserts, 130 yogurts (without
sugar), 193 yogurts (with sugar) in the cafeteria of School of Economics and Business School
at the University of Strasbourg. Consumption of healthy food was measured by sale records
of healthy food observed at the end of a day. Results of the experimental treatments showed a
non significant impact on the amount of healthy food and drinks purchase.
Keywords: healthy food; nudging; field experiment; students; university cafeteria.
9 This is a joint project with Sihem Dekhili.

69
4.1 Introduction
A healthy food is something we need to aspire to. Small everyday changes in people’s eating
behaviour can have significant positive impact on people’s health. Food industry plays an
important role in shaping eating habits (Harris et al. 2009).
Our productivity is directly impacted by what we eat. According to Health Enhancement
Research Organization employees who eat healthily all day long were 25% more likely to
have higher job performance (Long, 2015).
Obesity has been recognised as a significant threat that can be a cause of major diseases and
in the long run incurs massive cost to the health systems (Feng et al. 2010). Obesity has
major consequences potentially leading to a decrease in the quality of life of the individuals
concerned. In 2012 at least one in two people were overweight or obese in over half of OECD
countries (OECD, 2012). According to OECD rates are projected to increase further and in
some countries two out of three people will be obese by 2020.
Current strategies to raise awareness of healthy eating are clearly not enough to tackle the
problems we face.
An innovative behavioural technique that has become widely used in the area of behaviour
change research is ‘nudge’. The idea of nudging is based on possibility to guide people
towards better decisions by presenting choices in different ways.
Nudge was primarily defined by Thaler and Sunstein (2008) as a technique that alters a
person’s decision-making context without removing options or changing the incentives in
order to promote choice and behaviour in accordance to their own preferences, such as
choosing healthy food over unhealthy food in a restaurant, university cafeteria or
supermarket. According to Cooper (2013) nudge help us to make the “right” decision easier.
The concept of nudges Thaler and Sunstein (2008) suggests a policy of libertarian
paternalism, favouring simplicity, effectiveness and a relatively low cost of implementation.
As suggested by Sunstein and Thaler (2008) 'libertarian' aspect refers to the necessity of
respecting everyone's freedom to act, decide or even change their minds as it suits them.
Purpose of this research is to test whether nudges affect healthy food purchases in a
university cafeteria.
In our study we focused on young population, students at a French University between 18-30

70
years old. Young population is a large and important segment of the population that is
affected by unhealthy eating habits that can later result in obesity.
France might still be one of the OECD countries least affected by obesity, but the problem
has been getting worse over the last twenty years (OCDE, 2009). According to ObÉpi (2009),
obesity has risen to a level of 14.5 % in adults. Based on a trend scenario, obesity could
reach 22% till 2025, meaning more than one person in five. The OECD data from 2012
showed modest increases in obesity (2-3%) over the past decade in countries like Spain and
France.
In this paper we use data from a field experiment to analyze the impact on healthy and less
healthy food and drinks sales from a ‘nudge’.
This study contributes to the literature on the use of the nudges as a policy-making
intervention, by testing whether nudge can increase healthy food purchase in a university
cafeteria.
We summarize the aim of the paper in the following hypothesis that we tested empirically:
H1: Using a non-price intervention nudge (social norm) combined with an awareness-raising
message and an 'easy to choose' nudge - positively affects consumption of healthy food in the
university cafeteria.
The second section of this article provides a literature overview. The third section illustrates
the methodology used and the third section analyzes the results and compares these to our
hypotheses. The final section contains the conclusion, some indications for future research
and policy implications.
4.2 Literature review
A growing literature on behavioural economics and psychology suggests non-price
interventions can be used to affect consumers’ choices. Non-price interventions or nudges are
a subtle way of influencing behaviour without offering material incentives or imposing
punishments.
We review available literature on use of nudges to affect healthy eating. We mention various

71
psychological biases as obstacles to healthy eating. Furthermore we give description of
nudging and nudges in general, and review available studies on use of nudges for promotion
of healthy food.
There are some behavioural biases that ordinarily contribute to self harmful behaviour rather
than promoting healthy behaviour (e.g., default option and sunk cost fallacy). For example
large sodas in menus at fast food restaurants as a default option is harmful for health
(Loewenstein et al. 2007). Furthermore, the sunk cost fallacy where individuals over eat to
'get their money's worth' (Downs et al. (2009); Just et al. (2007)).
4.2.1 Social norms
The importance of social norms is evident in the inclusion of norms in consumer behaviour
models (Fishbein and Ajzen, 1975). Experimental studies of Asch (1951) and Sherif (1963)
established conformity as a behavioural response of compliance with social norms.
Based on social capital theory people are strongly influenced by their social networks,
networks which are supported by social norms including trust, reciprocity and mutuality
(Putnam, 2000; Halpern, 2005). Moreover social norms are sustained by the approval and
disapproval of others in the community (Elster, 1989). Our perception of how others see us,
particularly our peers is important to us (Moseley and Stoker, 2013).
It is widely accepted and has been incorporated into a number of theories of healthy
behaviour that social norms are important determinants of physical activity and eating
behaviours, such as the Theory of Planned Behavior (Ajzen, 1985) and Social Cognitive
Theory (Bandura, 2001).
Ball et al. (2010) and Okun et al. (2003) suggest that social norms may be potentially
important determinants of physical activity and eating behaviours, and that this influence may
be independent of the effects of the more well-established predictor, social support. For
example, Ball et al. (2010) suggest that women who observe many others engaging in
particular physical activity or eating behaviours may come to view these behaviours as
‘normative’ or socially desirable. According to Ball et al. (2010) they may adopt the same
behaviours due to a positive attitude about the behaviours, a shared belief in their value or a
strong social push to confirm and ‘fit in’ to society.

72
Robinson et al. (2013) examined the effect of health and social norm messages on high
calorie snack food intake. According to Robinson et al. (2013) the amount of high calorie
snack food consumed was significantly lower in both the health and the social norm message
condition compared with the control message condition (36% and 28%).
To the best of our knowledge this observation has not been tested experimentally, and our
study is among the first to use a social norm as a nudge in an experiment to check its effect
on healthy food purchase in France.
4.2.2 Convenience and other ‘nudges’
Hanks et al. (2012) show that introducing a convenience line that offered only healthier food
options nudged students to consume fewer unhealthy foods. Sales of healthier foods
increased by 18% and grams of less healthy foods consumed decreased by nearly 28%.
Hanks et al. (2013) investigate how small changes to school cafeterias, can influence the
choice and consumption of healthy foods.
They use convenience (improving the convenience of fruits and vegetables), attractiveness
(improving the attractiveness of fruits and vegetables relative to others), and normativeness
as interventions in school cafeterias. They show that the impact of the smarter lunchroom
makeover was most evident in the selection and consumption of fruits and vegetables.
Moreover actual fruit consumption increased by 18% and vegetable consumption by 25%.
According to Health Enhancement Research Organization employees who ate 5 or more
servings of fruits and vegetables at least four times per week were 20% more likely to be
more productive. Compared to their peers that were obese, employees who ate healthily and
regularly exercised were absent from work 27% less and performed 11% better at their job
(Long, 2015).
Changes in the size of portions can affect also diet. Wansink and Cheney (2005) find that the
size of serving bowls influences the food intake. According to Wansink and Cheney (2005)
large serving bowls led to a 56% greater intake. Moreover participants served from large
bowls took 53% more and consumed 56% more than those who served from small bowls.
Thunström and Nordström (2013) in a field experiment analyse how meal attributes and a
73
'nudge' impact healthy labelled meal consumption. Their nudge consists of placing healthy
labelled meals at the top of menu. Results show that certain meal attributes (red meat)
increase both sales and the market share of the healthy labelled meal. However the nudge
'used' on healthy labelled meal did not have impact on healthy labelled meal sales.
In the study by Oullier et al. (2010) two types of choice of food were compared. The nudge
they used involved asking the employees of a company to plan their menus for all of the
following month. According to the results Oullier et al. (2010) viewing the meals as a part of
schedule encourages the person to avoid choosing the same menu on several consecutive
days and also to diversify their food choices.
Seymour et al. (2004) reviewed the effectiveness of nutritional interventions in worksite and
university cafeterias involving the availability, access to, pricing or and information about
fruit and vegetables. According to Seymour et al. (2004) study results worksite and university
interventions have the most potential for success than those in restaurant and grocery stores.
Another study by Oullier et al. (2010) showed that decreasing the variety of food offered in a
cafeteria encourages people to eat less. Moreover study showed that if people are offered
with a three varieties of yoghurt in a bowl and they are serving them self, they will tend to
consume 23% more than if only one flavour is available.
However none of the mentioned studies use green footprints on the floor that will lead to
healthy choices fruits and salads on the shelf. In our study we introduce this nudge ‘easy to
choose’ with green footprint leading to healthy products salads and fruits.
Furthermore to the best of our knowledge this is one of the first experimental studies testing
nudges for healthy food purchase in France.
4.3 Methods
4.3.1 Experimental design
Our analysis is based on data from a field experiment. The experiment was conducted in a
cafeteria of School of Economics and Business at the University of Strasbourg.
The cafeteria is open to students and university staff of University of Strasbourg. Data on
daily turnovers from November 2013- January 2014 showed that on average 300 people
74
visited cafeteria every day (from Monday to Friday). In our empirical analysis we measured
consumption with sales data.
The experiment lasted over a period of four weeks where the first two weeks were the control
period and the second two weeks were treatment period. The first two weeks ran from 17
February -28 February 2014 and the second two weeks ran from 4 March-17 March 2014.
Over the two weeks but 10 working days in March, we collected data on sales of healthy and
less healthy food and drinks in the cafeteria of School of Economics and Business School at
the University of Strasbourg. The users were not aware that they were participants in the
study.
Healthy eating behaviour was measured by healthy food consumption with sales data
observed at the end of a day. Consumption of healthy food was measured by sale records of
healthy food (fruits and salads).
Collecting data from a field experiment to perform our study has several important benefits.
The field experiment allows us to analyse the impact on nudges (social norms) on healthy
food (fruits and salads) sales in cafeteria. Another benefit of the field experiment is that
prices of healthy food and their supply were not influenced by the authors of this study.
During the four experimental weeks, we had an agreement with management of the cafeteria
that they would provide us daily sales turnover during the experimental period. Moreover
sales data was collected by the cafeteria’s employees on a daily basis.
In the experiment we used one treatment consisting of two nudges combined together at the
same time. Before introduction of treatment, we had a control period of two weeks in order to
check sales of healthy food products without any treatment.
4.3.2 Treatment: The role of social norm and ‘easy to choose’ nudge on healthy
food purchase
For a non-price intervention nudge (social norm) we created a message with signs soliciting
participation in the healthy eating program to raise awareness about healthy eating.
The message, which was designed to reflect the importance of healthy food, included an
external descriptive social norm. The latter was induced by informing participants that the
majority of other students at the world leading university consume healthy food. Our message
was the following: Be different! Be healthier! Choose HEALTHY food, it is very easy!"
Almost 70% of Harvard students eat HEALTHY FOOD." Do you want to join or lag behind?

75
(see Figure 4.1 and Figure 4.2).
Since at the University of Strasbourg, majority of students are French, but also there are
international students the message was translated both to French and English. Based on the
foregoing analysis, we hypothesized that the message, which conveyed the external social
norm and a raising awareness message, would result in greater sales of healthy food.
Figure 4.1: Social norm message
Figure 4.2: Social norm message and label ‘healthy eating’ in cafeteria
In this experiment we called our ‘nudge’ ‘easy to choose’ healthy. It was the introduction of
green footprints on the floor of the cafeteria (see Figure 4.3).
The green footprints nudge is an example of the “making things easy” part of the nudging-

76
doctrine. Finding and choosing a healthy food in a cafeteria in a hurry is not always easiest,
so by simply making green footprints give people direction and helps people to choose
healthy food.
The green footprints directed the cafeteria customer from the cafeteria line entrance to the
shelf where the healthy food (fruits and salads) was located. Moreover on the fruits and
salads we put label ‘healthy eating’. In order to see the effect of nudge on amounts of fruit
and salads purchased we kept green footprints and labels there for two weeks.
According to Hansen and Jespersen (2012) utilised green footprints, directing pedestrians to
bins, and discovered a reduced amount of litter on the streets of Copenhagen by 46%.
Following this study by exploring how green footprints would influence people’s behaviour
in a different environment in our case the cafeteria, and promoting different behaviours in our
case the purchase of fruits and salads.
Figure 4.3: ‘easy to choose’ nudge - green footprints in cafeteria
Both non price intervention- nudges were introduces at the same time, our aim was to see
how combination of different nudges can influence students’ choice.
4.4 Results and discussion
For the purposes of our study we measured healthy eating behaviour by sale of healthy and
less healthy food and drinks in cafeteria. The experiment lasted over a period of four weeks.
In total, 606 bottle of waters, 675 soft drinks, 339 fruit juice, 247 fruits, 257 salads (large

77
portion), 87 salads (small portion) 227 desserts, 130 yogurts (without sugar), 193 yogurts
(with sugar) were sold during the two weeks period (see Table 4.1 and Figure 4.4 and Figure
4.5).
Figure 4.4: Sales of healthy and less healthy food in cafetaria
Figure 4.5: Sales of healthy and less healthy drinks in cafetaria

78
Table 4.1: Prices and total quantity of drinks and food sold during control and treatment
period
Price-euro Total quantity sold -
control
Total quantity sold -
treatments
Water 0.8 566 606
Soft drinks 1.1 542 675
Fruit juice 1.1 257 339
Fruits 0.6 250 247
Salads -Small 1 218 257
Salads- Large 1.6 115 87
Yogurt- healthy 0.45 182 13
Yogurt- less
healthy
0.65 193 193
Desserts 1.8 242 227
Nudging, by using social norm and “easy to choose” healthy, does not seem to impact sales
of the healthy food and drinks as shown by table 4.2 and 4.3 below. A single sample t-test
was used to determine whether there was a statistically significant difference between sales of
healthy and less healthy food and drinks in cafeteria before and after nudge treatment.
According to the results given in the Table 4.3 below we can see that the p-value associated
with the t-test is not small in most variables (water, fruits, salads (small), yogurt and
desserts), p > 0.05.
We conclude that mean of variables water, fruits, salads (small portion), yogurt and desserts
before treatments is not significantly different from their mean after the treatment. However
p-value associated with the t-test in variable salads (large portion) is small, it is less than 0.05
(salads (large portion) p-value is .002) there is evidence that the mean is different from the
hypothesized value. It means that mean salads (large portion) before and after treatment
changed. Number of salads (large portion) sold before the treatment decreased from 11.5 to
8.7 portions. In this case that nudge did not have positive effect and it did not increase
number of salads (large portion), contrary sales decreased.
Moreover we can conclude that nudge treatments did not have a significant impact on sales of
water, fruits, salads, yogurts and desserts.
However p-value associated with the t-test in variables soft drinks and fruit juice is small, it is

79
less than 0.05 (soft drinks p-value is .013, fruit juice p-value is .010) there is evidence that the
mean is different from the hypothesized value. It means that mean of soft drinks and fruit
juices before and after treatment changed.
Number of less healthy drinks, soft drinks (e.g., Coca Cola, Sprite, Fanta) sold before the
treatment increased from 542 to 675 pieces. This was an increase of 24.5 % and we can say
that nudge did not have positive effect and it did not reduce number of soft drinks, contrary
sales increased. Sales of healthy drinks such as fruit juice increased from 25.7 to 33.9 ( see
Table 4.2).
Table 4.2: T test statistics-drinks
Variable Mean-
Treatment
Mean-
Control
T-
statistics
P-
value
Water 60.6 56.6 0.7499 0.47
Soft drinks 67.5 54.2 3.0597 0.01
Fruit juice 33.9 25.7 3.2111 0.01
Table 4.3: T test statistics-food
Variable Mean-
Treatment
Mean-
Control
T-
statistics
P-
value
Fruits 24.7 25 -0.1307 0.89
Salads Small 25.7 21.8 1.5950 0.14 Salads Large 8.7 11.5 -2.7097 0.02
Yogurt-without sugar
13 18.2 -1.5631 0.15
Yogurt-with sugar
19.3 19.3 0.0000 1
Desserts 22.7 24.2 -0.4691 0.65 Our results can be seen as evidence that nudges do not always work out as planned. Our
results therefore do not lend support to our hypothesis H1: Using a non-price intervention
nudge (social norm) combined with an awareness-raising message and an 'easy to choose’
nudge - positively affects consumption of healthy food in the university cafeteria.
4.4.1 Why nudge do not always work out as planned?
Nudges help individuals with various decision-making flaws to eat healthier, to live longer

80
and better live. However some studies on nudges indicate that they do not always work out as
planned.
Rolls et al. (2007) found that altering plate sizes had no significant effect on energy intake at
meals eaten in three laboratory experiments. Participants made significantly more trips to the
buffet when they were given the smallest plate in one of these experiments.
Adding “healthy options to “unhealthy” meals might be challenging. Psychologists also
report “negative calorie illusion,” whereby adding a healthy option to weight-conscious
individuals’ unhealthy meals decreases their perception of the meals’ calorie content
(Marlow, 2014). Sometimes encouraging the adoption of a healthier lifestyle among
overweight individuals, promoting the consumption of healthy foods might end up facilitating
calorie overconsumption, leading to weight gain rather than weight loss (Chernev, 2011).
Labelling requirements are introduced to help people to reduce calories and other food
attributes (fat, sugar) (Marlow, 2014). However studies have found that labelling improves
calorie estimates (Elbel, 2011), but evidence so far does not clearly demonstrate that required
labels result in healthier eating.
Elbel et al. (2009) examined the influence of menu calorie labels on fast food choices in the
New York City’s labelling mandate. Elbel et al. (2009), found no change in calories
purchased after the law. Similar to Elbel et al. (2009) findings, our results showed that putting
labels on a healthy food such as salads did not help us to increase number of products sold
during the treatment period.
We introduced a series of green footprints leading to shelves in the hope of encouraging
people to take the healthier option. Green footprints on the floor had the same message as
labels on the food “eat healthy”. However introducing nudge, that we called ‘easy to choose’
with green footprint did not have significant effect on sales of healthy and less healthy drinks
and food.
In partnership with the local government Hansen did similar experiment, they tested two
potential “social nudges” using green footprints and green arrows to try to influence choices
(Hansen, 2012). In the first experiment they used green arrows pointing to stairs next to
railway-station escalators, in order to encourage people to take the healthier option. Results
showed that it had almost no effect. However for the second experiment they used green
footprints leading to rubbish bins and this reduced littering by 46% during a controlled
experiment.

81
In his work Hansen says: “There are no social norms about taking the stairs but there are
about littering.” (Hansen, 2012)
Bollinger et al. (2010) studied the impact of mandatory calorie posting on consumers’
purchase decisions, using detailed data from Starbucks. They found virtually no change in
purchases of beverage calories.
The field study replicated these findings; labelling healthy food did not lead to higher sales of
healthy food. Sales of healthy and less healthy food and drinks were not impacted by
manipulations. Our results showed that nudges do not always work out as planned, that sale
of less healthy drinks did not decreased; contrary they increased by 25 percent. Our results
similar to Bollinger et al. (2010) showed no significant change in purchase of healthy food
and drinks during nudge treatment period.
From these above mentioned studies we can notice there is a number of studies that show no
effect of nudges on healthy food consumption by some other means.
4.5 Conclusion
In this paper we presented field experiment in a university cafeteria that examines the effect
of combination of nudges social norm and ‘easy to choose’ on healthy and less healthy food
and drink consumption. Going beyond existing literature, we studied the joint effect of a
combination of nudges.
We introduced two nudges at the same time; first we triggered a behavioural change via two
different effects: awareness raising and an externally imposed norm. Additionally we used
green footprints and labels encouraging people to take the healthier option.
The results showed that combination of nudges used did not change consumers’ choice in a
healthier direction. Moreover sale of the less healthy drinks increased by 25 percent during
our treatment period (from 542 to 675).
Number of salads, fruits and healthy drinks sold did not change significantly. Comparing our
findings to the results from Thunström and Nordström (2013) we can say that our findings
are similar since they also found no impact on sales or the market share of the healthy
labelled meal from the nudge used in their study.
There are several possible explanations for these findings. One of the reasons might be
differences in culture. Olivier Oullier, a behavioural and brain scientist who advises the

82
French government, says: “The French have a tendency not to comply as easily with
perceived social norms the way Anglo-Saxons would,” (The Economist, 2012). Moreover
“Telling someone in France that their neighbour is using less electricity or saving more water
is not sufficient.” (The Economist, 2012). Our results also show that informing students in
France that the majority of other students at the world leading university consume healthy
food was not sufficient.
Another reason might be that the customer base of the field experiment consists of consumer
group students that are very sensitive to money. One of the reasons why consumers choose
less healthy food and drinks might be due financial reasons. But in our case prices of healthy
and less healthy drinks were the same (Coca Cola 335 ml price 1.10 euros and Minute Maid
Orange 335 ml price 1.10 euros. Moreover price of a healthy yogurt (without sugar and
artificial aroma) was 0.45 euros compared to less healthy yogurt (with sugar and additives)
0.65 euros. Still majority of students chose less healthy yogurt (on average 13 healthy and
19.3 less healthy yogurts per day were sold during treatment period).
Some limitations should be noted about our study. One of the limitations is a relatively small
number of healthy food available comparing to less healthy. Moreover fruits had a lower
price comparing to desserts which may have given these products an additional benefit. The
efficacy of nudge interventions could be studied over a longer time frame in order to give
more realistic results.
Our results show that a nudge was not able to influence significantly consumers’ healthy food
purchases. Nudges alone may not be the best solutions to encourage people to eat healthier.
However nudges in combination with some other tools such as; increase of assortment,
reduction of prices of healthy food, introduction of convenient lines, all together can result in
winning combination. According to van Kleef et al. (2012) increase the prominence of
healthy food in canteen by enlarging their availability, while permitting access to unhealthy
food, might me a promising strategy to promote sales of healthy food.
The examples from the literature review section illustrate how small changes in the
environment can lead to major positive effects on health and economics and they can be used
in public health prevention strategies. In our opinion nudge brings additional policy tools into
play that in combination with some other traditional tools (awareness campaigns, education
about healthy food) are required to change consumer behaviour. However time will show can

83
‘nudges’ convince policy makers and administrations to consider them to improve the
wellbeing of individuals.
An interesting topic for further research would be identification of other important factors
that nudge consumers towards healthier food choice in various environments such as
restaurants and grocery stores. More research is needed to analyse long-term effects of
nudges on healthy food purchase in various environments.

84
References
Ajzen, I. (1985). From intentions to actions: A theory of planned behavior (pp. 11-39).
Springer Berlin Heidelberg.
Asch, S. E. (1951). Effects of group pressure upon the modification and distortion of
judgments. Groups, leadership, and men, 222-236.
Ball, K., Jeffery, R. W., Abbott, G., McNaughton, S. A., & Crawford, D. (2010). Is healthy
behavior contagious: associations of social norms with physical activity and healthy eating.
Int J Behav Nutr Phys Act, 7(1), 86.
Bandura, A. (2001). Social cognitive theory: An agentic perspective. Annual review of
psychology, 52(1), 1-26.
Bollinger, B., Leslie, P., & Sorensen, A. (2010). Calorie posting in chain restaurants (No.
w15648). National Bureau of Economic Research.
Chernev, Alexander, “The Dieter’s Paradox,” Journal of Consumer Psychology 21, 2:178–83,
2011.
Cooper Leigh, Manuel Calatrava Conesa, (2013). A fruitful nudge towards a healthy diet.
Available at: http://www.inudgeyou.com/a-fruitful-nudge-towards-a-healthy-diet/ [Accessed:
20 Oct 2014].
Downs, J. S., Loewenstein, G., & Wisdom, J. (2009). Strategies for promoting healthier food
choices. The American Economic Review, 159-164.
Elbel, B., Kersh, R., Brescoll, V. L., & Dixon, L. B. (2009). Calorie labeling and food choices:
a first look at the effects on low-income people in New York City.Health Affairs, 28(6),
w1110-w1121.
Elbel, B. (2011). Consumer estimation of recommended and actual calories at fast food
restaurants. Obesity, 19(10), 1971-1978.
Elster J. (1989) Social norms and economic theory. Journal of Economic Perspectives 3(4):99–
117.
Feng, J., Glass, T. A., Curriero, F. C., Stewart, W. F., & Schwartz, B. S. (2010). The built
environment and obesity: a systematic review of the epidemiologic evidence. Health &
place, 16(2), 175-190.
Fishbein, M., & Ajzen, I. (1975). Belief, attitude, intention and behavior: An introduction to
85
theory and research.
Hanks, A. S., Just, D. R., & Wansink, B. (2013). Smarter Lunchrooms can address new school
lunchroom guidelines and childhood obesity. The Journal of pediatrics, 162(4), 867-869.
Hanks, A. S., Just, D. R., Smith, L. E., & Wansink, B. (2012). Healthy convenience: nudging
students toward healthier choices in the lunchroom. Journal of Public Health, 34(3), 370-376.
Hansen, P.G. & Jespersen, A.M. (2012). Nudge, adfærdsøkonomi, og ‘økonomisk psykologi’ –
fra eksperiment til skraldespand. Psykologisk set, vol. 87-88., p. 15-23. Available at:
http://www.inudgeyou.com/green-nudge-nudging-litter-into-the-bin/
Harris, J.L., Pomeranz, J.L., Lobstein, T. & Brownell, K.D. (2009) A crisis in the marketplace:
how food marketing contributes to childhood obesity and what can be done. Annual Review
of Public Health, 30, 211–225.
Halpern D. (2005) Social capital. Cambridge/Malden, MA: Polity Press; 2005.
Just, D. R., & Wansink, B. (2011). The flat-rate pricing paradox: conflicting effects of “all-you-
can-eat” buffet pricing. The Review of Economics and Statistics, 93(1), 193-200.
Just, D. R., Mancino, L., & Wansink, B. (2007). Could behavioral economics help improve diet
quality for nutrition assistance program participants?. USDA-ERS Economic Research
Report, (43).
Loewenstein, G., Brennan, T., & Volpp, K. G. (2007). Asymmetric paternalism to improve
health
Long, J,( 2015) Get More Done by Following 'The Productivity Diet' (Infographic) Available
at: http://www.entrepreneur.com/article/247711 [Accessed: 26 June 2015].
Marlow, M. L. (2014). Weight Loss Nudges: Market Test or Government Guess?. Working
Paper, Mercatus Center at George Mason University, Arlington, VA.
Moseley, A., & Stoker, G. (2013). Nudging citizens? Prospects and pitfalls confronting a new
heuristic. Resources, Conservation and Recycling, 79, 4-10.
ObÉpi-Roche (2009), Enquête épidémiologique nationale sur le surpoids et l’obésité.
OCDE - Organisation de coopération et de développement économiques (2009), Panorama de
la santé.
OECD report. Obesity update 2012 Available at: http://www.oecd.org/health/49716427.pdf

86
[Accessed: 20 Oct 2014].
Okun, M. A., Ruehlman, L., Karoly, P., Lutz, R., Fairholme, C., & Schaub, R. (2003). Social
support and social norms: Do both contribute to predicting leisure-time exercise?. American
Journal of Health Behavior, 27(5), 493-507.
Oullier, O., Cialdini, R., Thaler, R. H., & Mullainathan, S. (2010). Improving public health
prevention with a nudge. Economic Perspectives, 6(2), 117-36.
Price J, Just D. Getting kids to eat their veggies. In: International Association of Agricultural
Economists 27th Triennial Conference, Beijing, 2010.
Putnam R. (2000) Bowling alone: the collapse and renewal of American community. New
York: Simon and Schuster
Robinson, E., Harris, E., Thomas, J., Aveyard, P., & Higgs, S. (2013). Reducing high calorie
snack food in young adults: a role for social norms and health based messages. International
Journal of Behavioral Nutrition and Physical Activity, 10(1), 73.
Rolls, B. J., Roe, L. S., Halverson, K. H., & Meengs, J. S. (2007). Using a smaller plate did not
reduce energy intake at meals. Appetite, 49(3), 652-660.
Seymour, J. D., Lazarus Yaroch, A., Serdula, M., Blanck, H. M., & Khan, L. K. (2004). Impact
of nutrition environmental interventions on point-of-purchase behavior in adults: a review.
Preventive Medicine, 39, 108-136.
Sherif, C. W. (1963). Social categorization as a function of latitude of acceptance and series
range. The Journal of Abnormal and Social Psychology, 67(2), 148.
Thaler RH, Sunstein C. Nudge: improving decisions about health, wealth, and happiness. Yale
University Press, 2008.
The Economist (2012) Behavioural economics: Herding the masses Available at:
http://www.economist.com/blogs/freeexchange/2012/03/behavioural-economics [Accessed:
20 Oct 2014].
Thunström, L., & Nordström, J. (2013). The Impact of Meal Attributes and Nudging on
Healthy Meal Consumption—Evidence from a Lunch Restaurant Field Experiment. Modern
Economy, 4(10a), 1-8.
van Kleef, E., Otten, K., & van Trijp, H. C. (2012). Healthy snacks at the checkout counter: A
lab and field study on the impact of shelf arrangement and assortment structure on consumer

87
choices. BMC public health, 12(1), 1072.
Wansink, B., & Cheney, M. M. (2005). Super bowls: serving bowl size and food consumption.
Jama, 293(14), 1723-1728.

88
5. Conclusions
This work was based on primary data collected through a survey and two field experiments at
the University of Pisa and University of Strasbourg.
The three chapters of this thesis were focused on the understanding consumer behaviour in
relation to energy consumption, recycling and healthy food consumption by using two
different approaches (‘nudge’ as a behavioural economics approach and “Attitude Behaviour
Context” (ABC) theory).
How should policy makers and managers take all our findings into account?
In chapter 2 our results show that more innovative means should be used to engage citizens or
consumers from unsustainable practices to more environmental friendly actions. For instance,
institutions and environmental associations could consider partnering with energy-saving
companies to promote their innovative products on the market. Private companies could also
play a pivotal role in developing the market demand for energy-saving products. This means
that managers should work on building the level of trust of consumers in their communication
and marketing strategies by providing credible and scientifically-based information on
environmental performance.
In chapter 3 our result suggests that schools, universities and companies should use
awareness raising and externally imposed norms in order to nudge their students and
employees to recycle more. Moreover they should use more convenient and accessible bins
for recycling, making it easier to recycle. For policy makers nudge should be seen as low cost
solution for that can be applied to a wide array of recycling and green behaviour issues.
Our results in chapter 4 show that a nudge was not able to influence significantly consumers’
healthy food purchases. Nudges alone may not be the best solutions to encourage people to
eat healthier. However nudges in combination with some other tools such as; increase of
assortment, reduction of prices of healthy food, introduction of convenient lines, all together
could result in winning combination and promote sales of healthy food.