Embed Size (px)
Citation preview
SUSTAINABLE DEVELOPMENT: CIVIL ENGINEERING AND THE BUILT ENVIRONMENT
INTERNATIONAL CONFERENCE Malta
5th May 2011
08:30 – 09:00
Registration
09:00 – 09:30
Opening Session
Sustainable Development: Civil Engineering & the Built Environment Introduction Vincent Cassar President Kamra tal-Periti
Gorazd Humar President ECCE
Hon. Perit George Pullicino Minister for Resources & Rural Affairs
09:30 – 10:00 Key Note Lecture Richard Coackley, Vice President Institution of Civil Engineers (ICE)
10:00 – 11:00 Session 1 Education in Civil Engineering
Civil Engineering Education in Europe – 2011, 12 years after Bologna I. Manoliu, Technical University of Civil Engineering, Bucharest, Romania
Civil/Structural Engineering Education in the Faculty for the Built Environment – looking ahead. Alex Torpiano, Faculty of the Built Environment, University of Malta
Education: Planning & Infrastructure Paul Gauci, Faculty of the Built Environment, University of Malta
Education in Civil Engineering: Sustainable Construction Ruben Paul Borg, Faculty for the Built Environment, University of Malta
Software & Civil Engineering Education Dion Buhagiar, Faculty of the Built Environment, University of Malta

DEN
IS H
CAM
ILLE
RI
DH
I PER
ITI
- dhc
@dh
iper
iti.c
om
INTE
RN
ATIO
NA
L C
ON
FER
ENC
E Va
lletta
5th
May
201
1
Kamra Tal Periti
European Council of Civil Engineers Tsunami wave hitting sea wall
in Phuket Thailand
Normal Sea Waves At the breakwater , entrance to
Grand harbour
Largest wave displaced boulders, with a mass of 2,000 Tons imply Tsunami surges of 30-40M depth
It is very improbable for wind driven waves to be higher than 12m, with boulders up to 15 tons weight being washed over sea walls 4m above sea level
Wave Forces: Tsunami And Sea Wind Driven in the Mediterranean: Malta’s Scenario
DEN
IS H
CAM
ILLE
RI
DH
I PER
ITI
- dhc
@dh
iper
iti.c
om
INTE
RN
ATIO
NA
L C
ON
FER
ENC
E Va
lletta
5th
May
201
1
Kamra Tal Periti
European Council of Civil Engineers
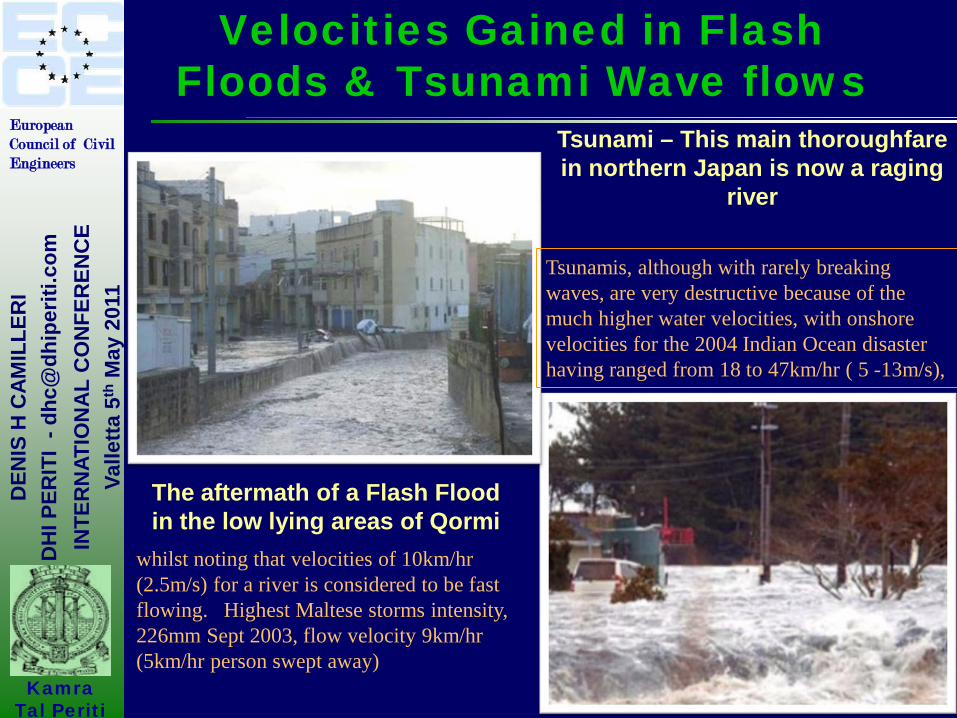
The aftermath of a Flash Flood in the low lying areas of Qormi
Tsunami – This main thoroughfare in northern Japan is now a raging
river
Tsunamis, although with rarely breaking waves, are very destructive because of the much higher water velocities, with onshore velocities for the 2004 Indian Ocean disaster having ranged from 18 to 47km/hr ( 5 -13m/s),
whilst noting that velocities of 10km/hr (2.5m/s) for a river is considered to be fast flowing. Highest Maltese storms intensity, 226mm Sept 2003, flow velocity 9km/hr (5km/hr person swept away)
Velocities Gained in Flash Floods & Tsunami Wave flows

DEN
IS H
CAM
ILLE
RI
DH
I PER
ITI
- dhc
@dh
iper
iti.c
om
INTE
RN
ATIO
NA
L C
ON
FER
ENC
E Va
lletta
5th
May
201
1
Kamra Tal Periti
European Council of Civil Engineers
Table 1: The disturbing forces and typical wavelengths for wind driven waves and tsunami
Thus noting the deepest ocean seas standing at 10,000m , whilst the deepest end of the Mediterranean at 4,000m the sea depth to wavelength ratio for a tsunami wave stands at: 200km/4km = 50 > 20, thus defined as a shallow wave. Shallow water waves are defined as: D/L > ½ With V = (gD) ½ but for Tsunami V=(gD) ½ (Kevlevgen)
Wave Type Typical Wavelength
Disturbing Force
Wind Wave 60-150m Wind over ocean
Seismic sea wave (tsunami)
200 km Faulting of sea floor, volcanic eruption, landslide
Source: Brooks/Cole, a division of Thomson learning, Inc
THE CHARACTERISTICS OF WAVES & BATHYMETRY DATA

DEN
IS H
CAM
ILLE
RI
DH
I PER
ITI
- dhc
@dh
iper
iti.c
om
INTE
RN
ATIO
NA
L C
ON
FER
ENC
E Va
lletta
5th
May
201
1
Kamra Tal Periti
European Council of Civil Engineers Waves grow continuously under the action of wind and their
maximum height reflects the average intensity of the wind along the fetch. Once fully developed wind waves will not develop in size, no matter how long the wind blows. Largest maximum waves of 6m or more are located in the Western Mediterranean and the Ionean Sea under the action of the Maestrale.
A 40-year analysis of Significant Water Heights shows wave heights in the Mediterranean Basin varying from a minimal effect up to 5m tending to 7m, although extraordinary storms with wave heights 10m – 11m have been recorded. Note that the Malta significant wave height is in figure 3 indicated at 3m.
WIND DRIVEN WAVES

DEN
IS H
CAM
ILLE
RI
DH
I PER
ITI
- dhc
@dh
iper
iti.c
om
INTE
RN
ATIO
NA
L C
ON
FER
ENC
E Va
lletta
5th
May
201
1
Kamra Tal Periti
European Council of Civil Engineers
MEDITERREAN WAVE FETCH & Bathymetry
Figure 1: Mediterranean Basin and its Sea Fetch averaging: 3,700km X 1,785km
Source: Google earth with indication of shallow & deep seas in the Mediterranean
Malta’s NNW Fetch - 1,226 km NE Fetch - 647km
DEN
IS H
CAM
ILLE
RI
DH
I PER
ITI
- dhc
@dh
iper
iti.c
om
INTE
RN
ATIO
NA
L C
ON
FER
ENC
E Va
lletta
5th
May
201
1
Kamra Tal Periti
European Council of Civil Engineers
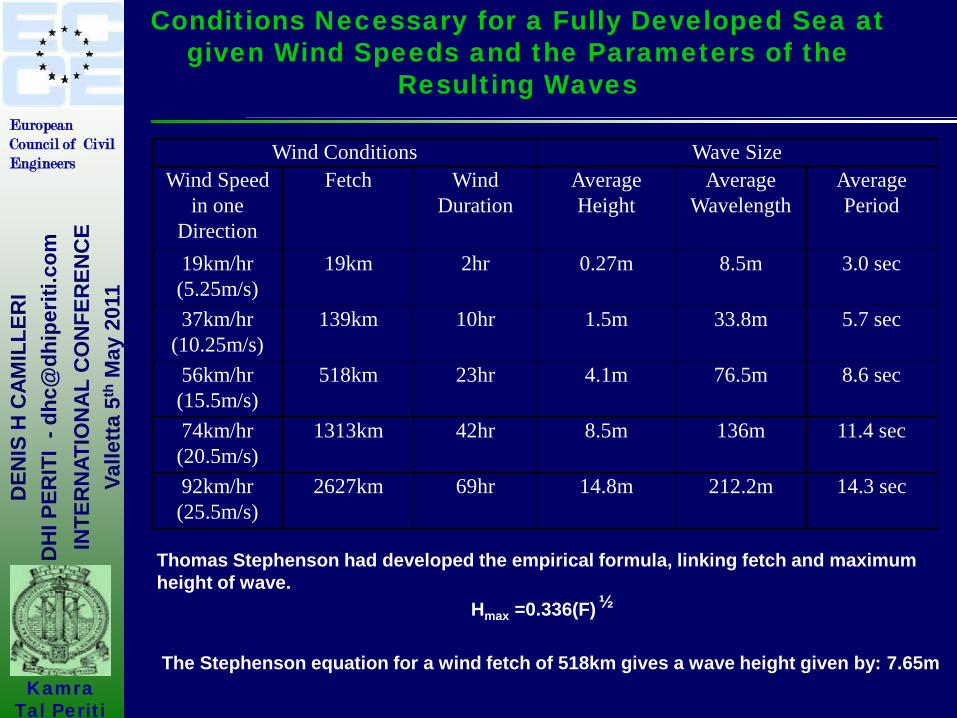
Conditions Necessary for a Fully Developed Sea at given Wind Speeds and the Parameters of the
Resulting Waves
Thomas Stephenson had developed the empirical formula, linking fetch and maximum height of wave. Hmax =0.336(F) ½ The Stephenson equation for a wind fetch of 518km gives a wave height given by: 7.65m
Wind Conditions Wave Size Wind Speed
in one Direction
Fetch Wind Duration
Average Height
Average Wavelength
Average Period
19km/hr (5.25m/s)
19km 2hr 0.27m 8.5m 3.0 sec
37km/hr (10.25m/s)
139km 10hr 1.5m 33.8m 5.7 sec
56km/hr (15.5m/s)
518km 23hr 4.1m 76.5m 8.6 sec
74km/hr (20.5m/s)
1313km 42hr 8.5m 136m 11.4 sec
92km/hr (25.5m/s)
2627km 69hr 14.8m 212.2m 14.3 sec

DEN
IS H
CAM
ILLE
RI
DH
I PER
ITI
- dhc
@dh
iper
iti.c
om
INTE
RN
ATIO
NA
L C
ON
FER
ENC
E Va
lletta
5th
May
201
1
Kamra Tal Periti
European Council of Civil Engineers
SEAWAVE PRESSURES ON VERTICAL FACES
The power of the wind driven waves has been established on whether the walls are subjected to non-breaking (or pulsating), impulsive breaking (impact) or broken wave impact. The greatest force recorded was one of 3.5 tons per square foot (335kN/m2 by Mr. Thomas Stevenson. One thing evident from Mr. Stevenson’s experiments is that the larger the area of the exposed face the less is the pressure recorded, that very high pressures, possibly even exceeding the record of 3.5 tons, may occur on small areas. The main methods used to estimate pulsating wave forces on upright breakwaters, include the work of Hiroi 1919, Ito 1971 and Goda 1985. Sanflou 1928 however, deals with walls in deep water, not subjected to impact forces. Minikin’s method in the early 1950’s, used for breaking waves was found to be too conservative, and has been overtaken by Goda’s method used for both breaking and non-breaking waves.
SEAWAVE PRESSURES ON VERTICAL FACES

DEN
IS H
CAM
ILLE
RI
DH
I PER
ITI
- dhc
@dh
iper
iti.c
om
INTE
RN
ATIO
NA
L C
ON
FER
ENC
E Va
lletta
5th
May
201
1
Kamra Tal Periti
European Council of Civil Engineers
Heroi’s Formula
Minikin Method Goda Method
PRESSURE DISTRIBUTION by BREAKWATER WIND WAVE DRIVEN
WAVES

DEN
IS H
CAM
ILLE
RI
DH
I PER
ITI
- dhc
@dh
iper
iti.c
om
INTE
RN
ATIO
NA
L C
ON
FER
ENC
E Va
lletta
5th
May
201
1
Kamra Tal Periti
European Council of Civil Engineers
Goda method
Minikin method
Hiroi Method
Wave Period (sec) 6 10 6 10 Pl (kN/m2) 26.6 36.4 336 176 65 F (kN/m) 99.6 142 309 194 278 M (kN-m/m) 204 289 772 485 598
Hiroi method gives a force F of 278kN/m, which equates to 3 times the hydrostatic force developed Goda method, equates to 1.2 times the hydrostatic pressure developed. Both these wave pressures are considerable, noting blast explosion loading to be taken at 35kN/m2. This peak value below the still water line decays rapidly with depth, although not being the case of the Hiroi method. A Ciria document notes that the average wave pressure on sea walls varies from 150kN/m2 down to 50kN/m2, with the lower pressures adopted where the wall is very high.
Comparison of wave forces on a 4.3m high wall as calculated by the Goda & Minikin methods
Source: Coastal Technical Note 1988
PRESSURE GENERATED BY WIND DRIVEN SEA WAVES

DEN
IS H
CAM
ILLE
RI
DH
I PER
ITI
- dhc
@dh
iper
iti.c
om
INTE
RN
ATIO
NA
L C
ON
FER
ENC
E Va
lletta
5th
May
201
1
Kamra Tal Periti
European Council of Civil Engineers
MEDITERRANEAN TSUNAMI CHARACTERISTICS
In 365AD an M7.7 in Crete created a tsunami reaching Libya, Egypt, Calabria and as far as Spain – the only tsunami to have propagated across entire Mediterranean 1.5m run up - return period 100 years 4.0m run up - return period 500 years 7.0m run up - return period 1000 years
Source : Swiss Re 1992

DEN
IS H
CAM
ILLE
RI
DH
I PER
ITI
- dhc
@dh
iper
iti.c
om
INTE
RN
ATIO
NA
L C
ON
FER
ENC
E Va
lletta
5th
May
201
1
Kamra Tal Periti
European Council of Civil Engineers
•W. Mediterranean is less prone than EAST.
•Strongest tsunamis are excited in the Aegean Sea, Hellenic & Calabrian areas.
•Greece has had more than 160 events catalogued over 2000 years, although geological record suggests tsunami may have been smaller than described. Even for the 1956 Aegean Tsunami (V) scientific reports considered inaccurate.
MEDITERRANEAN REGIONS TSUNAMI HAZARDS

DEN
IS H
CAM
ILLE
RI
DH
I PER
ITI
- dhc
@dh
iper
iti.c
om
INTE
RN
ATIO
NA
L C
ON
FER
ENC
E Va
lletta
5th
May
201
1
Kamra Tal Periti
European Council of Civil Engineers
------------ Coasts exposed to tsunamis Source: Munich Re, “Flooding and Insurance” 1997.
MEDITERRANEAN AREAS PRONE TO TSUNAMI RISK

DEN
IS H
CAM
ILLE
RI
DH
I PER
ITI
- dhc
@dh
iper
iti.c
om
INTE
RN
ATIO
NA
L C
ON
FER
ENC
E Va
lletta
5th
May
201
1
Kamra Tal Periti
European Council of Civil Engineers
HISTORICAL TSUNAMI HAZARD - MALTA
• Agius de Soldanis recounts how the sea at Xlendi rolled out to about 1 mile sweeping back “con grande impeto e mormorio” (MMXI) 1693
• 1908 Messina (MMXI) flooding occurred an hour later in Msida & M’Xlokk, number of fishing boats damaged high sea level recorded in Grand Harbour.
• 1973 a recession occurred in Salina bay lowering depth by 0.6m event accompanied with rumbling noise.
• 1983 sea in front of the Msida parish church flooded the road

DEN
IS H
CAM
ILLE
RI
DH
I PER
ITI
- dhc
@dh
iper
iti.c
om
INTE
RN
ATIO
NA
L C
ON
FER
ENC
E Va
lletta
5th
May
201
1
Kamra Tal Periti
European Council of Civil Engineers
TSUNAMI RISKS
The greatest tsunami damage with 7.00m ht run-off is from the Aegean Sea with 90min warning.
From Eastern Sicily only a 0.5m high run-off is expected with a 50min warning period.
DEN
IS H
CAM
ILLE
RI
DH
I PER
ITI
- dhc
@dh
iper
iti.c
om
INTE
RN
ATIO
NA
L C
ON
FER
ENC
E Va
lletta
5th
May
201
1
Kamra Tal Periti
European Council of Civil Engineers
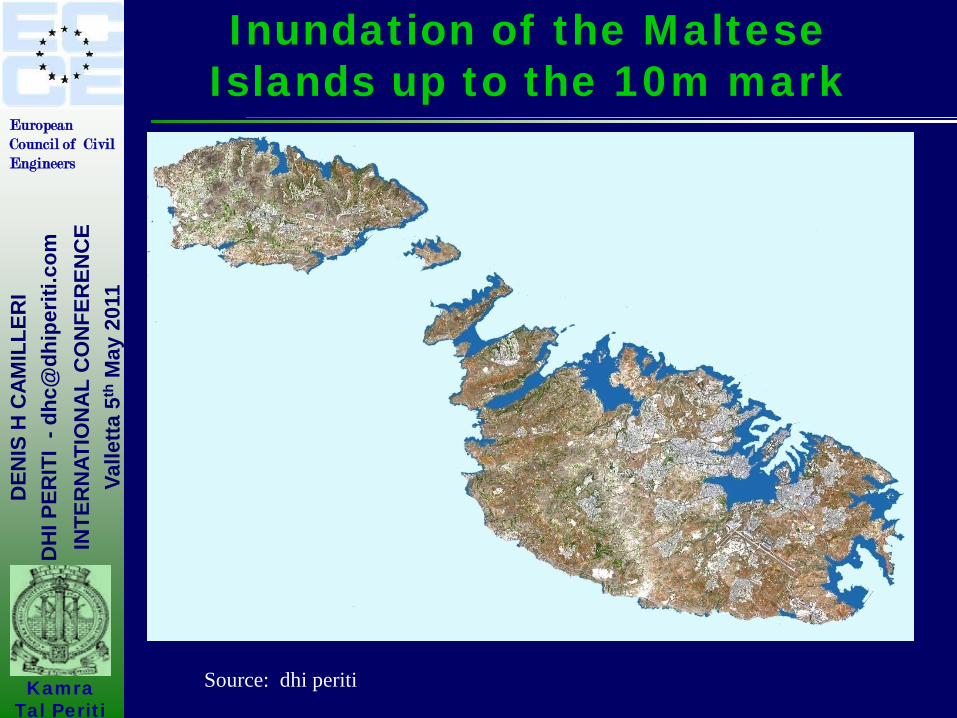
Source: dhi periti
Inundation of the Maltese Islands up to the 10m mark
DEN
IS H
CAM
ILLE
RI
DH
I PER
ITI
- dhc
@dh
iper
iti.c
om
INTE
RN
ATIO
NA
L C
ON
FER
ENC
E Va
lletta
5th
May
201
1
Kamra Tal Periti
European Council of Civil Engineers
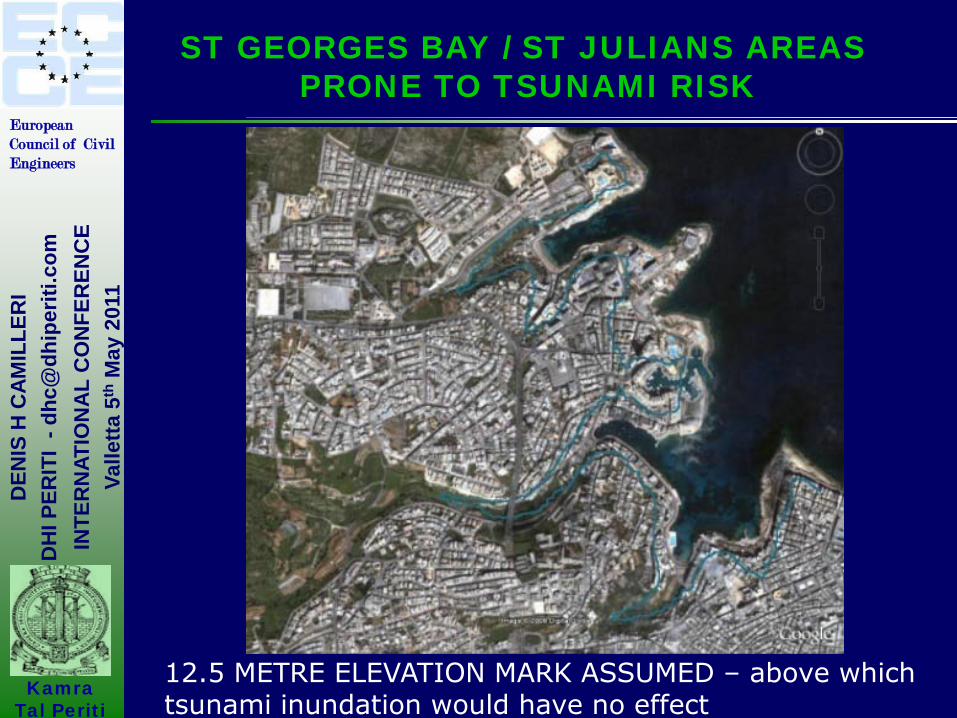
ST GEORGES BAY / ST JULIANS AREAS PRONE TO TSUNAMI RISK
12.5 METRE ELEVATION MARK ASSUMED – above which tsunami inundation would have no effect
DEN
IS H
CAM
ILLE
RI
DH
I PER
ITI
- dhc
@dh
iper
iti.c
om
INTE
RN
ATIO
NA
L C
ON
FER
ENC
E Va
lletta
5th
May
201
1
Kamra Tal Periti
European Council of Civil Engineers
TSUNAMI FORCES
• ∑ horizontal force = hydrostatic + hydrodynamic + impulsive + inertial.
• Tests show that the max wave loading on a wall on impact is 10-12 times the hydrostatic force
• For wave height < 5m & velocity < 5m/s, tsunami force exceeds 5000 kg/m2 with windows and masonry panels expected to fail at 10-20% of this level
DEN
IS H
CAM
ILLE
RI
DH
I PER
ITI
- dhc
@dh
iper
iti.c
om
INTE
RN
ATIO
NA
L C
ON
FER
ENC
E Va
lletta
5th
May
201
1
Kamra Tal Periti
European Council of Civil Engineers
JAPANESE DESIGN METHOD (Okada & al 2004)
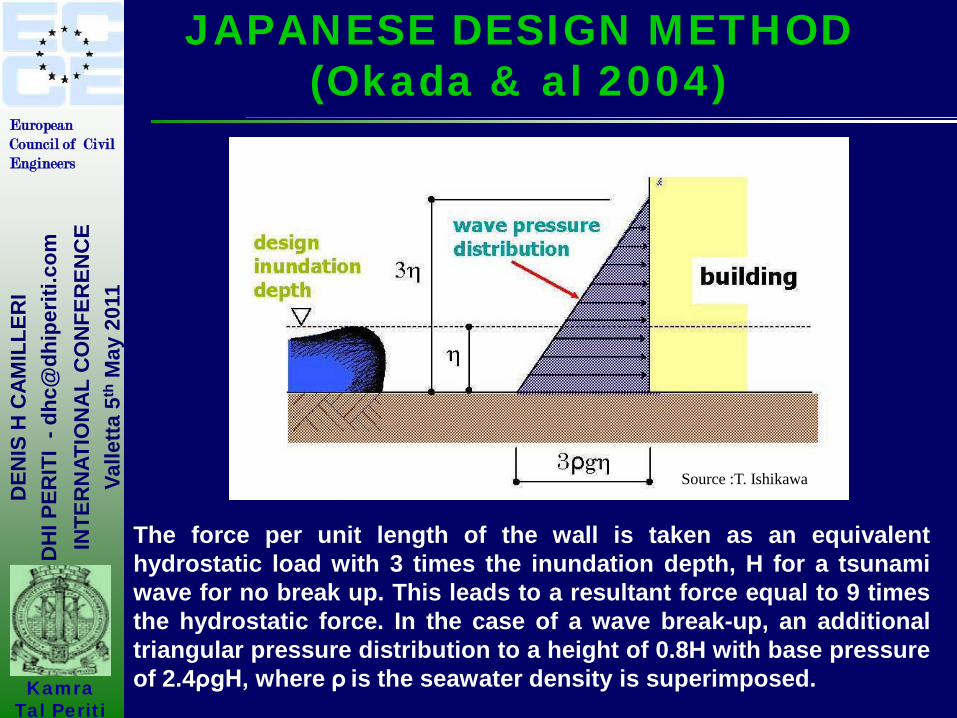
The force per unit length of the wall is taken as an equivalent hydrostatic load with 3 times the inundation depth, H for a tsunami wave for no break up. This leads to a resultant force equal to 9 times the hydrostatic force. In the case of a wave break-up, an additional triangular pressure distribution to a height of 0.8H with base pressure of 2.4ρgH, where ρ is the seawater density is superimposed.
Source :T. Ishikawa

DEN
IS H
CAM
ILLE
RI
DH
I PER
ITI
- dhc
@dh
iper
iti.c
om
INTE
RN
ATIO
NA
L C
ON
FER
ENC
E Va
lletta
5th
May
201
1
Kamra Tal Periti
European Council of Civil Engineers
WAVE PRESSURE DISTRIBUTRION BASED ON BUILDING CONDITIONS
When pressure-resistant members are lower than 3η
Source :T. Ishikawaa
DEN
IS H
CAM
ILLE
RI
DH
I PER
ITI
- dhc
@dh
iper
iti.c
om
INTE
RN
ATIO
NA
L C
ON
FER
ENC
E Va
lletta
5th
May
201
1
Kamra Tal Periti
European Council of Civil Engineers
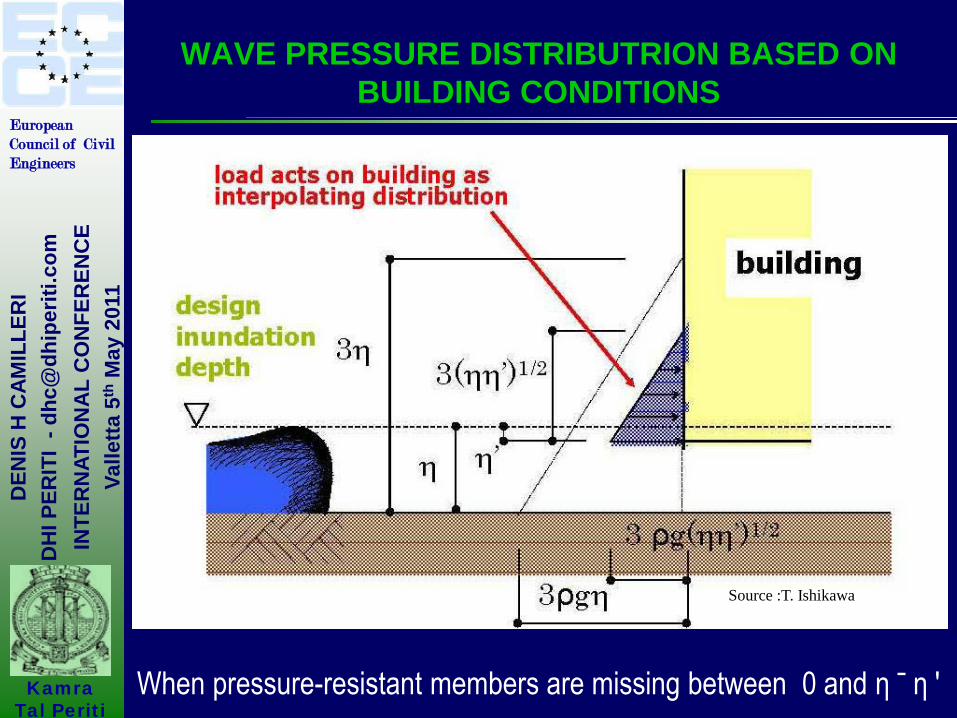
WAVE PRESSURE DISTRIBUTRION BASED ON BUILDING CONDITIONS
When pressure-resistant members are missing between 0 and η ˉ η '
Source :T. Ishikawa

DEN
IS H
CAM
ILLE
RI
DH
I PER
ITI
- dhc
@dh
iper
iti.c
om
INTE
RN
ATIO
NA
L C
ON
FER
ENC
E Va
lletta
5th
May
201
1
Kamra Tal Periti
European Council of Civil Engineers
Setting of Tsunami design load for the buildings which have glass windows
The tsunami wave pressures generated with wall openings of 25% and 50%. Reductions noted in the 15% - 25% and 30% - 40% respectively.
Source :T. Ishikawa
DEN
IS H
CAM
ILLE
RI
DH
I PER
ITI
- dhc
@dh
iper
iti.c
om
INTE
RN
ATIO
NA
L C
ON
FER
ENC
E Va
lletta
5th
May
201
1
Kamra Tal Periti
European Council of Civil Engineers
WAVE FORCES as compared to Hydrostatic FORCE
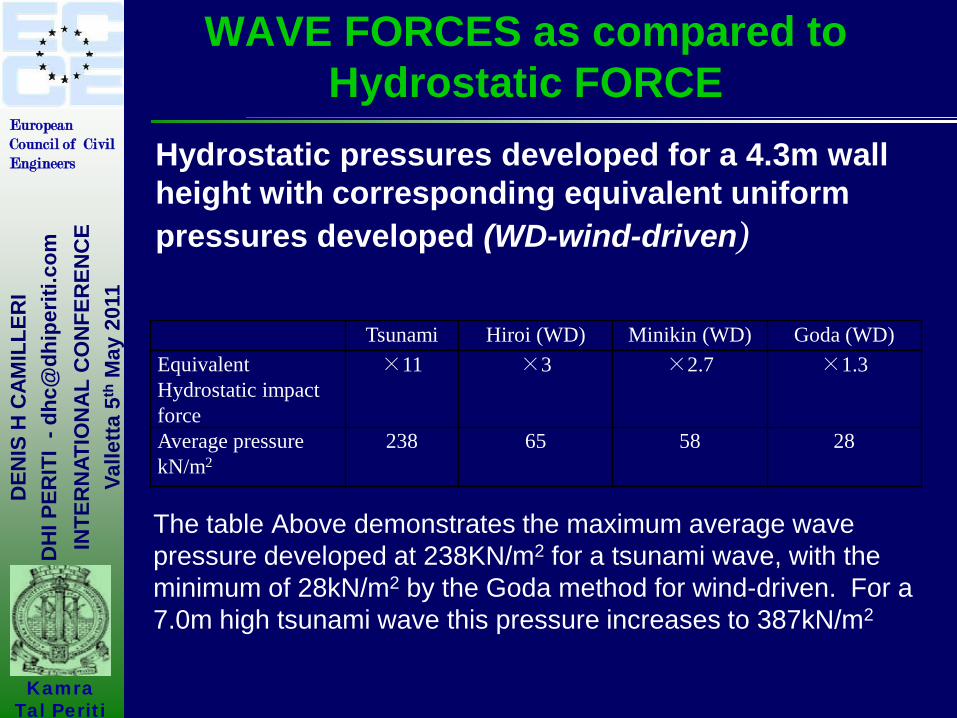
The table Above demonstrates the maximum average wave pressure developed at 238KN/m2 for a tsunami wave, with the minimum of 28kN/m2 by the Goda method for wind-driven. For a 7.0m high tsunami wave this pressure increases to 387kN/m2
Tsunami Hiroi (WD) Minikin (WD) Goda (WD) Equivalent Hydrostatic impact force
×11 ×3 ×2.7 ×1.3
Average pressure kN/m2
238 65 58 28
Hydrostatic pressures developed for a 4.3m wall height with corresponding equivalent uniform pressures developed (WD-wind-driven)
DEN
IS H
CAM
ILLE
RI
DH
I PER
ITI
- dhc
@dh
iper
iti.c
om
INTE
RN
ATIO
NA
L C
ON
FER
ENC
E Va
lletta
5th
May
201
1
Kamra Tal Periti
European Council of Civil Engineers
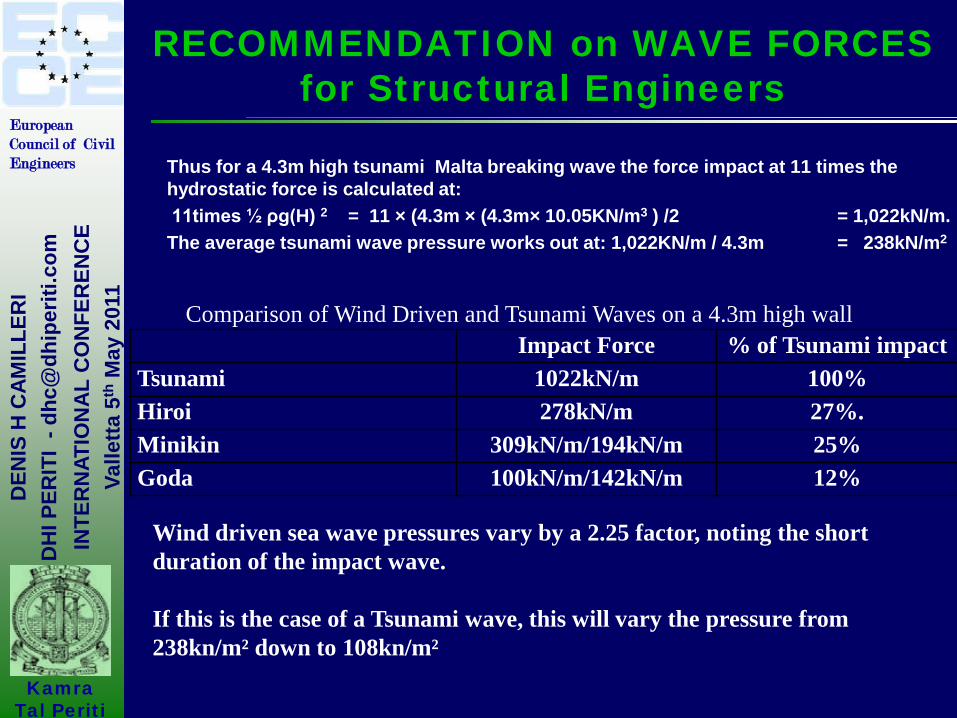
RECOMMENDATION on WAVE FORCES for Structural Engineers
Thus for a 4.3m high tsunami Malta breaking wave the force impact at 11 times the hydrostatic force is calculated at: 11times ½ ρg(H) 2 = 11 × (4.3m × (4.3m× 10.05KN/m3 ) /2 = 1,022kN/m. The average tsunami wave pressure works out at: 1,022KN/m / 4.3m = 238kN/m2
Impact Force % of Tsunami impact Tsunami 1022kN/m 100% Hiroi 278kN/m 27%. Minikin 309kN/m/194kN/m 25% Goda 100kN/m/142kN/m 12%
Comparison of Wind Driven and Tsunami Waves on a 4.3m high wall
Wind driven sea wave pressures vary by a 2.25 factor, noting the short duration of the impact wave. If this is the case of a Tsunami wave, this will vary the pressure from 238kn/m² down to 108kn/m²

DEN
IS H
CAM
ILLE
RI
DH
I PER
ITI
- dhc
@dh
iper
iti.c
om
INTE
RN
ATIO
NA
L C
ON
FER
ENC
E Va
lletta
5th
May
201
1
Kamra Tal Periti
European Council of Civil Engineers
TSUNAMI – SEA WAVE FORCES for the Maltese Islands
SEA WIND damage is greater from the NW with 5.2m high waves developing than from the NE (max wind speed 16 knots) with 3m waves developing. (max wind speed 22 knots) Greater Tsunami damage however may occur from the Eastern side, with 5m tsunami waves developing.