Embed Size (px)
Citation preview

Policy Research Working Paper 8481
Sustainable Development Goals Diagnostics
An Application of Network Theory and Complexity Measures to Set Country Priorities
M. H. El-MaghrabiS. Gable
I. Osorio RodarteJ. Verbeek
Office of the Senior Vice PresidentUN Relations and PartnershipsJune 2018
WPS8481P
ublic
Dis
clos
ure
Aut
horiz
edP
ublic
Dis
clos
ure
Aut
horiz
edP
ublic
Dis
clos
ure
Aut
horiz
edP
ublic
Dis
clos
ure
Aut
horiz
ed

Produced by the Research Support Team
Abstract
The Policy Research Working Paper Series disseminates the findings of work in progress to encourage the exchange of ideas about development issues. An objective of the series is to get the findings out quickly, even if the presentations are less than fully polished. The papers carry the names of the authors and should be cited accordingly. The findings, interpretations, and conclusions expressed in this paper are entirely those of the authors. They do not necessarily represent the views of the International Bank for Reconstruction and Development/World Bank and its affiliated organizations, or those of the Executive Directors of the World Bank or the governments they represent.
Policy Research Working Paper 841
This paper is a product of the Office of the Senior Vice President, 2030 Agenda, UN Relations and Partnerships. It is part of a larger effort by the World Bank to provide open access to its research and make a contribution to development policy discussions around the world. Policy Research Working Papers are also posted on the Web at http://www.worldbank.org/research. The authors may be contacted at [email protected].
The United Nations 2030 Agenda and the Sustainable Devel-opment Goals are comprehensive and holistic in nature, as they includes 17 goals and 169 targets covering economic, social, and environmental dimensions of development. In this context, policy makers face the challenge of translating the global agenda into feasible yet ambitious development plans and policies. This paper presents a methodology that can assist policy makers in prioritizing the targets of the Sustainable Development Goals within their develop-ment plans, given elements of path dependency among the goals. The method used is based on the notion that existing patterns of development outcomes can reveal infor-mation about the commonalities in countries’ unobservable Sustainable Development Goal delivery mechanisms. The ease with which capacities can be used between Sustainable
Development Goals depends on their degree of commonal-ity, conceptualized in the proximity between them. Related to this, the paper introduces Sustainable Development Goal centrality as a measure of connectedness. In addition, it defines a country’s Sustainable Development Goals den-sity to indicate how close an “unsuccesful” Sustainable Development Goals is to those Sustainable Development Goals in which a country is performing well. The paper concludes that countries should prioritize the Sustainable Development Goals that are within reach (high density) and/or offer higher scope for success through redeploy-ment of existing capacities (high centrality). It applies the method to show how this can help countries prioritize implementation of the Sustainable Development Goals.
SustainableDevelopmentGoalsDiagnostics:AnApplicationofNetworkTheoryandComplexity
MeasurestoSetCountryPriorities
M.H.El‐Maghrabi,*S.Gable, I.OsorioRodarte,*andJ.Verbeek*1
Keywords: Sustainable Development Goals, network theory and implementation, economic complexity, proximity, centrality, density, benchmarking of the SDGs
JEL Classification: C50, D85, H11, I00, O19, O21, O50
* All with the World Bank Group. + Chief Economist of Swedish International Development Cooperation Agency. 1 The paper was prepared under the general guidance of Mahmoud Mohieldin and benefitted from Hans Lofgren’s constructive engagement. This note is part of a series of analytical initiatives by the Office of the World Bank’s Senior Vice‐President of the 2030 Agenda, UN Relations and Partnerships. In addition, the Office of the Senior Vice President produced the “Trajectories for Sustainable Development Goals” (Gable et al., 2015), which included ten country case studies encompassing the earlier SDG Country Development Diagnostic framework, as well as the report “Financing for Development Post‐2015” (World Bank, 2013) and Sustainable Development Goals Diagnostics: The Case of Egypt (Amin‐Salem et al, 2018). The findings, interpretations, and conclusions expressed in this paper are entirely those of the authors. They do not necessarily represent the views of the International Bank for Reconstruction and Development/World Bank and its affiliated organizations, or those of the Executive Directors of the World Bank or the governments they represent.

2. Existing tools for SDG benchmarking
2
1. Introduction
The UN 2030 Agenda and the Sustainable Development Goals (SDGs) are comprehensive and holistic in nature, as they include 17 goals and 169 targets covering economic, social, and environmental dimensions of development. The highly ambitious agenda stresses that all individuals shall collectively benefit from the fruits of development and that no one shall be left behind. In this context, policy makers face the challenge of translating the global agenda into feasible yet sambitious development plans and policies. Hence, there is a need to develop methodologies that can assist during different steps in this process: from data measurement and benchmarking, to prioritization of targets and monitoring of progress. Tailored to their individual national development plans and under the auspices of the global agenda, these methods should be transparent and replicable.
This paper presents a methodology that can assist policy makers to prioritize targets related to their SDG development plans. The methodology uses extensively a global database on SDG progress constructed mainly with data from the United Nations and the World Bank. The methodology proposes a set of metrics that indicate the probability of becoming an over‐achiever in a particular SDG indicator, a probability that is conditional on progress on the rest of the SDGs.
The method is based on the notion that existing patterns of development outcomes can reveal information about the commonalities that exist in the unobservable SDG‐delivery mechanisms that exist within countries. It is natural to think that countries have a diversity of capacities in the form of skills, culture, infrastructure, roads, natural resources, technology, institutions, systems of government, religion, etc. In addition, through a process of collective action, countries’ SDG‐delivery mechanisms are (intentionally and non‐intentially) created, and their effectiveness is reflected in the achievement of observable development outcomes.
The approach used in this paper is largely based on the basic notions of economic complexity (Hartmann, Guevara, Jara‐Figueroa, Aristarán, & Hidalgo, 2015; Hausmann et al., 2013; Hausmann & Klinger, 2006; Hidalgo, Klinger, Barabasi, & Hausmann, 2007). Our hypothesis is that if a set of positive development outcomes are observed frequently co‐existing across countries, then there are strong commonalities in the mechanisms of SDG‐delivery that make possible these positive development outcomes. For instance, secondary and primary completion rates are two indicators that are strongly correlated – and it can clearly be seen that the first indicator is conditional on the later and that some (but not all) of the capacities used to over‐perform in primary completion can be re‐used for completion in secondary education. Our hypothesis simply implies that the probability of succeeding in an SDG target can be estimated conditionally on the observed progress on all other targets. To assess this hypothesis, we built measures of SDG progress at the detailed indicator level, largely based on the methodology of Gable, Lofgren, & Osorio‐Rodarte, (2015), and propose a set of metrics based on network theory and economic complexity to test our hypothesis. Examples of questions that will be addressed are as followed:
How are the SDGs interconnected? What is the probability of over‐performing in a particular SDG, given progress in
others? Does achievement in some targets tend to promote progress on others?
The paper begins in Section 2 by assessing recent efforts to create similar SDG‐related benchmark and scorecard tools. Section 3 discusses the compiled SDG data, its coverage, and caveats, and presents our methodological framework, which includes a metrics

2. Existing tools for SDG benchmarking
3
derived from network theory and economic complexity. Section 4 presents an application to a country‐specific case. Section 5 concludes with areas for further development and research.
2. Existing tools for SDG benchmarking Several initiatives to define measurement standards, identify statistical gaps, collect
cross‐country comparable data, and monitor progress in SDGs have been launched. Some of these recent efforts are highlighted below.
The Overseas Development Institute (ODI) produced scorecards to illustrate long‐term projections for the achievement of the 2030 Agenda (Nicolai, Hoy, Berliner, & Aedy, 2015). Each scorecard classifies the effort needed in three groups: (i) Reform – if there is a need for better targeted solutions to accelerate progress; (ii) Revolution – significant action and innovation required; and (iii) Reversal – complete and total revision is compulsory. The scorecards produce a more complete and sharper understanding of the global challenge; however, they rely heavily on regional aggregates, thus limiting the application at the country level.
The SDG Index and Dashboards (Sachs, Schmidt‐Traub, Duran‐Delacre, & Teksoz, 2017) address country‐level objectives by ranking countries based on their overall SDG achievements. Presently, 39 indicators, equally weighted, are included in the index. An additional SDG Dashboard proposal was constructed as a tool to visually present data for each country and goal. Its purpose is to highlight one’s most pressing constraints to identify priorities in which an evaluation of policy is urgent. The initiative started with data for OECD countries.
Le Blanc's (2015) study explores the extent to which the structure of the proposed goals and associated targets necessitate better integration across sectors through the analysis of the target statements. This study constructs a network built on the interpretation of the wording for targets as it has been stipulated in each goal. As such, the resulting network can be thought of as a “political mapping,” i.e., a reflection of the consensus among stakeholders as far as how they perceive the connection between the SDGs.
The Country Development Diagnostics Framework (Gable et al., 2015) is used to examine country‐specific progress conducive to the achievement of the SDGs. The analysis relies on cross‐country data; however, the outcomes are specific to each country considering its capacity level, proxied by income per capita. The framework is implemented as follows:
o Benchmarking recent outcomes for SDG target indicators inclusive of the factors (including policies) that influence them – how well is a country doing compared to other countries at similar levels of per‐capita incomes?
o Projecting 2030 outcomes for selected indicators (when the association between GNI per capita and indicators is deemed sufficiently strong) – under current trends and given expected growth, what are likely achievements for SDG indicators by 2030?
o Assessing options for accelerated progress – what can a country do to increase financial space destined to fulfill the SDG agenda?
3. Methodological framework
4
3. Methodological framework
Constructing a global SDG database
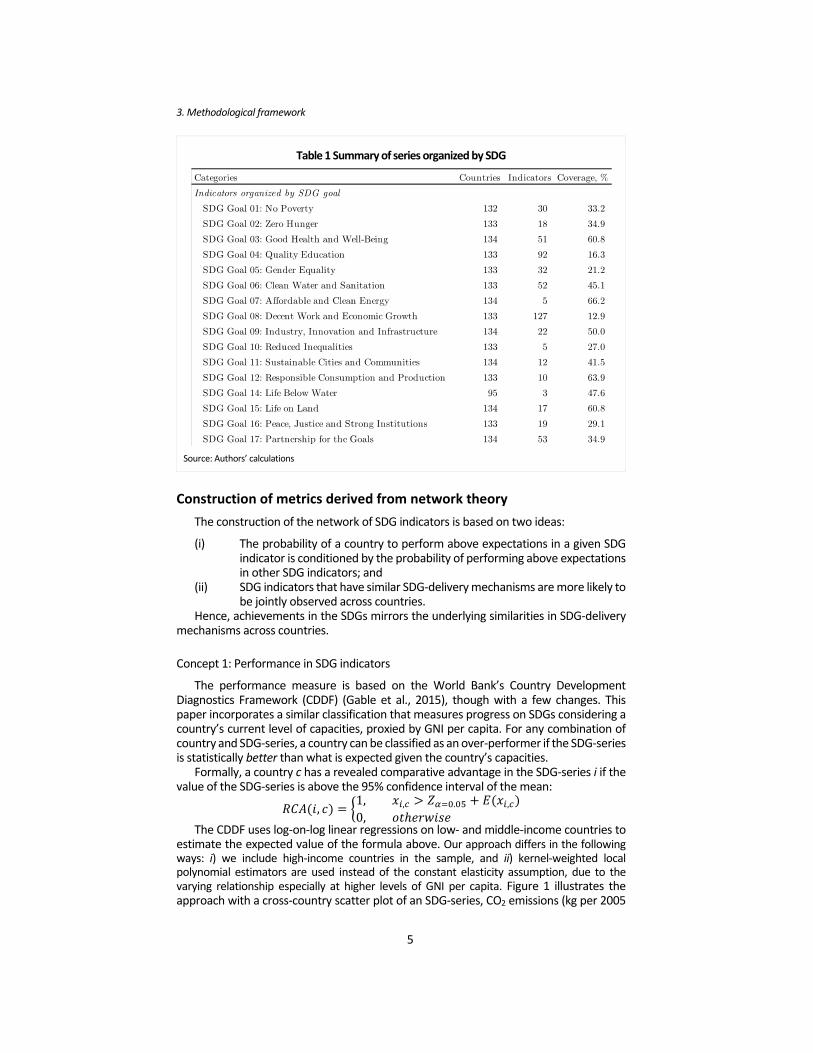
In March 2016, the United Nations Statistical Commission’s Interagency and Expert Group on SDG Indicators (IAEG‐SDGs) agreed on 231 SDG indicators to monitor and evaluate progress on the 17 goals and 169 targets of the 2030 Agenda. Each indicator can contain several data series, for instance if it is disaggregated by gender, location, or age. Recognizing that the level of methodological consistency and coverage differs significantly among the SDG indicators, a ier classification was designed to monitor progress on both the methodological aspects and cross‐country coverage. In this classification, approximately 45 percent of the indicators are classified within Tier I, having both an adequate methodology for measurement and sufficient coverage across countries. About a quarter of all indicators are classified as Tier II, indicating that the methodology is adequate, but coverage across countries is limited. Lastly, around 30 percent of indicators are categorized as Tier III. These indicators lack both an adequate methodology and consistent coverage across countries.2
Despite the immense challenges posed by limited SDG global coverage, for the purpose of this study, IAEG‐SDG data,3 the World Bank’s SDG database (WB‐SDGs), and additional external data have been merged, producing a database inclusive of the majority of Tier 1 indicators that can be organized by SDG goal or indicator. To maximize coverage, the most recent observation per SDG has been selected by country and series, within the latest 10 years. Also, some variables originally expressed in absolute values have been transformed into relative units of measurement to make them meaningful, for instance dividing them by a country’s population or GDP. Additionally, each observation is matched with the corresponding GNI per capita value for the country/year in question.4 Table 1 presents summary statistics of the database in question.
2 The distribution of data coverage might play a crucial role in the results presented in this paper; but it is hard to quantify the importance of unknown data. Arguably, the current distribution of data coverage reflects the evolving interests of the development community and policy makers. Under this argument, it is not totally surprising that coverage is biased towards the indicators included in the original MDGs, since most countries established the MDGs as benchmarks for progress. 3 The SDG Goals data is from the UN’s Sustainable Development Goals Indicator website, August 17, 2016: http://unstats.un.org/sdgs/ 4 Data can be found at: https://www.researchgate.net/publication/315497169_Compiled_UN_SDG_Global_Database_update_March_22_2017
3. Methodological framework
5
Construction of metrics derived from network theory
The construction of the network of SDG indicators is based on two ideas:
(i) The probability of a country to perform above expectations in a given SDG indicator is conditioned by the probability of performing above expectations in other SDG indicators; and
(ii) SDG indicators that have similar SDG‐delivery mechanisms are more likely to be jointly observed across countries.
Hence, achievements in the SDGs mirrors the underlying similarities in SDG‐delivery mechanisms across countries.
Concept 1: Performance in SDG indicators
The performance measure is based on the World Bank’s Country Development Diagnostics Framework (CDDF) (Gable et al., 2015), though with a few changes. This paper incorporates a similar classification that measures progress on SDGs considering a country’s current level of capacities, proxied by GNI per capita. For any combination of country and SDG‐series, a country can be classified as an over‐performer if the SDG‐series is statistically better than what is expected given the country’s capacities.
Formally, a country c has a revealed comparative advantage in the SDG‐series i if the value of the SDG‐series is above the 95% confidence interval of the mean:
,1, , . ,
0,
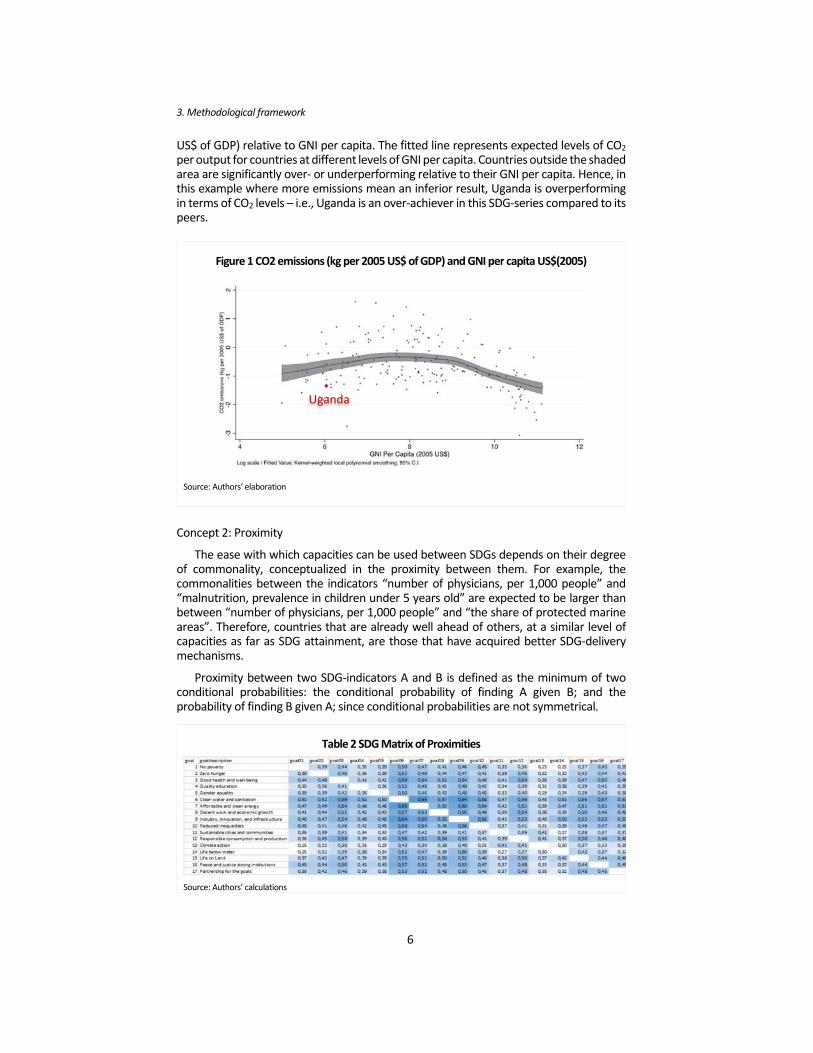
The CDDF uses log‐on‐log linear regressions on low‐ and middle‐income countries to estimate the expected value of the formula above. Our approach differs in the following ways: i) we include high‐income countries in the sample, and ii) kernel‐weighted local polynomial estimators are used instead of the constant elasticity assumption, due to the varying relationship especially at higher levels of GNI per capita. Figure 1 illustrates the approach with a cross‐country scatter plot of an SDG‐series, CO2 emissions (kg per 2005
Table 1 Summary of series organized by SDG
Source: Authors’ calculations
3. Methodological framework
6
US$ of GDP) relative to GNI per capita. The fitted line represents expected levels of CO2
per output for countries at different levels of GNI per capita. Countries outside the shaded area are significantly over‐ or underperforming relative to their GNI per capita. Hence, in this example where more emissions mean an inferior result, Uganda is overperforming in terms of CO2 levels – i.e., Uganda is an over‐achiever in this SDG‐series compared to its peers.
Concept 2: Proximity
The ease with which capacities can be used between SDGs depends on their degree of commonality, conceptualized in the proximity between them. For example, the commonalities between the indicators “number of physicians, per 1,000 people” and “malnutrition, prevalence in children under 5 years old” are expected to be larger than between “number of physicians, per 1,000 people” and “the share of protected marine areas”. Therefore, countries that are already well ahead of others, at a similar level of capacities as far as SDG attainment, are those that have acquired better SDG‐delivery mechanisms.
Proximity between two SDG‐indicators A and B is defined as the minimum of two conditional probabilities: the conditional probability of finding A given B; and the probability of finding B given A; since conditional probabilities are not symmetrical.
Figure 1 CO2 emissions (kg per 2005 US$ of GDP) and GNI per capita US$(2005)
Source: Authors’ elaboration
Table 2 SDG Matrix of Proximities
Source: Authors’ calculations
Uganda

3. Methodological framework
7
Concept 3: Centrality
Another important concept is an SDG’s “centrality.” Centrality of an SDG is the sum of all their SDG pair‐wise proximities; as such, it is used as a measure of connectedness. High centrality indicates that the SDG has a multitude of SDGs in its proximity, i.e., if a country is successful in that SDG, it is likely that it will be successful in many others. It should be noted given that we have yet to introduce country‐specific concepts, an SDG’s centrality is singular across all countries. It is expected that central SDGs, meaning those that appear to be better connected with the rest of the network; are fundamental to redeploy and scale up SDG‐delivery mechanisms and thereby be successful in achieving the overall SDG agenda.
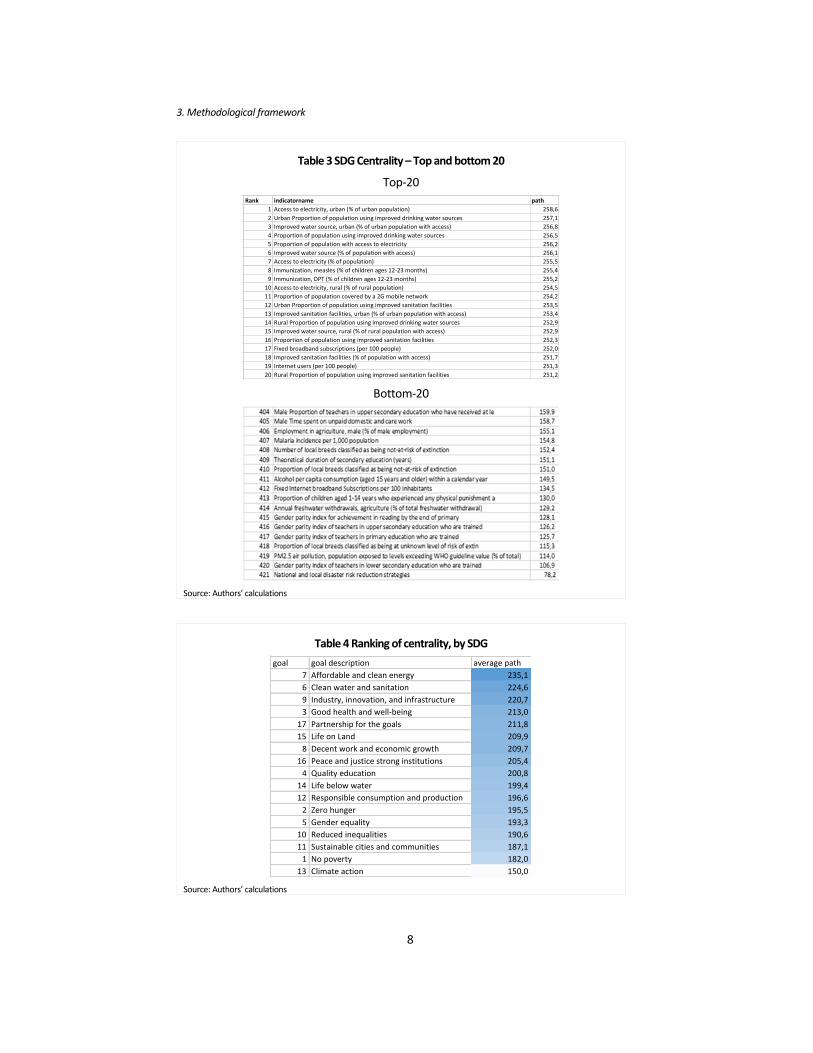
Table 3 presents the top 20 and the bottom 20 SDGs, ranked according to centrality. Not surprisingly, different measures of access to electricity are among the most connected SDGs, implying that if a country has successfully provided access to electricity, it is likely that success will ensue in other SDGs as well. As further indicated by Table 3, the groups of SDGs that exhibit high centrality are improved water and sanitation facilities, internet connectivity, school enrollment, and immunization. The least connected, however, appear to be far more diverse. This is also expected since if an SDG‐series has limited connection to the other SDGs, it implies that the former has very unique, non‐transferable, requirements for its SDG‐delivery. For example, as seen in Table 3, having a nondiscrimination clause mentioning gender within a constitution may not be strongly related to the other SDGs because the SDG‐delivery mechanism, changing the law, cannot be redeployed to other development outcomes, i.e., reduce mortality.
Table 4 ranks the 17 goals by their average centrality, based on the centrality of the underlying SDG‐series for each goal. The goal with the highest average centrality is SDG 7: Affordable and Clean Energy, followed by SDG 6: Clean Water and Sanitation, SDG 9: Industry, Innovation and Infrastructure, and SDG 3: Good Health and Well‐being. The values underscore that on average, fulfillment in these SDG areas yields a higher probability of success that will also be exhibited in other SDG areas. This metric implies that SDG‐delivery mechanisms put in place to over‐perform in the indicators within SDG 1: No Poverty and SDG 13: Climate Action are indeed very specific and cannot easily be redeployed to achieve targets in other goals.
3. Methodological framework
8
Table 3 SDG Centrality – Top and bottom 20
Top‐20
Bottom‐20
Source: Authors’ calculations
Table 4 Ranking of centrality, by SDG
Source: Authors’ calculations
Rank indicatorname path
1 Access to electricity, urban (% of urban population) 258,6
2 Urban Proportion of population using improved drinking water sources 257,1
3 Improved water source, urban (% of urban population with access) 256,8
4 Proportion of population using improved drinking water sources 256,5
5 Proportion of population with access to electricity 256,2
6 Improved water source (% of population with access) 256,1
7 Access to electricity (% of population) 255,5
8 Immunization, measles (% of children ages 12‐23 months) 255,4
9 Immunization, DPT (% of children ages 12‐23 months) 255,2
10 Access to electricity, rural (% of rural population) 254,5
11 Proportion of population covered by a 2G mobile network 254,2
12 Urban Proportion of population using improved sanitation facilities 253,5
13 Improved sanitation facilities, urban (% of urban population with access) 253,4
14 Rural Proportion of population using improved drinking water sources 252,9
15 Improved water source, rural (% of rural population with access) 252,9
16 Proportion of population using improved sanitation facilities 252,3
17 Fixed broadband subscriptions (per 100 people) 252,0
18 Improved sanitation facilities (% of population with access) 251,7
19 Internet users (per 100 people) 251,3
20 Rural Proportion of population using improved sanitation facilities 251,2
goal goal description average path7 Affordable and clean energy 235,1
6 Clean water and sanitation 224,6
9 Industry, innovation, and infrastructure 220,7
3 Good health and well‐being 213,0
17 Partnership for the goals 211,8
15 Life on Land 209,9
8 Decent work and economic growth 209,7
16 Peace and justice strong institutions 205,4
4 Quality education 200,8
14 Life below water 199,4
12 Responsible consumption and production 196,6
2 Zero hunger 195,5
5 Gender equality 193,3
10 Reduced inequalities 190,6
11 Sustainable cities and communities 187,1
1 No poverty 182,0
13 Climate action 150,0
4. Prioritizing SDGs
9
Concept 4: A country’s SDG density
Density in a given SDG is a country‐ and SDG‐specific concept. In the context of the SDG network and for a particular SDG, the ease for a country of becoming an over‐performer depends on: (i) the other SDGs in which the country is over‐performing; and (ii) the proximity from the target SDG to each of the others on which the country is over‐performing. Formally, the density for a country c in SDG j, on which it is under‐performing, is the sum of proximities between SDG j and all other successful SDGs, scaled by the sum of all proximities leading to SDG j (i.e., scaled by its centrality):
where denotes the proximity between SDGs i and j. The density of any SDG lies between 0 and 1. The higher the density of a non‐successful SDG, the closer its required capacities are to the country’s existing ones. Hence, density is defined on the basis of the proximities of the SDG to other SDGs in which the country is successful.
In sum, countries should prioritize SDGs that: Are within reach (high density, reflecting that the country has most of the
capacities) Offer higher scope for further diversification (high centrality, reflecting that
if the country is capable of producing this SDG it will very likely be capable of producing others).
Hence, it may come down to a trade‐off between “low‐hanging fruit” (due to the position of the country in the network) and high diversification return through a larger investment in new capacities.
4. Prioritizing SDGs While the result of the proximity matrix and the centrality measure for each SDG is
universal and creates the basic SDG network, the level of density for each SDG differs among countries since countries are successful in different parts of the network. If a country is successful in a dense part of the network, it means its current capacities can be used to diversify its SDG focus of implementation. If it is in a sparse part of the network, the opportunity set is limited. In both cases, a long‐term view is needed to ensure sustainable improvements on the SDG agenda, which means a jump to a high centrality SDG may be advisable even if the proximity is currently low. The country then must invest in new capacities that in the future will pay off in more diversity options. Using the example of Uganda, this section illustrates how these concepts can be used to assess policy options.
Figure 2 and Figure 3 show two SDGs for which Uganda is currently underperforming, that is for which Uganda is currently unsuccessful compared to what is expected for a typical country at Uganda’s income per capita level. Which one should Uganda prioritize? There are of course a number of factors to take into account to answer that question, but among those would be; (i) the easiness of success given current capacities (density), and (ii) the potential for further improvement it creates (centrality).
iij
cii
ij
cj
x
density
otherwise.0
1 if1 cici
RCAx and ij

4. Prioritizing SDGs
10
In a horizontal line, Figure 4 shows the proximity of other SDGs in relation to the two SDGs in question. SDG (a) is here access to electricity (% of population) and SDG (b) HIV incidence (rate, total population). Each gray circle or green dot represents another SDG indicator and the further away they are from the red circle (representing SDG (a) or SDG (b) with the normalized maximum centrality of 1) the lower the proximity. The green dots represent the SDGs where Uganda is currently successful and the circles where it is not.
Figure 2 Uganda, Access to electricity (% of the population)
Source: Authors’ elaboration
Figure 3 Uganda, HIV incidence rate
Source: Authors’ elaboration
Uganda
Uganda

4. Prioritizing SDGs
11
The centrality for a) access to electricity is 255 and for b) HIV incidence is 212. The
question is where in the network Uganda is, given it’s current capacities, i.e., its current successful SDGs. Calculating Uganda’s density with regard to each of these SDGs, it turns out that Uganda is somewhat closer in capacities to a) access to electricity, with density 0.594, than b) HIV incidence, 0.590. Hence, the fact that access to electricity has both higher density and centrality, suggests that it should be prioritized over HIV incidence (all else equal and no weights attached to the different goals).
Figure 4 Centrality and density for Uganda in Access to electricity and HIV incidence
Source: Authors’ calculations
Figure 5 Centrality and density for Uganda in Access to electricity and Child marriage
Source: Authors’ calculations
4. Prioritizing SDGs
12
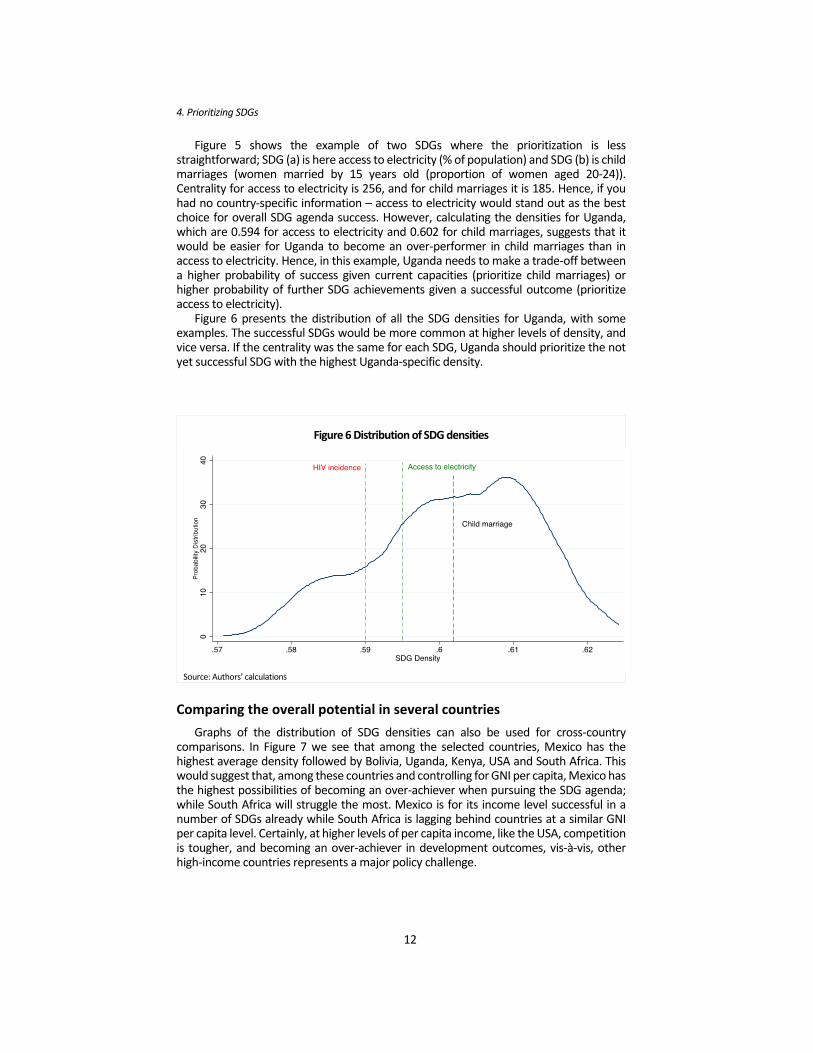
Figure 5 shows the example of two SDGs where the prioritization is less straightforward; SDG (a) is here access to electricity (% of population) and SDG (b) is child marriages (women married by 15 years old (proportion of women aged 20‐24)). Centrality for access to electricity is 256, and for child marriages it is 185. Hence, if you had no country‐specific information – access to electricity would stand out as the best choice for overall SDG agenda success. However, calculating the densities for Uganda, which are 0.594 for access to electricity and 0.602 for child marriages, suggests that it would be easier for Uganda to become an over‐performer in child marriages than in access to electricity. Hence, in this example, Uganda needs to make a trade‐off between a higher probability of success given current capacities (prioritize child marriages) or higher probability of further SDG achievements given a successful outcome (prioritize access to electricity).
Figure 6 presents the distribution of all the SDG densities for Uganda, with some examples. The successful SDGs would be more common at higher levels of density, and vice versa. If the centrality was the same for each SDG, Uganda should prioritize the not yet successful SDG with the highest Uganda‐specific density.
Comparing the overall potential in several countries
Graphs of the distribution of SDG densities can also be used for cross‐country comparisons. In Figure 7 we see that among the selected countries, Mexico has the highest average density followed by Bolivia, Uganda, Kenya, USA and South Africa. This would suggest that, among these countries and controlling for GNI per capita, Mexico has the highest possibilities of becoming an over‐achiever when pursuing the SDG agenda; while South Africa will struggle the most. Mexico is for its income level successful in a number of SDGs already while South Africa is lagging behind countries at a similar GNI per capita level. Certainly, at higher levels of per capita income, like the USA, competition is tougher, and becoming an over‐achiever in development outcomes, vis‐à‐vis, other high‐income countries represents a major policy challenge.
Figure 6 Distribution of SDG densities
Source: Authors’ calculations

4. Prioritizing SDGs
13
The shape of the distribution matters. A narrow probability distribution means that most SDGs have similar levels of density for the country in question. A broad probability distribution means that the density differs significantly between SDGs. Hence, the country has a higher potential to achieve some of the goals, but a lower potential to achieve others, suggesting an SDG network analysis would be very helpful in prioritizing SDG initiatives. With the average density in each country, it is possible to rank countries in terms of their potential for SDG improvement (not SDG levels achieved). Table 5 presents the top 15 and bottom 15 countries.
Figure 7 Distribution of densities for a sample of countries
Source: Authors’ calculations
Table 5 Average density in selected countries
TOP 15 BOTTOM 15
CountryAveragedensity Country
Averagedensity
Bulgaria 0,703 Micronesia 0,161
Panama 0,672 Afghanistan 0,159
Ecuador 0,671 Andorra 0,141
Peru 0,663 Tuvalu 0,118
Colombia 0,663 SãoToméandPríncipe 0,116
Chile 0,656 SanMarino 0,112
CostaRica 0,655 Palau 0,099
Mexico 0,641 MarshallIslands 0,092
Argentina 0,641 FaroeIslands 0,085
Vietnam 0,632 Yemen,Rep. 0,081
Madagascar 0,629 Morocco 0,075
Uruguay 0,628 Liechtenstein 0,061
Korea,Rep. 0,627 Greenland 0,058
Germany 0,623 IsleofMan 0,017
Hungary 0,621 Chile 0,008Source: Authors’ calculations
5. Conclusion
14
Another example showcasing the SDG network method compares the number of SDGs in which countries are succesful to their density. Mexico and Bolivia are successful with about the same number of SDG indicators included in this study: 282 in Mexico and 271 in Bolivia. Despite this, Mexico’s density is significantly higher than for Bolivia. This means Mexico’s successes are located in a more dense part of the SDG network, i.e., Mexico is doing well in those SDGs that have a high potential to make the development of other SDGs successful. The implication is that it would be easier for Mexico than for Bolivia to take advantage of its opportunities.
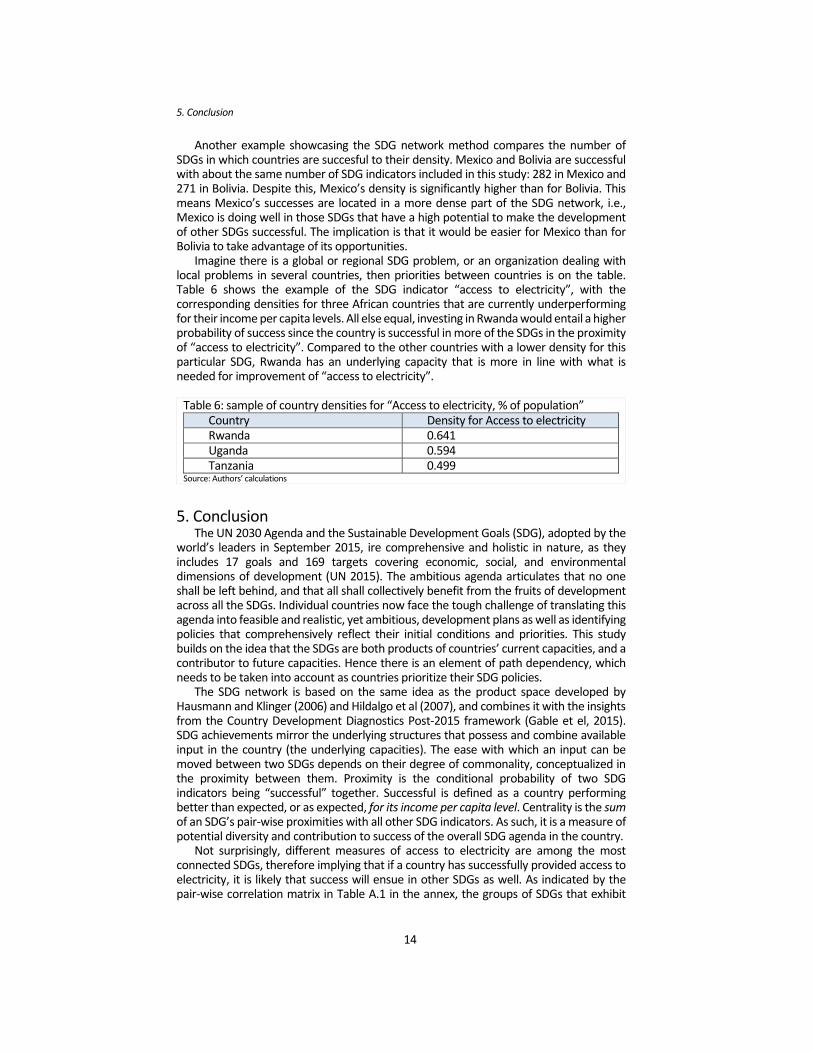
Imagine there is a global or regional SDG problem, or an organization dealing with local problems in several countries, then priorities between countries is on the table. Table 6 shows the example of the SDG indicator “access to electricity”, with the corresponding densities for three African countries that are currently underperforming for their income per capita levels. All else equal, investing in Rwanda would entail a higher probability of success since the country is successful in more of the SDGs in the proximity of “access to electricity”. Compared to the other countries with a lower density for this particular SDG, Rwanda has an underlying capacity that is more in line with what is needed for improvement of “access to electricity”.
Table 6: sample of country densities for “Access to electricity, % of population”
Country Density for Access to electricity Rwanda 0.641 Uganda 0.594 Tanzania 0.499
Source: Authors’ calculations
5. Conclusion The UN 2030 Agenda and the Sustainable Development Goals (SDG), adopted by the
world’s leaders in September 2015, ire comprehensive and holistic in nature, as they includes 17 goals and 169 targets covering economic, social, and environmental dimensions of development (UN 2015). The ambitious agenda articulates that no one shall be left behind, and that all shall collectively benefit from the fruits of development across all the SDGs. Individual countries now face the tough challenge of translating this agenda into feasible and realistic, yet ambitious, development plans as well as identifying policies that comprehensively reflect their initial conditions and priorities. This study builds on the idea that the SDGs are both products of countries’ current capacities, and a contributor to future capacities. Hence there is an element of path dependency, which needs to be taken into account as countries prioritize their SDG policies.
The SDG network is based on the same idea as the product space developed by Hausmann and Klinger (2006) and Hildalgo et al (2007), and combines it with the insights from the Country Development Diagnostics Post‐2015 framework (Gable et el, 2015). SDG achievements mirror the underlying structures that possess and combine available input in the country (the underlying capacities). The ease with which an input can be moved between two SDGs depends on their degree of commonality, conceptualized in the proximity between them. Proximity is the conditional probability of two SDG indicators being “successful” together. Successful is defined as a country performing better than expected, or as expected, for its income per capita level. Centrality is the sum of an SDG’s pair‐wise proximities with all other SDG indicators. As such, it is a measure of potential diversity and contribution to success of the overall SDG agenda in the country.
Not surprisingly, different measures of access to electricity are among the most connected SDGs, therefore implying that if a country has successfully provided access to electricity, it is likely that success will ensue in other SDGs as well. As indicated by the pair‐wise correlation matrix in Table A.1 in the annex, the groups of SDGs that exhibit

5. Conclusion
15
high centrality are improved water and sanitation facilities, internet connectivity, school enrollment, and immunization. The least connected, however, appear to be far more diverse. However, it is important to note that if an SDG has limited connection to the success of other SDGs, it does not imply that the SDG is irrelevant.
The methodology is then used for country‐specific assessment, by introducing the concept of density. Density is defined on the basis of the proximities of the SDG to other SDGs in which the country is successful. Hence, it is a country‐specific measure that differs for each SDG indicator. The higher the density of a non‐successful SDG, the closer its required capacities are to the country’s existing ones, and the easier it will be for the country to turn it into a successful SDG. When comparing two SDG policy options for a country, the country‐specific density for each SDG indicator (i.e., its easiness of success), must then be weighted against the cross‐country centrality of each SDG indicator (i.e., its connectiveness to other SDGs and hence potential for further improvement). Furthermore, countries can be ranked according to their average density, or their density for a specific SDG in question.
The awareness of country‐specific path dependency will be important in order achieve an efficient and successful prioritization of the SDG agenda in each country. However, it needs to take into account the level of data limitations and be combined with other studies, not least cost benefit analyses and political economy analyses. In addition, this approach assumes that all SDG targets have equal value in themselves, while those values may differ between SDG targets and for each country.
References
16
References Amin‐Salem, H., M.H. El‐Maghrabi, I. Osorio Rodarte, and J. Verbeek (2018). Sustainable
development goal diagnostics : the case of the Arab Republic of Egypt (English). Policy Research working paper; no. WPS 8463. Washington, D.C. : World Bank Group. http://documents.worldbank.org/curated/en/532831528165791465/Sustainable‐development‐goal‐diagnostics‐the‐case‐of‐the‐Arab‐Republic‐of‐Egypt
Gable, S. E., Lofgren, H., & Osorio‐Rodarte, I. (2015). Trajectories for sustainable development goals : framework and country applications. Washington D.C: World Bank. Retrieved from https://openknowledge.worldbank.org/handle/10986/23122
Hartmann, D., Guevara, M. R., Jara‐Figueroa, C., Aristarán, M., & Hidalgo, C. A. (2015). Linking Economic Complexity, Institutions and Income Inequality. Physics and Society. Retrieved from http://arxiv.org/abs/1505.07907
Hausmann, R., Hidalgo, C. A., Bustos, S., Coscia, M., Chung, S., Jimenez, J., … Yildirim, M. A. (2013). The Atlas of Economic Complexity. Center for International Development Harvard University. Retrieved from http://atlas.media.mit.edu/book/
Hausmann, R., & Klinger, B. (2006). Structural Transformation and Patterns of Comparative Advantage in the Product Space. CID Working Paper (Vol. no. 128.). Cambridge, Mass.: Center for International Development at Harvard University. Retrieved from http://discovery.lib.harvard.edu/?itemid=%7Clibrary/m/aleph%7C010148641
Hidalgo, C. A., Klinger, B., Barabasi, A. L., & Hausmann, R. (2007). The product space conditions the development of nations. Science, 317(5837), 482–487.
Le Blanc, D. (2015). Towards Integration at Last? The Sustainable Development Goals as a Network of Targets. Sustainable Development, 23(3), 176–187. https://doi.org/10.1002/sd.1582
Nicolai, S., Hoy, C., Berliner, T., & Aedy, T. (2015). Projecting progress: reaching the SDGs by 2030. Retrieved from https://www.odi.org/publications/9895‐projecting‐progress‐reaching‐sdgs‐2030
Sachs, J. D., Schmidt‐Traub, G., Duran‐Delacre, D., & Teksoz, K. (2017). SDG Index & Dashboards Report 2017. New York. Retrieved from http://www.sdgindex.org
World Bank. (2013). Financing for development post 2015. Washington, D.C. Retrieved from http://documents.worldbank.org/curated/en/206701468158366611/Financing‐for‐development‐post‐2015

Annex A: Results using pair‐wise correlations
17
Annex A: Results using pair‐wise correlations To investigate the statistical relationship between indicators, targets, and goals a
simple pair‐wise correlation was first used. Pair‐wise correlations indicate the extent of which two variables are moving together; if two variables show a strong correlation, it suggests that the behavior of one variable affects the other. However, it may also indicate the existence of an additional third variable that is affecting the former variables.
To summarize results from pair‐wise correlations, the 423 indicators were grouped by SDG goal and average pair‐wise correlation are presented in the matrix in Table A.1. In the table, darker colors indicate stronger average correlations. Since our goal is to support country‐specific prioritization of the SDGs, it is also important to advise on policy directions given the country’s current capacities and resources. This is especially true if the results differ significantly depending on the income per capita level. To further investigate this, we divide the sample into two sub‐samples; (i) low‐ and middle‐income countries, and (ii) high‐income countries.
In the entire sample and for the sample with only low and middle‐income countries, the goals that seem to have the strongest correlation with the other goal’s SDG indicators are “poverty reduction,” “clean water and sanitation,” “affordable and clean energy,” “gender equality,” “sustainable cities and communities,” and “health.” Table A.2 presents the average correlation of one specific SDG to all other SDGs. While it goes beyond this study to explain why specific goals are correlated with others, it is worth noticing that indicators with less of a global “public good” and more of a national “public good” character seem to have a stronger pair‐wise correlation. They are easier to address for a specific country once the resources are there, and may be hence be more strongly correlated with a third variable; the national income per capita.
The order of the goals, beginning with the strongest correlation to the other goals, alters subsequent to changes in the income level of the sample (see Table A.2). For example, “peace and justice” and “climate action” takes the place of “clean water and sanitation” and “affordable and clean energy,” which have less of a variation in a sample of only high‐income countries. With that being said, while we cannot compare the strength of the correlations across groups due to the varying sample sizes, we observe that the ranking of goals in terms of how strongly correlated they are to the other goals, changes. We therefore need a method that can (1) assess the implications for specific countries, and (2) control for income level. Consequently, to allow for the ability to advise countries with different capacities on how to prioritize their SDGs, we turn to network analysis in the next section.
While this report focuses on correlations between goals, it is also of great interest to see how the SDG indicators within the same goal are correlated. As observed in Table A.3, the strongest correlation is among the indicators related to SDG 1: No Poverty followed by SDG 7: Affordable Energy, SDG 6: Clean water and Sanitation, and lastly, SDG 3: Good Health and Well‐Being. The goals with the least correlated indicators are SDG 10: Reduced Inequalities and SDG 17: Partnership for the Goals. Identifying the reasons that perpetuate these results will not be investigated in this paper, though it should be noted that in some cases, it may indicate a too fragmented goal, which may affect the ability to identify efficient policies.

Annex A: Results using pair‐wise correlations
18
Table A.1a: Pair‐wise Correlation Matrix by Goal – All Countries.
Table A.1b: Pair-wise Correlation Matrix by Goal – Low and Middle-Income Countries.
Table A.1c: Pair‐wise Correlation Matrix by Goal – High Income Countries.
Table A.2: Between goals correlation – averages.

Annex A: Results using pair‐wise correlations
19
Table A.3: Within goals correlations – whole sample.
goal goaldescription within_corr
1 No poverty 64,8
7 Affordable and clean energy 49,4
6 Clean water and sanitation 45,9
3 Good health and well‐being 30,1
9 Industry, innovation, and infrastructure 28,2
4 Quality education 28,1
8 Decent work and economic growth 28,0
5 Gender equality 27,9
15 Life on Land 24,4
12 Responsible consumption and production 22,6
2 Zero hunger 22,2
16 Peace and justice strong institutions 20,9
11 Sustainable cities and communities 19,8
17 Partnership for the goals 17,1
10 Reduced inequalities 14,2
13 Climate action14 Life below water

Annex B: Economic complexity and the development of nations.
20
Annex B: Economic complexity and the development of nations. The SDG network analysis has borrowed concepts from the economic complexity
methodology. This annex explains briefly the main concepts of economic complexity. The process of structural transformation asserts that over time, as economic growth accelerates, a wider range of capacities are created, permitting the production of a larger selection of goods and services. Moreover, an additional feature of structural transformation is an increase in the human capacity to produce more technologically sophisticated goods and services i.e. an increase in the complexity of the economic system that fulfills a greater variety of needs. The product space approach articulates that the capacity of knowledge embedded in a society is not dependent on the amount of knowledge each individual possesses, but rather, the diversity of knowledge across individuals and a society’s ability to both use and combine such knowledge through a complex web of interactions (market, institutions, etc.).
The PS approach holds that the composition of produced goods and services mirrors the underlying structures that possess and combine this knowledge, and that this composition is not well captured by standard aggregate economic indicators. The ease with which the knowledge embedded in available production inputs can be transferred and recombined is an immense determinate of a producer’s ability to offer a larger and more complex set of goods and services (associated with higher productivity levels). The ease with which an input can be moved between two products is dependent on their degree of commonality.
In this context, Hausmann and Klinger (2006) started by proposing a measure of proximity based on observed patterns of diversification across countries. Specifically, they use the concept of conditional probabilities of co‐exporting pairs of products as the building block in the construction of a square matrix of proximities (the “PS map”). They show that products exported by stagnant countries tend to be isolated, located in the sparsest and less connected parts of the PS map, while products exported by countries with higher long‐run GDP growth rates tend to be in the densest part. Hence, the location of a country’s export mix in PS matters for growth.
Hidalgo and Hausmann (2011) embark in the study of the sequential evolution of economies—from the production of less sophisticated to more sophisticated activities. Economic complexity illustrates that economic development is not only a process of continuous improvement in the production of the same goods, but also one that requires structural transformation; that is, the accumulation of the capacities needed to upgrade production (by transferring resources) toward activities associated with higher levels of productivity. Moreover, such shift is the catalyst to fast and sustained growth, further implying that development is a path‐dependent process. The only feasible way to traverse it is through significant structural transformation.