Embed Size (px)
Citation preview
Sustainable development indicators at Macro Level: Green
Accounting

Indicators for Sustainable Development
1. Organizing one-dimensional indicators and how they can be used– PSR model of the UN– CSD indicator set for SD– Example indicators for SED
2. Overview over integrative indicators– Objective, definitions and purpose– Sustainable income– SEEA system– Economic welfare– Human welfare

Indicators
• Quantify and Simplify phenomena
• Inform and Alert about changes taking place in systems
• Their use / utility depends on the context• Should also be designed to help decision makers
understand why change is taking place
WARNING function
1. Organizing one-dimensional indicators

PSR (Pressure, State Response) Indicator Organizing Tool
• This framework has formed the basis for ongoing developments of the Driving- Force- State- Response (DSR) and the Driving-Force, Pressure- State- Impact- Response (DPSIR)
• Used e.g. in the UN indicator system– Indicators for sustainable energy
development, now transformed to the CSD system

PSR Tool

PSR Tool

Adapted from: Pinter et al, UNEP, IISD & Ecologistics International, 1999
Human ActivitiesthatInfluencethe environment
Condition of the
Environment
Response to Prevent / Reduce Negative Impact

Ongoing Development of PSR
PSR:Pressure - State - Response
DSR:Driving Force - State - Response
DPSIR: Driving Force - Pressure - State - Impact - Response

Pressure
• human activities• trade, and consumption
The pressures Human Society puts on the environment, as a result of:
These activities, or Driving Forces, result in direct pressures on the environment such as:
• pollution• resource depletion
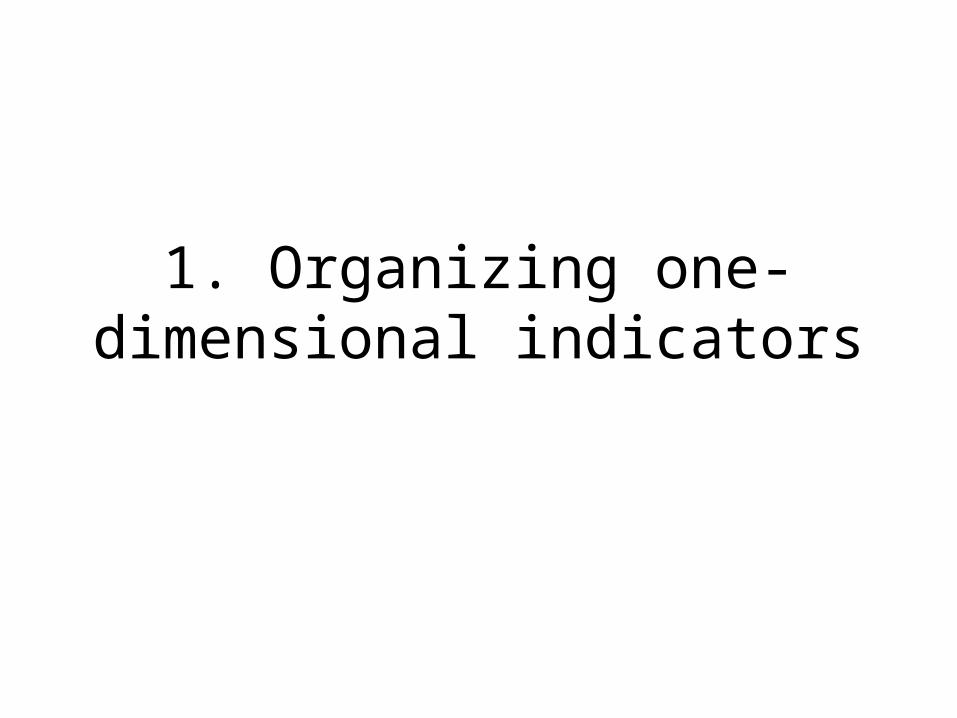
State• Condition (typically of the environment) that
results from the pressures, e.g. pollution levels, degree of land degradation or extent of deforestation
• These changed conditions may, in turn, affect human health and well-being
• One therefore needs an understanding of both the State of the Environment as well as the direct and indirect effects - or Impacts

Response
Relates to actions taken by society either individually or collectively,
to prevent or mitigate against negative environmental impacts,
to correct existing damage,
or, to conserve natural resources

Responses Include• Regulatory action &
Instruments of Policy • Public opinion & consumer preference • Changed management strategies• Environmental or research expenditure • Provision of environmental information

Example: Indicators for Sustainable Energy Development
• Energy is central to the three dimensions of SD:– Driver of
macroeconomic growth
– Prereq. for increased human welfare
– Causes environmental stress

Importance
• SED is a central component in the quest towards SD
• Discussed in Stockholm, Rio and Johannesburg

CSD indicators for SD
1. Core set of 58 indicators with flexible adaptation at the national level
2. Description of themes and sub-themes
3. Methodology sheet for each indicator by lead agency
4. Guidelines for national implementation

CSD framework
Dimension ThemeSub-Theme
Indicators
Social
Environmental
Economic
Institutional

SOCIAL
Theme Sub-theme Indicator
EquityPoverty
Percent of Population Living below Poverty Line
Gini Index of Income Inequality
Unemployment Rate
Gender Equality Ratio of Average Female Wage to Male Wage
Health
Nutritional Status Nutritional Status of Children
MortalityMortality Rate Under 5 Years Old
Life Expectancy at Birth
Sanitation Percent of Population with Adequate Sewage Disposal Facilities
Drinking Water Population with Access to Safe Drinking Water
Healthcare Delivery
Percent of Population with Access to Primary Health Care Facilities
Immunization against Infectious Childhood Diseases
Contraceptive Prevalence Rate
EducationEducation Level
Children Reaching Grade 5 of Primary Education Adult
Adult Secondary Education Achievement Level
Literacy Adult Literacy Rate
Housing Living Conditions Floor Area per Person
Security Crime (36, 24) Number of Recorded Crimes per 100,000 Population
Population Population ChangePopulation Growth Rate
Population of Urban Formal and Informal Settlements

ENVIRONMENTAL
Theme Sub-theme Indicator
Atmosphere
Climate Change Emission of Greenhouse Gases
Ozone Layer Depletion Consumption of Ozone Depleting Substances
Air Quality Ambient Concentration of Air Pollutants in Urban Areas
Land
Agriculture (14)
Arable and Permanent Crop Land Area
Use of Fertilizers
Use of Agriculture Pesticides
Forest (11)Forest Area as a Percent of Land Area
Wood Harvesting Intensity
Desertification (12) Land Affected by Desertification
Urbanization (7) Area of Urban Formal and Informal Settlements
Oceans, Seas and Coasts
Coastal ZoneAlgae Concentration in Coastal Waters
Percent of Total Population Living in Coastal Areas
Fisheries Annual Catch by Major Species
Fresh WaterWater Quality
Annual Withdrawal of Ground and Surface Water as a Percent of Total Available Water
Water QualityBOD in Water Bodies
Concentration of Faecal Coliform in Freshwater
BiodiversityEcosystem
Areas of Selected Key Ecosystems
Protected Area as a % of Total Area
Species Abundance of Selected Key Species

INSTITUTIONAL
Theme Sub-theme Indicator
Institutional Framework
Strategic Implementation
Of SD (8)National Sustainable Development Strategy
International Cooperation Implementation of Ratified Global Agreements
Institutional
Capacity
Information Access (40) Number of Internet Subscribers per 1000 Inhabitants
Communication Infrastructure (40)
Main Telephone Lines per 1000 Inhabitants
Science
and Technology (35)Expenditure on Research and Development as a Percent GDP
Disaster Preparedness
and ResponseEconomic and Human Loss Due to Natural Disasters

ECONOMIC
Theme Sub-theme Indicator
Economic
Structure
Economic PerformanceGDP per Capita
Investment Share in GDP
Trade Balance of Trade in Goods and Services
Financial StatusDebt to GNP Ratio
Total ODA Given or Received as a Percent of GNP
Consumption
and Production Patterns
Material Consumption Intensity of Material Use
Energy Use
Annual Energy Consumption per Capita
Share of Consumption of Renewable Energy Resources
Intensity of Energy Use
Waste Generation and Management
Generation of Industrial and Municipal Solid Waste
Generation of Hazardous Waste
Generation of Radioactive Waste
Waste Recycling and Reuse
Transportation Distance Traveled per Capita by Mode of Transport

CSD approach
• Non-integrative
• Multi-indicator approach
• Others try to incorporate all into one index - one value.

2. Overview over integrative indicators
Objective, definitions and purposeSustainable incomeSEEA systemEconomic welfareHuman welfare

Integrated indicators CSD, PSR
– Non-integrative– Multi one-dimensional indicator approach
Integrated indicators– Incorporate two or more metrics within or between dimensions into one
indicator– SNI, ISEW (between dimensions)– HDI (within human dimension)
Multi-dimensional indicators– Incorporate more than one dimensions into one metric– Not necessarily composite– Often graphical displays of more than one dimension at a time

Distinction between various accounting concepts – what is the context?

Goals for National Accounting

Weak vs. Strong Sustainability
• Weak sustainability– Contain the sum of man-made and natural capital
• Sum non-declining• Requires pricing of natural capital
– Assumes substitutability between man-made and natural capital
– Depletion of natural capital can be offset by creation of man-made capital
– “Consumption may be held constant in the face of exhaustible resources only if the rents deriving from the inter-temporally efficient use of those resources are reinvested in the reproducible capital.” (Hartwick rule)”

Strong sustainability
Strong sustainability– Separate sum of Man-made and natural capital non-declining
• Total stock of man-made capital non-declining• Total stock of natural capital non-declining
– Assumes very little substitutability between man-made and natural capital
Planning– Limit human scale– Technological change must be efficiency increasing– Use of NC must be sustainable
• Use of RNC cannot exceed regeneration• Do not exceed waste assimilative capacity• Non-renewable NC?

Goals for National Accounting

Marketed
• GNP• NNP = GNP - depreciation• NNP’ = NNP - depreciation of natural capital (or
income*user cost ratio)– El Serafy– User cost ratio: 1-X/R = (1/(1+r)^n+1)
X: true incomeR: net revenuen: life expectancyr: discount rate
Describes fraction that cannot account as income – due to depletion of resources (or natural capital), fraction subtracted from income

NNP’ - example
• Lifetime 10 years
• r = 5%
• User cost ratio:= (1/(1+0.05))^11
Interpretation?
Higher discount rate?

Economic Income
• Weak sustainability:– Sum of all capital non-declining
• Measures:– ENNP, SEEA– ENNP = NNP - ED - DS– Where:
• ED = Value of current environmental damage– Subtract from income (e.g. added cost due to water pollution)
• DS = Depreciation of natural capital, using user cost e.g. Value of changing the size of the stocks.
– Smaller stocks, less sustainable

Economic Income
• Strong Sustainability– Human, man-made and natural capital must
separately be non-declining.
• Metric:– Sustainable national income (SNI)– SNI = NNP - replacement cost for all non-
sustainable use of natural capital.– SEEA

Sustainable National Income (SNI)
Income that can be sustained each year – implies sustainable use of resources
• Replacement cost: The cost of restoring natural capital to its “sustainable” state using damage curves
• Sustainable state - Examples: – Fisheries, where recruitment=deaths– Soils, where regeneration=erosion– Acidification, critical load=>defines a sustainability standard

Damage Curves
Damage curves describe the marginal cost of reducing environmental burdens to the sustainability standard - or to its original state.
How created?• Based on shadow prices of environmental functions• Environmental functions defined (e.g. regeneration of a
fish stock)• Environmental burdens defined (e.g. Fishing, thermal
pollution to the ocean) – What affects the functioning of the environment
• Sustainability standard defined– How much burden the environment can take and still be
sustained

SNI Process
1. Quantify the environmental burden
2. Compile the standards to the environmental burdens
3. Formulate measures necessary to meet those standards - how can we reduce the burdens
4. Estimate cost curves associated with implementing those measures
5. Total the costs
6. Deduct from national income

SNI Issues
• Estimates not based on preferences
• Estimate static
• Does not indicate state of environment– Technological change not accounted for e.g.
• Irreversible losses cannot be quantified
• Very time-consuming
• Hard to define the sustainability standard

SEEA
• System of integrated Economic and Environmental Accounting
• Satellite Accounting to conventional income accounts
• Focus on natural capital – not human or social capital
• Two main issues:– 1. Requires the description of environment in physical
terms. A distinction has to be made between natural and manmade assets. Natural assets consists of biological assets, land and water areas with their ecosystems, subsoil assets and air.
SEEA
Two main issues:– 2. Requires the valuation of natural assets.
• Natural assets provide both marketable and non-marketable services and therefore their valuation requires the use of market and non-market valuation techniques.
• Also it is not possible to value all ecosystem functions of natural assets that are described in the physical accounts that show the economy and environment inter-linkages.

SEEA
• Contains:– Physical flow accounts– Accounts that link physical and monetary data
(hybrid accounts) – Environmental protection and resource
management accounts – Natural resource asset accounts
• Both monetary and physical
– Environmentally adjusted macroeconomic indicators

SEEA
• Physical flow accounts– Four kinds of flows
• Products• Natural resources (minerals, energy, soil, water,
biological material)• Ecosystem inputs (support services)• Residuals (waste)
– Two spheres• Economic• Environmental
SEEA
• Hybrid accounts– Simultaneous display of monetary and
physical accounts– Easy comparison where pollution is coming
from e.g.– I-O framework

SEEA
• Environmental protection and resource management accounts– Disaggregation of data from the conventional
accounts on environmental protection expenditures
• E.g. Pollution prevention, management of natural resources
• Can view where environmental costs are the highest – compared to economic output
• Framework created by Eurostat

SEEA
• Natural resource asset accounts– Both physical and monetary– Excludes many ecosystem services
• Difficult to define ownership
– Accumulation accounts, balance sheets• State at time t, again at time t+1
– Fisheries, forestry, water, subsoil, land– Critique: difficult to do when market prices do
not exist

SEEA
• Environmentally adjusted asset accounts– Combining the metrics– Subtracting loss in natural resources and
damage to the environment from conventional income

Economic Welfare
• Two main metrics:– Measure of economic welfare (MEW)
• Nordhaus and Tobin
– Indicator of Sustainable Economic Welfare (ISEW), Now called GPI (genuine progress indicator)
• Daily and Cobb

ISEW
• Adjust GNP:– Adjusts for income distribution
• Multiply by the index of income distribution - as given by the Gini Coefficient as (1-gini)
• Gini from 0-1, 5 income groups - measures distribution between them. 0= perfect, 20% each of income

Gini

ISEW
– Includes value of household work and non-market activities (add)
• E.g. measures as time*wages per hour per domestic workers
– Services of household capital (durability - add) (new purchase drives up GDP)
– Services of government capital (add)• Only services from highways and streets (7.5% of
net stock)
– Adjusts for loss in leasure time (subtract)• Since 1969

ISEW
– Cost of underemployment (subtract)– Cost of commuting (subtract)– Cost of personal pollution control (subtract)– Cost of automobile accidents (subtract)– Depreciation of active natural capital
• Cost of water pollution (quality, siltation)• Cost of air pollution
– E.g. reduction in yield– Damage to materials– Reduction in property values– Loss in visibility
• Cost of noise pollution

ISEW
• Includes changes in the stock of fixed reproducible capital (subtract)– Loss in wetlands– Loss of farmland– Depletion of non-renewable resources– Long term environmental damage– Cost of ozone depletion– Loss of forests
• Net capital investment (add or subtract)• Net foreign lending or borrowing (add or
subtract)

Index of GNP and ISEW

Human Welfare
• Direct metrics of human welfare– Human Development Index
• UNDP• Data from UN Human Development Report
– Happiness• Questionnaires regarding satisfaction with life• Age, physical health, family situation, employment,
education and income

HDI
• Accounts for:– Longevity - measured by life expectancy– Knowledge
• Adult literacy (2/3)• Mean year of schooling (1/3)
– Standard of living• GDP corrected by PPP

HDI calculation
http://hdr.undp.org/
http://hdr.undp.org/hdr2006/statistics/• Formula
I = (Xij - Xi,min)/(Xi,max - Xi,min)
HDI = SUM(I/3)
• i: variable i• j: country j
Max 1

HDI Results
• Norway (unchanged); 0.965• Iceland (unchanged); 0.960• Australia (unchanged); 0.957• Ireland (up); 0.956• Sweden (up); 0.951• Canada (down); 0.950• Japan (up); 0.949• USA (up); 0.948

Moving from indicators to action
• Plans to improve each indicators such we move towards sustainable development

Are indicators useful?
• Purpose:– Quantify and Simplify phenomena– Inform and Alert about changes taking place
in systems– Indicate movement towards or away from SD
(however defined)• SD objectives must be clearly defined and
indicators chosen accordingly
• Useful?