Embed Size (px)
Citation preview

Sustainable Diversion Limit Adjustment Mechanism: Draft Determination Report 2017
–UPDATE IMAGE
2 October 2017

Sustainable Diversion Limit Adjustment Mechanism: Draft Determination Report
Published by the Murray–Darling Basin Authority
MDBA publication no: 37/17
ISBN (online): 978-1-925599-43-5
© Murray–Darling Basin Authority 2017
With the exception of the Commonwealth Coat of Arms, the MDBA logo, trademarks and any exempt photographs and graphics (these are identified), this publication is provided under a Creative Commons Attribution 4.0 licence.
https://creativecommons.org/licenses/by/4.0
The Murray‒Darling Basin Authority’s preference is that you attribute this publication (and any Murray‒Darling Basin Authority material sourced from it) using the following wording within your work:
Title: Sustainable Diversion Limit Adjustment Mechanism: Draft Determination Report
Source: Licensed from the Murray‒Darling Basin Authority under a Creative Commons Attribution 4.0 Licence
Accessibility
The Murray‒Darling Basin Authority makes its documents and information available in accessible formats. On some occasions the highly technical nature of the document means that we cannot make some sections fully accessible. If you encounter accessibility problems or the document is in a format that you cannot access, please contact us.
Acknowledgement of the Traditional Owners of the Murray–Darling Basin
The Murray–Darling Basin Authority acknowledges and pays respect to the Traditional Owners, and their Nations, of the Murray–Darling Basin, who have a deep cultural, social, environmental, spiritual and economic connection to their lands and waters. The MDBA understands the need for recognition of Traditional Owner knowledge and cultural values in natural resource management associated with the Basin.
The approach of Traditional Owners to caring for the natural landscape, including water, can be expressed in the words of the Northern Basin Aboriginal Nations Board:
…As the First Nations peoples (Traditional Owners) we are the knowledge holders, connected to Country and with the cultural authority to share our knowledge. We offer perspectives to balance and challenge other voices and viewpoints. We aspire to owning and managing water to protect our totemic obligations, to carry out our way of life, and to teach our younger generations to maintain our connections and heritage through our law and customs. When Country is happy, our spirits are happy.
Cover image: Hattah Lakes TLM project - Messengers Regulator, releases back to the Murray after second watering event. Date: 3 April 2014, taken by: Heather Peachey
GPO Box 1801, Canberra ACT 2601
02 6279 0100
mdba.gov.au

Sustainable Diversion Limit Adjustment Mechanism: Draft Determination Report
Foreword
Through a suite of state-nominated projects, the Murray-Darling Basin Authority (the Authority) is
confident that 605 gigalitres of water can remain in the river system, and at the same time ensure
that environmental outcomes can also be achieved.
This is a key step in the Basin Plan, and demonstrates the flexibility and adaptability of the Plan.
The Authority continues working with all government agencies involved in the Basin to achieve a
healthy and productive river system.
These projects will make a real difference in the Basin and achieve environmental results. Some
of the projects will improve management of the Basin’s rivers to deliver water for the environment
more efficiently. Other projects will change river operating rules to enable better delivery of water.
All Basin governments are committed to these projects, and are confident they will get results.
As the Authority, we assess the projects nominated by the States and recommend changes to
Sustainable Diversion Limits (SDL) through the SDL Adjustment Mechanism.
This determination report outlines the assessment of the projects as a package. This includes the
proposed SDL adjustment at a Basin-wide scale, as well as at a catchment level for the southern
Basin.
The Authority knows community consultation in the Basin is crucial. Considerable work lies
ahead for all governments to further progress the design and implement the nominated projects
in the period to 2024. The Authority encourages all governments to actively involve the
community in progressing the projects.
The Authority understands and expects that projects will adapt to accommodate new information,
innovations, community feedback and regulatory approvals required for technical work. We are
optimistic that across the full suite of projects change can be accommodated and that further
improvements can be incorporated during the implementation phase. To achieve desired
outcomes from the nominated projects, governments will need to collaborate and progress must
be monitored independently.
This is just the start of the process, there are years ahead to design and implement these
projects. We encourage Basin state governments to continue the conversation, and ensure these
projects work on-the-ground with communities.
On behalf of Basin governments, the Authority invites public feedback until 3 November 2017. This is just the start of the process, there are year’s ahead to further design and implement these projects and they will contribute to a healthy productive Basin.
The Authority’s role in the SDL Adjustment Mechanism is clearly defined. The Authority is
charged with independently determining the proposed adjustment to the SDL as a result of
the package of projects nominated by state governments in the southern Basin, through the
SDL Adjustment Mechanism framework.
When the projects are further designed and implemented from 2018 to 2024, the Authority
has a role in monitoring the projects and ensuring outcomes are met.

Sustainable Diversion Limit Adjustment Mechanism: Draft Determination Report
Contents
Foreword ................................................................................................................................... i
Summary .................................................................................................................................. 1
Section 1: The Murray–Darling Basin Plan ............................................................................... 4
Section 2: Changing the sustainable diversion limits ................................................................ 8
Section 3: The SDL adjustment process ................................................................................ 10
Section 4: Determining the adjustment ................................................................................... 15
Section 5: SDL adjustment projects and outcomes ................................................................ 17
Section 7: Next steps – beyond 2017 ..................................................................................... 31
Section 8: Public comment period .......................................................................................... 33
References ............................................................................................................................. 34
Links to further reading ........................................................................................................... 35
Attachment A - package of supply, constraint and efficiency projects agreed by the Murray–
Darling Basin Ministerial Council on 16 June 2017 ................................................................. 36
Attachment B – Analysis of impacts on Ramsar wetlands ...................................................... 45
Attachment C – Modelling metrics .......................................................................................... 51

Sustainable Diversion Limit Adjustment Mechanism: Draft Determination Report
1
Summary
Purpose of the report
This report provides the Authority’s draft determination of the proposed adjustment to the
sustainable diversion limit (SDL). The determination is based on 36 projects notified by state
governments through the SDL Adjustment Mechanism in the Basin Plan, which aim to achieve
equivalent environmental outcomes using less water.
The Authority invites public comments on the draft SDL adjustment determination in the period
from Tuesday 3 October 2017 until Friday 3 November 2017.
Draft determination
The Murray–Darling Basin (the Basin) is a complex, diverse and dynamic system. It is
constantly changing in response to the influences of people, the climate and the way water is used
for production, communities and the environment.
The Basin Plan aims to find a balance between the water needs of all Basin users, to make sure
communities, industries and the environment continue to thrive. It does this through setting limits
on the amount of surface and ground water that can be taken to ensure sustainable use into the
future. These limits, also known as sustainable diversion limits (SDLs), regulate the amount of
water that can be used by communities and industries both within catchment areas and across the
entire Basin.
The Basin Plan set an initial water recovery target of 2750 GL for the whole Basin, an
approximately 20 percent reduction in water extractions. In settling the Basin Plan Basin
governments agreed that this target could be amended in two ways:
a review of northern Basin SDLs
the SDL Adjustment Mechanism.
Under the SDL Adjustment Mechanism, state governments can nominate projects which aim to
achieve agreed Basin Plan environmental outcomes with less water, leaving this water in the
system for consumptive uses. These projects are referred to as supply measures.
Governments can also propose projects that provide more water for the environment by making
consumptive water use more effective and efficient, providing those water savings to the
environment (referred to as efficiency projects).
The SDL Adjustment Mechanism allows an increase in SDLs of up to 650 GL of water from
supply measures, and 450 GL of additional water for the environment from efficiency measure
projects. State governments have nominated 36 supply measure and two efficiency measure
projects.

Sustainable Diversion Limit Adjustment Mechanism: Draft Determination Report
2
The Authority has undertaken its assessment of the supply measure projects using the SDL
Adjustment Mechanism framework in the Basin Plan, and determined a proposed SDL
adjustment increase of 605 GL. With current water recovery, including contracted deliveries, this
means that no further gap bridging water recovery would be required to meet the southern
connected Basin’s 2289 GL contribution to meeting the Basin wide target of 2750 GL.
This report sets out the proposed SDL adjustment amount resulting from the package of supply
measures nominated by state governments in the southern Basin. The information in the report
provides an account of how the Authority arrived at the adjustment amount, including the tests
applied to protect the aims of the Basin Plan, and the outcomes expected from the package of
projects nominated by state governments.
Invitation to provide feedback
A public comment period on the proposed SDL adjustment is open from
Tuesday 3 October 2017 until Friday 3 November 2017.
Interested parties can provide feedback on the proposed SDL Adjustment Mechanism
outcome and provide input that can be used to strengthen implementation of the proposed
projects by visiting mdba.gov.au.
Following consideration of public feedback, the Authority will make a final determination
and provide this along with information and advice resulting from the public feedback to the
Commonwealth minister responsible for water by 15 December 2017.

Sustainable Diversion Limit Adjustment Mechanism: Draft Determination Report
3
Structure of the report
This report is set out in the following way:
Section 1: Murray–Darling Basin Plan
An overview of the Murray–Darling Basin Plan, sustainable diversion limits and water
recovery to date.
Section 2: Changing the sustainable diversion limits
Outlines how the sustainable diversion limits in the Basin Plan can change.
Section 3: SDL adjustment projects
Presents information on how the process of adjusting the sustainable diversion limit
occurs, from feasibility studies through to the design and implementation of the projects.
Section 4: Determining the adjustment
This section outlines the framework used to assess the proposed suite of projects to
adjust the sustainable diversion limits.
Section 5: SDL adjustment projects and outcomes
Information on the proposed projects nominated by state governments that have been
assessed by the Authority and their expected outcomes.
Section 6: Proposed adjustment amounts
Proposed sustainable diversion limit adjustment amounts for the southern Basin,
including adjustment amounts at a catchment level.
Section 7: Next steps in the Adjustment Mechanism (beyond 2017)
This section presents how projects will be refined and implemented through to 2024.
Section 8: Public comment period
More information on how feedback can be provided on the proposed adjustment and the
suite of projects and how this information will be used.
Supporting information The Authority is also providing a range of supporting documents on the Authority’s website which
share information on the assessment framework and independent advice provided to the
Authority as part of the assessment process. These include:
Benchmark conditions of development for assessment of the SDL supply contribution
Modelling assessment to determine SDL Adjustment Volume
Independent Review of Hydrologic Modelling for SDL Adjustment (by Bewsher
Consulting)
Independent Expert Panel Murray–Darling Basin Plan SDL Limits of Change Review
The SDL adjustment assessment framework for supply measures.
These documents are more technical in nature and thus are intended for those interested in further
details of the assessment process. They are available at www.mdba.gov.au/sdlam-reports.

Sustainable Diversion Limit Adjustment Mechanism: Draft Determination Report
4
Section 1: The Murray–Darling Basin Plan
The Murray–Darling Basin Plan (Basin Plan) aims to safeguard one of Australia’s key national
assets, the Murray–Darling Basin (The Basin). The Basin covers more than one million square
kilometres, provides water to almost three million Australians, houses 40 percent of Australia’s
farms and generates around $19.4 billion annually from agricultural produce. It is also home to
diversity of water dependent ecosystems that support thousands of plant and animal species
including more than 46 species of native fish and 98 species of waterbirds.
The Basin Plan is a coordinated approach to water management across the Basin in four states
(South Australia, Victoria, New South Wales and Queensland) and the Australian Capital Territory.
It is a flexible and adaptive plan that aims to balance the needs of Basin communities and the
environment to achieve a healthy and productive river system.
The Basin Plan was developed as a requirement of the Water Act 2007 (Cwlth) and is a significant
step in the ongoing process of managing the Basin’s water. It does this by managing the Basin as
one system. The aim of the Basin Plan is to ensure that water is shared between all users in a
sustainable way. This will enable the river systems to continue to support communities, industries
and environments in the long-term as they adapt to changes, including a changing climate.
The Basin Plan contains specific objectives and frameworks to ensure:
water is used in a sustainable way
good quality water is delivered to people, businesses and the environment
environmental water is used effectively
state governments are committed to implementation of the Basin Plan
communities always have access to drinking water
water trade is efficient and fair
implementation of the Basin Plan is monitored and evaluated.
There are several key components of water management in the Basin which work as an
integrated package (illustrated in Figure 1). This report focuses on the sustainable diversion limit
component. Figure 2 provides a snapshot of the broader implementation actions and milestones
of the Basin Plan.

Sustainable Diversion Limit Adjustment Mechanism: Draft Determination Report
5
Figure 1: Components of water management in the Murray–Darling Basin
Figure 2: Overview of key Basin Plan milestones

Sustainable Diversion Limit Adjustment Mechanism: Draft Determination Report
6
Sustainable diversion limits
At its heart, the Basin Plan determines the amount of water that can be extracted or taken annually
from the Basin for consumptive use (urban, industrial and agricultural). The volume determined is
set through long-term average sustainable diversion limits (SDLs) – the level of extraction that will
achieve a sustainable balance between the environment and extractive uses for water. While
striving to improve the condition of the natural environment of the Basin, the setting of the SDLs
recognised that there must be a balance between water for the environment and water for
communities and industries. As a result, the SDLs were carefully calculated to balance
environmental, social and economic outcomes. Each river catchment in the Basin has its own SDL,
and there is also a limit for the Basin as a whole.
The SDLs will make more water available for the environment. Water recovered is used by
managers of water for the environment, including the Commonwealth Environment Water Holder,
to improve and maintain the health of waterways, lakes, major wetlands and floodplains within the
Basin, as well as protect important habitats for animals and plants. The SDLs for groundwater will
ensure that resources are not over-allocated in the future, and can sustain communities and
environments that depend on groundwater.
Across the Basin, the SDLs set in 2012 were lower than the amount that was being used. As a
consequence, water has been recovered to meet the limit. Across the Basin the additional amount
of water needed to meet the SDLs and improve river and wetland health is 2750 GL per year on
average (illustrated in Figure 3). The recovery target is made up of two components: a local, within
catchment amount, and a downstream shared target for broader system outcomes. The southern
Basin’s share of the 2750 GL recovery is 2289 GL.
The SDLs come into effect in 2019, and Basin state governments are currently working to develop
water resource plans for each catchment of the Basin which will implement the new limits.
Figure 3: Basin Plan sustainable diversion limit target and water recovery progress

Sustainable Diversion Limit Adjustment Mechanism: Draft Determination Report
7
Water recovery update
The Commonwealth is responsible for water recovery through directly purchasing water
entitlements, or acquiring water entitlements through investment in infrastructure modernisation.
The water recovery program is being implemented over several years to allow communities and
industry to transition to the new SDLs.
As of 30 June 2017, 74 per cent of the required Basin-wide water recovery had been achieved.
This consists of 74 per cent of water recovered in the northern Basin and 75 per cent in the
southern Basin (see Figure 3).
Water recovery figures for your catchment are available online at www.mdba.gov.au/water-
recovery.

Sustainable Diversion Limit Adjustment Mechanism: Draft Determination Report
8
Section 2: Changing the sustainable diversion limits
The Basin Plan was made using the best available information at the time. It was also
acknowledged that there was the opportunity to improve our understanding of the river system and
make changes prior to SDL implementation in July 2019. The SDL Adjustment Mechanism will
operate to determine whether there will be a reduction in the recovery volume in the south, while
the Northern Basin Review operates in the north.
The Northern Basin Review
At the time the Basin Plan was established, the Authority recognised more work was needed to
improve knowledge of the hydrology, environment and socio-economic implications of Basin Plan
settings in the less regulated river systems in the north. A commitment was made, supported by
all Basin governments, to undertake a review and assess whether Basin Plan settings in the north
are appropriate.
The review has resulted in the Authority recommending a new SDL for the northern Basin as a
proposed amendment to the Basin Plan. Information relating to the Northern Basin Review can be
found at: mdba.gov.au/BPamendments
The SDL Adjustment Mechanism
When settling the Basin Plan in 2012, Basin governments recognised that before 2019, when SDLs
come into effect, a range of changes could be explored to improve the operation of the river system,
and deliver both consumptive water and water for the environment more efficiently. These changes
mean that the objectives of the Basin Plan could be achieved with less water. Basin governments
included what is called the SDL Adjustment Mechanism in the Basin Plan to provide the opportunity
and incentive to find ways to improve how the Basin’s water resources are used, and potentially
amend the SDLs set in 2012 as a result.
The SDL Adjustment Mechanism allows SDLs to both potentially increase by up to 650 GL in
response to the more efficient use of water for the environment, and decrease by 450 GL in
response to more efficient consumptive use subject to the measures having a neutral social and
economic impact (Figure 4).
Figure 4: Illustration of the Adjustment Mechanism
Sustainable Diversion Limit Adjustment Mechanism: Draft Determination Report
9
The Basin Plan limits the net change of Basin-wide SDLs in response to these efficiencies to no
more than five per cent of Basin-wide SDLs of 10,873GL (i.e. approximately 544 gigalitres for
surface water SDLs). It also includes safeguards for the reliability of supply for consumptive users,
places limits on any change to environmental outcomes and ensures that all third party risks must
be addressed or mitigated.
The more efficient delivery of water for both environmental and consumptive use means that less
water is needed to achieve the current settings of the Basin Plan. The SDLs for surface water
catchments in the southern connected Basin can be adjusted as a result, and this will both reduce
the amount of water recovery needed in the southern Basin, and provide a mechanism to improve
the environmental outcomes of the Basin Plan.
The Basin Plan is a long term reform with many inter-related elements. The SDL Adjustment
Mechanism is one part of the framework established by governments to manage the amount of
water extracted from the Basin’s river and groundwater systems.
Council of Australian Governments
On 9 December 2016, Premiers and Chief Ministers from Basin state and territory government
reaffirmed the commitment of governments to the implementation of the Basin Plan through the
Council of Australian Governments (COAG). Ministers noted that the Murray–Darling Basin is of
vital economic and environmental significance to a large part of Australia and it is critical that the
Basin Plan is implemented on time and in full. COAG also noted that Basin governments are
seeking to offset, in full, the remaining water recovery in the southern Basin.
On 12 June 2017 COAG endorsed a report by the Murray–Darling Basin Ministerial Council to the
COAG - Implementing the Basin Plan.

Sustainable Diversion Limit Adjustment Mechanism: Draft Determination Report
10
Section 3: The SDL adjustment process
Over the last four years Basin state governments developed and proposed projects designed to
improve the efficiency of how the river system is managed. These projects have been considered
as part of the SDL Adjustment Mechanism. The key steps in the process that jurisdictions have
worked through to come up with a final package of projects, and the next steps are set out in
Figure 5.
Figure 5: SDL adjustment process

Sustainable Diversion Limit Adjustment Mechanism: Draft Determination Report
11
Project types
Being smarter and more efficient in how Basin water resources are used means finding ways to
save water and deliver it more effectively for both environmental and consumptive use. This can
be done by changing river management practices, using infrastructure to achieve efficiencies, or
overcoming some of the physical barriers to delivering water in the system.
In achieving efficiencies for environmental or consumptive water use, projects under the
Adjustment Mechanism aim to either improve the socio-economic or environmental outcomes of
the Basin Plan, and in some cases achieve both. There are three types of projects outlined in
Figure 6.
Figure 6: Types of SDL Adjustment Mechanism projects
Supply projects change the way the system is managed to achieve equivalent environmental outcomes using less water.
Supply projects are new ways to manage the Basin’s rivers to more efficiently deliver water for the
environment. To do this, projects can streamline the way the river is operated or build
environmental infrastructure works. Supply projects must deliver equivalent or better environmental
outcomes compared to those achieved under current Basin Plan settings, using less water. This
water can then remain in the river for consumptive uses such as irrigated agriculture and allows
the SDL to increase. Examples include:
infrastructure works (like the installation of regulators or building levee banks) that allow
water for the environment to be diverted onto floodplains and retained. This allows the
floodplain to return to a more natural flooding regime (in frequency, duration and depth) and
delivers ecological outcomes using a comparatively small volume of water. Some works
also reinstate flow pathways and variability removed during the major river management

Sustainable Diversion Limit Adjustment Mechanism: Draft Determination Report
12
works early last century.
changes to rules which operate storages and rivers in the Basin to provide flow rates or
timing better suited to when the environment needs water. The rule changes can provide
increased flexibility to access water for the environment, reduce restrictions on existing
works operations and enable more efficient and effective use of current infrastructure.
reconfiguring lakes or storage systems to reduce evaporation. This represents a major
change as evaporative savings provide additional water for environmental water managers
to use.
Efficiency projects provide water for the environment through more efficient use of irrigation, urban and industrial water.
Efficiency projects result in a decreased volume of water required for a consumptive use. Examples
include increasing the efficiency of on or off-farm water delivery systems, urban water delivery or
industrial water use, or stock and domestic water supply. This can be done by replacing or
upgrading on-farm irrigation, transforming a business so that it produces the same or more output
with less water, lining channels to reduce water losses within an irrigation or water supply network
or replacing a water supply. Efficiency measures must have neutral or improved socio-economic
outcomes, and decrease the SDL through decreasing the amount of water previously lost through
inefficiencies. This water remains in the river for environmental use.
The efficiency measures program under the SDL Adjustment Mechanism is available across all
catchments in both the northern and southern Basin. It is a voluntary program for participants and
funds projects brought forward through to the end of 2023. The aim is to achieve up to 450 GL
agreed by Basin governments as part of the SDL Adjustment Mechanism in the development of
the Basin Plan.
As part of the COAG commitment to implementing the Basin Plan, governments are currently
reviewing how efficiency measures can be designed and targeted to achieve their aims including
the requirement to have neutral or improved socio-economic outcomes.
Constraints projects propose changes to physical structures or river management practices to better deliver or more efficiently use water for the environment.
In developing the Basin Plan, governments identified a number of constraints preventing the full
benefits of water for the environment from being achieved. Constraints projects increase the
flexibility to release and move water for the environment through the system, and better deliver this
water when and where the environment will benefit most. This maximises environmental outcomes
and can provide floodplain outcomes that were previously difficult to achieve. Constraint relaxation
projects also improve the capacity of other supply projects to achieve their intended outcomes,
allowing the SDL to increase.
Any changes to flow rates over the long term will require state governments to work closely with
all potentially affected land holders, industries and communities. State governments have
committed to the principles below for constraint projects:
extensive community consultation including identifying the most effective way to mitigate
adverse impacts
Sustainable Diversion Limit Adjustment Mechanism: Draft Determination Report
13
funding infrastructure to ensure that third party impacts of proposed flows are mitigated
no managed flows at increased levels to occur until all necessary works are complete,
noting that it may be possible to have a staged relaxation of constraints.
Constraints projects can include changes to physical aspects of the river such as raising low-lying
bridges to improve access points, or operational changes such as river management rules or
creating easements to enable higher managed flows to be delivered.
Mitigating any third party impacts from higher managed flow levels has the benefit of also mitigating
the impacts of natural flow events at the same levels. In addition, communities can benefit through
increased infrastructure projects operating in their area, providing economic opportunities for local
contractors and the flow on benefits from this investment.
Notification process
On 5 May 2016 the Basin Officials Committee notified the Authority of 36 supply and two efficiency
measure projects to take into account in the SDL Adjustment Mechanism. The Basin Plan was
amended following this in 2016 to provide for a second notification by 30 June 2017. This allowed
more time for state governments to develop additional projects and maximise the benefits of the
SDL Adjustment Mechanism. A further supply measure project was notified on 28 June 2017.
Supply projects can be amended through to 31 December 2023. Amendments must be notified as
soon as possible after any relevant information has changed, or the project withdrawn if the
measure will not enter into operation by 30 June 2024.
Efficiency projects are part of an ongoing program across the whole of the Basin, and additional
projects can be notified until 31 December 2023.
Both supply and efficiency measures can only be notified if they will enter operation by
30 June 2024, and they are not anticipated in the Basin Plan.
Basin governments’ assessments
During the development of the SDL Adjustment Mechanism in the Basin Plan, Basin governments
agreed a set of criteria for supply and constraint projects to determine their viability and suitability
to be considered as a project. These criteria can be accessed at www.mdba.gov.au/assessment-
criteria.
At the feasibility stage projects were required to demonstrate technically feasibility, including that
they are likely to achieve their intended outcomes and potential risks and impacts were
manageable and acceptable.
State governments assessed project business cases in terms of anticipated ecological benefit, and
whether the proposal can effectively deliver on stated outcomes over the long term to produce an
enduring change. Projects cannot have unmitigated third party risks, including salinity and water
quality impacts. As part of this process, Basin governments also specified actions which the
proponent/s would need to undertake in project refinement, design and implementation, including
risk mitigation.

Sustainable Diversion Limit Adjustment Mechanism: Draft Determination Report
14
Aboriginal and cultural considerations
State governments were required to address environmental and heritage regulations, and where
relevant undertake a desktop cultural heritage assessment for each project. Risk strategies in the
business case needed to consider implications for significant sites, such as burial sites and scar
trees.
During project development and implementation state governments will undertake further work to
identify any key cultural issues, risks or concerns which need to be addressed, in consultation with
Aboriginal stakeholders. Identifying cultural flows is a key next step for the Basin Plan as a whole.
Funding the projects
The Intergovernmental Agreement on Implementing Water Reform in the Murray–Darling Basin
came into effect on 5 June 2013 and was subsequently endorsed by all Basin governments. The
agreement makes Commonwealth funding available to Basin state and territory governments for
SDL adjustment projects. With a proposed SDL adjustment of 605 GL a total of $1,119 million is
available to implement constraint and supply measure projects. Further funding is available under
the Water for the Environment Special Account for efficiency measure and constraints projects. A
number of SDL adjustment projects are already funded through other Commonwealth programs,
such as The Living Murray and the State Priority Projects under the sustainable water use and
infrastructure program.
The Intergovernmental Agreement is available on the Council of Australian Governments’ website.

Sustainable Diversion Limit Adjustment Mechanism: Draft Determination Report
15
Section 4: Determining the adjustment
SDLs can be changed as long as the environmental outcomes remain equivalent to those
in the Basin Plan and there are neutral or improved social and economic outcomes.
The Basin Plan sets out how to determine the SDL adjustment amount. For supply projects, a
science-based assessment framework was agreed to by all Basin governments and was included
in the Basin Plan. It specifies how the adjustment amount for supply projects is to be determined,
and importantly contains a number of safeguards which must all be satisfied before any changes
can be made to SDLs.
For efficiency projects, the adjustment takes into account water entitlements resulting from
implementation of the projects.
Valuing the contribution of supply projects
The assessment framework for supply projects uses the
Authority’s river-modelling platform to simulate changes in the
river’s hydrology created by the supply projects. Changes in
hydrology are then assessed for ecological impact. Further
detail can be found in the document ‘SDL adjustment
assessment framework for supply measures’ at
www.mdba.gov.au/sdlam-reports.
The supply measure package is compared to a modelled
representation of a fully implemented Basin Plan called the
benchmark (which includes 2750 GL of water recovery). In
this way lower volumes of water recovery are assessed to
determine if the package of supply measures can achieve
equivalent environmental outcomes. When comparing the
two modelled scenarios, three tests are applied to ensure
that the benefits of the Basin Plan are maintained and
protected. These are:
1. Were detrimental impacts on the reliability of supply to water users detected?
The state governments, as managers of water entitlements, developed a range of indicators for
each valley to assess impacts on supply reliability. These indicators are used by state
government experts to ensure changes to SDLs have no detrimental impacts on the reliability
of water supply that are not offset or negated.
2. Was the regional environmental outcome score equal to or higher than the benchmark scenario (environmental equivalence)?
To pass the environmental equivalence test, the region score achieved by modelling the
package of supply projects must be better than, or equivalent to, the score that would be
achieved under the Basin Plan. Exactly the same steps are applied to score both scenarios.
The ecological assessment allows for trade-offs between environmental outcomes in river
reaches, subject to the limits of change discussed below.
Key terms
Benchmark – modelled
representation of a fully
implemented Basin Plan
Reliability – the reliability of
water supply to users
Limits of change – ensure
trade-offs in ecological
outcomes do not result in
unacceptable adverse
change to key aspects of the
ecosystem

Sustainable Diversion Limit Adjustment Mechanism: Draft Determination Report
16
3. Were the environmental safeguards (limits of change) satisfied?
The limits of change safeguard environmental outcomes under the Basin Plan. The Basin Plan
allows for lower environmental outcomes in one river reach to be offset by improvements in
other river reaches. The limits of change set bounds on the amount of change permitted in each
catchment to ensure that key aspects of the ecosystem are not subject to unacceptable adverse
change. They are an essential component of the SDL adjustment method that enables
optimisation of the adjustment outcome, while protecting ecosystems in all parts of the system.
Floodplain ecosystems require a range of flows that vary in height and duration to sustain their
health and resilience. The limits of change rules protect this range of flows in each region. Limits
were also developed to avoid adverse impacts on the Coorong, Lower Lakes and Murray Mouth.
Applying the SDL adjustment method
The Authority must determine the smallest water recovery volume that passes all three tests. If all
tests are passed for a modelled SDL adjustment package scenario, an even smaller recovery
volume will be simulated (see Figure 7). This cycle continues until the smallest recovery volume
(and hence the highest possible adjustment to water recovery) is found which passes the
requirements of the SDL Adjustment Mechanism.
Valuing the contribution of efficiency projects
The efficiency programs improve the environmental outcomes under the Basin Plan by investing
in projects that reduce consumptive water inefficiencies and losses, and recover this water for the
environment. The reduction in consumptive water must have no reduction in socio-economic
outcomes. The water saved from these projects is registered as efficiency entitlements set aside
as water for the environment and the SDL is reduced as a result.
Basin Plan scenario in the model
(2750 water recovery)
Add package of supply projects
Run supply package modelling
scenario
Check outcome against required
tests
Final adjustment volume
Reduce
water
recovery
Figure 7: Applying the SDL adjustment method

Sustainable Diversion Limit Adjustment Mechanism: Draft Determination Report
17
Section 5: SDL adjustment projects and outcomes
SDL adjustment project package
Basin governments notified the Authority of 36 supply projects and 2 efficiency measures projects
to be considered as part of the SDL Adjustment Mechanism, using changes to infrastructure and
the way that the river is operated. In addition, a constraint project for the Goulburn catchment has
been proposed, but has not been included in this determination.
The full package of projects notified is listed in Table 1, and highlighted in Figure 8. A more detailed
description of the projects is at Attachment A.
The Authority maintains a register of SDL adjustment projects agreed by Basin governments on its
website at www.mdba.gov.au/sdlam-projects. As efficiency projects are added to the notified
package of projects through to 31 December 2023, the register will be updated to include
entitlements as they are acquired. The register will also record supply project amendments through
to December 2023.
Projects are at a range of stages in their design and implementation, for example The Living Murray
(TLM) projects have been built, while other projects are at the design and consultation stage.
Table 1: Package of supply, constraints and efficiency measures
Map ref. Project title Proponent state(s)
1 South East Flows Restoration Project South Australia
2 Flows for the Future South Australia
3 South Australian Riverland Floodplain Integrated Infrastructure Program (SARFIIP)
South Australia
4 Riverine Recovery Project South Australia
5 Chowilla Floodplain TLM Project South Australia / New South Wales / Victoria
6 South Australian Murray key focus area South Australia
7 Lindsay Island (Stage 1) Upper Lindsay watercourse Enhancement TLM Project
Victoria / New South Wales / South Australia
8 Lindsay Island (Stage 2) Floodplain Management Project
Victoria
9 Mulcra Island Environmental Flows TLM Project
Victoria / New South Wales / South Australia
10 SDL offsets in the Lower Murray NSW New South Wales

Sustainable Diversion Limit Adjustment Mechanism: Draft Determination Report
18
11 Wallpolla Island Floodplain Management Project
Victoria
12 Hattah Lakes North Floodplain Management Project
Victoria
13 Hattah Lakes Environmental Flows TLM Project
Victoria / New South Wales / South Australia
14 Belsar-Yungera Floodplain Management Project
Victoria
15 Burra Creek Floodplain Management Proposal
Victoria
16 Vinifera Floodplain Management Project Victoria
17 Nyah Floodplain Management Project Victoria
18 Guttrum and Benwell State Forests Floodplain Environmental Works Project
Victoria
19 Murray and Murrumbidgee Valley National Parks SDL Adjustment Supply Measure
New South Wales
20 Gunbower Forest TLM Project Victoria / New South Wales / South Australia
21 Gunbower National Park Floodplain Management Project
Victoria
22 Flexible Rates of Fall in River Levels Downstream of Hume Dam
Victoria / New South Wales
23 TLM environmental works and measures – Koondrook-Perricoota Forest Flood Enhancement proposal
New South Wales / Victoria / South Australia
24 Barmah–Millewa Forest Environmental Water Allocation
Victoria / New South Wales
25 New Goulburn key focus area* Victoria
26 Yarrawonga to Wakool junction key focus area
New South Wales
27 Improved regulation of the River Murray** Victoria / New South Wales

Sustainable Diversion Limit Adjustment Mechanism: Draft Determination Report
19
28 Hume to Yarrawonga key focus area Victoria / New South Wales
29 Hume Dam airspace management and pre- release rules
Victoria / New South Wales
30 2011 Snowy Water Licence Schedule 4 Amendments to River Murray Increased Flows Call Out Provisions
New South Wales / Victoria
31 Enhanced environmental water delivery (Hydro Cues)
New South Wales / Victoria / South Australia
32 Nimmie Caira Infrastructure Modifications Proposal
New South Wales
33 Modernising Supply Systems for Effluent Creeks – Murrumbidgee River
New South Wales
34 Improved Flow Management Works at the Murrumbidgee River – Yanco Creek Offtake
New South Wales
35 Computer Aided River Management (CARM) Murrumbidgee
New South Wales
36 Murrumbidgee key focus area New South Wales
37 Structural and operational changes at Menindee Lakes, including the Lower Darling key focus area constraint project
New South Wales
N/A On Farm Irrigation Efficiency and Other Water Use Efficiencies***
Commonwealth program
N/A Urban or Industrial and Mining areas water efficiency***
Commonwealth program
*Submitted as a constraint project only and not modelled as part of the SDL adjustment determination
**Not modelled as part of the SDL adjustment determination
***Efficiency projects are not location specific and operate across the Basin.

Sustainable Diversion Limit Adjustment Mechanism: Draft Determination Report
20
Figure 8: Map of SDL Adjustment Mechanism projects

Sustainable Diversion Limit Adjustment Mechanism: Draft Determination Report
21
Expected outcomes from the projects
The SDL adjustment project package can achieve equivalent environmental outcomes from less
water. This facilitates the opportunity for a 605 GL SDL adjustment outcome. As a result, more
water can remain in the system for other user uses, including for irrigated agriculture.
The projects at an individual level also aim to provide a range of benefits. These may apply over
the whole length of a river and/or a river reach. Some project examples are discussed below as a
demonstration of the landscape level benefits that they aim to deliver.
Environmental works
Environmental works projects inundate floodplain areas but use less water. These projects use
structures like environmental regulators to direct water to, and retain water on the floodplain,
without having to raise the river level. Because this uses less water than a managed overbank flow,
watering can be undertaken more often, for longer durations and during droughts. The projects can
therefore help to restore a more natural watering regime, both increasing ecological resilience and
using less water in the long-term. In addition, improvements in the condition of important wetland
areas provide ecological benefits to species dependent on the wetlands for habitat and breeding
opportunities. The improved condition of these areas can also enhance recreational and cultural
values for local communities, including Aboriginal communities.
Examples of environmental works projects in the SDL adjustment package include:
The Living Murray proposals, in which works such as regulators and levees are used to
provide water to wetlands and improve floodplain connectivity. The structures
allow managers to deliver water to over 37,000 ha of significant forests, wetlands and lakes
along the River Murray, and hold water on the floodplain for longer. This simulates natural
flows using only a fraction of the water required for an overbank flow, and the water can be
returned to the river and re-used downstream.
Victoria’s nine environmental works projects located along the Victorian Murray look to build
upon and complement The Living Murray icon sites. In the same manner as The Living
Murray proposals, these projects use works and operating strategies to benefit a range of
ecological, social, cultural and economic values. They aim to provide ecological resilience
to native flora and fauna, drought refuges for native species, and breeding opportunities for
fauna, including recreationally-fished species.
New South Wales has proposed the “SDL offsets in the Lower Murray New South Wales”
project, which combines operational changes to the Murray Lock 8 and 9 weirs and a series
of environmental works. The operational changes to weir pool heights better deliver water
onto the floodplain at ecologically beneficial times and return surrounding wetlands to more
natural wetting/drying regimes. Works in the Carrs, Capitts and Bunberoo Creek systems
aim to improve environmental water delivery to the area and a fishway on Frenchman's
creek will provide passage through one of the last major barriers to fish movement along
the River Murray, promoting connectivity between breeding sites, feeding grounds and
migratory routes.
The Improved flow management works in the New South Wales project “Murrumbidgee
Rivers – Yanco Creek offtake” are designed to reinstate a better flow regime to wetlands
important for waterbirds and vegetation communities critical to fish species including the

Sustainable Diversion Limit Adjustment Mechanism: Draft Determination Report
22
Murray Cod. The mid-Murrumbidgee wetlands support many rare and threatened fauna
species, including the Environment Protection and Biodiversity Conservation Act 1999
(EPBC Act) listed endangered Trout Cod, the vulnerable southern bell frog and numerous
bird species.
South Australia’s “South East Flows Restoration Project” will construct a channel from both
existing and new drains to divert additional water from the Upper South East into the
Coorong South Lagoon. This will provide fresh water to the Coorong and provide positive
ecological benefits by reducing salinity levels, especially in the South Lagoon. Reducing
salinity levels will improve resilience before, during and after drought periods.
The New South Wales Government has developed a proposal for the Menindee Lakes that
aims to reduce evaporation, optimise the significant natural, cultural and economic values
of the Lakes, and continue their use for recreational and tourism purposes. The proposal
aims to move the management of the Lakes towards outcome based operating rules, rather
than the current approach. The proposal includes new regulators to separate the
management of Lakes Menindee and Cawndilla and to enable the managed use of Lake
Cawndilla as a storage option, reducing its evaporative losses.
Projects to change river operations
Projects that change how the river system is operated can provide a range of benefits, taking
advantage of new information made available in emerging technologies and data sources, and
trialling new ways to make river management more efficient. For example:
The Computer Aided River Management for the Murrumbidgee River uses better and more
reliable information in the form of metering, inundation models and loss estimates to provide
more accurate releases for downstream orders and save operational loss water.
The Victoria/New South Wales “Barmah–Millewa Forest Environmental Water Allocation
(BMFEWA)” project looks to better coordinate BMFEWA and other environmental water in
the reach to reduce any use of water for the environment when it may provide limited
environmental benefit.
Improving the management of water for the environment in the Hume Dam is the focus of
the Victoria/New South Wales “Hume Dam Airspace Management project”. The project
aims to change airspace management to result in more water being made available for both
the environment and irrigation.
Improved operations at Hume Dam is also the focus of the Victoria/New South Wales
“Flexible Rates of Fall in River Levels Downstream of Hume Dam” project. This project has
been developed and trialled over a number of years, and will use the knowledge gained to
optimise draw down rates in the River Murray downstream of Hume Dam, to reduce
unseasonal flooding and negative impacts on the ecology of the Barmah–Millewa forest.

Sustainable Diversion Limit Adjustment Mechanism: Draft Determination Report
23
The Basin has historically been managed to deliver water for human needs, including irrigation and
stock and domestic use. The timing and variability of flows needed by the environment is different
to consumptive users, and river management, which takes into account the needs of the
environment can deliver significant benefits and efficiencies. Supply projects such as:
“Enhanced environmental water delivery” aim to do this by reinstating more natural flow
regimes and overbank flow events by aligning water for the environment delivery with
natural flows, particularly in tributary streams. When applied in conjunction with the gradual
relaxing of constraints, through constraints management projects, the benefits to the
environment are substantial. Changed operating rules, combined with relaxed constraints,
can also result in social and economic benefits. This is associated with being able to
manage moderate flooding more effectively.
Constraints projects
Relaxing constraints allows the better delivery of water for the environment when and where it is
needed to maximise environmental outcomes. Projects contribute towards achieving ecological
targets and flows in the southern connected Basin, which were considered important during the
development of the Basin Plan. In particular, relaxing constraints provides opportunities for
environmental watering of large areas of floodplain in New South Wales, Victoria and South
Australia. This improves the health of forests, fish and bird habitats, the connection between the
river and the floodplain, and replenishes groundwater. It also works to improve the capacity of other
supply projects to achieve their intended environmental outcomes.
The effects of addressing constraints will vary across areas in different river catchments.
A number of constraints projects have been notified as supply measures.
Some key secondary benefits for communities include:
increased pasture growth for floodplain graziers
funding for on-farm infrastructure improvements, such as new bridges or crossings
funding for upgrades to ageing public flood infrastructure, such as levees, roads and
crossings
better water quality as saline pools are flushed out and floodplain litter washed away to
reduce the risk and severity of blackwater events
recreation and tourism associated with the higher flows and healthy wetlands, such as
fishing, kayaking and camping
the opportunity to provide goods and services through the construction of water
management structures.

Sustainable Diversion Limit Adjustment Mechanism: Draft Determination Report
24
The circumstances and the triggers under which constraints projects may be operated by river
operators are yet to be fully negotiated. State governments have committed to the principles below
for constraint projects:
extensive community consultation, including identifying the most effective way to mitigate
adverse impacts
funding infrastructure to ensure that third party impacts of proposed flows are mitigated
no managed flows at increased levels to occur until all necessary works are complete,
noting that it may be possible to have a staged relaxation of constraints.
While there are multiple environmental and community benefits to relaxing constraints,
governments recognise that some parts of the community also has concerns. A key element of
constraint relaxation is for unacceptable impacts arising from changes to the delivery of water for
the environment to be mitigated. State governments will undertake detailed engagement to
understand concerns and design mitigation strategies that meet community needs, with any
change to flow rates over the long-term requiring extensive consultation with all potentially affected
land holders, industries and communities.
Efficiency projects
The Commonwealth’s efficiency program has been running for a number of years, funding on-farm
and off-farm irrigation projects that more efficiently deliver water for irrigation to the farm or the
crop, with the irrigator providing a significant proportion of the saved water to the Commonwealth
in return for funding. Project reviews have consistently shown benefits to the irrigator that are broad
and long lasting. These include increased crop yield and quality, improved crop flexibility and better
use of labour. Economic benefits can also accrue to local communities through the program’s
requirements for materials and services and production increases. The projects have reportedly
also improved irrigator confidence in the future and assisted in succession planning.
Efficiency projects need to meet Basin Plan requirements for neutral or improved socio-economic
outcomes. In response to community concerns, the Commonwealth in consultation with Basin state
governments commissioned an independent review to provide advice on how to best design the
efficiency measure program to recover 450 GL of water by 2024, and have neutral or improved
socio-economic outcomes as required by the Basin Plan. The study will also report on the potential
social-economic impacts arising from efficiency measure projects at a range of scales and will
provide an anticipated cost of recovering water through efficiency measure projects.
The review, conducted by EY, will report back to Basin governments in December 2017.

Sustainable Diversion Limit Adjustment Mechanism: Draft Determination Report
25
Ramsar sites
The Basin plan requires that any changes to the SDLs take account of Australia’s international
obligations under the Ramsar Convention and advise the Commonwealth minister responsible for
water on the implications of a proposal for any declared Ramsar wetland. The Ramsar Convention
(an international treaty signed in Ramsar, Iran, in 1971) aims to halt the worldwide loss of wetlands
and to conserve, through wise use and management, those that remain. Australia has 65 Ramsar
sites, 16 of which are in the Murray–Darling Basin. Eight are located in the southern-connected
Basin and are potentially affected by SDL adjustment projects. These are:
1. Barmah Forest
2. NSW Central Murray State Forests
3. Gunbower Forest
4. Hattah-Kulkyne Lakes
5. Fivebough and Tuckerbil Swamps
6. ‘Riverland’
7. Banrock Station Wetland Complex
8. The Coorong and Lakes Alexandrina and Albert.
Analysis undertaken by the Authority indicates there may be changes to the hydrological regime
as a result of operating the SDL Adjustment Mechanism. This could include changes to the volume,
timing, duration and frequency of surface water flows. These changes may affect flows to and
within Ramsar wetlands in the southern Basin, with the potential to change their ecological
character in both positive and negative ways.
Supply measure projects can increase outcomes for Ramsar wetlands in a number of ways,
including greater floodplain connectivity and improved seasonality and duration of water for the
environment. An analysis of the outcomes from the SDL adjustment package has determined that
the proposed adjustments meet the ecological equivalence test and the limits of change
safeguards and are not likely to have a significant impact on the eight relevant Ramsar wetlands.
More detail is provided in Attachment B.
As part of project delivery, proponents must obtain all necessary approvals including those under
the Environment Protection and Biodiversity Conservation Act (EPBC Act). This requires the
proponent to consider any adverse impacts on Ramsar sites. In addition, ongoing project
refinement and implementation through to 2024 will need to consider potential impacts on Ramsar
wetlands. This may include coordinating the package as a whole to maximise the potential for any
positive benefits through additional flows and connectivity, and avoid any adverse impacts through
appropriate management and operating regimes. The additional environmental benefits from
efficiency measures will also assist to maintain the character of Ramsar wetlands.

Sustainable Diversion Limit Adjustment Mechanism: Draft Determination Report
26
Proposed SDL adjustments
The Authority has determined the proposed adjustment amounts and how these should be
apportioned. Table 2 is based on the package of 36 supply measure projects submitted by state
governments. The supply projects were assessed through the SDL Adjustment Mechanism
framework described in this report, and required tests were applied to the resulting proposed
adjustment. This includes no adverse impacts on reliability of supply that are not offset or negated,
the achievement of environmental equivalence and no breach of the limits of change that has the
potential for adverse ecological impacts.
Table 2 is based on the package of 36 supply measure projects submitted by state governments.
The supply projects were assessed through the SDL Adjustment Mechanism framework described
in this report, and required tests were applied to the resulting proposed adjustment. This includes
no adverse impacts on reliability of supply that are not offset or negated, the achievement of
environmental equivalence and no breach of the limits of change that has the potential for adverse
ecological impacts.
Table 2: Proposed SDL adjustments for each resource unit (catchment area)
SDL resource unit Current SDL
(GL)
Apportionment of supply
contribution (GL)
Reallocation of shared
reduction (GL)
Proposed SDL (GL)#
14 Murrumbidgee 1938.1 162.0 0.0 2100.1
15 New South Wales Murray
1341.7 124.8 0.0 1466.5
16 Lower Darling 45.5 0.0 0.0 45.5
17 Victorian Murray
1251.7 72.8 0.0 1324.5
18 Kiewa 23.3 1.3 0.0 24.6
19 Ovens 80.3 3.0 0.0 83.3
20 Goulburn 1153.0 174.5 0.0 1327.5
21 Broken 54.6 1.1 0.0 55.7
22 Campaspe 120.9 2.6 0.0 123.5
23 Loddon 155.8 10.9 0.0 166.7
25 South Australian Murray
483.1 52.0 1.9 533.2
27 Eastern Mount Lofty Ranges
26.4 0.0 -1.9 28.3
29 Australian Capital Territory
47.6 0.0 0.0 47.6
Total 6722.0 605 0.0 7327
* The Basin Plan limits the net adjustment for supply and efficiency measures to SDLs to 5% of the Basin-wide SDL, or
544 GL. The full supply contribution of 605 GL can be reached once sufficient efficiency measures have been delivered
to reduce the net adjustment to 544 GL.
# this column was updated on 13/10/17 to correct an error.

Sustainable Diversion Limit Adjustment Mechanism: Draft Determination Report
27
Table 3: Proposed changes to water recovery in the southern connected Basin
SDL resource unit
Water recovery target under
the Basin Plan (GL)
Proposed adjusted water recovery target
(GL)
Water recovery completed to 30 June 2017
(GL)
Water recovery remaining after
proposed adjustments
(GL)
14 Murrumbidgee 563.0 401.0 401.0 0.0
15 New South Wales Murray
470.0 345.2 352.3 0.0
16 Lower Darling 15.0 15.0 20.0 0.0
17 Victorian Murray 455.4 382.6 397.0 0.0
18 Kiewa 1.3 0.0 0.0 0.0
19 Ovens 3.1 0.1 0.1 0.0
20 Goulburn 536.4 361.9 361.9 0.0
21 Broken 1.6 0.5 0.5 0.0
22 Campaspe 31.7 29.1 29.1 0.0
23 Loddon 22.8 11.9 11.9 0.0
25 South Australian Murray
181.9 131.8 143.9 0.0
27 Eastern Mount Lofty Ranges
1.9 0.0 0.0 0.0
29 Australian Capital Territory
4.9 4.9 4.9 0.0
Total 2289.0 1684.0 1722.6 0.0

Sustainable Diversion Limit Adjustment Mechanism: Draft Determination Report
28
Ecological outcomes/limits of change
The limits of change rules were developed and agreed by the Authority and Basin state
governments prior to the Basin Plan being settled. They were developed using the best available
modelling and scientific information at the time, but it was also understood that improvements in
knowledge would occur. As a result, the Basin Plan allows for a subset of limits of change which
relate to specific flow indicators to be reviewed where minor breaches occur. In these
circumstances, new lines of evidence can be considered to assess whether the intended site-
specific ecological targets can be achieved, for example mitigating strategies may be available that
allow the ecological outcomes of the Basin Plan to be achieved despite limits of change being in
breach. In this case the breached limit of change may not apply.
In making its SDL adjustment determination, the Authority engaged an independent expert review
panel to consider any potential breaches to the limits of change rules, based on early modelling of
the projects. The panel consisted of ecologists and river operators with significant experience in
these matters. Once the final model run was completed in September 2017, the panel provided
their findings and recommendations to the Authority. The panel considered relevant new evidence
on whether environmental outcomes were adversely affected, including the potential for available
mitigating actions to achieve the Basin Plan’s ecological outcomes.
The Panel analysed the failure to achieve specific targets for two river reaches with respect to
overbank flows and four sites with respect to base flows and concluded that none of the site specific
overbank target breaches were material or significant in terms of their likely impact on ecological
responses of birds, fish or vegetation. All breaches were considered sufficiently close to their
targets to be:
within the limits of modelling (and assumptions made within the models) or measurement
precision, and/or
within the capacity of river operators to optimise releases and flows to achieve the “missed”
targets, and/or
within the limits of our current understanding of cause and effect relationships between
hydrology and ecosystem function.
The investigation and analysis by the panel, and the consideration of the panel’s
recommendations by the Authority, used a strong evidence-base to provide confidence that
environmental outcomes can be achieved despite a limit of change rule being triggered.
The limits of change metric results are at Attachment C.
Reliability
In their assessment of potential impacts on the reliability of supply for the proposed SDL
adjustment, state government managers took into account the fact the model represents 2009
conditions and policy and management changes since then that may have negated or offset any
issues associated with the proposed adjustment.
The issue of reliability was considered by the Basin Officials Committee who agreed that if the
operation of the SDL Adjustment Mechanism has the potential to result in reduction of reliability for
entitlement holders, state governments will work together to find real world solutions to address
those reliability concerns, consistent with the requirements in the Basin Plan.

Sustainable Diversion Limit Adjustment Mechanism: Draft Determination Report
29
SDL Adjustment Mechanism assumptions
In making its determination of the proposed adjustment amounts, the Authority has used a number
of assumptions:
Reallocation of the shared reduction amounts
For each catchment the SDLs are made up of two components: the local reduction and the shared
reduction. The local water recovery amounts, set out in Schedule 2 of the Basin Plan, must be
achieved from infrastructure efficiencies and buyback within that catchment. The shared water
recovery is set at a zone level in Chapter 6 of the Basin Plan. There are five zones:
northern Basin
southern Basin Victoria
southern Basin New South Wales
southern Basin South Australia
southern Basin Australian Capital Territory.
For the purposes of the Adjustment Mechanism, state governments were given the opportunity to
request a change to the way shared reduction amounts for a zone were divided to better align with
state priorities. One reallocation request was received in the southern Basin from South Australia,
moving 1.9 GL of shared water recovery from the Eastern Mt Lofty Ranges to the South Australian
Murray.
Apportionment
The Authority has worked out the proposed adjustment to SDLs from the net result of the full
package of supply and efficiency projects. Adjustment values are not calculated for each project
individually due to the interlinked and interdependent nature of river management.
To work out the proposed SDL adjustments for each water resource plan area, the Authority needs
to allocate the overall adjustment value between catchments. This process is called apportionment.
On 9 December 2016, the COAG noted that Basin governments are seeking to offset the full
remaining water recovery amount in the southern Basin. The way that the total SDL adjustment
amount is distributed between catchments is a key element in achieving this goal.
The Authority has used the following principles for apportionment:
distribute the net adjustment in a way that aims to meet any remaining water recovery in
each catchment, and minimise under or over recovery outcomes at the catchment and state
levels for the southern connected Basin
if additional water is available above the remaining total southern connected Basin water
recovery target, the remaining amount will be distributed in a way that optimises the SDL
adjustment outcome within the model
once the water recovery target is met, the surplus supply contribution is apportioned to
deliver the supply contribution to the states in proportion to those ratios set out in section
6.05 of the Basin Plan.
Some water recovery in the southern Basin is contracted but not yet delivered. Water recovery
assumptions in the Authority’s apportionment of the total adjustment amount have been made
with the expectation that all contracted water recovery will be delivered. Subject to these existing
water recovery contracts being delivered and the implementation of the SDL Adjustment
Mechanism efficiency component, this will mean no further water recovery in the southern Basin.

Sustainable Diversion Limit Adjustment Mechanism: Draft Determination Report
30
Basin governments have indicated that they will continue to discuss the approach to apportionment
during the public feedback period.
The five per cent limit
The SDL Adjustment Mechanism allows a net adjustment of Basin-wide surface water SDLs by up
to five per cent, or 544 GL, of the Basin-wide limit of 10,873 GL. Where the proposed adjustment
determination result exceeds this amount after the net supply/efficiency outcome is calculated, the
overall adjustment must be reduced to within the five per cent amount. If further efficiency
entitlements are recovered the net increase is recalculated, taking into account total supply and
efficiency adjustment amounts. In other words, where the Authority determines an SDL adjustment
of over 544 GL, each GL of water over this amount, will require a matching GL of water through
the efficiency component of the Adjustment Mechanism. For example, an SDL adjustment of
544 GL can increase one GL to 545 with one GL of water from efficiency project, and to 564 GL
with 20 GL of water from efficiency projects and so on.
As the expected adjustment is above the five per cent threshold, efficiency projects will be required
to bring the system back into balance.
With the water recovery task in the southern connected Basin of 571 GL (30 June 2017) the
proposed adjustment amount, once the five per cent rule has been applied, does not account for
the total remaining water recovery. As a consequence additional water through efficiency will be
required for the net adjustment amount to reach the full water recovery target in the southern
connected Basin, before SDLs come into effect in 2019.
Water recovery
The determination of the proposed adjustment amounts, and the application of both apportionment
and the five per cent rule, all use the Commonwealth’s water recovery figures as at 30 June 2017.
These figures include recovered water and water that is contracted to be recovered. The Authority
will work with jurisdictions to adjust apportionment if required to account for any change to the
assumptions in the period prior to making its final determination.

Sustainable Diversion Limit Adjustment Mechanism: Draft Determination Report
31
Section 7: Next steps – beyond 2017
Project design and nomination
Basin state governments have worked collaboratively to develop the package of projects that have
been nominated for the SDL Adjustment Mechanism. State and Commonwealth agencies have
also undertaken rigorous project assessments against the agreed criteria in the phased process
set out in Figure 5. These assessments make sure that the full package of projects is sensible, will
achieve the aims of the SDL Adjustment Mechanism, and will improve the socio-economic and
environmental outcomes of the Basin Plan.
Draft Determination
The Authority has the role to independently assess the nominated projects to determine an
appropriate adjustment to the SDLs. The Authority also has a role to facilitate public input to the
draft determination. This report outlines the Authority’s assessment and now invites interested
people to submit feedback until 3 November.
Implementation
For both supply and efficiency projects the determination is just the start of the process. Local
knowledge is integral to the successful design and implementation of individual supply projects,
and will provide valuable input as the projects adapt and evolve over time in response to new
information. Community involvement will allow governments to understand the positive
environmental, social and economic benefits the projects can provide, and mitigate any adverse
impacts before projects are fully implemented. This input is critical to the ongoing detailed design
and implementation. There will be focused engagement on the package of projects, and Basin
state governments will work in partnership to provide information to communities about how they
can contribute through to 2024. An adaptive approach is envisaged (outlined in Box 1).

Sustainable Diversion Limit Adjustment Mechanism: Draft Determination Report
32
State and Commonwealth governments will work together to implement projects in a coordinated
way, to take advantage of interactions and interdependencies including coordination of the delivery
of water for the environment.
Box 1 - The proposed adaptive implementation approach
The Authority has used the information in project notification business cases, provided by Basin state governments, to determine the proposed SDL adjustment amount.
The assumptions used to model each project in the SDL Adjustment Mechanism assessment framework do not necessarily represent a commitment to a particular project design or operating strategy. Basin governments have agreed to take an adaptive approach to project implementation including ongoing community consultation on key projects. For most projects the next step is for Basin state governments to further refine project design, with the involvement of a wide range of people including communities, industries and water management experts. It is anticipated that some projects and their scope will be significantly further shaped whilst others will adopt existing business case parameters. Along with community consultation, the following will help to further inform project design:
further technical advice and assessment
compliance with regulations, including environmental impact assessment and cultural
and heritage legislation
advice and refinement in consultation with river operators and governments, including
negotiation of changes to river operating rules.
Where projects are significantly altered the proponent state government/s will amend the project notification, and the potential impacts of changes on the SDL adjustment value will be carefully considered. As a package environmental outcomes equivalent to 605 GL must be achieved.
The Authority will implement a transparent and accountable process to respond to changes during project design and implementation. The Authority will monitor and assess projects from 2018 to 2024 to ensure projects are on track to achieve stated outcomes. This will be done using a method that allows regular reporting against multiple lines of evidence and judgement, underpinned by rigorous modelling to enable the validation of real water savings. This will assist the Authority’s consideration of project outcomes and SDL adjustment reconciliation.
Ongoing reporting will provide state governments with an adaptive ‘no-surprises’ approach by identifying where a project may be unable to achieve its intended outcomes for a range of reasons. This work will ensure, as a package, the projects achieve the equivalent outcomes.
The reporting framework will include an assessment of the potential impact on the original SDL adjustment outcome, however SDLs will not be amended at these checkpoints. Through this ongoing oversight, governments will seek to achieve the outcomes of the 2017 SDL adjustment determination, with full water recovery in the southern connected Basin achieved through supply project implementation and efficiency projects. The Authority expects that most projects will change in some way during design and implementation, and this approach provides governments and communities with the flexibility to strengthen and improve the projects in the SDL Adjustment Mechanism.

Sustainable Diversion Limit Adjustment Mechanism: Draft Determination Report
33
Section 8: Public comment period
The Sustainable Diversion Limit Adjustment Mechanism assessment (draft determination) is
available for public comment from 3 October 2017–3 November 2017.
More information is available on the Authority’s website at www.mdba.gov.au/SDLAM, or you can
contact the Authority at [email protected], or call 1800 230 067.
How your feedback will be used
Basin governments are aware of a range of issues and opportunities that could strengthen the
projects and minimise risks.
There is a commitment to continue to strengthen projects during the next stage of project design
and implementation.
The public can provide input on issues or opportunities in relation to the package.
The feedback received will be used to provide advice, along with the SDL assessment, to the
Commonwealth minister responsible for water– once approved, it is then tabled in Parliament.
Project-specific feedback will be provided to Basin state governments to strengthen project design and implementation.

Sustainable Diversion Limit Adjustment Mechanism: Draft Determination Report
34
References
Bewsher, D. 2016. Review of the Hydrological Modelling Frameworks used to inform Potential Basin Plan Amendments. Murray-Darling Basin Authority.
Brookes, J, T Hillman, G Jones, and M Stewardson. 2014. SDL Adjustment Ecological Elements Method Development Report. Review of Final Project Report by the Independent Review Panel. Murray-Darling Basin Authority.
Campbell, B, E Coote, J Foster, H Johnson, and N Sloane. 2016. “Decision Support Systems - assisting implementation of long-term environmental water planning.” Edited by G J Vietz, A J Flatley and I D Rutherford. Proceedings of the 8th Australian Stream Management Conference. Leura, NSW. 547-561.
Commonwealth Government of Australia. 2012. Water Act 2007 - Basin Plan 2012. Canberra: Commonwealth of Australia.
Green, D, and P Alexander. 2006. River Murray Wetland Database: NSW, Victoria. Wetland Commence-to-flow levels: June 2006. Albury: Murray Wetlands Working Group.
MDBA. 2013. Returning water to Hattah Lakes - Episodes 1 and 2. https://www.mdba.gov.au/managing-water/environmental-water/delivering-environmental-water/hattah-lakes.
Murray-Darling Basin Authority. 2014d. Basin Annual Environmental Watering Priorities 2014-15. Canberra: Murray-Darling Basin Authority.
Murray-Darling Basin Authority. 2014c. Basin-wide environmental watering strategy 2014. Canberra: Murray-Darling Basin Authority.
Murray-Darling Basin Authority. 2014a. River Murray from Hume Dam to Yarrawonga Weir reach report: Constraints Management Strategy. Canberra: Murray-Darling Basin Authority.
Murray‐Darling Basin Authority. 2011. The proposed “environmentally sustainable level of take”
for surface water of the Murray‐Darling Basin: Methods and outcomes. Canberra: Murray‐Darling Basin Authority.
Overton, I C, C A Pollino, J Roberts, Reid J R W, N R Bond, H M McGinness, B Gawne, et al. 2014. “Development of the Murray-Darling Basin Plan SDL Adjustment Ecological Elements Method. Report prepared by CSIRO for the Murray-Darling Basin Authority.”

Sustainable Diversion Limit Adjustment Mechanism: Draft Determination Report
35
Links to further reading
Intergovernmental Agreement on Implementing Water Reform in the Murray Darling Basin Juen 2013 (revised March 2017): https://www.coag.gov.au/about-coag/agreements/intergovernmental-agreement-implementing-water-reform-murray-darling-basin
SDL adjustment projects: https://www.mdba.gov.au/basin-plan-roll-out/sustainable-diversion-limits/sdl-adjustment-proposals-state-projects
Commonwealth On-Farm Further Irrigation Efficiency Program (COFFIE):
http://www.agriculture.gov.au/water/mdb/programs/basin-wide/coffie
Phase 2 Assessment Guidelines for Supply and Constraint Measure Business Cases: http://www.mdba.gov.au/sites/default/files/pubs/Phase2-Assessment-Guidelines.docx
Hydrological modelling: https://www.mdba.gov.au/managing-water/hydrological-modelling
Hydrologic modelling to inform the proposed Basin Plan: methods and results: https://www.mdba.gov.au/publications/mdba-reports/hydrologic-modelling-inform-proposed-basin-plan-methods-results
Review of the Hydrological Modelling Frameworks used to inform Potential Basin Plan Amendments (2016): https://www.mdba.gov.au/publications/independent-reports/BPamendments-review-hydrological-modelling
Assessing environmental water requirements for the Basin’s rivers (background to hydrological indicator site and site-specific flow indicators SFIs). https://www.mdba.gov.au/publications/mdba-reports/assessing-environmental-water-requirements-basins-rivers
Ecological Elements method: https://www.mdba.gov.au/publications/independent-reports/development-murray-darling-basin-plan-sdl-adjustment-ecological
SDL Adjustment Ecological Elements Method Development Report, Review of Final Project Report by the Independent Review Panel: https://www.mdba.gov.au/publications/independent-reports/sdl-adjustment-ecological-elements-method-development-report-review
Efficiency measures, links to independent review terms of reference:
http://www.agriculture.gov.au/water/mdb/programs/
Hattah Lakes case study and related links: https://www.mdba.gov.au/managing-water/environmental-water/delivering-environmental-water/hattah-lakes
Australia’s Ramsar Sites: http://www.environment.gov.au/water/wetlands/publications/factsheet-australias-ramsar-sites
Basin-wide environmental watering strategy 2014: https://www.mdba.gov.au/publications/mdba-reports/basin-wide-environmental-watering-strategy-2014

Attachment A - package of supply, constraint and efficiency projects agreed by the Murray–Darling Basin Ministerial Council on 16 June 2017
36
Attachment A - package of supply, constraint and efficiency projects agreed by the Murray-Darling Basin Ministerial Council on 16 June 2017
Operational rules changes and system enhancements
Project title Proponent state(s)
Project description
2011 Snowy Water Licence Schedule 4 Amendments to River Murray Increased Flows Call Out Provisions
New South Wales / Victoria
Amendments to Snowy Hydro licence in 2011 allow the water recovered by the River Murray Increased Flows (RMIF) to be held and called out. Previously the release of the water was at the discretion of Snowy Hydro and was generally at times suited to Snowy Hydro’s commercial outcomes. The proposal intends to provide a means to control the timing of RMIF water releases from the Snowy Scheme, allowing more flexibility to achieve environmental outcomes targeted in the River Murray below Hume Dam.
Barmah–Millewa Forest Environmental Water Allocation
Victoria / New South Wales
Rule change to vary the rules associated with the water set aside by Victoria and New South Wales in an environmental account (the Barmah–Millewa Forest Environmental Watering Account or BMFEWA) to water the Barmah–Millewa Forest proposed to allow the use of other environmental entitlements to target the environmental requirements specified in the Basin Plan. This measure proposes to not initiate or continue release from BMFEWA if a four monthly flood has already occurred.
Computer Aided River Management (CARM) Murrumbidgee
New South Wales
The CARM project aims to use better information in the form of metering, inundation models and more accurate loss estimates to allow operators to more accurately make releases to meet downstream orders. The saved operational loss may then be calculated and set aside to achieve environmental outcomes. A callable entitlement as a result of the envisaged saving will allow delivery of previous losses (which were also contributing to environmental outcomes) in a more managed way.
Enhanced environmental water delivery (Hydro Cues)
New South Wales / Victoria / South Australia
This project will achieve enhanced environmental outcomes by increasing environmental water holders’ ability to time releases of environmental water from dams with increases in natural flows caused by rainfall. Proponents and environmental water holders will work together to explore opportunities to better mimic natural conditions without impacting long and short-term reliability. The environmental benefits, in part, will be dependent on the extent to which constraints projects are implemented. Any changes will be tested progressively and monitored in an adaptive management process consistent with agreed constraints outcomes. Proponents acknowledge the need for focussed engagement and consultation with communities on this project.
Flexible Rates of Fall in River Levels Downstream of Hume Dam
Victoria / New South Wales
Rule change to allow Hume releases to be reduced more quickly when flows have not been elevated for an extended period beforehand, with the water saved released at a different point in time or in a different flow pattern that would provide additional environmental benefits. The additional flexibility improves Hume Dam operational efficiency.
Hume Dam airspace management and pre-release rules
Victoria / New South Wales
Rule change to allow future environmental water releases in airspace management.
Improved Regulation of the River Murray
Victoria / New South Wales
The proposal focused on recent observed improvements in reducing river operational losses. While notified as a supply measure, there was no agreement by all jurisdictions for the project to be modelled as part of the SDL adjustment determination in September 2017.
Structural and operational changes at Menindee Lakes
New South Wales
This project is a package of operational changes and infrastructure works designed to improve the efficiency of the Menindee Lakes system. The enhanced Menindee project introduces some new works and measures to incorporate a wider range of infrastructure, operations, regulatory and adjustment options which in combination will deliver greater water efficiency savings. The proponent acknowledges the need for consultation with communities and the need to set out transparent governance arrangements.

Attachment A - package of supply, constraint and efficiency projects agreed by the Murray–Darling Basin Ministerial Council on 16 June 2017
37
Operational rules changes and system enhancements
Project title Proponent state(s)
Project description
SDL offsets in the Lower Murray NSW
New South Wales
The project aims to improve environmental water delivery and achieve better environmental and operational outcomes than achieved under the SDL benchmark model. This is to be done through the manipulation of weir pools, construction of a replacement pump station for Lake Cullulleraine (in Victoria), and works in the Carrs, Capitts and Bunberoo Creek systems to provide evaporative and seepage water savings. Weir pools can create unnatural inundation of connected wetlands when the river is held artificially high. Lowering the weir pool can be used to return wetlands to a more natural wetting/drying regime, while raising it can allow water to reach areas that would be difficult to water under most conditions. The strategy of raising and lowering the weirs should provide an environmental benefit compared to an artificially constant weir pool level.
Hume to Yarrawonga key focus area
Victoria / New South Wales
Investigation of opportunities to address physical and policy constraints to the delivery of higher regulated flows (up to 40,000 megalitres per day from Hume Dam). Investigations will include the potential effects of higher flows on third parties and mitigation options to address unacceptable impacts (including easements and/or infrastructure) to allow the delivery of these flows (to support improved river and wetland health outcomes). Landholder acceptance of potential works will be critical. This project must be considered in relation to the other southern connected Basin constraints projects.
Yarrawonga to Wakool junction key focus area
New South Wales
Investigation of opportunities to address physical and policy constraints to enable the delivery of higher flows (up to 30,000 megalitres per day downstream of Yarrawonga Weir, with a buffer for flows up to 50,000 megalitres per day). New South Wales will consult communities on mitigation options to address unacceptable impacts (including easements and/or infrastructure) to allow the delivery of these flows (to support improved river and wetland health outcomes). Landholder acceptance of potential works will be critical. This project must be considered in relation to the other southern connected Basin constraints projects.
South Australian Murray key focus area
South Australia
Investigation of opportunities to address physical and policy constraints to the delivery of higher regulated flows up to 80,000 megalitres per day at the South Australian border. Higher flows are important for maintaining longitudinal connectivity from the border to the Coorong, Lower Lakes and Murray Mouth and promoting lateral connectivity to deliver water to the wetlands, floodplains, creeks and anabranches connected to the main river channel. Landholder acceptance of potential works will be critical. This project must be considered in relation to the other southern connected Basin constraints projects.
New Goulburn key focus area*
Victoria
Investigation of opportunities to address in-channel constraints to the delivery of higher regulated flows up to 20,000 megalitres per day at Shepparton. Allowing the delivery of flows to the top of the bank would improve river health outcomes. This work will be done in a staged and bottom-up way with communities to understand the risks, impacts and costs, and develop feasible, practical and acceptable solutions to mitigate third party impacts. Building on this work, in close consultation with landholders and communities, further improvements to environmental water delivery will also be investigated. Landholder acceptance of potential works will be critical. This project must be considered in relation to the other southern connected Basin constraints projects.
Lower Darling key focus area (notified as part of the Menindee project)
New South Wales
As part of the ‘Structural and operational changes at Menindee Lakes’ project, investigation of opportunities to address phys ical and policy constraints to the delivery of higher regulated flows (up to 14,000 megalitres per day at Weir 32). Investigations will include the potential effects of higher flows on third parties and mitigation options to address unacceptable impacts (including easements and/or infrastructure) to allow the delivery of these flows (to support improved river and wetland health outcomes). Landholder acceptance of potential works will be critical. This project must be considered in relation to the other southern connected Basin constraints projects.
Murrumbidgee key focus area
New South Wales
Investigation of opportunities to address physical and policy constraints to the delivery of higher regulated flows (up to 40,000 megalitres per day at Wagga Wagga). Investigations will include the potential effects of higher flows on third parties and mitigation options to address unacceptable impacts (including easements and/or infrastructure) to allow the delivery of these flows (to support improved river and wetland health outcomes). Landholder acceptance of potential works will be critical. This project must be considered in relation to the other southern connected Basin constraints projects.
* This project is not notified as a supply measure and not included in the SLD adjustment determination

Attachment A - package of supply, constraint and efficiency projects agreed by the Murray–Darling Basin Ministerial Council on 16 June 2017
38
Environmental works
Project title Proponent state(s) Project description
Belsar-Yungera Floodplain Management Project
Victoria This proposed supply measure will maintain and improve flora and fauna habitat values and provide periodic breeding opportunities for wetland species, such as fish, frogs and waterbirds. Managed flows will be able to be delivered to 2,370 hectares of highly valued floodplain, representing one third of the total area. The works can be operated flexibly to meet the water requirements of different vegetation communities, mimicking a broad range of River Murray flows up to 170,000 megalitres per day. Through the construction of three large regulators, a series of smaller supporting regulators, track raising (levees) and a pipeline (to allow use of temporary pumps), this project will connect extensive areas of floodplain through tiered watering events. These works will make use of natural flow paths to increase the extent, frequency and duration of inundation from either Basin Plan flows or pumping during low flow events.
Burra Creek Floodplain Management Proposal
Victoria The proposed works will enable inundation of an area of 407 hectares. This represents 33 percent of the total forest area and almost all of the flood dependent communities found within the forest, and provides a greater extent of watering than is possible under Basin Plan flows. The works involve the construction of three large regulators, raising tracks to form levees, and the removal of barriers to flow on the floodplain.
Chowilla Floodplain TLM Project
South Australia / New South Wales/ Victoria
The Chowilla Floodplain works is part of a program of The Living Murray (TLM) works at icon sites along the River Murray to ensure that environmental water recovered as part of TLM is used efficiently and ecological elements are maintained. The Chowilla Floodplain project involves a major environmental regulator on the Chowilla Creek and a range of complementary works. The environmental regulator will allow flows to be managed to enable flooding across the floodplain under relatively low river flow conditions.
Flows for the Future South Australia The project proposes activities that reduce the interception of low flows and result in additional flows to riverine environments in the Eastern Mount Lofty Ranges (EMLR) and to the River Murray including the Coorong, Lower Lakes and Murray Mouth in South Australia. The project will help restore the natural low flow patterns within the EMLR through measures that will improve the passage of low flows and freshes to improve ecological habitat conditions.
Gunbower Forest TLM Project
Victoria / New South Wales / South Australia
A suite of engineering works have been built through TLM to deliver environmental water to the Gunbower Forest Icon Site, watering up to 4,800 hectares. These works and associated operating regime have been designed to achieve the ecological objectives that have been set for the forest. The works include two main components: • Lower Landscape Works — target the forest wetlands and use relatively small volumes of water. Works included refurbishing
existing regulators within the forest, constructing new regulators and decommissioning of a single regulator. These regulators deliver water from either Gunbower Creek or the River Murray (when flows exceed 14,000 megalitres per day).
Hipwell Road Channel — targets large areas of river red gums and can create the conditions required for large colonial waterbird breeding events. Works include construction of a channel to deliver water from Gunbower Creek to the forest, a new weir in Gunbower Creek and associated works.
Gunbower National Park Floodplain Management Project
Victoria The project has been developed to enable the delivery of environmental water to the wetlands and forest of the Gunbower National Park. It will mimic a natural flood event of up to 50,000 megalitres per day across 500 hectares. This includes almost half of the permanent and temporary wetlands in the project area and 20 percent (250 hectares) of river red gum with flood dependent understorey. The package of works include regulator and creek enhancement works. The mid forest works will consist of a 100 megalitres per day pump station location on the River Murray and a number of regulators. This will enable the provision of water to approximately 500 hectares of Gunbower National Park, currently unable to be watered by any other infrastructure.

Attachment A - package of supply, constraint and efficiency projects agreed by the Murray–Darling Basin Ministerial Council on 16 June 2017
39
Environmental works
Project title Proponent state(s) Project description
Guttrum and Benwell State Forests Floodplain Environmental Works Project
Victoria The project will reinstate a more natural flooding regime for the Guttrum and Benwell Forests, addressing, in particular, the reduced frequency and duration of floods. The proposed works will water 1,200 hectares via pump stations, including semi-permanent wetlands and 82 percent of the river red gum forest with flood dependent understorey. The works will include two separate pump stations to deliver environmental water into Guttrum Forest, one pump station in Benwell Forest and containment works (regulators and levees) in both forests to contain water on the floodplain. The works have been designed to meet the environmental watering requirements of the ecological values by mimicking a 26,000 megalitres per day flood event in the River Murray for Guttrum Forest and a 24,000 megalitres per day flood event for Benwell Forest.
Hattah Lakes Environmental Flows TLM Project
Victoria / New South Wales / South Australia
The project aims to deliver a watering regime that will achieve the ecological objectives for the Hattah Lakes Living Murray Icon Site. The on-ground works have been designed to increase the frequency, duration and extent of flooding across the lakes and surrounding floodplain. The package of works enables watering of 6,000 hectares and includes:
a new pumping station at Messenger’s Crossing
sill lowering in Chalka Creek South
four new regulators (Messenger’s, Oatey’s, Cantala, Kramen) and associated works
refurbishment of an existing regulator (Little Hattah)
three new stop banks or levees.
Hattah Lakes North Floodplain Management Project
Victoria This project will complement TLM works at the Hattah Lakes Icon Site by enhancing flooding across higher floodplain terraces. The project will also increase the flexibility for environmental water management across the lakes. The proposed works will water an additional 1,130 hectares of floodplain through the construction of two new regulators, a causeway across an existing track and 1.7 kilometres of levees along track alignments.
Improved Flow Management Works at the Murrumbidgee River – Yanco Creek Offtake
New South Wales This proposal aims to return the Yanco Creek system closer to a pre-development wetting/drying regime, while improving infrastructure that supplies irrigation and stock and domestic water. Upgrades to Yanco Weir on the Murrumbidgee River would result in more control over flows through the proposed Yanco Creek regulator. This may provide the Commonwealth Environmental Water Holder and the Office of Environment and Heritage with more flexibility in managing flows within the Murrumbidgee River system.
Lindsay Island (Stage 1) Upper Lindsay watercourse Enhancement TLM Project
Victoria / New South Wales / South Australia
Lindsay Island is part of the Lindsay-Wallpolla Icon Site. The Stage 1 works were funded by TLM and aimed to maintain existing high quality habitat for native fish, increase the extent of flowing habitat on Lindsay Island by about 28 kilometres, improve fish passage between the Lindsay Island anabranches and the River Murray and improve the condition of riparian vegetation. These works will contribute to achieving the ecological objectives that have been set for the site, focusing on in-stream habitat. The works include three new regulators:
Upper Lindsay River regulators (north and south inlets)
Mullaroo Creek regulator and fishway.
Lindsay Island (Stage 2) Floodplain Management Project
Victoria The Lindsay Island Floodplain Project will inundate 5,152 hectares of the floodplain and connect many parts of the floodplain through tiered watering events, including areas of unique fast-flowing aquatic habitat, through to sections of black box, lignum and onto the higher alluvial terraces. The proposed works will be operated in tandem with the recently completed TLM works at this site (Lindsay State 1) and Lock 7 to mimic flows of 40,000 megalitres per day to 120,000 megalitres per day. The proposed works include two components:
primary: Berribee Regulator and fishway, five containment regulators and 2.6 kilometres of levees along track alignments
secondary: 13 regulators and associated works, and 4.9 kilometres of levees along track alignments.
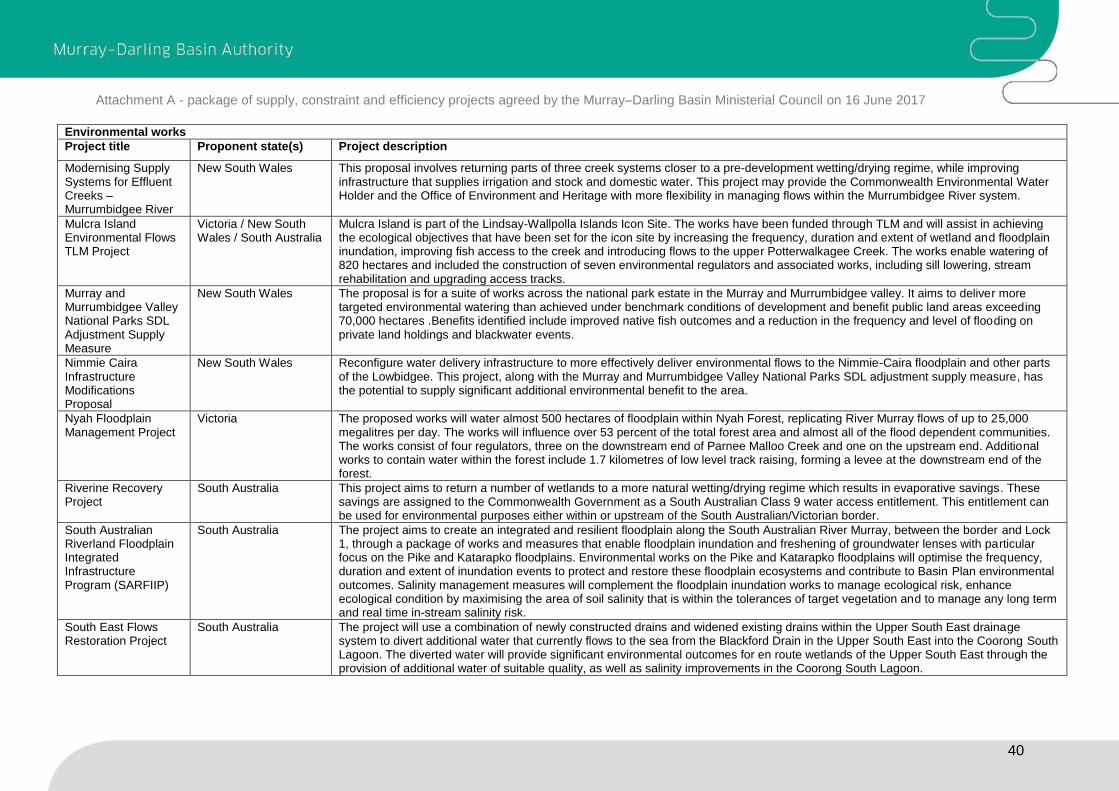
Attachment A - package of supply, constraint and efficiency projects agreed by the Murray–Darling Basin Ministerial Council on 16 June 2017
40
Environmental works
Project title Proponent state(s) Project description
Modernising Supply Systems for Effluent Creeks – Murrumbidgee River
New South Wales This proposal involves returning parts of three creek systems closer to a pre-development wetting/drying regime, while improving infrastructure that supplies irrigation and stock and domestic water. This project may provide the Commonwealth Environmental Water Holder and the Office of Environment and Heritage with more flexibility in managing flows within the Murrumbidgee River system.
Mulcra Island Environmental Flows TLM Project
Victoria / New South Wales / South Australia
Mulcra Island is part of the Lindsay-Wallpolla Islands Icon Site. The works have been funded through TLM and will assist in achieving the ecological objectives that have been set for the icon site by increasing the frequency, duration and extent of wetland and floodplain inundation, improving fish access to the creek and introducing flows to the upper Potterwalkagee Creek. The works enable watering of 820 hectares and included the construction of seven environmental regulators and associated works, including sill lowering, stream rehabilitation and upgrading access tracks.
Murray and Murrumbidgee Valley National Parks SDL Adjustment Supply Measure
New South Wales The proposal is for a suite of works across the national park estate in the Murray and Murrumbidgee valley. It aims to deliver more targeted environmental watering than achieved under benchmark conditions of development and benefit public land areas exceeding 70,000 hectares .Benefits identified include improved native fish outcomes and a reduction in the frequency and level of flooding on private land holdings and blackwater events.
Nimmie Caira Infrastructure Modifications Proposal
New South Wales Reconfigure water delivery infrastructure to more effectively deliver environmental flows to the Nimmie-Caira floodplain and other parts of the Lowbidgee. This project, along with the Murray and Murrumbidgee Valley National Parks SDL adjustment supply measure, has the potential to supply significant additional environmental benefit to the area.
Nyah Floodplain Management Project
Victoria The proposed works will water almost 500 hectares of floodplain within Nyah Forest, replicating River Murray flows of up to 25,000 megalitres per day. The works will influence over 53 percent of the total forest area and almost all of the flood dependent communities. The works consist of four regulators, three on the downstream end of Parnee Malloo Creek and one on the upstream end. Additional works to contain water within the forest include 1.7 kilometres of low level track raising, forming a levee at the downstream end of the forest.
Riverine Recovery Project
South Australia This project aims to return a number of wetlands to a more natural wetting/drying regime which results in evaporative savings. These savings are assigned to the Commonwealth Government as a South Australian Class 9 water access entitlement. This entitlement can be used for environmental purposes either within or upstream of the South Australian/Victorian border.
South Australian Riverland Floodplain Integrated Infrastructure Program (SARFIIP)
South Australia The project aims to create an integrated and resilient floodplain along the South Australian River Murray, between the border and Lock 1, through a package of works and measures that enable floodplain inundation and freshening of groundwater lenses with particular focus on the Pike and Katarapko floodplains. Environmental works on the Pike and Katarapko floodplains will optimise the frequency, duration and extent of inundation events to protect and restore these floodplain ecosystems and contribute to Basin Plan environmental outcomes. Salinity management measures will complement the floodplain inundation works to manage ecological risk, enhance ecological condition by maximising the area of soil salinity that is within the tolerances of target vegetation and to manage any long term and real time in-stream salinity risk.
South East Flows Restoration Project
South Australia The project will use a combination of newly constructed drains and widened existing drains within the Upper South East drainage system to divert additional water that currently flows to the sea from the Blackford Drain in the Upper South East into the Coorong South Lagoon. The diverted water will provide significant environmental outcomes for en route wetlands of the Upper South East through the provision of additional water of suitable quality, as well as salinity improvements in the Coorong South Lagoon.

Attachment A - package of supply, constraint and efficiency projects agreed by the Murray–Darling Basin Ministerial Council on 16 June 2017
41
Environmental works
Project title Proponent state(s) Project description
TLM environmental works and measures – Koondrook–Perricoota Forest Flood Enhancement proposal
New South Wales / Victoria / South Australia
Koondrook–Perricoota Forest is a highly significant floodplain ecosystem on the Murray River in New South Wales. The Koondrook–Perricoota Forest is a large mosaic of river red gum, black box and grey box communities, interspersed by wetland ecosystems in New South Wales. Covering 32,000 hectares the state forest (Crown land) is managed by Forests NSW and is listed on the Register of the National Estate. The structures have been built and partially commissioned by NSW Water and MDBA River Murray Operations.
Vinifera Floodplain Management Project
Victoria The Vinifera Floodplain project will water up to 350 hectares of floodplain within Vinifera Forest. This represents 55 percent of the total forest area (638 hectares) and almost all of the flood dependent communities. The proposed works involve construction of four regulators and 1.1 kilometres of low level track raising to enable control of both flood and pumped flows into and out of Vinifera Creek. Water will be delivered to the site through a combination of natural inflows or temporary pumping when river flows are insufficient.
Wallpolla Island Floodplain Management Project
Victoria Wallpolla Island is part of TLM’s Lindsay–Wallpolla Islands Icon Site. The proposed works will complement existing TLM works at this icon site. This project will increase the frequency and duration of floodplain inundation across 2,650 hectares, providing significant benefit to nationally important species, threatened vegetation communities, ecological values, carbon cycling and downstream water quality. This will benefit both Wallpolla Island and the broader Lower Murray region. The proposed works include four major regulators, 22 smaller containment regulators and 4.5 kilometres of levees (raised tracks). The works have been designed to complement weir pool manipulation activities (Locks 8 and 9) and connect areas of flowing aquatic habitat with sections of black box, lignum and higher alluvial terraces. This will enable watering at a landscape scale, mimicking flows of 30,000 megalitres per day to 120,000 megalitres per day.
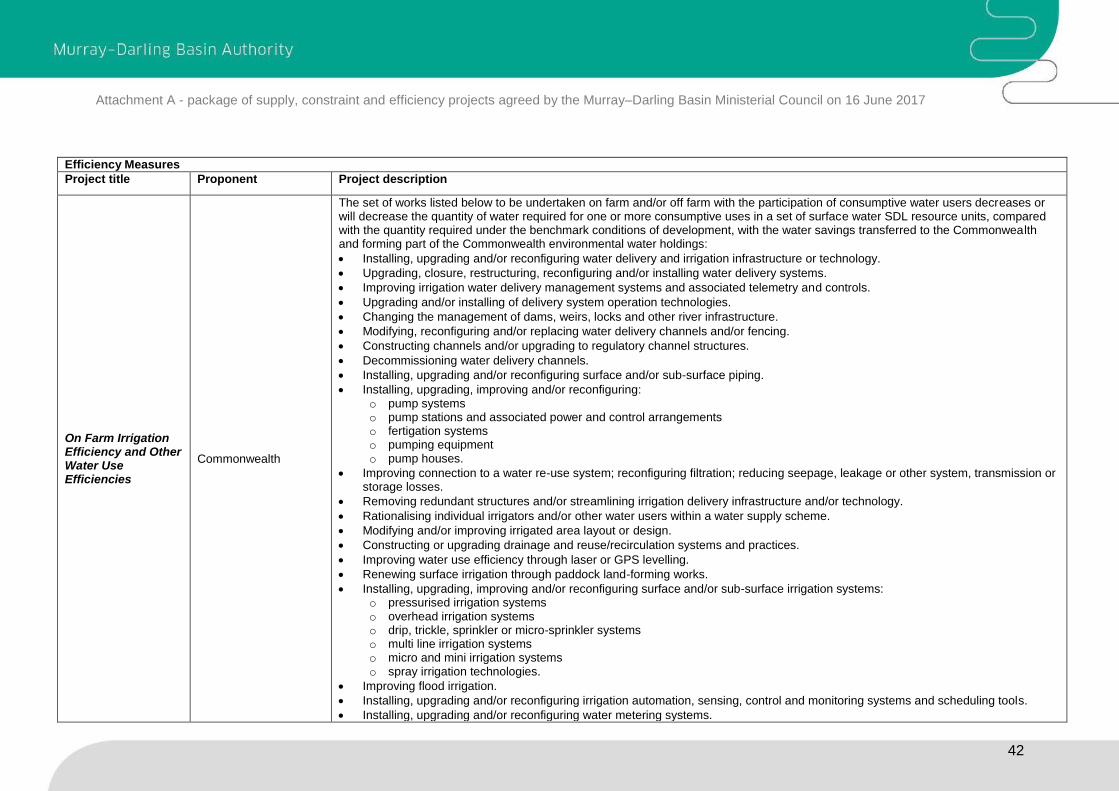
Attachment A - package of supply, constraint and efficiency projects agreed by the Murray–Darling Basin Ministerial Council on 16 June 2017
42
Efficiency Measures
Project title Proponent Project description
On Farm Irrigation Efficiency and Other Water Use Efficiencies
Commonwealth
The set of works listed below to be undertaken on farm and/or off farm with the participation of consumptive water users decreases or will decrease the quantity of water required for one or more consumptive uses in a set of surface water SDL resource units, compared with the quantity required under the benchmark conditions of development, with the water savings transferred to the Commonwealth and forming part of the Commonwealth environmental water holdings:
Installing, upgrading and/or reconfiguring water delivery and irrigation infrastructure or technology.
Upgrading, closure, restructuring, reconfiguring and/or installing water delivery systems.
Improving irrigation water delivery management systems and associated telemetry and controls.
Upgrading and/or installing of delivery system operation technologies.
Changing the management of dams, weirs, locks and other river infrastructure.
Modifying, reconfiguring and/or replacing water delivery channels and/or fencing.
Constructing channels and/or upgrading to regulatory channel structures.
Decommissioning water delivery channels.
Installing, upgrading and/or reconfiguring surface and/or sub-surface piping.
Installing, upgrading, improving and/or reconfiguring: o pump systems o pump stations and associated power and control arrangements o fertigation systems o pumping equipment o pump houses.
Improving connection to a water re-use system; reconfiguring filtration; reducing seepage, leakage or other system, transmission or storage losses.
Removing redundant structures and/or streamlining irrigation delivery infrastructure and/or technology.
Rationalising individual irrigators and/or other water users within a water supply scheme.
Modifying and/or improving irrigated area layout or design.
Constructing or upgrading drainage and reuse/recirculation systems and practices.
Improving water use efficiency through laser or GPS levelling.
Renewing surface irrigation through paddock land-forming works.
Installing, upgrading, improving and/or reconfiguring surface and/or sub-surface irrigation systems: o pressurised irrigation systems o overhead irrigation systems o drip, trickle, sprinkler or micro-sprinkler systems o multi line irrigation systems o micro and mini irrigation systems o spray irrigation technologies.
Improving flood irrigation.
Installing, upgrading and/or reconfiguring irrigation automation, sensing, control and monitoring systems and scheduling tools.
Installing, upgrading and/or reconfiguring water metering systems.

Attachment A - package of supply, constraint and efficiency projects agreed by the Murray–Darling Basin Ministerial Council on 16 June 2017
43
Efficiency Measures
Project title Proponent Project description
Installing river level and channel gauges.
Installing remote monitoring.
Installing, upgrading, improving and/or reconfiguring irrigation systems as a temperature mitigation strategy to minimise the need to overwater on high temperature days or reduce frost incidence or impact.
Installing weather proof netting and/or wind breaks.
Installing, upgrading and/or reconfiguring moisture monitoring equipment; moisture sensors and irrigation timers; moisture probes, relays and computer and communication equipment to monitor soil moisture levels.
Improving soil moisture holding capacity through mulching, manuring, cultivation and/or addressing soil acidity and alkalinity.
Upgrading, improving, and/or reconfiguring surface or sub-surface storages to reduce losses or installing or upgrading equipment to reduce losses.
Installing, upgrading, improving and/or reconfiguring surface or sub-surface storages.
Water harvesting.
Transferring to covered, intensive production systems.
Reconfiguring or diversifying crops or changing cropping times to reduce water requirement.
Changing to non-irrigation production systems.
Changing land or environmental management.
Modernising water supply control systems and its telemetry.
Changing water supply - replacing MDB water supply with groundwater, recycled water or water supply from a desalinisation plant.
Recovering and/or reusing wastewater.
Recycling water through hydroponics.
Recharging aquifers and/or underground storage of water. Project is for all units in the Murray-Darling Basin Plan

Attachment A - package of supply, constraint and efficiency projects agreed by the Murray–Darling Basin Ministerial Council on 16 June 2017
44
Efficiency Measures
Project title Proponent Project description
Urban or Industrial and Mining areas water efficiency
Commonwealth
The set of works listed below to be undertaken in urban or industrial areas with the participation of consumptive water users decreases or will decrease the quantity of water required for one or more consumptive uses in a set of surface water SDL resource units, compared with the quantity required under the benchmark conditions of development, with the water savings transferred to the Commonwealth and forming part of the Commonwealth environmental water holdings:
Constructing, replacing, upgrading, improving, or refurbishing bulk water infrastructure.
Improving management of bulk water supplies.
Upgrading, improving and/or refurbishing bulk water transport and/or distribution infrastructure.
Replacing surface water with fit-for-purpose water delivered from alternative supplies.
Improving economic regulation, competition and/or governance arrangements that lead to an increase in efficiency, availability, effectiveness and/or sustainability of the urban water sector.
Constructing, replacing, upgrading, installing, improving, or refurbishing filtration and/or water treatment infrastructure.
Constructing, replacing, installing, upgrading, refurbishing and/or improving the operation of urban water delivery infrastructure.
Improving systems for monitoring and predicting leaks.
Constructing, replacing, installing, upgrading, refurbishing and/or improving the operation of stock and domestic delivery infrastructure.
Constructing, replacing, upgrading, installing, improving or refurbishing water recycling and/or water reuse infrastructure.
Constructing, replacing, installing, upgrading, improving or refurbishing stormwater and waste-water capture and quality improvement infrastructure.
Constructing, replacing, installing, upgrading, improving or refurbishing stormwater and waste-water reuse infrastructure and/or devices.
Constructing, replacing, upgrading, installing, improving or refurbishing water sensitive urban design infrastructure and/or landscaping.
Improving management, use and/or integration of urban water sources.
Constructing, replacing, installing, upgrading, improving and/or refurbishing water efficient devices and/or technology.
Installing alternative household and/or community water supplies.
Metering and/or pressure management.
Reducing demand through demand management.
Undertaking water audits and/or offering rebates.
Consolidating and/or returning water entitlements where existing available water is no longer required for urban or other use. Programmes will be designed requiring adherence to all relevant approvals and regulations. Project is for all units in the Murray-Darling Basin Plan.

Attachment B – Analysis of impacts on Ramsar wetlands
45
Attachment B – Analysis of impacts on Ramsar wetlands
Basin Plan requirements
The Basin Plan requires the Authority to provide the Federal minister for water with advice on
the implications of a proposal for any declared Ramsar wetland. In this context the proposal
is the package of SDL projects as a whole.
Analysis outcomes
Modelling undertaken by the Authority indicates there will be changes to the hydrological
regime as a result of operating the SDL Adjustment Mechanism. This includes changes to the
volume, timing, duration and frequency of surface water flows which may affect flows to and
within Ramsar wetlands in the southern basin. This has the potential to change their ecological
character in both positive and negative ways.
An analysis of the outcomes from the SDL adjustment package has determined that the
proposed adjustments meet the ecological equivalence test and the limits of change
safeguards within the SDL Adjustment Mechanism. They are not likely to have significant
adverse impacts on the eight potentially affected Ramsar wetlands. More detail is provided
below.
It is important to note that this advice has been prepared to meet the requirements of Basin
Plan 7.10(2) and does not replace the need for Basin state governments to undertake their
own assessment of potential impacts during project design and implementation before they
take an action.
Method used to assess potential impact
The Commonwealth and state governments prepared ecological character descriptions
(ECDs) for Ramsar sites, identifying the critical components, processes and services unique
to each wetland. The ECDs set out limits of acceptable change (LAC) that allow ecological
change to be measured against wetland condition when first listed as a Ramsar site.
Hydrology is identified as a critical component and process in the ECDs of all eight potentially
impacted Ramsar wetlands. Many of the ECDs identify LACs for the hydrological regime. For
example, one of the LACs for Gunbower Forest requires:
‘No less than four events in any 10 year period of 13,700 ML/day for three months
(Murray River at Torrumbarry); and a maximum interval of three years between the
stated flow event.’
LACs are a tool by which ecological change can be measured, but exceeding a LAC does not
necessarily indicate there has been a negative change in ecological character.
Under the Basin Plan changes to the hydrological regime are safeguarded by limits of change
set out in Schedule 6, which aim to prevent adverse impacts at site-specific flow indicators
(SFIs). The ECDs were prepared prior to, and independently of, the Basin Plan. Consequently,
the ecological requirements of Ramsar listed wetlands were considered when developing the

Attachment B – Analysis of impacts on Ramsar wetlands
46
SFIs and limits of change in the Basin Plan. However, while the ECDs and the SFIs share
many commonalities in relation to geographic location and environmental water requirements,
it is not fully possible to make a direct comparison or assessment between the two metrics.
In its analysis of potential impacts the Authority has applied a modified form of the Matters of
National Environmental Significance Significant impact guidelines 1.1 (EPBC Act 1999). The
guidelines were produced to:
‘assist any person who proposes to take an action to decide whether or not they should
submit a referral to the Australian Government Department of the Environment (the
Department) for a decision by the Australian Government Environment Minister (the
minister) on whether assessment and approval is required under the Environment
Protection and Biodiversity Conservation Act 1999 (EPBC Act).’
The guidelines have four self-assessment questions. Three of these are relevant to assessing
potential impacts of the SDL Adjustment Mechanism on the Ramsar wetlands:
1. Are there any Ramsar wetlands located in the area of the proposed action?
2. Considering the proposed action at its broadest scope, is there potential for
impacts on Ramsar wetlands?
3. Are any impacts of the proposed action on Ramsar wetlands likely to be significant
impacts?
The guidelines also include advice on determining significant impact. One of these is relevant
to assessing potential impacts of the SDL Adjustment Mechanism on Ramsar wetlands:
‘An action is likely to have a significant impact on the ecological character of a declared
Ramsar wetland if there is a real chance or possibility that it will result in a substantial
and measurable change in the hydrological regime of the wetland, for example, a
substantial change to the volume, timing, duration and frequency of ground and
surface water flows to and within the wetland.’
Assessment results
Question 1: Are there any Ramsar wetlands located in the area of the proposed action?
There are eight Ramsar listed sites in affected units in the southern-connected system:
1. Barmah Forest
2. NSW Central Murray State Forests
3. Gunbower Forest
4. Hattah-Kulkyne Lakes
5. Fivebough and Tuckerbil Swamps
6. ‘Riverland’
7. Banrock Station Wetland Complex
8. The Coorong and Lakes Alexandrina and Albert
While there are 16 Ramsar listed sites in the Murray–Darling Basin, the remaining eight are
not likely to be affected by the SDL Adjustment Mechanism. This is because they are located
outside the affected water planning units, are located in disconnected river systems, or are
upstream of any proposed action.
Attachment B – Analysis of impacts on Ramsar wetlands
47
Question 2: Considering the proposed action at its broadest scope, is there potential
for impacts on Ramsar wetlands?
SDL adjustment projects may change the timing, duration and frequency of surface water
flows. This change is usually beneficial, and is the primary way in which equivalent
environmental outcomes can be achieved with less water.
This has the potential to impact both positively and negatively on the ecological character of
Ramsar wetlands by changing their hydrological regime.
Question 3: Are any impacts of the proposed action on Ramsar wetlands likely to be
significant?
SDL supply measure projects will either enhance or are not likely to have a significant impact
on the hydrological regime and therefore the ecological character of Ramsar wetlands. This
conclusion is based on Authority’s modelling of SFIs located at each wetland or nearby
Ramsar wetlands. The modelling included all SDL supply measure projects which was
compared against the Basin Plan benchmark scenario, to check that any change (adverse,
beneficial or neutral) was within the limits of change.
.

Attachment C– Modelling metric
48
Table 3 Limits of Acceptable Change (ECD) and Site-Specific Flow Indicators (Basin Plan) Requirements
Ramsar wetland in southern basin
Limits of Acceptable Change for Hydrology (ECDs)
Indicator sites most closely representing Ramsar wetlands (Basin Plan)
Overbank SFIs (Basin Plan)
Barmah Forest Minimum of 10,400 ML/day (Murray River at Yarrawonga) no less than 7 years in any 10 year period, with a mean duration no less than 100 days; and a maximum interval of 4 years between the flow threshold. Minimum of 16,000 ML/day (Murray River at Yarrawonga) no less than 7 years in any 10 year period, with a mean duration no less than 90 days; and a maximum interval of 4 years between the flow threshold. Minimum of 35,000 ML/day (Murray River at Yarrawonga) no less than 10 years in any 20 year period, with a mean duration no less than 60 days; and a maximum interval of 10 years between the flow threshold. Minimum of 60,000 ML/day (Murray River at Yarrawonga) no less than 12 years in any 50 year period, with a mean duration no less than 21 days; and a maximum interval of 12 years between the flow threshold.
Barmah–Millewa Forest
12,500 ML/day for 70 days 16,000 ML/day for 98 days 25,000 ML/day for 42 days 35,000 ML/day for 30 days 50,000 ML/day for 21 days 60,000 ML/day for 14 days 15,000 ML/day for 150 days
NSW Central Murray State Forests
Number of events in any 10 year period (based on average recurrence intervals) for the specified flow events, not to be less than the following: Millewa Forest Group (Murray River flow downstream of Yarrawonga); • 12,500 ML/day for 70 days – 5 events • 16,000 ML/day for 98 days – 3 events Koondrook-Perricoota Forest Group (Murray River flow at Torrumbarry Weir); • 16,000 ML/ day for 90 days – 3 events Werai Forest Group (Edward River flow at Deniliquin); • 5,000 ML/day for 60 days – 4 events In any 20 year period the interval between the following flow events to be no more than: • 13 years for the Millewa Forest Group (Murray River downstream of Yarrawonga) – 25,000 ML/day for 60 days; • 12 years for the Koondrook-Perricoota Forest Group (Murray River downstream of Torrumbarry) – 30,000 ML/day for 60 days; and • 15 years for the Werai Forest Group (Edwards River downstream of Deniliquin) – 18,000 ML/day for 30 days.
Barmah–Millewa Forest
12,500 ML/d 70 days 16,000 ML/day for 98 days
Gunbower–Koondrook–Perricoota
16,000 ML/day for 90 days 30,000 ML/day for 60 days
Gunbower Forest No less than four events in any 10 year period of 13,700 ML/day for three months (Murray River at Torrumbarry); and a maximum interval of three years between the stated flow event. No less than five events in any 20 year period of 30,000 ML/day for two months (Murray River at Torrumbarry) and a maximum
Gunbower–Koondrook–Perricoota
20,000 ML/day for 60 days 40,000 ML/day for 60 days
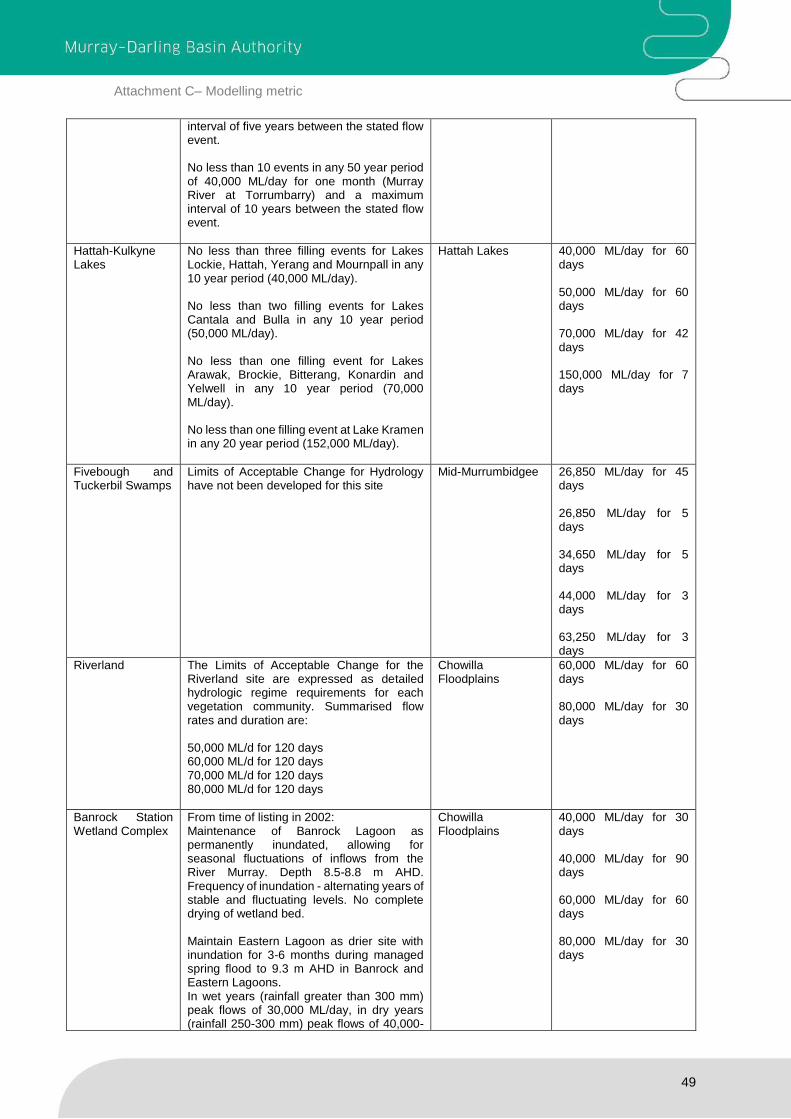
Attachment C– Modelling metric
49
interval of five years between the stated flow event. No less than 10 events in any 50 year period of 40,000 ML/day for one month (Murray River at Torrumbarry) and a maximum interval of 10 years between the stated flow event.
Hattah-Kulkyne Lakes
No less than three filling events for Lakes Lockie, Hattah, Yerang and Mournpall in any 10 year period (40,000 ML/day). No less than two filling events for Lakes Cantala and Bulla in any 10 year period (50,000 ML/day). No less than one filling event for Lakes Arawak, Brockie, Bitterang, Konardin and Yelwell in any 10 year period (70,000 ML/day). No less than one filling event at Lake Kramen in any 20 year period (152,000 ML/day).
Hattah Lakes 40,000 ML/day for 60 days 50,000 ML/day for 60 days 70,000 ML/day for 42 days 150,000 ML/day for 7 days
Fivebough and Tuckerbil Swamps
Limits of Acceptable Change for Hydrology have not been developed for this site
Mid-Murrumbidgee 26,850 ML/day for 45 days 26,850 ML/day for 5 days 34,650 ML/day for 5 days 44,000 ML/day for 3 days 63,250 ML/day for 3 days
Riverland The Limits of Acceptable Change for the Riverland site are expressed as detailed hydrologic regime requirements for each vegetation community. Summarised flow rates and duration are: 50,000 ML/d for 120 days 60,000 ML/d for 120 days 70,000 ML/d for 120 days 80,000 ML/d for 120 days
Chowilla Floodplains
60,000 ML/day for 60 days 80,000 ML/day for 30 days
Banrock Station Wetland Complex
From time of listing in 2002: Maintenance of Banrock Lagoon as permanently inundated, allowing for seasonal fluctuations of inflows from the River Murray. Depth 8.5-8.8 m AHD. Frequency of inundation - alternating years of stable and fluctuating levels. No complete drying of wetland bed. Maintain Eastern Lagoon as drier site with inundation for 3-6 months during managed spring flood to 9.3 m AHD in Banrock and Eastern Lagoons. In wet years (rainfall greater than 300 mm) peak flows of 30,000 ML/day, in dry years (rainfall 250-300 mm) peak flows of 40,000-
Chowilla Floodplains
40,000 ML/day for 30 days 40,000 ML/day for 90 days 60,000 ML/day for 60 days 80,000 ML/day for 30 days
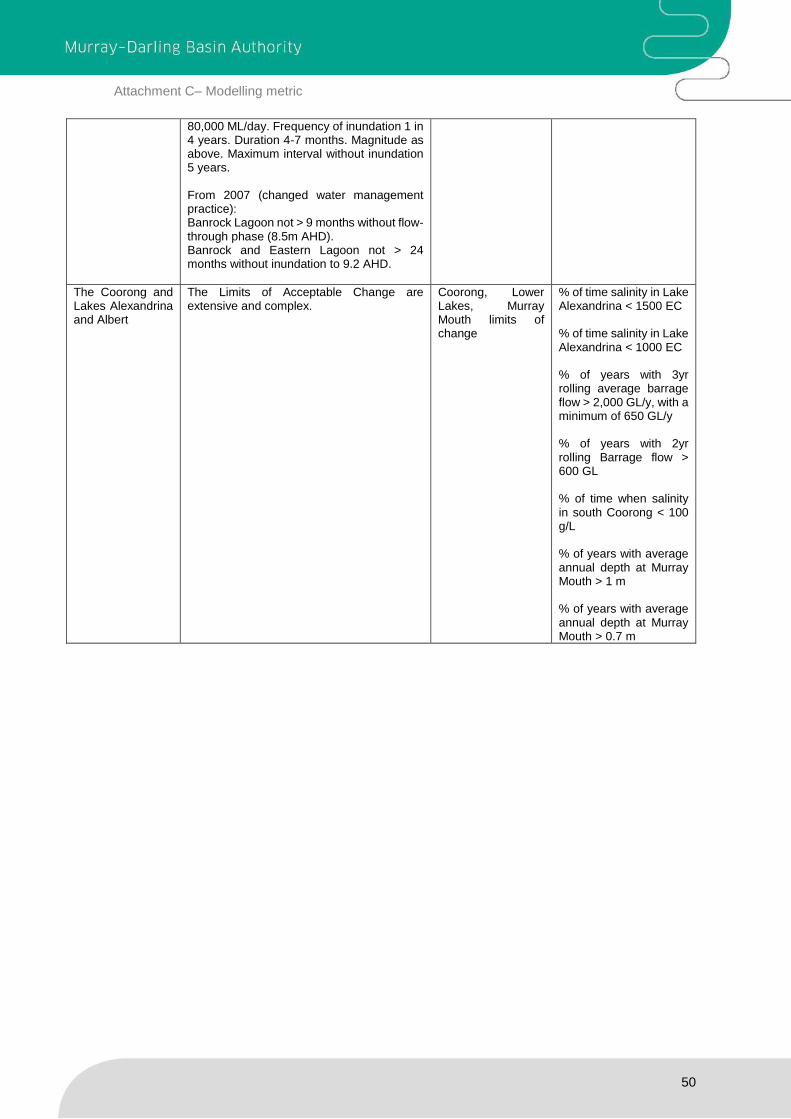
Attachment C– Modelling metric
50
80,000 ML/day. Frequency of inundation 1 in 4 years. Duration 4-7 months. Magnitude as above. Maximum interval without inundation 5 years. From 2007 (changed water management practice): Banrock Lagoon not > 9 months without flow-through phase (8.5m AHD). Banrock and Eastern Lagoon not > 24 months without inundation to 9.2 AHD.
The Coorong and Lakes Alexandrina and Albert
The Limits of Acceptable Change are extensive and complex.
Coorong, Lower Lakes, Murray Mouth limits of change
% of time salinity in Lake Alexandrina < 1500 EC % of time salinity in Lake Alexandrina < 1000 EC % of years with 3yr rolling average barrage flow > 2,000 GL/y, with a minimum of 650 GL/y % of years with 2yr rolling Barrage flow > 600 GL % of time when salinity in south Coorong < 100 g/L % of years with average annual depth at Murray Mouth > 1 m % of years with average annual depth at Murray Mouth > 0.7 m

Attachment C– Modelling metric
51
Attachment C – Modelling metrics
The modelling undertaken to inform the Basin Plan, and the determination of the SDL uses historic climate records over the 114-year period from 1 July 1895 to 30 June 2009. This period includes times of drought and very high flow, therefore representing a broad range of climatic conditions that have occurred across the Basin, and providing a good basis for testing the robustness of the proposed SDLs and possible environmental outcomes.
Four key modelling scenarios were used in this analysis. Each model run is outlined below:
Ecological Assessment Scores
The following section presents the Ecological Assessment Scores for the modelled scenarios.
Table 1 presents the overall reach score.
Table 4. Reach wise ecological score
Assessment Reach Without
Development Baseline Benchmark SDL 605
Upper-Murray – Barmah-Millewa Forest 6935 4003 5100 5017
Upper-central Murray – Gunbower-Koondrook-Perricoota
7030 3405 5567 6376
Mid-Murray – Hattah Lakes 5577 2738 3387 3955
Lower-Murray - Chowilla 6080 2791 3970 4271
Edward Wakool 6292 3224 4169 4120
Lower Darling 4271 2637 2791 2805
Mid- Murrumbidgee 6360 4163 4646 4495
Lower Murrumbidgee 7524 5094 6502 6331
Lower Goulburn Floodplain 8641 6814 8219 8038
Southern basin region score 6523 3874 4928 5045
Without development
•The without development scenario is a near-natural condition model run. It is based on the baseline scenario, giving the best available estimate of what flows would have been like with no human use or management of flows.
Baseline
•The baseline scenario represents a starting point against which the effect of implementing the Basin Plan can be assessed. This scenario is the best available estimate of water resource use in the Basin as at June 2009, and reflects the water policy framework and operating rules that were in place at that time.
Benchmark
•The benchmark scenario represents a fully implemented Basin Plan. This is recovery of 2750GL of water for the environment, but retains the water policy framework and operating rules as set in 2009. The Benchmark is the point of comparison for the SDL Adjustment Mechanism.
SDL 605
•The SDL 605 scenario represents a SDL supply contribution of 605 GL, with all of the proposed supply measures fully implemented in the model. It continues to apply the water policy frameworks and operating rules as set in 2009, unless these are specifically altered by a supply proposal.

Attachment C – Modelling metric
52
Table 5. Ecological element, ecological class scores and overall reach score for each reach
Class Ecological Element
Without development Baseline Benchmark SDL 605
Upp
er
Mu
rray –
Ba
rma
h-M
illew
a F
ore
st
EE score
EC score
Reach Score
EE score
EC score
Reach Score
EE score
EC score
Reach Score
EE score
EC score
Reach Score
Bir
d
Waterbirds – health 6685
5301
6935
2463
1657
4003
4456
3485
5100
4017
3232
5017
Bitterns, crakes and rails 5439 781 2868 2719
Colonial-nesting waterbirds 4395 1623 3140 2930
Waterbirds – breeding 4684 1763 3474 3263
Ve
ge
tati
on
River Red Gum forests 7806
7442
4304
4271
5371
4986
5254
5073
River Red Gum woodlands 7858 4859 4534 4671
Blackbox forests and woodlands
7873 4531 4335 4822
Shrublands na na na na
Tall grasslands, sedge and rushlands
6408 3543 4426 4625
Benthic herblands 7263 4120 6263 5991
Fis
h Short-lived fish 8097
8063 6048
6081 6961
6831 6834
6745 Long-lived fish 8030 6114 6701 6655
Class Ecological Element
Without development Baseline Benchmark SDL 605
Mid
-up
pe
r M
urr
ay –
Gu
nbo
wer-
Ko
on
dro
ok
Pe
rric
oo
ta
EE score
EC score
Reach Score
EE score
EC score
Reach Score
EE score
EC score
Reach Score
EE score
EC score
Reach Score
Bir
d
Waterbirds – health 7198
5009
7030
2183
1161
3405
4637
3161
5567
5981
3752
6376
Bitterns, crakes and rails 4706 417 2947 3247
Colonial-nesting waterbirds 3816 754 2351 2172
Waterbirds – breeding 4316 1289 2711 3610
Ve
ge
tati
on
River Red Gum forests 8177
7911
3809
3555
6568
6396
7783
7590
River Red Gum woodlands 8111 3528 6422 7984
Blackbox forests and woodlands
8503 3381 7263 8073
Shrublands na na na na
Tall grasslands, sedge and rushlands
6853 3502 5332 6520
Benthic herblands na na na na
Fis
h Short-lived fish 8197
8170 5532
5498 7233
7142 7958
7785 Long-lived fish 8143 5464 7051 7613

Attachment C – Modelling metric
53
Class Ecological Element
Without development Baseline Benchmark SDL 605
Mid
Mu
rray –
Hatt
ah
Lakes
EE score
EC score
Reach Score
EE score
EC score
Reach Score
EE score
EC score
Reach Score
EE score
EC score
Reach Score
Bir
d
Waterbirds – health 4267
3913
5577
1073
1217
2738
1797
1853
3387
2318
2349
3955
Bitterns, crakes and rails na na na na
Colonial-nesting waterbirds 3342 1053 1500 1747
Waterbirds – breeding 4132 1526 2263 2981
Ve
ge
tati
on
River Red Gum forests 6434
5876
2095
2313
3500
3186
3435
3895
River Red Gum woodlands 6588 2026 3333 3666
Blackbox forests and woodlands
6547 1752 2733 3218
Shrublands 6274 3262 3671 3956
Tall grasslands, sedge and rushlands
4548 2321 2850 3234
Benthic herblands 4865 2423 3029 5858
Fis
h Short-lived fish 7027
6942 4742
4683 5250
5122 5833
5622 Long-lived fish 6858 4623 4995 5410
Class Ecological Element
Without development Baseline Benchmark SDL 605
Lo
wer
Mu
rray -
Cho
will
a
EE score
EC score
Reach Score
EE score
EC score
Reach Score
EE score
EC score
Reach Score
EE score
EC score
Reach Score
Bir
d
Waterbirds – health 4491
4856
6080
1031
1281
2791
2183
2611
3970
2398
2792
4271
Bitterns, crakes and rails 5794 794 2399 2666
Colonial-nesting waterbirds 4219 1456 2570 2608
Waterbirds – breeding 4921 1842 3289 3495
Ve
ge
tati
on
River Red Gum forests 6244
6256
1628
2324
3456
3725
4042
4118
River Red Gum woodlands 6682 1574 3881 4170
Blackbox forests and woodlands
6483 1613 2704 3308
Shrublands 6340 3161 4115 4529
Tall grasslands, sedge and rushlands
5332 2686 3705 3898
Benthic herblands 6454 3284 4488 4759
Fis
h Short-lived fish 7363
7128 4987
4767 5916
5575 6356
5902 Long-lived fish 6894 4547 5234 5449

Attachment C – Modelling metric
54
Class Ecological Element
Without development Baseline Benchmark SDL 605
Ed
ward
Wako
ol
EE score
EC score
Reach Score
EE score
EC score
Reach Score
EE score
EC score
Reach Score
EE score
EC score
Reach Score
Bir
d
Waterbirds – health 4719
5447
6292
1874
1690
3224
2306
3401
4169
2039
3255
4120
Bitterns, crakes and rails 7886 1044 5746 5219
Colonial-nesting waterbirds 3921 1553 2026 2158
Waterbirds – breeding 5263 2289 3526 3605
Ve
ge
tati
on
River Red Gum forests 6173
6078
2081
2773
3248
3495
3154
3389
River Red Gum woodlands 6333 2029 3099 3016
Blackbox forests and woodlands
6917 3026 3155 2718
Shrublands 6505 3737 3897 4091
Tall grasslands, sedge and rushlands
5213 2966 3635 3523
Benthic herblands 5327 2799 3936 3833
Fis
h Short-lived fish 7574
7351 5410
5209 5973
5611 6075
5717 Long-lived fish 7129 5008 5248 5359
Class Ecological Element
Without development Baseline Benchmark SDL 605
Lo
wer
Darlin
g
EE score
EC score
Reach Score
EE score
EC score
Reach Score
EE score
EC score
Reach Score
EE score
EC score
Reach Score
Bir
d
Waterbirds – health 2361
3312
4271
961
1309
2637
1040
1467
2791
1095
1416
2805
Bitterns, crakes and rails na na na na
Colonial-nesting waterbirds na na na na
Waterbirds – breeding 4263 1658 1895 1737
Ve
ge
tati
on
River Red Gum forests 3829
3696
1729
2009
2028
2188
2010
2255
River Red Gum woodlands na na na na
Blackbox forests and woodlands
2958 1569 1788 1793
Shrublands 4520 3110 3176 3333
Tall grasslands, sedge and rushlands
4314 1993 2185 2314
Benthic herblands 2861 1642 1764 1827
Fis
h Short-lived fish 6079
5804 4668
4593 4820
4716 4812
4744 Long-lived fish 5529 4517 4613 4677

Attachment C – Modelling metric
55
Class Ecological Element
Without development Baseline Benchmark SDL 605
Mid
-Mu
rrum
bid
gee
EE score
EC score
Reach Score
EE score
EC score
Reach Score
EE score
EC score
Reach Score
EE score
EC score
Reach Score
Bir
d
Waterbirds – health 4285
4361
6360
1744
1809
4163
1690
2723
4646
1812
2407
4495
Bitterns, crakes and rails 5632 1780 4861 3658
Colonial-nesting waterbirds 3526 1684 2000 1895
Waterbirds – breeding 4000 2026 2342 2263
Ve
ge
tati
on
River Red Gum forests 7182
7307
4214
4747
4603
5008
4665
4993
River Red Gum woodlands 7878 4765 5122 5485
Blackbox forests and woodlands
8067 5991 5881 5672
Shrublands na na na na
Tall grasslands, sedge and rushlands
6101 4017 4427 4149
Benthic herblands na na na na
Fis
h Short-lived fish 7701
7411 6152
5934 6596
6207 6440
6086 Long-lived fish 7122 5717 5819 5733
Class Ecological Element
Without development Baseline Benchmark SDL 6050
Lo
wer
Mu
rrum
bid
ge
e
EE score
EC score
Reach Score
EE score
EC score
Reach Score
EE score
EC score
Reach Score
EE score
EC score
Reach Score
Bir
d
Waterbirds – health 7807
7034
7524
4319
3311
5094
6117
5340
6502
5980
4940
6331
Bitterns, crakes and rails 6807 1420 3890 3309
Colonial-nesting waterbirds 6367 3130 4811 4493
Waterbirds – breeding 7153 4376 6541 5976
Ve
ge
tati
on
River Red Gum forests 8256
7529
6161
5363
7462
6772
7336
6614
River Red Gum woodlands 8107 5454 7210 6843
Blackbox forests and woodlands
8407 5836 7515 7235
Shrublands 7277 5297 6369 6279
Tall grasslands, sedge and rushlands
7678 5487 6929 6927
Benthic herblands 5451 3940 5146 5066
Fis
h Short-lived fish 7887
8009 6799
6608 7505
7394 7563
7438 Long-lived fish 8131 6417 7284 7314

Attachment C – Modelling metric
56
Class Ecological Element
Without development Baseline Benchmark SDL 605
Lo
wer
Go
ulb
urn
Flo
od
pla
in
EE score
EC score
Reach Score
EE score
EC score
Reach Score
EE score
EC score
Reach Score
EE score
EC score
Reach Score
Bir
d
Waterbirds – health 8898
8238
8641
6946
5749
6814
8419
7604
8219
8297
7267
8038
Bitterns, crakes and rails na na na na
Colonial-nesting waterbirds na na na na
Waterbirds – breeding 7579 4553 6789 6237
Ve
ge
tati
on
River Red Gum forests 8989
8781
7657
6981
8765
8413
8728
8301
River Red Gum woodlands 9000 8014 8816 8928
Blackbox forests and woodlands
9000 7852 8914 8896
Shrublands na na na na
Tall grasslands, sedge and rushlands
8404 5812 7875 7666
Benthic herblands 8512 5572 7697 7285
Fis
h Short-lived fish 8907
8903 7696
7711 8651
8639 8545
8546 Long-lived fish 8898 7727 8627 8547

Attachment C – Modelling metric
57
Overbank flow requirement
The following section presents the modelled output for the Site-Specific Flow Indicators (SFI)
for each reach. These flows are all overbank flows that engage different levels of the
floodplain. The SFIs were determined to reflect key ecological processes (Overton et al.
2014). The statistics show the percentage of years that the SFI’s are met.
Table 6. Percentage of years with a successful event for overbank flow indicators in the southern connected Basin.
Overbank flow indicators – Upper Murray Barmah-Millewa Forest
Without Development
Baseline Benchmark Limit of Change
SDL 605
12,500 ML/d for a total duration of 70 days (with min duration of 7 consecutive days) between Jun & Nov
87% 50% 76% 70% 71%
16,000 ML/d for a total duration of 98 days (with min duration of 7 consecutive days) between Jun & Nov
66% 30% 53% 48% 49%
25,000 ML/d for a total duration of 42 days (with min duration of 7 consecutive days) between Jun & Nov
66% 30% 50% 45% 49%
35,000 ML/d for a total duration of 30 days (with min duration of 7 consecutive days) between Jun & May
53% 24% 36% 33% 35%
50,000 ML/d for a total duration of 21 days (with min duration of 7 consecutive days) between Jun & May
39% 18% 17% 17% 18%
60,000 ML/d for a total duration of 14 days (with min duration of 7 consecutive days) between Jun & May
33% 14% 14% 14% 14%
15,000 ML/d for a total duration of 150 days (with min duration of 7 consecutive days) between Jun & Dec
44% 11% 35% 32% 32%
Overbank flow indicators – Mid-Upper Murray Gunbower-Koondrook-Perricoota
Without Development
Baseline Benchmark Limit of Change
SDL 605
16,000 ML/d for a total duration of 90 days (with min duration of 7 consecutive days) between Jun & Nov
86% 31% 68% 61% 61%
20,000 ML/d for a total duration of 60 days (with min duration of 7 consecutive days) between Jun & Nov
87% 34% 64% 60% 61%
30,000 ML/d for a total duration of 60 days (with min duration of 7 consecutive days) between Jun & May
60% 25% 40% 36% 38%
40,000 ML/d for a total duration of 60 days (with min duration of 7 consecutive days) between Jun & May
39% 11% 24% 22% 23%
20,000 ML/d for a total duration of 150 days (with min duration of 7 consecutive days) between Jun & Dec
43% 7% 26% 23% 23%

Attachment C – Modelling metric
58
Overbank flow indicators – Mid Murray Hattah Lakes
Without Development
Baseline Benchmark Limit of Change
SDL 605
40,000 ML/d for a total duration of 60 days (with min duration of 7 consecutive days) between Jun & Dec
67% 30% 46% 41% 41%
50,000 ML/d for a total duration of 60 days (with min duration of 7 consecutive days) between Jun & Dec
47% 19% 30% 30% 32%
70,000 ML/d for a total duration of 42 days (with min duration of 7 consecutive days) between Jun & Dec
38% 11% 18% 16% 16%
85,000 ML/d for a total duration of 30 days (with min duration of 7 consecutive days) between Jun & May
33% 10% 11% 10% 11%
120,000 ML/d for a total duration of 14 days (with min duration of 7 consecutive days) between Jun & May
23% 8% 8% 8% 8%
150,000 ML/d for a total duration of 7 days (with min duration of 7 consecutive days) between Jun & May
17% 5% 6% 5% 6%
Overbank flow indicators – Lower Murray Chowilla
Without Development
Baseline Benchmark Limit of Change SDL 605
40,000 ML/d for a total duration of 30 days (with min duration of 7 consecutive days) between Jun & Dec
80% 37% 55% 50% 51%
40,000 ML/d for a total duration of 90 days (with min duration of 7 consecutive days) between Jun & Dec
58% 22% 38% 34% 34%
60,000 ML/d for a total duration of 60 days (with min duration of 7 consecutive days) between Jun & Dec
41% 12% 27% 25% 26%
80,000 ML/d for a total duration of 30 days (with min duration of 7 consecutive days) between Jun & May
34% 10% 15% 14% 14%
100,000 ML/d for a total duration of 21 days (with min duration of 1 day) between Jun & May
19% 6% 7% 6% 6%
125,000 ML/d for a total duration of 7 days (with min duration of 1 day) between Jun & May
17% 4% 5% 4% 5%

Attachment C – Modelling metric
59
Overbank flow indicators – Edward-Wakool Without
Development Baseline Benchmark Limit of Change SDL 605
5,000 ML/d for a total duration of 60 days (with min duration of 7 consecutive days) between Jun & Dec
82% 39% 66% 60% 65%
5,000 ML/d for a total duration of 120 days (with min duration of 7 consecutive days) between Jun & Dec
52% 22% 36% 35% 35%
18,000 ML/d for a total duration of 28 days (with min duration of 5 consecutive days) between Jun & Dec
39% 15% 16% 15% 18%
30,000 ML/d for a total duration of 21 days (with min duration of 6 consecutive days) between Jun & Dec
28% 12% 13% 12% 12%
Overbank flow indicators – Lower Darling* Without
Development Baseline Benchmark
Limit of Change
SDL 605
17,000 ML/d for 18 consecutive days between Jun & May
47% 18% 21% 20% 19%
20,000 ML/d for 30 consecutive days between Jun & May
27% 10% 11% 10% 15%
25,000 ML/d for 45 consecutive days between Jun & May
14% 8% 8% 8% 9%
45,000 ML/d for 2 consecutive days between Jun & May
10% 7% 7% 7% 8%
Overbank flow indicators – Mid-Murrumbidgee Without
Development Baseline Benchmark Limit of Change SDL 605
26,850 ML/d for a total duration of 45 days (with min duration of 1 day) between Jul & Nov
28% 11% 11% 11% 11%
26,850 ML/d for 5 consecutive days between Jun & Nov 67% 46% 60% 54% 54%
34,650 ML/d for 5 consecutive days between Jun & Nov 57% 29% 41% 37% 38%
44,000 ML/d for 3 consecutive days between Jun & Nov 44% 22% 23% 22% 23%
63,250 ML/d for 3 consecutive days between Jun & Nov 21% 11% 10% 10% 10%
Overbank flow indicators – Lower Murrumbidgee Without
Development Baseline Benchmark
Limit of Change
SDL 605
Total volume of 175 GL (flow > 5,000 ML/d) between Jul & Sep
94% 68% 94% 85% 86%
Total volume of 270 GL (flow > 5,000 ML/d) between Jul & Sep
92% 57% 86% 77% 78%
Total volume of 400 GL (flow > 5,000 ML/d) between Jul & Oct
92% 52% 83% 75% 77%
Total volume of 800 GL (flow > 5,000 ML/d) between Jul & Oct
78% 39% 60% 54% 56%
Total volume of 1,700 GL (flow > 5,000 ML/d) between Jul & Nov
56% 18% 30% 27% 27%
Total volume of 2,700 GL (flow > 5,000 ML/d) between May & Feb
44% 9% 18% 16% 16%

Attachment C – Modelling metric
60
Overbank flow indicators – Lower Goulburn floodplain
Without Development
Baseline Benchmark Limit of Change
SDL 605
25,000 ML/d for a median duration of 5 days between Jun & Nov
90% 57% 82% 74% 75%
40,000 ML/d for a median duration of 4 days between Jun & Nov
72% 38% 61% 55% 57%
*Site-specific flow indicators at this location were assessed by the Independent Expert
Panel, see Section 4.
Fresh Requirement
The following section presents the modelled output for the fresh indicators. These are flows
that are above normal regulated flow, but do not result in flow onto the floodplain. As with
SFIs, these are presented as the percentage of years that the fresh is achieved.
Table 7. Percentage of years with a successful event for fresh flow indicators in the southern connected Basin
Fresh flow indicator – Riverland Chowilla floodplain Without
Development Baseline Benchmark
Limit of Change
SDL 605
20,000 ML/d for 60 consecutive days between Aug & Dec 89% 43% 69% 69% 77%
Fresh flow indicator – Edward-Wakool Without
Development Baseline Benchmark
Limit of Change
SDL 605
1,500 ML/d for a total duration of 180 days (with min duration of 1 day) between Jun & Mar
75% 96% 94% 94% 96%
Fresh flow indicator – Lower Darling Without
Development Baseline Benchmark
Limit of Change
SDL 605
7,000 ML/d for 10 consecutive days between Jun & May 95% 57% 54% 54% 61%
Fresh flow indicator – Lower Murrumbidgee Without
Development Baseline Benchmark
Limit of Change
SDL 605
1,100 ML/d for 25 consecutive days between Dec & May 96% 32% 47% 47% 54%
4,500 ML/d for 20 consecutive days between Oct & Dec 90% 35% 53% 53% 57%
3,100 ML/d for 30 consecutive days between Oct & Mar 91% 29% 42% 42% 52%
Fresh flow indicator – Lower Goulburn floodplain Without
Development Baseline Benchmark
Limit of Change
SDL 605
Two events annually of 2,500 ML/d for 4 consecutive days (with min duration of 30 days between events) between Dec & Apr
60% 10% 56% 56% 56%

Attachment C – Modelling metric
61
5,000 ML/d for 14 consecutive days between Oct & Nov 82% 28% 59% 59% 59%
Coorong, Lower Lakes and Murray Mouth Indicators
The following section presents the modelled output for the Coorong, Lower Lakes and
Murray Mouth (CLLMM). These limits of change are specified in the Basin Plan as Target
frequencies that must be maintained or improved.
Table 8. Flow and Salinity limits of change indicator achievement for the Coorong, Lower Lakes and Murray Mouth
Coorong, Lower Lakes and Murray Mouth – Limits of Change indicators
Target Without
development Baseline Benchmark SDL 605
% of time salinity in Lake Alexandrina < 1500 EC 100% 87% 96% 100% 100%
% of time salinity in Lake Alexandrina < 1000 EC 95% 85% 89% 99% 96%
% of years with 3yr rolling average barrage flow > 2,000 GL/y, with a minimum of 650 GL/y
95% 97% 77% 97% 96%
% of years with 2yr rolling Barrage flow > 600 GL 100% 100% 97% 100% 100%
% of time when salinity in south Coorong < 100 g/L 96% 100% 93% 100% 100%
% of years with average annual depth at Murray Mouth > 1 m
90% 100% 76% 93% 92%
% of years with average annual depth at Murray Mouth > 0.7 m
95% 100% 84% 96% 96%

Attachment C – Modelling metric
62
Baseflow requirement
This section presents the modelled output for the baseflow metric. Baseflows are important
for maintaining connectivity, refugia and water quality in the river channel. The baseflows are
presented as a volumetric difference between the target volume (GL per year) and that
achieved under the modelled scenario.
The Independent Expert Panel looked at the baseflow metrics and results (see section 4).
Table 9. Annual average baseflow requirement and baseflow shortfalls
Site description Baseflow
requirement (GL/yr)
Benchmark SDL 605
Murrumbidgee @ Darlington Point 645 1 1
Murrumbidgee @ Balranald 597 21 23
Goulburn @ U/S Goulburn Weir 757 0 1
Goulburn @ McCoys Bridge 746 0 5
Campaspe @ U/S Campaspe Weir 19 0 0
Campaspe @ Rochester 36 0 0
Loddon @ U/S Serpentine Weir 12 0 0
Loddon @ Appin South 12 0 0
Murray @ D/S Yarrawonga Weir 1469 2 5
Murray River @ D/S Torrumbarry 2002 4 27
Murray River @ D/S Euston 2999 9 12
Flow to SA 3220 9 3
Darling @ Burtundy 151 1 1

Attachment C – Modelling metric
63
Reliability of water supply
The following section presents the modelled outputs of metrics that were developed by each
State, to assess the reliability of supply for users of each river valley. The state governments
used these as part of their assessment of reliability for their entitlement holders.
Table 10.Reliability of water supply in the southern connected Basin
Goulburn reliability Baseline Benchmark SDL 605
Percentage of years with full HRWS allocation in February 95% 97% 97%
Percentage of years with full LRWS allocation in February 43% 68% 60%
Percentage of years with LRWS allocation in February > 0 75% 91% 87%
Minimum February allocation 28% 39% 37%
Long term average HRWS allocation in February 98% 99% 99%
Long term average LRWS allocation in February 59% 81% 75%
1999-2009 average HRWS allocation in February 81% 88% 86%
1999-2009 average LRWS allocation in February 0% 7% 5%
Campaspe reliability Baseline Benchmark SDL 605
Percentage of years with full HRWS allocation in February 95% 97% 97%
Percentage of years with full LRWS allocation in February 76% 86% 83%
Percentage of years with LRWS allocation in February > 0 89% 95% 95%
Minimum February allocation 42% 6% 3%
Long term average HRWS allocation in February 98% 98% 98%
Long term average LRWS allocation in February 81% 92% 90%
1999-2009 average HRWS allocation in February 84% 80% 78%
1999-2009 average LRWS allocation in February 19% 37% 35%
Loddon reliability Baseline Benchmark SDL 605
Percentage of years with full HRWS allocation in February 92% 97% 94%
Percentage of years with full LRWS allocation in February 43% 68% 60%
Percentage of years with LRWS allocation in February > 0 75% 91% 86%
Minimum February allocation 0% 0% 0%
Long term average HRWS allocation in February 96% 97% 96%
Long term average LRWS allocation in February 59% 81% 75%
1999-2009 average HRWS allocation in February 66% 73% 67%
1999-2009 average LRWS allocation in February 0% 7% 5%

Attachment C – Modelling metric
64
Murrumbidgee reliability Baseline Benchmark SDL 605
Long term average of %-age allocation at the start of year (GS)
33% 37% 38%
Long term average of %-age allocation in September (GS) 45% 48% 50%
Long term average of %-age allocation at the end of year (GS)
73% 77% 79%
Minimum %-age allocation at the end of year (GS) 2% 2% 8%
1999-2009 average of %-age allocation at the end of year (GS)
39% 45% 43%
NSW Murray reliability Baseline Benchmark SDL 605
Long term average of %-age allocation at the start of year (HS)
97% 94% 97%
Long term average of %-age allocation in February (HS) 99% 99% 99%
Long term average of %-age allocation at the end of year (HS)
99% 99% 99%
Minimum %-age allocation at the end of year (HS) 97% 97% 97%
1999-2009 average of %-age allocation at the end of year (HS)
98% 98% 98%
Long term average of %-age allocation at the start of year (GS)
45% 52% 51%
Long term average of %-age allocation in September (GS) 63% 68% 66%
Long term average of %-age allocation at the end of year (GS)
86% 89% 89%
Minimum %-age allocation at the end of year (GS) 2% 5% 7%
1999-2009 average of %-age allocation at the end of year (GS)
60% 58% 59%
VIC Murray reliability Baseline Benchmark SDL 605
Percentage of years with full HRWS allocation in February 97% 98% 99%
Percentage of years with full LRWS allocation in February 79% 94% 94%
Percentage of years with LRWS allocation in February > 0 86% 98% 98%
Minimum February allocation 23% 47% 73%
Long term average HRWS February allocation 99% 99% 100%
Long term average LRWS February allocation 83% 96% 97%
1999-2009 average HRWS February allocation 85% 94% 98%
1999-2009 average LRWS February allocation 42% 74% 80%

Attachment C – Modelling metric
65
SA Murray reliability Baseline Benchmark SDL 605
Percentage years with full entitlement in June 69% 86% 82%
Percentage years with full entitlement in May 76% 92% 86%
Long term average % entitlement in June 91% 97% 95%
Long term average % entitlement in May 98% 99% 99%
Maximum number of sequential years not at full entitlement in June
10 6 5
Maximum number of sequential years not at full entitlement in May
9 6 6
Minimum % entitlement in May 48% 52% 49%
Minimum three year rolling average of % entitlement in May
77% 67% 67%
1999-2009 average % entitlement in June 71% 79% 74%
1999-2009 average % entitlement in May 89% 91% 90%
Lower Darling reliability Baseline Benchmark SDL 605
Long term average of Lower Darling General Security EOY Allocation
94% 98% 99%
Long term average of Lower Darling LWU EOY Allocation 100% 100% 100%

GPO Box 1801, Canberra ACT 2601
1800 230 067
mdba.gov.au