Embed Size (px)
Citation preview

$67,435,000Energy Efficiency Revenue Bonds
Series 2011
Sustainable Energy Utility, Inc.
Post Pricing Commentary August 1, 2011

Table of Contents
1. Preliminary and Final Official Statement Covers
2. Preliminary and Final Pricing Wires
3. Pricing Spreads and Comparable Transactions
4. Distribution Analysis
5. Rating Reports
6. Market Commentary
7. Marketing Materials and Media
8. Working Group
9. Final Numbers
10. Closing Memo
Section

Preliminary and Final Official Statement Covers

This
Pre
limin
ary
Offi
cial
Sta
tem
ent a
nd th
e in
form
atio
n co
ntai
ned
here
in a
re s
ubje
ct to
com
plet
ion
and
amen
dmen
t. U
nder
no
circ
umst
ance
s sh
all t
his
Prel
imin
ary
Offi
cial
Sta
tem
ent c
onst
itute
an
offe
r to
sell o
r the
sol
icita
tion
of a
n of
fer t
o bu
y, no
r sha
ll the
re b
e an
y sa
le o
f the
Bon
ds in
any
juris
dict
ion
in w
hich
suc
h of
fer,
solic
itatio
n or
sal
e w
ould
be
unla
wfu
l prio
r to
regi
stra
tion
or q
ualifi
catio
n un
der t
he s
ecur
ities
law
s of
any
suc
h ju
risdi
ctio
n. T
he Is
suer
has
dee
med
this
Pre
limin
ary
Offi
cial
Sta
tem
ent fi
nal,
as o
f its
dat
e, e
xcep
t for
info
rmat
ion
perm
itted
to b
e om
itted
by
Rul
e 15
c2‑1
2 of
the
Secu
ritie
s an
d Ex
chan
ge C
omm
issi
on.
PRELIMINARY OFFICIAL STATEMENT DATED JULY 18, 2011
NEW ISSUE-BOOK-ENTRY ONLY RATINGS: See “RATINGS herein”
In the opinion of Drinker Biddle & Reath LLP, Bond Counsel, under existing law as currently enacted and construed, interest on the Bonds is excluded from gross income for federal income tax purposes and is not a specific item of tax preference for purposes of the individual and corporate federal alternative minimum tax; but, interest on the Bonds will be included in “adjusted current earnings” in computing alternative minimum taxable income with respect to certain corporations. The Bonds, and the interest payable thereon, are exempt from taxation by the State of Delaware or any political subdivision thereof. See “CERTAIN TAX MATTERS” herein.
$62,640,000*SUSTAINABLE ENERGY UTILITY, INC.
Energy Efficiency Revenue Bonds, Series 2011Dated: Date of Issuance Due: September 15, as shown on inside cover
The Sustainable Energy Utility, Inc. Energy Efficiency Revenue Bonds, Series 2011 (the “Bonds”) are being issued by Sustainable Energy Utility, Inc. (the “Issuer”), a Delaware nonprofit corporation created by and for the benefit of the State of Delaware (the “State”) pursuant to the Delaware Energy Act, 29 Del. C. §8059 (the “SEU Authorizing Act”), under a Trust Indenture dated as of August 1, 2011, between the Issuer and Citibank N.A. Agency & Trust, New York, New York (the “Trustee”). Proceeds of the Bonds will be used to fund projects (the “Projects”) consisting of the design, construction and installation of certain energy conservation measures at facilities of certain State agencies (collectively and as further described herein, the “Agencies”). Such funds will be applied to pay the costs of the Projects on behalf of the Agencies in accordance with separate Guaranteed Energy Savings Agreements between the Agencies and the energy service companies that have contracted with the Agencies to implement the Projects (the “Contractors”). See “THE PROJECTS” herein.
The Bonds will be issued as fully registered bonds in the name of Cede & Co., as registered owner and nominee of The Depository Trust Company, New York, New York (“DTC”). DTC is securities depository for the Bonds. Purchases of the Bonds will be made in book-entry form and purchasers will not receive certificates representing their interests in the Bonds purchased. Principal and redemption price if any of, and interest on, the Bonds are payable by the Trustee to DTC which in turn will remit such principal and interest payments to participants for subsequent disbursement to the beneficial owners of the Bonds. As long as Cede & Co. is the registered owner as nominee of DTC, payments on the Bonds will be made to such registered owner, and disbursal of such payments to beneficial owners will be the responsibility of DTC and its participants. See “BOOK-ENTRY ONLY SYSTEM” herein.
The Bonds will be available to purchasers in denominations of $5,000 and any integral multiple of $5,000. Interest, at the rates set forth on the inside cover hereof, is payable on March 15, 2012 and on each September 15 and March 15 thereafter. The Bonds are subject to redemption as described herein. See “THE BONDS – Redemption” herein.
The Bonds are limited obligations of the Issuer payable solely from the Trust Estate, primarily consisting of the Installment Payments (as defined herein) to be made to the Trustee (as assignee of the Issuer) by, or on behalf of, the Agencies in consideration of the Issuer issuing the Bonds and making the proceeds thereof available to pay the costs of the Projects on behalf of the Agencies. The Agencies’ obligations to make Installment Payments are subject to appropriation by the State. See “SECURITY FOR AND SOURCES OF PAYMENT OF THE BONDS.”
EXCEPT AS DESCRIBED HEREIN WITH RESPECT TO THE PAYMENT OF MONEYS WHEN, AS AND IF APPROPRIATED TO THE AGENCIES FOR SUCH PURPOSE, NEITHER THE STATE NOR ANY POLITICAL SUBDIvISION THEREOF SHALL BE OBLIGATED TO MAKE PAYMENTS ON THE BONDS. NEITHER THE FAITH AND CREDIT NOR THE TAXING POWER OF THE STATE OR OF ANY POLITICAL SUBDIvISION THEREOF IS PLEDGED TO THE PAYMENT OF THE PRINCIPAL OF OR THE INTEREST ON BONDS. THE ISSUANCE OF THE BONDS SHALL NOT DIRECTLY OR INDIRECTLY OR CONTINGENTLY OBLIGATE THE STATE OR ANY POLITICAL SUBDIvISION THEREOF TO LEvY OR TO PLEDGE ANY FORM OF TAXATION WHATEvER THEREFOR, OR TO MAKE ANY APPROPRIATION FOR THEIR PAYMENT.
The Bonds are offered when, as and if issued and accepted by the Underwriter subject to the approval of legality by Drinker Biddle & Reath LLP, Bond Counsel, and to certain other conditions. Certain legal matters will be passed upon for the Issuer by Murphy and Landon, Wilmington, Delaware, and for the State Agencies that are not institutions of higher learning by the Department of Justice, State of Delaware as counsel; for Delaware State University and Delaware Technical Community College by their respective general counsels; and for the Underwriter by Miller, Canfield, Paddock and Stone, P.L.C. The Bonds are expected to be delivered to DTC in book-entry form on or about August __, 2011.
Citi*Preliminary, subject to change.

MATURITY SCHEDULE
Due September 15
Principal Amount*
Interest Rate Yield Price
CUSIP**
2013 $1,430,000 % % 2014 1,545,000 2015 2,950,000 2016 2,900,000 2017 3,055,000 2018 1,840,000 2019 1,975,000 2020 2,080,000 2021 2,220,000 2022 2,405,000 2023 2,570,000 2024 2,745,000 2025 2,935,000 2026 3,135,000 2027 3,345,000 2028 3,565,000 2029 3,805,000 2030 4,060,000 2031 4,395,000
$9,685,000* ____% Term Bonds Due September 15, 2034, Priced @ _____% to Yield ______%
* Preliminary, subject to change.
** Copyright 2011, American Bankers Association. CUSIP data herein are provided by Standard & Poor’s CUSIP Service Bureau, a division of The McGraw-Hill Companies, Inc. The CUSIP numbers listed above are being provided solely for the convenience of bondholders and neither the Issuer nor the Agencies make any representation with respect to such number or undertakes any responsibility for their accuracy. The CUSIP numbers are subject to being changed after the issuance of the Bonds as a result of various subsequent actions including, but not limited to, a refunding in whole or in part of the Bonds.

NEW ISSUE-BOOK-ENTRY ONLY RATINGS: See “RATINGS herein”
In the opinion of Drinker Biddle & Reath LLP, Bond Counsel, under existing law as currently enacted and construed, interest on the Bonds is excluded from gross income for federal income tax purposes and is not a specific item of tax preference for purposes of the individual and corporate federal alternative minimum tax; but, interest on the Bonds will be included in “adjusted current earnings” in computing alternative minimum taxable income with respect to certain corporations. The Bonds, and the interest payable thereon, are exempt from taxation by the State of Delaware or any political subdivision thereof. See “CERTAIN TAX MATTERS” herein.
$67,435,000SUSTAINABLE ENERGY UTILITY, INc.
Energy Efficiency Revenue Bonds, Series 2011
Dated: Date of Issuance Due: September 15, as shown on inside cover
The Sustainable Energy Utility, Inc. Energy Efficiency Revenue Bonds, Series 2011 (the “Bonds”) are being issued by Sustainable Energy Utility, Inc. (the “Issuer”), a Delaware nonprofit corporation created by and for the benefit of the State of Delaware (the “State”) pursuant to the Delaware Energy Act, 29 Del. C. §8059 (the “SEU Authorizing Act”), under a Trust Indenture dated as of August 1, 2011, between the Issuer and Citibank, N.A., New York, New York (the “Trustee”). Proceeds of the Bonds will be used to fund projects (the “Projects”) consisting of the design, construction and installation of certain energy conservation measures at facilities of certain State agencies (collectively and as further described herein, the “Agencies”). Such funds will be applied to pay the costs of the Projects on behalf of the Agencies in accordance with separate Guaranteed Energy Savings Agreements between the Agencies and the energy service companies that have contracted with the Agencies to implement the Projects (the “Contractors”). See “THE PROJECTS” herein.
The Bonds will be issued as fully registered bonds in the name of Cede & Co., as registered owner and nominee of The Depository Trust Company, New York, New York (“DTC”). DTC is securities depository for the Bonds. Purchases of the Bonds will be made in book-entry form and purchasers will not receive certificates representing their interests in the Bonds purchased. Principal and redemption price if any of, and interest on, the Bonds are payable by the Trustee to DTC which in turn will remit such principal and interest payments to participants for subsequent disbursement to the beneficial owners of the Bonds. As long as Cede & Co. is the registered owner as nominee of DTC, payments on the Bonds will be made to such registered owner, and disbursal of such payments to beneficial owners will be the responsibility of DTC and its participants. See “BOOK-ENTRY ONLY SYSTEM” herein.
The Bonds will be available to purchasers in denominations of $5,000 and any integral multiple of $5,000. Interest, at the rates set forth on the inside cover hereof, is payable on March 15, 2012 and on each September 15 and March 15 thereafter. The Bonds are subject to redemption as described herein. See “THE BONDS – Redemption” herein.
The Bonds are limited obligations of the Issuer payable solely from the Trust Estate, primarily consisting of the Installment Payments (as defined herein) to be made to the Trustee (as assignee of the Issuer) by, or on behalf of, the Agencies in consideration of the Issuer issuing the Bonds and making the proceeds thereof available to pay the costs of the Projects on behalf of the Agencies. The Agencies’ obligations to make Installment Payments are subject to appropriation by the State. See “SECURITY FOR AND SOURCES OF PAYMENT OF THE BONDS.”
EXCEPT AS DESCRIBED HEREIN WITH RESPECT TO THE PAYMENT OF MONEYS WHEN, AS AND IF APPROPRIATED TO THE AGENCIES FOR SUCH PURPOSE, NEITHER THE STATE NOR ANY POLITICAL SUBDIvISION THEREOF SHALL BE OBLIGATED TO MAKE PAYMENTS ON THE BONDS. NEITHER THE FAITH AND CREDIT NOR THE TAXING POWER OF THE STATE OR OF ANY POLITICAL SUBDIvISION THEREOF IS PLEDGED TO THE PAYMENT OF THE PRINCIPAL OF OR THE INTEREST ON BONDS. THE ISSUANCE OF THE BONDS SHALL NOT DIRECTLY OR INDIRECTLY OR CONTINGENTLY OBLIGATE THE STATE OR ANY POLITICAL SUBDIvISION THEREOF TO LEvY OR TO PLEDGE ANY FORM OF TAXATION WHATEvER THEREFOR, OR TO MAKE ANY APPROPRIATION FOR THEIR PAYMENT.
The Bonds are offered when, as and if issued and accepted by the Underwriter subject to the approval of legality by Drinker Biddle & Reath LLP, Bond Counsel, and to certain other conditions. Certain legal matters will be passed upon for the Issuer by Drinker Biddle & Reath LLP; for the State Agencies that are not institutions of higher learning by the Department of Justice, State of Delaware as counsel; for Delaware State University and Delaware Technical Community College by their respective general counsels; and for the Underwriter by Miller, Canfield, Paddock and Stone, P.L.C. Becker Capital and Finance, New York, New York, and NW Financial Group, LLC, Jersey City, New Jersey, have served as financial advisors to the Issuer in connection with the issuance of the Bonds. The Bonds are expected to be delivered to DTC in book-entry form on or about August 1, 2011.
citi
Dated July 25, 2011

$67,435,000
Sustainable Energy Utility, Inc. Energy Efficiency Revenue Bonds, Series 2011
MATURITY SCHEDULE
Due September 15
Principal Amount
Interest Rate Yield Price
CUSIP**
2013 $1,775,000 2.000% 0.650% 102.840 86932UAA3 2014 1,845,000 3.000 1.000 106.132 86932UAB1 2015 3,325,000 3.000 1.280 106.884 86932UAC9 2016 400,000 3.000 1.640 106.654 86932UAD7 2016 2,840,000 5.000 1.640 116.441 86932UAW5 2017 300,000 4.000 2.040 111.224 86932UAE5 2017 3,135,000 5.000 2.040 116.952 86932UAX3 2018 2,285,000 4.000 2.460 110.002 86932UAF2 2019 2,405,000 5.000 2.790 115.959 86932UAG0 2020 570,000 3.000 3.060 99.523 86932UAH8 2020 2,000,000 5.000 3.060 115.336 86932UAZ8 2021 2,655,000 5.000 3.230 115.175 86932UAJ4 2022 2,805,000 5.000 3.440* 113.235 86932UAK1 2023 2,940,000 5.000 3.600* 111.784 86932UAL9 2024 3,080,000 3.500 3.770 97.222 86932UAM7 2025 3,175,000 5.000 3.900* 109.122 86932UAN5 2026 3,325,000 5.000 3.990* 108.339 86932UAP0 2027 700,000 4.000 4.080 99.057 86932UAQ8 2027 2,780,000 5.000 4.080* 107.562 86932UAY1 2028 3,630,000 5.000 4.170* 106.792 86932UAR6 2029 3,810,000 4.250 4.440 97.647 86932UAS4 2030 3,960,000 5.000 4.290* 105.775 86932UAT2 2031 4,215,000 5.000 4.370* 105.104 86932UAU9
$9,480,000 5.00% Term Bonds Due September 15, 2034, Priced @ 103.612 to Yield 4.550%*, CUSIP 86932UAV7
* Yield calculated to call date of September 15, 2021.
** Copyright 2011, American Bankers Association. CUSIP data herein are provided by Standard & Poor’s CUSIP Service Bureau, a
division of The McGraw-Hill Companies, Inc. The CUSIP numbers listed above are being provided solely for the convenience of bondholders and neither the Issuer nor the Agencies make any representation with respect to such number or undertakes any responsibility for their accuracy. The CUSIP numbers are subject to being changed after the issuance of the Bonds as a result of various subsequent actions including, but not limited to, a refunding in whole or in part of the Bonds.

Preliminary and Final Pricing Wires

********************************************************************************
Monday, July 25, 2011 10:48AM ========================================MSS Wire #273397 == Preliminary Pricing Wire ==MSS Master Message #3216512 ========================================TO: Citigroup Global Markets Inc (Manager)
RE: $67,670,000*SUSTAINABLE ENERGY UTILITY, INC. (Delaware)Energy Efficiency Revenue BondsSeries 2011
MOODY'S: Aa2 S&P: AA+ FITCH: NR
DATED:08/01/2011 FIRST COUPON:03/15/2012
DUE: 09/15
ADD'L TAKEDOWN
MATURITY AMOUNT* COUPON PRICE ( Pts )09/15/2013 1,825M 2.00% 0.70 1/4
(Approx. $ Price 102.733)09/15/2014 1,915M 3.00% 1.00 1/4 (Approx. $ Price 106.132)
09/15/2015 3,420M 3.00% 1.30 3/8 (Approx. $ Price 106.800)
09/15/2016 3,350M 3.00% 1.64 3/8 (Approx. $ Price 106.654)
09/15/2017 3,490M 4.00% 2.04 1/2 (Approx. $ Price 111.224)
09/15/2018 2,320M 4.00% 2.46 1/2 (Approx. $ Price 110.002)
09/15/2019 2,450M 5.00% 2.79 1/2 (Approx. $ Price 115.959)
09/15/2020 2,580M 3.00% 3.06 1/2 (Approx. $ Price 99.523)
09/15/2021 2,640M 5.00% 3.23 1/2 (Approx. $ Price 115.175)
09/15/2022 2,800M 5.00% 3.42 1/2
(Approx. $ Price PTC 09/15/2021 113.418 Approx. YTM 3.530 )09/15/2023 2,930M 5.00% 3.58 1/2 (Approx. $ Price PTC 09/15/2021 111.964 Approx. YTM 3.761 )
09/15/2024 3,065M 3.50% 3.72 1/2 (Approx. $ Price 97.729)
09/15/2025 3,170M 5.00% 3.85 1/2 (Approx. $ Price PTC 09/15/2021 109.560 Approx. YTM 4.101 )
09/15/2026 3,315M 5.00% 3.94 1/2
(Approx. $ Price PTC 09/15/2021 108.773 Approx. YTM 4.209 )09/15/2027 3,465M 4.00% 4.03 1/2 (Approx. $ Price 99.643)
09/15/2028 3,600M 5.00% 4.12 1/2 (Approx. $ Price PTC 09/15/2021 107.219 Approx. YTM 4.395 )
09/15/2029 3,765M 5.00% 4.19 1/2 (Approx. $ Price PTC 09/15/2021 106.621 Approx. YTM 4.463 )
09/15/2030 3,950M 5.00% 4.26 1/2
(Approx. $ Price PTC 09/15/2021 106.028 Approx. YTM 4.525 )09/15/2031 4,195M 5.00% 4.35 1/2 (Approx. $ Price PTC 09/15/2021 105.271 Approx. YTM 4.595 )
09/15/2034 9,425M 5.00% 4.58 1/2 (Approx. $ Price PTC 09/15/2021 103.366 Approx. YTM 4.758 )
---------------------------------------

CALL FEATURES: Optional call in 09/15/2021 @ 100.00
---------------------------------------
* - APPROXIMATE SUBJECT TO CHANGE
Order period until today 12:45 PM, Eastern, Monday, 07/25/11.Please use Electronic Order Entry to enter orders or call (212) 723-7093 .
The manager reserves the right to terminate or extend the order period prior to or laterthan the above-mentioned time and date and to confirm bonds at their discretion.
PRIORITY OF ORDERS AS FOLLOWS:1. Delaware Retail2. Member
The compliance addendum MSRB Rule G-11 will apply.
Delivery is firm for Monday, August 1, 2011.
This Issue is book entry. This issue is clearing through DTC.
Citigroup Global Markets Inc
By: Citigroup Global Markets Inc New York, NY
Monday, July 25, 2011 10:48AM
********************************************************************************

********************************************************************************
Tuesday, July 26, 2011 9:02AM ========================================MSS Wire #273436 == Final Pricing Wire ==MSS Master Message #3216882 ========================================TO: Citigroup Global Markets Inc (Manager)
RE: $67,435,000SUSTAINABLE ENERGY UTILITY, INC. (Delaware)Energy Efficiency Revenue BondsSeries 2011
WE HAVE RECEIVED THE WRITTEN AWARD.
DELIVERY IS FIRM FOR 08/01/2011.
CUSIP AND TRADE DATE WIRE WILL FOLLOW SHORTLY.
MOODY'S: Aa2 S&P: AA+ FITCH: NR
DATED:08/01/2011 FIRST COUPON:03/15/2012
DUE: 09/15
ADD'L
TAKEDOWNMATURITY AMOUNT COUPON PRICE ( Pts )09/15/2013 1,775M 2.00% 0.65 1/4 (Approx. $ Price 102.840)
09/15/2014 1,845M 3.00% 1.00 1/4 (Approx. $ Price 106.132)
09/15/2015 3,325M 3.00% 1.28 3/8 (Approx. $ Price 106.884)
09/15/2016 400M 3.00% 1.64 3/8 (Approx. $ Price 106.654)
09/15/2016 2,840M 5.00% 1.64 3/8 (Approx. $ Price 116.441)
09/15/2017 300M 4.00% 2.04 1/2 (Approx. $ Price 111.224)
09/15/2017 3,135M 5.00% 2.04 1/2 (Approx. $ Price 116.952)
09/15/2018 2,285M 4.00% 2.46 1/2 (Approx. $ Price 110.002)
09/15/2019 2,405M 5.00% 2.79 1/2 (Approx. $ Price 115.959)
09/15/2020 570M 3.00% 3.06 1/2 (Approx. $ Price 99.523)
09/15/2020 2,000M 5.00% 3.06 1/2 (Approx. $ Price 115.336)
09/15/2021 2,655M 5.00% 3.23 1/2 (Approx. $ Price 115.175)
09/15/2022 2,805M 5.00% 3.44 1/2 (Approx. $ Price PTC 09/15/2021 113.235 Approx. YTM 3.549 )
09/15/2023 2,940M 5.00% 3.60 1/2
(Approx. $ Price PTC 09/15/2021 111.784 Approx. YTM 3.779 )09/15/2024 3,080M 3.50% 3.77 1/2 (Approx. $ Price 97.222)
09/15/2025 3,175M 5.00% 3.90 1/2 (Approx. $ Price PTC 09/15/2021 109.122 Approx. YTM 4.140 )
09/15/2026 3,325M 5.00% 3.99 1/2 (Approx. $ Price PTC 09/15/2021 108.339 Approx. YTM 4.247 )
09/15/2027 700M 4.00% 4.08 1/2
(Approx. $ Price 99.057)09/15/2027 2,780M 5.00% 4.08 1/2 (Approx. $ Price PTC 09/15/2021 107.562 Approx. YTM 4.342 )

09/15/2028 3,630M 5.00% 4.17 1/2 (Approx. $ Price PTC 09/15/2021 106.792 Approx. YTM 4.429 )
09/15/2029 3,810M 4.25% 4.44 1/2 (Approx. $ Price 97.647)
09/15/2030 3,960M 5.00% 4.29 1/2
(Approx. $ Price PTC 09/15/2021 105.775 Approx. YTM 4.544 )09/15/2031 4,215M 5.00% 4.37 1/2 (Approx. $ Price PTC 09/15/2021 105.104 Approx. YTM 4.608 )
09/15/2034 9,480M 5.00% 4.55 1/2 (Approx. $ Price PTC 09/15/2021 103.612 Approx. YTM 4.741 )
---------------------------------------
CALL FEATURES: Optional call in 09/15/2021 @ 100.00
---------------------------------------
Sinking Fund Schedule
2034 Term Bond
09/15/2032 4,32509/15/2033 2,63509/15/2034 2,520
PRIORITY OF ORDERS AS FOLLOWS:1. Delaware Retail2. Member
The compliance addendum MSRB Rule G-11 will apply.
The Award is expected on Monday, July 25, 2011 at 8:24PM Eastern .
Delivery is firm for Monday, August 1, 2011.
This Issue is book entry. This issue is clearing through DTC.
Award: 07/25/2011Award Time: 8:24PM EasternDelivery: 08/01/2011 (Firm)Initial trade:Date of Execution:Time of Execution:
MATURITY CUSIP COUPON ---------- --------- ------ 09/15/2013 86932UAA3 2.000 09/15/2014 86932UAB1 3.000 09/15/2015 86932UAC9 3.000 09/15/2016 86932UAD7 3.000
09/15/2016 86932UAW5 5.000 09/15/2017 86932UAE5 4.000 09/15/2017 86932UAX3 5.000 09/15/2018 86932UAF2 4.000 09/15/2019 86932UAG0 5.000 09/15/2020 86932UAH8 3.000 09/15/2020 86932UAZ8 5.000 09/15/2021 86932UAJ4 5.000 09/15/2022 86932UAK1 5.000

09/15/2023 86932UAL9 5.000 09/15/2024 86932UAM7 3.500 09/15/2025 86932UAN5 5.000 09/15/2026 86932UAP0 5.000 09/15/2027 86932UAQ8 4.000 09/15/2027 86932UAY1 5.000 09/15/2028 86932UAR6 5.000 09/15/2029 86932UAS4 4.250 09/15/2030 86932UAT2 5.000 09/15/2031 86932UAU9 5.000 09/15/2034 86932UAV7 5.000
Citigroup Global Markets Inc
By: Citigroup Global Markets Inc New York, NY
Tuesday, July 26, 2011 9:02AM
********************************************************************************

Pricing Spreads and Comparable Transactions

SEU Comparable TransactionsThe SEU financing priced favorably to other appropriation backed deals because of the strength of the State of Delaware.
5
Issuer: Sustainable Energy Utility, Inc. Tobacco Settlement Financing Corp (NY) New York State Housing Finance AgencySeries: Energy Efficiency Revenue Bonds, Series 2011 Series 2011B (Appropriation) 2011 Series A (Appropriation)Size: $67.435 million $543.595 million $71.015 million
Ratings: Aa2 / AA+ / NR NR / AA‐ / AA‐ NR / AA‐ / AA‐Call Date: 9/15/2021 Non‐Call Non‐CallSale Date: 7/25/2011 6/28/2011 6/23/2011
Year Par CouponSpread
to MMD Par CouponSpread
to MMD Par CouponSpread
to MMD
2012 16,320 2.50% Sealed2013 1,775 2.00% 25 81,595 4.00% 51 12,600 5.00% 40 2014 1,845 3.00% 35 85,000 5.00% 73 12,600 5.00% 55 2015 3,325 3.00% 38 89,000 5.00% 83 7,705 5.00% 65 2016 3,240 3%/5% 45 94,000 5.00% 85 8,060 3.00% 75 2017 3,435 4%/5% 50 98,000 5.00% 85 8,475 5.00% 78 2018 2,285 4.00% 53 96,000 5.00% 85 900 5.00% 80 2019 2,405 5.00% 53 1,875 5.00% 79 2020 2,570 3%/5% 55 2,480 5.00% 80 2021 2,655 5.00% 55 2022 2,805 5.00% 57 2023 2,940 5.00% 57 2024 3,080 3.50% 60 2025 3,175 5.00% 60 2026 3,325 5.00% 60 2027 3,480 4%/5% 60 2028 3,630 5.00% 60 2029 3,810 4.25% 78 2030 3,960 5.00% 54 2031 4,215 5.00% 52 203220332034 9,480 5.00% 41
*2029 maturity priced with discount structure

SEU Comparable Transactions (Cont’d)
Given the relative scarcity of the Delaware name, the SEU’s bonds were in high demand.
6
Issuer: Sustainable Energy Utility, Inc. City of Jacksonville, Florida The Turnpike Authority of KentuckySeries: Energy Efficiency Revenue Bonds, Series 2011 Series 2011B (Appropriation) 2011 Series A (Appropriaton)Size: $67.435 million $86.600 million $115.175 million
Ratings: Aa2 / AA+ / NR Aa2 / AA‐ / AA Aa2 / AA+ / AA‐Call Date: 9/15/2021 Non‐Call 7/1/2021Sale Date: 7/25/2011 6/9/2011 4/6/2011
Year Par CouponSpread
to MMD Par CouponSpread
to MMD Par CouponSpread
to MMD
20122013 1,775 2.00% 25 650 3.00% 76 2014 1,845 3.00% 35 1,100 4.00% 79 2015 3,325 3.00% 38 9,200 5.00% 82 2016 3,240 3%/5% 45 9,425 5.00% 84 13,170 5.00% 52 2017 3,435 4%/5% 50 14,675 5.00% 90 13,780 4.00% 59 2018 2,285 4.00% 53 10,275 5.00% 87 14,420 5.00% 67 2019 2,405 5.00% 53 11,675 5.00% 86 15,115 5.00% 68 2020 2,570 3%/5% 55 14,175 5.00% 82 3,785 5.00% 68 2021 2,655 5.00% 55 15,425 5.00% 79 3,960 5.00% 66 2022 2,805 5.00% 57 4,135 5.00% 66 2023 2,940 5.00% 57 4,295 4.13% 66 2024 3,080 3.50% 60 4,455 5.00% 66 2025 3,175 5.00% 60 4,615 5.00% 68 2026 3,325 5.00% 60 4,920 5.00% 70 2027 3,480 4%/5% 60 5,175 5.00% 70 2028 3,630 5.00% 60 5,435 5.00% 70 2029 3,810 4.25% 78 5,685 5.00% 70 2030 3,960 5.00% 54 5,945 5.00% 68 2031 4,215 5.00% 52 6,285 4.88% 64 203220332034 9,480 5.00% 41
*2029 maturity priced with discount structure

Distribution Analysis

Sustainable Energy Utility, Inc.
Energy Efficiency Revenue Bonds, Series 2011
Orders and Allotments by Order Type (000’s)
Member63%
Retail5%Citi
Underwritten32%
Allotment % Breakdown by Order Type
Order Type Orders Allotments
Retail: 3,365$ 3,265$ Member: 79,175 42,760 Citi Underwritten: - 21,410
Total: 82,540$ 67,435$

Sustainable Energy Utility, Inc.
Energy Efficiency Revenue Bonds, Series 2011
Orders and Allotments by Maturity(000’s)
*Coverage Factors <1.0x indicate maturities underwritten by Citi
Maturity Orders Allotments Coverage
9/15/2013 7,325$ 1,775$ 4.1x 9/15/2014 2,640 1,845 1.4x 9/15/2015 7,340 3,325 2.2x 9/15/2016 700 3,240 0.2x 9/15/2017 300 3,435 0.1x 9/15/2018 2,820 2,285 1.2x 9/15/2019 4,900 2,405 2.0x 9/15/2020 585 2,570 0.2x 9/15/2021 5,530 2,655 2.1x 9/15/2022 2,805 2,805 1.0x 9/15/2023 2,980 2,940 1.0x 9/15/2024 2,005 3,080 0.7x 9/15/2025 - 3,175 - 9/15/2026 450 3,325 0.1x 9/15/2027 700 3,480 0.2x 9/15/2028 - 3,630 - 9/15/2029 3,810 3,810 1.0x 9/15/2030 3,960 3,960 1.0x 9/15/2031 4,215 4,215 1.0x 9/15/2034 29,475 9,480 3.1x
Total: 82,540$ 67,435$ 1.2x

Sustainable Energy Utility, Inc.
Energy Efficiency Revenue Bonds, Series 2011
Orders and Allotments by Buyer(000’s)
Unfilled orders are typically the result of oversubscribed maturities:– Serial Bonds: 2013 – 2015, 2018 – 2019, 2021 – 2034 Term Bond
Buyers Orders Allotments
Citi Underwritten -$ 21,410$ Definitive Capital 22,690 9,580 Lord Abbet 11,745 6,315 Gannett 5,735 5,695 First New York Securities 3,810 3,810 Merrill TOB 9,425 3,750 Retail 3,365 3,265 Breckenridge Capital 2,450 2,405 Sterling Asset Management 3,740 1,545 Wells Fargo 1,500 1,485 Cutwater Asset Management 3,420 1,425 Neuberger Berman 4,465 1,425 Wilmington Trust 3,420 1,400 RBC Wealth Management 1,000 1,000 Edward Jones 1,000 900 Lee Munder Investments 875 875 Wells Capital Management 1,825 450 JP Morgan Asset Management 1,825 450 Columbia Management 250 250
Total: 82,540$ 67,435$

Ratings Reports

New Issue: MOODY'S ASSIGNS INITIAL RATING OF Aa2 TO APPROXIMATELY $70 MILLION DELAWARE SUSTAINABLE ENERGY UTILITY, INC. ENERGY EFFICIENCY REVENUE BONDS
Global Credit Research - 14 Jul 2011
OUTLOOK IS STABLE
Delaware (State of) State DE
Moody's Rating
Opinion
NEW YORK, Jul 14, 2011 -- Moody's Investors Service has assigned an initial rating of Aa2 to the Delaware Sustainable Energy Utility, Inc., Energy Efficiency Revenue Bonds, Series 2011, expected to be issued with a par amount of approximately $70 million. Proceeds will be used to finance projects for five state agencies or entities consisting of the design, construction and installation of certain energy efficiency measures, and to fund capitalized interest on the bonds. The bonds are paid by appropriations made from the State of Delaware's General Fund to those agencies or entities, and therefore the rating on the bonds is based on the general obligation rating of the State of Delaware (rated Aaa/Stable).
RATING RATIONALE
The rating reflects the strong legal structure; the involvement of several entities in the transaction, including state agencies, contractors, and a non-profit corporation; the potential for future legislative action reducing the revenue stream from which debt service payments are made; the lack of any other appropriation debt issued by the state; and some relative weakness regarding essentiality of the project. The rating is two notches off the state's rating of Aaa, reflecting both the need for legislative appropriation and the factors listed above.
CREDIT STRENGTHS
--Payments for debt service are absolute and unconditional obligations of agencies to pay under the Installment Payment Agreement
--The MOU strengthens flow of funds from state directly to trustee
--State has long history of strong and conservative management
CREDIT CHALLENGES
--This is a new and untested credit for the state, which has not previously issued appropriation-backed debt
--Distance from the state, with various agencies and other entities responsible for making installment payments (rather than the state appropriating for debt service), and the bonds issued by a non-profit corporation
--The involvement of private contractors and a non-profit corporation presents risks, although small, around potential bankruptcy situations
DETAILED CREDIT DISCUSSION
THE BONDS
The Sustainable Energy Utility, Inc. (SEU) is issuing approximately $70 million in bonds to finance energy efficiency projects. The bonds will have a maximum final maturity of 20 years after the end of the construction period, and will be fixed rate bonds. There will be capitalized interest through the construction period. No debt service reserve fund will be available for the bonds.
ISSUE RATINGEnergy Efficiency Revenue Bonds, Series 2011 Aa2 Sale Amount $70,000,000 Expected Sale Date 07/19/11 Rating Description Lease Appropriation
Page 1 of 4
7/18/2011http://www.moodys.com/research/MOODYS-ASSIGNS-INITIAL-RATING-OF-Aa2-TO-APPR...

OBLIGATION TO MAKE PAYMENTS IS GOVERNED BY INSTALLMENT PAYMENT AGREEMENT
The State of Delaware created the Sustainable Energy Utility, Inc. (SEU) on June 28, 2007, as a non-profit tax-exempt 501(c)(3) organization to realize the state's legislated target of a 30% reduction in energy use by 2020. SEU expects to enter into a Construction Funding Agreement with a contractor and each agency involved in this transaction, whereby the SEU agrees to pay for energy efficiency investments. The agencies involved in this transaction are the Department of Corrections, the Department of Services for Children, Youth, and Their Families, the Office of Management and Budget, Delaware State University, and Delaware Technical and Community College.
After the issuance of these bonds, the contractor will use the proceeds to complete energy efficiency projects. The bonds are secured by payments under Installment Payment Agreements signed by the agencies and the SEU. In the agreements, the agencies pledge to make annual payments for installation of energy efficiency upgrades (and the SEU in turn assigns those payments to the trustee in the trust indenture). The obligation of each agency to make payment is absolute and unconditional, subject to appropriation. Installment payments are limited obligations of the agency payable from amounts appropriated by the state that are eligible for payment of the installment payments pursuant to the Energy Performance Contracting Act (Del Code Ann. Tit. 29 section 6974). The act states that "a governmental unit may use funds designated for operating, energy, or capital expenditures for any performance contract, including, without limitation, for purchases on an installment payment or lease purchase basis." We note that the revenues from which the installment payments are made are governed by the act, and could therefore be changed by a further act.
MEMORANDUMS OF UNDERSTANDING WITH STATE BUDGET OFFICE ADD STRENGTH
Each of the agencies involved is expected to enter into a Memorandum of Understanding (MOU) with the state Office of Management and Budget. The state in the MOU recognizes that the agency is obligated to make payments under the Installment Payment Agreement. It recognizes that pursuant to statute, payments from the state to an agency shall not be reduced as a result of a performance contract during the life of the contract. Further, the agency agrees to request the Installment Payment Agreement amounts in its annual budget request, and OMB agrees to work with the agency and the legislature to ensure appropriate levels of funding are received. Finally, the agency agrees it will transfer sufficient funds to make its payments at the beginning of each year, and OMB agrees it will initiate the transfer and make payments directly to the trustee, out of appropriated funds available to make the payments.
Each contractor is expected to enter into a Guaranteed Energy Savings Agreement (GESA) with the agencies, guaranteeing a targeted annual savings level for the term of the agreement. Each agency is therefore guaranteed to receive energy efficiencies and savings, unless the contractor declares bankruptcy. Each agency's obligations under its Installment Payment Agreement are absolute and unconditional, whether or not the guaranteed energy savings levels are achieved under its Guaranteed Energy Savings Agreement, provided that the Installment Payments are limited obligations of the agency, payable only from amounts appropriated by the state that are eligible for payment of the Installment Payments pursuant to the Energy Performance Contracting Act.
THE SEU
The SEU is a not-for-profit corporation formed by and for the benefit of the state pursuant to the SEU Authorizing Act, with full lawful power and authority to enter into the Indenture and to issue bonds. The SEU was created in 2007 for the purpose of, among other things, developing energy efficiency services. As such, the SEU plans to issue the bonds to pay the costs of projects which consist of the design, construction and installation of certain energy conservation measures at certain facilities operated by the agencies. The SEU is not limited to acting solely as a shell corporation facilitating financings, and we note that were the SEU to expand its operations, this could present additional risk.
The State of Delaware created the SEU to coordinate and promote the sustainable use of energy in the state. The SEU's statutory charge includes the use of competitive markets and leveraged private-financing to deliver cost-effective energy services. The SEU Authorizing Act creates an Oversight Board to ensure that the SEU meets responsibilities and performance targets enumerated in its contract with the Energy Office and to serve as the SEU's board of directors. This Act further establishes initial performance targets for the SEU as well as evaluation and monitoring mechanisms to ensure that energy savings are verifiable.
STRONG COVERAGE FROM STATE APPROPRIATIONS TO AGENCIES
The agencies and entities involved in the transaction could withstand severe budget cuts and still have no trouble making their installment payments. The Department of Corrections, for example, received $30 million in fiscal 2011 budgetary appropriations for energy, supplies and materials, contractual services, and capital outlay (the line items from which the installment payment can be made), providing over 8 times coverage of a likely annual installment payment of approximately $3.6 million. The other agencies and entities report even stronger coverage of installment payments by fiscal 2011 appropriated amounts available for installment payments to the trustee.
Outlook
As the rating on this transaction is notched off the state's general obligation rating, the outlook is the state's stable outlook, which reflects our belief that the combination of the state's strong structural governance features, speedy actions to deal with downward revenue revisions, the use of recurring solutions to solve gaps, a low-risk debt profile and high pension funding ratio will result in the state coming out of this recession in a strong position relative to its peers.
What could change the rating-DOWN
Page 2 of 4
7/18/2011http://www.moodys.com/research/MOODYS-ASSIGNS-INITIAL-RATING-OF-Aa2-TO-APPR...

--Significant decline in state appropriations available for debt service
--Any legislative changes that weaken the structure of the security
The principal methodology used in this rating was The Fundamentals of Credit Analysis for Lease-Backed Municipal Obligations published in October 2004. Please see the Credit Policy page on www.moodys.com for a copy of this methodology.
REGULATORY DISCLOSURES
For ratings issued on a program, series or category/class of debt, this announcement provides relevant regulatory disclosures in relation to each rating of a subsequently issued bond or note of the same series or category/class of debt or pursuant to a program for which the ratings are derived exclusively from existing ratings in accordance with Moody's rating practices. For ratings issued on a support provider, this announcement provides relevant regulatory disclosures in relation to the rating action on the support provider and in relation to each particular rating action for securities that derive their credit ratings from the support provider's credit rating. For provisional ratings, this announcement provides relevant regulatory disclosures in relation to the provisional rating assigned, and in relation to a definitive rating that may be assigned subsequent to the final issuance of the debt, in each case where the transaction structure and terms have not changed prior to the assignment of the definitive rating in a manner that would have affected the rating. For further information please see the ratings tab on the issuer/entity page for the respective issuer on www.moodys.com.
Information sources used to prepare the rating are the following: parties involved in the ratings, parties not involved in the ratings, and public information.
Moody's considers the quality of information available on the rated entity, obligation or credit satisfactory for the purposes of issuing a rating.
Moody's adopts all necessary measures so that the information it uses in assigning a credit rating is of sufficient quality and from sources Moody's considers to be reliable including, when appropriate, independent third-party sources. However, Moody's is not an auditor and cannot in every instance independently verify or validate information received in the rating process.
Please see ratings tab on the issuer/entity page on Moodys.com for the last rating action and the rating history.
The date on which some Credit Ratings were first released goes back to a time before Moody's Investors Service's Credit Ratings were fully digitized and accurate data may not be available. Consequently, Moody's Investors Service provides a date that it believes is the most reliable and accurate based on the information that is available to it. Please see the ratings disclosure page on our website www.moodys.com for further information.
Please see the Credit Policy page on Moodys.com for the methodologies used in determining ratings, further information on the meaning of each rating category and the definition of default and recovery.
Analysts
Emily Raimes Analyst Public Finance Group Moody's Investors Service
Edward Hampton Backup Analyst Public Finance Group Moody's Investors Service
Contacts
Journalists: (212) 553-0376 Research Clients: (212) 553-1653
Moody's Investors Service, Inc. 250 Greenwich Street New York, NY 10007 USA
Page 3 of 4
7/18/2011http://www.moodys.com/research/MOODYS-ASSIGNS-INITIAL-RATING-OF-Aa2-TO-APPR...

© 2011 Moody's Investors Service, Inc. and/or its licensors and affiliates (collectively, "MOODY'S"). All rights reserved.
CREDIT RATINGS ARE MOODY'S INVESTORS SERVICE, INC.'S ("MIS") CURRENT OPINIONS OF THE RELATIVE FUTURE CREDIT RISK OF ENTITIES, CREDIT COMMITMENTS, OR DEBT OR DEBT-LIKE SECURITIES. MIS DEFINES CREDIT RISK AS THE RISK THAT AN ENTITY MAY NOT MEET ITS CONTRACTUAL, FINANCIAL OBLIGATIONS AS THEY COME DUE AND ANY ESTIMATED FINANCIAL LOSS IN THE EVENT OF DEFAULT. CREDIT RATINGS DO NOT ADDRESS ANY OTHER RISK, INCLUDING BUT NOT LIMITED TO: LIQUIDITY RISK, MARKET VALUE RISK, OR PRICE VOLATILITY. CREDIT RATINGS ARE NOT STATEMENTS OF CURRENT OR HISTORICAL FACT. CREDIT RATINGS DO NOT CONSTITUTE INVESTMENT OR FINANCIAL ADVICE, AND CREDIT RATINGS ARE NOT RECOMMENDATIONS TO PURCHASE, SELL, OR HOLD PARTICULAR SECURITIES. CREDIT RATINGS DO NOT COMMENT ON THE SUITABILITY OF AN INVESTMENT FOR ANY PARTICULAR INVESTOR. MIS ISSUES ITS CREDIT RATINGS WITH THE EXPECTATION AND UNDERSTANDING THAT EACH INVESTOR WILL MAKE ITS OWN STUDY AND EVALUATION OF EACH SECURITY THAT IS UNDER CONSIDERATION FOR PURCHASE, HOLDING, OR SALE.
ALL INFORMATION CONTAINED HEREIN IS PROTECTED BY LAW, INCLUDING BUT NOT LIMITED TO, COPYRIGHT LAW, AND NONE OF SUCH INFORMATION MAY BE COPIED OR OTHERWISE REPRODUCED, REPACKAGED, FURTHER TRANSMITTED, TRANSFERRED, DISSEMINATED, REDISTRIBUTED OR RESOLD, OR STORED FOR SUBSEQUENT USE FOR ANY SUCH PURPOSE, IN WHOLE OR IN PART, IN ANY FORM OR MANNER OR BY ANY MEANS WHATSOEVER, BY ANY PERSON WITHOUT MOODY'S PRIOR WRITTEN CONSENT. All information contained herein is obtained by MOODY'S from sources believed by it to be accurate and reliable. Because of the possibility of human or mechanical error as well as other factors, however, all information contained herein is provided "AS IS" without warranty of any kind. MOODY'S adopts all necessary measures so that the information it uses in assigning a credit rating is of sufficient quality and from sources Moody's considers to be reliable, including, when appropriate, independent third-party sources. However, MOODY'S is not an auditor and cannot in every instance independently verify or validate information received in the rating process. Under no circumstances shall MOODY'S have any liability to any person or entity for (a) any loss or damage in whole or in part caused by, resulting from, or relating to, any error (negligent or otherwise) or other circumstance or contingency within or outside the control of MOODY'S or any of its directors, officers, employees or agents in connection with the procurement, collection, compilation, analysis, interpretation, communication, publication or delivery of any such information, or (b) any direct, indirect, special, consequential, compensatory or incidental damages whatsoever (including without limitation, lost profits), even if MOODY'S is advised in advance of the possibility of such damages, resulting from the use of or inability to use, any such information. The ratings, financial reporting analysis, projections, and other observations, if any, constituting part of the information contained herein are, and must be construed solely as, statements of opinion and not statements of fact or recommendations to purchase, sell or hold any securities. Each user of the information contained herein must make its own study and evaluation of each security it may consider purchasing, holding or selling. NO WARRANTY, EXPRESS OR IMPLIED, AS TO THE ACCURACY, TIMELINESS, COMPLETENESS, MERCHANTABILITY OR FITNESS FOR ANY PARTICULAR PURPOSE OF ANY SUCH RATING OR OTHER OPINION OR INFORMATION IS GIVEN OR MADE BY MOODY'S IN ANY FORM OR MANNER WHATSOEVER.
MIS, a wholly-owned credit rating agency subsidiary of Moody's Corporation ("MCO"), hereby discloses that most issuers of debt securities (including corporate and municipal bonds, debentures, notes and commercial paper) and preferred stock rated by MIS have, prior to assignment of any rating, agreed to pay to MIS for appraisal and rating services rendered by it fees ranging from $1,500 to approximately $2,500,000. MCO and MIS also maintain policies and procedures to address the independence of MIS's ratings and rating processes. Information regarding certain affiliations that may exist between directors of MCO and rated entities, and between entities who hold ratings from MIS and have also publicly reported to the SEC an ownership interest in MCO of more than 5%, is posted annually at www.moodys.com under the heading "Shareholder Relations — Corporate Governance — Director and Shareholder Affiliation Policy."
Any publication into Australia of this document is by MOODY'S affiliate, Moody's Investors Service Pty Limited ABN 61 003 399 657, which holds Australian Financial Services License no. 336969. This document is intended to be provided only to "wholesale clients" within the meaning of section 761G of the Corporations Act 2001. By continuing to access this document from within Australia, you represent to MOODY'S that you are, or are accessing the document as a representative of, a "wholesale client" and that neither you nor the entity you represent will directly or indirectly disseminate this document or its contents to "retail clients" within the meaning of section 761G of the Corporations Act 2001.
Notwithstanding the foregoing, credit ratings assigned on and after October 1, 2010 by Moody's Japan K.K. (“MJKK”) are MJKK's current opinions of the relative future credit risk of entities, credit commitments, or debt or debt-like securities. In such a case, “MIS” in the foregoing statements shall be deemed to be replaced with “MJKK”. MJKK is a wholly-owned credit rating agency subsidiary of Moody's Group Japan G.K., which is wholly owned by Moody’s Overseas Holdings Inc., a wholly-owned subsidiary of MCO.
This credit rating is an opinion as to the creditworthiness or a debt obligation of the issuer, not on the equity securities of the issuer or any form of security that is available to retail investors. It would be dangerous for retail investors to make any investment decision based on this credit rating. If in doubt you should contact your financial or other professional adviser.
Page 4 of 4
7/18/2011http://www.moodys.com/research/MOODYS-ASSIGNS-INITIAL-RATING-OF-Aa2-TO-APPR...

Research
Summary:
Sustainable Energy Utility Inc., Delaware; Appropriations
Rationale
The strong general credit quality of the State of Delaware (AAA/Stable);
The state's demonstrated commitment, within both the administrative and legislative branches, to repaying its appropriation-backed debt;
The strong contractual provisions, which include an absolute and unconditional payment provision upon annual appropriation; and
Annual payments that are date certain and not subject to acceptance.
The Department of Correction;
The Department of Services for Children, Youth and Their Families;
The Office of Management and Budget (OMB);
Delaware State University; and
Delaware Technical Community College.
Credit Profile
US$81.455 mil energy efficiency rev bnds (Delaware) ser 2011 Long Term Rating AA+/Stable New
RatingsDirect
18-Jul-2011
Current Ratings
Standard & Poor's Ratings Services assigned its 'AA+' long-term rating, and stable outlook, to the Sustainable Energy Utility Inc., Del.'s (SEU) energy efficiency revenue bonds, series 2011.
The rating reflects what we view as:
The bonds are being issued by SEU, a Delaware not-for-profit corporation created by and for the benefit of the State of Delaware pursuant to the Delaware Act, Del. Code Tit. 29 §8059 under a Trust Indenture between the SEU and Citibank N.A. Agency & Trust, New York, N.Y., as trustee.
We understand that bond proceeds will be used to fund projects consisting of the design, construction, and installation of certain energy conservation measures (ECM) at facilities of a number of state agencies inclusive of Delaware State University (the agencies). The funds will be used by various energy service companies that have contracted with the state through these agencies to implement the projects under the guaranteed energy savings agreements. The agencies that have entered these contracts for this issue are:
The bonds are limited obligations of the SEU payable solely from the trust estate. The trust estate includes installment payments made by OMB through a memorandum of understanding (MOU) between OMB and the various agencies. The installment payments are provided through an installment payment agreement with each agency and are subject to annual appropriations from the state. The SEU is a signatory and beneficiary of the MOU. The bonds are equally and ratably secured by the trust estate, and the failure of the state to appropriate sufficient funds to each of the agencies to make the installment payments will cause insufficient funds to be available to provide full debt service payments on the
Page 1 of 3[18-Jul-2011] Summary: Sustainable Energy Utility Inc., Delaware; Appropriations
7/18/2011https://www.globalcreditportal.com/ratingsdirect/showArticlePage.do?rand=7Uo1dWPt3n&article...

Outlook
Related Criteria And Research
Primary Credit Analyst: Richard J Marino, New York (1) 212-438-2058;[email protected]
Secondary Contact: Robin Prunty, New York (1) 212-438-2081; [email protected]
bonds. To insure sufficient funds are provided to the agencies the MOU provides that each agency will include in its annual budget request an amount, which fully satisfies its annual obligation under its installment payment agreement. Each agency will transfer the amount of its annual installment payments to OMB at the beginning of each fiscal year, and OMB will make payments directly to the trustee on behalf each agency.
Each agency's obligations under its installment payment agreement are absolute and unconditional, and not subject to counterclaim or offset. The installment payments do not depend upon guaranteed energy savings being achieved. The lack of a debt service reserve fund is offset by debt service payments not being made until two-and-a-half months have elapsed in the state's fiscal year. The SEU's interest in the MOU is assigned to the trustee and full assignment of all installment payments that cover debt service on the bonds has also been given to the trustee.
The state enacted the Energy Performance Contracting Act to encourage agencies to conserve energy by authorizing them to enter into guaranteed energy performance contracts for the design and installation of ECMs at their facilities. The act provides that the contract can be structured as an installment payment contract and that the financing of the ECMs might be implemented through a third party, such as SEU. Each agency participating in the program selected a pre-qualified contractor to perform an investment-grade energy audit of its facilities and recommend ECMs. The act requires an agency to allocate sufficient monies for each fiscal year to pay amounts payable under a performance contract, including a performance contract structured as an installment payment contract and permits an agency to use funds designated for operating, energy, or capital expenditures for any performance contract, including for purchases on an installment payment basis. The installment payment agreements are substantially the same for each agency, and we understand are date certain and not subject to project completion.
(For further information, see the full analysis on Delaware, published May 11, 2011, on RatingsDirect on the Global Credit Portal.)
The stable outlook on SEU reflects the stable outlook on Delaware's long-term general obligation bonds.
USPF Criteria: Appropriation-Backed Obligations, June 13, 2007
Complete ratings information is available to subscribers of RatingsDirect on the Global Credit Portal at www.globalcreditportal.com. All ratings affected by this rating action can be found on Standard & Poor's public Web site at www.standardandpoors.com. Use the Ratings search box located in the left column.
No content (including ratings, credit-related analyses and data, model, software or other application or output therefrom) or any part thereof (Content) may be modified, reverse engineered, reproduced or distributed in any form by any means, or stored in a database or retrieval system, without the prior written permission of S&P. The Content shall not be used for any unlawful or unauthorized purposes. S&P, its affiliates, and any third-party providers, as well as their directors, officers, shareholders, employees or agents (collectively S&P Parties) do not guarantee the accuracy, completeness, timeliness or availability of the Content. S&P Parties are not responsible for any errors or omissions, regardless of the cause, for the results obtained from the use of the Content, or for the security or maintenance of any data input by the user. The Content is provided on an "as is" basis. S&P PARTIES DISCLAIM ANY AND ALL EXPRESS OR IMPLIED WARRANTIES, INCLUDING, BUT NOT LIMITED TO, ANY WARRANTIES OF MERCHANTABILITY OR FITNESS FOR A PARTICULAR PURPOSE OR USE, FREEDOM FROM BUGS, SOFTWARE ERRORS OR DEFECTS, THAT THE CONTENT'S FUNCTIONING WILL BE UNINTERRUPTED OR THAT THE CONTENT WILL OPERATE WITH ANY SOFTWARE OR HARDWARE CONFIGURATION. In no event shall S&P Parties be liable to any party for any direct, indirect, incidental, exemplary, compensatory, punitive, special or consequential damages, costs, expenses, legal fees, or losses (including, without limitation, lost income or lost profits and opportunity costs) in connection with any use of the Content even if advised of the possibility of such damages.
Credit-related analyses, including ratings, and statements in the Content are statements of opinion as of the date they are expressed and not statements of fact or recommendations to purchase, hold, or sell any securities or to make any investment decisions. S&P assumes no obligation to update the Content following publication in any form or format. The Content should not be relied on and is not a substitute for the skill, judgment and experience of the user, its management, employees, advisors and/or clients when making investment and other business decisions. S&P's opinions and analyses do not address the suitability of any security. S&P does not act as a fiduciary or an investment advisor. While S&P has obtained information from sources it believes to
Page 2 of 3[18-Jul-2011] Summary: Sustainable Energy Utility Inc., Delaware; Appropriations
7/18/2011https://www.globalcreditportal.com/ratingsdirect/showArticlePage.do?rand=7Uo1dWPt3n&article...
be reliable, S&P does not perform an audit and undertakes no duty of due diligence or independent verification of any information it receives.
S&P keeps certain activities of its business units separate from each other in order to preserve the independence and objectivity of their respective activities. As a result, certain business units of S&P may have information that is not available to other S&P business units. S&P has established policies and procedures to maintain the confidentiality of certain non-public information received in connection with each analytical process.
S&P may receive compensation for its ratings and certain credit-related analyses, normally from issuers or underwriters of securities or from obligors. S&P reserves the right to disseminate its opinions and analyses. S&P's public ratings and analyses are made available on its Web sites, www.standardandpoors.com (free of charge), and www.ratingsdirect.com and www.globalcreditportal.com (subscription), and may be distributed through other means, including via S&P publications and third-party redistributors. Additional information about our ratings fees is available at www.standardandpoors.com/usratingsfees.
Any Passwords/user IDs issued by S&P to users are single user-dedicated and may ONLY be used by the individual to whom they have been assigned. No sharing of passwords/user IDs and no simultaneous access via the same password/user ID is permitted. To reprint, translate, or use the data or information other than as provided herein, contact Client Services, 55 Water Street, New York, NY 10041; (1) 212-438-7280 or by e-mail to: [email protected].
Copyright © 2011 Standard & Poor’s, a division of The McGraw-Hill Companies. All Rights Reserved.
Page 3 of 3[18-Jul-2011] Summary: Sustainable Energy Utility Inc., Delaware; Appropriations
7/18/2011https://www.globalcreditportal.com/ratingsdirect/showArticlePage.do?rand=7Uo1dWPt3n&article...

Market Commentary

Citi Investment Research & Analysis is a division of Citigroup Global Markets Inc. (the "Firm"), which does and seeks to do business with companies covered in its research reports. As a result, investors should be aware that the Firm may have a conflict of interest that could affect the objectivity of this report. Investors should consider this report as only a single factor in making their investment decision.
Citigroup Global Markets
North America
22 July 2011 │ 21 pages
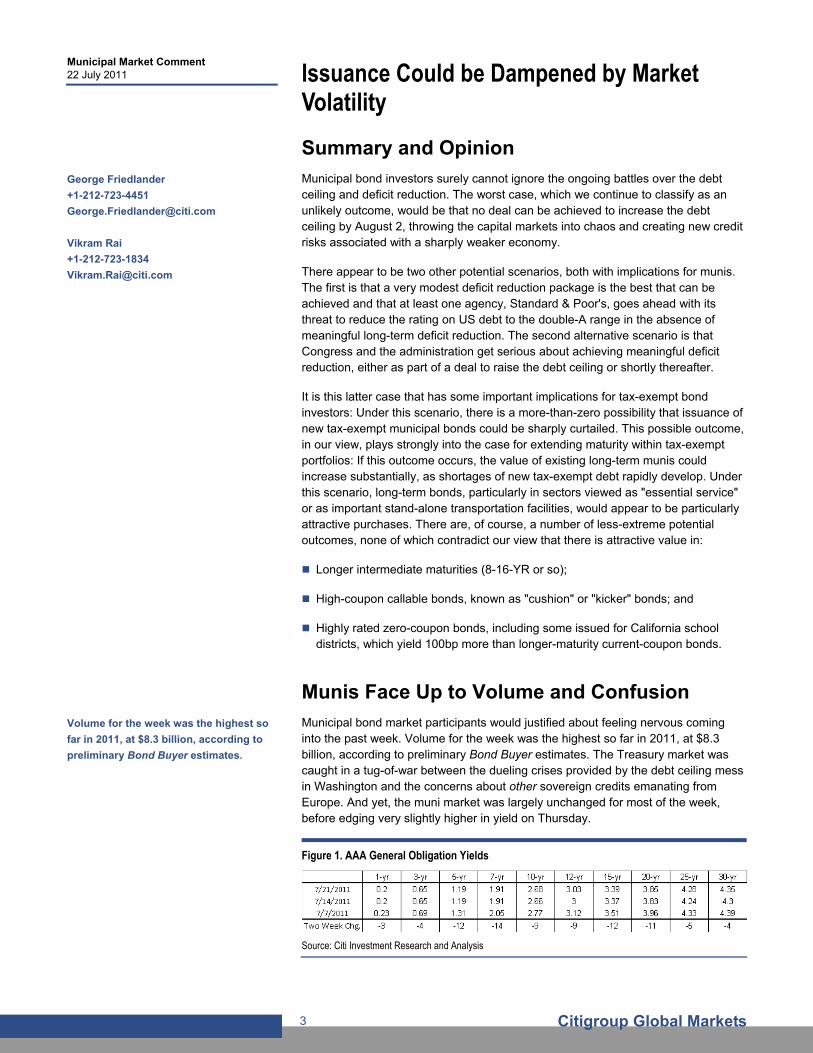
Municipal Market Comment Issuance Could be Dampened by Market Volatility
Uncertainty surrounding the debt ceiling battle has yet to be resolved and the Treasury market has been highly volatile, but range-bound.
Despite the uncertainties surrounding these issues, the municipal bond market stayed in an even narrower track while handling the heaviest calendar of 2011.
There are three sets of most likely potential outcomes for the debt ceiling/deficit reduction crisis: no deal, a small deal with likely Treasury downgrades, and a larger deal that could lead to major spending cuts.
Each of these scenarios presents different challenges for the municipal market though the larger deal presents the greatest challenge as access to the tax-exempt bond market for new issues could be curtailed or eliminated at some point in the process.
We discuss some of the key myths and realities surrounding the muni market that ought to be considered as the process moves forward.
BABs continue to perform well, showing their defensive characteristics. MCDS spreads have widened, as if investors are forgetting about the Lehman overhang.
Crossover high-grade and derivatives investors are unlikely to get out of their muni positions, but high-yield investors could certainly start angling for an exit.
Current Recommendations in this issue:
– BAB credit OAS curves are inverted; buy 10-20-YR bonds versus the long end
– Overweight high-grade taxable university bonds versus Treasuries
– Overweight high-quality revenue bonds versus Treasuries
Municipals
See Appendix A-1 for Analyst Certification, Important Disclosures and non-US research analyst disclosures.
George Friedlander +1-212-723-4451 [email protected]
Mikhail Foux +1-212-723-9353 [email protected]
Vikram Rai +1-212-723-1834 [email protected]

Municipal Market Comment 22 July 2011
Citigroup Global Markets 2
Issuance Could be Dampened by Market Volatility 3 Summary and Opinion 3 Munis Face Up to Volume and Confusion 3 Demand Patterns 5 The Debt Ceiling Crisis: Three Distinct Scenarios 6 Deficit Reduction Could Curtail New Tax-Exempt Issuance 8 Special Focus: Myths That Magnify the Threat to Tax Exemption for Newly Issued Bonds 9
Introduction 9 Myth #1: The muni market provides an inefficient subsidy 9 Myth #2: Taxable tax credit bonds could effectively replace tax-exempt bonds as a form of support for state and local issuers. 10 Myth #3: Subsidies for state and local issuance are dangerous because low borrowing costs lead issuers to "overspend." 10 Myth #4: Taxable Build America Bonds could never provide an efficient subsidy for state and local projects because the buyers of taxable munis are primarily non-taxed entities. 10 Myth #5: Funding for state and local projects is ample, whether they are subsidized or not. 11 Myth #6: Anything that can be done to reduce the federal deficit will ultimately auger to the benefit of state and local governments as well. 11
Quantitative Municipal Strategies 12 Crossover Investors Not Running for an Exit 12 Recommend 10-20-YR BABs 14 US Municipals Strategy Portfolio 15
MMD Rate and Curves 15 Derivatives 16
Trades Opened Since Last Publication 17 Trades Closed Since Last Publication 17 Appendix A — US Muni Strategy Portfolio Closed Trades 18 Appendix A-1 19
Contents
Municipal Market Comment 22 July 2011
Citigroup Global Markets 3
Summary and Opinion
Municipal bond investors surely cannot ignore the ongoing battles over the debt ceiling and deficit reduction. The worst case, which we continue to classify as an unlikely outcome, would be that no deal can be achieved to increase the debt ceiling by August 2, throwing the capital markets into chaos and creating new credit risks associated with a sharply weaker economy.
There appear to be two other potential scenarios, both with implications for munis. The first is that a very modest deficit reduction package is the best that can be achieved and that at least one agency, Standard & Poor's, goes ahead with its threat to reduce the rating on US debt to the double-A range in the absence of meaningful long-term deficit reduction. The second alternative scenario is that Congress and the administration get serious about achieving meaningful deficit reduction, either as part of a deal to raise the debt ceiling or shortly thereafter.
It is this latter case that has some important implications for tax-exempt bond investors: Under this scenario, there is a more-than-zero possibility that issuance of new tax-exempt municipal bonds could be sharply curtailed. This possible outcome, in our view, plays strongly into the case for extending maturity within tax-exempt portfolios: If this outcome occurs, the value of existing long-term munis could increase substantially, as shortages of new tax-exempt debt rapidly develop. Under this scenario, long-term bonds, particularly in sectors viewed as "essential service" or as important stand-alone transportation facilities, would appear to be particularly attractive purchases. There are, of course, a number of less-extreme potential outcomes, none of which contradict our view that there is attractive value in:
Longer intermediate maturities (8-16-YR or so);
High-coupon callable bonds, known as "cushion" or "kicker" bonds; and
Highly rated zero-coupon bonds, including some issued for California school districts, which yield 100bp more than longer-maturity current-coupon bonds.
Munis Face Up to Volume and Confusion
Municipal bond market participants would justified about feeling nervous coming into the past week. Volume for the week was the highest so far in 2011, at $8.3 billion, according to preliminary Bond Buyer estimates. The Treasury market was caught in a tug-of-war between the dueling crises provided by the debt ceiling mess in Washington and the concerns about other sovereign credits emanating from Europe. And yet, the muni market was largely unchanged for most of the week, before edging very slightly higher in yield on Thursday.
Figure 1. AAA General Obligation Yields
Source: Citi Investment Research and Analysis
Issuance Could be Dampened by Market Volatility
George Friedlander
+1-212-723-4451
Vikram Rai
+1-212-723-1834
Volume for the week was the highest so
far in 2011, at $8.3 billion, according to
preliminary Bond Buyer estimates.
Municipal Market Comment 22 July 2011
Citigroup Global Markets 4
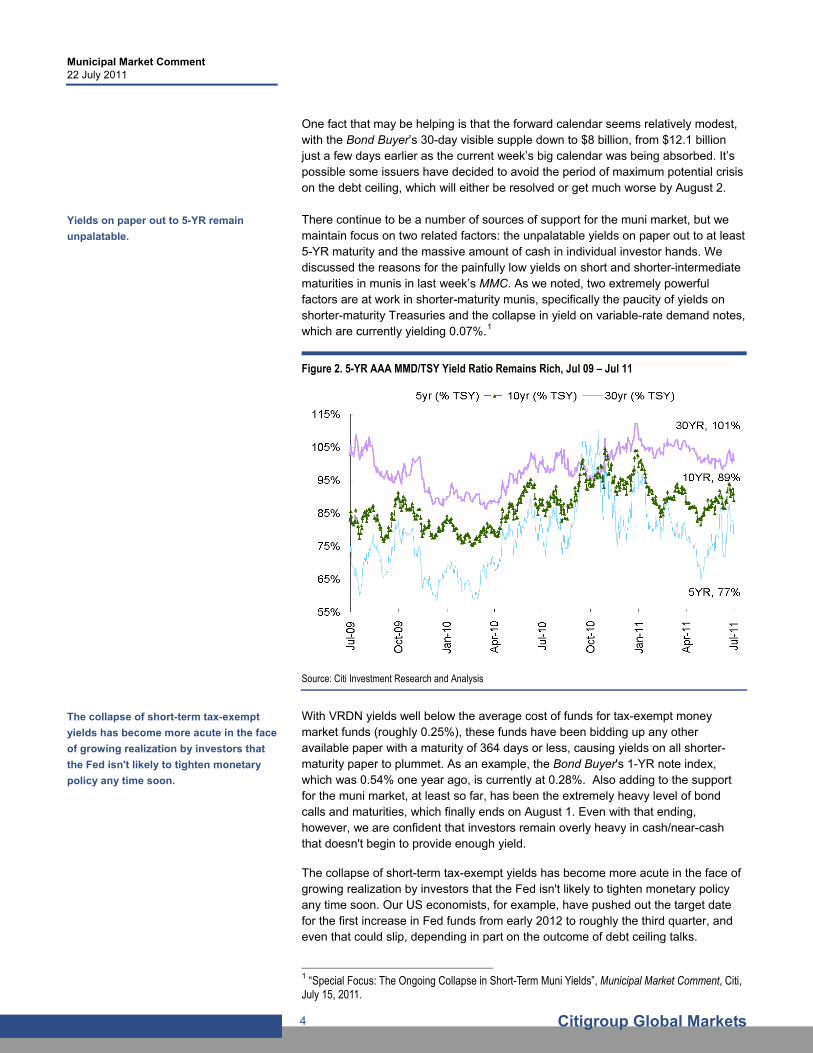
One fact that may be helping is that the forward calendar seems relatively modest, with the Bond Buyer’s 30-day visible supple down to $8 billion, from $12.1 billion just a few days earlier as the current week’s big calendar was being absorbed. It’s possible some issuers have decided to avoid the period of maximum potential crisis on the debt ceiling, which will either be resolved or get much worse by August 2. There continue to be a number of sources of support for the muni market, but we maintain focus on two related factors: the unpalatable yields on paper out to at least 5-YR maturity and the massive amount of cash in individual investor hands. We discussed the reasons for the painfully low yields on short and shorter-intermediate maturities in munis in last week’s MMC. As we noted, two extremely powerful factors are at work in shorter-maturity munis, specifically the paucity of yields on shorter-maturity Treasuries and the collapse in yield on variable-rate demand notes, which are currently yielding 0.07%.1
Figure 2. 5-YR AAA MMD/TSY Yield Ratio Remains Rich, Jul 09 – Jul 11
Source: Citi Investment Research and Analysis
With VRDN yields well below the average cost of funds for tax-exempt money market funds (roughly 0.25%), these funds have been bidding up any other available paper with a maturity of 364 days or less, causing yields on all shorter-maturity paper to plummet. As an example, the Bond Buyer's 1-YR note index, which was 0.54% one year ago, is currently at 0.28%. Also adding to the support for the muni market, at least so far, has been the extremely heavy level of bond calls and maturities, which finally ends on August 1. Even with that ending, however, we are confident that investors remain overly heavy in cash/near-cash that doesn't begin to provide enough yield.
The collapse of short-term tax-exempt yields has become more acute in the face of growing realization by investors that the Fed isn't likely to tighten monetary policy any time soon. Our US economists, for example, have pushed out the target date for the first increase in Fed funds from early 2012 to roughly the third quarter, and even that could slip, depending in part on the outcome of debt ceiling talks.
1 “Special Focus: The Ongoing Collapse in Short-Term Muni Yields”, Municipal Market Comment, Citi, July 15, 2011.
Yields on paper out to 5-YR remain
unpalatable.
The collapse of short-term tax-exempt
yields has become more acute in the face
of growing realization by investors that
the Fed isn't likely to tighten monetary
policy any time soon.

Municipal Market Comment 22 July 2011
Citigroup Global Markets 5
Demand Patterns
Bond fund flows remained slightly positive this week, with long-term funds showing outflows once again. Nevertheless, we are at least a bit optimistic about the results from Lipper/AMG. All weekly reporting funds showed inflows of $123 million for the week ended 7/20, down from $367 million the prior week. Flows in intermediate funds dropped fairly sharply, to $98 million, from $382 million. Long-term funds had outflows of $137 million, down from $157 million the week before. And high-yield funds remained in modestly positive territory, at $97 million, versus $67 million the prior week.
Figure 3. All Muni Bond Fund Flows (Four Week Average), Inching Up Figure 4. Weekly Long Term Muni Bond Flows Remain Dismal
Source: Citi Investment Research and Analysis Source: Citi Investment Research and Analysis
The reasons for our cautious optimism are threefold. First, we believe that fund investors, in particular, were spooked by the ongoing confusion in Washington and by the Euro crises. According to Lipper, both taxable bond funds and equity funds saw a substantial decline in inflows this week versus the prior two weeks. Any settling down of the external crises may lead to better data, we suspect. Second, outflows now appear to be limited largely to one or two fund families. And third, during this week's heavy calendar, funds were among the buyers for a number of the major new deals.
In the meantime, buying by direct retail investors remains solid in three ways. First, the net buys of odd-lots from the MSRB daily feed has declined modestly from recent peaks but remains extremely solid. Second, we continue to see a willingness to do extension swaps out of our least-favored 1-5-YR range into longer, higher-yielding maturities. Finally, bona fide retail orders taken during the retail order periods for this week's heavy new issue calendar saw very solid demand on nearly all deals. Clearly, had direct retail not been active over the past week, the $8.3 billion or so of new issues would have caused a substantial upward adjustment in yields, but that was not the case. And all of this happened in the midst of the twin crises over Greece and the European Union and the still-extant crisis over the need to raise the debt ceiling.
Clearly, had direct retail not been active
over the past week, the $8.3 billion or so
of new issues would have caused a
substantial upward adjustment in yields.

Municipal Market Comment 22 July 2011
Citigroup Global Markets 6
The Debt Ceiling Crisis: Three Distinct Scenarios
Both Standard & Poor's and Moody's have responded aggressively to the ongoing risks and complexities generated by the need to raise the debt ceiling by August 2, give or take a day. On July 13, Moody’s had warned that the United States could lose its Aaa rating if there is a default due to failure to raise the debt ceiling by August 2. (The agency also suggested that it might act before the actual "drop dead" date of August 2, but it is not certain that it would do so.)
On Tuesday, July 19, Moody’s said that five states — Maryland, New Mexico, South Carolina, Tennessee and Virginia, totaling about $24 billion in GO debt outstanding — of the 15 currently rated triple-A were targeted for a potential downgrade due to their fiscally sensitive relationship with the US sovereign credit. “Should the U.S. government’s rating be downgraded to Aa1 or lower, these five states’ ratings would likely be downgraded as well,” Moody’s said.
A Moody's analyst was quoted in the Bond Buyer as saying that the risk factors tying these five states, in particular, to the federal triple-A are macroeconomic sensitivity, capital markets reliance and dependence on federal revenues. The agency, however, noted that these five states remain strong credits, as a result of financial resources available to counteract those risks.
In our view, however, Standard & Poor's has taken a more aggressive and comprehensive approach to this particular crisis because:
1. S&P has made it clear that there is a substantial risk of a downgrade of US Treasury debt even if a debt ceiling deal is reached, if that deal does not incorporate a substantial down payment toward reducing the size of the US's current and projected annual deficit.
The agency parsed the outlook for US Treasury debt into three distinct sets of potential outcomes:
A worst case, under which Congress does not reach a deal to raise the debt ceiling by August 2;
An intermediate case, under which there is an agreement to raise the debt ceiling on a timely basis but no substantial progress made to put an agreement in place to cut future deficits through a combination of spending cuts and revenue increases; and
A better case, under which substantial progress is made toward reducing future deficits. Earlier S&P reports explicitly put the magnitude of cuts needed to achieve this best case at $4 trillion over 10 years, but the most recent reports simply spoke about the need for the administration and Congress to achieve an agreement to raise the debt ceiling and successfully collaborate on a long-term framework for fiscal consolidation.
Only under this third scenario, according to the agency, would the triple-A rating of Treasury and related debt be confirmed. Under the first scenario, Treasury soon misses a payment, resulting in an SD (Selective Default) rating, followed by a confirmation in the double-A range once the ceiling is raised and debt repayment restarts. Under the second scenario, the rating would be lowered to the double-A range, but the timing is more uncertain.
Moody’s has also suggested that it might
act before the actual "drop dead" date of
August 2.
In the worst case scenario, the Treasury
misses a payment, resulting in an SD
(Selective Default) rating, followed by a
confirmation in the double-A range once
the ceiling is raised and debt repayment
restarts.

Municipal Market Comment 22 July 2011
Citigroup Global Markets 7
2. S&P has parsed the outcome for a wide range of capital market credits under the three potential scenarios. For the municipal bond market in particular, S&P published a special report, titled "Where U.S. Public Finance Ratings Could Head in the Wake of the Federal Fiscal Crisis."2 While the report is far too detailed to summarize comprehensively here, we believe that it is important to make a few observations. These include the following:
The better case scenario, under which Congress and the administration get serious about the need to sharply reduce the size of projected annual deficits, is not uniformly good news for municipal issuers in terms of the ratings outlook, even though only under this scenario would the US debt rating be confirmed at triple-A. This outcome could, ironically, be the most negative for the ratings of some public finance issuers over the near term because of the potential sharp cut in outlays that affect their operations. The agency notes, however, that impact differs depending upon which outlays are cut (Social Security versus Medicare versus military). Nevertheless, after having publicly embraced this scenario, the agency concedes that it could slow growth for years to come, causing lower ratings in some sectors to occur over time.
Under the intermediate case, the rating implications for state and local issuers over the near-term appear to not be as severe as under the "better case," even though under this case, according to the agency, the rating on US debt is very likely to be downgraded to the double-A range.
S&P is more emphatic about the negative implications of the worst case, under which no agreement is reached by August 2 and the Treasury misses payments on some of its debt. According to the Agency, the Treasury soon misses a payment and rating goes to SD (Selective Default). World credit markets seize up, and equity markets fall sharply. When the credit markets reopen, interest rates are significantly higher. The dollar loses 10% or more of its value. When the debt payment recommences in full, the US ratings drop to AA/A-1+/negative outlook. Investors seek new, risk-free alternatives (including possibly some munis). Under this scenario, there would be many state downgrades and, at the local level, concerns about variable-rate demand notes and more questions about ability to pay.
S&P notes that, in many sectors, under all three scenarios, ratings would have to be examined on a case-by-case basis. However, one pattern stands out in looking at the Agency’s views on implications of all three scenarios: The sectors that appear to be in the least jeopardy for rating reductions are essential service utility revenue bonds and important stand-alone transportation facilities.
The bottom line is that, with the series of reports published in conjunction with its examination of the debt ceiling crisis, S&P has begun to articulate a view that the federal/state/local "compact" is under pressure, regardless of how the federal government begins to deal with the challenges created by massive projected federal deficits, with credit implications for many issuers on a case-by-case basis as a consequence.
2 “Where U.S. Public Finance Ratings Could Head In The Wake Of The Federal Fiscal Crisis”, Steven J Murphy et. al., Standard & Poor’s, July 21, 2011.
The better case scenario could ironically,
be the most negative for the ratings of
some public finance issuers over the
near term.
S&P notes that, in many sectors, under
all three scenarios, ratings would have to
be examined on a case-by-case basis.

Municipal Market Comment 22 July 2011
Citigroup Global Markets 8
Deficit Reduction Could Curtail New Tax-Exempt Issuance
It is important to begin our discussion of this topic by stressing that absolutely nothing is being considered by Congress or the administration as part of deficit reduction that would eliminate or curtail the tax-exempt status of interest on state and local bonds that were initially issued as tax-exempt. Indeed, the scenario we will be describing below substantially strengthens the case for purchasing longer-maturity tax-exempt bonds, including but not limited to the two sectors noted above — essential service utilities and strong stand-alone transportation facilities.
Having said that, we believe that it is important to note that, in our view, the tax-exempt status for some or all newly issued municipal bonds, after some future date, is in the most jeopardy than it has been since the 1986 tax reform bill, which curtailed a number of types of issuance and made other types of new issues subject to the Alternative Minimum Tax for the first time. The reason for our concern about the tax exemption stems from several sources.
First, the "Gang of Six" plan to reduce the deficit had significant bipartisan support, even though we do not expect it to be enacted for a variety of reasons, including the artificial nature of some of its assumptions regarding tax cuts. This plan was modeled in large part on the Bowles-Simpson plan developed by The National Commission on Fiscal Responsibility and Reform.3 Under this plan, all newly issued state and local debt would come as taxable bonds, but without the subsidy provided for Build America Bonds issued in 2009-2010 as part of the stimulus bill. The elimination of this tax exemption would, in effect, be a source of revenue under the Commission’s deficit reduction package.
Second, while there is no certainty that future deficit reduction plans will incorporate this philosophy, there are reasons to believe that they could. These include a number of myths regarding the benefits and costs of allowing municipal bonds to be issued in tax-exempt form, which we discuss below.
Third, in our view, far too little attention is being paid or is likely to be paid to the fact that the federal, state and local governments must act as a team in order to provide governmental services in a cost-effective manner that provides the capacity for the US to continue to compete effectively with the rest of the world. In other words, in our view, there is a risk that federal spending cuts that merely move a number of governmental responsibilities to the state and local level will be mistakenly viewed as bona fide deficit reduction, rather than a reorganization of responsibilities — often to lower levels of government that lack the capacity to meet these responsibilities in a vacuum.
3 “The Moment of Truth”, The National Commission on Fiscal Responsibility and Reform, December 2010. The full document is available here in PDF form.
The curtailment of new tax-exempt
issuance strengthens the case for
purchasing longer-maturity tax-exempt
bonds, including essential service
utilities and strong stand-alone
transportation facilities.

Municipal Market Comment 22 July 2011
Citigroup Global Markets 9
Introduction
Regardless of the outcome of the debt ceiling deficit reduction battle, we believe that at least four factors related to state and local governments have become clear:
1. Deficit reduction will get done, eventually. In our view, there is a real risk that, when it finally gets done, it will incorporate changes in federal spending patterns that do not fully incorporate or appreciate the impact at the state and local level. In other words, there is a risk that a cut in spending at the federal level that result in the need to increase spending at the state or local level will still be considered a "victory" in the fight to reduce federal spending. Of course, in a policy-driven process, any decisions on reductions in spending will incorporate the question as to a) what other level of government, if any, will have to pick up that spending and b) if that other level of government is fully equipped to take on the new responsibility.
2. A number of the larger deficit reduction proposals, such as the Bowles-Simpson Report, recommended that all new municipal debt, after some future date, be issued on an unsubsidized taxable basis. In our view, there is a real risk that at least some portion of this recommendation gets incorporated into any major new deficit reduction plan.
3. As a result of the first factor, there is a real risk that access to tax-exempt financing is not sufficiently prioritized by state and local officials, who find themselves fighting a rear-guard action on many fronts as federal spending cuts continue.
4. There are a large number of members of Congress, in both houses and on both sides of the aisle, who may not fully appreciate the merits and importance of tax-exempt financing (or another form of subsidy, such as Build America Bonds) for state and local issuers.
Given these factors, we will be incorporating discussion of related issues from time to time as a "Special Focus" within the Municipal Market Comment. We have addressed some of these issues in the past on a limited basis4, but given the oncoming train of deficit reduction, we feel that many of these related issues ought to be addressed in a more focused and organized fashion. Expect additional "Special Focus" discussions on this topic in future MMCs.
In this installment, we begin the process of addressing a number of beliefs among decision-makers related to state and local financing that we believe to reflect myths, rather than the realities, of state and local financing.
Myth #1: The muni market provides an inefficient subsidy
This apparently widespread belief is based, in our view, upon two key factors. First, it ignores the value of the capital market as a sort and selection mechanism for needed state and local projects. Simply by tapping into this sort and selection mechanism, the municipal bond market provides a level of efficiency that is (in our view) rarely reached via funding activities that involve direct federal spending. In the
4 “Special Note: The Market for State and Local Borrowing Needs to be Enhanced, Not Eliminated”, Citi, George Friedlander, 13th April.
Special Focus: Myths That Magnify the Threat to Tax Exemption for Newly Issued Bonds

Municipal Market Comment 22 July 2011
Citigroup Global Markets 10
capital market case, state and local governments chose projects that make sense while recognizing that debt issued for these projects will have to be repaid. In the direct subsidy case, governments will often accept the subsidy simply because it is available, without adequately prioritizing the need for the project.
The second, and perhaps more important factor is that estimates of the revenue loss associated with permitting investors to invest on a tax-exempt basis has historically been dramatically overstated. This issue was addressed in some detail in a recent article, “Portfolio Substitutions and the Revenue Cost of the Federal Income Tax Exemption for State and Local Government Bonds.” The authors note:
"Our results demonstrate that estimates of the revenue gain from eliminating the income tax exemption for interest paid by state and local governments are sensitive to assumptions about how taxable investors would adjust their portfolios in response to this change. If high-tax-bracket individual taxpayers shun bonds issued by state and local governments when the interest on those bonds is taxable, and if they invest instead in lightly-taxed assets such as low-yield corporate equities, the revenue gain from curtailing the exemption is likely to be substantially smaller than if these investors continue to hold state and local government bonds even after the interest becomes taxable."5
In other words, because the investors in tax-exempts tend to have access to other relatively tax-efficient investments, estimates of the loss of revenues resulting from the tax exemption tend to be greatly overestimated.
Myth #2: Taxable tax credit bonds could effectively replace tax-exempt bonds as a form of support for state and local issuers.
We admit to being puzzled as to why this so-called "alternative" to tax exemption continues to receive so much support among certain members of Congress. As we have discussed in the past, this mechanism simply does not work as a cost-effective form of subsidy. In 2009-2010, when issuers were given the choice of using direct-pay Build America Bonds or Tax Credit Bonds with the same level of federal subsidy, they all utilized BABs, at a far lower cost of funding than could be provided by tax credit bonds.
Myth #3: Subsidies for state and local issuance are dangerous because low borrowing costs lead issuers to "overspend."
In our view, there are a number of misperceptions incorporated into this "myth." First, long-term subsidized financing — either tax-exempts or BABs — is rarely used for budgetary purposes, as opposed to capital projects. Second, in the current era, when spending on big public works no longer has political support, state and local governments tend to be far more cautious about undertaking new projects, regardless of cost. This is a large part of the reason why year-to-date issuance is down nearly 44%, for example.
Myth #4: Taxable Build America Bonds could never provide an efficient subsidy for state and local projects
5 “Portfolio Substitution and the Revenue Cost of the Federal Income Tax Exemption for State and Local Government Bonds”, James M. Poterba and Auturo Ramirez Verdugo, National Tax Journal, June 2011. The full text is available here.

Municipal Market Comment 22 July 2011
Citigroup Global Markets 11
because the buyers of taxable munis are primarily non-taxed entities.
We have heard this from a number of muni market participants, but we argue it's wrong. Revenue that can be used to offset the cost of the BAB subsidy comes from the reduction in tax-exempt issuance, plus a modest amount from ownership of BABs by low-taxed institutions, such as life insurance companies (and property and casualty companies). In our view, the most efficient way to fund state and local projects is through a combination of tax-exempt bonds and moderate-subsidy BABs, as the administration has proposed.
Myth #5: Funding for state and local projects is ample, whether they are subsidized or not.
In our view, this is an assumption that is fraught with danger, particularly as federal spending declines under deficit reduction. The United States, which historically had a strong global advantage as a result of its high-quality infrastructure, has now fallen to 23rd in the world in the quality of its infrastructure, according to a report by McKinsey and Company,6 from seventh only a decade ago. Without access to sources of low-cost funding, large portions of the US will fall further and further behind in terms of the projects needed to replenish our aging infrastructure stock.
Myth #6: Anything that can be done to reduce the federal deficit will ultimately auger to the benefit of state and local governments as well.
This, in our view, is a particularly important concern, noted in the introduction to this section. In our view, any attempts at major federal deficit reduction must take into concern the impact at other levels of government and the capacity of these governments to take on added responsibilities. The willingness of authors of major studies on deficit reduction to simply jettison low-cost financing for state and local governments reinforces the danger of such "federal-centric" thinking, in our view.
6 “Growth and renewal in the United States: Retooling America’s economic engine”, James Manyika et. al, McKinsey Global Institute, February 2011. The report is available here in PDF form.

Municipal Market Comment 22 July 2011
Citigroup Global Markets 12
The 2011 trend has resumed, with BABs yet again outperforming. Their spreads were 2bp tighter on the week, compared to corporates, which were flat, and MCDX, which widened by 3bp (Figure 5). Currently, Build America Bonds are trading 3bp through the long-dated industrials, one of the lowest spread differentials between the two sectors over the last year.
This asset class continues to be very strongly supported by the improving GO fundamentals and positive technicals. As discussed in our previous weekly, going forward, some of the better-quality BABs (education, revenue bonds and even some GOs) could generate investor interest as a result of the flight to safety in the aftermath of the possible US downgrade. We think that MCDS/MCDX is probably more attractive than cash, given its wider spreads and the overhang of the Lehman unwind, but it is also more technical and susceptible to market shocks. Meanwhile, BABs are more defensive and less volatile.
Figure 5. BABs versus Long-Dated Industrials, Jul 10-Jul 11 Figure 6. BAB Triple-As versus MMD 30-YR, Jul 10-Jul 11
115
145
175
205
Jul-10 Sep-10 Nov-10 Jan-11 Mar-11 May-11 Jul-11
Spr
ead
to T
reas
urie
s
BABs Corp
3.0
3.5
4.0
4.5
5.0
5.5
6.0
6.5
Jul-10 Sep-10 Nov-10 Jan-11 Mar-11 May-11 Jul-11
%
60
160
260
360
460
560
bps
AAA Spread (RHS)AAA BABS Yield (LHS)30yr MMD Yield (LHS)
Source: Citi Investment Research and Analysis Source: Citi Investment Research and Analysis, Muni Market Data Line
Crossover Investors Not Running for an Exit
Munis are one of the best-performing asset classes this year, which could be a blessing and a curse at the same time. Why, one would ask? Crossover investors played an extremely important role in 2010-2011, helping to stabilize the market. At that time, municipals was the only asset class in distress, attracting attention of opportunistic buyers and providing for a good entry point to put money to work. It is pretty hard to estimate how much money non-traditional fixed-income investors have dedicated to munis, but it was a pretty big number. The muni market share of the crossover investors is much larger, compared to any time period prior to 2011.
However, now the tables have turned: Munis perform well, while other asset classes are under pressure, and it is only natural to ask if crossover investors will start exiting the muni space any time soon, putting pressure on the market. Below, we will try to briefly outline our views on this important subject.
Quantitative Municipal Strategies
Mikhail Foux
+1-212-723-9353
Vikram Rai
+1-212-723-1834

Municipal Market Comment 22 July 2011
Citigroup Global Markets 13
Figure 7. IG Muni Corporates Minus Corporates, Jun 10-Jul 11 Figure 8. IG/HY Fund Flows, Jun 10-Jul 11
-60
-30
0
30
60
Jun-10 Sep-10 Dec-10 Mar-11 Jun-11
Sp
rea
d (
bp
)
-4
-3
-2
-1
0
1
2
3
Jun-10 Aug-10 Nov-10 Feb-11 May-11
Inflo
ws
(bln
)
HY Flows (Weekly) IG Flows (Weekly)
Source: Citi Investment Research and Analysis Source: AMG
To correctly approach this question, one should break down the universe of crossover investors into several groups. The high-grade investors were the ones investing in Build America Bonds and, earlier this year, into attractively priced tax-exempts. As discussed earlier in this publication, there is no reason for high grade investors to sell, since BABs/tax-exempts provide them with the needed diversification and duration; and are still attractively priced versus corporates (Figure 5, Figure 7). Meanwhile, the high-grade corporate investors continue to benefit from large fund inflows (Figure 8) and a relatively low corporate supply, which make them cash-rich.
Meanwhile for high-yield crossover investors, the situation is somewhat different: First there were large outflows out of HY funds over the last several months (Figure 8); second, contrary to the IG market, HY munis are much less attractive to HY corporates (Figure 9). As a result, we would not be surprised to see the high yield crossover investors angling for the exit.
Lastly, hedge fund and derivatives investors should still find enough value in MCDX/MCDS compared to the US high-grade corporates, The overhang of the Lehman unwind is a 600-pound gorilla in the room, which should keep municipal protection spreads in check.
To summarize, we do not think that we would see any meaningful selling of munis by derivatives and high-grade cash investors. However, some profit taking by high-yield crossover investors is already under way and we could see more of it going forward.
Also, in light of the correlated effect of the US debt downgrade on the municipal market, we recommend staying overweight high-grade taxable university bonds versus Treasuries and overweight high-quality revenue bonds versus Treasuries.7
7 For further details, please see our piece, US Debt Downgrade: Parsing the Impact on Municipals, Citi, July 20, 2011

Municipal Market Comment 22 July 2011
Citigroup Global Markets 14
Figure 9. HY Corporates Versus Munis , Jun 10-Jul 11 Figure 10. MCDX versus CDX, Jun 10-Jul 11
5
6
7
8
9
10
Jun-10 Sep-10 Dec-10 Mar-11 Jun-11
Yie
lds
(%)
HY Corp. Tobacco BB/BBBHospitals BBB
0
75
150
225
300
Jun-10 Sep-10 Dec-10 Mar-11 Jun-11
Spr
ead
(bps
)
MCDX CDX IG Diff.
Source: Citi Investment Research and Analysis Source: Bloomberg
Recommend 10-20-YR BABs
Benchmark bond spreads can sometimes be deceiving. Given the current UST 10s-30s curve (Figure 11), which is near the steepest point this year, if a 20-YR credit bond is quoted off the 30-YR benchmark, its spread looks rich, compared to other longer-dated bonds. The better way to compare bonds is their OAS, which is a much more objective measure, taking into account the whole Treasury curve.
From this point of view, the medium term BABs (with the average life of 10-YR-20-YR), start to look very interesting – many credit curves are inverted (Figure 12). Also keep in mind that investors typically look at the stated maturity of BABs, forgetting about the sinking funds, which dramatically shorten the average life for a number of bonds that have them. As bond maturities start getting closer to the 10-YR point, the bonds will start trading off this benchmark, making their spread very attractive. To get in front of this trend and take advantage of the inverted credit curves, we think that investors should be buying Build America Bonds in the belly of the curve either outright or by switching out of the long-dated instruments.
Figure 11. UST 10s30s Slope, Jan 11-Jul 11 Figure 12. BABs 1030s Slope
2.5
3
3.5
4
4.5
5
Jan-11 Feb-11 Mar-11 Apr-11 May-11 Jun-11 Jul-11
Yie
ld (
%)
1
1.1
1.2
1.3
1.4
Diff
. (%
)
10yr 30yr Diff.
Source: Bloomberg Source: Citi Investment Research and Analysis

Municipal Market Comment 22 July 2011
Citigroup Global Markets 15
The US Municipal Strategy Portfolio year-to-date return is down 0.55% versus last week.8 Figure 13 describes the performance of all current outstanding trades, including newly initiated recommendations, followed by a discussion of each recommendation. All closed trades are listed in the Appendix.
Figure 13. US Municipals Strategy Portfolio Performance
Source: Citi Investment Research and Analysis Note: Past performance is not a guarantee of future results. Returns are gross of management and transaction fees.
MMD Rate and Curves
Initiate 5s30s AAA MMD Flatteners
Opened: April 21, 2011; Horizon: 3 months
8 Please note that this portfolio is just a tracker for trades recommended by our team, not a generic “model” portfolio recommended for our clients.
US Municipals Strategy Portfolio
Vikram Rai
+1-212-723-1834

Municipal Market Comment 22 July 2011
Citigroup Global Markets 16
Target: 25bp; Stop Loss: 20bp
Entry level: 308bp (30-YR MMD @ 4.72% and 5-YR MMD @ 1.64%)
We recommend initiating 5s30s AAA MMD flatteners9 as we believed that going into the second half of the year, the 30-YR MMD rate would remain well bid relative to the 5-YR MMD rate, which looked slightly rich. Also, the 5s30s MMD curve was at the highs of its two-year trading range, and we expected a corrective reversal going forward. The trade is down 8bp.
Initiate 10s30s AAA MMD Flatteners (Rate Locks versus Cash)
Opened: May 9, 2011; Horizon: 3 months
Target: 25bp; Stop Loss: 20bp
Entry level: 153bp (30-YR MMD @ 4.45% and 3M 10-YR Rate Lock @ 2.92%)
We recommend initiating 10s30s AAA MMD flatteners10 as we believed that going into the second half of the year, the 30-YR MMD rate would remain well bid relative to the 10-YR MMD rate and the rate lock versus cash combination would provide some positive carry as well. The trade is currently up 7bp.
Buy 1-YR Pre-Res versus 12-Month T-Bill
Opened: February 25, 2011; Horizon: 1 year
Target: 10bp; Stop Loss: 10bp
Entry level: 12bp (pre-res @ 35bp and 12-month T-bill @ 23bp)
At the time of the recommendation, we felt that taxable investors and crossover buyers, who have the flexibility to choose between comparable investments in the high-grade securities, might find it worthwhile to switch out of 12-month T-bills into 1-YR pre-refunded bonds. The trade is even more compelling for tax-exempt investors who invest in T-bills, given that the tax-equivalent yield for 1-YR Pre-Res is around 53bp. The trade is up 8bp to date.
Derivatives
Initiate MCDX Steepener Rolldown Trades
Opened: April 29, 2011; Horizon: 6 months
Target: 20bp; Stop Loss: 10bp
Entry level: 51bp (MCDX14 5-YR at 114bp, MCXD16 10-YR at 165bp)
We recommend selling protection on MCDX14 5-YR at 114bp, versus buying MCXD16 10-YR at 165bp. To execute this trade in a duration-neutral fashion, one needs to sell $15 million of MCDX14, versus buying $10 million of MCDX16. With the passage of time, MCDX14 spreads will tighten much faster compared to MCDX16 as it rolls down the very steep front end of the MCDX curve. Investors also benefit from a slight positive carry. This trade is currently up 7bp.
Initiate 5s10s MCDX Steepeners
Opened: June 10, 2011; Horizon: 3 months
9 “Initiate 5s30s AAA MMD Flatteners”, Citi, April 21, 2011. 10 “Initiate 10s30s AAA MMD Flatteners”, Citi, May 9, 2011.

Municipal Market Comment 22 July 2011
Citigroup Global Markets 17
Target: 15bp; Stop Loss: 10bp
Entry level: 20bp (MCDX16 5-YR at 133bp, MCDX16 10-YR at 153bp)
At the time of the trade, MCDX and single-name MCDS had rallied due to a combination of improving technicals and supportive fundamentals. MCDX 10-YR had been outperforming, and the 5s10s curve was the flattest since 2010. Meanwhile, the CDX IG curve was very steep. Thus, we recommended executing DV01-weighted curve steepeners. The trade had only a marginal downside and should benefit from a positive carry and an attractive roll-down. The trade is currently up 12bp.
Pay 10YR SIFMA Libor Ratio
Opened: June 17, 2011; Horizon: 3 months
Target: 3%; Stop Loss: 2%
Entry level: 81.75%
The SIFMA Libor ratio typically compresses in high rate environments and increases as rates rally. However, at the time of the trade, ratios had declined along with rates in the past few months, which conflicted with historical patterns. We felt the yield ratio had some room to increase as the municipal market returned to more normal circumstances over the next few months and benchmark rates remained low. The trade is flat so far.
Buy 10Y CDS on the high-beta GOs against 10Y MCDX
Opened: July 8, 2011; Horizon: 3 months
Target: 15bp; Stop Loss: 10bp
Entry level: -15bp
At the time of the trade, the spread differential between the high-beta GOs and MCDX/medium-beta was at the lowest point this year. Hence, we recommended buying protection on the high-beta credits against either MCDX and/or a basket of the medium-beta GOs. The trade is up 5bp so far.
Trades Opened Since Last Publication
None.
Trades Closed Since Last Publication
None.
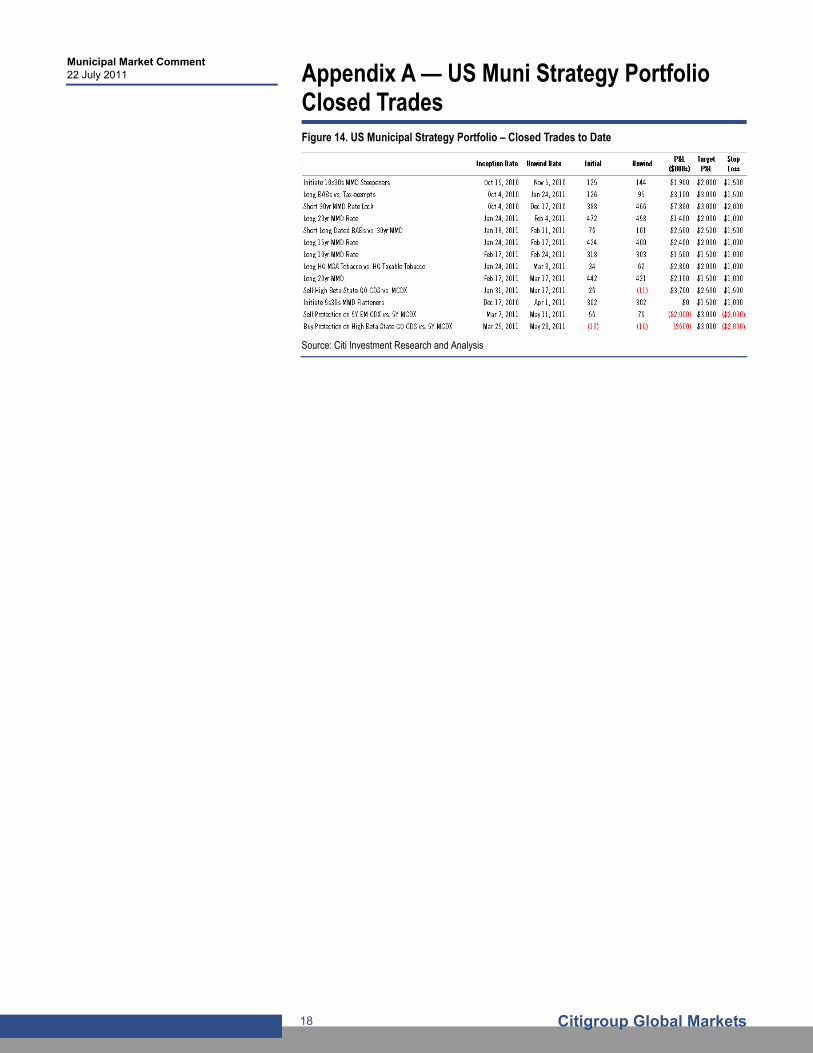
Municipal Market Comment 22 July 2011
Citigroup Global Markets 18
Figure 14. US Municipal Strategy Portfolio – Closed Trades to Date
Source: Citi Investment Research and Analysis
Appendix A — US Muni Strategy Portfolio Closed Trades

Municipal Market Comment 22 July 2011
Citigroup Global Markets 19
Appendix A-1 Analyst Certification
The research analyst(s) primarily responsible for the preparation and content of this research report are named in bold text in the author block at the front of the product except for those sections where an analyst's name appears in bold alongside content which is attributable to that analyst. Each of these analyst(s) certify, with respect to the section(s) of the report for which they are responsible, that the views expressed therein accurately reflect their personal views about each issuer and security referenced and were prepared in an independent manner, including with respect to Citigroup Global Markets Inc and its affiliates. No part of the research analyst's compensation was, is, or will be, directly or indirectly, related to the specific recommendation(s) or view(s) expressed by that research analyst in this report.
IMPORTANT DISCLOSURES
Analysts' compensation is determined based upon activities and services intended to benefit the investor clients of Citigroup Global Markets Inc. and its affiliates ("the Firm"). Like all Firm employees, analysts receive compensation that is impacted by overall firm profitability which includes investment banking revenues.
For important disclosures (including copies of historical disclosures) regarding the companies that are the subject of this Citi Investment Research & Analysis product ("the Product"), please contact Citi Investment Research & Analysis, 388 Greenwich Street, 28th Floor, New York, NY, 10013, Attention: Legal/Compliance. In addition, the same important disclosures, with the exception of the Valuation and Risk assessments and historical disclosures, are contained on the Firm's disclosure website at www.citigroupgeo.com. Valuation and Risk assessments can be found in the text of the most recent research note/report regarding the subject company. Historical disclosures (for up to the past three years) will be provided upon request.
NON-US RESEARCH ANALYST DISCLOSURES Non-US research analysts who have prepared this report (i.e., all research analysts listed below other than those identified as employed by Citigroup Global Markets Inc.) are not registered/qualified as research analysts with FINRA. Such research analysts may not be associated persons of the member organization and therefore may not be subject to the NYSE Rule 472 and NASD Rule 2711 restrictions on communications with a subject company, public appearances and trading securities held by a research analyst account. The legal entities employing the authors of this report are listed below:
Citigroup Global Markets Inc George Friedlander; Mikhail Foux; Vikram Rai
OTHER DISCLOSURES
For securities recommended in the Product in which the Firm is not a market maker, the Firm is a liquidity provider in the issuers' financial instruments and may act as principal in connection with such transactions. The Firm is a regular issuer of traded financial instruments linked to securities that may have been recommended in the Product. The Firm regularly trades in the securities of the issuer(s) discussed in the Product. The Firm may engage in securities transactions in a manner inconsistent with the Product and, with respect to securities covered by the Product, will buy or sell from customers on a principal basis.
Securities recommended, offered, or sold by the Firm: (i) are not insured by the Federal Deposit Insurance Corporation; (ii) are not deposits or other obligations of any insured depository institution (including Citibank); and (iii) are subject to investment risks, including the possible loss of the principal amount invested. Although information has been obtained from and is based upon sources that the Firm believes to be reliable, we do not guarantee its accuracy and it may be incomplete and condensed. Note, however, that the Firm has taken all reasonable steps to determine the accuracy and completeness of the disclosures made in the Important Disclosures section of the Product. The Firm's research department has received assistance from the subject company(ies) referred to in this Product including, but not limited to, discussions with management of the subject company(ies). Firm policy prohibits research analysts from sending draft research to subject companies. However, it should be presumed that the author of the Product has had discussions with the subject company to ensure factual accuracy prior to publication. All opinions, projections and estimates constitute the judgment of the author as of the date of the Product and these, plus any other information contained in the Product, are subject to change without notice. Prices and availability of financial instruments also are subject to change without notice. Notwithstanding other departments within the Firm advising the companies discussed in this Product, information obtained in such role is not used in the preparation of the Product. Although Citi Investment Research & Analysis (CIRA) does not set a predetermined frequency for publication, if the Product is a fundamental research report, it is the intention of CIRA to provide research coverage of the/those issuer(s) mentioned therein, including in response to news affecting this issuer, subject to applicable quiet periods and capacity constraints. The Product is for informational purposes only and is not intended as an offer or solicitation for the purchase or sale of a security. Any decision to purchase securities mentioned in the Product must take into account existing public information on such security or any registered prospectus.
Investing in non-U.S. securities, including ADRs, may entail certain risks. The securities of non-U.S. issuers may not be registered with, nor be subject to the reporting requirements of the U.S. Securities and Exchange Commission. There may be limited information available on foreign securities. Foreign companies are generally not subject to uniform audit and reporting standards, practices and requirements comparable to those in the U.S. Securities of some foreign companies may be less liquid and their prices more volatile than securities of comparable U.S. companies. In addition, exchange rate movements may have an adverse effect on the value of an investment in a foreign stock and its corresponding dividend payment for U.S. investors. Net dividends to ADR investors are estimated, using withholding tax rates conventions, deemed accurate, but investors are urged to consult their tax advisor for exact dividend computations. Investors who have received the Product from the Firm may be prohibited in certain states or other jurisdictions from purchasing securities mentioned in the Product from the Firm. Please ask your Financial Consultant for additional details. Citigroup Global Markets Inc. takes responsibility for the Product in the United States. Any orders by US investors resulting from the information contained in the Product may be placed only through Citigroup Global Markets Inc.
Important Disclosures for Morgan Stanley Smith Barney LLC Customers: Morgan Stanley & Co. Incorporated (Morgan Stanley) research reports may be available about the companies that are the subject of this Citi Investment Research & Analysis (CIRA) research report. Ask your Financial Advisor or use smithbarney.com to view any available Morgan Stanley research reports in addition to CIRA research reports.

Municipal Market Comment 22 July 2011
Citigroup Global Markets 20
Important disclosure regarding the relationship between the companies that are the subject of this CIRA research report and Morgan Stanley Smith Barney LLC and its affiliates are available at the Morgan Stanley Smith Barney disclosure website at www.morganstanleysmithbarney.com/researchdisclosures. The required disclosures provided by Morgan Stanley and Citigroup Global Markets, Inc. on Morgan Stanley and CIRA research relate in part to the separate businesses of Citigroup Global Markets, Inc. and Morgan Stanley that now form Morgan Stanley Smith Barney LLC, rather than to Morgan Stanley Smith Barney LLC in its entirety. For Morgan Stanley and Citigroup Global Markets, Inc. specific disclosures, you may refer to www.morganstanley.com/researchdisclosures and https://www.citigroupgeo.com/geopublic/Disclosures/index_a.html. This CIRA research report has been reviewed and approved on behalf of Morgan Stanley Smith Barney LLC. This review and approval was conducted by the same person who reviewed this research report on behalf of CIRA. This could create a conflict of interest.
The Citigroup legal entity that takes responsibility for the production of the Product is the legal entity which the first named author is employed by. The Product is made available in Australia through Citigroup Global Markets Australia Pty Ltd. (ABN 64 003 114 832 and AFSL No. 240992), participant of the ASX Group and regulated by the Australian Securities & Investments Commission. Citigroup Centre, 2 Park Street, Sydney, NSW 2000. The Product is made available in Australia to Private Banking wholesale clients through Citigroup Pty Limited (ABN 88 004 325 080 and AFSL 238098). Citigroup Pty Limited provides all financial product advice to Australian Private Banking wholesale clients through bankers and relationship managers. If there is any doubt about the suitability of investments held in Citigroup Private Bank accounts, investors should contact the Citigroup Private Bank in Australia. Citigroup companies may compensate affiliates and their representatives for providing products and services to clients. The Product is made available in Brazil by Citigroup Global Markets Brasil - CCTVM SA, which is regulated by CVM - Comissão de Valores Mobiliários, BACEN - Brazilian Central Bank, APIMEC - Associação dos Analistas e Profissionais de Investimento do Mercado de Capitais and ANBID - Associação Nacional dos Bancos de Investimento. Av. Paulista, 1111 - 11º andar - CEP. 01311920 - São Paulo - SP. If the Product is being made available in certain provinces of Canada by Citigroup Global Markets (Canada) Inc. ("CGM Canada"), CGM Canada has approved the Product. Citigroup Place, 123 Front Street West, Suite 1100, Toronto, Ontario M5J 2M3. This product is available in Chile through Banchile Corredores de Bolsa S.A., an indirect subsidiary of Citigroup Inc., which is regulated by the Superintendencia de Valores y Seguros. Agustinas 975, piso 2, Santiago, Chile. The Product is made available in France by Citigroup Global Markets Limited, which is authorised and regulated by Financial Services Authority. 1-5 Rue Paul Cézanne, 8ème, Paris, France. The Product is distributed in Germany by Citigroup Global Markets Deutschland AG ("CGMD"), which is regulated by Bundesanstalt fuer Finanzdienstleistungsaufsicht (BaFin). CGMD, Reuterweg 16, 60323 Frankfurt am Main. If the Product is made available in Hong Kong by, or on behalf of, Citigroup Global Markets Asia Ltd., it is attributable to Citigroup Global Markets Asia Ltd., Citibank Tower, Citibank Plaza, 3 Garden Road, Hong Kong. Citigroup Global Markets Asia Ltd. is regulated by Hong Kong Securities and Futures Commission. If the Product is made available in Hong Kong by The Citigroup Private Bank to its clients, it is attributable to Citibank N.A., Citibank Tower, Citibank Plaza, 3 Garden Road, Hong Kong. The Citigroup Private Bank and Citibank N.A. is regulated by the Hong Kong Monetary Authority. The Product is made available in India by Citigroup Global Markets India Private Limited, which is regulated by Securities and Exchange Board of India. Bakhtawar, Nariman Point, Mumbai 400-021. The Product is made available in Indonesia through PT Citigroup Securities Indonesia. 5/F, Citibank Tower, Bapindo Plaza, Jl. Jend. Sudirman Kav. 54-55, Jakarta 12190. Neither this Product nor any copy hereof may be distributed in Indonesia or to any Indonesian citizens wherever they are domiciled or to Indonesian residents except in compliance with applicable capital market laws and regulations. This Product is not an offer of securities in Indonesia. The securities referred to in this Product have not been registered with the Capital Market and Financial Institutions Supervisory Agency (BAPEPAM-LK) pursuant to relevant capital market laws and regulations, and may not be offered or sold within the territory of the Republic of Indonesia or to Indonesian citizens through a public offering or in circumstances which constitute an offer within the meaning of the Indonesian capital market laws and regulations. The Product is made available in Israel through Citibank NA, regulated by the Bank of Israel and the Israeli Securities Authority. Citibank, N.A, Platinum Building, 21 Ha'arba'ah St, Tel Aviv, Israel. The Product is made available in Italy by Citigroup Global Markets Limited, which is authorised and regulated by Financial Services Authority. Foro Buonaparte 16, Milan, 20121, Italy. The Product is made available in Japan by Citigroup Global Markets Japan Inc. ("CGMJ"), which is regulated by Financial Services Agency, Securities and Exchange Surveillance Commission, Japan Securities Dealers Association, Tokyo Stock Exchange and Osaka Securities Exchange. Shin-Marunouchi Building, 1-5-1 Marunouchi, Chiyoda-ku, Tokyo 100-6520 Japan. If the Product was distributed by Nikko Cordial Securities Inc. it is being so distributed under license. In the event that an error is found in an CGMJ research report, a revised version will be posted on the Firm's Global Equities Online (GEO) website. If you have questions regarding GEO, please call (81 3) 6270-3019 for help. The Product is made available in Korea by Citigroup Global Markets Korea Securities Ltd., which is regulated by the Financial Services Commission, the Financial Supervisory Service and the Korea Financial Investment Association (KOFIA). Citibank Building, 39 Da-dong, Jung-gu, Seoul 110-180, Korea. KOFIA makes available registration information of research analysts on its website. Please visit the following website if you wish to find KOFIA registration information on research analysts of Citigroup Global Markets Korea Securities Ltd. http://dis.kofia.or.kr/fs/dis2/fundMgr/DISFundMgrAnalystPop.jsp?companyCd2=A03030&pageDiv=02. The Product is made available in Malaysia by Citigroup Global Markets Malaysia Sdn Bhd, which is regulated by Malaysia Securities Commission. Menara Citibank, 165 Jalan Ampang, Kuala Lumpur, 50450. The Product is made available in Mexico by Acciones y Valores Banamex, S.A. De C. V., Casa de Bolsa, Integrante del Grupo Financiero Banamex ("Accival") which is a wholly owned subsidiary of Citigroup Inc. and is regulated by Comision Nacional Bancaria y de Valores. Reforma 398, Col. Juarez, 06600 Mexico, D.F. In New Zealand the Product is made available through Citigroup Global Markets New Zealand Ltd. (Company Number 604457), a Participant of the New Zealand Exchange Limited and regulated by the New Zealand Securities Commission. Level 19, Mobile on the Park, 157 Lambton Quay, Wellington. The Product is made available in Pakistan by Citibank N.A. Pakistan branch, which is regulated by the State Bank of Pakistan and Securities Exchange Commission, Pakistan. AWT Plaza, 1.1. Chundrigar Road, P.O. Box 4889, Karachi-74200. The Product is made available in the Philippines through Citicorp Financial Services and Insurance Brokerage Philippines, Inc., which is regulated by the Philippines Securities and Exchange Commission. 20th Floor Citibank Square Bldg. The Product is made available in Poland by Dom Maklerski Banku Handlowego SA an indirect subsidiary of Citigroup Inc., which is regulated by Komisja Nadzoru Finansowego. Dom Maklerski Banku Handlowego S.A. ul.Senatorska 16, 00-923 Warszawa. The Product is made available in the Russian Federation through ZAO Citibank, which is licensed to carry out banking activities in the Russian Federation in accordance with the general banking license issued by the Central Bank of the Russian Federation and brokerage activities in accordance with the license issued by the Federal Service for Financial Markets. Neither the Product nor any information contained in the Product shall be considered as advertising the securities mentioned in this report within the territory of the Russian Federation or outside the Russian Federation. The Product does not constitute an appraisal within the meaning of the Federal Law of the Russian Federation of 29 July 1998 No. 135-FZ (as amended) On Appraisal Activities in the Russian Federation. 8-10 Gasheka Street, 125047 Moscow. The Product is made available in Singapore through Citigroup Global Markets Singapore Pte. Ltd., a Capital Markets Services Licence holder, and regulated by Monetary Authority of Singapore. 1 Temasek Avenue, #39-02 Millenia Tower, Singapore 039192. The Product is made available by The Citigroup Private Bank in Singapore through Citibank, N.A., Singapore branch, a licensed bank in

Municipal Market Comment 22 July 2011
Citigroup Global Markets 21
Singapore that is regulated by Monetary Authority of Singapore. This report is distributed in Singapore by Citibank Singapore Ltd ("CSL") to selected Citigold/Citigold Private Clients. CSL provides no independent research or analysis of the substance or in preparation of this report. Please contact your Citigold//Citigold Private Client Relationship Manager in CSL if you have any queries on or any matters arising from or in connection with this report. Citigroup Global Markets (Pty) Ltd. is incorporated in the Republic of South Africa (company registration number 2000/025866/07) and its registered office is at 145 West Street, Sandton, 2196, Saxonwold. Citigroup Global Markets (Pty) Ltd. is regulated by JSE Securities Exchange South Africa, South African Reserve Bank and the Financial Services Board. The investments and services contained herein are not available to private customers in South Africa. The Product is made available in Spain by Citigroup Global Markets Limited, which is authorised and regulated by Financial Services Authority. 29 Jose Ortega Y Gassef, 4th Floor, Madrid, 28006, Spain. The Product is made available in Taiwan through Citigroup Global Markets Taiwan Securities Company Ltd., which is regulated by Securities & Futures Bureau. No portion of the report may be reproduced or quoted in Taiwan by the press or any other person. 14 and 15F, No. 1, Songzhi Road, Taipei 110, Taiwan. If the Product is related to non-Taiwan listed securities, neither the Product nor any information contained in the Product shall be considered as advertising the securities or making recommendation of the securities. The Product is made available in Thailand through Citicorp Securities (Thailand) Ltd., which is regulated by the Securities and Exchange Commission of Thailand. 18/F, 22/F and 29/F, 82 North Sathorn Road, Silom, Bangrak, Bangkok 10500, Thailand. The Product is made available in Turkey through Citibank AS which is regulated by Capital Markets Board. Tekfen Tower, Eski Buyukdere Caddesi # 209 Kat 2B, 23294 Levent, Istanbul, Turkey. In the U.A.E, these materials (the "Materials") are communicated by Citigroup Global Markets Limited, DIFC branch ("CGML"), an entity registered in the Dubai International Financial Center ("DIFC") and licensed and regulated by the Dubai Financial Services Authority ("DFSA" to Professional Clients and Market Counterparties only and should not be relied upon or distributed to Retail Clients. A distribution of the different CIRA ratings distribution, in percentage terms for Investments in each sector covered is made available on request. Financial products and/or services to which the Materials relate will only be made available to Professional Clients and Market Counterparties. The Product is made available in United Kingdom by Citigroup Global Markets Limited, which is authorised and regulated by Financial Services Authority. This material may relate to investments or services of a person outside of the UK or to other matters which are not regulated by the FSA and further details as to where this may be the case are available upon request in respect of this material. Citigroup Centre, Canada Square, Canary Wharf, London, E14 5LB. The Product is made available in United States by Citigroup Global Markets Inc, which is a member of FINRA and registered with the US Securities and Exchange Commission. 388 Greenwich Street, New York, NY 10013. Unless specified to the contrary, within EU Member States, the Product is made available by Citigroup Global Markets Limited, which is regulated by Financial Services Authority. Pursuant to Comissão de Valores Mobiliários Rule 483, Citi is required to disclose whether a Citi related company or business has a commercial relationship with the subject company. Considering that Citi operates multiple businesses in more than 100 countries around the world, it is likely that Citi has a commercial relationship with the subject company. Many European regulators require that a firm must establish, implement and make available a policy for managing conflicts of interest arising as a result of publication or distribution of investment research. The policy applicable to CIRA's Products can be found at www.citigroupgeo.com. Compensation of equity research analysts is determined by equity research management and Citigroup's senior management and is not linked to specific transactions or recommendations. The Product may have been distributed simultaneously, in multiple formats, to the Firm's worldwide institutional and retail customers. The Product is not to be construed as providing investment services in any jurisdiction where the provision of such services would not be permitted. Subject to the nature and contents of the Product, the investments described therein are subject to fluctuations in price and/or value and investors may get back less than originally invested. Certain high-volatility investments can be subject to sudden and large falls in value that could equal or exceed the amount invested. Certain investments contained in the Product may have tax implications for private customers whereby levels and basis of taxation may be subject to change. If in doubt, investors should seek advice from a tax adviser. The Product does not purport to identify the nature of the specific market or other risks associated with a particular transaction. Advice in the Product is general and should not be construed as personal advice given it has been prepared without taking account of the objectives, financial situation or needs of any particular investor. Accordingly, investors should, before acting on the advice, consider the appropriateness of the advice, having regard to their objectives, financial situation and needs. Prior to acquiring any financial product, it is the client's responsibility to obtain the relevant offer document for the product and consider it before making a decision as to whether to purchase the product. CIRA concurrently disseminates its research via proprietary and non-proprietary electronic distribution platforms. Periodically, individual analysts may also opt to circulate research to one or more clients by email. Such email distribution is discretionary and is done only after the research has been disseminated via the aforementioned distribution channels.
© 2011 Citigroup Global Markets Inc. Citi Investment Research & Analysis is a division of Citigroup Global Markets Inc. Citi and Citi with Arc Design are trademarks and service marks of Citigroup Inc. and its affiliates and are used and registered throughout the world. All rights reserved. Any unauthorized use, duplication, redistribution or disclosure of this report (the “Product”), including, but not limited to, redistribution of the Product by electronic mail, posting of the Product on a website or page, and/or providing to a third party a link to the Product, is prohibited by law and will result in prosecution. The information contained in the Product is intended solely for the recipient and may not be further distributed by the recipient to any third party. Where included in this report, MSCI sourced information is the exclusive property of Morgan Stanley Capital International Inc. (MSCI). Without prior written permission of MSCI, this information and any other MSCI intellectual property may not be reproduced, redisseminated or used to create any financial products, including any indices. This information is provided on an "as is" basis. The user assumes the entire risk of any use made of this information. MSCI, its affiliates and any third party involved in, or related to, computing or compiling the information hereby expressly disclaim all warranties of originality, accuracy, completeness, merchantability or fitness for a particular purpose with respect to any of this information. Without limiting any of the foregoing, in no event shall MSCI, any of its affiliates or any third party involved in, or related to, computing or compiling the information have any liability for any damages of any kind. MSCI, Morgan Stanley Capital International and the MSCI indexes are services marks of MSCI and its affiliates. The Firm accepts no liability whatsoever for the actions of third parties. The Product may provide the addresses of, or contain hyperlinks to, websites. Except to the extent to which the Product refers to website material of the Firm, the Firm has not reviewed the linked site. Equally, except to the extent to which the Product refers to website material of the Firm, the Firm takes no responsibility for, and makes no representations or warranties whatsoever as to, the data and information contained therein. Such address or hyperlink (including addresses or hyperlinks to website material of the Firm) is provided solely for your convenience and information and the content of the linked site does not in anyway form part of this document. Accessing such website or following such link through the Product or the website of the Firm shall be at your own risk and the Firm shall have no liability arising out of, or in connection with, any such referenced website.
ADDITIONAL INFORMATION IS AVAILABLE UPON REQUEST

Marketing Materials and Media

SEU – Bloomberg Information Release (June 29th 2011)

*Subject to change.
FOR INTERNAL USE ONLY
Municipal Retail Marketing
$70,220,000*
Sustainable Energy Utility, Inc. (Delaware) Energy Efficiency Revenue Bonds, Series 2011
THE OFFERING
Managers: Citi (Sole Manager) Schedule: * POS Mailing: 07/18/2011 (Supplement on 7/19/2011) ROP: n/a Sale Date: 07/25/2011 Closing: 08/10/2011* Dates: * First Principal: 09/15/2013 First Interest: 03/15/2012 Final Maturity: 09/15/2034 Underlying (Confirmed) Ratings: Moody’s: Aa2 S&P: AA+ Fitch: NR Tax Exemption: Please refer to front cover of the Preliminary Official Statement and page 20 for
tax matters Interest Payable: Interest on the bonds, at the rates set forth on the inside cover of the POS, is
payable on March 15, 2012 and on each September 15 and March 15 thereafter.
Call Features: * 10-yr par call expected. Refer to page 5 of POS for redemption details Maturity Schedule: * Serial Bonds maturing 2013-2031 Term Bond maturing 2034 with sinking schedule beginning in 2032 PURPOSE OF THE BONDS The proceeds to be received by the Issuer from the sale of the Bonds will be used (i) to finance projects (the "Projects") consisting of the design, construction and installation of certain energy efficiency measures, including reimbursement of Project costs paid on behalf of Delaware State University under the Interim Funding Agreement dated April 11, 2011 between the Issuer and Delaware State University; (ii) to fund capitalized interest on the Bonds; and (iii) to pay all or a portion of costs of the issuance of the Bonds (including the payment of certain program expenses of the Issuer).

*Subject to change.
FOR INTERNAL USE ONLY
SECURITY Sources of Payment: Please refer to page 10 of the Preliminary Official Statement ADDITIONAL INFORMATION Please read the Preliminary Official Statement in its entirety for a complete description of the offering terms, security provisions, bondholders’ risks and redemption provisions. This sales memorandum is a summary of the financing for quick reference only. MARKETING
Pricing: Marc Livolsi (212) 723-7093 Security: Trenton Allen (215) 854-6036 Gardner Smith (415) 951-1731 Keith Campo (212) 723-9162 Marketing: Elaine Miller (212) 723-7114

delawareonline.com JULY 24, 2011 ••• SUNDAY NEWS JOURNAL F5BUSINESS
By ALAN SAYREAssociated Press
NEW ORLEANS — Thepowerful flow of theMissis-sippi River, which broughtdestruction to scores livingnear its flooded banks thisspring, is viewed by a newgeneration of energy entre-preneurs as a reliable alter-nativeway to generate elec-tricity.These developers aren’t
planning giant concretedams like the ones thatbrought electric lights tomany Americans for thefirst time. Instead, theiridea is to put turbines on thebottoms of rivers or mountthem on barges to spin gen-erators.It’s all part of the emerg-
ing technology of hydroki-netics – using flowingwaterto generate power withoutdams.“If we’re going to con-
trol the cost of convertingto new forms of energy,hydro has to be part of thatequation,” said JonGuidroz,project development direc-tor for Boston-based FreeFlow Power, which wants togenerate energy from theMississippi River.Hydrokinetic generation
isn’t a new idea, but only inrecent years has technol-ogymade it feasible.“Water speeds vary and,
years ago, generatorsweren’t built and developedfor variable speed,” saidBrent Ballard, chief execu-tive of Olney, Texas-basedGulfstream Technologies.“In the last few years, theymakevery efficient genera-tors that can operate in awide range of speeds.”Still, developers are
faced with many chal-lenges, such as the currentlow prices for electricitythat have bedeviled otheralternative energy formsand a technology that is stillin its infancy. Widespread
application is years away,and no one is yet willing topredict how much powercould eventually be gener-ated nationwide byhydroki-netics.“I’d say hydrokinetic
generators are at the stagewhere the wind generatorswere 15 years ago,” saidJerome Johnson, researchprofessor at the Institute ofNorthern Engineering withthe University of Alaska atFairbanks.FFP is focusing on ob-
taining federal permits for25 hydrokinetic projectsalong the lower MississippiRiver between Kentuckyand Louisiana. Sites werechosen based on flow vol-ume, flow velocity and theproximity to transmissionfacilities and potential cus-tomers. At each site, hun-dreds of turbines on pylonsat the bottom of the riverwould spin like propellers
and transmit energy to theriverbank.Each turbine would pro-
duce about 40 kilowatts ofpower, comparable to gaso-line and diesel-poweredhome generators. By com-parison, small wind tur-bines used to power homesand small businesses typi-cally have capacities of 100kilowatts or less.Guidroz said FFP’s long-
term goal is to operate tur-bines for utilities and forchemical industries alongthe river. The companybegan testing one in June ataDowChemical Co. plant inPlaquemine, La. The com-pany said that in addition toprivate funding, it receiveda $1.4 million grant fromthe U.S. Energy Depart-ment.The cost of a turbine, for
now, is an FFP trade secret.Ballard said turbines
also could be strung below
some existing dams to pro-duce additional power.“Your infrastructure is
already there,” he said. “It’snot like a wind farm whereyou might have to build 200miles of infrastructure.”And flowing water can
be had away from rivers.Gulfstream Technologiesbegan a pilot hydrokineticproject in December 2009at a power plant on a lake inTexas. The turbine uses theflow of water that comesfrom the plant followingcooling cycles.Guidroz said he wasn’t
deterred about the flood of2011, saying that underwa-ter turbines could easily bedesigned to handle the rag-ing river.“If anything, it proves
the awesome power of theriver and the potential forhydrokinetics,” he said.Some hydrokinetic test-
ing is also taking place in
Alaska, where poweringisolated villages is a chal-lenge.Alaska Power & Tele-
phone Co., which provideselectricity to 33 communi-tieswith populations of 60 to3,000, hopes the technologycan reduce the use of room-sized diesel generators thatstill account for 30 percentof the power it provides.Using a $1.8 million fed-
eral grant, the companybuilt an aluminum bargemounted with a power tur-bine that dipped into theYukon River. Last year, thegenerator provided part ofthe power for Eagle Village– population 50. The bargewas later pulled back be-cause of drifting wood, andthe Institute of NorthernEngineering isworking on adevice to divert debris,Johnson said. Another trialcould take place next year.AP&T believes the tech-
nology canbedeveloped forwidespread and bigger gen-eration, said Mark Mc-Cready, the company’smar-keting director.Developers are trying to
deal with environmentalconcerns.In a study that will be
sent to the Federal EnergyRegulatory Commission,FFP is assessing whetherits turbines would affectshipping or fishing on theMississippi. The commis-sion will have to approveany large-scale uses ofriver turbines.Both FFP and Gulf-
stream Technologies saytheir turbines are environ-mentally friendly. FFP’sturbines use no chemical lu-bricants, Guidroz said. Thecompany also put largergaps between the turbineblades so large species canpass through safely, at theexpense of somegeneratingefficiency. GulfstreamTechnologies has opted fora biodegradable lubricant,Ballard said.But the cost has killed
the plans of other develop-ers.Marine services com-
panyMcGinnis Inc. thoughtits proximity to the OhioRiver was a natural reasonto get into hydrokineticgeneration. However, theSouth Point, Ohio-basedcompany found small-scalegeneration wasn’t economi-cally feasible and a largeroperation required develop-ment costs that were toohigh, said its legal counselDoug Ruschman.The company tried to
get federal help but wasturned aside.Douglas Meffert, execu-
tive director of Tulane Uni-versity’s RiverSphere, aplanned hydrokinetic test-ing facility along theMissis-sippi River in New Orleans,said the technology willneed federal support forcommercial development.“Every renewable en-
ergy source that has movedinto commercial use, suchas solar and wind, has al-ways had to depend uponthat initial subsidy,” he said.
Hydrokineticsbilled as damalternative
Underwater energy turbines being tested
Alaska Power & Telephone Company employees prepare to lower the 25-kilowatt AP&T Yukon hydrokinetic turbine intothe Yukon River in Eagle, Alaska, in June 2010. Delivering power to isolated Alaskan villages is a problem, and the com-pany hopes the technology can reduce the use of room-sized diesel generators that still account for 30 percent of thepower it provides. Hydrokinetic turbines are also being tested in the Mississippi River. ALASKA POWER & TELEPHONE COMPANY
Under no circumstances shall this announcement constitute an offer to sell or a solicitation of an offer to buy, norshall there be any sale of the Bonds in any jurisdiction in which such offer, solicitation or sale would be
unlawful prior to registration or qualification under the securities laws of such jurisdiction.The Bonds will be sold by means of a Preliminary Official Statement.
NEW ISSUE—BOOK-ENTRY ONLY CONFIRMED RATINGS: Moody’s:Aa2Standard & Poor’s: AA+
*$70,220,000*
Sustainable Energy Utility, Inc.
Energy Efficiency Revenue Bonds,Series 2011
Expected Pricing July 25, 2011
• Interest is Federally Tax-Exempt**
• Interest is State Tax-Exempt for Delaware Residents**
• Maturities ranging from 2013–2034*
• Bonds to be delivered on or about August 10, 2011*
• Bonds will be available in $5,000 denominations
Further information, including copies of the PreliminaryOfficial Statement for these Bonds, may be obtained
from the firm listed below:
Citi877-801-4593
**Preliminary, subject to change.**Before purchasing any Bonds, contact your tax advisor to determine any applicable federal, state and localtax consequences.
In the opinion of Drinker Biddle & Reath LLP, Bond Counsel, under existing law ascurrently enacted and construed, interest on the Bonds is excluded from gross income forfederal income tax purposes and is not a specific item of tax preference for purposes of theindividual and corporate federal alternative minimum tax; but, interest on the Bonds willbe included in “adjusted current earnings” in computing alternative minimum taxableincome with respect to certain corporations. The Bonds, and the interest payable thereon,are exempt from taxation by the State of Delaware or any political subdivision thereof. See“CERTAIN TAXMATTERS” in the Preliminary Official Statement.
NJ-0000560474
SharedAccommodationsStuff
SharedAccommodationsAnimals
SharedAccommodationsRentals Shared
AccommodationsRentals
SharedAccommodationsTransportation
SharedAccommodationsTransportation
NEW TODAYNew ads appearing for the first time from your neighbors. Call 800-427-2424.
Where homes andpeople find each other.
Look for EZ featuredopen houses and EZ byappointment directoryin The News Journal’sHomeFinder sections.
Every Saturdayand Sunday.
START BUILDING
BUYING Old Photos,Books, Post CardsCostumeJewelry
Furniture, Pottery.Complete Estates.CALL ON CARA
484-356-3123610-918-2528
FREE DINNER: Brick andmortar opportunity. En-trepreneurs [email protected]
BERNESE MOUNTAINDOG PUPS - AKC.Vet checked, physical,ready to go, great temp,mom & dad on premises$900. 443-206-0122
PUGGLEMale, shots & wormed.
Ready to go.302-373-9473
WILMINGTONCool Springs XLG 2BR. 2BA, $1200/mo. HT/HT incl.Background check.No security nec.Call: 302-593-2588
MIDDLETOWN, 197093BR townhouse. 101 ColeBlvd. Wall to wall carpet,new kitchen & bathroomfloors, new appliances,refrig, d/w, fenced prvtback yard w/ deck. Nr
schools, trans & shopping,$1100/mo +util. 1mo sec,Sect 8 ok. 302-290-5994
ALL NEWLYRENOVATED
3BR, W/W, W/D,HOOK-UP, YARD.
2710 West Street$925/mo. Sec 8 OKCall: 302-983-4001
A Nice 2nd Flr 2BR Apt at900 East 17th St near
Destiny’s Church. Washer.& More. Only $675+util.Also 1st Flr 2BR at 2100
Pine St near Walt’s Chick-en. $650+ Util. 3 BR
House at 1201 B St. $875+ Util. 302-983-1666.
ALL NEWLYRENOVATED
Rosegate 3br, w/w c/ac,w/d, hook-up, Yard.
20 Thorn Court;$895/mo Sec 8 OKCall: 302-983-4001
All clean large furnish-ed rooms in Newport,one person. Cable &
electric included$145/ per wk. Call:302-455-9116 Lv. msg
NEWARKFurn. room for rent.
$130/wk + sec.302-397-4787.
DEVILLE ’72- Blue,All power, Only 70K mi.Runs good, just inspected$2700. 302-420-4268
CORVETTE COUPE ’93-exc cond, 80k mi, mustsell, 302-745-8850
Accord LX ’01 4 cyl, 130k,Green,super clean, 1owner, $4,995.302-559-2666
ECLIPSE GS ’06Orange, 2.4L auto sportshift, 23-29 mpg. Carfax.$12,000 Call 302-373-6368
FIBER GLASS BEDCOVER FR PICK UP
TRUCK 6.5FT bed, blk,good cond, $500.Call 302-478-0843
19’ SKIFF- open workboat. 60 horse powermariner, center console,trailer included, Runsgreat. $2500 or bestoffer. 302-299-5936
2003 Chevy S10 XtremePickup V6, 5sp, 122,000miles, very good condi-tion condition, Blue withSilver Stripes, 1 adultowner, 5900.00 Call 302-632-1585
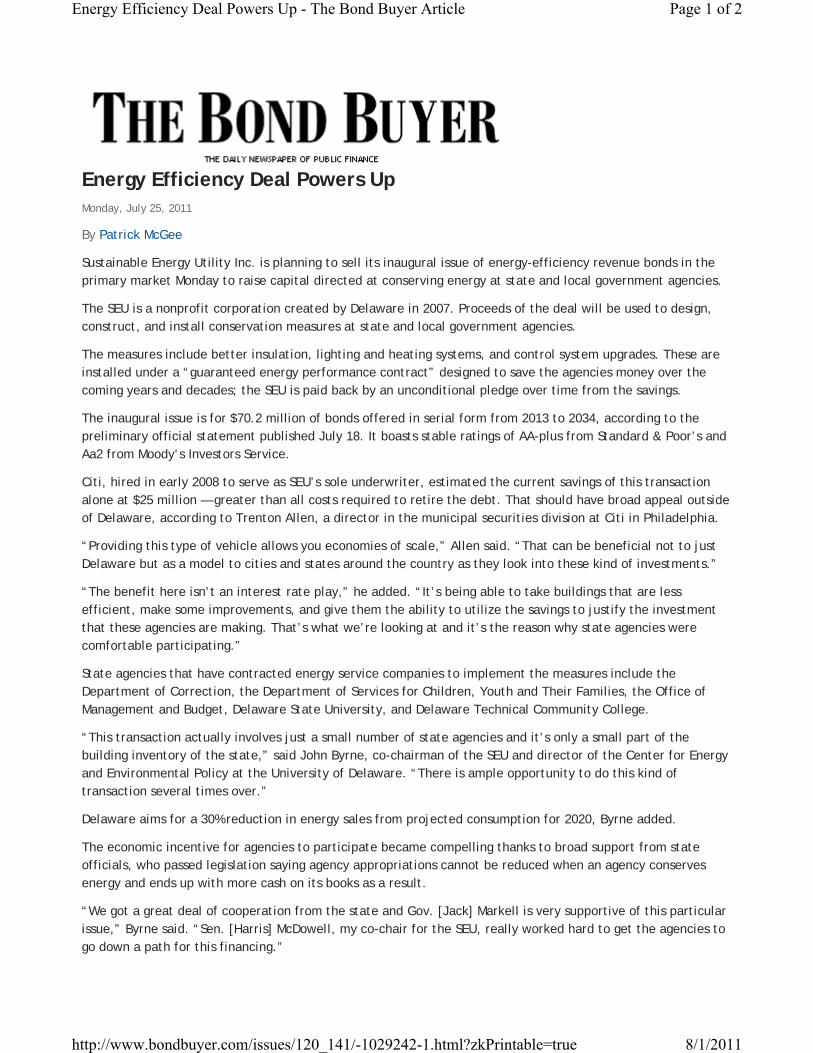
Energy Efficiency Deal Powers Up
Sustainable Energy Utility Inc. is planning to sell its inaugural issue of energy-efficiency revenue bonds in the primary market Monday to raise capital directed at conserving energy at state and local government agencies.
The SEU is a nonprofit corporation created by Delaware in 2007. Proceeds of the deal will be used to design, construct, and install conservation measures at state and local government agencies.
The measures include better insulation, lighting and heating systems, and control system upgrades. These are installed under a “guaranteed energy performance contract” designed to save the agencies money over the coming years and decades; the SEU is paid back by an unconditional pledge over time from the savings.
The inaugural issue is for $70.2 million of bonds offered in serial form from 2013 to 2034, according to the preliminary official statement published July 18. It boasts stable ratings of AA-plus from Standard & Poor’s and Aa2 from Moody’s Investors Service.
Citi, hired in early 2008 to serve as SEU’s sole underwriter, estimated the current savings of this transaction alone at $25 million — greater than all costs required to retire the debt. That should have broad appeal outside of Delaware, according to Trenton Allen, a director in the municipal securities division at Citi in Philadelphia.
“Providing this type of vehicle allows you economies of scale,” Allen said. “That can be beneficial not to just Delaware but as a model to cities and states around the country as they look into these kind of investments.”
“The benefit here isn’t an interest rate play,” he added. “It’s being able to take buildings that are less efficient, make some improvements, and give them the ability to utilize the savings to justify the investment that these agencies are making. That’s what we’re looking at and it’s the reason why state agencies were comfortable participating.”
State agencies that have contracted energy service companies to implement the measures include the Department of Correction, the Department of Services for Children, Youth and Their Families, the Office of Management and Budget, Delaware State University, and Delaware Technical Community College.
“This transaction actually involves just a small number of state agencies and it’s only a small part of the building inventory of the state,” said John Byrne, co-chairman of the SEU and director of the Center for Energy and Environmental Policy at the University of Delaware. “There is ample opportunity to do this kind of transaction several times over.”
Delaware aims for a 30% reduction in energy sales from projected consumption for 2020, Byrne added.
The economic incentive for agencies to participate became compelling thanks to broad support from state officials, who passed legislation saying agency appropriations cannot be reduced when an agency conserves energy and ends up with more cash on its books as a result.
“We got a great deal of cooperation from the state and Gov. [Jack] Markell is very supportive of this particular issue,” Byrne said. “Sen. [Harris] McDowell, my co-chair for the SEU, really worked hard to get the agencies to go down a path for this financing.”
Monday, July 25, 2011
By Patrick McGee
Page 1 of 2Energy Efficiency Deal Powers Up - The Bond Buyer Article
8/1/2011http://www.bondbuyer.com/issues/120_141/-1029242-1.html?zkPrintable=true

Byrne calls McDowell, a Democrat from Wilmington North, “the dean of energy policy in the state,” noting he has written all the major energy legislation including the bills that created the SEU — the first of its kind in the United States.
The biggest energy conservation investment in Delaware to date is the $20 million it received, spread over two and a half years, from the American Recovery and Reinvestment Act in 2008.
Monday’s transaction alone will more than triple that investment.
Bruce Schlein, vice president in corporate sustainability at Citi in New York, said one aim of the SEU is to harmonize the market dynamics of energy-efficiency finance, which he called “hugely fragmented.”
“There really is no silver-bullet solution,” Schlein said. “I think we all recognize that solving efficiency at this scale across many different market segments and different geographies will require models like the SEU and others.”
Citi allied with the White House Better Buildings Initiative last month to propel these kinds of projects. Announced by President Obama in February, the initiative aims to double the share of electricity from clean energy by 2035 and make commercial buildings 20% more energy efficient by 2020.
“It’s serving as a catalyst and using the bully pulpit of the White House to champion the effort,” Schlein said of the initiative. “It includes policy initiatives that are under development, sharing of data and best practices, and builds on existing ARRA-supported efforts in cities around the country.”
Delaware boasts triple-A ratings from all three rating agencies, and last week Moody’s maintained Delaware’s stable outlook even as the U.S. sovereign credit received a warning that it could be downgraded if resolution isn’t found on the debt ceiling.
The SEU revenue bonds don’t have a full faith and credit pledge behind them and aren’t backed by a taxing authority. Standard & Poor’s justified its high rating — one notch below AAA — based on strong contractual provisions and its view that this is appropriation-backed debt, to which the state has a “demonstrated commitment.”
Moody’s similarly noted a strong legal structure that says Delaware agencies have made an absolute pledge to make annual payments to the SEU, which in turn assigns them to the trustee.
© 2011 The Bond Buyer and SourceMedia Inc., All rights reserved. Use, duplication, or sale of this service, or data contained herein, except as described in the subscription agreement, is strictly prohibited. Trademarks page. Client Services 1-800-221-1809, 8:30am - 5:30pm, ET
For information regarding Reprint Services please visit: http://license.icopyright.net/3.7745?icx_id=20090817FNNRUTWS
Page 2 of 2Energy Efficiency Deal Powers Up - The Bond Buyer Article
8/1/2011http://www.bondbuyer.com/issues/120_141/-1029242-1.html?zkPrintable=true

Sustainable Energy Utility, Inc.
Strictly Private and Confidential
July, 2011
Energy Efficiency Revenue Bonds, Series 2011
Investor Presentation

2
This call is intended to provide certain information about the Sustainable Energy Utility, Inc. and the Energy Efficiency Revenue Bonds, Series 2011 to current and prospective investors only. This call does not constitute an offer to sell or the solicitation of an offer to buy any security and any such offer will be made solely by means of an official statement. This call is not intended for members of the press. We kindly ask that members of the press disconnect at this time.
Disclaimer

3
Sustainable Energy Utility, Inc.
– Senator Harris B. McDowell III, Co – Chairman
– Dr. John Byrne, Co – Chairman
Bond Counsel
– Baird Brown, Drinker Biddle & Reath LLP
Co‐Financial Advisor
– Kenneth Becker, Becker Capital and Finance
Senior Managing Underwriter
– Trenton Allen, Citigroup Global Markets Inc.
Presentation Participants

4
Meeting Agenda
Overview of the Sustainable Energy Utility, Inc. 1
Energy Efficiency Revenue Bond (“EERB”) Program 2
Financing Overview 3

5
Established by the State of Delaware on June 28, 2007 to realize:
– Legislated Target: 30% Reduction in energy use by 2020
– Legislated Target: 10‐20% of Electricity Sales from Distributed Renewables by 2020
Public/private partnership combines the best of both worlds:
– SEU is organized as a non‐profit tax‐exempt 501(c)(3) organization
– Day to day operations are conducted by for‐profit companies, non‐profits & others specializing in energy sector
SEULess
Transportation Energy
Less Electricity
Less Heating FuelWater/ Materials
Conservation
Distributed Renewables
Education
Green Buildings/ Green
Neighborhoods
Affordable Energy
Sustainable Energy Utility, Inc. (“SEU”)
The SEU Model

6
Senator Harris McDowellCo-Chair
Dr. John ByrneCo-Chair
SEU Activities
Since its creation in 2007, the SEU has been active as a catalyst for green and clean energy in Delaware
Managed the State of Delaware’s ARRA Funding
– In coordination with the Delaware Energy Office, the SEU oversaw $20 million of the State of Delaware’s American Recovery and Reinvestment Act funding
Stabilized the Delaware Solar Renewable Energy Credits (“SREC”) Market
– The SEU supported the Delaware SREC market by agreeing to purchase and warehouse SREC’s created by the Dover SUN Park Project, the largest solar power plant on the East Coast
Initiated Public Sector Energy Savings Program
– Public and private sector energy savings initiatives which are responsible for meeting a legislated target of 10% ‐ 15% reductions in sales of utility fuels by 2015

7
Meeting Agenda
Overview of the Sustainable Energy Utility, Inc. 1
Energy Efficiency Revenue Bond (“EERB”) Program 2
Proposed Financing 3

8
Energy Efficiency Revenue Bond Program
*Preliminary and Subject to Change
The Energy Efficiency Revenue Bond Program is Designed to Facilitate:
1) Ease of Participation:– The SEU, through its financial advisors, bond counsel and co‐chairs who have significant expertise in the
energy efficiency field provide technical and financial assistance to participants from the initial project scope to financial close
2) Energy Cost Reduction:– By using a finance model that directly links the benefits of energy savings to agency investment in energy
efficiency, this new approach provides the best signal for government energy cost reduction
3) Scalable Utilization:– Series 2011 provides funding for multiple public entities throughout the State including:
– Department of Corrections (“DOC”)
– Department of Services for Children, Youth, and Their Families (“DSCYF”)
– Office of Management and Budget (“OMB”)
– Delaware Technical and Community College (“DTCC”)
– Delaware State University (“DSU”)
The SEU supports the growing financing need of energy efficiencyprojects in the public sector

9
Each Agency’s obligations under the respective Installment Payment Agreement are absolute and unconditional and will remain in full force and effect until all Installment Payments have been paid in full and will not be affected, modified or impaired by the occurrence of any event or circumstance, including termination of the Guaranteed Energy Savings Agreement for any reason, including the default or failure of the Contractor fully to perform any of its obligations under the Guaranteed Energy Savings Agreement. Installments Payments are limited obligations of the Agency payable only from amounts appropriated by the State that are eligible for payment of the Installment Payments pursuant to the Energy Performance Contracting Act, Del. Code Ann. tit. 29 § 6974(c).
EERB Security
The strength of the bond’s security lies in the provisions of the Installment Payment Agreement

10
Program Mechanics
Trustee Bondholders
Delaware SEU
ESCO
Agency
Legislature
Appropriations
GESAConstruction Savings
Guarantee
Payment Agreement
Installment Payments
Construction Funding AgreementConstruction Advances
IndentureAssigns Installment
Payments
Bonds
1) The Delaware State Agencies (“Agencies”) enter into Installment Payment Agreements with the SEU whereby the Agencies agree to make annual payments for installation of energy efficiency upgrades
2) ESCO enters into Guaranteed Energy Savings Agreement (“GESA”) with the Agencies, guaranteeing targeted annual savings level for the term of the agreement
3) The SEU enters into Construction Funding Agreement with the Energy Service Company (“ESCO”) and the Agency whereby the SEU agrees to provide capital for energy efficiency investments
4) The SEU issues tax‐exempt bonds secured by the payments under the Installment Payment Agreement
1
2
3
4
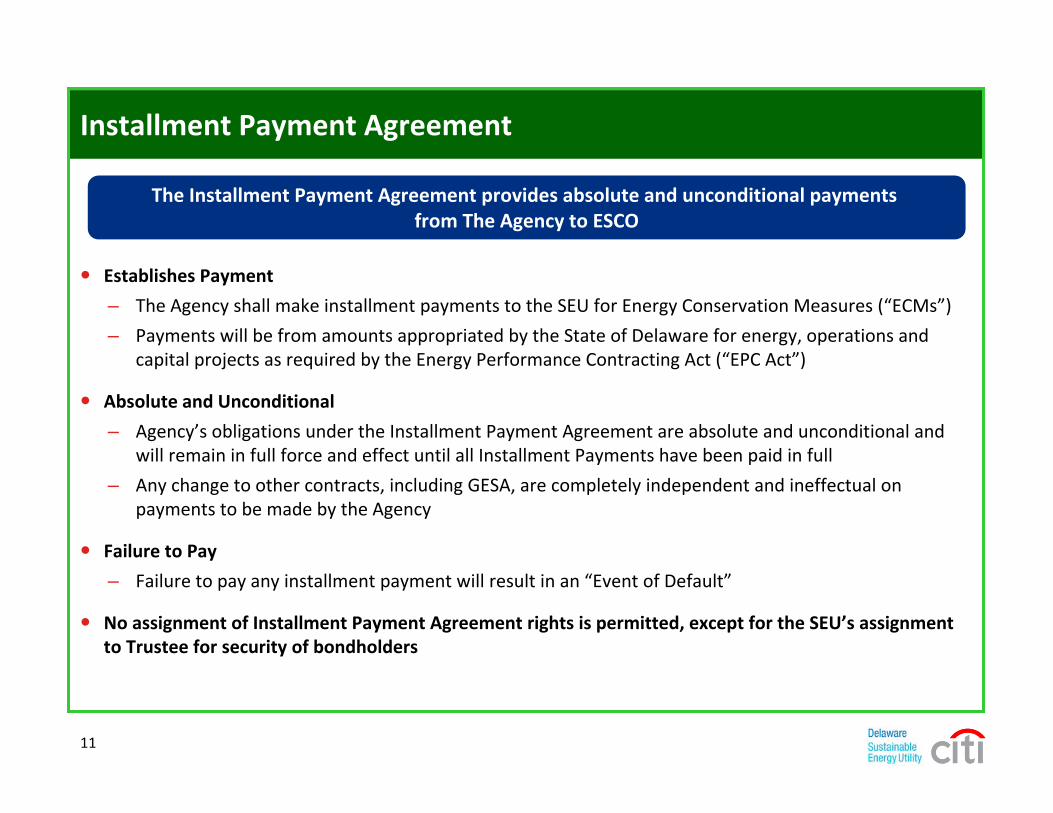
11
Installment Payment Agreement
Establishes Payment
– The Agency shall make installment payments to the SEU for Energy Conservation Measures (“ECMs”)
– Payments will be from amounts appropriated by the State of Delaware for energy, operations and capital projects as required by the Energy Performance Contracting Act (“EPC Act”)
Absolute and Unconditional
– Agency’s obligations under the Installment Payment Agreement are absolute and unconditional and will remain in full force and effect until all Installment Payments have been paid in full
– Any change to other contracts, including GESA, are completely independent and ineffectual on payments to be made by the Agency
Failure to Pay
– Failure to pay any installment payment will result in an “Event of Default”
No assignment of Installment Payment Agreement rights is permitted, except for the SEU’s assignment to Trustee for security of bondholders
The Installment Payment Agreement provides absolute and unconditional payments from The Agency to ESCO

12
Guaranteed Energy Savings Agreement
The GESA establishes a guaranteed level of savings which the Agencies will receive from the installment of Energy Conservation Measures
Each Agency will enter into a GESA with an ESCO in accordance with the EPC Act
ESCO’s Obligations:
– Design, construct and install certain Energy Conservation Measures and perform other necessary work to maintain satisfactory operation
– Guarantee certain energy savings resulting from the operation of such energy efficiency improvements will exceed installment payments and payments for maintenance under GESA
Permitted Changes
– The ESCO may, without consent, make changes to work so long as they are immaterial and are consistent with intent of GESA
Insolvency of ESCO
– Agency will have right to request assurances of future performance or terminate GESA
– If no assurance, Agency will complete work under own forces and demand excess funds over bond proceeds from ESCO

13
Construction Funding Agreement
The Construction Funding Agreement is among the SEU, the Agency, and respective ESCO and establishes the funding price and method for Energy Conservation Measures
Construction Price
– The SEU shall cause the Trustee to pay the construction price for Energy Conservation Measures to the ESCO
– Amount of payments will be determined by completion of milestones set forth in the Agreement
Ability to Change Party to Agreement
– In the event the GESA is terminated, the Agency may enter into new GESA with alternate ESCO
Alternate ESCO would then become party to existing Construction Funding Agreement
Project Funding Source
– Only funds on deposit in the related project account will be available to pay the construction price
– If funds are insufficient to pay the construction price because of a change order, the Agency will pay the excess costs
No assignment of Construction Funding Agreement rights is permitted, except for the SEU’s assignment to Trustee for security of bondholders

14
Memorandum of Understanding (“MOU”) Enhances Security
Trustee
Bondholders
State OMB
Legislature
Appropriations
Flow of Funds
Each Agency has entered into an (MOU) with the State Office of Management and Budget
State OMB agrees it will initiate the transfer and make payments directly to the trustee, out of each agency’s appropriated funds available to make the payments
The MOU recognizes that the agency is obligated to make payments under the Installment Payment Agreement

15
Strong Coverage Exists for Agency Installment Payment Obligations
For FY 2012, the available revenue under the EPC Act provides ample coverage for each participant’s installment payment obligations
Guaranteed Savings vs. Installment Payments*
0.0
25.0
50.0
75.0
100.0
125.0
150.0
Aggregate GuaranteedSavings
Aggregate Payments
Debt
Ser
vice
($ m
illio
ns)
Net Savings:$22.929
Participant Coverage Analysis
18.9x$1,085,987$20,568,800OMB
3.3x$1,379,000$4,500,000DTCC
$1,580,620
$196,114
$3,262,329
Maximum Installment Payment
17.8x$28,094,900DSU
186.6x$36,594,100KIDS
10.0x$32,689,100DOC
Coverage
FY 2012 Appropriation Eligible for Payment
Participant
*Preliminary and Subject to Change
Installment Payment
Obligations
State of DE Investment

16
Meeting Agenda
Overview of the Sustainable Energy Utility, Inc. 1
Energy Efficiency Revenue Bond (“EERB”) Program 2
Financing Overview 3

17
Series 2011 Program Participants
The Program Participants are all essential departments of the State
Total2011 Program Participants
1
Noresco
$2 million
DSCYF
81231Project Sites
Johnson Controls
Pepco EnergyHoneywell,
Sieberlich Trane, Ameresco
NorescoESCO
$75 million$11 million$6 million$16 million$40 millionProjected Cost($)*
DSUDTCCOMBDOCName
DTCC8%
DSU15%
DSCYF3%
OMB21%
DOC53%
Participation as % of Total
*Preliminary and Subject to Change

18
Tax‐Exempt (see cover of POS)Tax Status:
Citigroup Global Markets Inc.Underwriter:
Semi – Annual (March 15 and September 15)Interest Payments:
Aa2 (confirmed) / AA+ (confirmed) ; M / S&PRatings:
Annual (September 15)Principal Payments:
Various Energy Conservation MeasuresProject:
Delaware Sustainable Energy Utility, Inc.Issuer:
Financing Overview

19
9/15/2034Final Maturity:
36 monthsCapitalized Interest:
NoneDebt Service Reserve:
$70,220,000*Par:
Structure of the Bonds
*Preliminary and Subject to Change
Preliminary Debt Service*
In addition to the 2011 SEU borrowing, the State of Delaware is investing its own cash in the projects
0.0
1.0
2.0
3.0
4.0
5.0
6.0
7.0
2012 2015 2018 2021 2024 2027 2030 2033
Deb
t Ser
vice
($ m
illio
ns)
Principal Interest

20
Series 2011 Transaction Schedule
Important Dates:
July 25th – Price bonds
August 10th – Close Transaction
*Preliminary and Subject to Change
July 2011 August 2011 S M T W T F S S M T W T F S 1 2 1 2 3 4 5 6 3 4 5 6 7 8 9 7 8 9 10 11 12 13
10 11 12 13 14 15 16 14 15 16 17 18 19 2017 18 19 20 21 22 23 21 22 23 24 25 26 2724 25 26 27 28 29 30 28 29 30 31 31

21
For further information on this transaction, please refer to the Preliminary Official Statement or contact Citigroup Global Markets Inc.
Additional Information

efficiency, renewable energy & mitigation
In January 2007, Citi released a Climate Change Position Statement, the first US financial institution to do so. As a sustainability leader in the financial sector, Citi has taken concrete steps to address this important issue of climate change by: (a) targeting $50 billion over 10 years to address global climate change: includes significant increases in investment and financing of alternative energy, clean technology, and other carbon-emission reduction activities; (b) committing to reduce GHG emissions of all Citi owned and leased properties around the world by 10% by 2011; (c) purchasing more than 52,000 MWh of green (carbon neutral) power for our operations in 2006; (d) creating Sustainable Development Investments (SDI) that makes private equity investments in renewable energy and clean technologies; (e) providing lending and investing services to clients for renewable energy development and projects; (f) producing equity research related to climate issues that helps to inform investors on risks and opportunities associated with the issue; and (g) engaging with a broad range of stakeholders on the issue of climate change to help advance understanding and solutions.
Citi works with its clients in greenhouse gas intensive industries to evaluate emerging risks from climate change and, where appropriate, to mitigate those risks.
© 2011 Citigroup Global Markets Inc. Member SIPC. All rights reserved. Citi and Citi and Arc Design are trademarks and service marks of Citigroup Inc. or its affiliates and are used and registered throughout the world.
IRS Circular 230 Disclosure: Citigroup Inc. and its affiliates do not provide tax or legal advice. Any discussion of tax matters in these materials (i) is not intended or written to be used, and cannot be used or relied upon, by you for the purpose of avoiding any tax penalties and (ii) may have been written in connection with the "promotion or marketing" of any transaction contemplated hereby ("Transaction"). Accordingly, you should seek advice based on your particular circumstances from an independent tax advisor.Any terms set forth herein are intended for discussion purposes only and are subject to the final terms as set forth in separate definitive written agreements. This presentation is not a commitment to lend, syndicate a financing, underwrite or purchase securities, or commit capital nor does it obligate us to enter into such a commitment. Nor are we acting in any other capacity as a fiduciary to you. By accepting this presentation, subject to applicable law or regulation, you agree to keep confidential the existence of and proposed terms for any Transaction.
Prior to entering into any Transaction, you should determine, without reliance upon us or our affiliates, the economic risks and merits (and independently determine that you are able to assume these risks) as well as the legal, tax and accounting characterizations and consequences of any such Transaction. In this regard, by accepting this presentation, you acknowledge that (a) we are not in the business of providing (and you are not relying on us for) legal, tax or accounting advice, (b) there may be legal, tax or accounting risks associated with any Transaction, (c) you should receive (and rely on) separate and qualified legal, tax and accounting advice and (d) you should apprise senior management in your organization as to such legal, tax and accounting advice (and any risks associated with any Transaction) and our disclaimer as to these matters. By acceptance of these materials, you and we hereby agree that from the commencement of discussions with respect to any Transaction, and notwithstanding any other provision in this presentation, we hereby confirm that no participant in any Transaction shall be limited from disclosing the U.S. tax treatment or U.S. tax structure of such Transaction.
We are required to obtain, verify and record certain information that identifies each entity that enters into a formal business relationship with us. We will ask for your complete name, street address, and taxpayer ID number. We may also request corporate formation documents, or other forms of identification, to verify information provided.
Any prices or levels contained herein are preliminary and indicative only and do not represent bids or offers. These indications are provided solely for your information and consideration, are subject to change at any time without notice and are not intended as a solicitation with respect to the purchase or sale of any instrument. The information contained in this presentation may include results of analyses from a quantitative model which represent potential future events that may or may not be realized, and is not a complete analysis of every material fact representing any product. Any estimates included herein constitute our judgment as of the date hereof and are subject to change without any notice. We and/or our affiliates may make a market in these instruments for our customers and for our own account. Accordingly, we may have a position in any such instrument at any time.
Although this material may contain publicly available information about Citi corporate bond research, fixed income strategy or economic and market analysis, Citi policy (i) prohibits employees from offering, directly or indirectly, a favorable or negative research opinion or offering to change an opinion as consideration or inducement for the receipt of business or for compensation and (ii) prohibits analysts from being compensated for specific recommendations or views contained in research reports. So as to reduce the potential for conflicts of interest, as well as to reduce any appearance of conflicts of interest, Citi has enacted policies and procedures designed to limit communications between its investment banking and research personnel to specifically prescribed circumstances.
Disclaimer

Sustainable Energy Utility gets $72.5M for retrofits Bond sale pays for energy-efficiency upgrades By AARON NATHANS, The News Journal
Delaware's Sustainable Energy Utility has raised $72.5 million in a bond sale that will pay for energy-efficiency upgrades to a slew of government and educational buildings.
The retrofits will include improving the boilers at Legislative Hall, the lighting at state prisons and the cooling systems at Delaware State University and Delaware Technical & Community College.
SEU officials say the state will save in operating expenses $23 million above and beyond what it will pay for the upgrades.
The private contractors hired to perform the work have guaranteed the state and schools a long-term savings on their energy bills.
The state agencies are guaranteeing the bonds with payments over 20 years, using the energy savings they expect to realize, said Ken Becker, the SEU's financial adviser.
"It's a no-risk arrangement for Delawareans," said state natural resources secretary Collin O'Mara, a board member of the SEU.
The state supplemented the privately raised money with $11.3 million from the Bond Bill, the state's traditional method for funding capital projects.
But by largely working outside the Bond Bill process, "we're not crowding out schools and roads," O'Mara said.
The state was able to get a better interest rate -- 3.7 percent -- than the private contractors would have gotten had they gone to the bond market instead, O'Mara said. O'Mara said the state tax-exempt status of the bonds lowered the interest rate.
The companies performing the work, and splitting the money, are Ameresco, Noresco, Pepco Energy Services, Crane, Trane, Johnson Controls and Honeywell.
The two largest contracts include Noresco's $39.1 million project for the Department of Correction and Johnson Controls' $11.3 million project for DSU.
The retrofitting work is expected to be completed within the next year, O'Mara said. The work, he said, is expected to generate about 1,000 construction jobs.
Sen. Joe Booth, R-Georgetown, voted against making the SEU's bonds tax-exempt because "I think we've subsidized green energy enough."
The state is going to have to pay back the construction money, and he said he was concerned the energy savings would be difficult to measure.
"I have my suspicions about whether or not we're heading down the right road here," Booth said, worrying that the use
Page 1 of 2Sustainable Energy Utility gets $72.5M for retrofits
8/3/2011http://www.sparkweekly.com/apps/pbcs.dll/article?Date=20110802&Category=BUSINESS...

of the bonding route would expand to other applications. "Typically, government has no problem feeding upon itself."
But Gov. Jack Markell said the investment will make Delaware "a national leader in demonstrating both the economic and environmental benefits of energy conservation and efficiency."
Copyright © 2011, The News Journal. Users of this site agree to the Terms of Service and Privacy Policy/Your California Privacy Rights (Terms updated March 2007). Questions?
Page 2 of 2Sustainable Energy Utility gets $72.5M for retrofits
8/3/2011http://www.sparkweekly.com/apps/pbcs.dll/article?Date=20110802&Category=BUSINESS...
Working Group
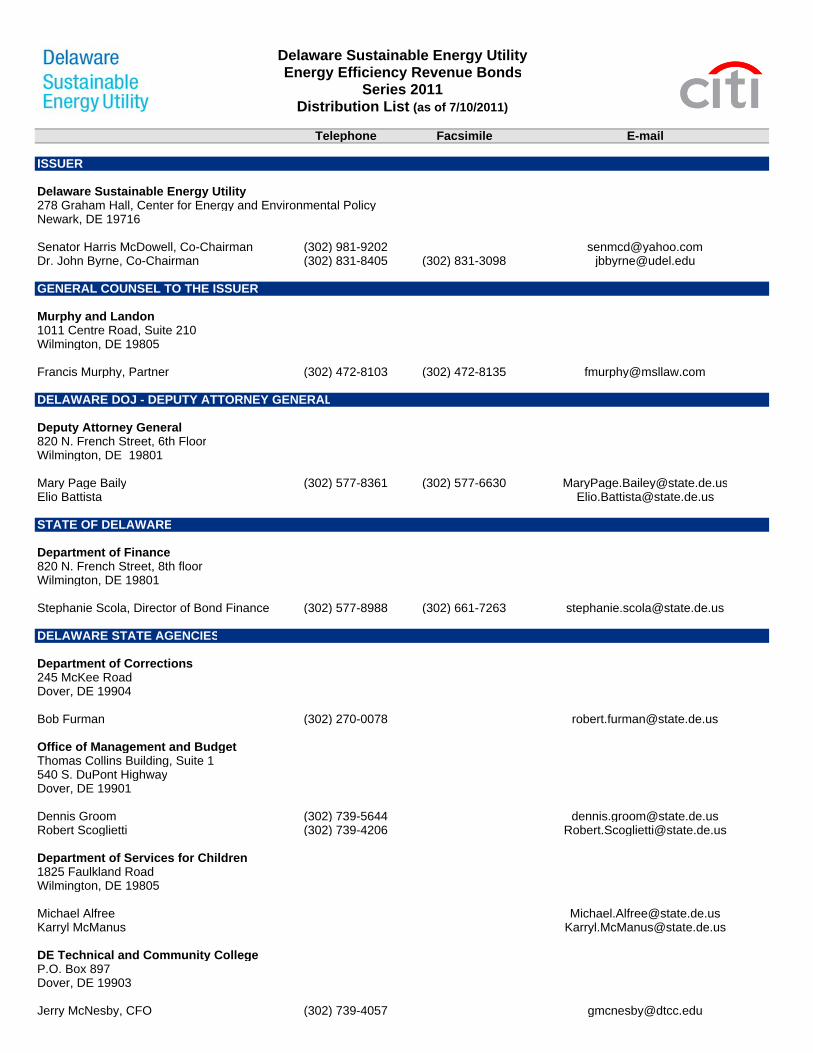
Delaware Sustainable Energy UtilityEnergy Efficiency Revenue Bonds
Series 2011Distribution List (as of 7/10/2011)
Telephone Facsimile E-mail
ISSUER
Delaware Sustainable Energy Utility278 Graham Hall, Center for Energy and Environmental PolicyNewark, DE 19716
Senator Harris McDowell, Co-Chairman (302) 981-9202 [email protected]. John Byrne, Co-Chairman (302) 831-8405 (302) 831-3098 [email protected]
GENERAL COUNSEL TO THE ISSUER
Murphy and Landon1011 Centre Road, Suite 210Wilmington, DE 19805
Francis Murphy, Partner (302) 472-8103 (302) 472-8135 [email protected]
DELAWARE DOJ - DEPUTY ATTORNEY GENERAL
Deputy Attorney General820 N. French Street, 6th FloorWilmington, DE 19801
Mary Page Baily (302) 577-8361 (302) 577-6630 [email protected] Battista [email protected]
STATE OF DELAWARE
Department of Finance820 N. French Street, 8th floorWilmington, DE 19801
Stephanie Scola, Director of Bond Finance (302) 577-8988 (302) 661-7263 [email protected]
DELAWARE STATE AGENCIES
Department of Corrections245 McKee RoadDover, DE 19904
Bob Furman (302) 270-0078 [email protected]
Office of Management and BudgetThomas Collins Building, Suite 1540 S. DuPont HighwayDover, DE 19901
Dennis Groom (302) 739-5644 [email protected] Scoglietti (302) 739-4206 [email protected]
Department of Services for Children1825 Faulkland RoadWilmington, DE 19805
Michael Alfree [email protected] McManus [email protected]
DE Technical and Community CollegeP.O. Box 897Dover, DE 19903
Jerry McNesby, CFO (302) 739-4057 [email protected]

Delaware Sustainable Energy UtilityEnergy Efficiency Revenue Bonds
Series 2011Distribution List (as of 7/10/2011)
Telephone Facsimile E-mail
Brian D. Shirey, DTCC Legal Counsel (302) 739-4064 [email protected]
DE State University1200 North Dupont HighwayDover, DE 19901
Sheila Winfrey-Brown (302) 857-7852 (302) 857-6203 [email protected] Mohammadi [email protected] Ninan, DSU Bond Counsel [email protected]
ESCOs
NORESCO11000 Regency Parkway; Suite 400Cary, NC 27518
Paul Carter (412) 849-5821 [email protected] Farren [email protected] Roberti [email protected]
Pepco Energy Services616 Burtis StreetBrick, NJ 08723
Wayne Leahy (609) 221-1291 [email protected] Veerabhadrappa [email protected] Marks [email protected] Moon [email protected] Patrick Sweeney [email protected]
Seiberlich Trane66 Southgate BlvdNew Castle, DE 19720
Doug Edwards (302) 395-0200 [email protected]
Honeywell Building Solutions[to come][to come]
Larry Doyle (610) 918-9435 [email protected]
AMERESCO3640 Everett St., Northwest Suite 100Washington DC 20008
Shelley H. Cohen (202) 422-4488 [email protected]
CO - FINANCIAL ADVISOR
Becker Capital and FinanceThe York435 E. 79th St. Suite 8-FNew York, NY 10075
Kenneth Becker, President (302) 740-6795 [email protected]

Delaware Sustainable Energy UtilityEnergy Efficiency Revenue Bonds
Series 2011Distribution List (as of 7/10/2011)
Telephone Facsimile E-mail
CO - FINANCIAL ADVISOR
NW Financial Group, LLC10 Exchange Place, 17th FloorJersey City, NJ 07302
Doug Bacher, Managing Director (201) 656-0115 (201) 656-4905 [email protected] Litzebauer, Vice President (201) 656-0115 (201) 656-4905 [email protected]
BOND COUNSEL
Drinker Biddle & Reath LLPOne Logan Square, Ste. 2000Philadelphia, PA 19103-6996
C. Baird Brown, Partner (215) 988-3338 (215) 988-2757 [email protected] Wood [email protected] Klock [email protected] Congdon (215) 988-2659 [email protected]
SERIES 2011A UNDERWRITER
Citi1650 Market Street; 42nd FloorPhiladelphia, PA 19103
Trenton Allen, Director (215) 478-5679 (215) 563-7881 [email protected]
390 Greenwich Street; 2nd FloorNew York, NY 10013
George Leung, Director (212) 723-5138 (212) 723-8939 [email protected] Smith, Associate (415) 951-1731 [email protected] Campo, Analyst (212) 723-9162 (212) 723-8939 [email protected]
UNDERWRITER'S COUNSEL
Miller Canfield225 W. Washington; Suite 2600Chicago, Illinois 60606
Paul D. Durbin, Senior Counsel (312) 460-4211 (312) 460-4201 [email protected] Rupley (313) 496-7521 (313) 496-8451 [email protected]
RATING AGENCIES
Moody's Investors Service7 World Trade CenterNew York, NY 10007
Emily Raimes, VP (212) 553-7203 [email protected] Larson, AVP (212) 553-0818 [email protected] Hampton, AVP (212) 553-2741 [email protected]
Standard and Poor's Rating Services55 Water StreetNew York, NY 10041
Robin Prunty, MD (212) 438-2081 [email protected] Marino (212) 438-2058 [email protected]

Final Numbers

Jul 26, 2011 8:33 pm Prepared by Citigroup Global Markets Inc. Page 1
SOURCES AND USES OF FUNDS
Delaware Sustainable Energy UtilityEnergy Efficiency Revenue Bonds, Series 2011
Aggregate Projects**FINAL PRICING NUMBERS**
Dated Date 08/01/2011Delivery Date 08/01/2011
Sources:
Bond Proceeds:Par Amount 67,435,000.00Net Premium 5,116,141.30
72,551,141.30
Other Sources of Funds:Equity Contribution 11,270,000.00
83,821,141.30
Uses:
Project Fund Deposits:Project Fund 75,102,694.00
Other Fund Deposits:Capitalized Interest Fund 7,320,037.12
Delivery Date Expenses:Cost of Issuance 711,785.00Underwriter's Discount 638,525.65Program Fee 44,426.55
1,394,737.20
Other Uses of Funds:Additional Proceeds 3,672.98
83,821,141.30
Notes: Equity is contributed for DOC, KIDS, and OMB to make INDIVIDUAL projects cashflow positive $11,270,000 equity contribution cap to come from the State of Delaware All Savings are escalated at 2.50% per year except for DSU DSU is escalated at 4.70% per executed GESA Construction period varies by project with Max 36 months (DOC) and Min 8 months (KIDS) On-going SEU fee of 6 basis points annually through 10 years SEU Upfront Fee of 50bps minus PV of 6bp On-Going fee included in COI COI includes DSU interim COI

Jul 26, 2011 8:33 pm Prepared by Citigroup Global Markets Inc. Page 2
SOURCES AND USES OF FUNDS
Delaware Sustainable Energy UtilityEnergy Efficiency Revenue Bonds, Series 2011
Aggregate Projects**FINAL PRICING NUMBERS**
Dated Date 08/01/2011Delivery Date 08/01/2011
OMB - CarvelOMB - and DTCC -
Department of OMB - Sussex Legislative Richardson/Rob DTCC - Terry Wilmington/Sta Delaware StateSources: Corrections KIDS County Mall bins Building Campus nton Campus University Total
Bond Proceeds:Par Amount 37,030,000.00 1,545,000.00 940,000.00 4,830,000.00 5,770,000.00 2,060,000.00 3,995,000.00 11,265,000.00 67,435,000.00Net Premium/OID 2,669,284.15 121,925.05 72,475.20 368,670.85 434,667.60 205,428.55 400,350.95 843,338.95 5,116,141.30
39,699,284.15 1,666,925.05 1,012,475.20 5,198,670.85 6,204,667.60 2,265,428.55 4,395,350.95 12,108,338.95 72,551,141.30
Other Sources of Funds:Equity Contribution 5,668,481.83 631,710.53 1,592,738.11 1,952,428.54 1,424,640.99 11,270,000.00
45,367,765.98 2,298,635.58 2,605,213.31 7,151,099.39 7,629,308.59 2,265,428.55 4,395,350.95 12,108,338.95 83,821,141.30
OMB - CarvelOMB - and DTCC -
Department of OMB - Sussex Legislative Richardson/Rob DTCC - Terry Wilmington/Sta Delaware StateUses: Corrections KIDS County Mall bins Building Campus nton Campus University Total
Project Fund Deposits:Project Fund 39,069,088.00 2,185,416.00 2,535,000.00 6,692,504.00 7,079,809.00 2,134,614.00 4,145,338.00 11,260,925.00 75,102,694.00
Other Fund Deposits:Capitalized Interest Fund 5,546,978.89 80,875.16 50,251.48 360,755.40 432,724.43 86,468.74 166,945.99 595,037.03 7,320,037.12
Delivery Date Expenses:Cost of Issuance 380,703.46 15,884.06 9,664.09 49,656.97 59,321.06 21,178.76 41,072.39 134,304.21 711,785.00Underwriter's Discount 356,847.61 14,599.59 8,984.93 45,601.32 54,592.51 17,020.29 33,024.99 107,854.41 638,525.65Program Fee 13,987.53 1,036.18 456.69 3,237.29 3,672.79 5,740.97 11,122.33 5,172.77 44,426.55
751,538.60 31,519.83 19,105.71 98,495.58 117,586.36 43,940.02 85,219.71 247,331.39 1,394,737.20
Other Uses of Funds:Additional Proceeds 160.49 824.59 856.12 -655.59 -811.20 405.79 -2,152.75 5,045.53 3,672.98
45,367,765.98 2,298,635.58 2,605,213.31 7,151,099.39 7,629,308.59 2,265,428.55 4,395,350.95 12,108,338.95 83,821,141.30

Jul 26, 2011 8:33 pm Prepared by Citigroup Global Markets Inc. Page 3
SOURCES AND USES OF FUNDS
Delaware Sustainable Energy UtilityEnergy Efficiency Revenue Bonds, Series 2011
Aggregate Projects**FINAL PRICING NUMBERS**
Notes: Equity is contributed for DOC, KIDS, and OMB to make INDIVIDUAL projects cashflow positive $11,270,000 equity contribution cap to come from the State of Delaware All Savings are escalated at 2.50% per year except for DSU DSU is escalated at 4.70% per executed GESA Construction period varies by project with Max 36 months (DOC) and Min 8 months (KIDS) On-going SEU fee of 6 basis points annually through 10 years SEU Upfront Fee of 50bps minus PV of 6bp On-Going fee included in COI COI includes DSU interim COI

Jul 26, 2011 8:33 pm Prepared by Citigroup Global Markets Inc. Page 4
BOND SUMMARY STATISTICS
Delaware Sustainable Energy UtilityEnergy Efficiency Revenue Bonds, Series 2011
Aggregate Projects**FINAL PRICING NUMBERS**
Dated Date 08/01/2011Delivery Date 08/01/2011Last Maturity 09/15/2034
Arbitrage Yield 3.697655%True Interest Cost (TIC) 4.072317%Net Interest Cost (NIC) 4.277112%All-In TIC 4.192214%Average Coupon 4.771812%
Average Life (years) 13.422Duration of Issue (years) 9.886
Par Amount 67,435,000.00Bond Proceeds 72,551,141.30Total Interest 43,190,481.40Net Interest 38,712,865.75Total Debt Service 110,625,481.40Maximum Annual Debt Service 6,322,225.00Average Annual Debt Service 4,784,379.30
Underwriter's Fees (per $1000) Average Takedown 4.744105 Other Fee 4.724652
Total Underwriter's Discount 9.468757
Bid Price 106.639899
Par Average AverageBond Component Value Price Coupon Life Duration
Serial Bond - bifurcated 3,400,000.00 110.600 4.485% 9.828 8.116Serial Bond 54,555,000.00 108.090 4.715% 12.167 10.001Term Bond 2034 9,480,000.00 103.612 5.000% 21.932 13.716
67,435,000.00 13.422
All-In ArbitrageTIC TIC Yield
Par Value 67,435,000.00 67,435,000.00 67,435,000.00 + Accrued Interest + Premium (Discount) 5,116,141.30 5,116,141.30 5,116,141.30 - Underwriter's Discount -638,525.65 -638,525.65 - Cost of Issuance Expense -711,785.00 - Other Amounts -44,426.55
Target Value 71,912,615.65 71,156,404.10 72,551,141.30
Target Date 08/01/2011 08/01/2011 08/01/2011Yield 4.072317% 4.192214% 3.697655%

Jul 26, 2011 8:33 pm Prepared by Citigroup Global Markets Inc. Page 5
BOND PRICING
Delaware Sustainable Energy UtilityEnergy Efficiency Revenue Bonds, Series 2011
Aggregate Projects**FINAL PRICING NUMBERS**
Maturity Yield to Call Call PremiumBond Component Date Amount Rate Yield Price Maturity Date Price (-Discount) Takedown
Serial Bond:09/15/2013 1,775,000 2.000% 0.650% 102.840 50,410.00 2.50009/15/2014 1,845,000 3.000% 1.000% 106.132 113,135.40 2.50009/15/2015 3,325,000 3.000% 1.280% 106.884 228,893.00 3.75009/15/2016 2,840,000 5.000% 1.640% 116.441 466,924.40 3.75009/15/2017 3,135,000 5.000% 2.040% 116.952 531,445.20 5.00009/15/2018 2,285,000 4.000% 2.460% 110.002 228,545.70 5.00009/15/2019 2,405,000 5.000% 2.790% 115.959 383,813.95 5.00009/15/2020 570,000 3.000% 3.060% 99.523 -2,718.90 5.00009/15/2021 2,655,000 5.000% 3.230% 115.175 402,896.25 5.00009/15/2022 2,805,000 5.000% 3.440% 113.235 C 3.549% 09/15/2021 100.000 371,241.75 5.00009/15/2023 2,940,000 5.000% 3.600% 111.784 C 3.779% 09/15/2021 100.000 346,449.60 5.00009/15/2024 3,080,000 3.500% 3.770% 97.222 -85,562.40 5.00009/15/2025 3,175,000 5.000% 3.900% 109.122 C 4.140% 09/15/2021 100.000 289,623.50 5.00009/15/2026 3,325,000 5.000% 3.990% 108.339 C 4.247% 09/15/2021 100.000 277,271.75 5.00009/15/2027 2,780,000 5.000% 4.080% 107.562 C 4.342% 09/15/2021 100.000 210,223.60 5.00009/15/2028 3,630,000 5.000% 4.170% 106.792 C 4.429% 09/15/2021 100.000 246,549.60 5.00009/15/2029 3,810,000 4.250% 4.440% 97.647 -89,649.30 5.00009/15/2030 3,960,000 5.000% 4.290% 105.775 C 4.544% 09/15/2021 100.000 228,690.00 5.00009/15/2031 4,215,000 5.000% 4.370% 105.104 C 4.608% 09/15/2021 100.000 215,133.60 5.000
54,555,000 4,413,316.70
Serial Bond - bifurcated:09/15/2016 400,000 3.000% 1.640% 106.654 26,616.00 3.75009/15/2017 300,000 4.000% 2.040% 111.224 33,672.00 5.00009/15/2020 2,000,000 5.000% 3.060% 115.336 306,720.00 5.00009/15/2027 700,000 4.000% 4.080% 99.057 -6,601.00 5.000
3,400,000 360,407.00
Term Bond 2034:09/15/2032 4,325,000 5.000% 4.550% 103.612 C 4.741% 09/15/2021 100.000 156,219.00 5.00009/15/2033 2,635,000 5.000% 4.550% 103.612 C 4.741% 09/15/2021 100.000 95,176.20 5.00009/15/2034 2,520,000 5.000% 4.550% 103.612 C 4.741% 09/15/2021 100.000 91,022.40 5.000
9,480,000 342,417.60
67,435,000 5,116,141.30

Jul 26, 2011 8:33 pm Prepared by Citigroup Global Markets Inc. Page 6
BOND PRICING
Delaware Sustainable Energy UtilityEnergy Efficiency Revenue Bonds, Series 2011
Aggregate Projects**FINAL PRICING NUMBERS**
Dated Date 08/01/2011Delivery Date 08/01/2011First Coupon 03/15/2012
Par Amount 67,435,000.00Premium 5,116,141.30
Production 72,551,141.30 107.586774%Underwriter's Discount -638,525.65 -0.946876%
Purchase Price 71,912,615.65 106.639899%Accrued Interest
Net Proceeds 71,912,615.65

Jul 26, 2011 8:33 pm Prepared by Citigroup Global Markets Inc. Page 7
BOND DEBT SERVICE
Delaware Sustainable Energy UtilityEnergy Efficiency Revenue Bonds, Series 2011
Aggregate Projects**FINAL PRICING NUMBERS**
Period AnnualEnding Principal Coupon Interest Debt Service Debt Service
03/15/2012 1,921,468.90 1,921,468.9009/15/2012 1,544,037.50 1,544,037.50 3,465,506.4003/15/2013 1,544,037.50 1,544,037.5009/15/2013 1,775,000 2.000% 1,544,037.50 3,319,037.50 4,863,075.0003/15/2014 1,526,287.50 1,526,287.5009/15/2014 1,845,000 3.000% 1,526,287.50 3,371,287.50 4,897,575.0003/15/2015 1,498,612.50 1,498,612.5009/15/2015 3,325,000 3.000% 1,498,612.50 4,823,612.50 6,322,225.0003/15/2016 1,448,737.50 1,448,737.5009/15/2016 3,240,000 ** 1,448,737.50 4,688,737.50 6,137,475.0003/15/2017 1,371,737.50 1,371,737.5009/15/2017 3,435,000 ** 1,371,737.50 4,806,737.50 6,178,475.0003/15/2018 1,287,362.50 1,287,362.5009/15/2018 2,285,000 4.000% 1,287,362.50 3,572,362.50 4,859,725.0003/15/2019 1,241,662.50 1,241,662.5009/15/2019 2,405,000 5.000% 1,241,662.50 3,646,662.50 4,888,325.0003/15/2020 1,181,537.50 1,181,537.5009/15/2020 2,570,000 ** 1,181,537.50 3,751,537.50 4,933,075.0003/15/2021 1,122,987.50 1,122,987.5009/15/2021 2,655,000 5.000% 1,122,987.50 3,777,987.50 4,900,975.0003/15/2022 1,056,612.50 1,056,612.5009/15/2022 2,805,000 5.000% 1,056,612.50 3,861,612.50 4,918,225.0003/15/2023 986,487.50 986,487.5009/15/2023 2,940,000 5.000% 986,487.50 3,926,487.50 4,912,975.0003/15/2024 912,987.50 912,987.5009/15/2024 3,080,000 3.500% 912,987.50 3,992,987.50 4,905,975.0003/15/2025 859,087.50 859,087.5009/15/2025 3,175,000 5.000% 859,087.50 4,034,087.50 4,893,175.0003/15/2026 779,712.50 779,712.5009/15/2026 3,325,000 5.000% 779,712.50 4,104,712.50 4,884,425.0003/15/2027 696,587.50 696,587.5009/15/2027 3,480,000 ** 696,587.50 4,176,587.50 4,873,175.0003/15/2028 613,087.50 613,087.5009/15/2028 3,630,000 5.000% 613,087.50 4,243,087.50 4,856,175.0003/15/2029 522,337.50 522,337.5009/15/2029 3,810,000 4.250% 522,337.50 4,332,337.50 4,854,675.0003/15/2030 441,375.00 441,375.0009/15/2030 3,960,000 5.000% 441,375.00 4,401,375.00 4,842,750.0003/15/2031 342,375.00 342,375.0009/15/2031 4,215,000 5.000% 342,375.00 4,557,375.00 4,899,750.0003/15/2032 237,000.00 237,000.0009/15/2032 4,325,000 5.000% 237,000.00 4,562,000.00 4,799,000.0003/15/2033 128,875.00 128,875.0009/15/2033 2,635,000 5.000% 128,875.00 2,763,875.00 2,892,750.0003/15/2034 63,000.00 63,000.0009/15/2034 2,520,000 5.000% 63,000.00 2,583,000.00 2,646,000.00
67,435,000 43,190,481.40 110,625,481.40 110,625,481.40

Jul 26, 2011 8:33 pm Prepared by Citigroup Global Markets Inc. Page 8
BOND DEBT SERVICE
Delaware Sustainable Energy UtilityEnergy Efficiency Revenue Bonds, Series 2011
Aggregate Projects**FINAL PRICING NUMBERS**
PeriodEnding Principal Coupon Interest Debt Service
09/15/2012 3,465,506.40 3,465,506.4009/15/2013 1,775,000 2.000% 3,088,075.00 4,863,075.0009/15/2014 1,845,000 3.000% 3,052,575.00 4,897,575.0009/15/2015 3,325,000 3.000% 2,997,225.00 6,322,225.0009/15/2016 3,240,000 ** 2,897,475.00 6,137,475.0009/15/2017 3,435,000 ** 2,743,475.00 6,178,475.0009/15/2018 2,285,000 4.000% 2,574,725.00 4,859,725.0009/15/2019 2,405,000 5.000% 2,483,325.00 4,888,325.0009/15/2020 2,570,000 ** 2,363,075.00 4,933,075.0009/15/2021 2,655,000 5.000% 2,245,975.00 4,900,975.0009/15/2022 2,805,000 5.000% 2,113,225.00 4,918,225.0009/15/2023 2,940,000 5.000% 1,972,975.00 4,912,975.0009/15/2024 3,080,000 3.500% 1,825,975.00 4,905,975.0009/15/2025 3,175,000 5.000% 1,718,175.00 4,893,175.0009/15/2026 3,325,000 5.000% 1,559,425.00 4,884,425.0009/15/2027 3,480,000 ** 1,393,175.00 4,873,175.0009/15/2028 3,630,000 5.000% 1,226,175.00 4,856,175.0009/15/2029 3,810,000 4.250% 1,044,675.00 4,854,675.0009/15/2030 3,960,000 5.000% 882,750.00 4,842,750.0009/15/2031 4,215,000 5.000% 684,750.00 4,899,750.0009/15/2032 4,325,000 5.000% 474,000.00 4,799,000.0009/15/2033 2,635,000 5.000% 257,750.00 2,892,750.0009/15/2034 2,520,000 5.000% 126,000.00 2,646,000.00
67,435,000 43,190,481.40 110,625,481.40

Jul 26, 2011 8:33 pm Prepared by Citigroup Global Markets Inc. Page 9
NET DEBT SERVICE
Delaware Sustainable Energy UtilityEnergy Efficiency Revenue Bonds, Series 2011
Aggregate Projects**FINAL PRICING NUMBERS**
Period Total SEU Admin M & V Fee Capitalized NetEnding Debt Service Fee (ESCO) Trustee Fee Interest Fund Debt Service
09/15/2012 3,465,506.40 40,461 7,218.33 15,000 -3,520,967.40 7,218.3309/15/2013 4,863,075.00 40,461 165,142.58 15,000 -2,021,431.11 3,062,247.4709/15/2014 4,897,575.00 39,396 159,013.07 15,000 -1,777,638.61 3,333,345.4609/15/2015 6,322,225.00 38,289 293,808.27 15,000 6,669,322.2709/15/2016 6,137,475.00 36,294 251,400.72 15,000 6,440,169.7209/15/2017 6,178,475.00 34,350 259,472.66 15,000 6,487,297.6609/15/2018 4,859,725.00 32,289 266,817.90 12,500 5,171,331.9009/15/2019 4,888,325.00 30,918 254,897.92 12,500 5,186,640.9209/15/2020 4,933,075.00 29,475 263,144.87 12,500 5,238,194.8709/15/2021 4,900,975.00 27,933 271,653.05 12,500 5,213,061.0509/15/2022 4,918,225.00 280,451.06 12,500 5,211,176.0609/15/2023 4,912,975.00 289,523.39 12,500 5,214,998.3909/15/2024 4,905,975.00 298,895.64 12,500 5,217,370.6409/15/2025 4,893,175.00 308,584.64 12,500 5,214,259.6409/15/2026 4,884,425.00 317,328.07 12,500 5,214,253.0709/15/2027 4,873,175.00 307,294.13 12,500 5,192,969.1309/15/2028 4,856,175.00 317,309.73 12,500 5,185,984.7309/15/2029 4,854,675.00 327,655.33 12,500 5,194,830.3309/15/2030 4,842,750.00 338,340.81 12,500 5,193,590.8109/15/2031 4,899,750.00 362,622.34 12,500 5,274,872.3409/15/2032 4,799,000.00 353,105.12 11,250 5,163,355.1209/15/2033 2,892,750.00 141,360.83 6,250 3,040,360.8309/15/2034 2,646,000.00 133,430.92 6,250 2,785,680.92
110,625,481.40 349,866 5,968,471.38 288,750 -7,320,037.12 109,912,531.66

Jul 26, 2011 8:33 pm Prepared by Citigroup Global Markets Inc. Page 10
NET DEBT SERVICE
Delaware Sustainable Energy UtilityEnergy Efficiency Revenue Bonds, Series 2011
Aggregate Projects**FINAL PRICING NUMBERS**
Period Total M & V Fee Capitalized Net AnnualEnding Debt Service SEU Admin Fee (ESCO) Trustee Fee Interest Fund Debt Service Net D/S
03/15/2012 1,921,468.90 20,230.50 -1,941,699.4009/15/2012 1,544,037.50 20,230.50 7,218.33 15,000 -1,579,268.00 7,218.33 7,218.3303/15/2013 1,544,037.50 20,230.50 -1,130,614.00 433,654.0009/15/2013 3,319,037.50 20,230.50 165,142.58 15,000 -890,817.11 2,628,593.47 3,062,247.4703/15/2014 1,526,287.50 19,698.00 -886,821.50 659,164.0009/15/2014 3,371,287.50 19,698.00 159,013.07 15,000 -890,817.11 2,674,181.46 3,333,345.4603/15/2015 1,498,612.50 19,144.50 1,517,757.0009/15/2015 4,823,612.50 19,144.50 293,808.27 15,000 5,151,565.27 6,669,322.2703/15/2016 1,448,737.50 18,147.00 1,466,884.5009/15/2016 4,688,737.50 18,147.00 251,400.72 15,000 4,973,285.22 6,440,169.7203/15/2017 1,371,737.50 17,175.00 1,388,912.5009/15/2017 4,806,737.50 17,175.00 259,472.66 15,000 5,098,385.16 6,487,297.6603/15/2018 1,287,362.50 16,144.50 1,303,507.0009/15/2018 3,572,362.50 16,144.50 266,817.90 12,500 3,867,824.90 5,171,331.9003/15/2019 1,241,662.50 15,459.00 1,257,121.5009/15/2019 3,646,662.50 15,459.00 254,897.92 12,500 3,929,519.42 5,186,640.9203/15/2020 1,181,537.50 14,737.50 1,196,275.0009/15/2020 3,751,537.50 14,737.50 263,144.87 12,500 4,041,919.87 5,238,194.8703/15/2021 1,122,987.50 13,966.50 1,136,954.0009/15/2021 3,777,987.50 13,966.50 271,653.05 12,500 4,076,107.05 5,213,061.0503/15/2022 1,056,612.50 1,056,612.5009/15/2022 3,861,612.50 280,451.06 12,500 4,154,563.56 5,211,176.0603/15/2023 986,487.50 986,487.5009/15/2023 3,926,487.50 289,523.39 12,500 4,228,510.89 5,214,998.3903/15/2024 912,987.50 912,987.5009/15/2024 3,992,987.50 298,895.64 12,500 4,304,383.14 5,217,370.6403/15/2025 859,087.50 859,087.5009/15/2025 4,034,087.50 308,584.64 12,500 4,355,172.14 5,214,259.6403/15/2026 779,712.50 779,712.5009/15/2026 4,104,712.50 317,328.07 12,500 4,434,540.57 5,214,253.0703/15/2027 696,587.50 696,587.5009/15/2027 4,176,587.50 307,294.13 12,500 4,496,381.63 5,192,969.1303/15/2028 613,087.50 613,087.5009/15/2028 4,243,087.50 317,309.73 12,500 4,572,897.23 5,185,984.7303/15/2029 522,337.50 522,337.5009/15/2029 4,332,337.50 327,655.33 12,500 4,672,492.83 5,194,830.3303/15/2030 441,375.00 441,375.0009/15/2030 4,401,375.00 338,340.81 12,500 4,752,215.81 5,193,590.8103/15/2031 342,375.00 342,375.0009/15/2031 4,557,375.00 362,622.34 12,500 4,932,497.34 5,274,872.3403/15/2032 237,000.00 237,000.0009/15/2032 4,562,000.00 353,105.12 11,250 4,926,355.12 5,163,355.1203/15/2033 128,875.00 128,875.0009/15/2033 2,763,875.00 141,360.83 6,250 2,911,485.83 3,040,360.8303/15/2034 63,000.00 63,000.0009/15/2034 2,583,000.00 133,430.92 6,250 2,722,680.92 2,785,680.92
110,625,481.40 349,866.00 5,968,471.38 288,750 -7,320,037.12 109,912,531.66 109,912,531.66

Delaware Sustainable Energy UtilityEnergy Efficiency Revenue Bonds, Series 2011Aggregated ProjectsProject Summary Statistics - Bond Years
FINAL PROJECTS AND PRICING
Construction Period **Blended** monthsFinancing Term 20 years from end of constructionGESA Escalator **Blended**Equity Contribution:
Project Fund: $11,270,000 Capitalized Interest Contribution $-
All Projects
Project FinancingProject Cost $75,102,694 Par Amount $67,435,000Monthly Draws n/a Average Life (years) 13.42Baseline Annual Savings $5,601,169 Net Savings (w/ equity) $26,706,874Simple Payback (years) 14.72 Net Savings % of Proj 35.560%
Guaranteed Savings Principal Interest D/S Cap_I M&V SEU Trustee Installment Payments Total Payments Surplus / (Deficit)
9/15/2012 62,325 - 3,465,506 3,465,506 (3,520,967) 7,218 40,461 15,000 - 7,218 55,107 9/15/2013 2,226,689 1,775,000 3,088,075 4,863,075 (2,021,431) 165,143 40,461 15,000 2,897,105 3,062,247 (835,559) 9/15/2014 2,526,188 1,845,000 3,052,575 4,897,575 (1,777,639) 159,013 39,396 15,000 3,174,332 3,333,345 (807,158)
1 9/15/2015 6,036,759 3,325,000 2,997,225 6,322,225 - 293,808 38,289 15,000 6,375,514 6,669,322 (632,564) 2 9/15/2016 5,936,118 3,240,000 2,897,475 6,137,475 - 251,401 36,294 15,000 6,188,769 6,440,170 (504,052) 3 9/15/2017 6,106,260 3,435,000 2,743,475 6,178,475 - 259,473 34,350 15,000 6,227,825 6,487,298 (381,038) 4 9/15/2018 6,295,499 2,285,000 2,574,725 4,859,725 - 266,818 32,289 12,500 4,904,514 5,171,332 1,124,167 5 9/15/2019 6,472,822 2,405,000 2,483,325 4,888,325 - 254,898 30,918 12,500 4,931,743 5,186,641 1,286,182 6 9/15/2020 6,621,950 2,570,000 2,363,075 4,933,075 - 263,145 29,475 12,500 4,975,050 5,238,195 1,383,755 7 9/15/2021 6,806,474 2,655,000 2,245,975 4,900,975 - 271,653 27,933 12,500 4,941,408 5,213,061 1,593,413 8 9/15/2022 6,999,744 2,805,000 2,113,225 4,918,225 - 280,451 - 12,500 4,930,725 5,211,176 1,788,567 9 9/15/2023 7,198,951 2,940,000 1,972,975 4,912,975 - 289,523 - 12,500 4,925,475 5,214,998 1,983,952
10 9/15/2024 7,404,299 3,080,000 1,825,975 4,905,975 - 298,896 - 12,500 4,918,475 5,217,371 2,186,928 11 9/15/2025 7,615,998 3,175,000 1,718,175 4,893,175 - 308,585 - 12,500 4,905,675 5,214,260 2,401,738 12 9/15/2026 7,834,266 3,325,000 1,559,425 4,884,425 - 317,328 - 12,500 4,896,925 5,214,253 2,620,012 13 9/15/2027 8,059,326 3,480,000 1,393,175 4,873,175 - 307,294 - 12,500 4,885,675 5,192,969 2,866,357 14 9/15/2028 8,291,417 3,630,000 1,226,175 4,856,175 - 317,310 - 12,500 4,868,675 5,185,985 3,105,432 15 9/15/2029 8,530,780 3,810,000 1,044,675 4,854,675 - 327,655 - 12,500 4,867,175 5,194,830 3,335,950 16 9/15/2030 8,777,667 3,960,000 882,750 4,842,750 - 338,341 - 12,500 4,855,250 5,193,591 3,584,076 17 9/15/2031 9,171,834 4,215,000 684,750 4,899,750 - 362,622 - 12,500 4,912,250 5,274,872 3,896,961 18 9/15/2032 9,344,544 4,325,000 474,000 4,799,000 - 353,105 - 11,250 4,810,250 5,163,355 4,181,189 19 9/15/2033 4,938,764 2,635,000 257,750 2,892,750 - 141,361 - 6,250 2,899,000 3,040,361 1,898,403 20 9/15/2034 4,630,733 2,520,000 126,000 2,646,000 - 133,431 - 6,250 2,652,250 2,785,681 1,845,052
Totals: $147,889,405 $67,435,000 $43,190,481 $110,625,481 ($7,320,037) $5,968,471 $349,866 $288,750 $103,944,060 $109,912,532 $37,976,874
1 Bond Years schedule reports by bond year (September 15)2 Schedules incorporate capitalized interest deposit and upfront SEU Fees3 Financing Term is calculated from the end of construction period to final bond maturity4 Contracted Annual Savings is baseline savings number provided in GESA contracts in which we escalate off of5 Debt Service Inflation assumed at 0% for all projects6 Simple Payback is Project Cost + Capitalized Interest / contracted annual savings7 Equity is contributed by all in order to make individual projects cashflow positive on annual basis

Delaware Sustainable Energy UtilityEnergy Efficiency Revenue Bonds, Series 2011
Aggregated Projects
0
1
2
3
4
5
6
7
8
9
10
1 2 3 4 5 6 7 8 9 10 11 12 13 14 15 16 17 18 19 20 21 22 23
Year
Deb
t Ser
vice
/ Sa
ving
s ($
mill
ions
)
Installment Payments
Guaranteed Savings

Delaware Sustainable Energy UtilityEnergy Efficiency Revenue Bonds, Series 2011
Aggregated Projects
$147.889
$109.913
$11.270
0
20
40
60
80
100
120
140
160
Aggregate Guaranteed Savings Aggregate Payments
Deb
t Ser
vice
/ Sa
ving
s ($
mill
ions
)
Net Savings:$26.707

Delaware Sustainable Energy UtilityEnergy Efficiency Revenue Bonds, Series 2011Department of CorrectionsProject Summary Statistics - Bond Years
FINAL PROJECT AND PRICING NUMBERS
Construction Period 36 monthsFinancing Term 20 yearsGESA Escalator 2.50%Equity Contribution:
Project Fund: $5,668,482 Capitalized Interest Contribution $-
DOC
Project FinancingProject Cost $39,069,088 Par Amount $37,030,000Monthly Draws $1,085,252 Average Life (years) 14.99Baseline Annual Savings $3,159,984 Net Savings (w/ equity) $14,286,614Simple Payback (years) 14.12 Net Savings % of Proj 36.568%
Guaranteed Savings Principal Interest D/S Cap_I M&V SEU Trustee Installment Payments Total Payments Surplus / (Deficit)
9/15/2012 - - 1,965,488 1,965,488 (1,991,702) - 22,218 3,996 0 0 (0) 9/15/2013 - - 1,751,425 1,751,425 (1,777,639) - 22,218 3,996 (0) (0) 0 9/15/2014 - - 1,751,425 1,751,425 (1,777,639) - 22,218 3,996 (0) (0) 0
1 9/15/2015 3,429,899 1,385,000 1,751,425 3,136,425 - 129,722 22,218 3,996 3,162,639 3,292,361 137,539 2 9/15/2016 3,245,731 1,220,000 1,709,875 2,929,875 - 82,073 21,387 3,996 2,955,258 3,037,330 208,401 3 9/15/2017 3,326,875 1,275,000 1,652,975 2,927,975 - 84,740 20,655 3,996 2,952,626 3,037,366 289,509 4 9/15/2018 3,410,047 1,335,000 1,590,775 2,925,775 - 87,494 19,890 4,266 2,949,931 3,037,426 372,621 5 9/15/2019 3,495,298 1,385,000 1,537,375 2,922,375 - 90,338 19,089 4,266 2,945,730 3,036,068 459,229 6 9/15/2020 3,582,680 1,460,000 1,468,125 2,928,125 - 93,274 18,258 4,266 2,950,649 3,043,923 538,757 7 9/15/2021 3,672,247 1,515,000 1,401,525 2,916,525 - 96,305 17,382 4,266 2,938,173 3,034,479 637,769 8 9/15/2022 3,764,053 1,610,000 1,325,775 2,935,775 - 99,436 - 4,266 2,940,041 3,039,477 724,576 9 9/15/2023 3,858,155 1,685,000 1,245,275 2,930,275 - 102,666 - 4,266 2,934,541 3,037,208 820,947
10 9/15/2024 3,954,609 1,765,000 1,161,025 2,926,025 - 106,003 - 4,266 2,930,291 3,036,295 918,314 11 9/15/2025 4,053,474 1,825,000 1,099,250 2,924,250 - 109,449 - 4,266 2,928,516 3,037,965 1,015,509 12 9/15/2026 4,154,811 1,915,000 1,008,000 2,923,000 - 113,005 - 4,266 2,927,266 3,040,272 1,114,539 13 9/15/2027 4,258,681 2,005,000 912,250 2,917,250 - 116,678 - 4,266 2,921,516 3,038,195 1,220,486 14 9/15/2028 4,365,148 2,095,000 816,000 2,911,000 - 120,470 - 4,266 2,915,266 3,035,737 1,329,411 15 9/15/2029 4,474,277 2,200,000 711,250 2,911,250 - 124,386 - 4,266 2,915,516 3,039,902 1,434,374 16 9/15/2030 4,586,134 2,285,000 617,750 2,902,750 - 128,428 - 4,266 2,907,016 3,035,444 1,550,689 17 9/15/2031 4,700,787 2,400,000 503,500 2,903,500 - 132,602 - 4,266 2,907,766 3,040,369 1,660,418 18 9/15/2032 4,818,307 2,515,000 383,500 2,898,500 - 136,912 - 4,344 2,902,844 3,039,756 1,778,551 19 9/15/2033 4,938,764 2,635,000 257,750 2,892,750 - 141,361 - 6,250 2,899,000 3,040,361 1,898,403 20 9/15/2034 4,630,733 2,520,000 126,000 2,646,000 - 133,431 - 6,250 2,652,250 2,785,681 1,845,052
Totals: $80,720,709 $37,030,000 $26,747,738 $63,777,738 ($5,546,979) $2,228,773 $205,533 $100,548 $58,536,840 $60,765,613 $19,955,096
1 Bond Years schedule reports by bond year (September 15)2 Schedules incorporate capitalized interest deposit and upfront SEU Fees3 Financing Term is calculated from the end of construction period to final bond maturity4 Contracted Annual Savings is baseline savings number provided in GESA contracts in which we escalate off of5 Debt Service Inflation assumed at 0% for all projects6 Simple Payback is Project Cost + Capitalized Interest / contracted annual savings7 Equity is contributed by all in order to make individual projects cashflow positive on annual basis

Delaware Sustainable Energy UtilityEnergy Efficiency Revenue Bonds, Series 2011Department of Services for Children, Youth, and their FamiliesProject Summary Statistics - Bond Years
FINAL PROJECT AND PRICING NUMBERS
Construction Period 8 monthsFinancing Term 20 yearsGESA Escalator 2.50%Equity Contribution:
Project Fund: $631,711 Capitalized Interest Contribution $-
KIDS
Project FinancingProject Cost $2,185,416 Par Amount $1,545,000Monthly Draws $273,177 Average Life (years) 12.63Contracted Annual Savings $149,580 Net Savings (w/ equity) $420,597Simple Payback (years) 15.15 Net Savings % of Proj 19.246%
Guaranteed Savings Principal Interest D/S Cap_I M&V SEU Trustee Installment Payments Total Payments Surplus / (Deficit)
1 9/15/2012 62,325 - 78,584 78,584 (80,875) 7,218 927 1,365 (0) 7,218 55,107 2 9/15/2013 151,138 55,000 70,025 125,025 - 15,425 927 1,365 127,317 142,741 8,397 3 9/15/2014 154,917 55,000 68,925 123,925 - 12,939 894 1,365 126,184 139,122 15,794 4 9/15/2015 158,789 60,000 67,275 127,275 - 13,359 861 1,365 129,501 142,860 15,930 5 9/15/2016 162,759 60,000 65,475 125,475 - 13,793 825 1,365 127,665 141,458 21,302 6 9/15/2017 166,828 60,000 62,675 122,675 - 14,241 789 1,365 124,829 139,070 27,758 7 9/15/2018 170,999 65,000 59,775 124,775 - 14,704 753 1,376 126,904 141,608 29,391 8 9/15/2019 175,274 65,000 57,175 122,175 - 15,182 714 1,376 124,265 139,447 35,827 9 9/15/2020 179,656 75,000 53,925 128,925 - 15,676 675 1,376 130,976 146,651 33,004
10 9/15/2021 184,147 70,000 50,275 120,275 - 16,185 630 1,376 122,281 138,466 45,681 11 9/15/2022 188,751 70,000 46,775 116,775 - 16,711 - 1,376 118,151 134,862 53,889 12 9/15/2023 193,470 80,000 43,275 123,275 - 17,254 - 1,376 124,651 141,905 51,564 13 9/15/2024 198,306 85,000 39,275 124,275 - 17,815 - 1,376 125,651 143,466 54,841 14 9/15/2025 203,264 85,000 36,300 121,300 - 18,394 - 1,376 122,676 141,070 62,194 15 9/15/2026 208,346 90,000 32,050 122,050 - 18,992 - 1,376 123,426 142,418 65,928 16 9/15/2027 213,554 95,000 27,550 122,550 - 19,609 - 1,376 123,926 143,535 70,019 17 9/15/2028 218,893 95,000 23,000 118,000 - 20,246 - 1,376 119,376 139,622 79,271 18 9/15/2029 224,365 100,000 18,250 118,250 - 20,904 - 1,376 119,626 140,530 83,835 19 9/15/2030 229,975 105,000 14,000 119,000 - 21,583 - 1,376 120,376 141,959 88,015 20 9/15/2031 375,214 175,000 8,750 183,750 - 35,528 - 1,376 185,126 220,654 154,561
Totals: $3,820,970 $1,545,000 $923,334 $2,468,334 ($80,875) $345,760 $7,995 $27,449 $2,422,903 $2,768,663 $1,052,307
1 Bond Years schedule reports by bond year (September 15)2 Schedules incorporate capitalized interest deposit and upfront SEU Fees3 Financing Term is calculated from the end of construction period to final bond maturity4 Contracted Annual Savings is baseline savings number provided in GESA contracts in which we escalate off of5 Inflation assumed at 0% for all projects6 Simple Payback is Project Cost + Capitalized Interest / contracted annual savings7 Equity is contributed by all in order to make individual projects cashflow positive on annual basis

Delaware Sustainable Energy UtilityEnergy Efficiency Revenue Bonds, Series 2011OMB - Sussex CountyProject Summary Statistics - Bond Years
FINAL PROJECT AND PRICING NUMBERS
Construction Period 12 monthsFinancing Term 20 yearsGESA Escalator 2.50%Equity Contribution:
Project Fund: $1,592,738 Capitalized Interest Contribution $-
OMB Sussex
Project FinancingProject Cost $2,535,000 Par Amount $940,000Monthly Draws $211,250 Average Life (years) 13.20Baseline Annual Savings $113,804 Net Savings (w/ equity) -$452,157Simple Payback (years) 22.72 Net Savings % of Proj -17.837%
Guaranteed Savings Principal Interest D/S Cap_I M&V SEU Trustee Installment Payments Total Payments Surplus / (Deficit)
9/15/2012 - - 48,368 48,368 (50,251) - 564 1,320 (0) (0) 0 1 9/15/2013 123,525 15,000 43,100 58,100 - 43,975 564 1,320 59,984 103,959 19,566 2 9/15/2014 116,892 25,000 42,800 67,800 - 27,391 555 1,320 69,675 97,066 19,826 3 9/15/2015 119,814 25,000 42,050 67,050 - 28,487 540 1,320 68,910 97,396 22,418 4 9/15/2016 122,810 20,000 41,300 61,300 - 29,626 525 1,320 63,145 92,771 30,039 5 9/15/2017 128,388 25,000 40,600 65,600 - 30,811 513 1,320 67,433 98,244 30,144 6 9/15/2018 159,181 45,000 39,450 84,450 - 32,044 498 1,327 86,275 118,318 40,863 7 9/15/2019 163,160 45,000 37,650 82,650 - 33,325 471 1,327 84,448 117,773 45,388 8 9/15/2020 167,240 50,000 35,400 85,400 - 34,658 444 1,327 87,171 121,829 45,411 9 9/15/2021 171,420 55,000 32,900 87,900 - 36,045 414 1,327 89,641 125,685 45,735
10 9/15/2022 175,706 55,000 30,150 85,150 - 37,486 - 1,327 86,477 123,963 51,743 11 9/15/2023 180,099 60,000 27,400 87,400 - 38,986 - 1,327 88,727 127,713 52,386 12 9/15/2024 184,601 60,000 24,400 84,400 - 40,545 - 1,327 85,727 126,272 58,329 13 9/15/2025 189,216 60,000 22,300 82,300 - 42,167 - 1,327 83,627 125,794 63,422 14 9/15/2026 193,947 55,000 19,300 74,300 - 43,854 - 1,327 75,627 119,480 74,466 15 9/15/2027 198,795 55,000 16,550 71,550 - 45,608 - 1,327 72,877 118,485 80,311 16 9/15/2028 203,765 55,000 14,050 69,050 - 47,432 - 1,327 70,377 117,809 85,956 17 9/15/2029 208,859 60,000 11,300 71,300 - 49,330 - 1,327 72,627 121,956 86,903 18 9/15/2030 214,081 60,000 8,750 68,750 - 51,303 - 1,327 70,077 121,379 92,701 19 9/15/2031 219,433 60,000 5,750 65,750 - 53,355 - 1,327 67,077 120,432 99,001 20 9/15/2032 205,747 55,000 2,750 57,750 - 50,696 - 1,329 59,079 109,775 95,972
Totals: $3,446,678 $940,000 $586,318 $1,526,318 ($50,251) $797,125 $5,088 $27,819 $1,508,973 $2,306,098 $1,140,581
1 Bond Years schedule reports by bond year (September 15)2 Schedules incorporate capitalized interest deposit and upfront SEU Fees3 Financing Term is calculated from the end of construction period to final bond maturity4 Contracted Annual Savings is baseline savings number provided in GESA contracts in which we escalate off of5 Debt Service Inflation assumed at 0% for all projects6 Guaranteed Savings stream inflated at 2.50% and incorporates decreased gas cost after year 57 Simple Payback is Project Cost + Capitalized Interest / contracted annual savings8 Equity is contributed by all in order to make individual projects cashflow positive on annual basis
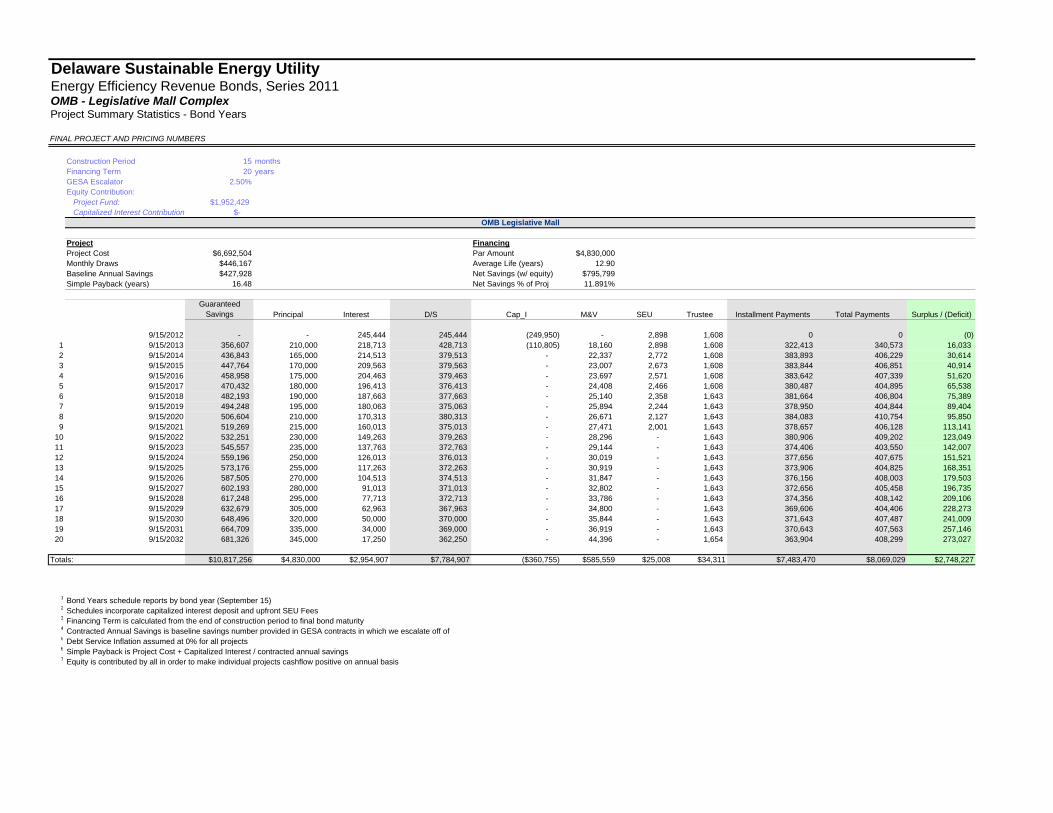
Delaware Sustainable Energy UtilityEnergy Efficiency Revenue Bonds, Series 2011OMB - Legislative Mall ComplexProject Summary Statistics - Bond Years
FINAL PROJECT AND PRICING NUMBERS
Construction Period 15 monthsFinancing Term 20 yearsGESA Escalator 2.50%Equity Contribution:
Project Fund: $1,952,429 Capitalized Interest Contribution $-
OMB Legislative Mall
Project FinancingProject Cost $6,692,504 Par Amount $4,830,000Monthly Draws $446,167 Average Life (years) 12.90Baseline Annual Savings $427,928 Net Savings (w/ equity) $795,799Simple Payback (years) 16.48 Net Savings % of Proj 11.891%
Guaranteed Savings Principal Interest D/S Cap_I M&V SEU Trustee Installment Payments Total Payments Surplus / (Deficit)
9/15/2012 - - 245,444 245,444 (249,950) - 2,898 1,608 0 0 (0) 1 9/15/2013 356,607 210,000 218,713 428,713 (110,805) 18,160 2,898 1,608 322,413 340,573 16,033 2 9/15/2014 436,843 165,000 214,513 379,513 - 22,337 2,772 1,608 383,893 406,229 30,614 3 9/15/2015 447,764 170,000 209,563 379,563 - 23,007 2,673 1,608 383,844 406,851 40,914 4 9/15/2016 458,958 175,000 204,463 379,463 - 23,697 2,571 1,608 383,642 407,339 51,620 5 9/15/2017 470,432 180,000 196,413 376,413 - 24,408 2,466 1,608 380,487 404,895 65,538 6 9/15/2018 482,193 190,000 187,663 377,663 - 25,140 2,358 1,643 381,664 406,804 75,389 7 9/15/2019 494,248 195,000 180,063 375,063 - 25,894 2,244 1,643 378,950 404,844 89,404 8 9/15/2020 506,604 210,000 170,313 380,313 - 26,671 2,127 1,643 384,083 410,754 95,850 9 9/15/2021 519,269 215,000 160,013 375,013 - 27,471 2,001 1,643 378,657 406,128 113,141
10 9/15/2022 532,251 230,000 149,263 379,263 - 28,296 - 1,643 380,906 409,202 123,049 11 9/15/2023 545,557 235,000 137,763 372,763 - 29,144 - 1,643 374,406 403,550 142,007 12 9/15/2024 559,196 250,000 126,013 376,013 - 30,019 - 1,643 377,656 407,675 151,521 13 9/15/2025 573,176 255,000 117,263 372,263 - 30,919 - 1,643 373,906 404,825 168,351 14 9/15/2026 587,505 270,000 104,513 374,513 - 31,847 - 1,643 376,156 408,003 179,503 15 9/15/2027 602,193 280,000 91,013 371,013 - 32,802 - 1,643 372,656 405,458 196,735 16 9/15/2028 617,248 295,000 77,713 372,713 - 33,786 - 1,643 374,356 408,142 209,106 17 9/15/2029 632,679 305,000 62,963 367,963 - 34,800 - 1,643 369,606 404,406 228,273 18 9/15/2030 648,496 320,000 50,000 370,000 - 35,844 - 1,643 371,643 407,487 241,009 19 9/15/2031 664,709 335,000 34,000 369,000 - 36,919 - 1,643 370,643 407,563 257,146 20 9/15/2032 681,326 345,000 17,250 362,250 - 44,396 - 1,654 363,904 408,299 273,027
Totals: $10,817,256 $4,830,000 $2,954,907 $7,784,907 ($360,755) $585,559 $25,008 $34,311 $7,483,470 $8,069,029 $2,748,227
1 Bond Years schedule reports by bond year (September 15)2 Schedules incorporate capitalized interest deposit and upfront SEU Fees3 Financing Term is calculated from the end of construction period to final bond maturity4 Contracted Annual Savings is baseline savings number provided in GESA contracts in which we escalate off of5 Debt Service Inflation assumed at 0% for all projects6 Simple Payback is Project Cost + Capitalized Interest / contracted annual savings7 Equity is contributed by all in order to make individual projects cashflow positive on annual basis

Delaware Sustainable Energy UtilityEnergy Efficiency Revenue Bonds, Series 2011OMB - Carvel and Richardson/Robbins BuildingsProject Summary Statistics - Bond Years
FINAL PROJECT AND PRICING NUMBERS
Construction Period 16 monthsFinancing Term 20 yearsGESA Escalator 2.50%Equity Contribution:
Project Fund: $1,424,641 Capitalized Interest Contribution $-
OMB Carvel
Project FinancingProject Cost $7,079,809 Par Amount $5,770,000Monthly Draws $442,488 Average Life (years) 13.15Baseline Annual Savings $495,757 Net Savings (w/ equity) $2,108,276Simple Payback (years) 15.15 Net Savings % of Proj 29.779%
Guaranteed Savings Principal Interest D/S Cap_I M&V SEU Trustee Installment Payments Total Payments Surplus / (Deficit)
9/15/2012 - - 294,597 294,597 (299,737) - 3,462 1,678 (0) (0) 0 1 9/15/2013 381,113 210,000 262,513 472,513 (132,987) 12,263 3,462 1,678 344,665 356,928 24,185 2 9/15/2014 517,679 195,000 258,313 453,313 - 16,718 3,336 1,678 458,326 475,044 42,634 3 9/15/2015 530,621 200,000 252,463 452,463 - 17,220 3,219 1,678 457,359 474,579 56,042 4 9/15/2016 543,886 205,000 246,463 451,463 - 17,736 3,099 1,678 456,239 473,976 69,911 5 9/15/2017 557,483 215,000 237,013 452,013 - 18,268 2,976 1,678 456,666 474,935 82,549 6 9/15/2018 571,420 220,000 226,563 446,563 - 18,816 2,847 1,720 451,130 469,946 101,475 7 9/15/2019 585,706 230,000 217,763 447,763 - 19,381 2,715 1,720 452,198 471,578 114,128 8 9/15/2020 600,349 245,000 206,263 451,263 - 19,962 2,577 1,720 455,560 475,522 124,827 9 9/15/2021 615,357 255,000 194,713 449,713 - 20,561 2,430 1,720 453,863 474,424 140,934
10 9/15/2022 630,741 265,000 181,963 446,963 - 21,178 - 1,720 448,683 469,861 160,881 11 9/15/2023 646,510 280,000 168,713 448,713 - 21,813 - 1,720 450,433 472,246 174,264 12 9/15/2024 662,673 290,000 154,713 444,713 - 22,468 - 1,720 446,433 468,900 193,772 13 9/15/2025 679,239 305,000 144,563 449,563 - 23,142 - 1,720 451,283 474,424 204,815 14 9/15/2026 696,220 315,000 129,313 444,313 - 23,836 - 1,720 446,033 469,869 226,352 15 9/15/2027 713,626 330,000 113,563 443,563 - 24,551 - 1,720 445,283 469,834 243,792 16 9/15/2028 731,467 345,000 97,763 442,763 - 25,288 - 1,720 444,483 469,770 261,696 17 9/15/2029 749,753 365,000 80,513 445,513 - 26,046 - 1,720 447,233 473,279 276,474 18 9/15/2030 768,497 380,000 65,000 445,000 - 26,828 - 1,720 446,720 473,548 294,949 19 9/15/2031 787,709 395,000 46,000 441,000 - 27,632 - 1,720 442,720 470,353 317,357 20 9/15/2032 1,010,491 525,000 26,250 551,250 - 35,629 - 1,732 552,982 588,611 421,880
Totals: $12,980,541 $5,770,000 $3,605,010 $9,375,010 ($432,724) $439,337 $30,123 $35,879 $9,008,288 $9,447,624 $3,532,917
1 Bond Years schedule reports by bond year (September 15)2 Schedules incorporate capitalized interest deposit and upfront SEU Fees3 Financing Term is calculated from the end of construction period to final bond maturity4 Contracted Annual Savings is baseline savings number provided in GESA contracts in which we escalate off of5 Debt Service Inflation assumed at 0% for all projects6 Simple Payback is Project Cost + Capitalized Interest / contracted annual savings7 Equity is contributed by all in order to make individual projects cashflow positive on annual basis8 Utilizes Option 1 Project Cost w/ 2.50% escalator on Savings and 3.00% escalator on M&V

Delaware Sustainable Energy UtilityEnergy Efficiency Revenue Bonds, Series 2011Delaware Technical Community College - Terry CampusProject Summary Statistics - Bond Years
FINAL PROJECT AND PRICING NUMBERS
Construction Period 13 monthsFinancing Term 5 yearsGESA Escalator 2.50%Equity Contribution:
Project Fund: $- Capitalized Interest Contribution $-
DTCC - Terry
Project FinancingProject Cost $2,134,614 Par Amount $2,060,000Monthly Draws $164,201 Average Life (years) 4.18Baseline Annual Savings $131,303 Net Savings $854,029Simple Payback (years) 16.92 Net Savings % of Proj 40.009%
Guaranteed Savings Principal Interest D/S Cap_I M&V SEU Trustee Installment Payments Total Payments Surplus / (Deficit)
9/15/2012 - - 83,830 83,830 (86,469) - 1,236 1,403 (0) (0) 0 1 9/15/2013 131,303 390,000 74,700 464,700 - 12,340 1,236 1,403 467,339 479,679 (348,376) 2 9/15/2014 134,585 400,000 66,900 466,900 - 12,710 1,002 1,403 469,305 482,015 (347,430) 3 9/15/2015 137,950 410,000 54,900 464,900 - 13,091 762 1,403 467,065 480,156 (342,206) 4 9/15/2016 141,399 420,000 42,600 462,600 - 13,484 516 1,403 464,519 478,003 (336,604) 5 9/15/2017 144,934 440,000 21,900 461,900 - 13,888 264 1,403 463,567 477,455 (332,521) 6 9/15/2018 148,557 - - - - 14,305 - - - 14,305 134,252 7 9/15/2019 152,271 - - - - 5,176 - - - 5,176 147,095 8 9/15/2020 156,078 - - - - 5,331 - - - 5,331 150,747 9 9/15/2021 159,979 - - - - 5,491 - - - 5,491 154,488
10 9/15/2022 163,979 - - - - 5,656 - - - 5,656 158,323 11 9/15/2023 168,078 - - - - 5,825 - - - 5,825 162,253 12 9/15/2024 172,280 - - - - 6,000 - - - 6,000 166,280 13 9/15/2025 176,587 - - - - 6,180 - - - 6,180 170,407 14 9/15/2026 181,002 - - - - 6,366 - - - 6,366 174,636 15 9/15/2027 185,527 - - - - 6,557 - - - 6,557 178,970 16 9/15/2028 190,165 - - - - 6,754 - - - 6,754 183,411 17 9/15/2029 194,919 - - - - 6,956 - - - 6,956 187,963 18 9/15/2030 199,792 - - - - 7,165 - - - 7,165 192,627 19 9/15/2031 204,787 - - - - 7,380 - - - 7,380 197,407 20 9/15/2032 209,907 - - - - 7,601 - - - 7,601 202,306
Totals: $3,354,079 $2,060,000 $344,830 $2,404,830 ($86,469) $168,256 $5,016 $8,416 $2,331,794 $2,500,050 $854,029
1 Bond Years schedule reports by bond year (September 15)2 Schedules incorporate capitalized interest deposit and upfront SEU Fees3 Financing Term is calculated from the end of construction period to final bond maturity4 Contracted Annual Savings is baseline savings number provided in GESA contracts in which we escalate off of5 Debt Service Inflation assumed at 0% for all projects6 Simple Payback is Project Cost + Capitalized Interest / contracted annual savings7 Debt Service modeled for short level debt at the instruction of DTCC

Delaware Sustainable Energy UtilityEnergy Efficiency Revenue Bonds, Series 2011Delaware Technical Community College - Wilmington/Stanton CampusProject Summary Statistics - Bond Years
FINAL PROJECT AND PRICING NUMBERS
Construction Period 12 monthsFinancing Term 5 yearsGESA Escalator 2.50%Equity Contribution:
Project Fund: $- Capitalized Interest Contribution $-
DTCC - Wilmington/Stanton
Project FinancingProject Cost $4,145,338 Par Amount $3,995,000Monthly Draws $345,445 Average Life (years) 4.19Baseline Annual Savings $318,564 Net Savings $3,287,557Simple Payback (years) 13.54 Net Savings % of Proj 79.307%
Guaranteed Savings Principal Interest D/S Cap_I M&V SEU Trustee Installment Payments Total Payments Surplus / (Deficit)
9/15/2012 - - 163,003 163,003 (166,946) - 2,397 1,546 0 0 (0) 1 9/15/2013 345,775 755,000 145,250 900,250 - 21,643 2,397 1,546 904,193 925,836 (580,061) 2 9/15/2014 327,209 770,000 130,150 900,150 - 20,583 1,944 1,546 903,640 924,223 (597,014) 3 9/15/2015 335,389 795,000 107,050 902,050 - 21,197 1,482 1,546 905,078 926,275 (590,886) 4 9/15/2016 343,774 815,000 83,200 898,200 - 21,834 1,005 1,546 900,751 922,585 (578,811) 5 9/15/2017 352,369 860,000 42,850 902,850 - 22,484 516 1,546 904,912 927,396 (575,028) 6 9/15/2018 361,177 - - - - 22,163 - - - 22,163 339,014 7 9/15/2019 370,207 - - - - 11,886 - - - 11,886 358,321 8 9/15/2020 379,462 - - - - 12,246 - - - 12,246 367,216 9 9/15/2021 388,949 - - - - 12,608 - - - 12,608 376,341
10 9/15/2022 398,672 - - - - 12,992 - - - 12,992 385,680 11 9/15/2023 408,639 - - - - 13,377 - - - 13,377 395,262 12 9/15/2024 418,855 - - - - 13,775 - - - 13,775 405,080 13 9/15/2025 429,327 - - - - 14,195 - - - 14,195 415,132 14 9/15/2026 440,060 - - - - 14,616 - - - 14,616 425,443 15 9/15/2027 451,061 - - - - 15,055 - - - 15,055 436,006 16 9/15/2028 462,337 - - - - 15,507 - - - 15,507 446,831 17 9/15/2029 473,896 - - - - 15,972 - - - 15,972 457,924 18 9/15/2030 485,743 - - - - 16,451 - - - 16,451 469,292 19 9/15/2031 497,887 - - - - 16,944 - - - 16,944 480,943 20 9/15/2032 466,834 - - - - 15,958 - - - 15,958 450,875
Totals: $8,137,619 $3,995,000 $671,503 $4,666,503 ($166,946) $331,487 $9,741 $9,277 $4,518,575 $4,834,103 $3,287,557
1 Bond Years schedule reports by bond year (September 15)2 Schedules incorporate capitalized interest deposit and upfront SEU Fees3 Financing Term is calculated from the end of construction period to final bond maturity4 Contracted Annual Savings is baseline savings number provided in GESA contracts in which we escalate off of5 Debt Service Inflation assumed at 0% for all projects6 Simple Payback is Project Cost + Capitalized Interest / contracted annual savings7 Debt Service modeled for short level debt at the instruction of DTCC
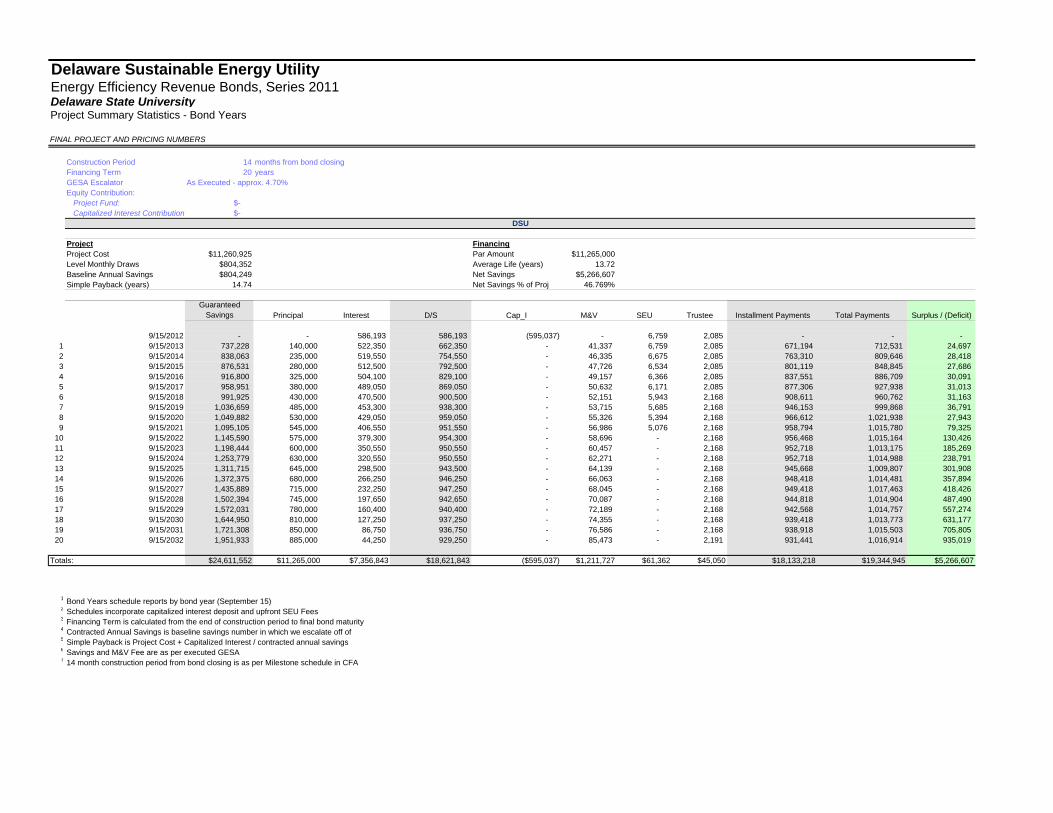
Delaware Sustainable Energy UtilityEnergy Efficiency Revenue Bonds, Series 2011Delaware State UniversityProject Summary Statistics - Bond Years
FINAL PROJECT AND PRICING NUMBERS
Construction Period 14 months from bond closingFinancing Term 20 yearsGESA Escalator As Executed - approx. 4.70%Equity Contribution:
Project Fund: $- Capitalized Interest Contribution $-
DSU
Project FinancingProject Cost $11,260,925 Par Amount $11,265,000Level Monthly Draws $804,352 Average Life (years) 13.72Baseline Annual Savings $804,249 Net Savings $5,266,607Simple Payback (years) 14.74 Net Savings % of Proj 46.769%
Guaranteed Savings Principal Interest D/S Cap_I M&V SEU Trustee Installment Payments Total Payments Surplus / (Deficit)
9/15/2012 - - 586,193 586,193 (595,037) - 6,759 2,085 - - - 1 9/15/2013 737,228 140,000 522,350 662,350 - 41,337 6,759 2,085 671,194 712,531 24,697 2 9/15/2014 838,063 235,000 519,550 754,550 - 46,335 6,675 2,085 763,310 809,646 28,418 3 9/15/2015 876,531 280,000 512,500 792,500 - 47,726 6,534 2,085 801,119 848,845 27,686 4 9/15/2016 916,800 325,000 504,100 829,100 - 49,157 6,366 2,085 837,551 886,709 30,091 5 9/15/2017 958,951 380,000 489,050 869,050 - 50,632 6,171 2,085 877,306 927,938 31,013 6 9/15/2018 991,925 430,000 470,500 900,500 - 52,151 5,943 2,168 908,611 960,762 31,163 7 9/15/2019 1,036,659 485,000 453,300 938,300 - 53,715 5,685 2,168 946,153 999,868 36,791 8 9/15/2020 1,049,882 530,000 429,050 959,050 - 55,326 5,394 2,168 966,612 1,021,938 27,943 9 9/15/2021 1,095,105 545,000 406,550 951,550 - 56,986 5,076 2,168 958,794 1,015,780 79,325
10 9/15/2022 1,145,590 575,000 379,300 954,300 - 58,696 - 2,168 956,468 1,015,164 130,426 11 9/15/2023 1,198,444 600,000 350,550 950,550 - 60,457 - 2,168 952,718 1,013,175 185,269 12 9/15/2024 1,253,779 630,000 320,550 950,550 - 62,271 - 2,168 952,718 1,014,988 238,791 13 9/15/2025 1,311,715 645,000 298,500 943,500 - 64,139 - 2,168 945,668 1,009,807 301,908 14 9/15/2026 1,372,375 680,000 266,250 946,250 - 66,063 - 2,168 948,418 1,014,481 357,894 15 9/15/2027 1,435,889 715,000 232,250 947,250 - 68,045 - 2,168 949,418 1,017,463 418,426 16 9/15/2028 1,502,394 745,000 197,650 942,650 - 70,087 - 2,168 944,818 1,014,904 487,490 17 9/15/2029 1,572,031 780,000 160,400 940,400 - 72,189 - 2,168 942,568 1,014,757 557,274 18 9/15/2030 1,644,950 810,000 127,250 937,250 - 74,355 - 2,168 939,418 1,013,773 631,177 19 9/15/2031 1,721,308 850,000 86,750 936,750 - 76,586 - 2,168 938,918 1,015,503 705,805 20 9/15/2032 1,951,933 885,000 44,250 929,250 - 85,473 - 2,191 931,441 1,016,914 935,019
Totals: $24,611,552 $11,265,000 $7,356,843 $18,621,843 ($595,037) $1,211,727 $61,362 $45,050 $18,133,218 $19,344,945 $5,266,607
1 Bond Years schedule reports by bond year (September 15)2 Schedules incorporate capitalized interest deposit and upfront SEU Fees3 Financing Term is calculated from the end of construction period to final bond maturity4 Contracted Annual Savings is baseline savings number in which we escalate off of5 Simple Payback is Project Cost + Capitalized Interest / contracted annual savings6 Savings and M&V Fee are as per executed GESA 7 14 month construction period from bond closing is as per Milestone schedule in CFA

Closing Memo

og
CLOSING FLOW OF FUNDS MEMORANDUM
To: Phone E-Mail Dr. John Byrne (302) 831-8405 [email protected] Kenneth Becker (302) 740-6795 [email protected] Doug Bacher (201) 656-0115 [email protected] Heather Litzebauer (201) 656-0115 [email protected] C. Baird Brown (215) 988-3338 [email protected] Charles Congdon (215) 988-2659 [email protected] Molly Wood (215) 988-2697 [email protected] Kimberly Klock (215) 988-2674 [email protected] Paul D. Durbin (312) 460-4211 [email protected] Stephanie M. Scola (302) 577-8988 [email protected] Bob Furman (302) 270-0078 [email protected] Dennis Groom (302) 739-5644 [email protected] Robert Scoglietti (302) 739-4206 [email protected] Jerry McNesby (302) 739-4057 [email protected] Sheila Winfrey-Brown (302) 857-7852 [email protected] Marion O’Connor (212) 816-5671 [email protected] Barbara Bennett (212) 816-5671 [email protected] Mary Jo Murphy (212) 723-7095 [email protected] James Quinn (212) 723-7095 [email protected] From: Phone E-Mail Trenton Allen (215) 478-5679 [email protected] Gardner Smith (415) 951-1731 [email protected] Keith Campo (212) 723-9162 [email protected] Date: August 1, 2011 RE: Sustainable Energy Utility, Inc. (“SEU”) Energy Efficiency Revenue Bonds, Series 2011 $67,435,000 Closing Information The closing will be held on Monday, August 1, 2011 at 10:00am at:
Drinker, Biddle & Reath LLP One Logan Square, Ste. 2000
(18th and Cherry Streets) Philadelphia, PA 19103-6996
Contact: C. Baird Brown Telephone: (215) 988-2700 Facsimile: (215) 988-2757

Sustainable Energy Utility, Inc. (Delaware) August 1, 2011 Page 2
I. PURCHASE PRICE AND FUNDS AVAILABLE AT DELIVERY The amount due at closing for the Series 2011 Bonds is as follows:
Energy Efficiency Revenue Bonds, Series 2011
Par Amount of Bonds $67,435,000.00 Plus: Net Original Issue Premium 5,116,141.30 Less: Underwriters’ Discount 638,525.65 Purchase Price (WIRE) $71,912,615.65 Equity Contribution from the State: 11,270,000.00 Funds Available at Closing $83,182,615.65 II. DEPOSIT / TRANSFER OF FUNDS PAYMENT INSTRUCTIONS The closing wire instructions follow: 1. Citi will make a wire transfer in the amount of $71,912,615.65 to the Trustee in accordance with the
following instructions:
Bank = Citibank, N.A. ABA = Acct #: = Acct Name: = Attn: = Mark Altabe
2. The State of Delaware will make a wire transfer in the amount of $11,270,000 to the Trustee in accordance with the following instructions:
Bank = Citibank, N.A. ABA = Acct #: = Acct Name: = Attn: = Mark Altabe
Funds will not be disbursed into any accounts until the Bond issue is closed. Bond Counsel, the Trustee and Citi are parties to the conversation with DTC to release the Bonds and only after that time, shall Citibank NA disburse the funds.
Mary Jo Murphy will be coordinating Citi’s wire. She can be contacted at (212) 723-7095. Closing On Monday, August 1, 2011, after confirming that the wire has been received and that all documents are complete, the SEU, the SEU’s Co-Financial Advisors, Bond Counsel, the Trustee and Citi will call DTC to release the Bonds, and the financing will be closed.

Sustainable Energy Utility, Inc. (Delaware) August 1, 2011 Page 3
III. ALLOCATION OF FUNDS AVAILABLE AT DELIVERY The funds from Citi’s wire and the State of Delaware’s wire to the Trustee will be deposited as follows: (1) The Trustee will deposit in the Project Account within the Project Fund $75,107,739.53 so that such accounts shall equal a sufficient amount to satisfy project costs for all agencies; -Detailed breakdown of Project Account sub-account deposits appears in line 1 of Appendix A
-For Delaware State University, the project account includes $11,260,925.00 of project proceeds as well as $5,045.53 in additional proceeds to equal the total of $11,265,970.53
(2) The Trustee will deposit $7,320,037.12 into the Capitalized Interest Sub-Accounts within the Project Fund; -Detailed breakdown of Capitalized Interest sub-account deposits appears in line 2 of Appendix A (3) The Trustee will deposit $754,839.00 in the separate account for the Administrative Expense Account as set forth in the closing statement

Sustainable Energy Utility, Inc. (Delaware) August 1, 2011 Page 4
APPENDIX A: Project Sub-Account Breakdown
---- SEE NEXT PAGE ----

Sustainable Energy Utility, Inc.Energy Efficiency Revenue Bonds, Series 2011Sub-Account Disbursements**Appendix A**
FINAL PRICING AND PROJECT NUMBERS1 2 3 4 5 6 7 8
Line # DOC KIDS OMB -
Sussex OMB - Legislative OMB - Carvel DTCC - Terry
DTCC - Wilmington DSU TOTAL
Agency Department of Corrections
Department of Services for
Children, Youth, and Their Families
Office of Management and Budget - Sussex
County Court
Office of Management and
Budget - Legislative Mall Complex
Office of Management and Budget - Carvel
Building
Delaware Technical Community College
Terry Campus
Delaware Technical Community College Wilmington Campus
Delaware State University
Contractor NORESCO NORESCO Sieberlich Trane Honeywell AMERESCO PEPCO PEPCO Johnson Controls
#1Project Account -Sub-Accounts 39,069,088.00 2,185,416.00 2,535,000.00 6,692,504.00 7,079,809.00 2,134,614.00 4,145,338.00 11,265,970.53 $75,107,739.53
#2Capitalized Interest - Sub-Accounts 5,546,978.89 80,875.16 50,251.48 360,755.40 432,724.43 86,468.74 166,945.99 595,037.03 $7,320,037.12

Sustainable Energy Utility, Inc. (Delaware) August 1, 2011 Page 5
APPENDIX B: Installment Payment Obligations by Project
---- SEE NEXT PAGE ----
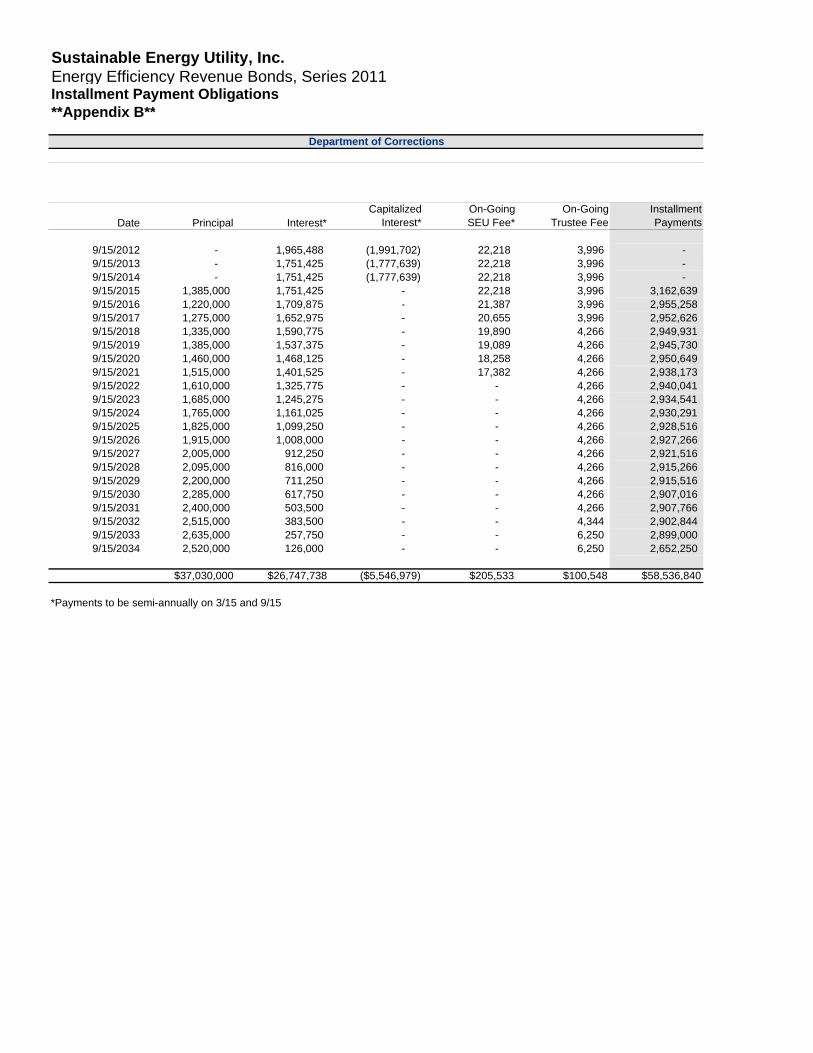
Sustainable Energy Utility, Inc.Energy Efficiency Revenue Bonds, Series 2011Installment Payment Obligations**Appendix B**
Department of Corrections
Date Principal Interest*Capitalized
Interest*On-Going SEU Fee*
On-Going Trustee Fee
Installment Payments
9/15/2012 - 1,965,488 (1,991,702) 22,218 3,996 - 9/15/2013 - 1,751,425 (1,777,639) 22,218 3,996 - 9/15/2014 - 1,751,425 (1,777,639) 22,218 3,996 - 9/15/2015 1,385,000 1,751,425 - 22,218 3,996 3,162,639 9/15/2016 1,220,000 1,709,875 - 21,387 3,996 2,955,258 9/15/2017 1,275,000 1,652,975 - 20,655 3,996 2,952,626 9/15/2018 1,335,000 1,590,775 - 19,890 4,266 2,949,931 9/15/2019 1,385,000 1,537,375 - 19,089 4,266 2,945,730 9/15/2020 1,460,000 1,468,125 - 18,258 4,266 2,950,649 9/15/2021 1,515,000 1,401,525 - 17,382 4,266 2,938,173 9/15/2022 1,610,000 1,325,775 - - 4,266 2,940,041 9/15/2023 1,685,000 1,245,275 - - 4,266 2,934,541 9/15/2024 1,765,000 1,161,025 - - 4,266 2,930,291 9/15/2025 1,825,000 1,099,250 - - 4,266 2,928,516 9/15/2026 1,915,000 1,008,000 - - 4,266 2,927,266 9/15/2027 2,005,000 912,250 - - 4,266 2,921,516 9/15/2028 2,095,000 816,000 - - 4,266 2,915,266 9/15/2029 2,200,000 711,250 - - 4,266 2,915,516 9/15/2030 2,285,000 617,750 - - 4,266 2,907,016 9/15/2031 2,400,000 503,500 - - 4,266 2,907,766 9/15/2032 2,515,000 383,500 - - 4,344 2,902,844 9/15/2033 2,635,000 257,750 - - 6,250 2,899,000 9/15/2034 2,520,000 126,000 - - 6,250 2,652,250
$37,030,000 $26,747,738 ($5,546,979) $205,533 $100,548 $58,536,840
*Payments to be semi-annually on 3/15 and 9/15
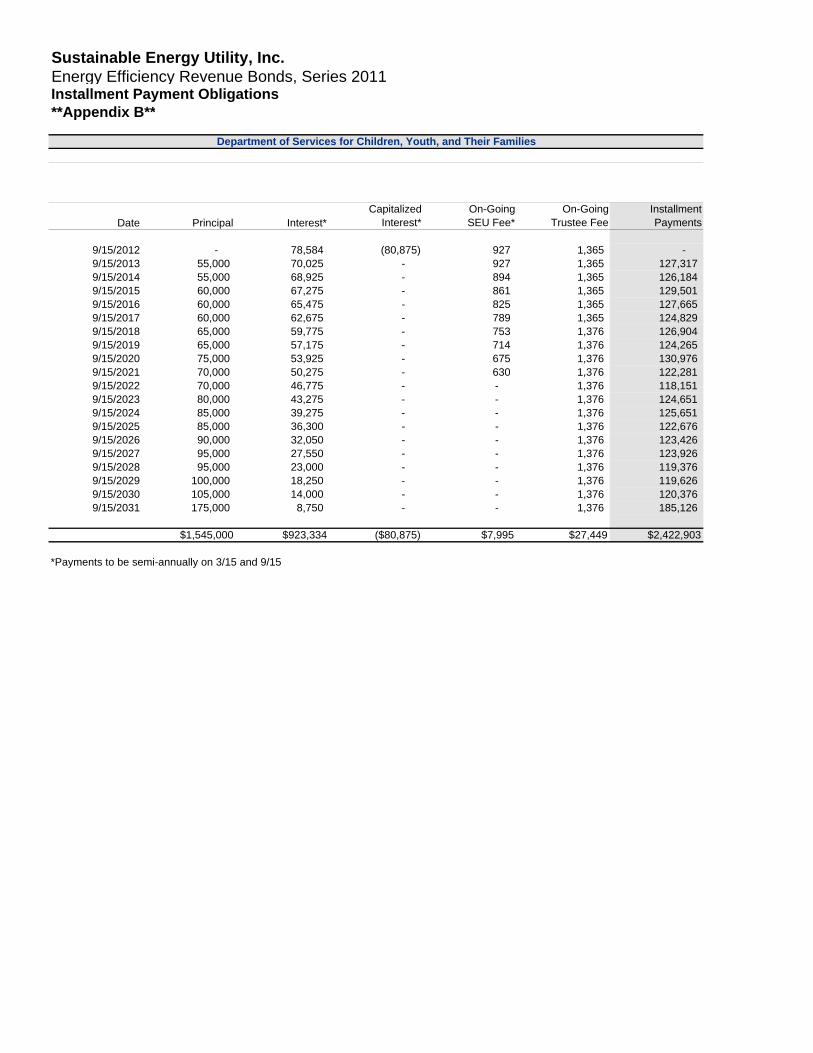
Sustainable Energy Utility, Inc.Energy Efficiency Revenue Bonds, Series 2011Installment Payment Obligations**Appendix B**
Department of Services for Children, Youth, and Their Families
Date Principal Interest*Capitalized
Interest*On-Going SEU Fee*
On-Going Trustee Fee
Installment Payments
9/15/2012 - 78,584 (80,875) 927 1,365 - 9/15/2013 55,000 70,025 - 927 1,365 127,317 9/15/2014 55,000 68,925 - 894 1,365 126,184 9/15/2015 60,000 67,275 - 861 1,365 129,501 9/15/2016 60,000 65,475 - 825 1,365 127,665 9/15/2017 60,000 62,675 - 789 1,365 124,829 9/15/2018 65,000 59,775 - 753 1,376 126,904 9/15/2019 65,000 57,175 - 714 1,376 124,265 9/15/2020 75,000 53,925 - 675 1,376 130,976 9/15/2021 70,000 50,275 - 630 1,376 122,281 9/15/2022 70,000 46,775 - - 1,376 118,151 9/15/2023 80,000 43,275 - - 1,376 124,651 9/15/2024 85,000 39,275 - - 1,376 125,651 9/15/2025 85,000 36,300 - - 1,376 122,676 9/15/2026 90,000 32,050 - - 1,376 123,426 9/15/2027 95,000 27,550 - - 1,376 123,926 9/15/2028 95,000 23,000 - - 1,376 119,376 9/15/2029 100,000 18,250 - - 1,376 119,626 9/15/2030 105,000 14,000 - - 1,376 120,376 9/15/2031 175,000 8,750 - - 1,376 185,126
$1,545,000 $923,334 ($80,875) $7,995 $27,449 $2,422,903
*Payments to be semi-annually on 3/15 and 9/15
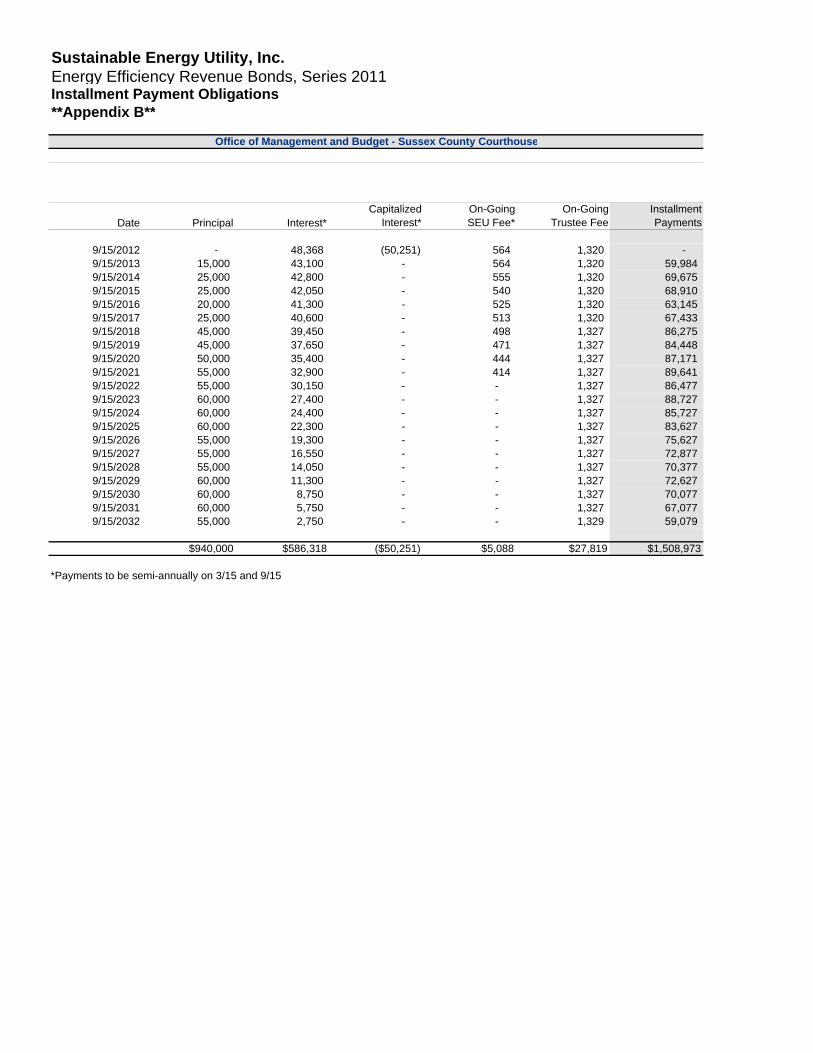
Sustainable Energy Utility, Inc.Energy Efficiency Revenue Bonds, Series 2011Installment Payment Obligations**Appendix B**
Office of Management and Budget - Sussex County Courthouse
Date Principal Interest*Capitalized
Interest*On-Going SEU Fee*
On-Going Trustee Fee
Installment Payments
9/15/2012 - 48,368 (50,251) 564 1,320 - 9/15/2013 15,000 43,100 - 564 1,320 59,984 9/15/2014 25,000 42,800 - 555 1,320 69,675 9/15/2015 25,000 42,050 - 540 1,320 68,910 9/15/2016 20,000 41,300 - 525 1,320 63,145 9/15/2017 25,000 40,600 - 513 1,320 67,433 9/15/2018 45,000 39,450 - 498 1,327 86,275 9/15/2019 45,000 37,650 - 471 1,327 84,448 9/15/2020 50,000 35,400 - 444 1,327 87,171 9/15/2021 55,000 32,900 - 414 1,327 89,641 9/15/2022 55,000 30,150 - - 1,327 86,477 9/15/2023 60,000 27,400 - - 1,327 88,727 9/15/2024 60,000 24,400 - - 1,327 85,727 9/15/2025 60,000 22,300 - - 1,327 83,627 9/15/2026 55,000 19,300 - - 1,327 75,627 9/15/2027 55,000 16,550 - - 1,327 72,877 9/15/2028 55,000 14,050 - - 1,327 70,377 9/15/2029 60,000 11,300 - - 1,327 72,627 9/15/2030 60,000 8,750 - - 1,327 70,077 9/15/2031 60,000 5,750 - - 1,327 67,077 9/15/2032 55,000 2,750 - - 1,329 59,079
$940,000 $586,318 ($50,251) $5,088 $27,819 $1,508,973
*Payments to be semi-annually on 3/15 and 9/15

Sustainable Energy Utility, Inc.Energy Efficiency Revenue Bonds, Series 2011Installment Payment Obligations**Appendix B**
Office of Management and Budget - Legislative Mall Complex
Date Principal Interest*Capitalized
Interest*On-Going SEU Fee*
On-Going Trustee Fee
Installment Payments
9/15/2012 - 245,444 (249,950) 2,898 1,608 - 9/15/2013 210,000 218,713 (110,805) 2,898 1,608 322,413 9/15/2014 165,000 214,513 - 2,772 1,608 383,893 9/15/2015 170,000 209,563 - 2,673 1,608 383,844 9/15/2016 175,000 204,463 - 2,571 1,608 383,642 9/15/2017 180,000 196,413 - 2,466 1,608 380,487 9/15/2018 190,000 187,663 - 2,358 1,643 381,664 9/15/2019 195,000 180,063 - 2,244 1,643 378,950 9/15/2020 210,000 170,313 - 2,127 1,643 384,083 9/15/2021 215,000 160,013 - 2,001 1,643 378,657 9/15/2022 230,000 149,263 - - 1,643 380,906 9/15/2023 235,000 137,763 - - 1,643 374,406 9/15/2024 250,000 126,013 - - 1,643 377,656 9/15/2025 255,000 117,263 - - 1,643 373,906 9/15/2026 270,000 104,513 - - 1,643 376,156 9/15/2027 280,000 91,013 - - 1,643 372,656 9/15/2028 295,000 77,713 - - 1,643 374,356 9/15/2029 305,000 62,963 - - 1,643 369,606 9/15/2030 320,000 50,000 - - 1,643 371,643 9/15/2031 335,000 34,000 - - 1,643 370,643 9/15/2032 345,000 17,250 - - 1,654 363,904
$4,830,000 $2,954,907 ($360,755) $25,008 $34,311 $7,483,470
*Payments to be semi-annually on 3/15 and 9/15

Sustainable Energy Utility, Inc.Energy Efficiency Revenue Bonds, Series 2011Installment Payment Obligations**Appendix B**
Office of Management and Budget - Carvel Building
Date Principal Interest*Capitalized
Interest*On-Going SEU Fee*
On-Going Trustee Fee
Installment Payments
9/15/2012 - 294,597 (299,737) 3,462 1,678 - 9/15/2013 210,000 262,513 (132,987) 3,462 1,678 344,665 9/15/2014 195,000 258,313 - 3,336 1,678 458,326 9/15/2015 200,000 252,463 - 3,219 1,678 457,359 9/15/2016 205,000 246,463 - 3,099 1,678 456,239 9/15/2017 215,000 237,013 - 2,976 1,678 456,666 9/15/2018 220,000 226,563 - 2,847 1,720 451,130 9/15/2019 230,000 217,763 - 2,715 1,720 452,198 9/15/2020 245,000 206,263 - 2,577 1,720 455,560 9/15/2021 255,000 194,713 - 2,430 1,720 453,863 9/15/2022 265,000 181,963 - - 1,720 448,683 9/15/2023 280,000 168,713 - - 1,720 450,433 9/15/2024 290,000 154,713 - - 1,720 446,433 9/15/2025 305,000 144,563 - - 1,720 451,283 9/15/2026 315,000 129,313 - - 1,720 446,033 9/15/2027 330,000 113,563 - - 1,720 445,283 9/15/2028 345,000 97,763 - - 1,720 444,483 9/15/2029 365,000 80,513 - - 1,720 447,233 9/15/2030 380,000 65,000 - - 1,720 446,720 9/15/2031 395,000 46,000 - - 1,720 442,720 9/15/2032 525,000 26,250 - - 1,732 552,982
$5,770,000 $3,605,010 ($432,724) $30,123 $35,879 $9,008,288
*Payments to be semi-annually on 3/15 and 9/15

Sustainable Energy Utility, Inc.Energy Efficiency Revenue Bonds, Series 2011Installment Payment Obligations**Appendix B**
Delaware Technical Community College - Terry Campus
Date Principal Interest*Capitalized
Interest*On-Going SEU Fee*
On-Going Trustee Fee
Installment Payments
9/15/2012 - 83,830 (86,469) 1,236 1,403 - 9/15/2013 390,000 74,700 - 1,236 1,403 467,339 9/15/2014 400,000 66,900 - 1,002 1,403 469,305 9/15/2015 410,000 54,900 - 762 1,403 467,065 9/15/2016 420,000 42,600 - 516 1,403 464,519 9/15/2017 440,000 21,900 - 264 1,403 463,567 9/15/2018 - - - - - - 9/15/2019 - - - - - - 9/15/2020 - - - - - - 9/15/2021 - - - - - - 9/15/2022 - - - - - - 9/15/2023 - - - - - - 9/15/2024 - - - - - - 9/15/2025 - - - - - - 9/15/2026 - - - - - - 9/15/2027 - - - - - - 9/15/2028 - - - - - - 9/15/2029 - - - - - - 9/15/2030 - - - - - - 9/15/2031 - - - - - - 9/15/2032 - - - - - -
$2,060,000 $344,830 ($86,469) $5,016 $8,416 $2,331,794
*Payments to be semi-annually on 3/15 and 9/15

Sustainable Energy Utility, Inc.Energy Efficiency Revenue Bonds, Series 2011Installment Payment Obligations**Appendix B**
Delaware Technical Community College - Wilmington Campus
Date Principal Interest*Capitalized
Interest*On-Going SEU Fee*
On-Going Trustee Fee
Installment Payments
9/15/2012 - 163,003 (166,946) 2,397 1,546 - 9/15/2013 755,000 145,250 - 2,397 1,546 904,193 9/15/2014 770,000 130,150 - 1,944 1,546 903,640 9/15/2015 795,000 107,050 - 1,482 1,546 905,078 9/15/2016 815,000 83,200 - 1,005 1,546 900,751 9/15/2017 860,000 42,850 - 516 1,546 904,912 9/15/2018 - - - - - - 9/15/2019 - - - - - - 9/15/2020 - - - - - - 9/15/2021 - - - - - - 9/15/2022 - - - - - - 9/15/2023 - - - - - - 9/15/2024 - - - - - - 9/15/2025 - - - - - - 9/15/2026 - - - - - - 9/15/2027 - - - - - - 9/15/2028 - - - - - - 9/15/2029 - - - - - - 9/15/2030 - - - - - - 9/15/2031 - - - - - - 9/15/2032 - - - - - -
$3,995,000 $671,503 ($166,946) $9,741 $9,277 $4,518,575
*Payments to be semi-annually on 3/15 and 9/15

Sustainable Energy Utility, Inc.Energy Efficiency Revenue Bonds, Series 2011Installment Payment Obligations**Appendix B**
Delaware State University
Date Principal Interest*Capitalized
Interest*On-Going SEU Fee*
On-Going Trustee Fee
Installment Payments
9/15/2012 - 586,193 (595,037) 6,759 2,085 - 9/15/2013 140,000 522,350 - 6,759 2,085 671,194 9/15/2014 235,000 519,550 - 6,675 2,085 763,310 9/15/2015 280,000 512,500 - 6,534 2,085 801,119 9/15/2016 325,000 504,100 - 6,366 2,085 837,551 9/15/2017 380,000 489,050 - 6,171 2,085 877,306 9/15/2018 430,000 470,500 - 5,943 2,168 908,611 9/15/2019 485,000 453,300 - 5,685 2,168 946,153 9/15/2020 530,000 429,050 - 5,394 2,168 966,612 9/15/2021 545,000 406,550 - 5,076 2,168 958,794 9/15/2022 575,000 379,300 - - 2,168 956,468 9/15/2023 600,000 350,550 - - 2,168 952,718 9/15/2024 630,000 320,550 - - 2,168 952,718 9/15/2025 645,000 298,500 - - 2,168 945,668 9/15/2026 680,000 266,250 - - 2,168 948,418 9/15/2027 715,000 232,250 - - 2,168 949,418 9/15/2028 745,000 197,650 - - 2,168 944,818 9/15/2029 780,000 160,400 - - 2,168 942,568 9/15/2030 810,000 127,250 - - 2,168 939,418 9/15/2031 850,000 86,750 - - 2,168 938,918 9/15/2032 885,000 44,250 - - 2,191 931,441
$11,265,000 $7,356,843 ($595,037) $61,362 $45,050 $18,133,218
*Payments to be semi-annually on 3/15 and 9/15

Sustainable Energy Utility, Inc. (Delaware) August 1, 2011 Page 6
APPENDIX C: Bond Pricing
MATURITIES, AMOUNTS, INTEREST RATES, YIELDS AND CUSIPS $67,435,000
Sustainable Energy Utility, Inc. Energy Efficiency Revenue Bonds, Series 2011
$57,955,000 Serial Bonds
Due September 15
Principal Amount
Interest Rate Yield Price
CUSIP**
2013 $1,775,000 2.000% 0.650% 102.840 86932UAA32014 1,845,000 3.000 1.000 106.132 86932UAB12015 3,325,000 3.000 1.280 106.884 86932UAC92016 400,000 3.000 1.640 106.654 86932UAD72016 2,840,000 5.000 1.640 116.441 86932UAW52017 300,000 4.000 2.040 111.224 86932UAE52017 3,135,000 5.000 2.040 116.952 86932UAX32018 2,285,000 4.000 2.460 110.002 86932UAF22019 2,405,000 5.000 2.790 115.959 86932UAG02020 570,000 3.000 3.060 99.523 86932UAH82020 2,000,000 5.000 3.060 115.336 86932UAZ82021 2,655,000 5.000 3.230 115.175 86932UAJ42022 2,805,000 5.000 3.440* 113.235 86932UAK12023 2,940,000 5.000 3.600* 111.784 86932UAL92024 3,080,000 3.500 3.770 97.222 86932UAM72025 3,175,000 5.000 3.900* 109.122 86932UAN52026 3,325,000 5.000 3.990* 108.339 86932UAP02027 700,000 4.000 4.080 99.057 86932UAQ82027 2,780,000 5.000 4.080* 107.562 86932UAY12028 3,630,000 5.000 4.170* 106.792 86932UAR62029 3,810,000 4.250 4.440 97.647 86932UAS42030 3,960,000 5.000 4.290* 105.775 86932UAT22031 4,215,000 5.000 4.370* 105.104 86932UAU9
$9,480,000 Term Bond
$9,480,000 5.00% Term Bonds Due September 15, 2034, Priced @ 103.612 to Yield 4.550%*, CUSIP 86932UAV7 * Yield calculated to call date of September 15, 2021.

Sustainable Energy Utility, Inc. (Delaware) August 1, 2011 Page 7
APPENDIX D: Sources and Uses
Sources of Funds Principal Amount of the Bonds1 $67,435,000.00 Plus Net Original Issue Premium 5,116,141.30 Total Bond Proceeds $72,551,141.30 Equity Contribution from the State 11,270,000.00 Total Sources of Funds $83,821,141.30
Uses of Funds Project Fund Deposits:
Dept of Correction $39,069,088.00 Dept of Services for Children, Youth and Their Families 2,185,416.00 Delaware State University 11,260,925.00 Office of Management and Budget 16,307,313.00 Delaware Technical and Community College 6,279,952.00
Deposit to Capitalized Interest Accounts 7,320,037.12 Costs of Issuance2 1,398,410.18 Total Uses of Funds $83,821,141.30
1 Includes certain capitalized interest. 2 Includes Underwriter's Discount, rating agency fees, legal and financial advisory fees, Issuer's fee and
other miscellaneous expenses incurred in connection with the issuance of the Bonds as well as an allowance for contingencies of $3,672.98.

Disclaimer
Any terms set forth herein are intended for discussion purposes only and are subject to the final terms as set forth in separate definitive written agreements. This presentation is not a commitment to lend, syndicate a financing, underwrite or purchase securities, or commit capital nor does it obligate us to enter into such a commitment, nor are we acting as a fiduciary to you. By accepting this presentation, subject to applicable law or regulation, you agree to keep confidential the existence of and proposed terms for any transaction contemplated hereby (a “Transaction”).
Prior to entering into any Transaction, you should determine, without reliance upon us or our affiliates, the economic risks and merits (and independently determine that you are able to assume these risks) as well as the legal, tax and accounting characterizations and consequences of any such Transaction. In this regard, by accepting this presentation, you acknowledge that (a) we are not in the business of providing (and you are not relying on us for) legal, tax or accounting advice, (b) there may be legal, tax or accounting risks associated with any Transaction, (c) you should receive (and rely on) separate and qualified legal, tax and accounting advice and (d) you should apprise senior management in your organization as to such legal, tax and accounting advice (and any risks associated with any Transaction) and our disclaimer as to these matters. By acceptance of these materials, you and we hereby agree that from the commencement of discussions with respect to any Transaction, and notwithstanding any other provision in this presentation, we hereby confirm that no participant in any Transaction shall be limited from disclosing the U.S. tax treatment or U.S. tax structure of such Transaction.
IRS Circular 230 Disclosure: Citigroup, Inc. and its affiliates do not provide tax or legal advice. Any discussion of tax matters in these materials (i) is not intended or written to be used, and cannot be used or relied upon, by you for the purpose of avoiding any tax penalties and (ii) may have been written in connection with the "promotion or marketing" of the Transaction. Accordingly, you should seek advice based on your particular circumstances from an independent tax advisor.
We are required to obtain, verify and record certain information that identifies each entity that enters into a formal business relationship with us. We will ask for your complete name, street address, and taxpayer ID number. We may also request corporate formation documents, or other forms of identification, to verify information provided.
Any prices or levels contained herein are preliminary and indicative only and do not represent bids or offers. These indications are provided solely for your information and consideration, are subject to change at any time without notice and are not intended as a solicitation with respect to the purchase or sale of any instrument. The information contained in this presentation may include results of analyses from a quantitative model which represent potential future events that may or may not be realized, and is not a complete analysis of every material fact representing any product. Any estimates included herein constitute our judgment as of the date hereof and are subject to change without any notice. We and/or our affiliates may make a market in these instruments for our customers and for our own account. Accordingly, we may have a position in any such instrument at any time.
Citi maintains a policy of strict compliance to the anti-tying provisions of the U.S. Bank Holding Company Act of 1956, as amended, and the regulations issued by the Federal Reserve Board implementing the anti-tying rules (collectively, the "Anti-tying Rules"). Moreover, our credit policies provide that credit must be underwritten in a safe and sound manner and be consistent with Section 23B of the Federal Reserve Act and the requirements of federal law. Consistent with these requirements and our Anti-tying Policy:
• The extension of commercial loans or other products or services to you by Citibank, N.A. (“Citibank”) or any of its subsidiaries will not be conditioned on your taking other products or services offered by Citibank or any of its subsidiaries or affiliates, unless such a condition is permitted under an exception to the Anti-tying Rules.
• We will not vary the price or other terms of any product or service offered by Citibank or its subsidiaries on the condition that you purchase another product or service from Citibank or any Citi affiliate, unless we are authorized to do so under an exception to the Anti-tying Rules.
• We will not require you to provide property or services to Citibank or any affiliate of Citibank as a condition to the extension of a commercial loan to you by Citibank or any of its subsidiaries, unless such a requirement is reasonably required to protect the safety and soundness of the loan.
• We will not require you to refrain from doing business with a competitor of Citi or any of its affiliates as a condition to receiving a commercial loan from Citibank or any of its subsidiaries, unless the requirement is reasonably designed to ensure the soundness of the loan.
Although this material may contain publicly available information about Citi corporate bond research or economic and market analysis, Citi policy (i) prohibits employees from offering, directly or indirectly, a favorable or negative research opinion or offering to change an opinion as consideration or inducement for the receipt of business or for compensation; and (ii) prohibits analysts from being compensated for specific recommendations or views contained in research reports. So as to reduce the potential for conflicts of interest, as well as to reduce any appearance of conflicts of interest, Citi has enacted policies and procedures designed to limit communications between its investment banking and research personnel to specifically prescribed circumstances.