Embed Size (px)
Citation preview

Sustainable Food Survey 2016
SummarySummary

• Over half of respondents (54%) of respondents are responsible for buying all their own food
• The vast majority (87%) of respondents report that they use supermarkets in a town/village to do their food shopping at least once a month
• Price (78%) and location/convenience (73%) are the two main factors which influence where respondents decide to do their food shopping.
• Food to cook or prepare at home represents the biggest weekly spend for respondents with approximately two fifths (39%) spending £31 or more on average per week.
• Price is also reported as the strongest influence on what food respondents buy with 85% saying they consider this when buying food.
A national online survey looking at attitudes, awareness and behaviours linked to sustainable food issues was completed by over 3000 students studying in further and higher education across the UK. The research was completed in September 2016 as part of NUS’ Student Eats which helps students to develop their own growing sites and food enterprises, embedding sustainable food production across campuses, curriculums and communities.
Food purchasing
Q. To what extent do you agree or disagree with the following statements?
• Almost two fifths of respondents say they make a conscious effort to buy Fairtrade products (38%) and a third say they try to buy food that is in season in the UK (34%).
• Respondents perceive locally produced food / food products to be a way of purchasing food that is as fresh as possible (42%) and also a way of supporting the local economy (34%), however only around a quarter say that these products are worth paying a bit extra for (23%).
• Only 6% of respondents say that how animals are reared is not important to them.• 76% agree that it’s better for the environment to eat local fruit and vegetables grown in
season. • 52% agree that they have a good understanding of the issues surrounding buying local
and seasonal produce.• 25% have been hungry but did not eat because of a lack of money or other resources in
the last 12 months.
Sustainable food and food poverty
15%
21%
34%
58%
37%
42%
42%
28%
25%
27%
17%
9%
13%
5%
2%
1%
0% 50% 100%
I have a good understanding of the issuessurrounding buying local / seasonal
produce (n=3257)
Where possible I try to support Britishproducers (n=3262)
It’s better for the environment to eat local fruit and vegetables grown in season
(n=3264)
I think it’s important that animals bred for food are treated as humanely as possible
(n=3265)
Strongly agree Agree Neither agree nor disagree
Disagree Strongly disagree Don’t know

IntroductionIntroduction

Research objectives and methodology
Student Eats puts sustainable food at the heart of universities and colleges across the UK.We work with students to develop their own growing sites and food enterprises, embedding sustainable food production across campuses, curriculums and communities.
Together, we produce loads of low-carbon, fresh, healthy food on campuses across the country.With more and more students growing their own food, we make a hugely positive impact on campus life – across enterprise, community, wellbeing, education and sustainability.
This survey gathered data on student attitudes, awareness and behaviours linked to sustainable food issues.
Objectives
The online survey was promoted to NUS’ database of NUS Extra cardholders in September 2016.The survey took approximately 5 minutes to complete and was incentivised with a cash prize draw.3274 respondents completed the survey.
Within the report, a number of questions have been broken down for particular types ofrespondents. Where there are any statistical significant differences between answers, they arereported where applicable and to large enough base size (n>30) and are valid at confidence level of99%.
Methodology

The respondents…
are in higher education70%
are in further education28%
55%44%
live with their parents 27%
live in private rented accommodation
23%
live in self-catered halls of residence
22%
Full demographic data can be found in the Annex at the end of this reportImage credit: Globe icon – Yu Luck @ Noun project
are from the UK78%
are from within the EU11%
are from outside the EU
10%

Research Findings | Food purchasing
Research Findings Food purchasing

Over half of respondents say they are responsible for doing the main food shopping where they live (54%). A fifth of respondents say their parents are responsible for food shopping.
1%
1%
10%
14%
20%
54%
0% 10% 20% 30% 40% 50% 60%
Other
Not applicable – I live in catered
accommodation
I always share the food shopping with
people I live with
I sometimes share the food shopping with
people I live with but mostly buy my own
food
My parents
I buy all my own food
Q. Who is responsible for doing the main food shopping where you live? (Base: 3274 Balance: No response)
• Respondents who are women are more likely to say they buy their own food (59% compared with 48% men).
• Respondents who are men are more likely to say they sometimes share food shopping with the people they live with (16% compared with 12% women).

The vast majority (87%) of respondents report that they use supermarkets in a town/village to do their food shopping at least once a month. Two fifths (39%) use convenience stores and a quarter (26%) use small independent shops for their food shopping at least once a month.
0%
1%
7%
8%
17%
20%
21%
26%
39%
87%
0% 10% 20% 30% 40% 50% 60% 70% 80% 90% 100%
Other type of shop
Have vegetable box delivered
Health food shop
Farmers market / Farm shop
Market
Via the internet
Out of town supermarket
Small independent shops (e.g. Greengrocer /
Butcher / Fishmonger / Bakery)
Convenience store / corner shop
Supermarket in town/village
Q. At which of these types of shop do you do food shopping at least once a month?(Base: 3273 Balance: No response)
• International respondents are more likely to say they shop at markets at least once a month than UK respondents (25% EU respondents and 29% non-EU respondents compared with 14% UK respondents).

Price (78%) and location/convenience (73%) are the two main factors which influence where respondents decide to do their food shopping. The offers and deals available (again linked to price) influence where two fifths (40%) of respondents do their food shopping.
1%
5%
8%
22%
33%
40%
73%
78%
0% 10% 20% 30% 40% 50% 60% 70% 80% 90%
Other
I trust the brands available
I trust the retailer
Range of products available
Quality of products available
Offers and deals available
Location / convenience
Price
Q. What factors influence where you decide to do your food shopping?(Base: 3272 Balance: No response )
• UK respondents are more likely to say they are influenced by offers and deals than international respondents (41% UK respondents compared with 35% EU respondents and 32% non-EU respondents.
• International respondents are more likely to say they are influenced by the quality of produce than UK respondents (39% EU respondents and 40% non-EU respondents compared with 31% UK respondents).

Food to cook or prepare at home represents the biggest weekly spend for respondents, relative to other items, with approximately two fifths (39%) spending £31 or more on average per week. Toiletries, non-alcoholic drinks and cigarettes represent the lowest weekly spend on average (61%, 61% and 75% spending less than £10 per week).
75%
61%
61%
59%
57%
54%
53%
52%
49%
44%
43%
40%
38%
34%
10%
6%
28%
27%
24%
22%
18%
30%
20%
18%
22%
29%
33%
33%
29%
24%
2%
6%
6%
10%
8%
10%
8%
9%
12%
10%
12%
14%
16%
24%
4%
3%
3%
3%
4%
6%
7%
4%
6%
9%
15% 10% 14%
0% 10% 20% 30% 40% 50% 60% 70% 80% 90%100%
Cigarettes / e-cigarettes
Non-alcoholic drinks
Toiletries
Other course costs (e.g. stationery, printing, photocopying)
Alcoholic drinks
Internet / wifi
Other food (e.g. take-away, home delivery)
Other equipment linked to your course
Course books
Clothes
Mobile phone
Social activities (e.g. films, sport, clubs and societies)
Eating out at cafes, pubs and restaurants
Transport / travel
Food to cook or prepare at home
Less than £10 £10 - £20 £21 - £30 £31 - £40 £41 - £50 Over £50 Don't know
Q. Now thinking about what you spend your money on, how much is your weekly average spend on the following items:(Base: c. 3240 Balance: No response)
• Respondents who are women are more likely to say they spend over £50 on average per week on food to cook or prepare at home (16% compared with 11% men).
• International respondents are less likely to say they spend over £50 on average per week on food to cook or prepare at home compared with UK respondents (9% EU respondents and 6% non-EU respondents compared with 16% UK respondents).

Milk (83%), bread (82%) and fresh fruit and vegetables (81%) are the most commonly reported food items that respondents tend to buy. Prepared food, such as ready meals, tinned vegetables and fruit and ‘ready to cook’ kits are less likely to be purchased by respondents (20%, 25% and 5% respectively).
15%
25%
30%
34%
37%
40%
41%
42%
58%
65%
65%
65%
68%
69%
75%
81%
82%
83%
0% 10% 20% 30% 40% 50% 60% 70% 80% 90%
Ready to cook kits
Tinned vegetables and fruit
Ready meals
Frozen fruit / vegetables
Frozen meat / fish
Other bakery products
Ready-made cooking sauces
Other tinned food
Other dairy products e.g. yoghurt
Rice
Fresh meat / fish
Potatoes
Cheese
Cereals
Pasta
Fresh fruit and vegetables
Bread
Milk
Q. Which of these things do you tend to buy?(Base: 3265 Balance: No response)
Women respondents are more likely to say they tend to buy fresh fruit and vegetables (86% compared with 75% men).
Women respondents are less likely to say they tend to buy ready meals (26% compared with 35% men).
UK respondents are more likely to say they tend to buy ready-made cooking sauces than international respondents (44% compared with 31% EU respondents and 30% non-EU respondents).
UK respondents are more likely to say they tend to buy fresh meat and fish than international respondents (68% compared with 59% EU respondents and 52% non-EU respondents).

As well as influencing where respondents do their shopping, price is also reported as the strongest influence on what food respondents buy (85% say they consider this when buying food). Quality/freshness (74%) and taste (62%) are also important considerations, however very few respondents report considering the environmental impact of their food (10%).
1%
4%
10%
14%
15%
28%
33%
39%
48%
52%
60%
62%
62%
74%
85%
0% 10% 20% 30% 40% 50% 60% 70% 80% 90%
Other
Not applicable - Someone else decides on most of the foodI eat
Environmental impact of producing the food
Where the food is grown / produced
Whether the food has been produced ethically
The availability of the food in the shops I go to
Habit or routine
Convenience in preparation
How healthy it is
What special offers are available
Foods I know how to cook/prepare
How much money I have
Taste
Quality or freshness of the food
Price of the food
Q. What factors do you take into consideration when buying food?(Base: 3270 Balance: No response)
Women respondents are more likely to say they consider the quality or freshness of food (75% compared with 72% men).
Women respondents are more likely to say they consider what special offers are available (53% compared with 50% men).
Non-EU international respondents are more likely to say the are influenced by foods they know how to cook or prepare (70% non-EU compared with 60% EU and 59% UK respondents).
EU respondents are most likely to say they consider where food is grown / produced (16% compared with 14% UK respondents and 8% non-EU respondents).

Research Findings Sustainable food habits
and attitudes
Research FindingsSustainable food habits
and attitudes

Almost two fifths of respondents say they make a conscious effort to buy Fairtrade products (38%) and a third say they try to buy food that is in season in the UK (34%). A third of respondents report that they do not make a conscious effort to buy food with any of the environmental or ethical accreditations or characteristics (32%).
32%
2%
9%
15%
21%
22%
30%
34%
38%
0% 10% 20% 30% 40%
None of these
LEAF marque food
Freedom food
Red tractor meat
Fish from sustainable sources (e.g. Marine
Stewardship Council certified)
Organically produced or grown food products
Locally produced or grown food products
Food that is in season in the UK
Fairtrade products
Q. Which, if any, of these do you make a conscious effort to buy?(Base: 3223 Balance: No response)
Women respondents are more likely to say they make a conscious effort to buy food that is in season in the UK (36% compared with 32% men).
Women respondents are less likely to say they don’t make a conscious effort to buy any food that has ethical or environmental credentials (29% compared with 35% men).
Women respondents are less likely to say they don’t make a conscious effort to buy red tractor meat (14% compared with 17% men).
UK respondents are least likely to make a conscious effort to buy organic food (20% compared with 33% EU respondents and 31% non-EU respondents).

Respondents perceive locally produced food / food products to be a way of purchasing food that is as fresh as possible (42%) and also a way of supporting the local economy (34%), however only around a quarter say that these products are worth paying a bit extra for (23%).
1%
6%
7%
8%
8%
9%
10%
15%
23%
25%
28%
30%
31%
34%
42%
0% 20% 40% 60%
Other
There is no benefit in the taste
Not an option where I shop
Don’t know
It is inconvenient to check the origin of products
How food is produced is not important to me
It is too much of an inconvenience to find local
produced food
It’s difficult to find information on where things are
produced
Are worth paying a bit extra for
I want a wide choice of products
Too expensive for my budget
I’m happy with the products I buy already
I like knowing where my food has come from
I want to support the local economy / local businesses
I want food I buy to be as fresh as possible
Q. Which, if any, of these statements matches how you think about buying locally produced food / food products?(Base: 3266 Balance: No response)
UK respondents are most likely to say they want to support the local economy / businesses through locally produced food (36% compared with 28% EU respondents and non-EU respondents).
Non-EU international respondents are more likely to say how food is produced is not important compared with UK respondents (12% compared with 8%).
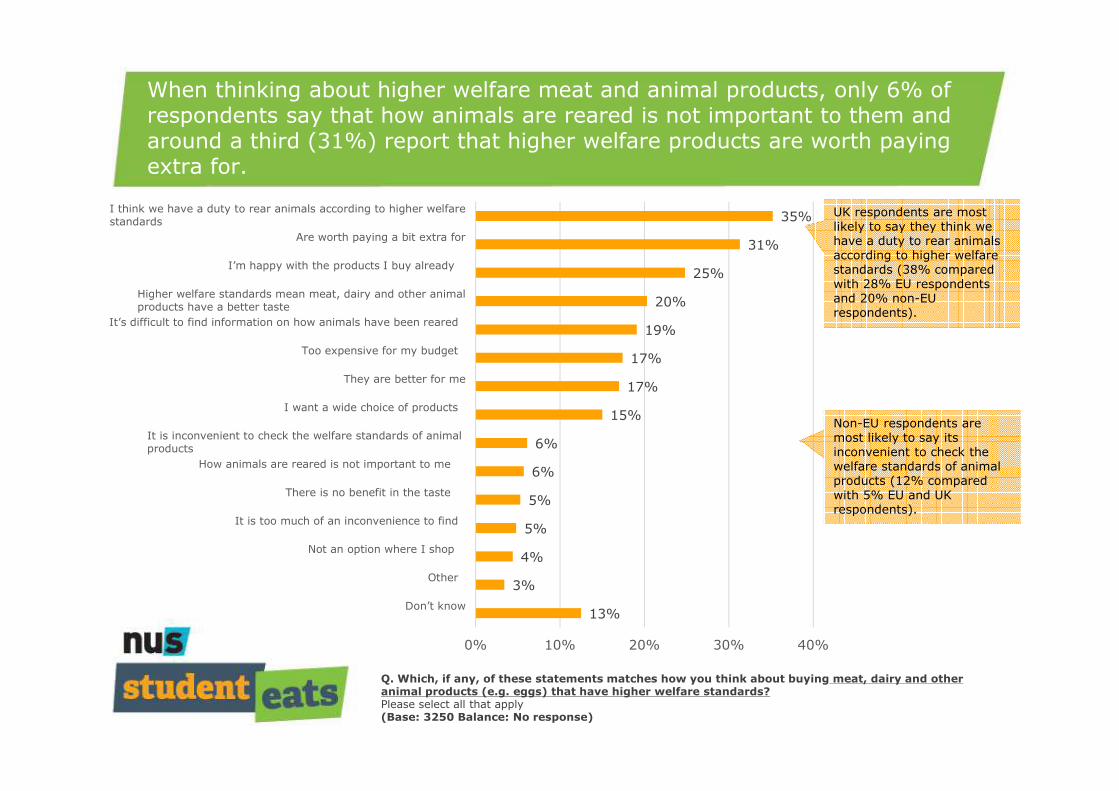
When thinking about higher welfare meat and animal products, only 6% of respondents say that how animals are reared is not important to them and around a third (31%) report that higher welfare products are worth paying extra for.
13%
3%
4%
5%
5%
6%
6%
15%
17%
17%
19%
20%
25%
31%
35%
0% 10% 20% 30% 40%
Don’t know
Other
Not an option where I shop
It is too much of an inconvenience to find
There is no benefit in the taste
How animals are reared is not important to me
It is inconvenient to check the welfare standards of animalproducts
I want a wide choice of products
They are better for me
Too expensive for my budget
It’s difficult to find information on how animals have been reared
Higher welfare standards mean meat, dairy and other animalproducts have a better taste
I’m happy with the products I buy already
Are worth paying a bit extra for
I think we have a duty to rear animals according to higher welfarestandards
Q. Which, if any, of these statements matches how you think about buying meat, dairy and other animal products (e.g. eggs) that have higher welfare standards?Please select all that apply(Base: 3250 Balance: No response)
UK respondents are most likely to say they think we have a duty to rear animals according to higher welfare standards (38% compared with 28% EU respondents and 20% non-EU respondents).
Non-EU respondents are most likely to say its inconvenient to check the welfare standards of animal products (12% compared with 5% EU and UK respondents).

The majority of respondents agree to some extent (86%) that it is important to treat animals bred for food humanely. There is also strong agreement that it is better for the environment to eat locally grown fruit and vegetables that are in season (76%), however just half (52%) of respondents say they have a good understanding of the issues surrounding buying local / seasonal produce.
15%
21%
34%
58%
37%
42%
42%
28%
25%
27%
17%
9%
13%
5%
2%
1%
0% 10% 20% 30% 40% 50% 60% 70% 80% 90%100%
I have a good understanding of the issues
surrounding buying local / seasonal produce
(n=3257)
Where possible I try to support British producers
(n=3262)
It’s better for the environment to eat local fruit and
vegetables grown in season (n=3264)
I think it’s important that animals bred for food are
treated as humanely as possible (n=3265)
Strongly agree Agree Neither agree nor disagree
Disagree Strongly disagree Don’t know
Rather not say
Q. To what extent do you agree or disagree with the following statements?Please select one for each option(Base: in brackets Balance: No response)
UK respondents are most likely to agree that they have a good understanding of the issues surrounding local and seasonal produce (54% compared with 46% EU respondents and 44% non-EU respondents).

Students and Food Poverty
Research FindingsStudents and Food
Poverty

38% of respondents report being unable to eat healthy and nutritious food in the last 12 months due to a lack of money or other resources, and a similar proportion (36%) have been worried they would run out of food for the same reason. A quarter report having been hungry but did not eat because of a lack of money or other resources and 13% say they have gone a whole day without eating for this reason.
12%
13%
24%
25%
32%
36%
38%
83%
83%
70%
69%
63%
57%
56%
0% 10% 20% 30% 40% 50% 60% 70% 80% 90%100%
You were unable to eat healthy and nutritious
food because of a lack of access to sufficient
cooking facilities?
You went without eating for a whole day
because of a lack of money or other resources?
You were unable to eat healthy and nutritious
food because of a lack of affordable food
retailers locally?
You were hungry but did not eat because of a
lack of money or other resources?
You ate less than you thought you should
because of a lack of money or other resources?
You were worried you would run out of food
because of a lack of money or other resources?
You were unable to eat healthy and nutritious
food because of a lack of money or other
resources?
Yes No Don't know Rather not say
Q. Now we'd like to ask some questions about your food consumption in the last 12 months.During the last 12 months, was there a time when:Please pick one for each statement(Base: c. 3260 Balance: No response)
UK respondents are most likely to say they have been worried they would run out of food because of a lack of money or other resources in the last 12 months (37% compared with 31% EU and non-EU respondents).
International respondents are more likely to say they have been unable to eat healthy and nutritious food because of a lack of access to sufficient cooking facilities in the last 12 months (25% non-EU and 17% EU respondents compared 9% UK respondents).

Research FindingsPro-environmental
attitudes and behaviours
Research FindingsPro-environmental
attitudes and behaviours

The majority of respondents report doing at least one or two things that are environmentally-friendly (93%). 4% say they don’t really do anything to help the environment.
4%
4%
36%
36%
19%
2%
0% 10% 20% 30% 40%
Don't know
I don't really do anything that is environmentally-friendly
I do one or two things that are environmentally-friendly
I do quite a few things that are environmentally-friendly
I'm environmentally-friendly in most things I do
I'm environmentally-friendly in everything I do
Q. Which of the following statements best describes you?Please pick one(Base: 3265 Balance: No response)

Half of respondents (51%) say they would be willing to make changes to the food they buy to reduce their impact on the environment if they knew more about the subject.
5%
4%
11%
12%
18%
51%
0% 10% 20% 30% 40% 50% 60%
Don't know
I would be willing to take action such as growing my own food
I already make changes to the food I buy to reduce my impact
on the environment
I already make changes to the food I buy to reduce my impact
on the environment and I’d like to do more
I would still buy the food I usually buy
I would be willing to make changes to the food I buy to reduce
my impact on the environment
Q. Please read the statement below and tell us which of the options best applies to you. If I had a better understanding of the environmental impacts of how food is produced…Please select one only(Base: 3254 Balance: No response)

Using a segmentation model of environmental attitudes and behaviours, a quarter (26%) of respondents are categorised as Concerned Consumers. This group hold broad pro-environmental concerns but not as strongly as Positive Greens, who make up 21% of survey respondents.
2%
5%
12%
16%
18%
21%
26%
0% 5% 10% 15% 20% 25% 30%
Waste Watchers
Stalled Starters
Cautious Participants
Honestly Disengaged
Sideline Supporters
Positive Greens
Concerned Consumers
• Hold the most positive pro-environmental attitudes and beliefs
• Most likely to want to live in a more environmentally-friendly way than they currently do
• Most willing to pay for environmentally-friendly products
• Hold positive pro-environmental attitudes and beliefs but with less conviction
• Likely to think they are doing more to live in a more environmentally-friendly way than actually are
• Likely to cite money-saving and inconvenience as the reasons for not doing more
• Agree that there is an environmental crisis, but cynical about our ability to tackle it
• Pro-environmental behaviour is likely to be focused on actions in the home but these behaviours are not a natural fit with their self-identity
• Any behaviours they do need to fit with their current lifestyle and habits
The segmentation model, developed by Defra in 2008, is built around strength of agreement or disagreement with 17 statements focused on attitudes and behaviours towards environmental issues locally and globally. Further detail can be found here.

Over three quarters (78%) of respondents say they would like to do either a bit more, or a lot more to help the environment.
2%
20%
48%
30%
0% 10% 20% 30% 40% 50%
Don't know
I'm happy with what I do at the moment
I'd like to do a bit more to help the environment
I'd like to do a lot more to help the environment
Q. Which of these best describes how you feel about your current lifestyle and the environment?Please select one only(Base: 3258 Balance: No response)

The RespondentsAnnexFull Demographics

I would prefer not to say2%
I am an international student from within the EU studying …
I am an international student from outside the EU studying …
I am a UK citizen studying in the UK 78%
0% 20% 40% 60% 80%
Nationality
In another way 0.20%
Prefer not to say 0.40%
Man 44%
Woman 55%
0% 20% 40% 60% 80%
Gender
Respondent demographics
Accommodation type
Other 2%
University / college/ privately owned catered accommodation 8%
My own home 18%
University / college/ privately owned self-catered accommodation 22%
Privately rented accommodation 23%
My parents' home 27%
0% 5% 10% 15% 20% 25% 30%

Graduated in the last year 1%
Apprenticeship 2%
Higher education70%
Further education 28%
0% 20% 40% 60% 80%
Level of study
Undergraduate 5th year or more0.3%
Undergraduate 4th year 2%
Undergraduate 3rd year 7%
Undegraduate 2nd year 12%
Undergraduate 1st year 78%
0% 20% 40% 60% 80%
Year of study (HE)
Respondent demographics
Subject (all)
Written arts 1%
Languages 2%
Medicine & Dentistry 3%
Law 3%
Historical & Philosophical studies 3%
Maths & Computer Sciences 6%
Physical sciences 6%
Subjects allied to medicine 7%
Education 7%
Engineering and Technology 9%
Creative arts & design 9%
Social studies 10%
Business & administrative studies 11%
Other 24%
0% 5% 10% 15% 20% 25% 30%